
Q3-2024


Q3-2024
In the third quarter of 2024, the real estate market north of New York City experienced its first notable shift in over three years. After an extended period of dwindling inventory due to high demand, we are now observing an increase in available listings across most of our markets, offering much-needed relief to buyers.
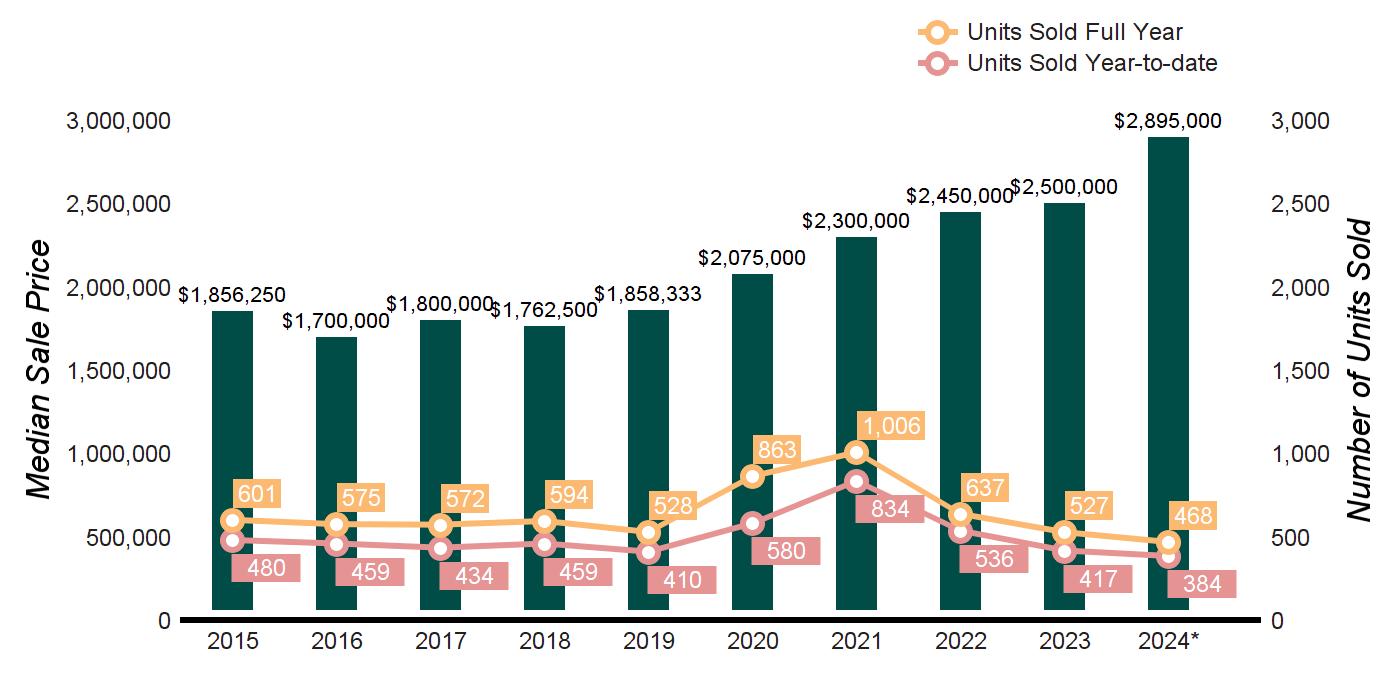
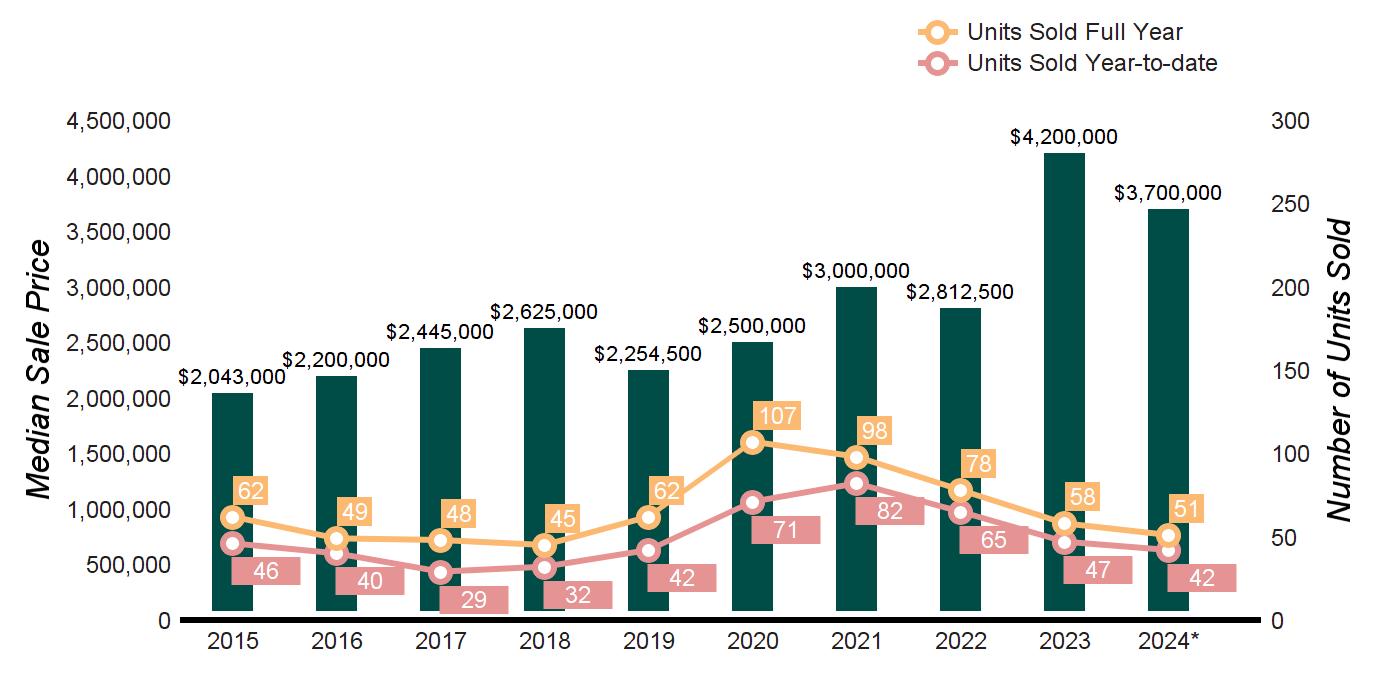
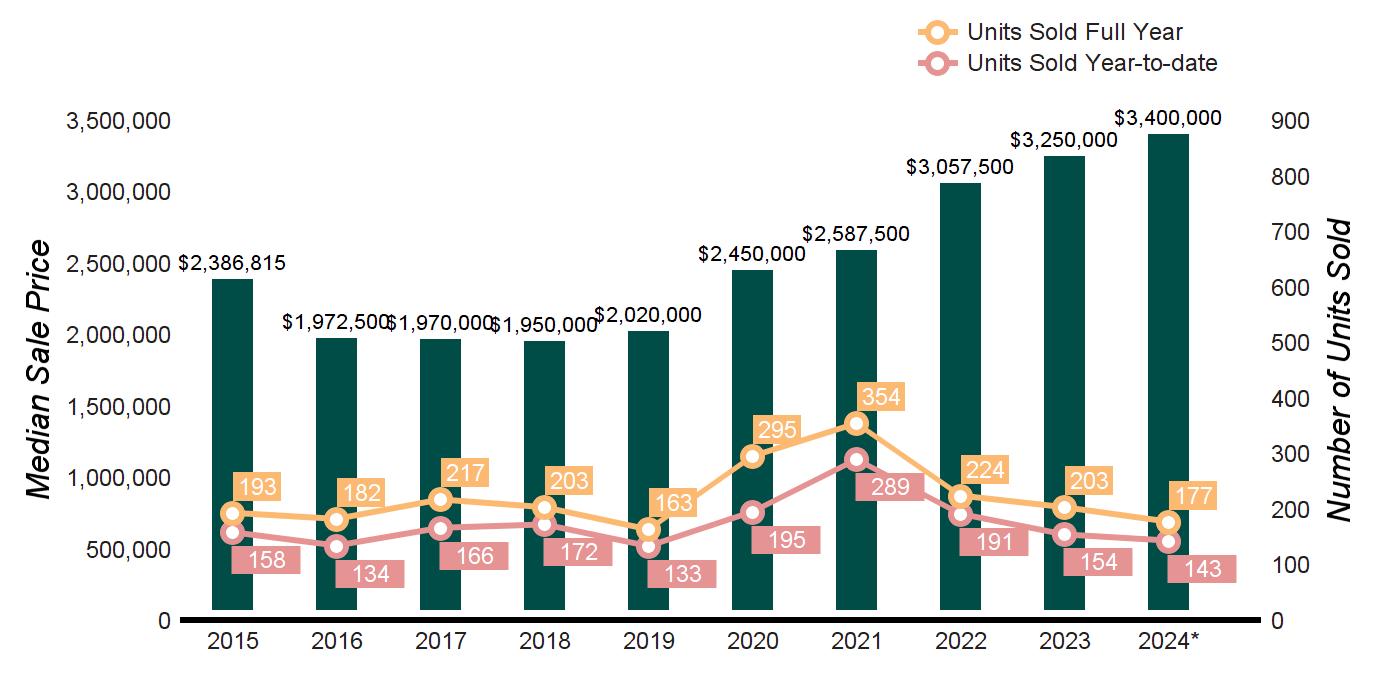
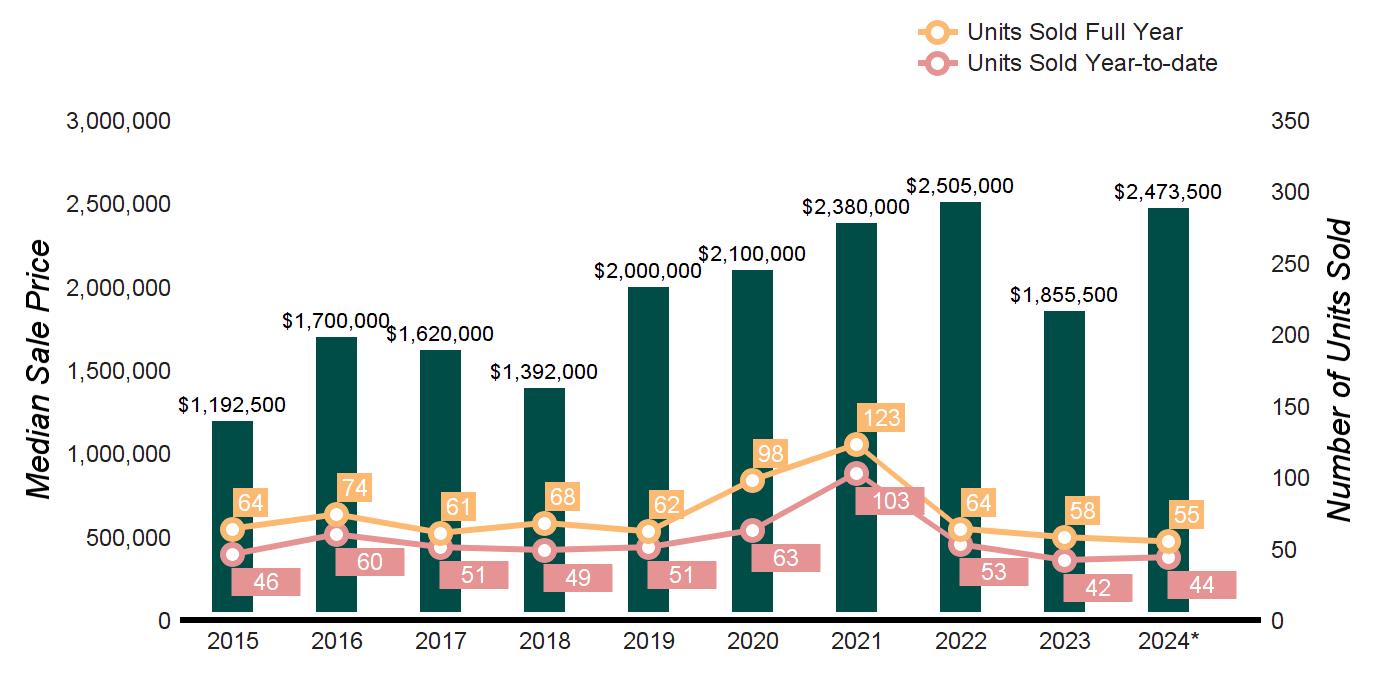
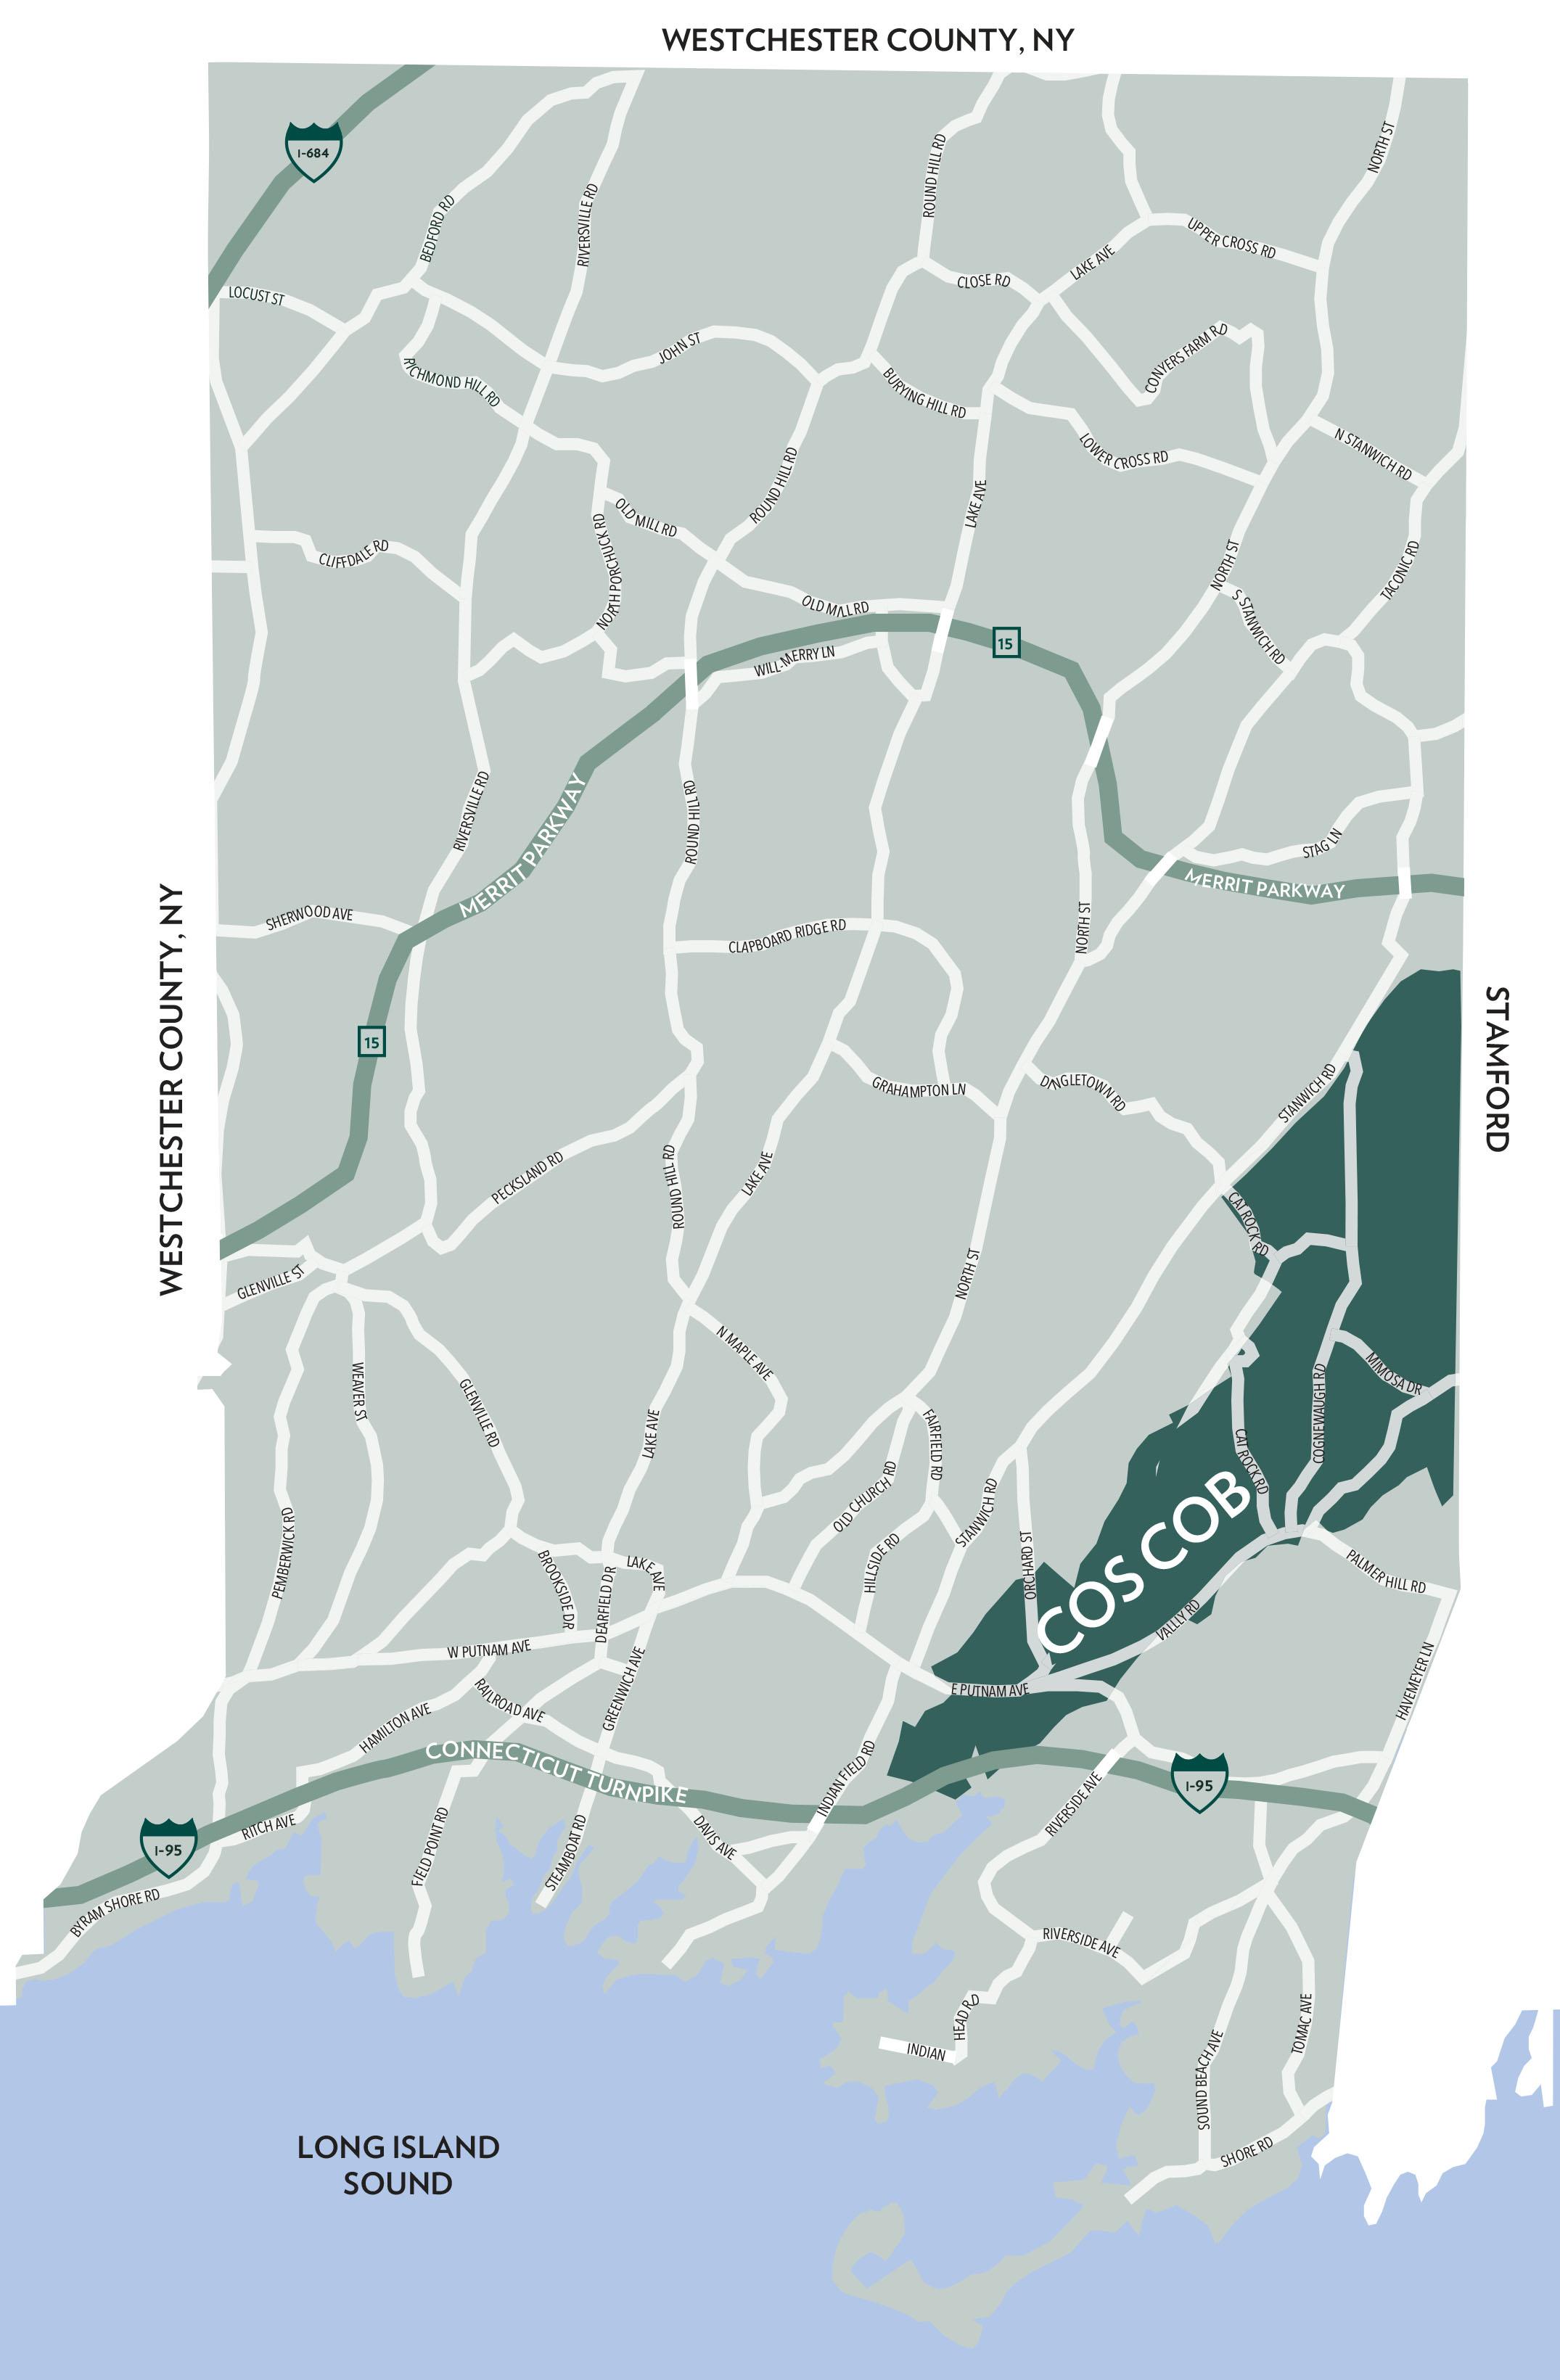
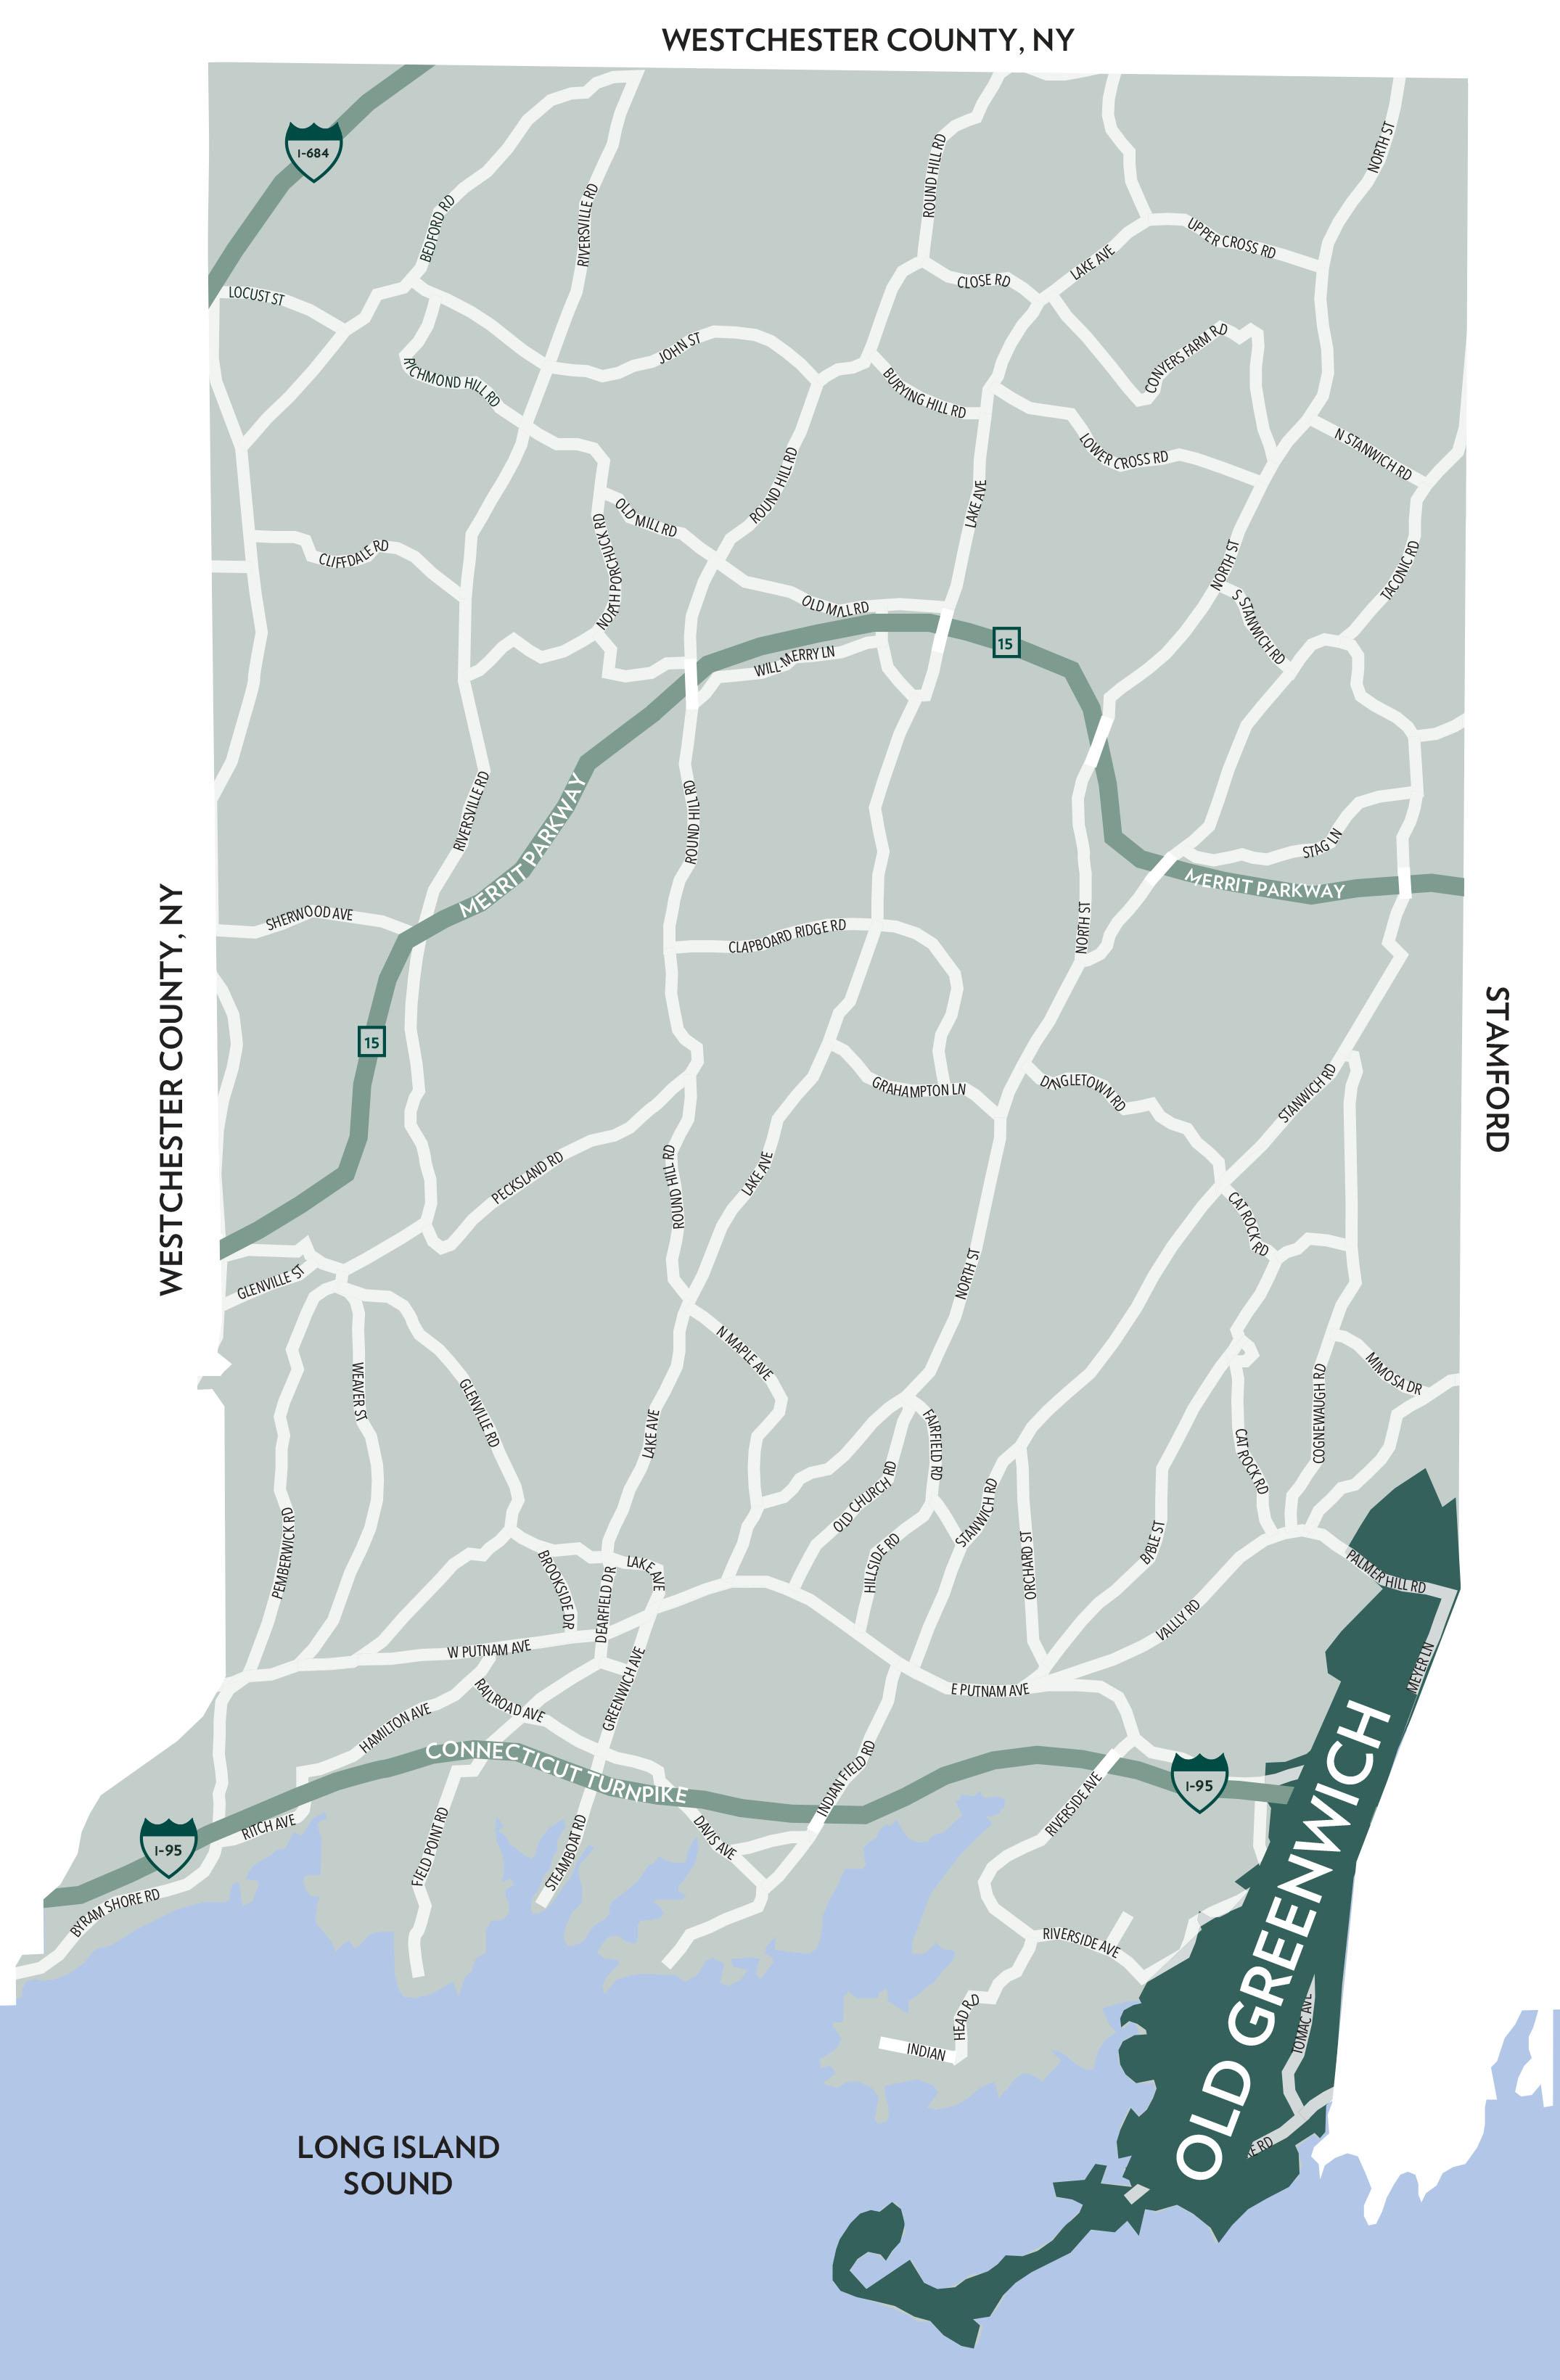
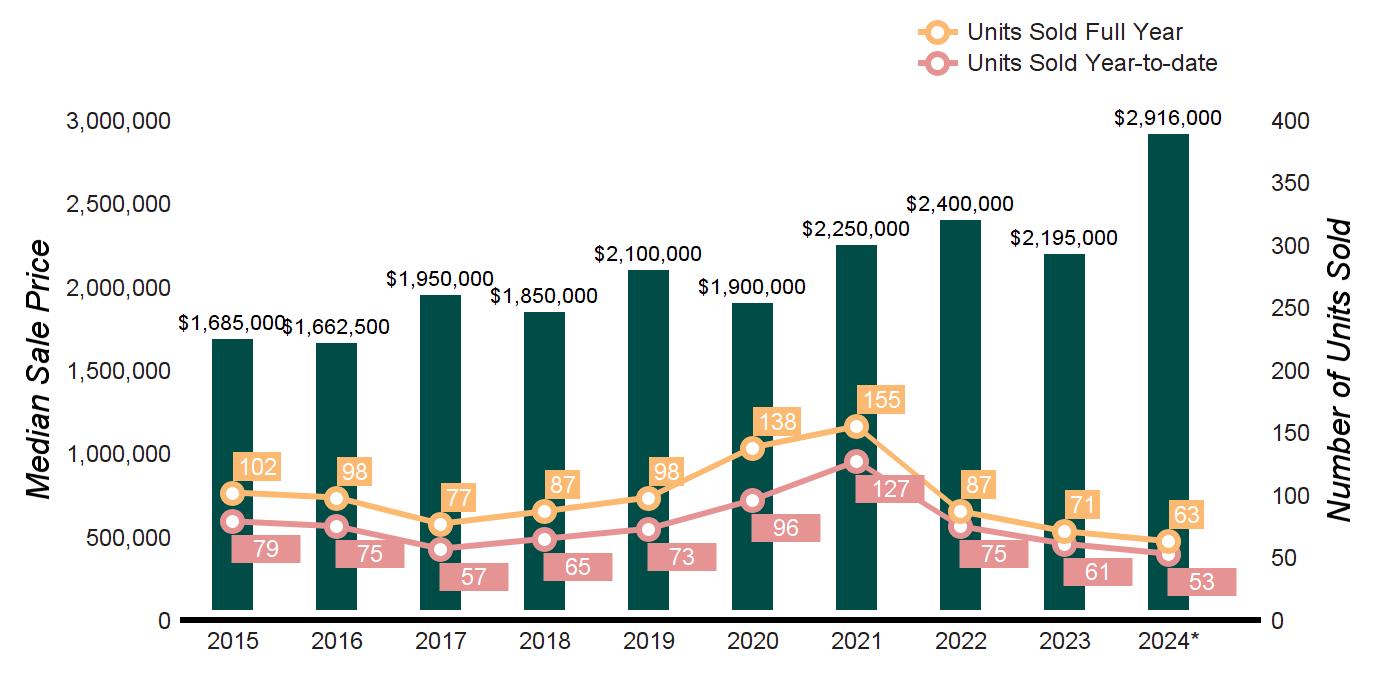
Greenwich has seen a significant uptick in inventory, with listings increasing by an average of 19% year-over-year. Some areas have experienced inventory rises as high as 43% in Cos Cob, and 157% in Old Greenwich. Although there was a 5% decrease in homes sold last quarter, the market saw a 22% rise in the median sale price, now at $3 million. This demonstrates that demand remains strong as more options become available.
These developments, coupled with indications from the Federal Reserve regarding potential rate cuts, may encourage sellers hesitant to enter the market to reconsider. The opportunity to capitalize on increased inventory and sustained buyer demand could prompt more movement among homeowners, particularly those looking to trade up or down.
Overall, the trends observed in the third quarter of 2024 suggest meaningful changes in the market, marking a shift in a landscape that has remained relatively flat for years. As we move forward, the sustained resilience of the buyer pool, coupled with increasing inventory levels, points towards a dynamic and evolving market environment.
With Warm Regards,
Liz Nunan President and CEO
Source: 1/1/24 - 9/30/24,


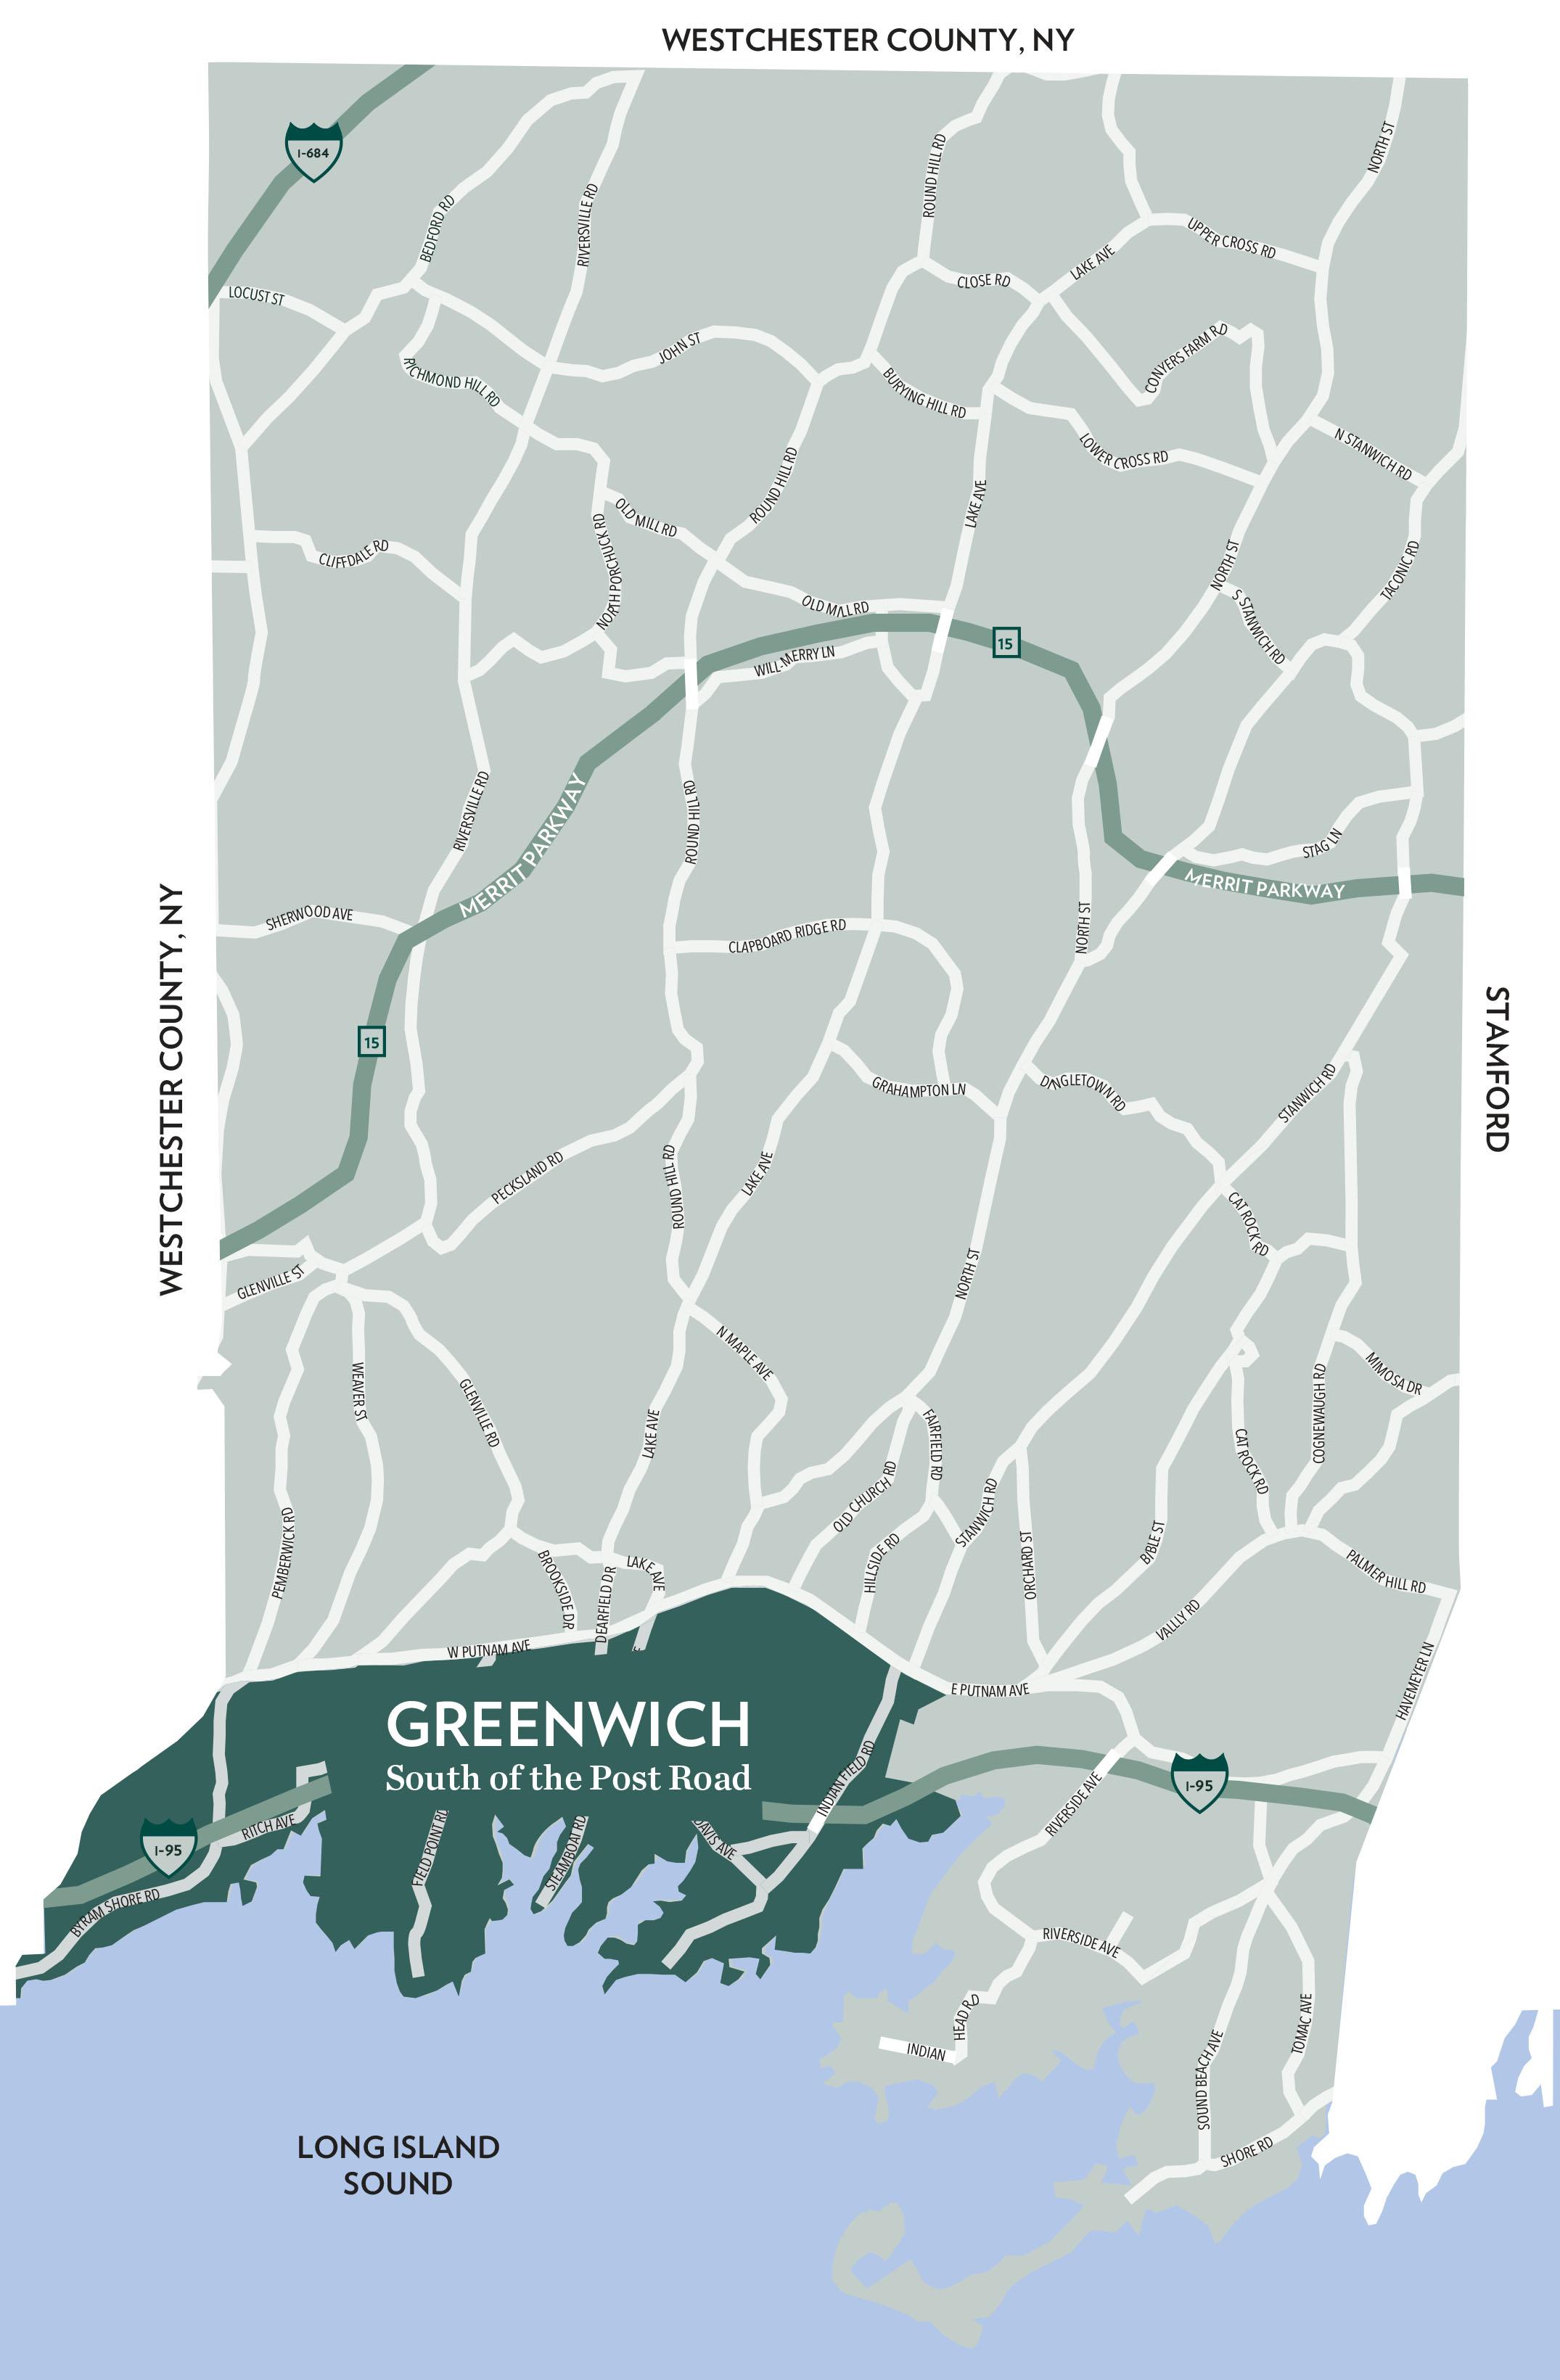
SouthofthePostRoad
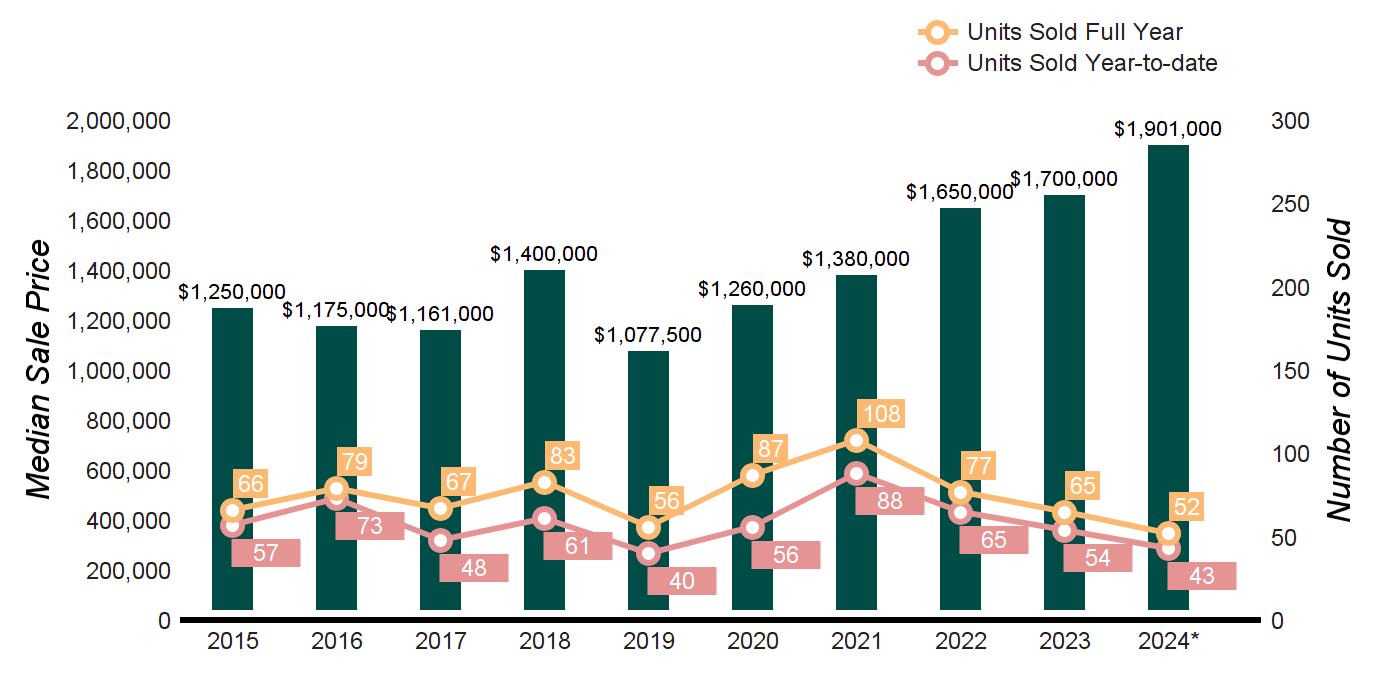
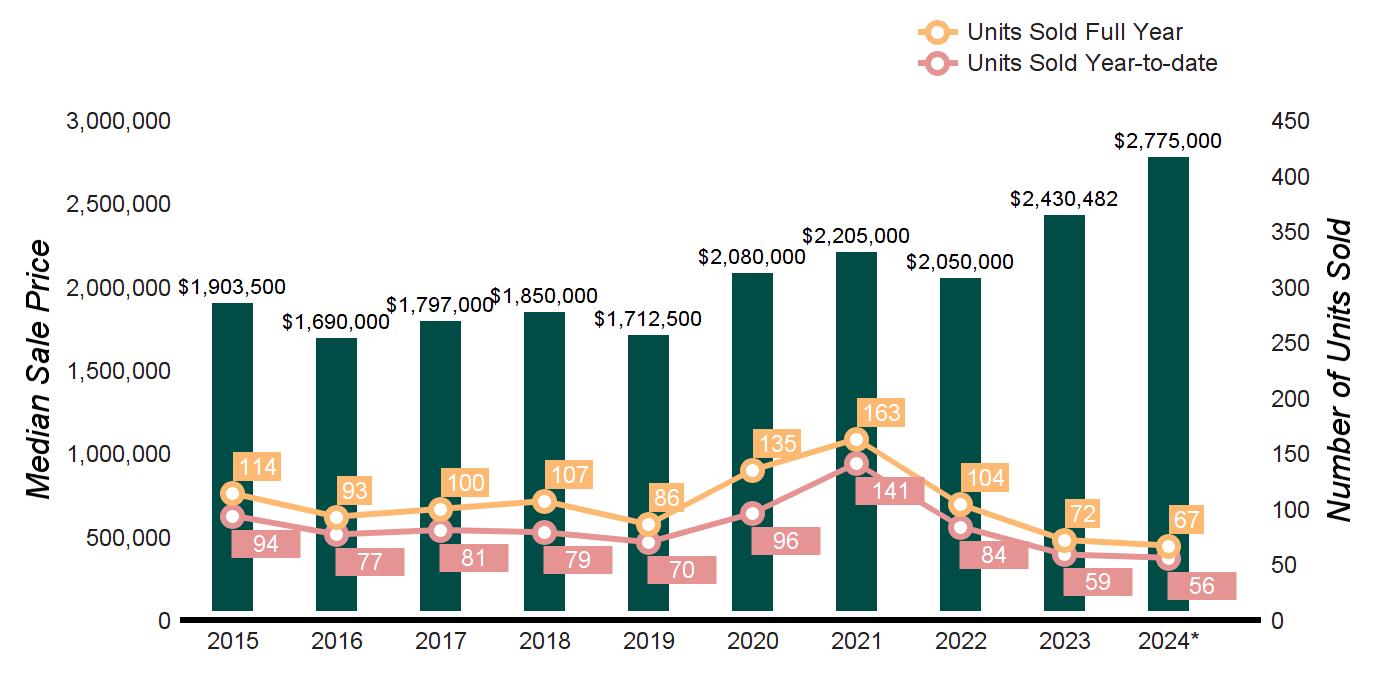
* Homes sold for 2024 are annualized based on actual sales year-to-date.
$10,000,000 and
Source: Greenwich Multiple Listing Service, Single-family homes
* Homes sold for 2024 are annualized based on actual sales year-to-date.
OF SEPTEMBER 30, 2024
OF SEPTEMBER 30, 2023
$5,000,000
Source: Greenwich Multiple Listing Service, Single-family homes
* Homes sold for 2024 are annualized based on actual sales year-to-date.
OF SEPTEMBER 30, 2024
OF SEPTEMBER 30, 2023
Demand Ratio Key 1-4: High Demand 5-6: Balanced 7-9:
$3,000,000
$10,000,000
Source: Greenwich Multiple Listing Service, Single-family homes
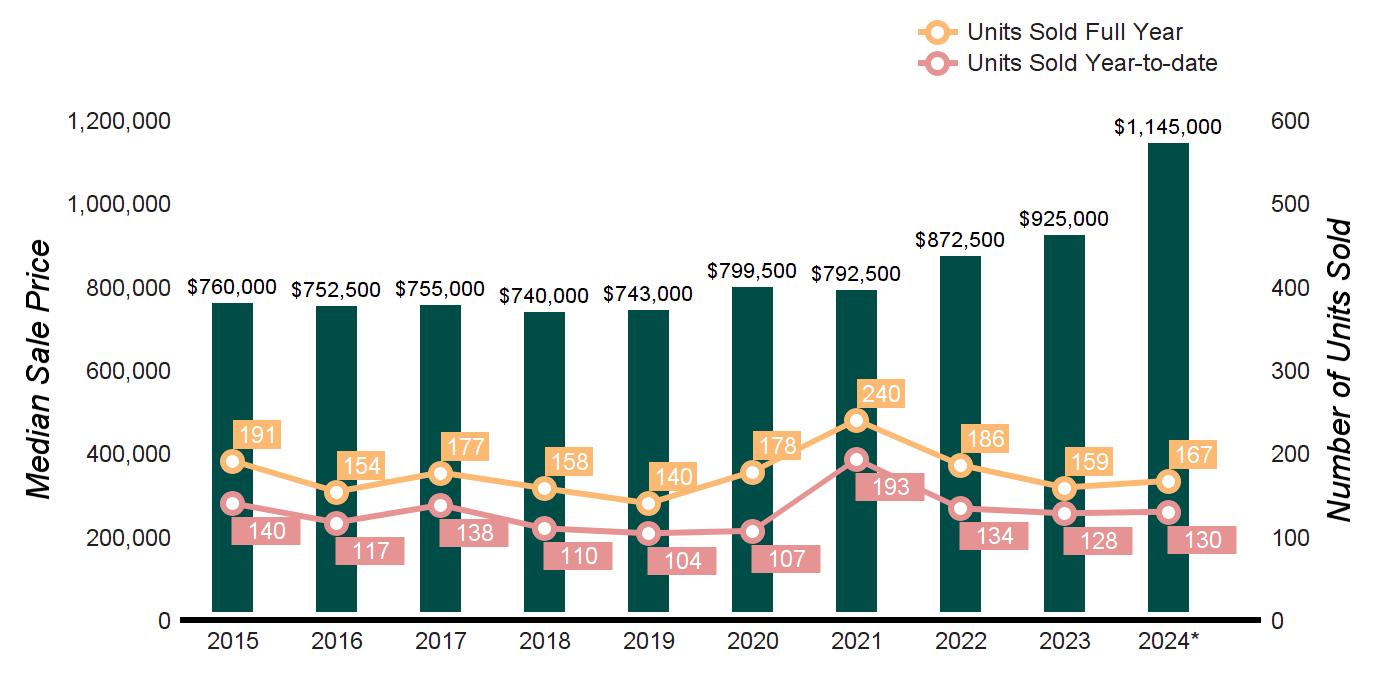
TEN-YEAR MARKET HISTORY
* Homes sold for 2024 are annualized based on actual sales year-to-date.
OF SEPTEMBER 30, 2024
OF SEPTEMBER 30, 2023
$10,000,000
Source: Greenwich Multiple Listing Service, Single-family homes
* Homes sold for 2024 are annualized based on actual sales year-to-date.
DEMAND
AS OF SEPTEMBER 30, 2024
OF SEPTEMBER 30, 2023 2024 vs. 2023
$3,000,000
$10,000,000
Source: Greenwich Multiple Listing Service, Single-family homes
* Homes sold for 2024 are annualized based on actual sales year-to-date.
AS OF SEPTEMBER 30, 2024 AS OF SEPTEMBER 30, 2023 2024 vs. 2023
$10,000,000
Source: Greenwich Multiple Listing Service, Single-family homes
* Homes sold for 2024 are annualized based on actual sales year-to-date.
AS OF SEPTEMBER 30, 2024 AS OF SEPTEMBER 30, 2023 2024 vs. 2023
$3,000,000
$10,000,000 and
Source: Greenwich Multiple Listing Service, Single-family homes
TEN-YEAR MARKET HISTORY
* Homes sold for 2024 are annualized based on actual sales year-to-date.
OF SEPTEMBER 30, 2023
$10,000,000
Source: Greenwich Multiple Listing Service, Condominium
YEARS AND COUNTING

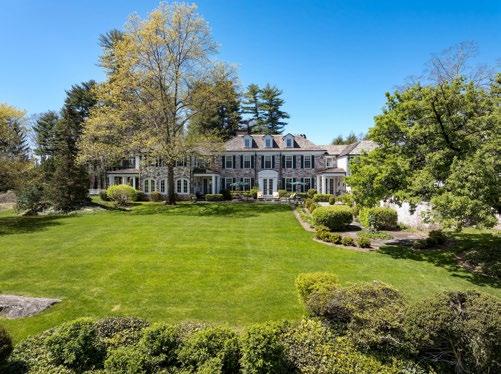
31 N BALDWIN FARMS, GREENWICH, CT
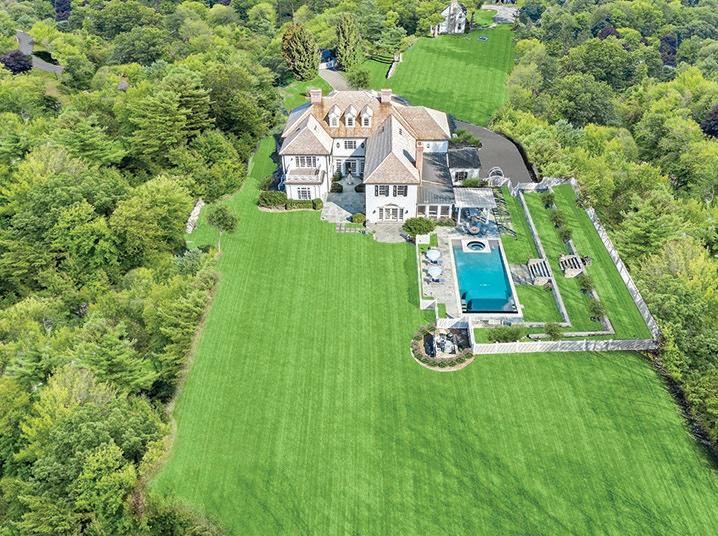
Extraordinary custom stone/clapboard home on 2.46 private acres with pool and cabana. Offered at $10,900,000 | M 203.705.9680
375
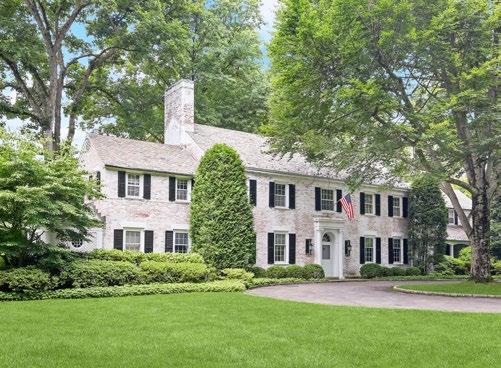
12 WOODSIDE RD, GREENWICH, CT
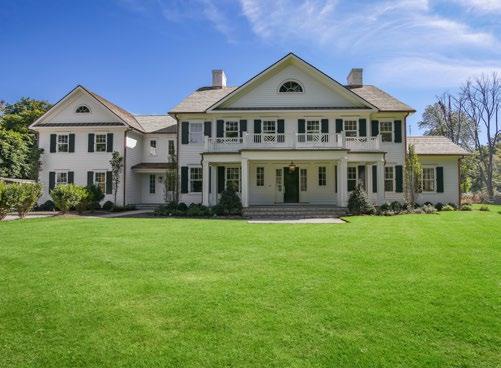
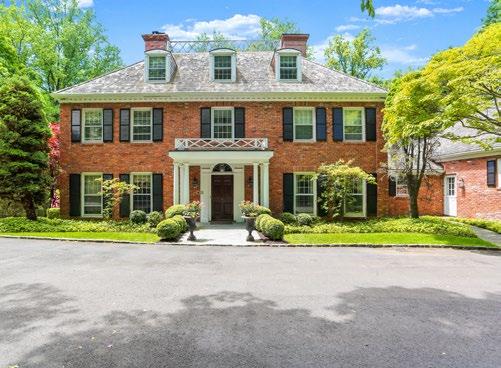
Classic Georgian situated on a prime lot in the highly desirable Deer Park Association. Offered at $9,495,000 | M 203.526.6007
7
61
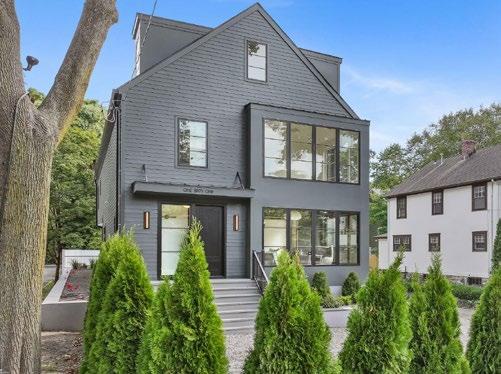
Architecturally
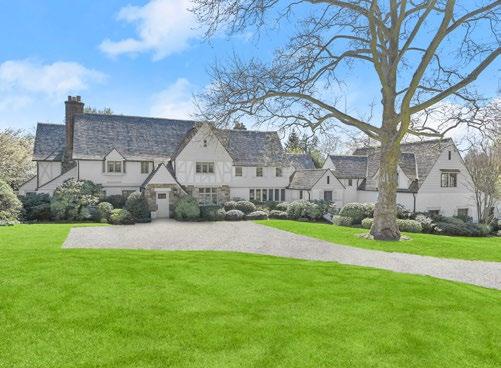
230 TACONIC RD, GREENWICH, CT
530 LAKE AVE, GREENWICH, CT
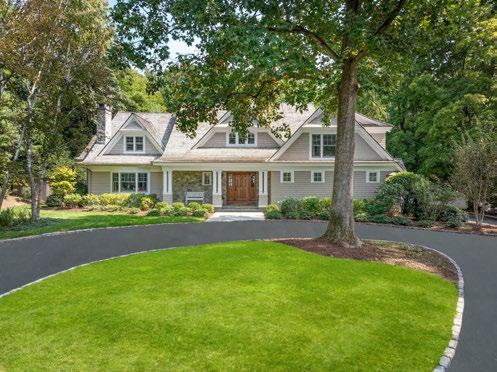
Classic five-bedroom brick Colonial with pool sits on 2.12 private acres close to town. Offered at $5,395,000 | M 203.536.5534
161
Leading Real Estates Companies of the World | Luxury Portfolio International Mayfair International Realty | Board of Regents Luxury Real Estate