Q3-2024


Q3-2024
THIRD QUARTER 2024

ANSONIA BEACON FALLS BETHANY BRANFORD
CHESHIRE DERBY EAST HAVEN GUILFORD
HAMDEN MADISON MERIDEN MIDDLEBURY MILFORD NAUGATUCK NEW HAVEN NORTH BRANFORD
THIRD QUARTER 2024

CHESTER CLINTON CROMWELL
DEEP RIVER DURHAM EAST HADDAM
EAST HAMPTON ESSEX HADDAM
KILLINGWORTH MIDDLEFIELD MIDDLETOWN
OLD SAYBROOK PORTLAND WESTBROOK
In the third quarter of 2024, the real estate market north of New York City experienced its first notable shift in more than three years. After an extended period of dwindling inventory due to high demand, we are now observing an increase in available listings across most of our markets, offering much-needed relief to buyers.
New Haven County has seen a significant uptick in inventory, with listings increasing by an average of 9% year-over-year. Some areas have experienced inventory rises as high as 52%, as seen in the town of Woodbridge. Despite this influx, the median sale price in New Haven has continued to rise, increasing 11% to $387,500. In Middlesex County, inventory has increased by 2% year-over-year. Although there was a decrease in homes sold, the market saw a 10% rise in the median sale price, now at $440,000. This demonstrates that demand remains strong even as more options become available.
These developments, coupled with indications from the Federal Reserve regarding potential rate cuts, may encourage sellers hesitant to enter the market to reconsider. The opportunity to capitalize on increased inventory and sustained buyer demand could prompt more movement among homeowners, particularly those looking to trade up or down.
Overall, the trends observed in the third quarter of 2024 suggest meaningful changes in the market, marking a shift in a landscape that has remained relatively flat for years. As we move forward, the sustained resilience of the buyer pool, coupled with increasing inventory levels, points towards a dynamic and evolving market environment.
With Warm Regards
Liz Nunan President and CEO


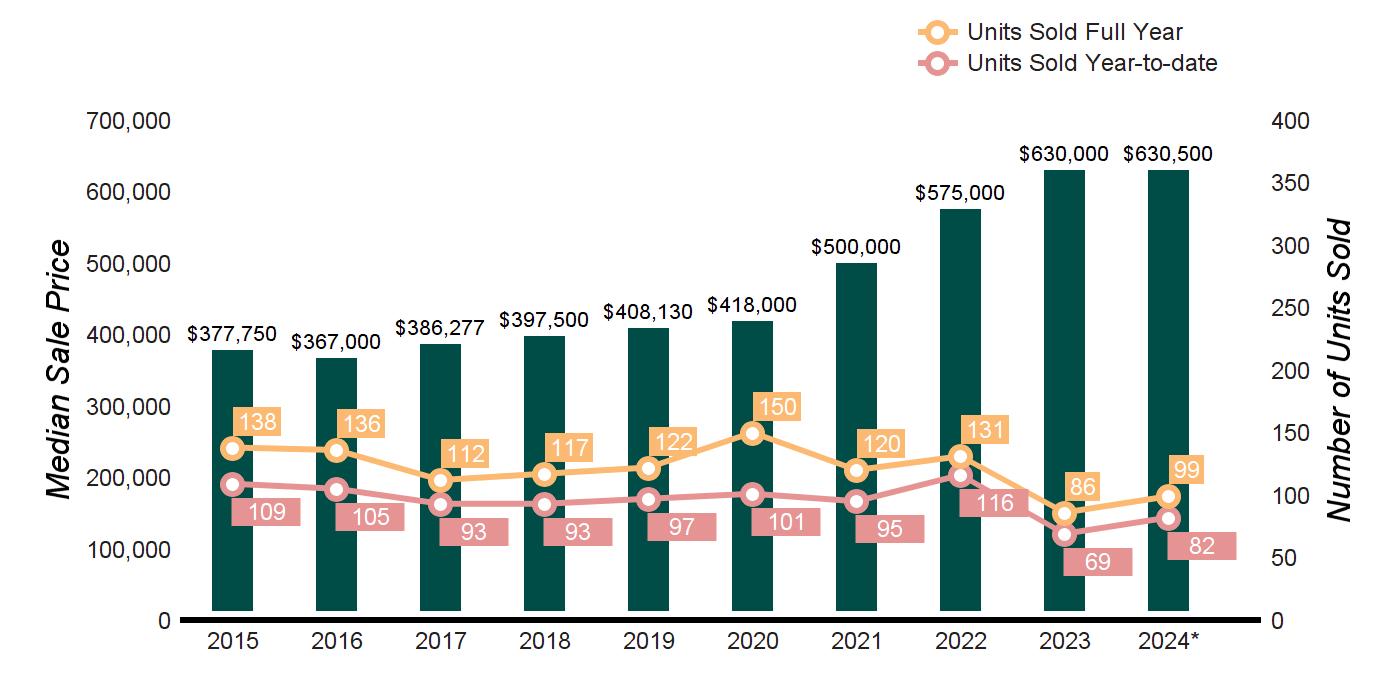
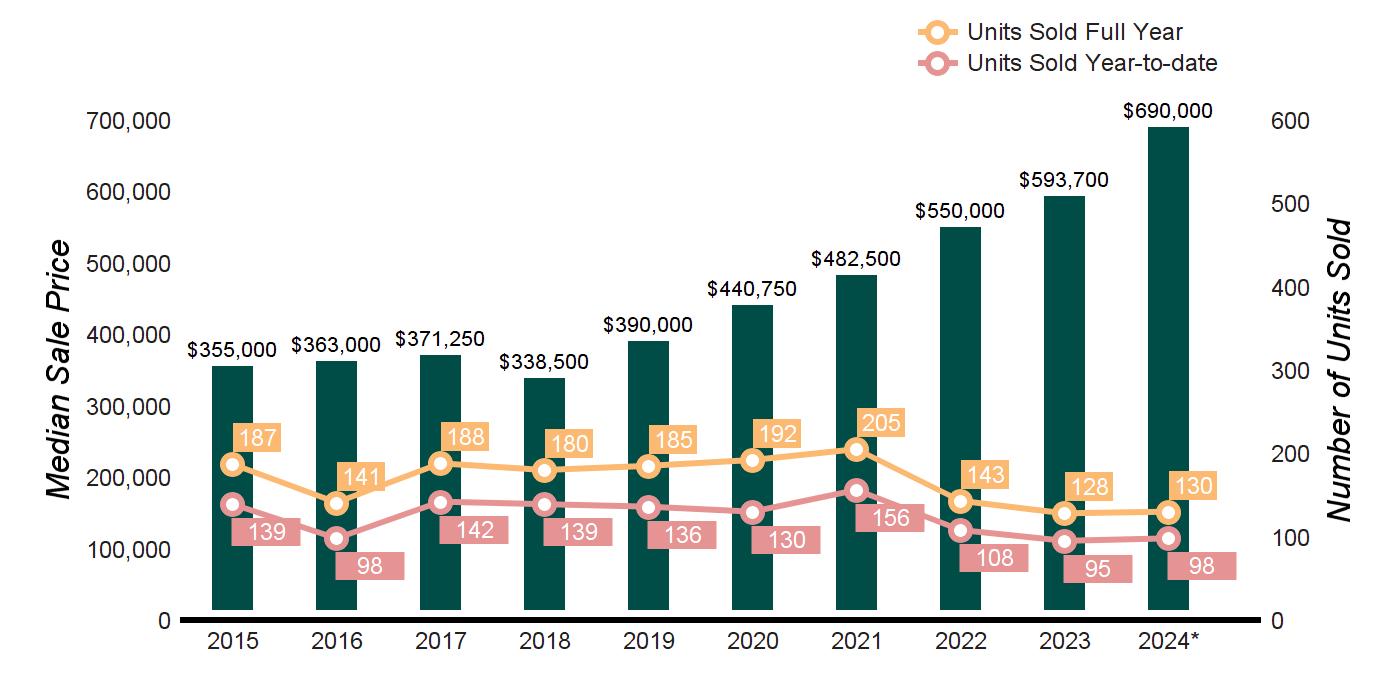
MARKET HISTORY
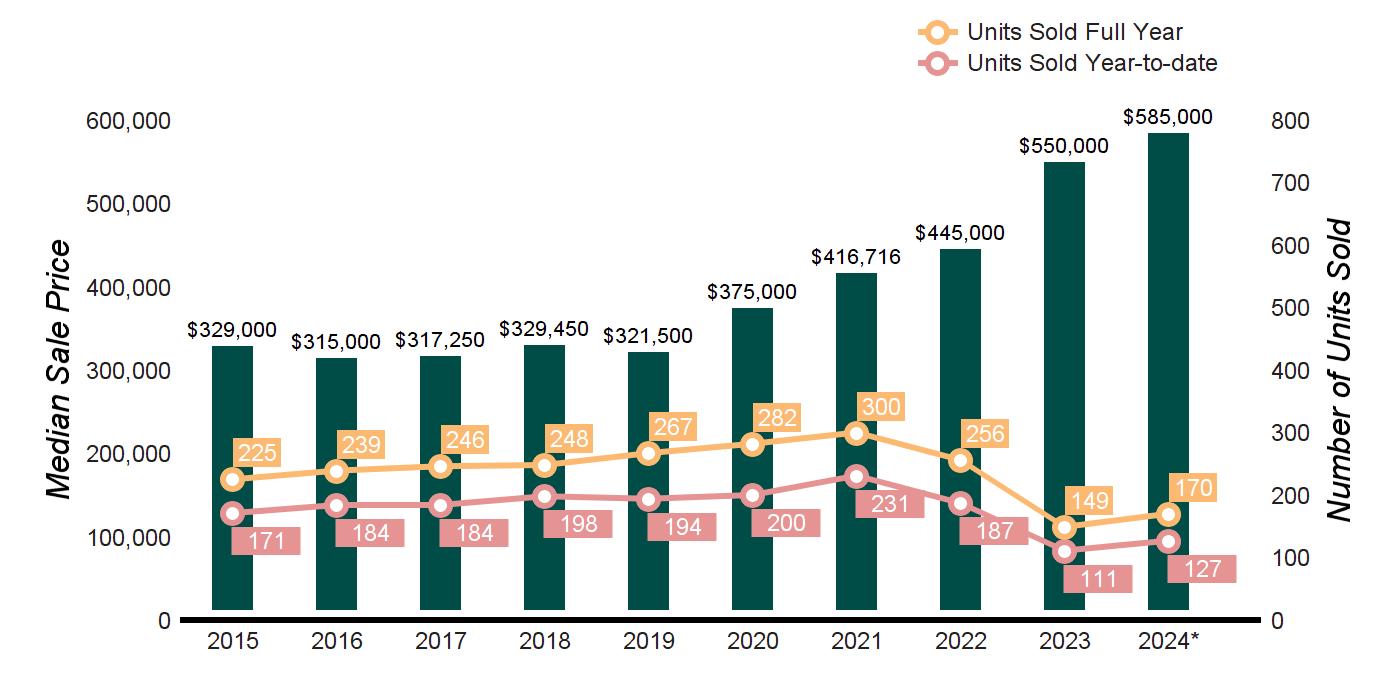
Source : Smart MLS, Single Family For Sale

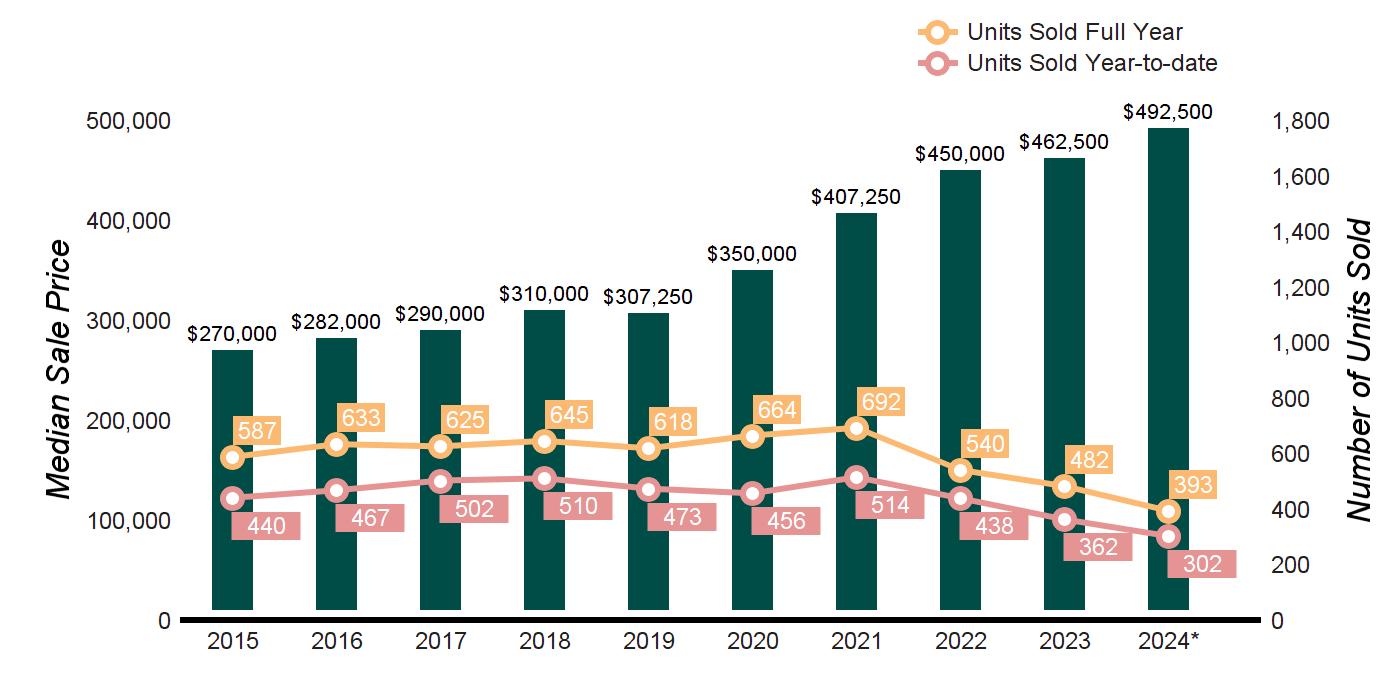

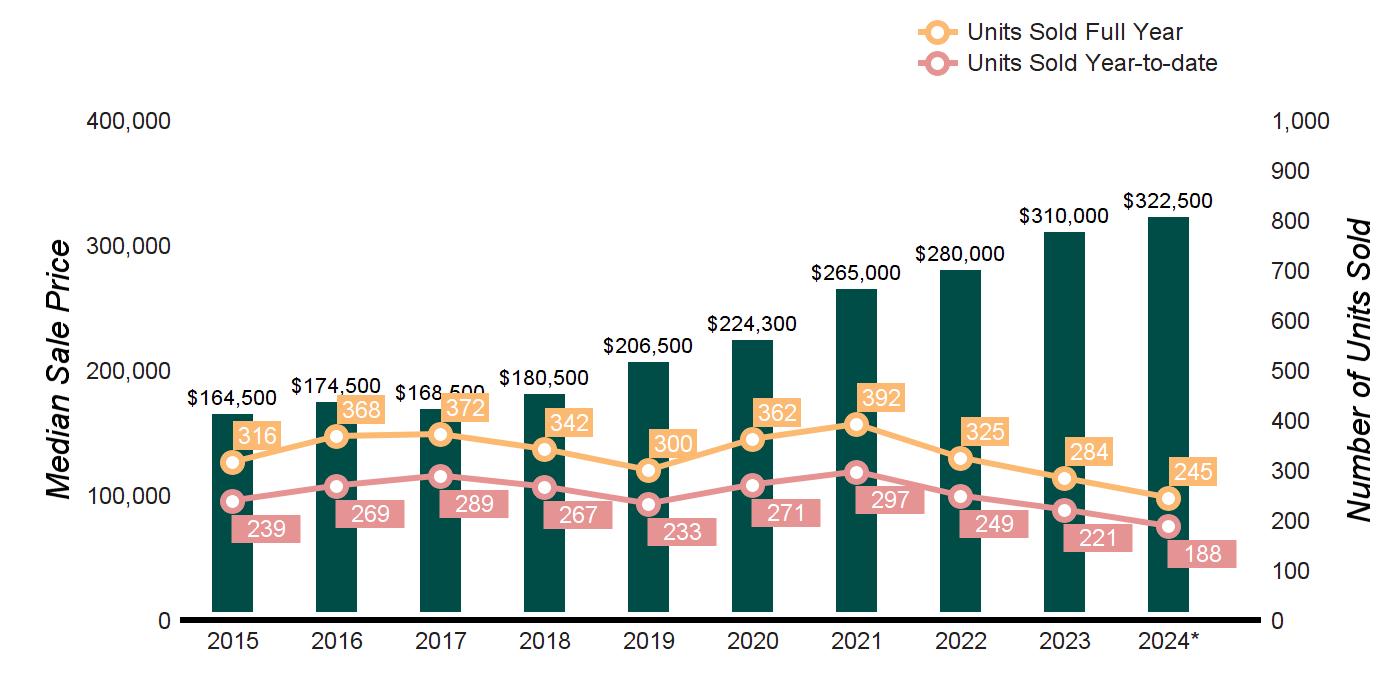

TEN-YEAR MARKET HISTORY

QUARTERLY MARKET OVERVIEW

QUARTERLY MARKET OVERVIEW

ACTIVE LISTINGS
Q3- 2024 vs Q3- 2023
0.0%
PENDING LISTINGS
Q3- 2024 vs Q3- 2023 -16.7%
SOLD LISTINGS
Q3- 2024 vs Q3- 2023 -29.4%
QUARTERLY MARKET OVERVIEW

QUARTERLY MARKET OVERVIEW

ACTIVE LISTINGS
Q3- 2024 vs Q3- 2023
4.2%
PENDING LISTINGS
Q3- 2024 vs Q3- 2023 -14.3% SOLD LISTINGS
Q3- 2024 vs Q3- 2023 -6.0%

QUARTERLY MARKET OVERVIEW

ACTIVE LISTINGS
Q3- 2024 vs Q3- 2023 15.4%
PENDING LISTINGS
Q3- 2024 vs Q3- 2023 0.0% SOLD LISTINGS
Q3- 2024 vs Q3- 2023 16.0%
QUARTERLY MARKET OVERVIEW

QUARTERLY MARKET OVERVIEW

ACTIVE LISTINGS
Q3- 2024 vs Q3- 2023 0.0%
PENDING LISTINGS
Q3- 2024 vs Q3- 2023 3.2% SOLD LISTINGS
Q3- 2024 vs Q3- 2023 -2.8%
QUARTERLY MARKET OVERVIEW

QUARTERLY MARKET OVERVIEW

ACTIVE LISTINGS
Q3- 2024 vs Q3- 2023 0.0%
PENDING LISTINGS
Q3- 2024 vs Q3- 2023 69.6%
SOLD LISTINGS
Q3- 2024 vs Q3- 2023
3.3%
QUARTERLY MARKET OVERVIEW

QUARTERLY MARKET OVERVIEW

ACTIVE LISTINGS
Q3- 2024 vs Q3- 2023
38.6%
PENDING LISTINGS
Q3- 2024 vs Q3- 2023 -20.8% SOLD LISTINGS
Q3- 2024 vs Q3- 2023 -2.5%

QUARTERLY MARKET OVERVIEW

ACTIVE LISTINGS
Q3- 2024 vs Q3- 2023 -28.6%
PENDING LISTINGS
Q3- 2024 vs Q3- 2023 -25.0% SOLD LISTINGS
Q3- 2024 vs Q3- 2023 11.3%

QUARTERLY MARKET OVERVIEW

ACTIVE LISTINGS
Q3- 2024 vs Q3- 2023
-10.7%
PENDING LISTINGS
Q3- 2024 vs Q3- 2023
150.0% SOLD LISTINGS
Q3- 2024 vs Q3- 2023 -20.0%
QUARTERLY MARKET OVERVIEW

QUARTERLY MARKET OVERVIEW

ACTIVE LISTINGS
Q3- 2024 vs Q3- 2023 -9.7%
PENDING LISTINGS
Q3- 2024 vs Q3- 2023
66.7%
SOLD LISTINGS
Q3- 2024 vs Q3- 2023
3.4%
QUARTERLY MARKET OVERVIEW

2024 vs Q3- 2023
QUARTERLY MARKET OVERVIEW

ACTIVE LISTINGS
Q3- 2024 vs Q3- 2023 10.5%
PENDING LISTINGS
Q3- 2024 vs Q3- 2023 29.4%
SOLD LISTINGS
Q3- 2024 vs Q3- 2023 2.3%

QUARTERLY MARKET OVERVIEW

ACTIVE LISTINGS
Q3- 2024 vs Q3- 2023 24.1%
Source : Smart MLS, Single Family For Sale
PENDING LISTINGS
Q3- 2024 vs Q3- 2023 10.7%
SOLD LISTINGS
Q3- 2024 vs Q3- 2023 -7.1%

ACTIVE LISTINGS
Q3- 2024 vs Q3- 2023 12.1%
Source : Smart MLS, Single Family For Sale
PENDING LISTINGS
Q3- 2024 vs Q3- 2023 -28.6% SOLD LISTINGS
Q3- 2024 vs Q3- 2023 -24.6%

MARKET HISTORY

QUARTERLY MARKET OVERVIEW

ACTIVE LISTINGS
Q3- 2024 vs Q3- 2023 -14.3%
QUARTERLY MARKET OVERVIEW
PENDING LISTINGS
Q3- 2024 vs Q3- 2023
83.3%
SOLD LISTINGS
Q3- 2024 vs Q3- 2023 -2.3%


ACTIVE LISTINGS
Q3- 2024 vs Q3- 2023
100.0%
QUARTERLY MARKET OVERVIEW
QUARTERLY MARKET OVERVIEW
PENDING LISTINGS
Q3- 2024 vs Q3- 2023 0.0% SOLD LISTINGS
Q3- 2024 vs Q3- 2023 -20.0%


ACTIVE LISTINGS
Q3- 2024 vs Q3- 2023
100.0%
QUARTERLY MARKET OVERVIEW
PENDING LISTINGS
Q3- 2024 vs Q3- 2023 -28.6%
SOLD LISTINGS
Q3- 2024 vs Q3- 2023
27.3%

QUARTERLY MARKET OVERVIEW

ACTIVE LISTINGS
Q3- 2024 vs Q3- 2023 11.1%
QUARTERLY MARKET OVERVIEW
PENDING LISTINGS
Q3- 2024 vs Q3- 2023 50.0%
SOLD LISTINGS
Q3- 2024 vs Q3- 2023 25.0%


ACTIVE LISTINGS
Q3- 2024 vs Q3- 2023
75.0%
QUARTERLY MARKET OVERVIEW
QUARTERLY MARKET OVERVIEW
PENDING LISTINGS
Q3- 2024 vs Q3- 2023 -33.3%
SOLD LISTINGS
Q3- 2024 vs Q3- 2023 -23.5%


ACTIVE LISTINGS
Q3- 2024 vs Q3- 2023
25.5%
QUARTERLY MARKET OVERVIEW
QUARTERLY MARKET OVERVIEW
PENDING LISTINGS
Q3- 2024 vs Q3- 2023 -33.3% SOLD LISTINGS
Q3- 2024 vs Q3- 2023 -5.9%

QUARTERLY MARKET OVERVIEW

ACTIVE LISTINGS
Q3- 2024 vs Q3- 2023 0.0%
QUARTERLY MARKET OVERVIEW
PENDING LISTINGS
Q3- 2024 vs Q3- 2023 -33.3%
SOLD LISTINGS
Q3- 2024 vs Q3- 2023 0.0%