Market




Report DARIEN, ROWAYTON, NEW CANAAN Q3-2022
This October marks over 25 years of Houlihan Lawrence’s support of Breast Cancer Awareness Month. No matter the challenges we face, our elite team North of NYC remains STRONGER TOGETHER

We’re passionate in our support of breast cancer walks throughout our communities. Connect with your agent, visit any Houlihan Lawrence office or type in a link from below to learn how you can help contribute.

AMERICAN CANCER SOCIETY MAKING STRIDES AGAINST BREAST CANCER
Join us on October 16, 2022 Manhattanville College Purchase, NY
hlre.co/makingstrides2022
MILES OF HOPE BREAST CANCER FOUNDATION WALK

hlre.co/milesofhopeEF2022 hlre.co/milesofhopeLG2022 hlre.co/milesofhopeMB2022

SUPPORT CONNECTION SUPPORT-A-WALK hlre.co/supportconnection2022
Executive Summary
It is widely accepted that, in a normal year, spring and fall are the most active selling seasons in local real estate markets. However, the last couple of years (namely 2020 and 2021) have been anything but “normal” due to the massive influx of local homebuyers escaping the city during the pandemic. As we began 2022, we believed that local real estate markets would “normalize” a bit with a return to seasonal increases in homes for sale in spring, and we hoped, in the fall. Unfortunately, for homebuyers, this has not been the case.
Local markets continue to be marked by incredibly low levels of inventory for sale. The number of homes for sale in Darien, New Canaan, and Rowayton at the end of the quarter was down 27%, 30%, and 40%, respectively, versus last year. Given how constrained our markets are by low inventory levels, it is no surprise that sales totals are trending downward too. The number of homes sold during the third quarter of 2022 in Darien, New Canaan, and Rowayton was down 30%, 39%, and 16%, respectively, versus the same period last year.
Despite high inflation, stock market declines, and the Federal Reserve’s continued interest rate increases, demand for homes in our markets continues to outpace supply. Appropriately priced homes across most price points continue to attract more than one bidder, with cash buyers still active in the marketplace. Interestingly, we’re noticing a decline in the number of “trade-up” buyers within local markets. Seemingly, those who already own a home with a favorable mortgage rate are reluctant to trade their existing loan for a new one with a significantly higher rate.
Regardless, our continued low supply of homes for sale should help prices remain stable in the near term. In our view, the art of pricing a home for sale will become more challenging as recent comparable transactions, which may have been driven by “pandemic urgency,” become less relevant. The successful seller may want to consider more historical sales data in developing a proper pricing strategy going forward.
As the #1 brokerage in Greenwich, Darien, and New Canaan, Houlihan Lawrence is uniquely positioned to assist local luxury home buyers and sellers. We look forward to an opportunity to be of service to you.
With Warm Regards, Liz Nunan President and CEO
Q3-2022 MARKET REPORT
QUARTERLY MARKET OVERVIEW
Q3 2022 Q3
DARIEN
% CHANGE YTD 2022 YTD
% CHANGE
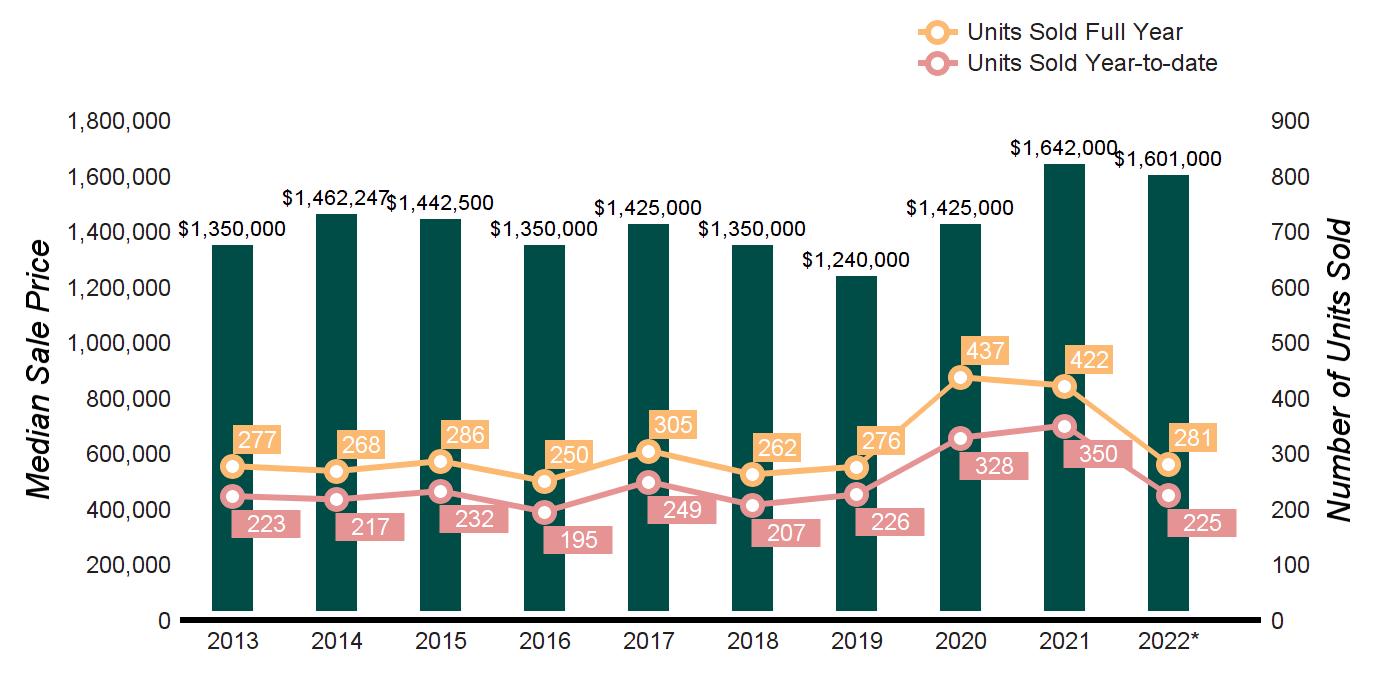
HOMES SOLD 83 119 -30.3% 225 350 -35.7%
AVERAGE SALE PRICE $1,932,206 $2,113,331 -8.6% $1,969,187 $1,912,084 3.0%
MEDIAN SALE PRICE $1,600,000 $1,810,000 -11.6% $1,601,000 $1,635,000 -2.1%
AVERAGE PRICE PER SQUARE FOOT $559 $515 8.5% $563 $502 12.2%
AVERAGE DAYS ON MARKET 30 43 -30.2% 36 70 -48.6%
100.0% 3.4% 103.4% 99.4% 4.0%
HISTORY
2021
2021
% SALE PRICE TO LIST PRICE 103.4%
TEN-YEAR MARKET
Average Sale Price $1,618,804 $1,619,781 $1,705,978 $1,673,646 $1,676,743 $1,603,743 $1,534,435 $1,655,525 $1,929,797 $1,969,187 Average Sale Price Average Price/SqFt $467 $474 $504 $490 $476 $458 $429 $446 $505 $563 Average Price/SqFt Days On Market 123 109 105 110 126 122 147 124 70 36 Days On Market %Sale Price to List Price 96.1% 96.9% 95.6% 96.0% 95.5% 94.7% 94.0% 96.3% 99.4% 103.4% %Sale Price to List Price * Homes sold for 2022 are annualized based on actual sales year-to-date. HOULIHANLAWRENCE.COM
SUPPLY/DEMAND ANALYSIS
AS OF SEPTEMBER 30, 2022
PRICE RANGE
SUPPLY: ACTIVE LISTINGS
DEMAND: PENDING SALES
$0 - $499,999 0 1
$500,000 - $699,999 4
$700,000 - $999,999 5 2
SUPPLY/ DEMAND RATIO*
Not Valid
AS OF SEPTEMBER 30, 2021 2022 vs. 2021
SUPPLY: ACTIVE LISTINGS
DEMAND: PENDING SALES
1
SUPPLY/ DEMAND RATIO*
% CHANGE IN LISTINGS
% CHANGE IN PENDINGS
0.0% 0.0%
0.0% -100.0%
12 1 12 -58.3% 100.0%
$1,000,000 - $1,499,999 10
$2,000,000 - $2,499,999
$2,500,000 - $2,999,999 5
$3,000,000 - $3,999,999
$4,000,000 and up
PRICE RANGE
$0 - $499,999
$500,000 - $699,999
$700,000 - $999,999
$1,000,000 - $1,499,999
YEAR-TO-DATE YEAR-OVER-YEAR
01/01/202209/30/2022
-50.0% -33.3%
-28.6% -20.0% $1,500,000 - $1,999,999
0.0% 500.0%
150.0% -40.0%
0.0% 133.3%
-37.5% 50.0%
01/01/202109/30/2021 % CHANGE 2022/2021 10/01/202109/30/2022 10/01/202009/30/2021 % CHANGE 2022/2021
-100.0%
-28.6%
-25.6%
3 -100.0%
-36.4%
61 -31.1%
124 -41.9% $1,500,000 - $1,999,999
-41.8%
-35.2%
-33.3%
$2,500,000 - $2,999,999
-41.9%
95 -31.6% $2,000,000 - $2,499,999
-50.0% $3,000,000 - $4,999,999
-48.8%
-24.4%
0.0%
DARIEN -35.7%
16.7%
-14.5% $5,000,000 and
-35.3%
0 0
0
0
4 1 4
3
4 3 14 5 3
6 6 1 12 9 1
8 6 1 8 1 8
3 2 2 5 1
6 7 1 6 3 2
10 3 3 16 2 8
MarketTotals 54 32 2 74 28 3 -27.0% 14.3% *Supply Demand Ratio Key 1-4: High Demand 5-6: Balanced 7-9: Low Demand 10+: Very Low Demand SOLD PROPERTIES
0 3
0
10 14
14 22
32 43
42
57 98
72
46 71
65
20 30
25 43
21 41
25 50
34 45
47 55
up 5 5
7 6
MarketTotals 225 350
297 459
Source: Smart MLS, Darien, Single Family Homes, Sold
QUARTERLY MARKET OVERVIEW
Q3 2022 Q3
% CHANGE YTD 2022 YTD
% CHANGE
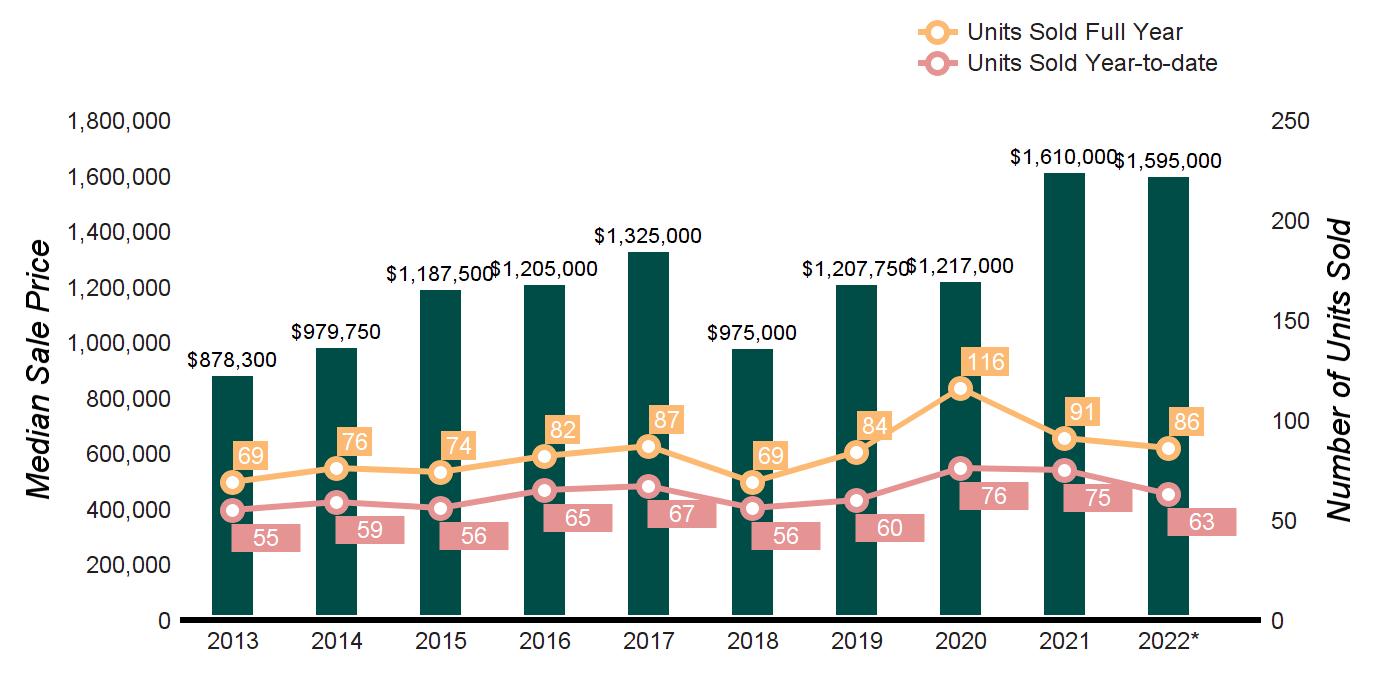
HOMES SOLD 29 25 16.0% 63 75 -16.0%
AVERAGE SALE PRICE $1,998,733 $1,870,900 6.8% $1,730,608 $1,722,011 0.5%
MEDIAN SALE PRICE $1,750,000 $1,775,000 -1.4% $1,595,000 $1,600,000 -0.3%
AVERAGE PRICE PER SQUARE FOOT $615 $588 4.6% $604 $533 13.3%

AVERAGE DAYS ON MARKET 43 54 -20.4% 37 79 -53.2%
% SALE PRICE TO LIST PRICE 100.8% 99.5% 1.3% 103.0% 99.8% 3.2%
HISTORY
sales year-to-date.
ROWAYTON
2021
2021
TEN-YEAR MARKET
Average Sale Price $1,135,078 $1,340,895 $1,273,026 $1,337,148 $1,379,317 $1,273,417 $1,276,696 $1,345,651 $1,774,299 $1,730,608 Average Sale Price Average Price/SqFt $373 $439 $435 $463 $459 $445 $439 $452 $548 $604 Average Price/SqFt Days On Market 99 117 136 145 110 92 139 111 80 37 Days On Market %Sale Price to List Price 93.7% 96.2% 94.9% 95.3% 95.0% 95.7% 95.3% 96.6% 99.3% 103.0% %Sale Price to List Price * Homes sold for 2022 are annualized based on actual
HOULIHANLAWRENCE.COM
SUPPLY/DEMAND ANALYSIS
AS OF SEPTEMBER 30, 2022
PRICE RANGE
$0 - $499,999
SUPPLY: ACTIVE LISTINGS
DEMAND: PENDING SALES
AS OF SEPTEMBER 30, 2021 2022 vs. 2021
SUPPLY/ DEMAND RATIO*
SUPPLY: ACTIVE LISTINGS
DEMAND: PENDING SALES
SUPPLY/ DEMAND RATIO*
% CHANGE IN LISTINGS
% CHANGE IN PENDINGS
0 0 Not Valid 0 0 Not Valid 0.0% 0.0%
$500,000 - $699,999 1 0 Not Valid 2 0 Not Valid -50.0% 0.0%
$700,000 - $999,999 3 0 Not Valid 3 2 2 0.0% -100.0%
$1,000,000 - $1,499,999 2 1 2 1 3 1 100.0% -66.7% $1,500,000 - $1,999,999 1 0 Not Valid 2 0 Not Valid -50.0% 0.0%
$2,000,000 - $2,499,999 1 0 Not Valid 3 0 Not Valid -66.7% 0.0%
$2,500,000 - $2,999,999 0 1 0 1 0 Not Valid -100.0% 0.0%
$3,000,000 - $3,999,999 0
2
SOLD PROPERTIES
Not Valid 0.0% 0.0%
2 -100.0% 100.0% $4,000,000 and up
-40.0% 0.0%
PRICE RANGE
YEAR-TO-DATE YEAR-OVER-YEAR
01/01/202209/30/2022
01/01/202109/30/2021 % CHANGE 2022/2021 10/01/202109/30/2022 10/01/202009/30/2021 % CHANGE 2022/2021
$0 - $499,999 0 1 -100.0% 0 2 -100.0%
$500,000 - $699,999
$700,000 - $999,999
-16.7%
-9.1%
12 -50.0%
21 -33.3%
$1,000,000 - $1,499,999
$2,000,000 - $2,499,999
-13.3%
5.9%
-60.0%
25 -16.0%
20 -30.0% $1,500,000 - $1,999,999
-57.1%
$2,500,000 - $2,999,999
166.7%
100.0% $3,000,000 - $4,999,999
-71.4%
Not Valid
ROWAYTON MarketTotals
-16.0%
100.0%
-44.4% $5,000,000 and
-31.3%
2 0
1
1 2 1 1 0
MarketTotals 9 6 2 15 6 3
*Supply Demand Ratio Key 1-4: High Demand 5-6: Balanced 7-9: Low Demand 10+: Very Low Demand
5 6
6
10 11
14
13 15
14
18 17
21
6 15
9 21
8 3
8 4
2 7
5 9
up 1 0
2 1
63 75
79 115
Source: Smart MLS, Rowayton, Single Family Homes, Sold
QUARTERLY MARKET OVERVIEW
Q3 2022 Q3 2021 % CHANGE YTD 2022 YTD 2021 % CHANGE
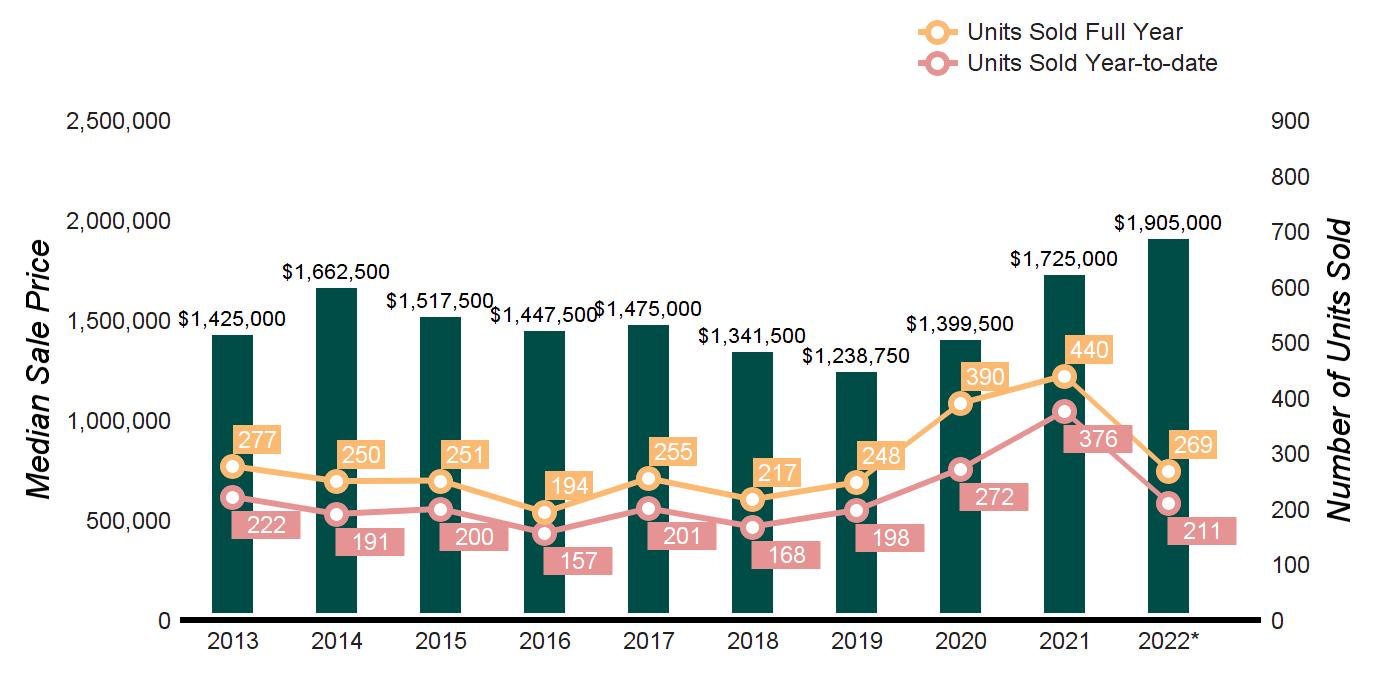
HOMES SOLD 85 139 -38.8% 211 376 -43.9%
AVERAGE SALE PRICE $2,342,503 $1,972,061 18.8% $2,189,147 $1,990,885 10.0%
MEDIAN SALE PRICE $2,000,000 $1,720,000 16.3% $1,905,000 $1,725,500 10.4%
AVERAGE PRICE PER SQUARE FOOT $489 $399 22.6% $458 $394 16.2%
AVERAGE DAYS ON MARKET 42 63 -33.3% 54 86 -37.2%
% SALE PRICE TO LIST PRICE 100.4% 100.2% 0.2% 101.2% 99.3% 1.9%
sold for 2022 are
HISTORY
based
sales year-to-date.
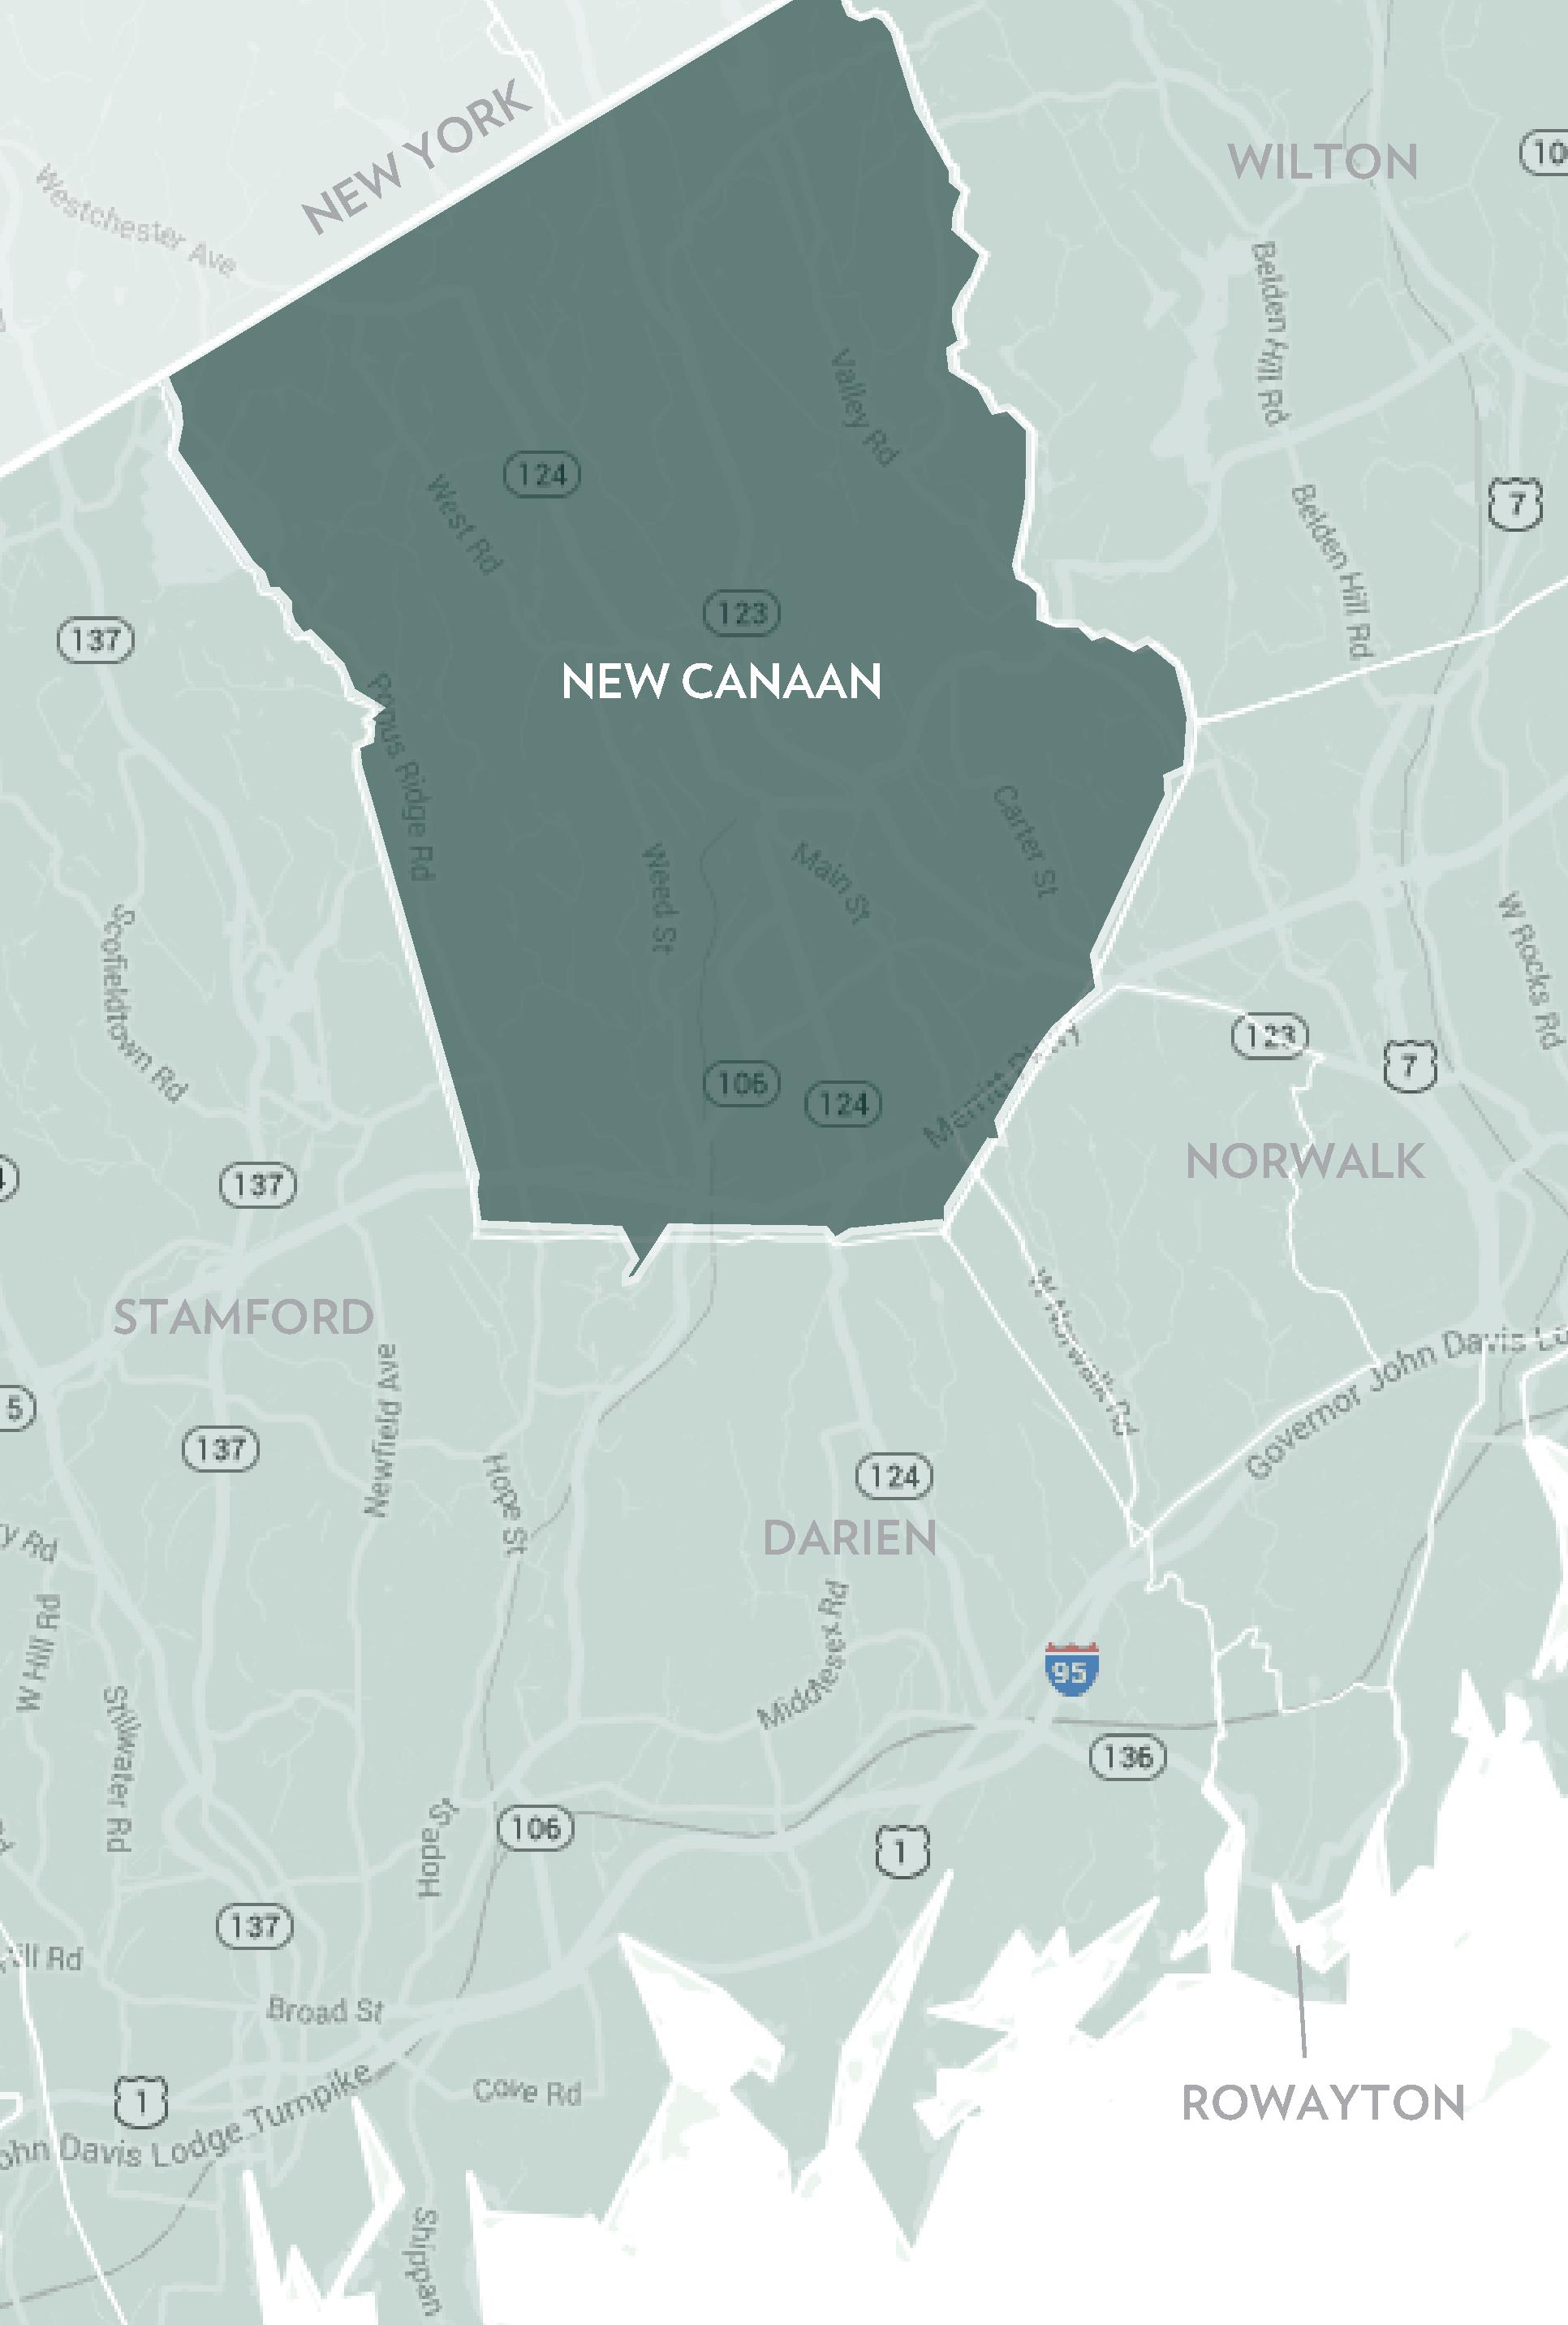
NEW CANAAN
TEN-YEAR MARKET
Average Sale Price $1,661,172 $1,929,472 $1,783,190 $1,770,026 $1,713,201 $1,628,160 $1,424,859 $1,670,517 $1,995,193 $2,189,147 Average Sale Price Average Price/SqFt $388 $389 $406 $356 $355 $341 $316 $337 $400 $458 Average Price/SqFt Days On Market 123 122 126 148 147 138 164 138 83 54 Days On Market %Sale Price to List Price 95.0% 94.9% 95.8% 93.8% 94.0% 92.2% 92.8% 95.4% 99.1% 101.2% %Sale Price to List Price * Homes
annualized
on actual
HOULIHANLAWRENCE.COM
SUPPLY/DEMAND ANALYSIS
AS OF SEPTEMBER 30, 2022
PRICE RANGE
SUPPLY: ACTIVE LISTINGS
DEMAND: PENDING SALES
AS OF SEPTEMBER 30, 2021 2022 vs. 2021
SUPPLY/ DEMAND RATIO*
SUPPLY: ACTIVE LISTINGS
$500,000 - $699,999 0 0 Not Valid 1
$700,000 - $999,999 8 1
DEMAND: PENDING SALES
SUPPLY/ DEMAND RATIO*
% CHANGE IN LISTINGS
% CHANGE IN PENDINGS
$0 - $499,999 0 0 Not Valid 0 0 Not Valid 0.0% 0.0%
Not Valid -100.0% 0.0%
1 7 14.3% 0.0%
$1,000,000 - $1,499,999 9
$2,000,000 - $2,499,999 8
$2,500,000 - $2,999,999 4
2
2 -35.3% -12.5%
4 6 -62.5% 25.0% $1,500,000 - $1,999,999 11
2 -11.1% 75.0%
4 -69.2% 66.7% $3,000,000 - $3,999,999 8
SOLD PROPERTIES
1
YEAR-TO-DATE YEAR-OVER-YEAR
PRICE RANGE
$0 - $499,999
$500,000 - $699,999
$700,000 - $999,999
$1,000,000 - $1,499,999
26.1% 0.0%
-50.0% 0.0% $4,000,000 and up
01/01/202209/30/2022 01/01/202109/30/2021 % CHANGE 2022/2021 10/01/202109/30/2022 10/01/202009/30/2021 % CHANGE 2022/2021
Not Valid
-50.0%
-53.3%
Not Valid
-50.0%
45 -62.2%
-48.6% $1,500,000 - $1,999,999
$2,500,000 - $2,999,999
-43.3%
-59.3%
-49.2%
-7.9%
$3,000,000 - $4,999,999
-48.6%
-51.3% $2,000,000 - $2,499,999
-11.1%
-35.0% $5,000,000 and
NEW CANAAN 133.3%
-39.6%
100.0%
-43.9%
-44.3%
0
8 7
5
24
7 2 17 8
7 1 9 4
5
13 3
5 2 16 5 3
29 2 15 23 2 12
MarketTotals 77 32 2 110 27 4 -30.0% 18.5% *Supply Demand Ratio Key 1-4: High Demand 5-6: Balanced 7-9: Low Demand 10+: Very Low Demand
0 0
0 0
4 8
5 10
14 30
17
55 97
74 144
37 91
57 117
31 61
36 70
35 38
40 45
29 48
39 60
up 6 3
7 3
MarketTotals 211 376
275 494
Source: Smart MLS, New Canaan, Single Family Homes, Sold
3 GLOBAL NETWORKS - REACHING 56 COUNTRIES & 6 CONTINENTS
Leading Real Estate Companies of the World | Luxury Portfolio International Board of Regents Luxury Real Estate


