Market


A myriad of data points indicate buyer demand remains strong in luxury markets north of NYC, defying broader trends in luxury real estate.
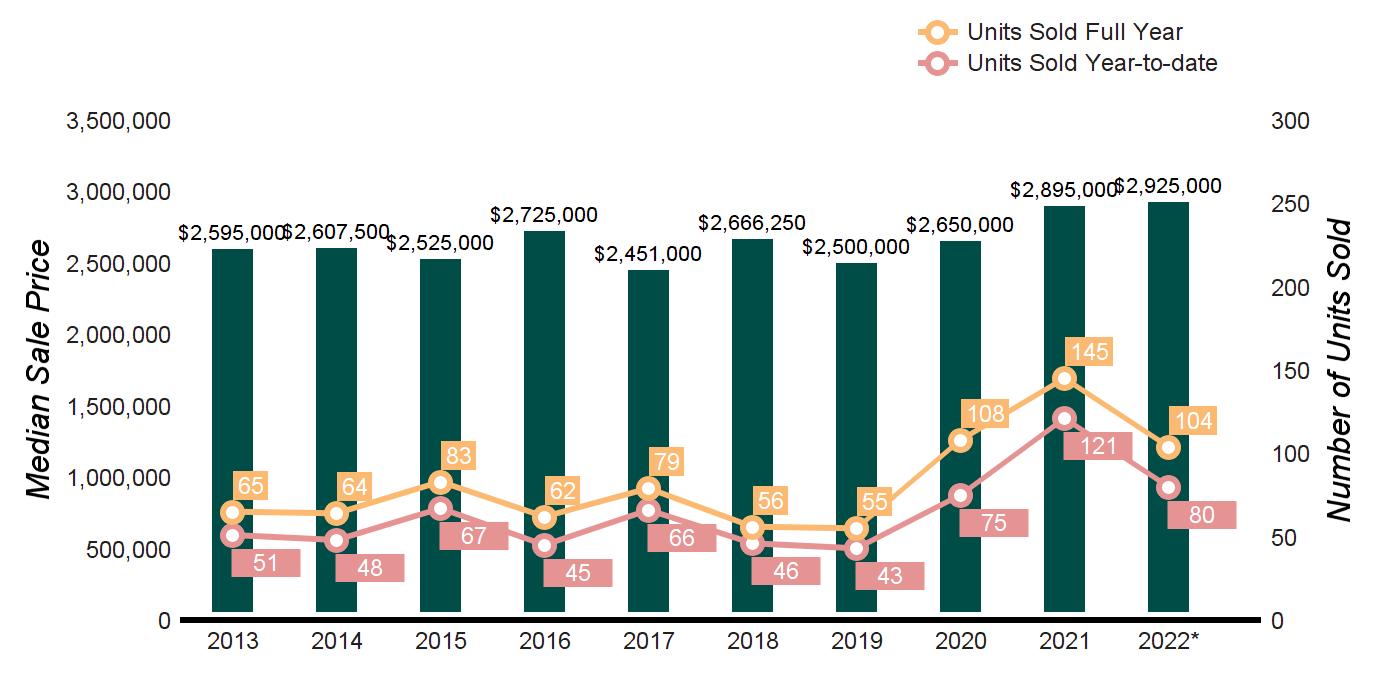
Westchester ($2M and higher) and Putnam/Dutchess counties ($1M and higher) realized respectable gains in year-to-date closed sales. Luxury markets in CT (Greenwich, $3M and higher; Darien, Rowayton, and New Canaan, $2M and higher) posted a decline for the fourth consecutive quarter. Buyer demand is not waning, but the supply of homes for sale is, resulting in fewer closed sales.
Closed sales are a lagging indicator, and pended sales (expected to close within 2 to 3 months) provide a timelier look at the market. In Southern Westchester, pended sales are slightly higher than the same period last year; however, in Northern Westchester, pended sales declined by one-third, and supply inched lower. Dutchess and Putnam counties are level with last year, with supply declining.
In Greenwich, both inventory and pended sales are down. However, homes are selling faster and at the asking price, pointing to a healthy market that is suffering only from a lack of product. The $10M price range is the exception - supply has nearly doubled compared to last year with no pended sales. Fifteen homes closed at $10M+ in 2021 and in 2020, compared to 8 closed sales so far this year.
In Darien, Rowayton, and New Canaan, pended sales climbed by double-digits, and homes are selling more quickly than in the same period last year. There is an appetite for new inventory, underscoring the sustained buoyancy of the luxury market.
Despite the headlines of a housing downturn, we are fortunate to live in an area that is bucking the trends for now. If you currently have a home for sale that is not generating activity or offers, the price and presentation of your home could be standing in the way of a timely sale. Buyers are motivated, decisive, and knowledgeable. They are quick to say yes to a listing that meets their criteria and swift to discard it if they perceive a listing to be overpriced and visually underwhelming.
Luxury real estate relies on demand from high-net-worth individuals (HNWI). The rapid downturn in the stock market and the threat of wealth erosion is a tangible fear. Continued declines can negatively impact HNWI's desire for luxury real estate sales. Until then, it's an opportune time to be a seller north of NYC.
Sincerely,
Anthony P. Cutugno Sr. Vice President, Director of Private BrokerageQ3 2022 Q3 2021 % CHANGE
YTD 2022 YTD 2021 % CHANGE
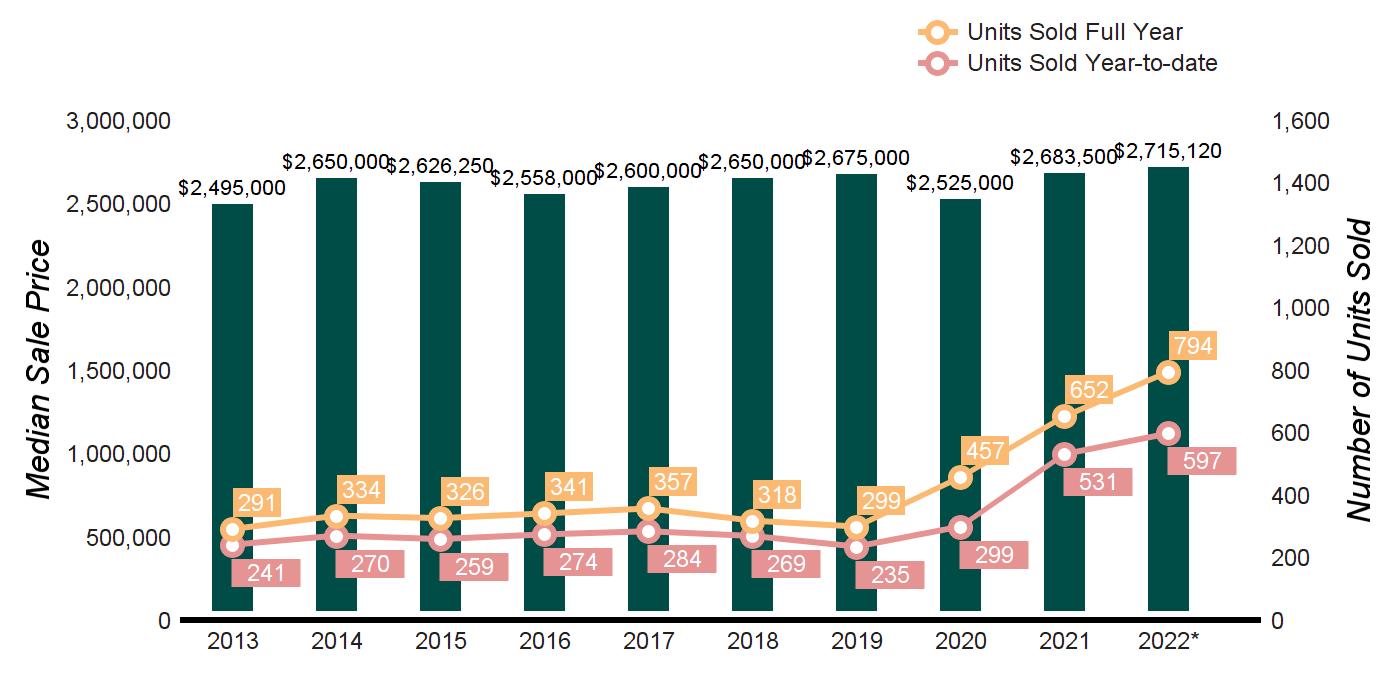
HOMES SOLD 267 242 10.3% 597 531 12.4%
TOTAL DOLLAR VOLUME $815,892,881 $708,597,314 15.1% $1,853,600,982 $1,598,037,626 16.0%
MEDIAN SALE PRICE $2,750,000 $2,622,500 4.9% $2,715,120 $2,650,000 2.5%
AVERAGE PRICE PER SQUARE FOOT $613 $545 12.5% $607 $546 11.2%
AVERAGE DAYS ON MARKET 36 54 -33.3% 45 75 -40.0%
% SALE PRICE TO LIST PRICE 103.7% 99.4% 4.3% 102.7% 98.2% 4.6%
Q3 2022 Q3 2021 % CHANGE YTD 2022 YTD 2021 % CHANGE
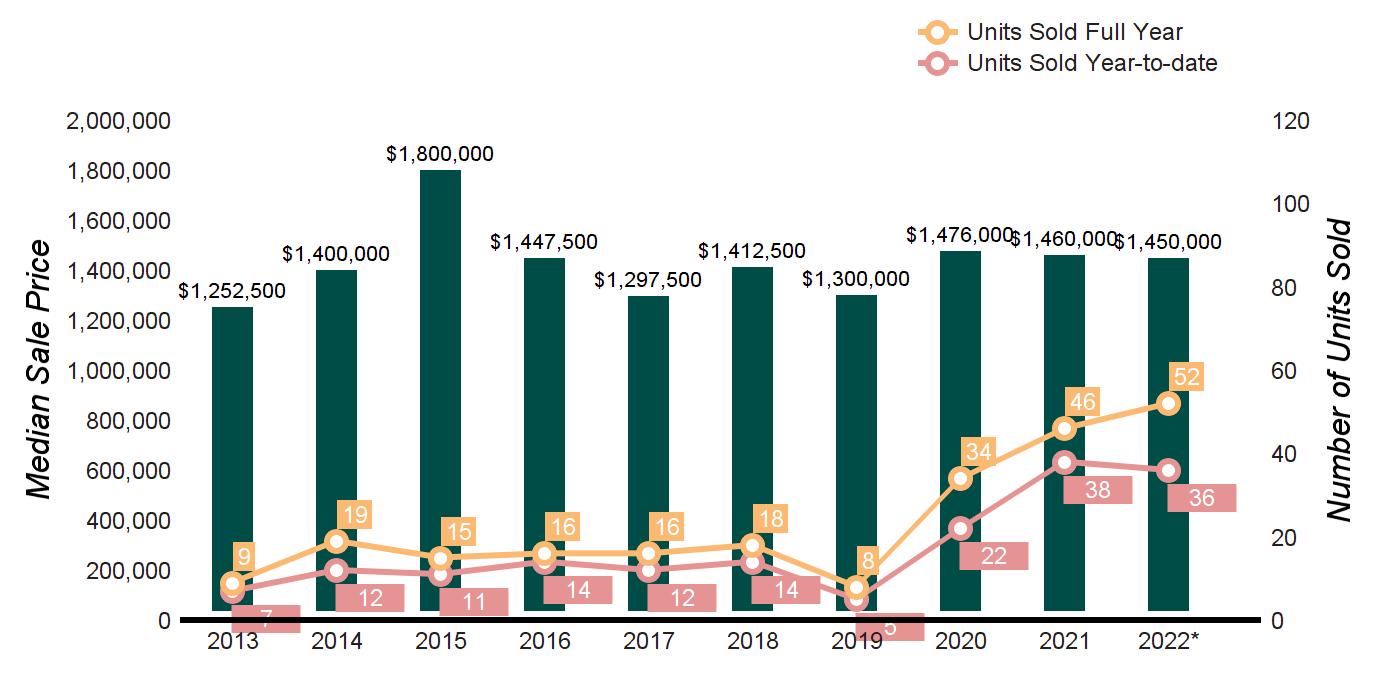
UNITS SOLD 32 46 -30.4% 121 118 2.5%
TOTAL DOLLAR VOLUME $77,390,997 $83,443,000 -7.3% $237,623,297 $239,733,306 -0.9%
MEDIAN SALE PRICE $1,450,000 $1,550,000 -6.5% $1,450,000 $1,590,115 -8.8%
AVERAGE PRICE PER SQUARE FOOT $456 $450 1.3% $441 $459 -3.9%
AVERAGE DAYS ON MARKET 116 179 -35.2% 158 182 -13.2%
% SALE PRICE TO LIST PRICE 89.4% 98.6% -9.3% 94.2% 95.8% -1.7%
Q3 2022 Q3 2021 % CHANGE
YTD 2022 YTD 2021 % CHANGE
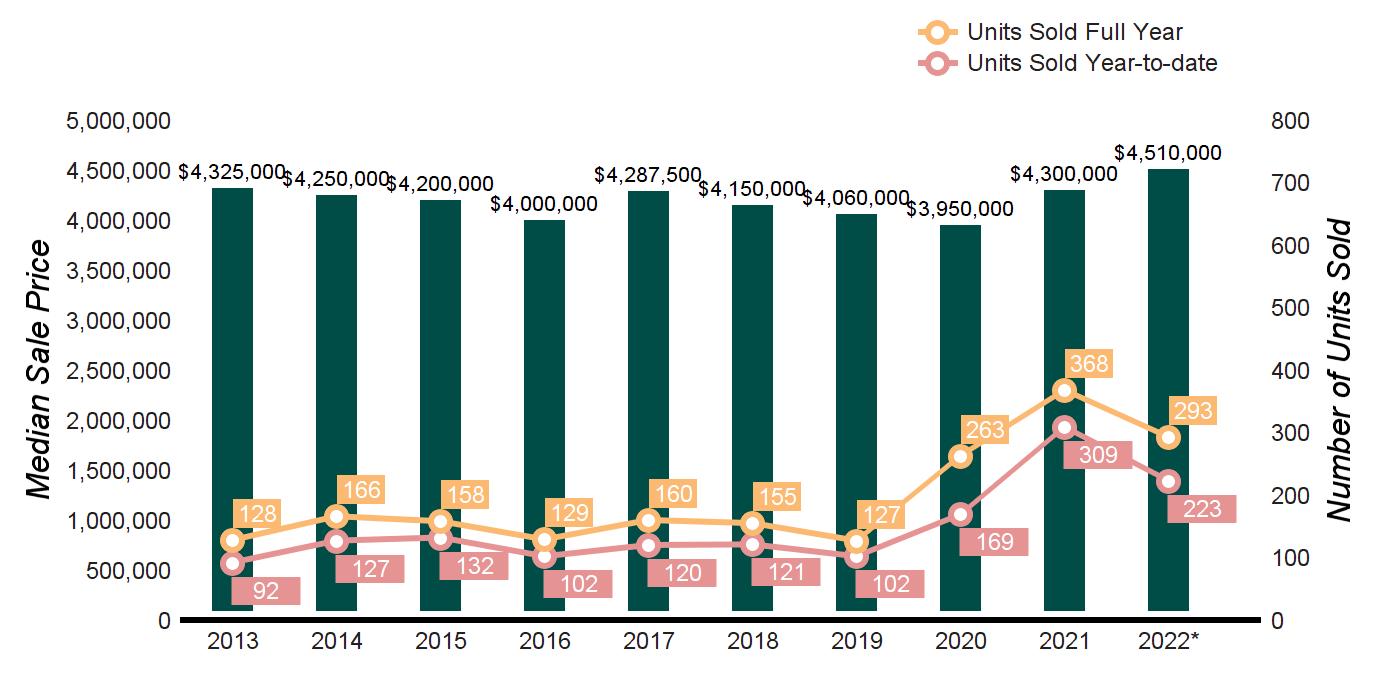
HOMES SOLD 85 120 -29.2% 223 309 -27.8%
TOTAL DOLLAR VOLUME $433,588,786 $597,638,896 -27.4% $1,136,746,613 $1,590,983,716 -28.6%
MEDIAN SALE PRICE $4,650,000 $4,237,500 9.7% $4,510,000 $4,275,000 5.5%
AVERAGE PRICE PER SQUARE FOOT $801 $793 1.0% $792 $761 4.1%
AVERAGE DAYS ON MARKET
SALE PRICE TO LIST PRICE
135 -49.6% 90 143 -37.1%
Q3 2022 Q3 2021 % CHANGE YTD 2022 YTD 2021 % CHANGE
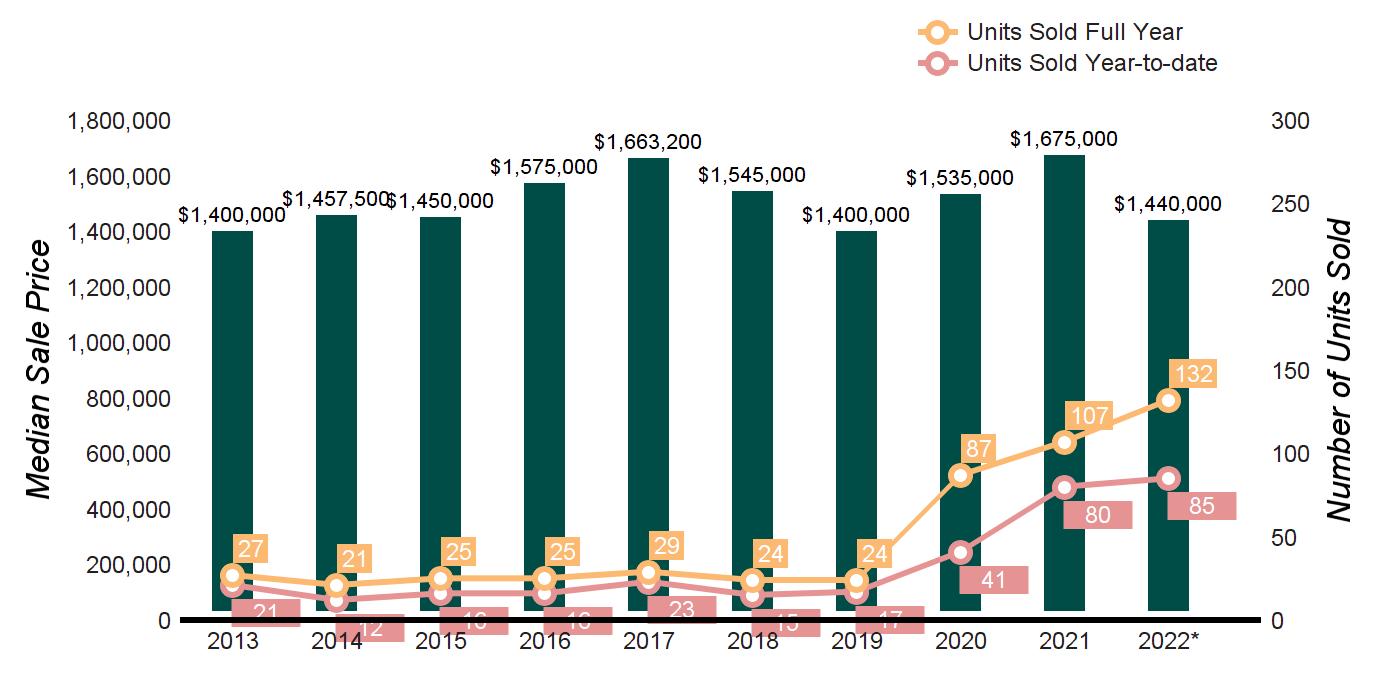
HOMES SOLD 30 48 -37.5% 80 121 -33.9%
TOTAL DOLLAR VOLUME $93,710,000 $154,880,781 -39.5% $257,358,997 $378,420,032 -32.0%
MEDIAN SALE PRICE $2,862,500 $2,775,000 3.2% $2,925,000 $2,800,000 4.5%
AVERAGE PRICE PER SQUARE FOOT $605 $564 7.3% $609 $561 8.6%
AVERAGE DAYS ON MARKET 25 50 -50.0% 41 91 -54.9%
% SALE PRICE TO LIST PRICE 103.4% 99.4% 4.0% 102.2% 98.5% 3.8%
Q3 2022 Q3 2021 % CHANGE YTD 2022 YTD 2021 % CHANGE
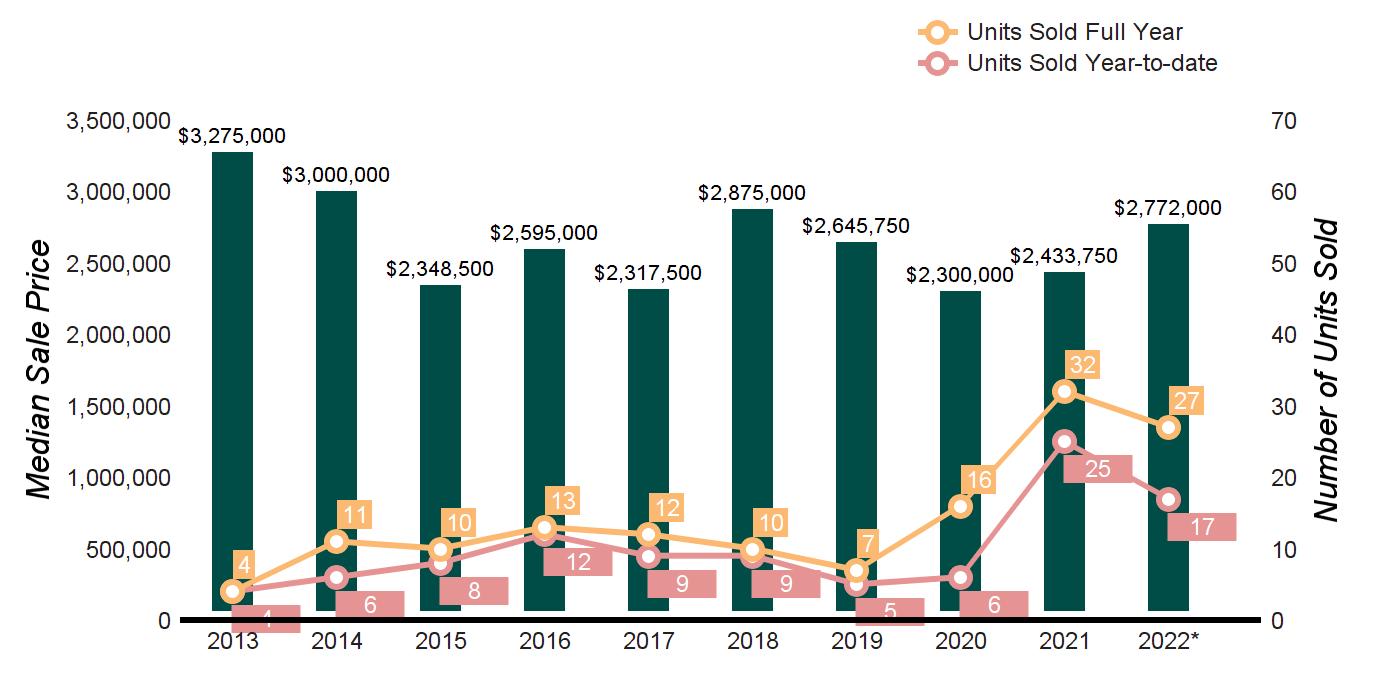
HOMES SOLD 9 10 -10.0% 17 25 -32.0%
TOTAL DOLLAR VOLUME $29,077,000 $26,667,500 9.0% $49,802,000 $66,865,360 -25.5%
MEDIAN SALE PRICE $2,830,000 $2,402,500 17.8% $2,772,000 $2,405,000 15.3%
AVERAGE PRICE PER SQUARE FOOT $787 $694 13.4% $761 $706 7.8% AVERAGE DAYS ON MARKET 53 55 -3.6% 34 59 -42.4%
% SALE PRICE TO LIST PRICE 103.1% 98.7% 4.5% 104.0% 98.9% 5.2%
2022
HOMES SOLD
TOTAL DOLLAR VOLUME
MEDIAN SALE PRICE
AVERAGE PRICE PER SQUARE FOOT
DAYS ON MARKET
SALE PRICE TO LIST PRICE
CHANGE
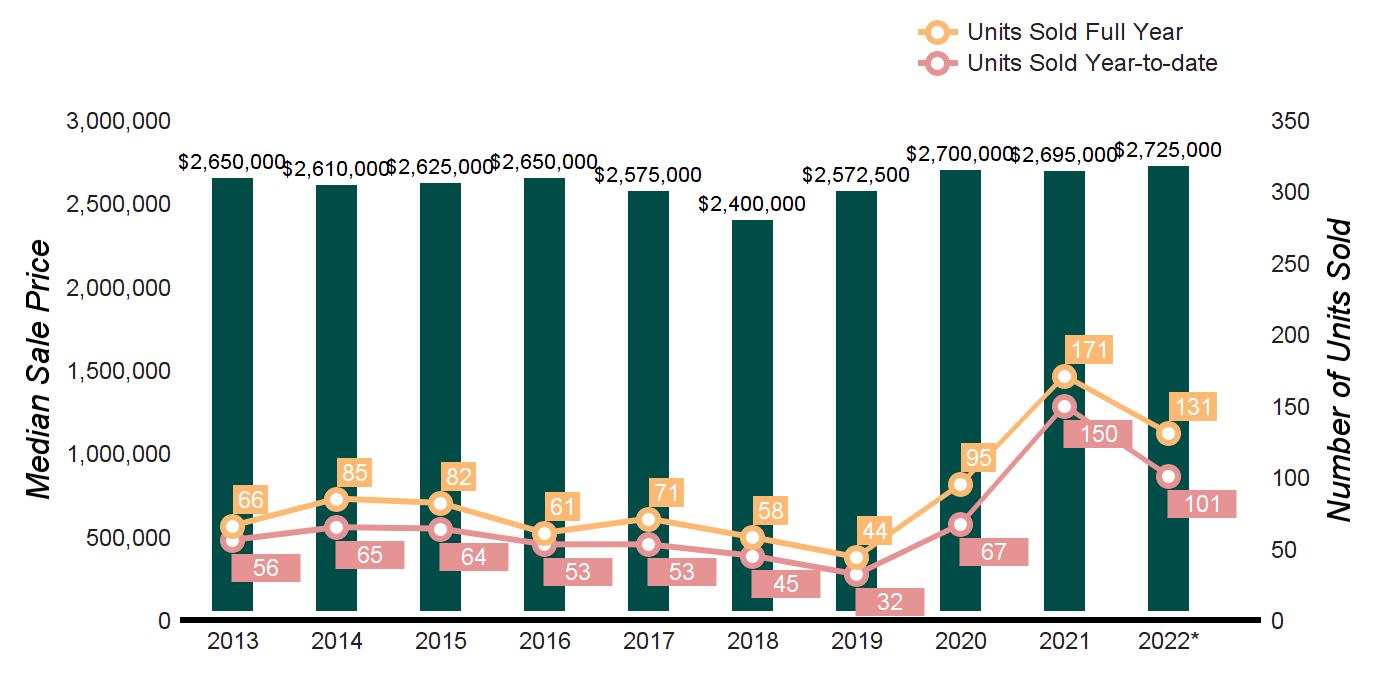
YTD 2022 YTD 2021 % CHANGE
-17.3% 101 150 -32.7%
$148,628,000 -3.6% $312,352,947 $437,820,597 -28.7%
$2,562,500
$2,725,000 $2,650,000 2.8%
25.7% $501 $415 20.7%
-21.3%
96 -38.5%
2.9%
2022
$2,000,000 - $2,999,999
$3,000,000 - $4,999,999
$5,000,000 - $9,999,999
Q3 2022 Q3 2021
CHANGE
YTD 2022 YTD 2021 % CHANGE
357 5%
139 33%
33 -6%
$1,000,000 - $1,999,999
$2,000,000 and up
33 -30%
13
$3,000,000 - $3,999,999
$4,000,000 - $4,999,999
$5,000,000 - $9,999,999
$10,000,000 and up
Q3 2022 Q3 2021
53
CHANGE
27 -48%
YTD 2022 YTD 2021 % CHANGE
79 16%
39 -25%
YTD 2022 YTD 2021 % CHANGE
138 -44%
60 -1%
100 -21%
11 -27%
YTD 2021
$2,000,000 - $2,999,999
$3,000,000 - $4,999,999
$5,000,000 - $9,999,999
$10,000,000 and up
CHANGE
-42%
-24%
YTD 2022 YTD 2021
$2,000,000 - $2,999,999
$3,000,000 - $4,999,999
$5,000,000 - $9,999,999
$10,000,000 and up
CHANGE
-22%
-71%
YTD 2022 YTD 2021
$2,000,000 - $2,999,999
$3,000,000 - $4,999,999
$5,000,000 - $9,999,999
$10,000,000 and up
CHANGE
-33%
-39%
SCHOOL DISTRICT # OF SALES
MEDIAN LUXURY SALE PRICE HIGHEST SALE PRICE
SCARSDALE 60 $2,820,000 $8,287,500
RYE CITY 34 $3,362,500 $8,500,000
MAMARONECK 31 $2,655,000 $5,200,000
HARRISON 27 $2,625,000 $3,855,000
CHAPPAQUA 20 $2,385,000 $3,800,000
BYRAM HILLS 18 $2,555,000 $4,000,000
BEDFORD 16 $3,650,000 $9,400,000
BRONXVILLE 12 $2,845,000 $3,675,000
KATONAH LEWISBORO 8 $2,697,500 $6,500,000
RYE NECK 8 $2,997,500 $4,125,000
IRVINGTON 6 $2,600,000 $5,000,000
PELHAM 4 $2,102,500 $3,000,000
NEW ROCHELLE 3 $2,400,000 $2,510,000
NORTH SALEM 1 $2,000,000 $2,000,000
TUCKAHOE 1 $2,200,000 $2,200,000
SCHOOL DISTRICT
# OF SALES
MEDIAN LUXURY SALE PRICE HIGHEST SALE PRICE
GARRISON 4 $1,312,500 $2,775,000
BREWSTER 2 $2,088,748 $2,178,497
TOWN/CITY
# OF SALES MEDIAN LUXURY SALE PRICE HIGHEST SALE PRICE
WASHINGTON 4
$1,315,000 $1,700,000
RHINEBECK 3 $1,450,000 $1,750,000
CLINTON 2 $2,825,000 $4,200,000
RED HOOK 1 $18,500,000 $18,500,000
PAWLING 1 $1,195,000 $1,195,000
TOWN/CITY
GREENWICH
RIVERSIDE
OLD GREENWICH
# OF SALES MEDIAN LUXURY SALE PRICE HIGHEST SALE PRICE
$5,075,000 $12,350,000
$4,200,000 $6,525,000
$3,805,000 $5,453,816
TOWN/CITY
WESTPORT
NEW CANAAN
DARIEN
# OF SALES MEDIAN LUXURY SALE PRICE HIGHEST SALE PRICE
$3,165,000 $11,400,000
$2,800,000 $10,800,000
$2,862,500 $4,600,000
FAIRFIELD 16 $2,261,250 $4,325,000
WESTON 12 $2,293,750 $6,500,000
WILTON 9 $2,275,000 $2,565,000
NORWALK
RIDGEFIELD
STAMFORD
REDDING
$2,830,000 $7,800,000
$2,700,000 $4,400,000
$2,075,000 $4,300,000
$2,025,000 $2,025,000
AS OF SEPTEMBER 30, 2022
PRICE RANGE SUPPLY: ACTIVE LISTINGS
$2,000,000 - $2,999,999
DEMAND: PENDING SALES
AS OF SEPTEMBER 30, 2021 2022 vs. 2021
SUPPLY/ DEMAND RATIO*
ACTIVE LISTINGS
DEMAND: PENDING SALES
SUPPLY/ DEMAND RATIO*
CHANGE IN LISTINGS
% CHANGE IN PENDINGS
-4.2% -2.8%
-17.5% 10.5% $5,000,000 - $9,999,999
$3,000,000 - $4,999,999
$10,000,000 and up
AS OF SEPTEMBER 30, 2022
PRICE RANGE SUPPLY: ACTIVE LISTINGS
$2,000,000 - $2,999,999
DEMAND: PENDING SALES
SUPPLY/ DEMAND RATIO*
34.8%
200.0%
AS OF SEPTEMBER 30, 2021 2022 vs. 2021
ACTIVE LISTINGS
DEMAND: PENDING SALES
SUPPLY/ DEMAND RATIO*
% CHANGE IN LISTINGS
% CHANGE IN PENDINGS
-10.3% -37.5%
-24.1% -75.0% $5,000,000 - $9,999,999
$3,000,000 - $4,999,999
29.4% 0.0% $10,000,000 and up
0.0% -100.0%
AS OF SEPTEMBER 30, 2022
PRICE RANGE SUPPLY: ACTIVE LISTINGS
DEMAND: PENDING SALES
AS OF SEPTEMBER 30, 2021 2022 vs. 2021
SUPPLY/ DEMAND RATIO*
SUPPLY: ACTIVE LISTINGS
DEMAND: PENDING SALES
SUPPLY/ DEMAND RATIO*
% CHANGE IN LISTINGS
% CHANGE IN PENDINGS
$1,000,000 - $1,999,999
AS OF SEPTEMBER 30, 2022
PRICE RANGE SUPPLY: ACTIVE LISTINGS
$1,000,000 - $1,999,999
DEMAND: PENDING SALES
SUPPLY/ DEMAND RATIO*
-35.7% -50.0%
-26.1% 33.3% $2,000,000 and up
OF SEPTEMBER 30, 2021 2022 vs. 2021
ACTIVE LISTINGS
PENDING SALES
SUPPLY/ DEMAND RATIO*
CHANGE IN LISTINGS
% CHANGE IN PENDINGS
7.7% -29.4%
-20.7%
AS OF SEPTEMBER 30, 2022
PRICE RANGE
SUPPLY: ACTIVE LISTINGS
DEMAND: PENDING SALES
AS OF SEPTEMBER 30, 2021 2022 vs. 2021
DEMAND RATIO*
ACTIVE LISTINGS
PENDING SALES
SUPPLY/ DEMAND RATIO*
CHANGE IN LISTINGS
% CHANGE IN PENDINGS
-25.6% -6.7% $4,000,000 - $4,999,999
$3,000,000 - $3,999,999
-9.7% -25.0% $5,000,000 - $9,999,999
AS OF SEPTEMBER 30, 2022
PRICE RANGE
$2,000,000 - $2,999,999
SUPPLY: ACTIVE LISTINGS
DEMAND: PENDING SALES
DEMAND RATIO*
-15.8% 6.3%
70.0% -100.0%
AS OF SEPTEMBER 30, 2021 2022 vs. 2021
ACTIVE LISTINGS
DEMAND: PENDING SALES
SUPPLY/ DEMAND RATIO*
CHANGE IN LISTINGS
% CHANGE IN PENDINGS
30.0% 50.0%
-21.4% 100.0% $5,000,000 - $9,999,999
$3,000,000 - $4,999,999
-16.7% 0.0% $10,000,000 and up
AS OF SEPTEMBER 30, 2022
PRICE RANGE
$2,000,000 - $2,999,999
$3,000,000 - $4,999,999
SUPPLY: ACTIVE LISTINGS
DEMAND: PENDING SALES
SUPPLY/ DEMAND RATIO*
Valid -100.0% 0.0%
AS OF SEPTEMBER 30, 2021 2022 vs. 2021
SUPPLY: ACTIVE LISTINGS
DEMAND: PENDING SALES
SUPPLY/ DEMAND RATIO*
% CHANGE IN LISTINGS
% CHANGE IN PENDINGS
Valid -75.0% 0.0%
-50.0% 200.0%
Valid -100.0% 0.0% $10,000,000 and up
$5,000,000 - $9,999,999
AS OF SEPTEMBER 30, 2022
PRICE RANGE SUPPLY: ACTIVE LISTINGS
$2,000,000 - $2,999,999
$3,000,000 - $4,999,999
$5,000,000 - $9,999,999
DEMAND: PENDING SALES
SUPPLY/ DEMAND RATIO*
Valid 0.0%
AS OF SEPTEMBER 30, 2021 2022 vs. 2021
SUPPLY: ACTIVE LISTINGS
DEMAND: PENDING SALES
SUPPLY/ DEMAND RATIO*
CHANGE IN LISTINGS
-45.5%
-11.1%
-50.0%
% CHANGE IN PENDINGS
-100.0%

TROY,
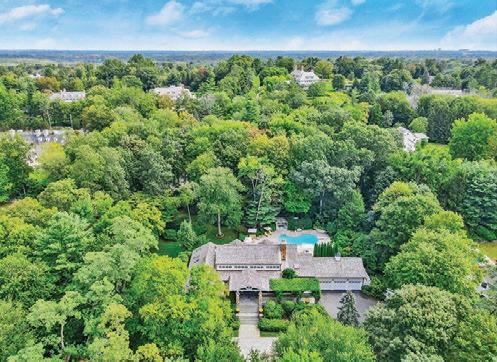
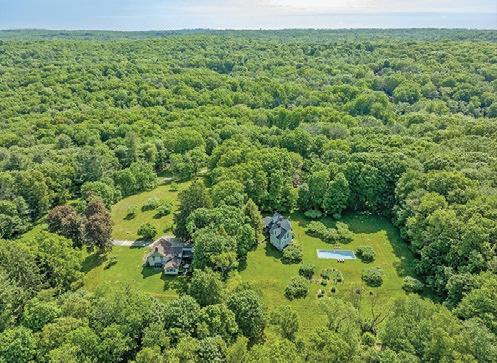
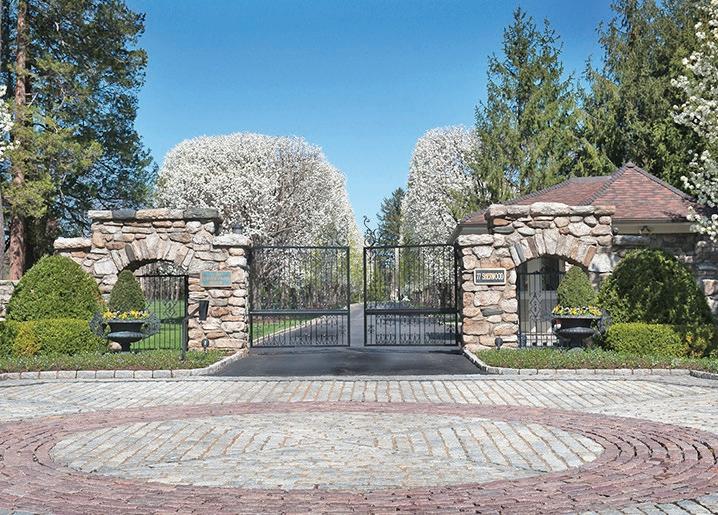
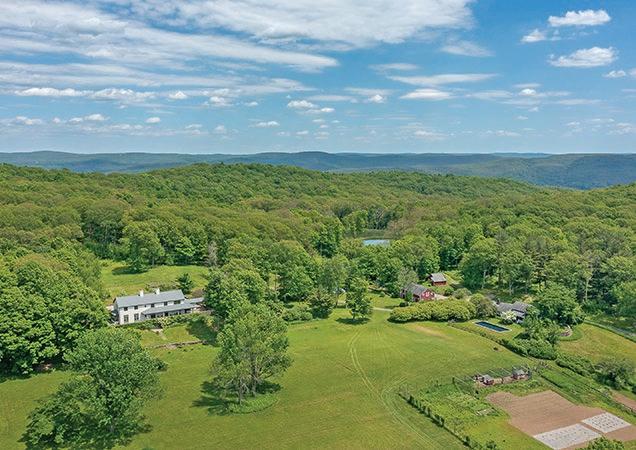
Designed expressly for our region's most exceptional properties, Houlihan Lawrence Private Brokerage offers discreet advisory and brokerage services to our valued luxury clients. Since its inception in 1990, our exclusive luxury program directed by Senior Vice President, Anthony P. Cutugno has earned a reputation for personalized boutique-style service and nuanced marketing that best serves the interests of our clientele. Known for our prudence and reliability, Houlihan Lawrence has worked with many of the area's most prominent families, charitable trusts, banks and estate trustees in facilitating the sale of the region's most prestigious properties.
Based on the private banking model, Tony is personally involved in every transaction offering invaluable insight and advice honed by decades of experience in international trade and luxury real estate.
What sets Private Brokerage apart is our ability to leverage Houlihan Lawrence's vast resources and impressive global partners to successfully position a property within the international marketplace. With a reach that extends to 6 continents, Houlihan Lawrence Private Brokerage understands the world of luxury and has cultivated relationships with international partners and high net-worth clients across the globe. These world-class connections supported by the personal oversight of Tony and his Private Brokerage team create a powerful combination that drives results year-after-year.