Market

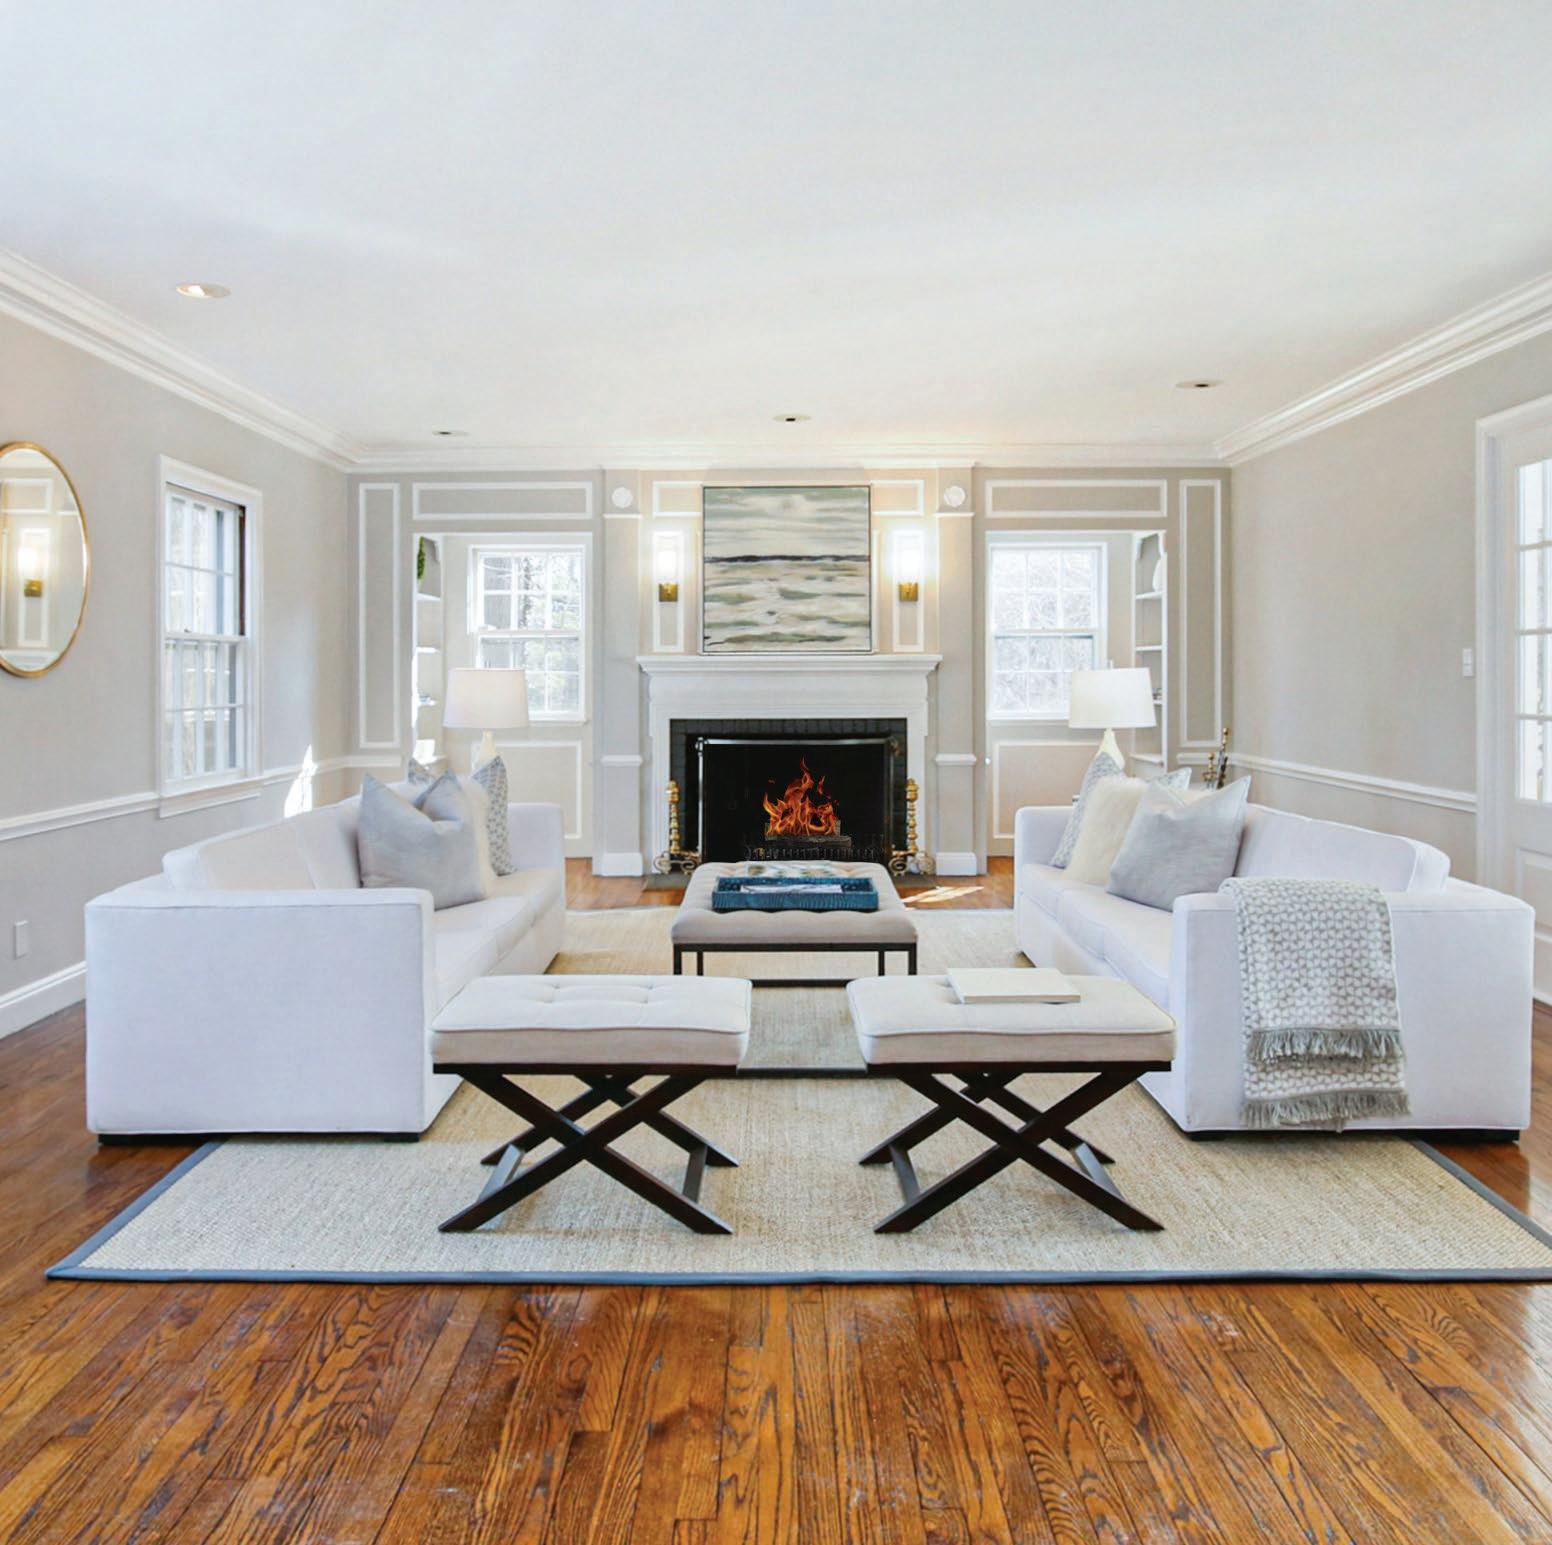
Report WESTCHESTER, PUTNAM & DUTCHESS Q3-2022
Executive Summary
Typically, the strongest selling seasons are spring and fall, when most listings come to market, and buyers can expect a more varied inventory. While the pandemic removed all seasonality for a few years due to urgency, we are seeing a return to a more normalized pace. One thing, however, remains painfully scarce - inventory.
The third quarter of 2022 saw a decline over last year in both inventory and, as a result, sales. The population of bidders is still high, maintaining a sellers’ market in most price points and areas, and the median sale price continues to increase. Although sales have inevitably declined with limited inventory, home sales in Westchester, Putnam, and Dutchess are greater than in 2019 and well over a decade prior.
Inflation, the stock market, and the Federal Reserve’s interest rate increase have cooled off some of the buyer pool as monthly mortgage payments have doubled compared to the interest rate low. Properly priced homes across most price points still see more than one bidder, and a good deal of cash buyers persists in the marketplace.
A few metrics indicate these economic conditions may be a prologue to change. Inventory in parts of Dutchess County has increased. In select Westchester and Putnam Counties areas, the very high-end price ranges have moved into a low-demand category for the first time in over two years. All other price points remain in very high demand.
Notwithstanding current economic news, it remains an excellent time to sell your home. The number of buyers far outweighs the inventory, which is the perfect formula for a seller. Autumn is one of the most spectacular times of year North of NYC, and our communities are a real draw for city dwellers looking to take a weekend escape.
With Warm Regards, Liz Nunan President and CEO
Q3-2022 MARKET REPORT
This October marks over 25 years of Houlihan Lawrence’s support of Breast Cancer Awareness Month. No matter the challenges we face, our elite team North of NYC remains STRONGER TOGETHER
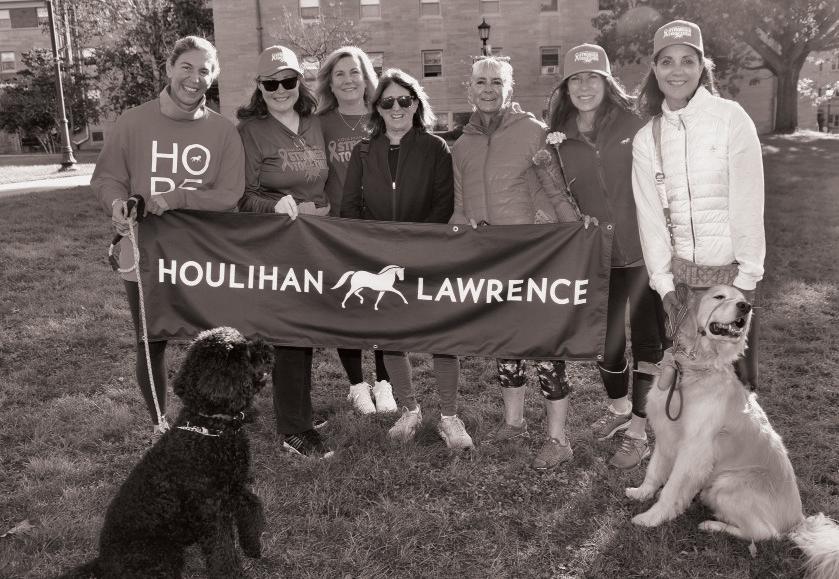
We’re passionate in our support of breast cancer walks throughout our communities. Connect with your agent, visit any Houlihan Lawrence office or type in a link from below to learn how you can help contribute.

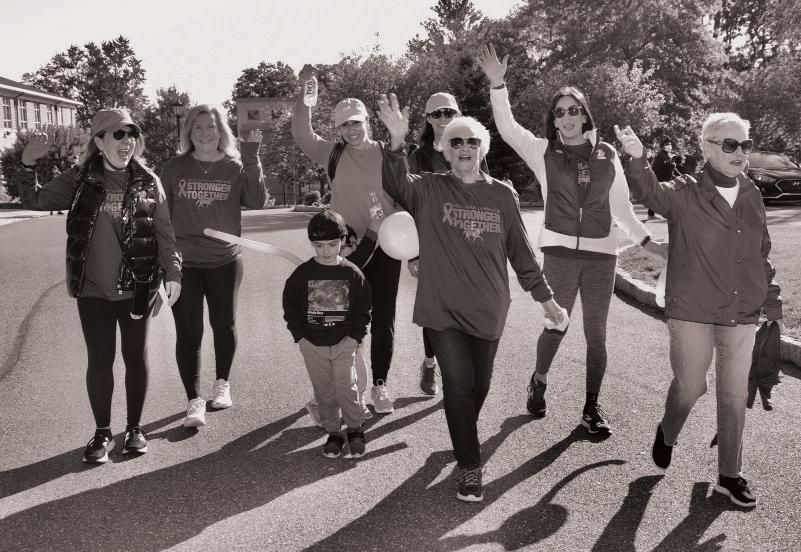
AMERICAN CANCER SOCIETY MAKING STRIDES AGAINST BREAST CANCER

Join us on October 16, 2022 Manhattanville College Purchase, NY hlre.co/makingstrides2022
MILES OF HOPE BREAST CANCER FOUNDATION WALK hlre.co/milesofhopeEF2022 hlre.co/milesofhopeLG2022 hlre.co/milesofhopeMB2022
SUPPORT CONNECTION SUPPORT-A-WALK hlre.co/supportconnection2022
WESTCHESTER COUNTY
SingleFamilyHomeOverview
NEW YORK CITY GATEWAY
MountVernon,NewRochelle,Pelham,Yonkers
LOWER WESTCHESTER
Bronxville,Eastchester,Edgemont,Scarsdale, Tuckahoe
THE RIVERTOWNS
Ardsley,BriarcliffManor,DobbsFerry,Elmsford, Hastings,Irvington,MountPleasant,Ossining, Pleasantville,PocanticoHills,Tarrytown
GREATER WHITE PLAINS
Greenburgh,Valhalla,WhitePlains
THE SOUND SHORE
BlindBrook,Harrison,Mamaroneck,Port Chester,RyeCity,RyeNeck
TABLE OF CONTENTS
NORTHERN WESTCHESTER
Bedford,ByramHills,Chappaqua,KatonahLewisboro,NorthSalem,Somers
NORTHWEST WESTCHESTER
Croton-Harmon,HendrickHudson,Lakeland, Peekskill,Yorktown
WESTCHESTER COUNTY
CondominiumOverview
WESTCHESTER COUNTY
Co-OperativeOverview
PUTNAM COUNTY
Brewster,Carmel,Garrison,Haldane,Mahopac, PutnamValley
PUTNAM COUNTY
CondominiumOverview
DUTCHESS COUNTY
SingleFamilyHomeOverview
SOUTHEAST DUTCHESS
Beekman,Dover,Pawling,UnionVale
SOUTHWEST DUTCHESS
Beacon,EastFishkill,Fishkill,LaGrange, Poughkeepsie,Poughkeepsie/City,Wappinger
NORTHEAST DUTCHESS
Amenia,NorthEast,PinePlains,Stanford, Washington
NORTHWEST DUTCHESS
Clinton,HydePark,Milan,PleasantValley,Red Hook,Rhinebeck
DUTCHESS COUNTY
CondominiumOverview
THIRD QUARTER2022
HOULIHANLAWRENCE.COM
QUARTERLY
SUPPLY DEMAND ANALYSIS
$0 - $499,999
$700,000 - $999,999
$1,500,000 - $1,999,999
$2,000,000 - $2,499,999
$2,500,000 - $2,999,999
$4,000,000 and up
-27.3% -41.2%
-10.6% -39.7%
-12.7% -13.9%
-10.3% -2.6%
-15.2% 0.0%
16.7% -28.1%
-24.2% -3.6%
-15.4% -13.6%
WESTCHESTER COUNTY SINGLE FAMILY HOMES
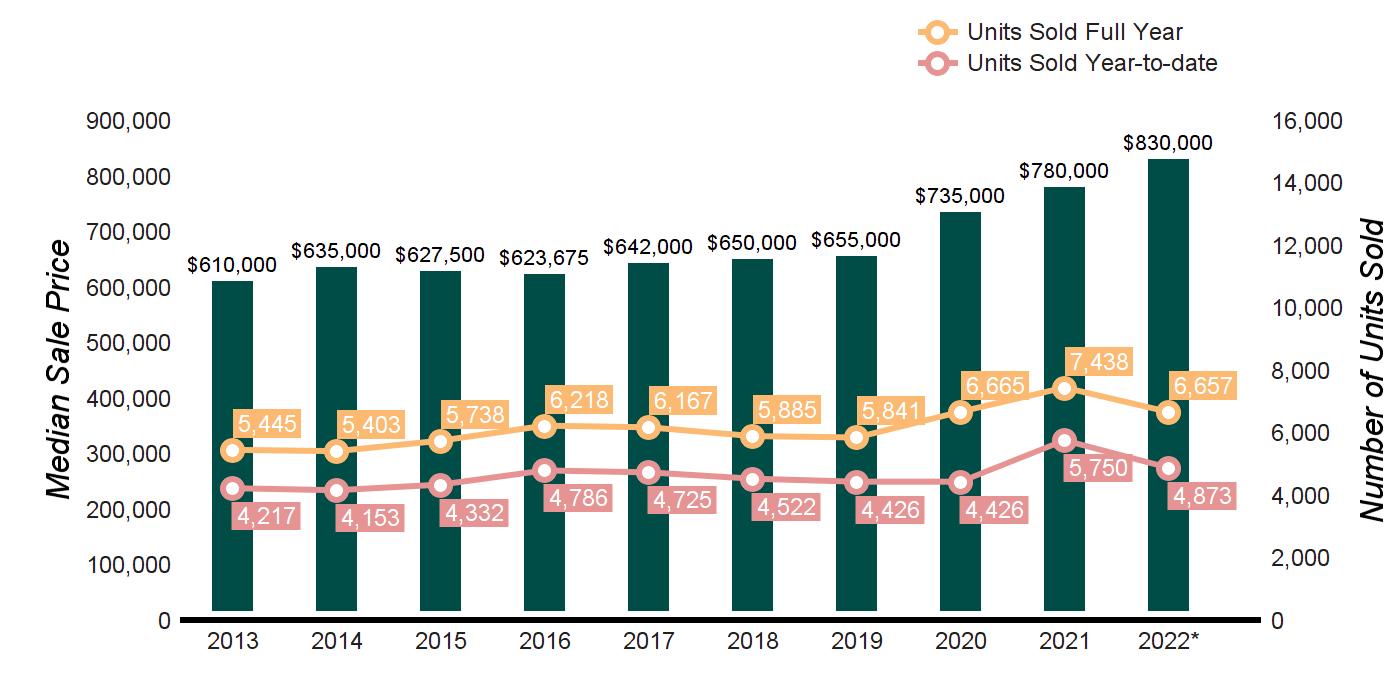
MARKET OVERVIEW Q3 2022 Q3 2021 % CHANGE YTD 2022 YTD 2021 % CHANGE HOMES SOLD 2021 2386 -15.3% 4873 5750 -15.3% AVERAGE SALE PRICE $1,197,928 $1,112,600 7.7% $1,154,515 $1,060,513 8.9% MEDIAN SALE PRICE $870,000 $855,000 1.8% $830,000 $800,000 3.8% AVERAGE PRICE PER SQUARE FOOT $430 $390 10.3% $416 $374 11.2% % SALE PRICE TO LIST PRICE 103.9 101.1 2.8% 103.3 100.1 3.2%
AS OF SEPTEMBER 30, 2022 AS OF SEPTEMBER 30, 2021 2022 vs. 2021 PRICE RANGE SUPPLY: ACTIVE LISTINGS DEMAND: PENDING SALES SUPPLY/ DEMAND RATIO* SUPPLY: ACTIVE LISTINGS DEMAND: PENDING SALES SUPPLY/ DEMAND RATIO* % CHANGE IN LISTINGS % CHANGE IN PENDINGS
117 143 1 161 243 1
$500,000 - $699,999 303 263 1 339 436 1
302 285 1 346 331 1
$1,000,000 - $1,499,999 166 147 1 185 151 1
89 66 1 105 66 2
56 23 2 48 32 2
47 27 2 62 28 2
$3,000,000 - $3,999,999 44 19 2 52 22 2
87 15 6 81 15 5 7.4% 0.0% MarketTotals 1211 988 1 1379 1324 1 -12.2% -25.4% *Supply Demand Ratio Key 1-4: High Demand 5-6: Balanced 7-9: Low Demand 10+: Very Low Demand TEN-YEAR MARKET HISTORY Average Sale Price $811,056 $861,164 $836,478 $818,945 $851,137 $856,530 $850,017 $947,353 $1,041,703 $1,154,515 Average Sale Price Average Price/SqFt $297 $308 $311 $309 $318 $320 $320 $337 $373 $416 Average Price/SqFt Days On Market 178 112 90 84 80 75 77 73 49 37 Days On Market %Sale Price to List Price 96.0 96.7 97.0 97.0 97.4 97.2 96.6 98.1 100.0 103.3 %Sale Price to List Price Source: Onekey MLS, SINGLE FAMILY HOMES * Homes sold for 2022 are annualized based on actual sales year-to-date.
NEW ROCHELLE


NEW YORK CITY GATEWAY
HOMES SOLD
SCHOOL DISTRICT
MOUNT
CLICK ON A SCHOOL DISTRICT FOR THE LATEST MONTHLY MARKET REPORT.

HOMES SOLD
VERNON
ROCHELLE PELHAM YONKERS
MEDIAN SALE PRICE
MEDIAN SALE PRICE
DISTRICT
SINGLE FAMILY HOMES
Preview all our HD Videos of Westchester, Putnam and Dutchess houlihanlawrence.com/communities
Q3 2022 Q3 2021 % CHANGE YTD 2022 YTD 2021 % CHANGE
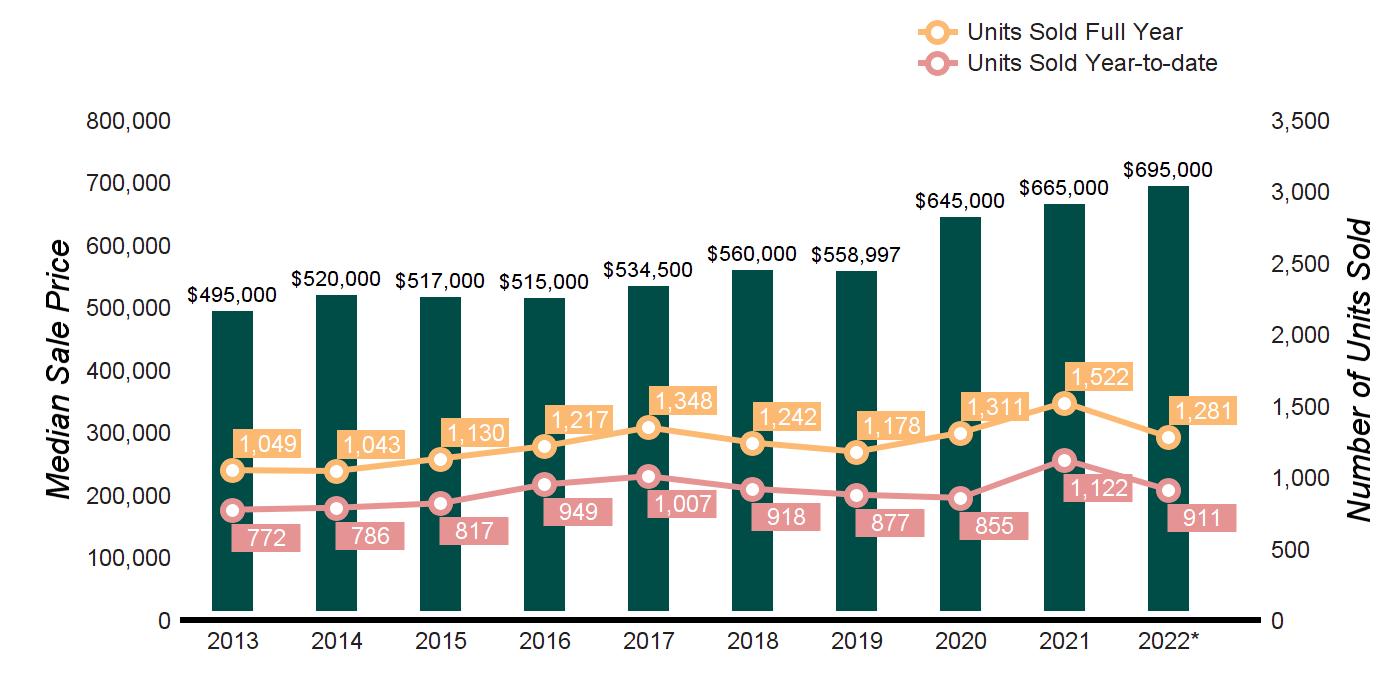
VERNON 50 36 39% 120 123 -2% NEW ROCHELLE 101 141 -28% 261 348 -25% PELHAM 39 51 -24% 95 128 -26% YONKERS 162 199 -19% 435 523 -17% NYCGateway 352 427 -18% 911 1122 -19%
MOUNT
NEW
Q 3 - 2022 VS. Q 3 - 2021 18%
Q 3 - 2022 VS. Q 3 - 2021 0%
SCHOOL
Q3 2022 Q3 2021 % CHANGE YTD 2022 YTD 2021 % CHANGE MOUNT VERNON $653,500 $585,000 12% $610,000 $579,280 5% NEW ROCHELLE $830,000 $870,000 -5% $810,000 $810,000 0% PELHAM $1,200,000 $1,225,000 -2% $1,175,000 $1,150,000 2% YONKERS $628,500 $599,000 5% $640,000 $599,000 7% NYCGateway $697,000 $700,000 0% $695,000 $670,000 4% Source: Onekey MLS, Single-family homes, Zones 7 & 8
NEW YORK
MOUNT VERNON, NEW ROCHELLE, PELHAM, YONKERS
SUPPLY DEMAND ANALYSIS
$0 - $299,999
$300,000 -$399,999
$400,000 - $499,999
$600,000 - $799,999
$800,000 - $999,999
$1,000,000 - $1,999,999
CITY GATEWAY SINGLE FAMILY HOMES
Click on a School district to obtain the latest monthly market report.
AS OF SEPTEMBER 30, 2022 AS OF SEPTEMBER 30, 2021 2022 vs. 2021 PRICE RANGE SUPPLY: ACTIVE LISTINGS DEMAND: PENDING SALES SUPPLY/ DEMAND RATIO* SUPPLY: ACTIVE LISTINGS DEMAND: PENDING SALES SUPPLY/ DEMAND RATIO* % CHANGE IN LISTINGS % CHANGE IN PENDINGS
2 2 1 2 4 1 0.0% -50.0%
7 14 1 11 20 1 -36.4% -30.0%
35 19 2 29 53 1 20.7% -64.2% $500,000 - $599,999 60 45 1 47 89 1 27.7% -49.4%
93 77 1 74 103 1 25.7% -25.2%
44 31 1 40 50 1 10.0% -38.0%
47 31 2 35 28 1 34.3% 10.7% $2,000,000 and up 12 1 12 16 4 4 -25.0% -75.0% MarketTotals 300 220 1 254 351 1 18.1% -37.3% *Supply Demand Ratio Key 1-4: High Demand 5-6: Balanced 7-9: Low Demand 10+: Very Low Demand TEN-YEAR MARKET HISTORY Average Sale Price $567,284 $596,124 $603,126 $604,355 $626,880 $643,464 $637,214 $725,426 $770,893 $817,895 Average Sale Price Average Price/SqFt $253 $261 $266 $272 $281 $297 $300 $319 $349 $382 Average Price/SqFt Days On Market 183 114 90 81 79 67 67 67 47 38 Days On Market %Sale Price to List Price 95.8 96.6 97.4 97.6 98.0 97.7 98.1 98.3 100.2 102.6 %Sale Price to List Price Source: Onekey MLS, Single-family homes, Zones 7 & 8 * Homes sold for 2022 are annualized based on actual sales year-to-date.
LOWER
HOMES SOLD
HOMES
MEDIAN SALE PRICE


WESTCHESTER SINGLE FAMILY HOMES SCARSDALE Preview all our HD Videos of Westchester, Putnam and Dutchess houlihanlawrence.com/communities
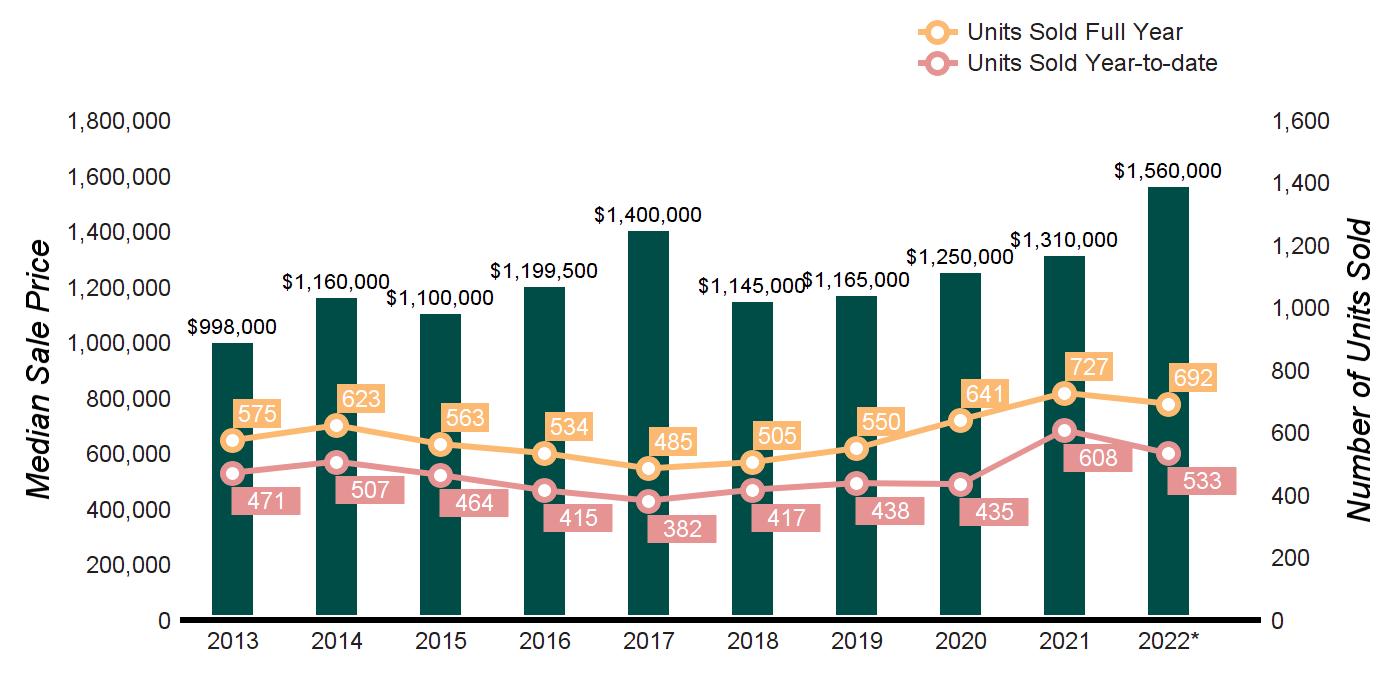
SCHOOL DISTRICT Q3 2022 Q3 2021 % CHANGE YTD 2022 YTD 2021 % CHANGE BRONXVILLE 23 28 -18% 66 57 16% EASTCHESTER 42 50 -16% 97 123 -21% EDGEMONT 50 40 25% 87 77 13% SCARSDALE 111 145 -23% 234 305 -23% TUCKAHOE 16 18 -11% 49 46 7% LowerWestchester 242 281 -14% 533 608 -12% CLICK ON A SCHOOL DISTRICT FOR THE LATEST MONTHLY MARKET REPORT. BRONXVILLE EASTCHESTER EDGEMONT SCARSDALE TUCKAHOE
SOLD Q 3 - 2022 VS. Q 3 - 2021 14% MEDIAN SALE PRICE Q 3 - 2022 VS. Q 3 - 2021 11%
SCHOOL DISTRICT Q3 2022 Q3 2021 % CHANGE YTD 2022 YTD 2021 % CHANGE BRONXVILLE $2,100,000 $2,070,000 1% $2,578,750 $2,250,000 15% EASTCHESTER $925,000 $786,750 18% $880,000 $805,000 9% EDGEMONT $1,377,500 $1,215,000 13% $1,295,000 $1,207,900 7% SCARSDALE $2,135,000 $1,825,000 17% $2,080,000 $1,800,000 16% TUCKAHOE $987,499 $999,000 -1% $879,000 $907,500 -3% LowerWestchester $1,604,000 $1,450,000 11% $1,560,000 $1,350,000 16% Source: Onekey MLS, Single-family homes, Zone 6
SINGLE FAMILY HOMES
BRONXVILLE, EASTCHESTER, EDGEMONT, SCARSDALE, TUCKAHOE
SUPPLY DEMAND ANALYSIS
SEPTEMBER
SEPTEMBER
$0 - $499,999
$500,000 - $699,999
$700,000 - $999,999
$1,000,000 - $1,499,999
$1,500,000 - $1,999,999
$2,000,000 - $2,499,999
$2,500,000 - $2,999,999
$3,000,000 - $3,999,999
$4,000,000 and up
-64.3%
LOWER WESTCHESTER
Click on a School district to obtain the latest monthly market report.
AS OF
30, 2022 AS OF
30, 2021 2022 vs. 2021 PRICE RANGE SUPPLY: ACTIVE LISTINGS DEMAND: PENDING SALES SUPPLY/ DEMAND RATIO* SUPPLY: ACTIVE LISTINGS DEMAND: PENDING SALES SUPPLY/ DEMAND RATIO* % CHANGE IN LISTINGS % CHANGE IN PENDINGS
0 0 Not Valid 2 1 2 -100.0% -100.0%
5 5 1 1 14 1 400.0%
26 25 1 40 30 1 -35.0% -16.7%
20 12 2 23 26 1 -13.0% -53.8%
17 11 2 11 13 1 54.5% -15.4%
7 5 1 11 5 2 -36.4% 0.0%
13 10 1 17 2 9 -23.5% 400.0%
10 11 1 12 9 1 -16.7% 22.2%
18 5 4 18 3 6 0.0% 66.7% MarketTotals 116 84 1 135 103 1 -14.1% -18.4% *Supply Demand Ratio Key 1-4: High Demand 5-6: Balanced 7-9: Low Demand 10+: Very Low Demand TEN-YEAR MARKET HISTORY Average Sale Price $1,263,156 $1,388,882 $1,406,473 $1,463,106 $1,632,159 $1,416,955 $1,399,705 $1,514,451 $1,632,770 $1,841,381 Average Sale Price Average Price/SqFt $413 $443 $451 $442 $454 $439 $422 $435 $477 $540 Average Price/SqFt Days On Market 168 88 72 80 86 75 85 83 47 36 Days On Market %Sale Price to List Price 96.3 97.7 97.6 96.4 96.7 96.1 95.7 97.2 99.7 103.2 %Sale Price to List Price Source: Onekey MLS, Single-family homes, Zone 6 * Homes sold for 2022 are annualized based on actual sales year-to-date.
THE RIVERTOWNS
THE RIVERTOWNS
HOMES SOLD
SCHOOL DISTRICT
ARDSLEY
CLICK ON A SCHOOL DISTRICT FOR THE LATEST MONTHLY MARKET REPORT.


ARDSLEY
FERRY ELMSFORD HASTINGS IRVINGTON MOUNT PLEASANT OSSINING
MANOR
HOMES SOLD
POCANTICO HILLS TARRYTOWN
MEDIAN SALE PRICE
SCHOOL DISTRICT
ARDSLEY
BRIARCLIFF MANOR
DOBBS FERRY $950,000
MEDIAN SALE PRICE
$777,037
$925,000
$852,500 $825,000
$601,500 $585,000 3% HASTINGS $965,000 $1,125,000
ELMSFORD $637,500 $602,500
IRVINGTON $1,366,000 $1,059,500
MOUNT PLEASANT $712,950 $677,000
OSSINING $645,000 $558,250
PLEASANTVILLE $830,000 $729,000
POCANTICO HILLS $1,029,500 $732,500
TARRYTOWN $875,000 $890,000
TheRivertowns $820,000 $767,500
$952,500 $885,000
$1,276,000 $1,062,500
$667,000 $679,000 -2%
$605,500 $557,500
$824,000 $712,500
$1,029,500 $848,500
$875,000 $890,000 -2%
$760,000 $735,000
SINGLE FAMILY HOMES
Preview all our HD Videos of Westchester, Putnam and Dutchess houlihanlawrence.com/communities
Q3 2022 Q3 2021 % CHANGE YTD 2022 YTD 2021 % CHANGE
37 38 -3% 96 106 -9% BRIARCLIFF MANOR 21 31 -32% 49 69 -29% DOBBS FERRY 30 32 -6% 63 72 -13% ELMSFORD 26 28 -7% 68 68 0% HASTINGS 25 25 0% 56 63 -11% IRVINGTON 25 30 -17% 59 77 -23% MOUNT PLEASANT 32 38 -16% 80 85 -6% OSSINING 52 78 -33% 132 190 -31% PLEASANTVILLE 33 31 7% 76 66 15% POCANTICO HILLS 6 2 200% 14 7 100% TARRYTOWN 25 23 9% 50 53 -6% TheRivertowns 312 356 -12% 743 856 -13%
BRIARCLIFF
DOBBS
PLEASANTVILLE
Q 3 - 2022 VS. Q 3 - 2021 12%
Q 3 - 2022 VS. Q 3 - 2021 7%
Q3 2022 Q3 2021 % CHANGE YTD 2022 YTD 2021 % CHANGE
$825,000 $785,000 5% $762,000
-2%
$1,085,000 $940,000 15% $1,110,000
20%
$1,015,000 -6%
3%
6%
-14%
8%
29%
20%
5%
16%
9%
14%
16%
41%
21%
-2%
7%
3% Source: Onekey MLS, Single-family homes, Zone 3
THE RIVERTOWNS
SINGLE FAMILY HOMES
ARDSLEY, BRIARCLIFF MANOR, DOBBS FERRY, ELMSFORD, HASTINGS, IRVINGTON, MOUNT PLEASANT
PLEASANTVILLE, POCANTICO HILLS, TARRYTOWN
SUPPLY DEMAND ANALYSIS
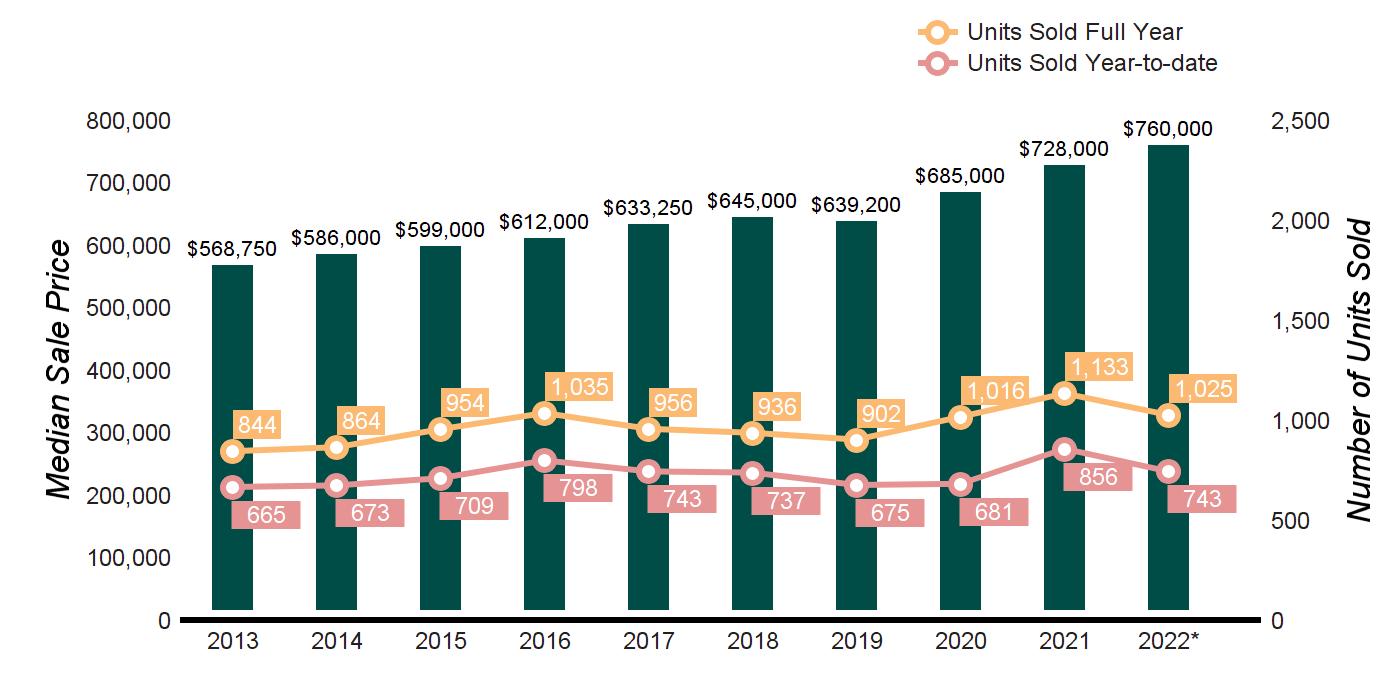
$0 - $299,999
$500,000 - $599,999
$600,000 - $799,999
OSSINING,
Click on a School district to obtain the latest monthly market report.
AS OF SEPTEMBER 30, 2022 AS OF SEPTEMBER 30, 2021 2022 vs. 2021 PRICE RANGE SUPPLY: ACTIVE LISTINGS DEMAND: PENDING SALES SUPPLY/ DEMAND RATIO* SUPPLY: ACTIVE LISTINGS DEMAND: PENDING SALES SUPPLY/ DEMAND RATIO* % CHANGE IN LISTINGS % CHANGE IN PENDINGS
0 2 0 2 3 1 -100.0% -33.3% $300,000 -$399,999 6 3 2 8 8 1 -25.0% -62.5% $400,000 - $499,999 7 12 1 16 22 1 -56.3% -45.5%
23 14 2 41 36 1 -43.9% -61.1%
58 38 2 68 70 1 -14.7% -45.7% $800,000 - $999,999 32 28 1 40 29 1 -20.0% -3.4% $1,000,000 - $1,999,999 37 45 1 55 24 2 -32.7% 87.5% $2,000,000 and up 16 3 5 14 4 4 14.3% -25.0% MarketTotals 179 145 1 244 196 1 -26.6% -26.0% *Supply Demand Ratio Key 1-4: High Demand 5-6: Balanced 7-9: Low Demand 10+: Very Low Demand TEN-YEAR MARKET HISTORY Average Sale Price $664,832 $689,728 $692,908 $705,636 $740,572 $765,251 $732,079 $768,144 $839,444 $900,302 Average Sale Price Average Price/SqFt $285 $294 $304 $308 $321 $323 $318 $326 $355 $392 Average Price/SqFt Days On Market 179 117 88 81 72 67 75 73 50 38 Days On Market %Sale Price to List Price 97.5 98.2 97.6 98.7 98.9 100.3 97.6 98.5 100.1 104.1 %Sale Price to List Price Source: Onekey MLS, Single-family homes, Zone 3 * Homes sold for 2022 are annualized based on actual sales year-to-date.
HOMES
MEDIAN SALE PRICE


GREATER WHITE PLAINS SINGLE FAMILY HOMES WHITE PLAINS Preview all our HD Videos of Westchester, Putnam and Dutchess houlihanlawrence.com/communities
SOLD SCHOOL DISTRICT Q3 2022 Q3 2021 % CHANGE YTD 2022 YTD 2021 % CHANGE GREENBURGH 63 52 21% 156 131 19% VALHALLA 18 28 -36% 57 62 -8% WHITE PLAINS 88 95 -7% 201 223 -10% GreaterWhitePlains 169 175 -3% 414 416 -1% CLICK ON A SCHOOL DISTRICT FOR THE LATEST MONTHLY MARKET REPORT. GREENBURGH VALHALLA WHITE PLAINS HOMES SOLD Q 3 - 2022 VS. Q 3 - 2021 3% MEDIAN SALE PRICE Q 3 - 2022 VS. Q 3 - 2021 6%
SCHOOL DISTRICT Q3 2022 Q3 2021 % CHANGE YTD 2022 YTD 2021 % CHANGE GREENBURGH $719,000 $644,500 12% $671,250 $630,000 7% VALHALLA $686,000 $649,950 6% $680,000 $650,000 5% WHITE PLAINS $806,500 $775,000 4% $800,000 $745,000 7% GreaterWhitePlains $740,000 $699,000 6% $720,000 $680,000 6% Source: Onekey MLS, Single-family homes, Zone 4
GREENBURGH, VALHALLA, WHITE PLAINS
SUPPLY DEMAND ANALYSIS
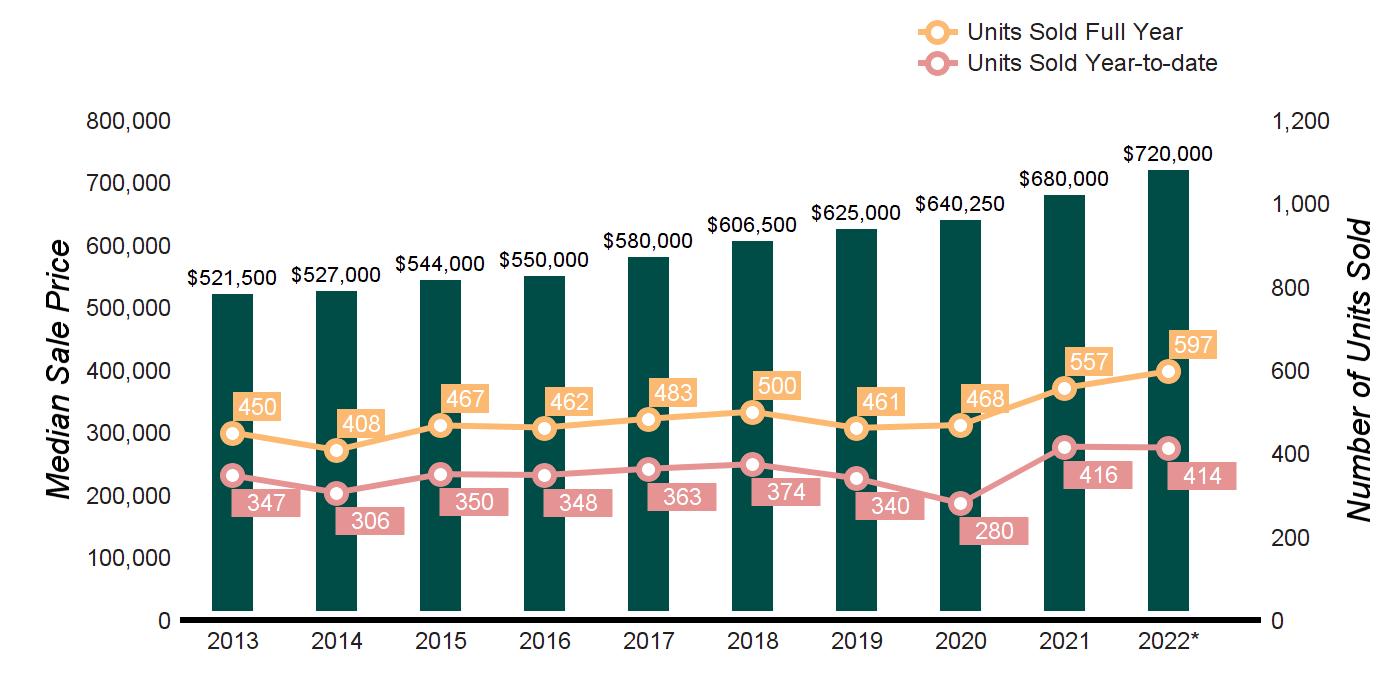
SINGLE FAMILY HOMES
$0 - $299,999
$300,000 -$399,999
$400,000 - $499,999
$500,000 - $599,999
$600,000 - $799,999
$800,000 - $999,999
$1,000,000 - $1,999,999
GREATER WHITE PLAINS
Click on a School district to obtain the latest monthly market report.
AS OF SEPTEMBER 30, 2022 AS OF SEPTEMBER 30, 2021 2022 vs. 2021 PRICE RANGE SUPPLY: ACTIVE LISTINGS DEMAND: PENDING SALES SUPPLY/ DEMAND RATIO* SUPPLY: ACTIVE LISTINGS DEMAND: PENDING SALES SUPPLY/ DEMAND RATIO* % CHANGE IN LISTINGS % CHANGE IN PENDINGS
0 0 Not Valid 0 1 0 0.0% -100.0%
0 3 0 1 4 1 -100.0% -25.0%
4 9 1 3 14 1 33.3% -35.7%
9 19 1 21 30 1 -57.1% -36.7%
28 40 1 29 38 1 -3.4% 5.3%
14 12 1 22 18 1 -36.4% -33.3%
8 11 1 18 6 3 -55.6% 83.3% $2,000,000 and up 4 0 Not Valid 0 0 Not Valid 0.0% 0.0% MarketTotals 67 94 1 94 111 1 -28.7% -15.3% *Supply Demand Ratio Key 1-4: High Demand 5-6: Balanced 7-9: Low Demand 10+: Very Low Demand TEN-YEAR MARKET HISTORY Average Sale Price $555,397 $594,770 $606,510 $593,753 $624,937 $650,930 $649,190 $692,816 $732,108 $786,738 Average Sale Price Average Price/SqFt $264 $272 $284 $290 $300 $305 $308 $323 $351 $383 Average Price/SqFt Days On Market 175 105 79 80 64 63 71 59 43 32 Days On Market %Sale Price to List Price 96.8 97.2 97.6 97.6 98.4 98.4 97.8 98.7 100.7 104.1 %Sale Price to List Price Source: Onekey MLS, Single-family homes, Zone 4 * Homes sold for 2022 are annualized based on actual sales year-to-date.
THE SOUND
HOMES SOLD
BROOK
MEDIAN SALE PRICE

HOMES

SHORE SINGLE FAMILY HOMES THE SOUND SHORE Preview all our HD Videos of Westchester, Putnam and Dutchess houlihanlawrence.com/communities
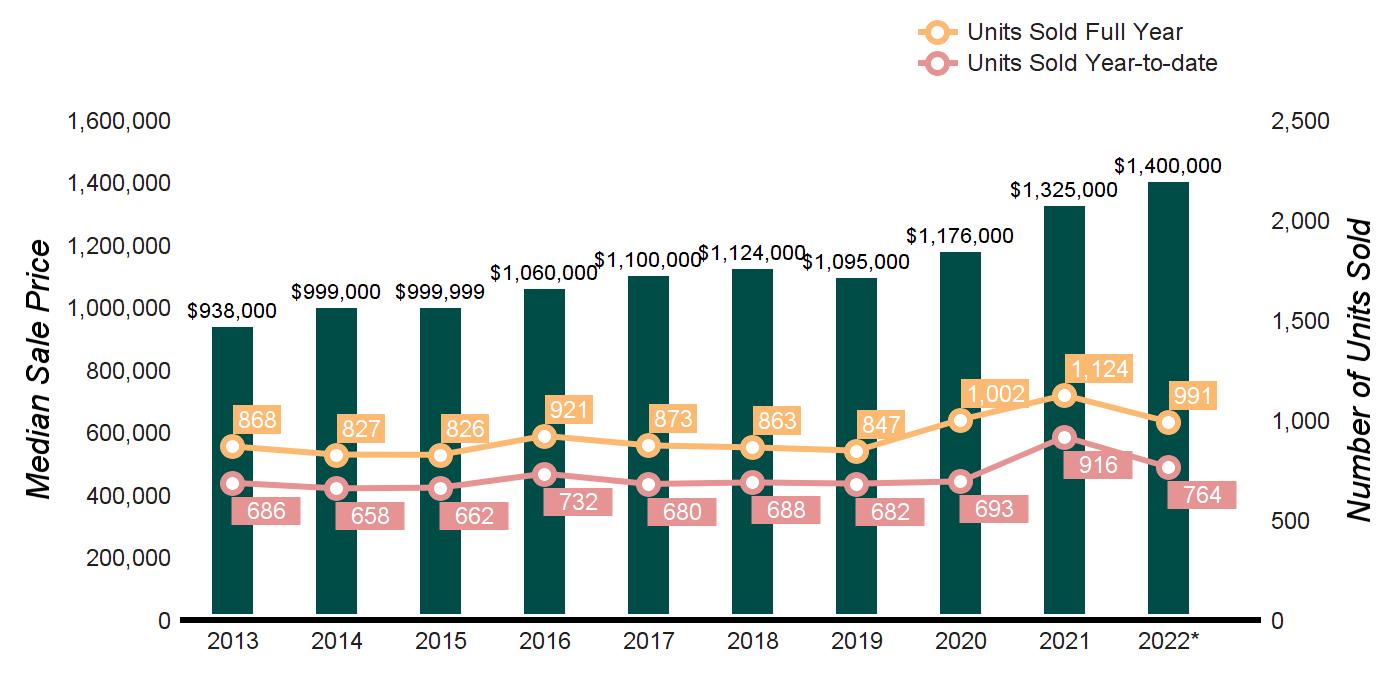
SCHOOL DISTRICT Q3 2022 Q3 2021 % CHANGE YTD 2022 YTD 2021 % CHANGE BLIND BROOK 36 46 -22% 105 119 -12% HARRISON 62 71 -13% 142 172 -17% MAMARONECK 101 137 -26% 224 290 -23% PORT CHESTER 19 35 -46% 82 92 -11% RYE CITY 60 68 -12% 142 168 -16% RYE NECK 34 32 6% 69 75 -8% TheSoundShore 312 389 -20% 764 916 -17% CLICK ON A SCHOOL DISTRICT FOR THE LATEST MONTHLY MARKET REPORT. BLIND
HARRISON MAMARONECK PORT CHESTER RYE CITY RYE NECK
SOLD Q 3 - 2022 VS. Q 3 - 2021 20% MEDIAN SALE PRICE Q 3 - 2022 VS. Q 3 - 2021 8%
SCHOOL DISTRICT Q3 2022 Q3 2021 % CHANGE YTD 2022 YTD 2021 % CHANGE BLIND BROOK $1,080,000 $1,087,000 -1% $1,068,000 $1,025,000 4% HARRISON $1,887,500 $1,479,850 28% $1,785,000 $1,482,425 20% MAMARONECK $1,575,000 $1,535,500 3% $1,497,500 $1,493,174 0% PORT CHESTER $650,000 $645,000 1% $650,000 $594,000 9% RYE CITY $2,355,950 $2,012,500 17% $2,267,500 $1,981,250 14% RYE NECK $1,177,500 $903,000 30% $1,150,000 $955,000 20% TheSoundShore $1,535,859 $1,425,000 8% $1,400,000 $1,350,000 4% Source: Onekey MLS, Single-family homes, Zone 5
THE SOUND SHORE
FAMILY HOMES
BLIND BROOK, HARRISON, MAMARONECK, PORT CHESTER, RYE CITY, RYE NECK
SUPPLY DEMAND ANALYSIS
SEPTEMBER
$0 - $499,999
$500,000 - $699,999
$700,000 - $999,999
$1,000,000 - $1,499,999
$1,500,000 - $1,999,999
$2,000,000 - $2,499,999
$2,500,000 - $2,999,999
$3,000,000 - $3,999,999
SINGLE
Click on a School district to obtain the latest monthly market report.
AS OF SEPTEMBER 30, 2022 AS OF
30, 2021 2022 vs. 2021 PRICE RANGE SUPPLY: ACTIVE LISTINGS DEMAND: PENDING SALES SUPPLY/ DEMAND RATIO* SUPPLY: ACTIVE LISTINGS DEMAND: PENDING SALES SUPPLY/ DEMAND RATIO* % CHANGE IN LISTINGS % CHANGE IN PENDINGS
2 14 1 5 10 1 -60.0% 40.0%
26 18 1 27 27 1 -3.7% -33.3%
26 33 1 32 32 1 -18.8% 3.1%
37 20 2 30 35 1 23.3% -42.9%
14 24 1 24 20 1 -41.7% 20.0%
22 9 2 11 9 1 100.0% 0.0%
10 7 1 13 14 1 -23.1% -50.0%
17 6 3 17 6 3 0.0% 0.0% $4,000,000 and up 20 8 3 23 6 4 -13.0% 33.3% MarketTotals 174 139 1 182 159 1 -4.4% -12.6% *Supply Demand Ratio Key 1-4: High Demand 5-6: Balanced 7-9: Low Demand 10+: Very Low Demand TEN-YEAR MARKET HISTORY Average Sale Price $1,271,109 $1,298,331 $1,367,114 $1,320,302 $1,353,465 $1,404,302 $1,355,790 $1,472,468 $1,592,056 $1,739,766 Average Sale Price Average Price/SqFt $406 $418 $434 $431 $436 $429 $422 $447 $484 $527 Average Price/SqFt Days On Market 165 99 83 74 75 78 81 66 52 38 Days On Market %Sale Price to List Price 96.1 96.9 96.4 96.7 97.1 95.7 95.9 97.8 100.2 104.3 %Sale Price to List Price Source: Onekey MLS, Single-family homes, Zone 5 * Homes sold for 2022 are annualized based on actual sales year-to-date.
BEDFORD
NORTHERN
HOMES SOLD
SCHOOL DISTRICT
BEDFORD
SCHOOL
HOMES
HILLS

SALEM
MEDIAN SALE PRICE
SCHOOL DISTRICT
BYRAM HILLS

WESTCHESTER SINGLE FAMILY HOMES
Preview all our HD Videos of Westchester, Putnam and Dutchess houlihanlawrence.com/communities
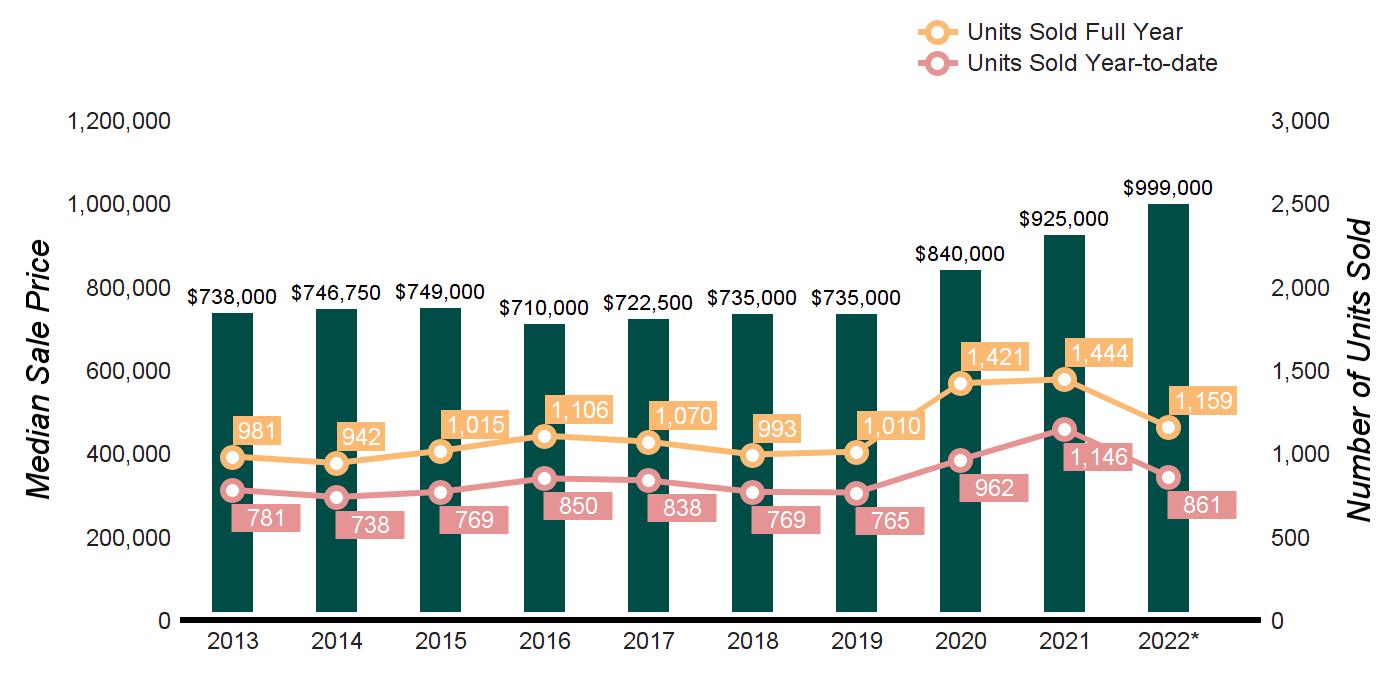
Q3 2022 Q3 2021 % CHANGE YTD 2022 YTD 2021 % CHANGE BEDFORD 76 98 -22% 206 254 -19% BYRAM HILLS 59 87 -32% 129 170 -24% CHAPPAQUA 80 113 -29% 172 242 -29% KATONAH LEWISBORO 66 93 -29% 172 229 -25% NORTH SALEM 17 24 -29% 45 65 -31% SOMERS 59 67 -12% 137 186 -26% NorthernWestchester 357 482 -26% 861 1146 -25% CLICK ON A
DISTRICT FOR THE LATEST MONTHLY MARKET REPORT.
BYRAM
CHAPPAQUA KATONAH-LEWISBORO NORTH
SOMERS
SOLD Q 3 - 2022 VS. Q 3 - 2021 26% MEDIAN SALE PRICE Q 3 - 2022 VS. Q 3 - 2021 11%
Q3 2022 Q3 2021 % CHANGE YTD 2022 YTD 2021 % CHANGE BEDFORD $1,125,000 $913,250 23% $1,030,012 $903,000 14%
$1,500,000 $1,395,000 8% $1,500,000 $1,303,750 15% CHAPPAQUA $1,373,500 $1,175,000 17% $1,331,500 $1,105,000 21% KATONAH LEWISBORO $977,500 $910,000 7% $892,500 $897,000 -1% NORTH SALEM $625,000 $810,000 -23% $625,000 $750,000 -17% SOMERS $700,000 $725,000 -3% $695,000 $670,000 4% NorthernWestchester $1,100,000 $987,000 11% $999,000 $930,000 7% Source: Onekey MLS, Single-family homes, Zone 2
NORTHERN
SINGLE FAMILY HOMES
BEDFORD, BYRAM HILLS, CHAPPAQUA, KATONAH-LEWISBORO, NORTH SALEM, SOMERS
SUPPLY DEMAND ANALYSIS
AS OF SEPTEMBER
OF SEPTEMBER
$0 - $499,999
$500,000 - $699,999
$700,000 - $999,999
$1,000,000 - $1,499,999
$1,500,000 - $1,999,999
$2,000,000 - $2,499,999
$2,500,000 - $2,999,999
$3,000,000 - $3,999,999
$4,000,000 and up
-51.9% -26.1%
-37.0%
-14.5%
-13.0%
-10.7%
-41.7%
-20.0%
-66.7%
-60.0%
WESTCHESTER
Click on a School district to obtain the latest monthly market report.
30, 2022 AS
30, 2021 2022 vs. 2021 PRICE RANGE SUPPLY: ACTIVE LISTINGS DEMAND: PENDING SALES SUPPLY/ DEMAND RATIO* SUPPLY: ACTIVE LISTINGS DEMAND: PENDING SALES SUPPLY/ DEMAND RATIO* % CHANGE IN LISTINGS % CHANGE IN PENDINGS
13 17 1 27 23 1
39 29 1 53 46 1 -26.4%
44 53 1 65 62 1 -32.3%
41 40 1 50 46 1 -18.0%
25 12 2 28 12 2
0.0%
16 7 2 18 12 2 -11.1%
18 8 2 21 10 2 -14.3%
10 2 5 20 6 3 -50.0%
38 2 19 30 5 6 26.7%
MarketTotals 244 170 1 312 222 1 -21.8% -23.4% *Supply Demand Ratio Key 1-4: High Demand 5-6: Balanced 7-9: Low Demand 10+: Very Low Demand TEN-YEAR MARKET HISTORY Average Sale Price $929,282 $1,020,339 $901,858 $868,326 $910,250 $893,432 $897,777 $984,186 $1,176,596 $1,349,956 Average Sale Price Average Price/SqFt $278 $284 $284 $277 $284 $277 $280 $292 $340 $391 Average Price/SqFt Days On Market 189 131 105 101 100 96 91 90 55 40 Days On Market %Sale Price to List Price 94.7 94.8 96.1 95.8 96.0 96.0 94.8 98.1 99.1 102.4 %Sale Price to List Price Source: Onekey MLS, Single-family homes, Zone 2 * Homes sold for 2022 are annualized based on actual sales year-to-date.
NORTHWEST
HOMES SOLD
MEDIAN SALE PRICE


HUDSON

HOMES
WESTCHESTER SINGLE FAMILY HOMES YORKTOWN Preview all our HD Videos of Westchester, Putnam and Dutchess houlihanlawrence.com/communities
SCHOOL DISTRICT Q3 2022 Q3 2021 % CHANGE YTD 2022 YTD 2021 % CHANGE CROTON HARMON 29 33 -12% 79 89 -11% HENDRICK HUDSON 47 43 9% 112 121 -7% LAKELAND 100 112 -11% 228 255 -11% PEEKSKILL 37 26 42% 89 69 29% YORKTOWN 63 60 5% 135 139 -3% NorthwestWestchester 276 274 1% 643 673 -5% CLICK ON A SCHOOL DISTRICT FOR THE LATEST MONTHLY MARKET REPORT. CROTON–HARMON HENDRICK
LAKELAND PEEKSKILL YORKTOWN
SOLD Q 3 - 2022 VS. Q 3 - 2021 1% MEDIAN SALE PRICE Q 3 - 2022 VS. Q 3 - 2021 6%
SCHOOL DISTRICT Q3 2022 Q3 2021 % CHANGE YTD 2022 YTD 2021 % CHANGE CROTON HARMON $815,000 $710,000 15% $815,000 $731,000 12% HENDRICK HUDSON $630,000 $550,000 15% $595,000 $553,000 8% LAKELAND $534,500 $510,000 5% $527,000 $488,000 8% PEEKSKILL $490,000 $463,250 6% $485,000 $425,000 14% YORKTOWN $661,000 $618,000 7% $650,000 $593,000 10% NorthwestWestchester $582,500 $549,500 6% $575,000 $533,000 8% Source: Onekey MLS, Single-family homes, Zone 1
CROTON–HARMON, HENDRICK HUDSON, LAKELAND, PEEKSKILL, YORKTOWN
SUPPLY DEMAND ANALYSIS
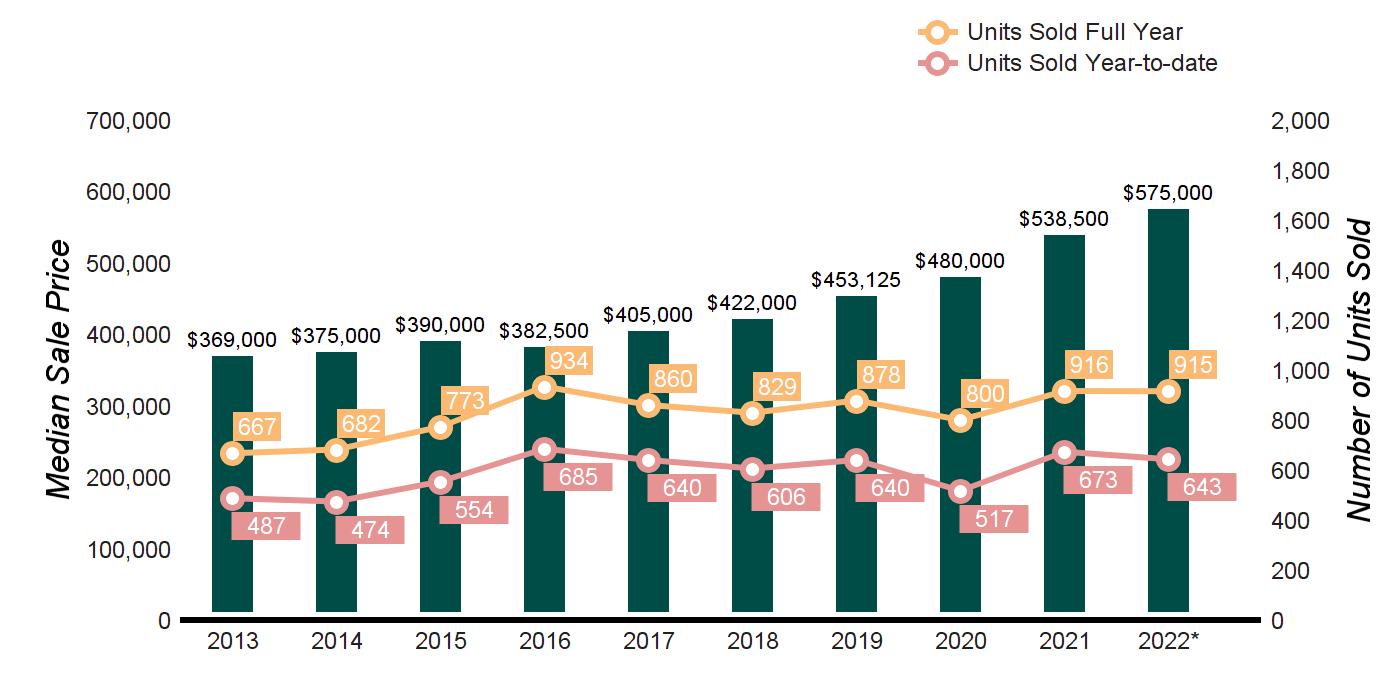
$0 - $299,999
$300,000 -$399,999
$800,000 - $999,999
$1,000,000 - $1,999,999
TEN-YEAR
NORTHWEST WESTCHESTER SINGLE FAMILY HOMES
Click on a School district to obtain the latest monthly market report.
AS OF SEPTEMBER 30, 2022 AS OF SEPTEMBER 30, 2021 2022 vs. 2021 PRICE RANGE SUPPLY: ACTIVE LISTINGS DEMAND: PENDING SALES SUPPLY/ DEMAND RATIO* SUPPLY: ACTIVE LISTINGS DEMAND: PENDING SALES SUPPLY/ DEMAND RATIO* % CHANGE IN LISTINGS % CHANGE IN PENDINGS
5 3 2 7 4 2 -28.6% -25.0%
8 12 1 18 24 1 -55.6% -50.0% $400,000 - $499,999 28 33 1 30 49 1 -6.7% -32.7% $500,000 - $599,999 19 39 1 29 41 1 -34.5% -4.9% $600,000 - $799,999 31 29 1 38 38 1 -18.4% -23.7%
27 11 2 17 14 1 58.8% -21.4%
9 7 1 16 7 2 -43.8% 0.0% $2,000,000 and up 3 0 Not Valid 2 2 1 50.0% -100.0% MarketTotals 130 134 1 157 179 1 -17.2% -25.1% *Supply Demand Ratio Key 1-4: High Demand 5-6: Balanced 7-9: Low Demand 10+: Very Low Demand
MARKET HISTORY Average Sale Price $398,011 $421,695 $431,339 $419,440 $441,752 $456,746 $483,257 $514,427 $581,831 $639,568 Average Sale Price Average Price/SqFt $194 $202 $208 $210 $221 $229 $240 $256 $286 $308 Average Price/SqFt Days On Market 183 118 99 89 77 72 71 63 46 35 Days On Market %Sale Price to List Price 96.5 96.2 97.7 98.2 98.8 98.9 98.6 99.3 101.3 102.3 %Sale Price to List Price Source: Onekey MLS, Single-family homes, Zone 1 * Homes sold for 2022 are annualized based on actual sales year-to-date.
QUARTERLY MARKET OVERVIEW
SUPPLY
PRICE RANGE
$0 - $299,999
$300,000 -$399,999
$500,000 - $599,999
$600,000 - $799,999
$800,000 - $999,999
$1,000,000 - $1,999,999
ANALYSIS
-40.3% -49.1%
-51.5% -35.6%
-26.4% -35.5%
-33.3% -45.0%
-37.2% -15.2%
-57.1% -45.0%
-31.6% -49.4%
12.5% -90.0%
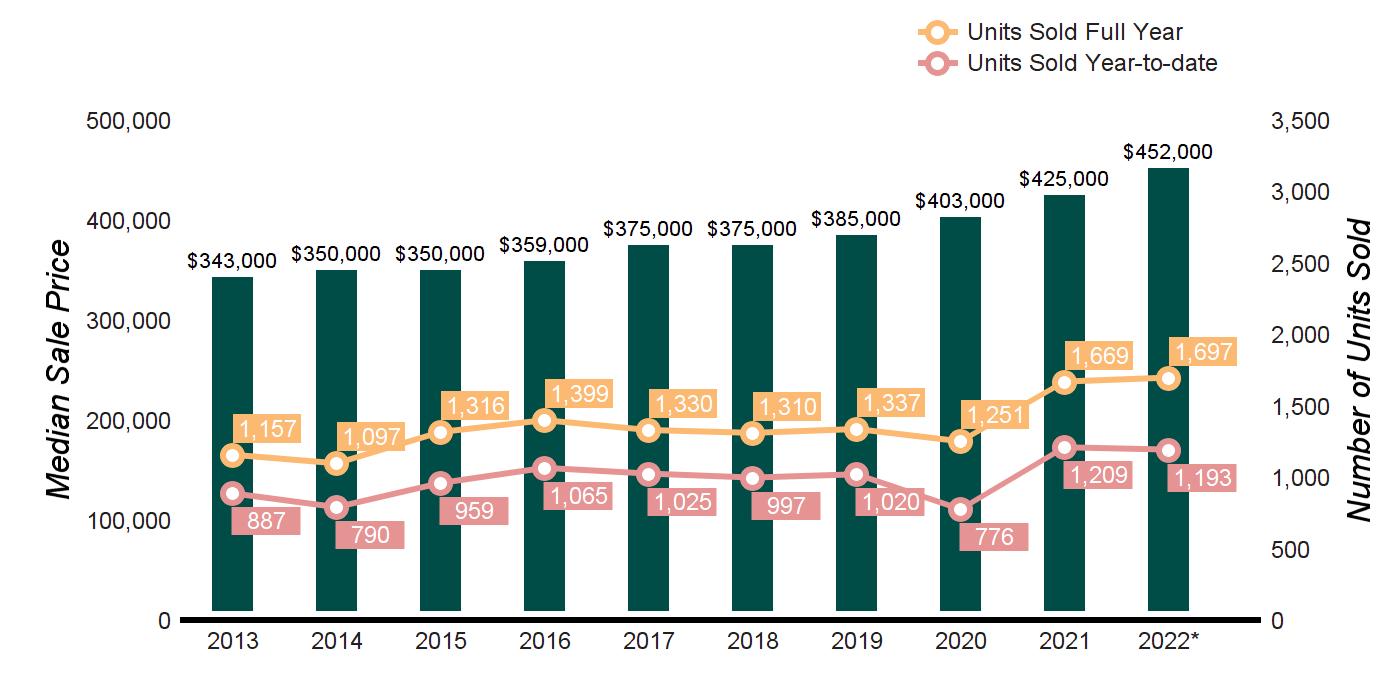
WESTCHESTER COUNTY CONDOMINIUMS
Q3 2022 Q3 2021 % CHANGE YTD 2022 YTD 2021 % CHANGE UNITS SOLD 373 492 -24.2% 1193 1209 -1.3% AVERAGE SALE PRICE $546,068 $593,396 -8.0% $570,981 $520,358 9.7% MEDIAN SALE PRICE $460,000 $470,000 -2.1% $452,000 $420,000 7.6% AVERAGE PRICE PER SQUARE FOOT $390 $397 -1.8% $404 $366 10.4% AVERAGE DAYS ON MARKET 45 51 -11.8% 53 57 -7.0% % SALE PRICE TO LIST PRICE 100.8 99.1 1.7% 100.3 99.1 1.2%
DEMAND
AS OF SEPTEMBER 30, 2022 AS OF SEPTEMBER 30, 2021 2022 vs. 2021
SUPPLY: ACTIVE LISTINGS DEMAND: PENDING SALES SUPPLY/ DEMAND RATIO* SUPPLY: ACTIVE LISTINGS DEMAND: PENDING SALES SUPPLY/ DEMAND RATIO* % CHANGE IN LISTINGS % CHANGE IN PENDINGS
43 29 1 72 57 1
47 58 1 97 90 1
$400,000 - $499,999 53 40 1 72 62 1
26 22 1 39 40 1
27 28 1 43 33 1
9 11 1 21 20 1
26 40 1 38 79 1
$2,000,000 and up 18 2 9 16 20 1
MarketTotals 249 230 1 398 401 1 -37.4% -42.6% *Supply Demand Ratio Key 1-4: High Demand 5-6: Balanced 7-9: Low Demand 10+: Very Low Demand TEN-YEAR MARKET HISTORY Average Sale Price $397,179 $423,000 $428,530 $422,642 $443,353 $442,707 $458,771 $482,135 $550,760 $570,981 Average Sale Price Average Price/SqFt $276 $288 $300 $309 $314 $324 $336 $342 $383 $404 Average Price/SqFt Days On Market 168 105 85 78 68 67 69 67 58 53 Days On Market %Sale Price to List Price 96.4 96.8 97.3 97.4 97.8 97.8 97.5 97.8 99.3 100.3 %Sale Price to List Price Source: Onekey MLS, Condominiums * Homes sold for 2022 are annualized based on actual sales year-to-date.
QUARTERLY MARKET OVERVIEW

SUPPLY
$0 - $299,999
$300,000 -$399,999
$500,000 - $599,999
$600,000 - $799,999
$800,000 - $999,999
$1,000,000 - $1,999,999
-23.0%
-28.6%
WESTCHESTER COUNTY CO-OPERATIVES
Q3 2022 Q3 2021 % CHANGE YTD 2022 YTD 2021 % CHANGE UNITS SOLD 576 573 0.5% 1684 1590 5.9% AVERAGE SALE PRICE $239,695 $228,320 5.0% $232,592 $222,285 4.6% MEDIAN SALE PRICE $205,000 $200,000 2.5% $198,000 $195,000 1.5% AVERAGE PRICE PER SQUARE FOOT $242 $233 3.9% $237 $229 3.5% AVERAGE DAYS ON MARKET 68 69 -1.4% 72 71 1.4% % SALE PRICE TO LIST PRICE 98.8 97.8 1.0% 98.6 97.8 0.8%
DEMAND ANALYSIS AS OF SEPTEMBER 30, 2022 AS OF SEPTEMBER 30, 2021 2022 vs. 2021 PRICE RANGE SUPPLY: ACTIVE LISTINGS DEMAND: PENDING SALES SUPPLY/ DEMAND RATIO* SUPPLY: ACTIVE LISTINGS DEMAND: PENDING SALES SUPPLY/ DEMAND RATIO* % CHANGE IN LISTINGS % CHANGE IN PENDINGS
543 432 1 685 553 1 -20.7% -21.9%
60 47 1 77 61 1 -22.1%
$400,000 - $499,999 17 20 1 28 9 3 -39.3% 122.2%
5 5 1 8 7 1 -37.5%
13 2 7 12 2 6 8.3% 0.0%
1 4 1 9 2 5 -88.9% 100.0%
4 1 4 0 3 0 0.0% -66.7% $2,000,000 and up 0 0 Not Valid 0 0 Not Valid 0.0% 0.0% MarketTotals 643 511 1 819 637 1 -21.5% -19.8% *Supply Demand Ratio Key 1-4: High Demand 5-6: Balanced 7-9: Low Demand 10+: Very Low Demand TEN-YEAR MARKET HISTORY Average Sale Price $188,081 $179,697 $179,406 $185,854 $187,907 $198,839 $204,571 $219,766 $222,698 $232,592 Average Sale Price Average Price/SqFt $181 $174 $179 $188 $193 $204 $214 $225 $228 $237 Average Price/SqFt Days On Market 219 151 115 94 85 77 68 66 72 72 Days On Market %Sale Price to List Price 94.8 95.5 96.1 96.8 97.5 97.9 98.0 97.7 97.9 98.6 %Sale Price to List Price Source: Onekey MLS, Co-Operatives * Homes sold for 2022 are annualized based on actual sales year-to-date.
PUTNAM COUNTY

HOMES SOLD
SCHOOL DISTRICT
BREWSTER
CLICK ON A SCHOOL DISTRICT FOR THE LATEST MONTHLY MARKET REPORT.

BREWSTER
MEDIAN SALE PRICE
SCHOOL DISTRICT
HOMES SOLD
SINGLE FAMILY HOMES BREWSTER-MAHOPAC Preview all our HD Videos of Westchester, Putnam and Dutchess houlihanlawrence.com/communities
Q3 2022 Q3 2021 % CHANGE YTD 2022 YTD 2021 % CHANGE
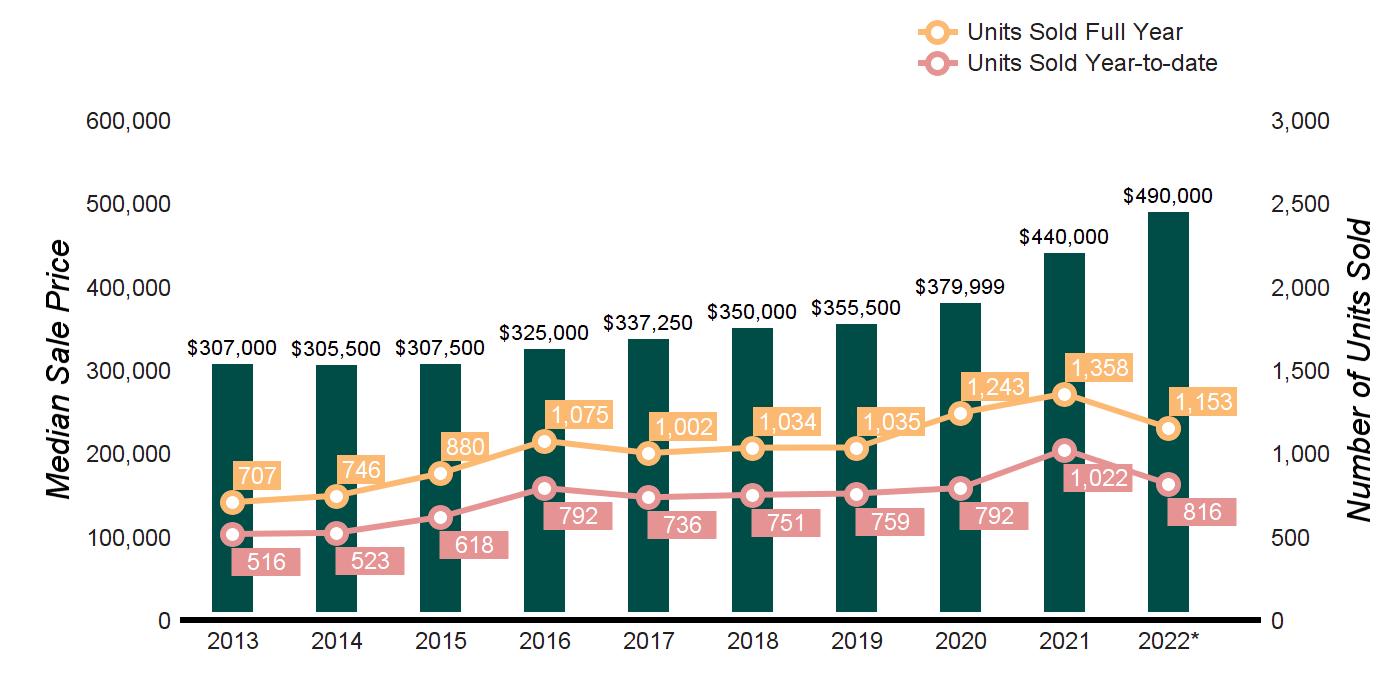
68 67 2% 172 199 -14% CARMEL 90 93 -3% 252 284 -11% GARRISON 12 15 -20% 27 34 -21% HALDANE 10 13 -23% 39 43 -9% LAKELAND 14 22 -36% 34 53 -36% MAHOPAC 90 92 -2% 212 269 -21% PUTNAM VALLEY 38 54 -30% 80 140 -43% Putnamcounty 322 356 -10% 816 1022 -20%
CARMEL GARRISON HALDANE LAKELAND MAHOPAC PUTNAM VALLEY
Q 3 - 2022 VS. Q 3 - 2021 10% MEDIAN SALE PRICE Q 3 - 2022 VS. Q 3 - 2021 8%
Q3 2022 Q3 2021 % CHANGE YTD 2022 YTD 2021 % CHANGE BREWSTER $468,050 $440,000 6% $437,500 $400,000 9% CARMEL $406,000 $385,000 6% $425,000 $364,500 17% GARRISON $853,700 $975,000 -12% $690,000 $975,000 -29% HALDANE $637,500 $585,000 9% $870,000 $585,000 49% LAKELAND $529,000 $515,000 3% $525,000 $440,000 19% MAHOPAC $552,000 $542,500 2% $540,000 $500,000 8% PUTNAM VALLEY $469,950 $402,500 17% $455,000 $396,250 15% Putnamcounty $504,500 $469,000 8% $490,000 $435,000 13% Source: Onekey MLS, Single-family homes, Zone 9
BREWSTER, CARMEL, GARRISON, HALDANE, LAKELAND, MAHOPAC, PUTNAM VALLEY
SUPPLY DEMAND ANALYSIS
$0 - $299,999
$300,000 -$399,999
$600,000 - $799,999
$800,000 - $999,999
$1,000,000 - $1,999,999
PUTNAM COUNTY SINGLE FAMILY HOMES
Click on a School district to obtain the latest monthly market report.
AS OF SEPTEMBER 30, 2022 AS OF SEPTEMBER 30, 2021 2022 vs. 2021 PRICE RANGE SUPPLY: ACTIVE LISTINGS DEMAND: PENDING SALES SUPPLY/ DEMAND RATIO* SUPPLY: ACTIVE LISTINGS DEMAND: PENDING SALES SUPPLY/ DEMAND RATIO* % CHANGE IN LISTINGS % CHANGE IN PENDINGS
29 21 1 39 38 1 -25.6% -44.7%
40 49 1 51 69 1 -21.6% -29.0% $400,000 - $499,999 47 39 1 53 76 1 -11.3% -48.7% $500,000 - $599,999 39 29 1 37 31 1 5.4% -6.5%
44 46 1 60 50 1 -26.7% -8.0%
23 16 1 26 10 3 -11.5% 60.0%
16 7 2 20 6 3 -20.0% 16.7% $2,000,000 and up 8 1 8 14 2 7 -42.9% -50.0% MarketTotals 246 208 1 300 282 1 -18.0% -26.2% *Supply Demand Ratio Key 1-4: High Demand 5-6: Balanced 7-9: Low Demand 10+: Very Low Demand TEN-YEAR MARKET HISTORY Average Sale Price $358,266 $362,883 $354,312 $358,374 $367,059 $390,203 $381,140 $433,668 $498,629 $549,016 Average Sale Price Average Price/SqFt $173 $175 $174 $176 $183 $195 $197 $210 $246 $267 Average Price/SqFt Days On Market 219 151 129 116 103 90 77 79 58 47 Days On Market %Sale Price to List Price 94.7 94.9 95.8 96.5 96.8 97.4 97.5 97.6 99.9 100.7 %Sale Price to List Price Source: Onekey MLS, Single-family homes, Zone 9 * Homes sold for 2022 are annualized based on actual sales year-to-date.
QUARTERLY MARKET OVERVIEW

AVERAGE
SUPPLY DEMAND ANALYSIS
PRICE RANGE
$0 - $299,999
$300,000 -$399,999
$400,000 - $499,999
$500,000 - $599,999
$600,000 - $799,999
$800,000 - $999,999
$1,000,000 - $1,999,999
$2,000,000 and up
-33.3% -28.6%
-36.4%
-100.0%
-100.0% -100.0%
-66.7%
-100.0%
PUTNAM COUNTY CONDOMINIUMS
Q3 2022 Q3 2021 % CHANGE YTD 2022 YTD 2021 % CHANGE UNITS SOLD 50 64 -21.9% 136 158 -13.9%
SALE PRICE $338,566 $317,412 6.7% $318,808 $287,699 10.8% MEDIAN SALE PRICE $324,900 $299,950 8.3% $295,000 $282,950 4.3% AVERAGE PRICE PER SQUARE FOOT $256 $216 18.5% $243 $214 13.6% AVERAGE DAYS ON MARKET 38 32 18.8% 42 49 -14.3% % SALE PRICE TO LIST PRICE 101.9 99.5 2.4% 100.8 99.6 1.2%
AS OF SEPTEMBER 30, 2022 AS OF SEPTEMBER 30, 2021 2022 vs. 2021
SUPPLY: ACTIVE LISTINGS DEMAND: PENDING SALES SUPPLY/ DEMAND RATIO* SUPPLY: ACTIVE LISTINGS DEMAND: PENDING SALES SUPPLY/ DEMAND RATIO* % CHANGE IN LISTINGS % CHANGE IN PENDINGS
6 10 1 9 14 1
12 14 1 10 22 1 20.0%
0 0 Not Valid 2 3 1 -100.0%
0 0 Not Valid 1 1 1
1 1 1 0 3 0 0.0%
0 0 Not Valid 0 0 Not Valid 0.0% 0.0%
0 0 Not Valid 0 1 0 0.0%
0 0 Not Valid 0 0 Not Valid 0.0% 0.0% MarketTotals 19 25 1 22 44 1 -13.6% -43.2% *Supply Demand Ratio Key 1-4: High Demand 5-6: Balanced 7-9: Low Demand 10+: Very Low Demand TEN-YEAR MARKET HISTORY Average Sale Price $229,906 $254,240 $279,172 $246,529 $241,929 $276,336 $253,968 $262,118 $296,474 $318,808 Average Sale Price Average Price/SqFt $158 $163 $176 $166 $168 $194 $187 $203 $215 $243 Average Price/SqFt Days On Market 249 137 117 115 83 76 64 82 46 42 Days On Market %Sale Price to List Price 95.8 95.8 97.0 97.4 96.9 98.4 98.1 97.9 99.7 100.8 %Sale Price to List Price Source: Onekey MLS, Condominiums * Homes sold for 2022 are annualized based on actual sales year-to-date.
QUARTERLY
SUPPLY DEMAND ANALYSIS
DUTCHESS
$0 - $299,999
$400,000 - $499,999
$600,000 - $799,999
$800,000 - $999,999
$1,000,000 - $1,999,999
-17.1% -43.8%
-14.1% -49.5%
-42.6%
-27.9%
25.6% -13.6%
16.1% -44.8%
7.7% -29.4%
-20.7% 80.0%
COUNTY SINGLE FAMILY HOMES
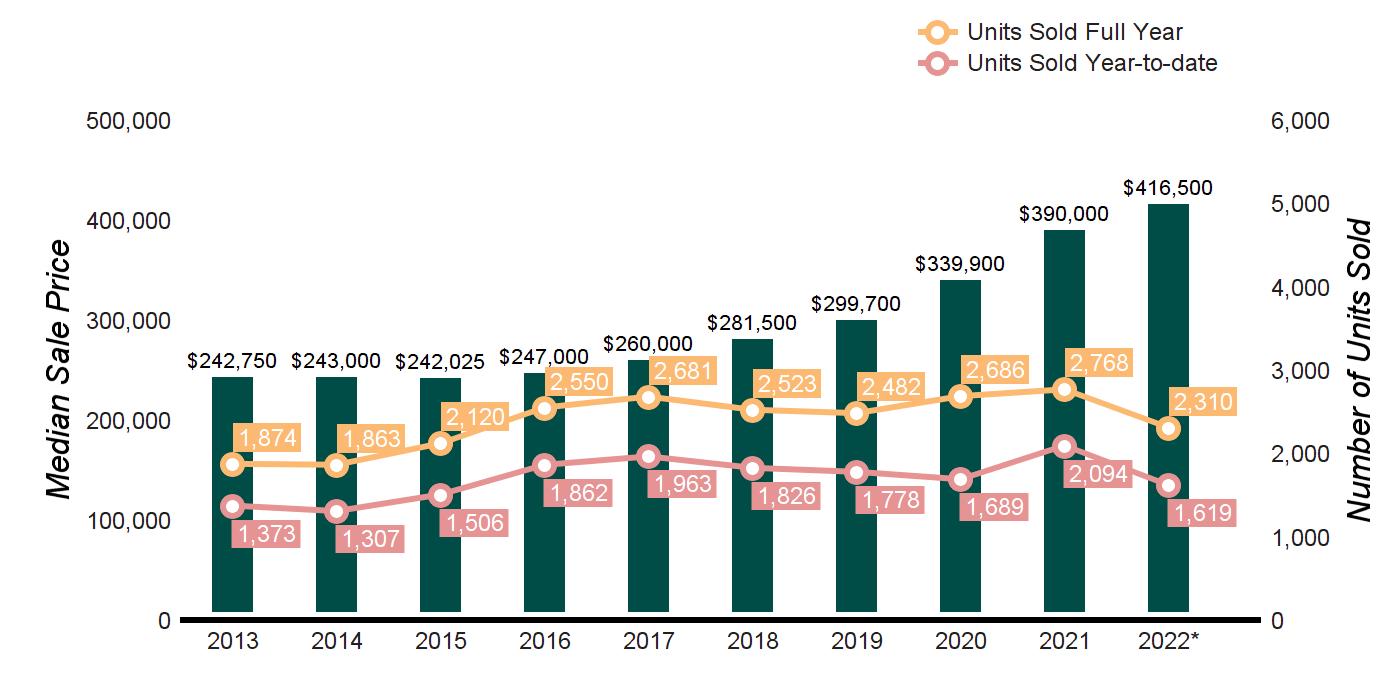
MARKET OVERVIEW Q3 2022 Q3 2021 % CHANGE YTD 2022 YTD 2021 % CHANGE HOMES SOLD 592 776 -23.7% 1619 2094 -22.7% AVERAGE SALE PRICE $540,552 $483,910 11.7% $521,159 $473,628 10.0% MEDIAN SALE PRICE $428,500 $405,447 5.7% $416,500 $389,000 7.1% AVERAGE PRICE PER SQUARE FOOT $239 $221 8.1% $254 $353 -28.0% % SALE PRICE TO LIST PRICE 98.6 101.1 -2.5% 99.5 99.6 -0.1%
AS OF SEPTEMBER 30, 2022 AS OF SEPTEMBER 30, 2021 2022 vs. 2021 PRICE RANGE SUPPLY: ACTIVE LISTINGS DEMAND: PENDING SALES SUPPLY/ DEMAND RATIO* SUPPLY: ACTIVE LISTINGS DEMAND: PENDING SALES SUPPLY/ DEMAND RATIO* % CHANGE IN LISTINGS % CHANGE IN PENDINGS
102 77 1 123 137 1
$300,000 -$399,999 146 106 1 170 210 1
122 74 2 109 129 1 11.9%
$500,000 - $599,999 77 49 2 51 68 1 51.0%
108 38 3 86 44 2
36 16 2 31 29 1
56 12 5 52 17 3
$2,000,000 and up 23 9 3 29 5 6
MarketTotals 670 381 2 651 639 1 2.9% -40.4% *Supply Demand Ratio Key 1-4: High Demand 5-6: Balanced 7-9: Low Demand 10+: Very Low Demand TEN-YEAR MARKET HISTORY Average Sale Price $296,375 $287,420 $282,862 $286,860 $298,238 $331,954 $334,166 $419,851 $474,640 $521,159 Average Sale Price Average Price/SqFt $137 $133 $133 $135 $146 $156 $164 $189 $216 $237 Average Price/SqFt Days On Market 180 171 171 173 156 149 141 139 129 110 Days On Market %Sale Price to List Price 94.3 93.7 94.9 96.1 96.8 97.2 97.0 98.6 99.9 99.5 %Sale Price to List Price Source: Mid-Hudson Multiple Listing Service, Residential-detached homes. * Homes sold for 2022 are annualized based on actual sales year-to-date.
POUGHKEEPSIE AREA

SOUTHWEST DUTCHESS

HOMES SOLD
TOWN/CITY
CLICK TO OBTAIN A SPECIFIC TOWN/CITY MONTHLY MARKET REPORT.

FISHKILL
HOMES SOLD
CITY
AVERAGE SALE PRICE
AVERAGE SALE PRICE
TOWN/CITY
SINGLE FAMILY HOMES
Preview all our HD Videos of Westchester, Putnam and Dutchess houlihanlawrence.com/communities
Q3 2022 Q3 2021 % CHANGE YTD 2022 YTD 2021 % CHANGE BEACON 27 28 -4% 72 98 -27% EAST FISHKILL 62 94 -34% 167 236 -29% FISHKILL 28 33 -15% 85 90 -6% LA GRANGE 54 64 -16% 123 165 -26% POUGHKEEPSIE TWP 101 134 -25% 277 346 -20% POUGHKEEPSIE CITY 30 39 -23% 93 115 -19% WAPPINGER 47 55 -15% 97 155 -37% SouthwestDutchess 349 447 -22% 914 1205 -24%
BEACON EAST
FISHKILL LA GRANGE POUGHKEEPSIE TWP POUGHKEEPSIE
WAPPINGER
Q 3 - 2022 VS. Q 3 - 2021 22%
Q 3 - 2022 VS. Q 3 - 2021 6%
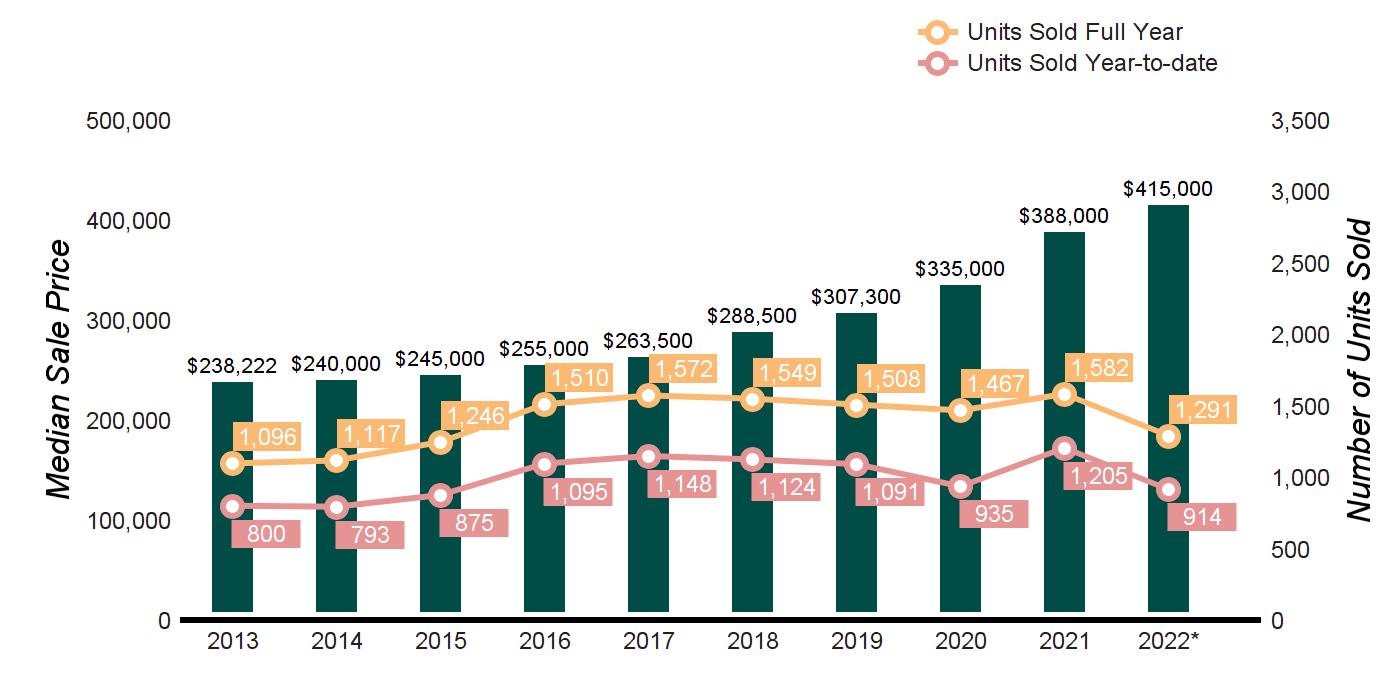
Q3 2022 Q3 2021 % CHANGE YTD 2022 YTD 2021 % CHANGE BEACON $599,000 $429,500 40% $542,500 $411,000 32% EAST FISHKILL $522,450 $494,500 6% $501,000 $459,000 9% FISHKILL $500,000 $425,000 18% $459,000 $414,375 11% LA GRANGE $464,500 $429,500 8% $440,000 $400,000 10% POUGHKEEPSIE TWP $380,000 $355,000 7% $367,900 $350,000 5% POUGHKEEPSIE CITY $357,500 $315,000 14% $343,000 $270,000 27% WAPPINGER $430,000 $393,000 9% $427,500 $390,000 10% SouthwestDutchess $425,000 $400,000 6% $415,000 $385,000 8% Source: Mid-Hudson Multiple Listing Service reports the Average Sale Price.
BEACON, EAST FISHKILL, FISHKILL,
SUPPLY DEMAND ANALYSIS
GRANGE, POUGHKEEPSIE TWP, POUGHKEEPSIE CITY, WAPPINGER
$0 - $299,999
$800,000 - $999,999
SOUTHWEST DUTCHESS SINGLE FAMILY HOMES
LA
Click to obtain a specific town/city monthly market report.
AS OF SEPTEMBER 30, 2022 AS OF SEPTEMBER 30, 2021 2022 vs. 2021 PRICE RANGE SUPPLY: ACTIVE LISTINGS DEMAND: PENDING SALES SUPPLY/ DEMAND RATIO* SUPPLY: ACTIVE LISTINGS DEMAND: PENDING SALES SUPPLY/ DEMAND RATIO* % CHANGE IN LISTINGS % CHANGE IN PENDINGS
51 44 1 60 77 1 -15.0% -42.9% $300,000 -$399,999 89 67 1 100 141 1 -11.0% -52.5% $400,000 - $499,999 65 46 1 62 91 1 4.8% -49.5% $500,000 - $599,999 38 27 1 28 33 1 35.7% -18.2% $600,000 - $799,999 58 22 3 46 24 2 26.1% -8.3%
20 10 2 14 11 1 42.9% -9.1% $1,000,000 - $1,999,999 13 1 13 16 1 16 -18.8% 0.0% $2,000,000 and up 3 2 2 0 1 0 0.0% 100.0% MarketTotals 337 219 2 326 379 1 3.4% -42.2% *Supply Demand Ratio Key 1-4: High Demand 5-6: Balanced 7-9: Low Demand 10+: Very Low Demand TEN-YEAR MARKET HISTORY Average Sale Price $265,446 $264,321 $264,243 $275,742 $282,042 $314,304 $323,063 $361,418 $411,024 $450,679 Average Sale Price Average Price/SqFt $130 $126 $128 $133 $141 $152 $163 $178 $203 $225 Average Price/SqFt Days On Market 178 165 164 170 154 144 138 130 125 104 Days On Market %Sale Price to List Price 96.3 96.1 96.5 97.7 98.0 98.9 98.3 99.3 100.9 100.9 %Sale Price to List Price Source: Mid-Hudson Multiple Listing Service, Residential-detached homes. * Homes sold for 2022 are annualized based on actual sales year-to-date.
SOUTHEAST

HOMES SOLD
SOLD

AVERAGE SALE PRICE
DUTCHESS SINGLE FAMILY HOMES DUTCHESS COUNTY Preview all our HD Videos of Westchester, Putnam and Dutchess houlihanlawrence.com/communities
TOWN/CITY Q3 2022 Q3 2021 % CHANGE YTD 2022 YTD 2021 % CHANGE BEEKMAN 32 33 -3% 74 89 -17% DOVER 14 16 -13% 38 30 27% PAWLING 9 18 -50% 32 40 -20% UNION VALE 12 20 -40% 37 40 -8% SoutheastDutchess 67 87 -23% 181 199 -9% CLICK TO OBTAIN A SPECIFIC TOWN/CITY MONTHLY MARKET REPORT. BEEKMAN DOVER PAWLING UNION VALE HOMES
Q 3 - 2022 VS. Q 3 - 2021 23% AVERAGE SALE PRICE Q 3 - 2022 VS. Q 3 - 2021 5%
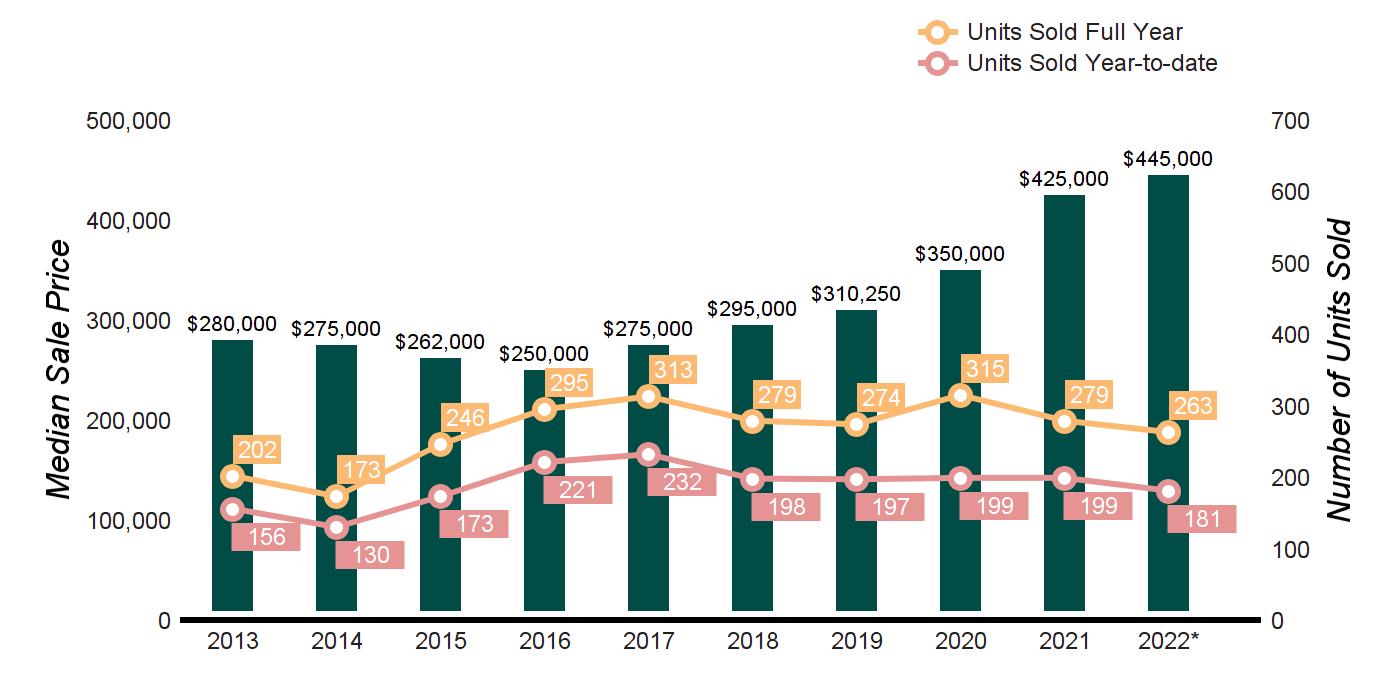
TOWN/CITY Q3 2022 Q3 2021 % CHANGE YTD 2022 YTD 2021 % CHANGE BEEKMAN $452,500 $465,000 -3% $436,000 $450,000 -3% DOVER $325,000 $314,000 4% $331,000 $295,000 12% PAWLING $540,000 $578,000 -7% $542,500 $442,500 23% UNION VALE $480,000 $440,000 9% $485,000 $452,500 7% SoutheastDutchess $420,000 $440,000 -5% $445,000 $426,111 4% Source: Mid-Hudson Multiple Listing Service reports the Average Sale Price.
BEEKMAN, DOVER, PAWLING, UNION VALE
SUPPLY DEMAND ANALYSIS
SINGLE FAMILY HOMES
$0 - $299,999
$300,000 -$399,999
$400,000 - $499,999
$600,000 - $799,999
$800,000 - $999,999
$1,000,000 - $1,999,999
SOUTHEAST DUTCHESS
Click to obtain a specific town/city monthly market report.
AS OF SEPTEMBER 30, 2022 AS OF SEPTEMBER 30, 2021 2022 vs. 2021 PRICE RANGE SUPPLY: ACTIVE LISTINGS DEMAND: PENDING SALES SUPPLY/ DEMAND RATIO* SUPPLY: ACTIVE LISTINGS DEMAND: PENDING SALES SUPPLY/ DEMAND RATIO* % CHANGE IN LISTINGS % CHANGE IN PENDINGS
9 6 2 15 8 2 -40.0% -25.0%
7 6 1 23 15 2 -69.6% -60.0%
9 10 1 12 15 1 -25.0% -33.3% $500,000 - $599,999 12 10 1 10 17 1 20.0% -41.2%
15 6 3 17 4 4 -11.8% 50.0%
2 0 Not Valid 2 5 1 0.0% -100.0%
9 3 3 4 1 4 125.0% 200.0% $2,000,000 and up 1 1 1 7 0 Not Valid -85.7% 0.0% MarketTotals 64 42 2 90 65 1 -28.9% -35.4% *Supply Demand Ratio Key 1-4: High Demand 5-6: Balanced 7-9: Low Demand 10+: Very Low Demand TEN-YEAR MARKET HISTORY Average Sale Price $327,164 $300,413 $303,007 $290,055 $307,284 $310,391 $334,548 $390,608 $501,923 $495,552 Average Sale Price Average Price/SqFt $143 $131 $134 $130 $134 $157 $155 $178 $212 $216 Average Price/SqFt Days On Market 188 178 195 187 167 156 140 146 135 121 Days On Market %Sale Price to List Price 93.6 95.4 94.1 94.3 95.9 96.2 95.9 97.2 98.8 99.8 %Sale Price to List Price Source: Mid-Hudson Multiple Listing Service, Residential-detached homes. * Homes sold for 2022 are annualized based on actual sales year-to-date.
HOMES
HOMES


AVERAGE SALE PRICE
TOWN/CITY

NORTHWEST DUTCHESS SINGLE FAMILY HOMES DUTCHESS COUNTY Preview all our HD Videos of Westchester, Putnam and Dutchess houlihanlawrence.com/communities
SOLD TOWN/CITY Q3 2022 Q3 2021 % CHANGE YTD 2022 YTD 2021 % CHANGE CLINTON 13 14 -7% 40 42 -5% HYDE PARK 46 61 -25% 124 174 -29% MILAN 9 7 29% 21 19 11% PLEASANT VALLEY 20 27 -26% 59 85 -31% RED HOOK 21 22 -5% 45 66 -32% RHINEBECK 16 30 -47% 49 90 -46% NorthwestDutchess 125 161 -22% 338 476 -29% CLICK TO OBTAIN A SPECIFIC TOWN/CITY MONTHLY MARKET REPORT. CLINTON HYDE PARK MILAN PLEASANT VALLEY RED HOOK RHINEBECK
SOLD Q 3 - 2022 VS. Q 3 - 2021 22% AVERAGE SALE PRICE Q 3 - 2022 VS. Q 3 - 2021 8%
Q3 2022 Q3 2021 % CHANGE YTD 2022 YTD 2021 % CHANGE CLINTON $828,000 $545,000 52% $717,500 $481,950 49% HYDE PARK $349,500 $320,000 9% $331,250 $293,900 13% MILAN $627,000 $675,000 -7% $650,000 $605,000 7% PLEASANT VALLEY $422,250 $420,000 1% $377,500 $365,000 3% RED HOOK $584,000 $442,000 32% $535,000 $442,450 21% RHINEBECK $755,000 $725,000 4% $725,000 $662,500 9% NorthwestDutchess $447,000 $415,000 8% $415,000 $375,000 11% Source: Mid-Hudson Multiple Listing Service reports the Average Sale Price.
FAMILY HOMES
CLINTON, HYDE PARK, MILAN, PLEASANT VALLEY, RED HOOK, RHINEBECK
SUPPLY DEMAND ANALYSIS

$0 - $299,999
$300,000 -$399,999
$400,000 - $499,999
$600,000 - $799,999
$800,000 - $999,999
$1,000,000 - $1,999,999
NORTHWEST DUTCHESS SINGLE
Click to obtain a specific town/city monthly market report.
AS OF SEPTEMBER 30, 2022 AS OF SEPTEMBER 30, 2021 2022 vs. 2021 PRICE RANGE SUPPLY: ACTIVE LISTINGS DEMAND: PENDING SALES SUPPLY/ DEMAND RATIO* SUPPLY: ACTIVE LISTINGS DEMAND: PENDING SALES SUPPLY/ DEMAND RATIO* % CHANGE IN LISTINGS % CHANGE IN PENDINGS
29 16 2 37 36 1 -21.6% -55.6%
37 25 1 26 36 1 42.3% -30.6%
24 12 2 24 14 2 0.0% -14.3% $500,000 - $599,999 17 8 2 9 10 1 88.9% -20.0%
28 9 3 13 10 1 115.4% -10.0%
10 2 5 5 10 1 100.0% -80.0%
19 5 4 17 13 1 11.8% -61.5% $2,000,000 and up 9 4 2 8 2 4 12.5% 100.0% MarketTotals 173 81 2 139 131 1 24.5% -38.2% *Supply Demand Ratio Key 1-4: High Demand 5-6: Balanced 7-9: Low Demand 10+: Very Low Demand TEN-YEAR MARKET HISTORY Average Sale Price $297,258 $308,849 $282,114 $280,385 $304,969 $343,282 $348,848 $492,055 $530,425 $631,280 Average Sale Price Average Price/SqFt $138 $144 $132 $137 $149 $158 $166 $209 $235 $263 Average Price/SqFt Days On Market 181 176 169 164 153 147 141 143 125 114 Days On Market %Sale Price to List Price 93.6 93.2 94.1 94.8 96.2 95.9 96.1 99.6 100.4 97.4 %Sale Price to List Price Source: Mid-Hudson Multiple Listing Service, Residential-detached homes. * Homes sold for 2022 are annualized based on actual sales year-to-date.
HOMES


AVERAGE SALE PRICE

NORTHEAST DUTCHESS SINGLE FAMILY HOMES DUTCHESS COUNTY Preview all our HD Videos of Westchester, Putnam and Dutchess houlihanlawrence.com/communities
SOLD TOWN/CITY Q3 2022 Q3 2021 % CHANGE YTD 2022 YTD 2021 % CHANGE AMENIA 8 11 -27% 32 37 -14% NORTH EAST 2 2 0% 10 10 0% PINE PLAINS 5 7 -29% 16 18 -11% STANFORD 8 15 -47% 24 39 -39% WASHINGTON 8 19 -58% 24 37 -35% NortheastDutchess 31 54 -43% 106 141 -25% CLICK TO OBTAIN A SPECIFIC TOWN/CITY MONTHLY MARKET REPORT. AMENIA NORTH EAST PINE PLAINS STANFORD WASHINGTON HOMES SOLD Q 3 - 2022 VS. Q 3 - 2021 43% AVERAGE SALE PRICE Q 3 - 2022 VS. Q 3 - 2021 1%
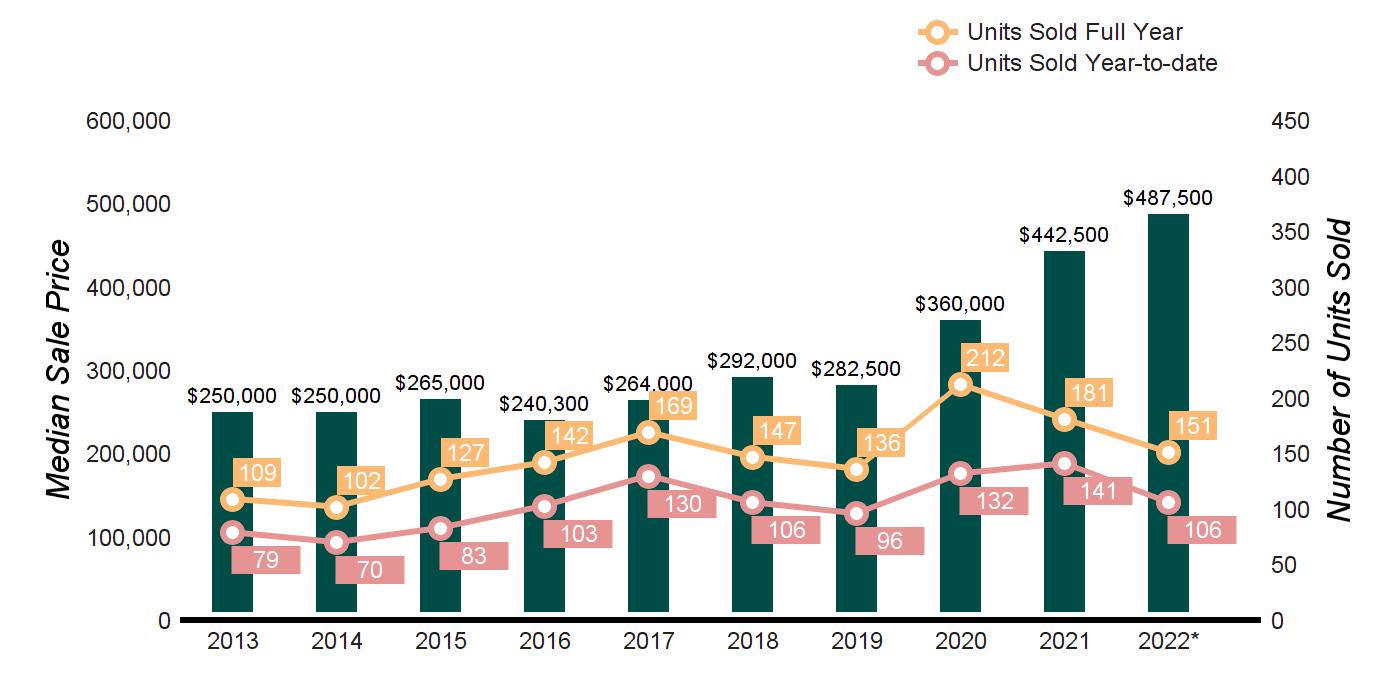
TOWN/CITY Q3 2022 Q3 2021 % CHANGE YTD 2022 YTD 2021 % CHANGE AMENIA $267,500 $290,000 -8% $419,500 $285,000 47% NORTH EAST $225,000 $432,000 -48% $372,500 $402,900 -8% PINE PLAINS $385,330 $334,900 15% $357,500 $319,750 12% STANFORD $671,000 $405,000 66% $565,000 $442,500 28% WASHINGTON $765,500 $825,000 -7% $1,020,499 $830,000 23% NortheastDutchess $435,000 $430,000 1% $487,500 $430,000 13% Source: Mid-Hudson Multiple Listing Service reports the Average Sale Price.
AMENIA, NORTH EAST, PINE PLAINS, STANFORD,
SUPPLY DEMAND ANALYSIS
$0 - $299,999
$300,000 -$399,999
$400,000 - $499,999
$600,000 - $799,999
$800,000 - $999,999
$1,000,000 - $1,999,999
NORTHEAST DUTCHESS SINGLE FAMILY HOMES
WASHINGTON Click to obtain a specific town/city monthly market report.
AS OF SEPTEMBER 30, 2022 AS OF SEPTEMBER 30, 2021 2022 vs. 2021 PRICE RANGE SUPPLY: ACTIVE LISTINGS DEMAND: PENDING SALES SUPPLY/ DEMAND RATIO* SUPPLY: ACTIVE LISTINGS DEMAND: PENDING SALES SUPPLY/ DEMAND RATIO* % CHANGE IN LISTINGS % CHANGE IN PENDINGS
11 9 1 8 8 1 37.5% 12.5%
10 4 3 10 7 1 0.0% -42.9%
14 1 14 8 3 3 75.0% -66.7% $500,000 - $599,999 6 3 2 2 6 1 200.0% -50.0%
6 1 6 9 5 2 -33.3% -80.0%
3 4 1 9 2 5 -66.7% 100.0%
13 3 4 14 2 7 -7.1% 50.0% $2,000,000 and up 10 2 5 14 2 7 -28.6% 0.0% MarketTotals 73 27 3 74 35 2 -1.4% -22.9% *Supply Demand Ratio Key 1-4: High Demand 5-6: Balanced 7-9: Low Demand 10+: Very Low Demand TEN-YEAR MARKET HISTORY Average Sale Price $567,693 $463,158 $472,708 $439,423 $430,139 $553,985 $432,414 $684,243 $831,763 $899,026 Average Sale Price Average Price/SqFt $190 $167 $188 $166 $201 $197 $179 $222 $271 $292 Average Price/SqFt Days On Market 197 208 212 212 193 198 186 191 162 142 Days On Market %Sale Price to List Price 87.9 80.5 88.9 91.3 92.6 92.0 91.1 95.3 96.2 97.1 %Sale Price to List Price Source: Mid-Hudson Multiple Listing Service, Residential-detached homes. * Homes sold for 2022 are annualized based on actual sales year-to-date.
QUARTERLY MARKET OVERVIEW
AVERAGE
SUPPLY DEMAND ANALYSIS
$0 - $299,999
$300,000 -$399,999
$400,000 - $499,999
$500,000 - $599,999
$600,000 - $799,999
$800,000 - $999,999
$1,000,000 - $1,999,999
-47.6%
-46.2%
180.0% -66.7%
DUTCHESS COUNTY CONDOMINIUMS
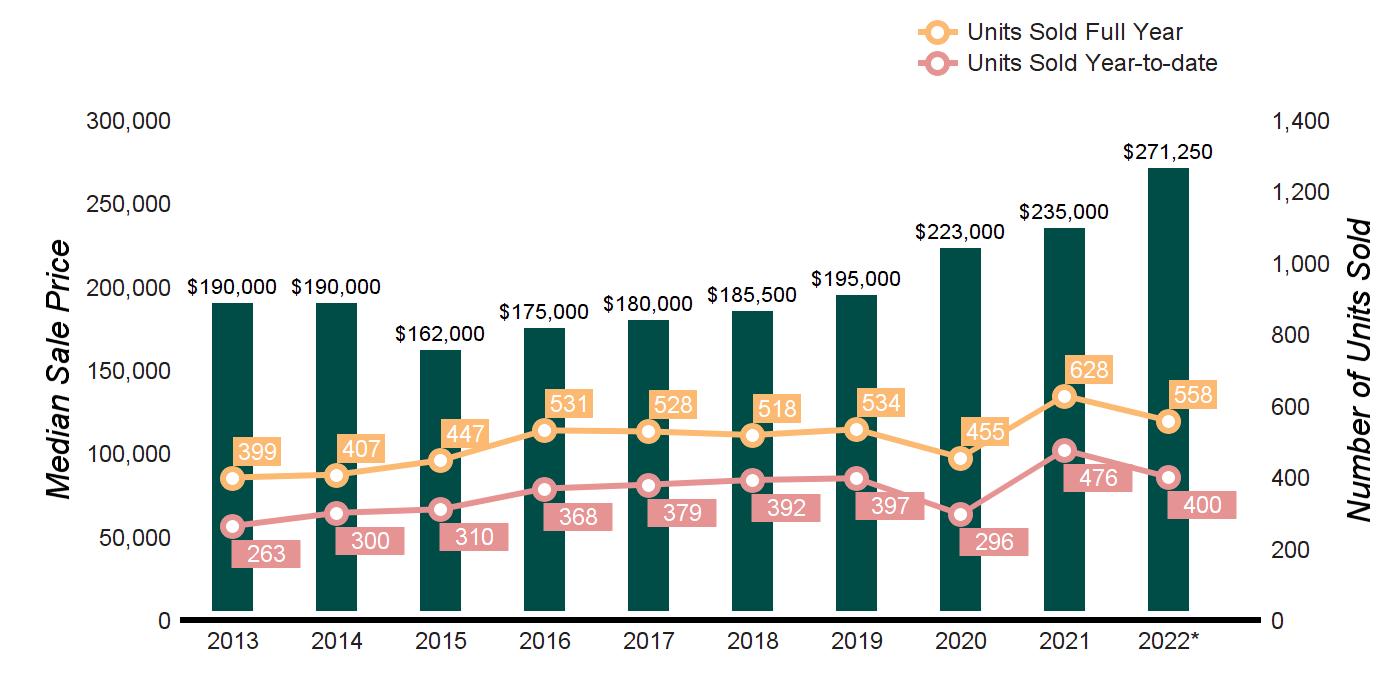
Q3 2022 Q3 2021 % CHANGE YTD 2022 YTD 2021 % CHANGE UNITS SOLD 135 168 -19.6% 400 476 -16.0%
SALE PRICE $305,223 $260,027 17.4% $293,181 $267,339 9.7% MEDIAN SALE PRICE $279,000 $235,500 18.5% $271,250 $235,450 15.2% AVERAGE PRICE PER SQUARE FOOT $217 $197 10.2% $211 $190 11.1% AVERAGE DAYS ON MARKET 74 119 -37.8% 99 131 -24.4% % SALE PRICE TO LIST PRICE 101.3 100.2 1.1% 101.3 98.5 2.8%
AS OF SEPTEMBER 30, 2022 AS OF SEPTEMBER 30, 2021 2022 vs. 2021 PRICE RANGE SUPPLY: ACTIVE LISTINGS DEMAND: PENDING SALES SUPPLY/ DEMAND RATIO* SUPPLY: ACTIVE LISTINGS DEMAND: PENDING SALES SUPPLY/ DEMAND RATIO* % CHANGE IN LISTINGS % CHANGE IN PENDINGS
53 44 1 52 84 1 1.9%
12 20 1 16 18 1 -25.0% 11.1%
8 7 1 17 13 1 -52.9%
4 4 1 5 4 1 -20.0% 0.0%
14 1 14 5 3 2
6 1 6 1 0 Not Valid 500.0% 0.0%
3 0 Not Valid 2 0 Not Valid 50.0% 0.0% $2,000,000 and up 0 0 Not Valid 0 0 Not Valid 0.0% 0.0% MarketTotals 100 77 1 98 122 1 2.0% -36.9% *Supply Demand Ratio Key 1-4: High Demand 5-6: Balanced 7-9: Low Demand 10+: Very Low Demand TEN-YEAR MARKET HISTORY Average Sale Price $205,732 $205,677 $191,248 $196,896 $195,776 $208,519 $218,425 $249,159 $266,743 $293,181 Average Sale Price Average Price/SqFt $140 $135 $132 $131 $139 $146 $153 $172 $192 $211 Average Price/SqFt Days On Market 209 178 174 159 137 149 146 131 127 99 Days On Market %Sale Price to List Price 96.7 97.3 96.8 97.5 96.4 98.5 98.3 98.2 98.7 101.3 %Sale Price to List Price Source: Mid-Hudson Multiple Listing Service, Residential-attached homes. * Homes sold for 2022 are annualized based on actual sales year-to-date.
4 GLOBAL NETWORKS – REACHING 56 COUNTRIES & 6 CONTINENTS
Christie’s International Real Estate
Leading Real Estates Companies of the World | Luxury Portfolio International Mayfair International Realty | Board of Regents Luxury Real Estate


