Market Report

FULL YEAR 2022


WESTCHESTER, PUTNAM & DUTCHESS
FULL YEAR 2022 MARKET REPORT
EXECUTIVE SUMMARY
To our clients and friends, we wish you a happy, healthy, and prosperous 2023. Because of your continued support, Houlihan Lawrence has been the market leader north of New York City for over two decades. As economic conditions and trends fluctuate, our agents adapt to guide and advise our clients through the ever-changing landscape.
2022 presented challenges for buyers as inventory continued to decline after several years of record lows. As interest rates rose, buyer demand remained robust which continued to increase median prices and decrease days on the market. Due to extraordinary demand created by the pandemic, and the further restricted inventory, sales peaked in 2020 and 2021 throughout Westchester, Putnam, and Dutchess Counties. And, as anticipated, sales naturally declined in 2022 after this unsustainable volume.
At the end of 2022, the demand for homes remained very high in relation to supply in most markets and price ranges with a few exceptions. In Northern Westchester, homes priced $4 million and up saw an increase in inventory with low demand. Putnam County homes priced over $1 million experienced the same slowdown, and parts of Dutchess County returned to a more balanced demand. These few market shifts may be the first indicators of a market starting to normalize. As we enter 2023, conditions remain ideal for sellers who properly price their homes, as discouraged yet price-savvy buyers continue to wait for new inventory.
Our communities across Westchester, Putnam, and Dutchess Counties continue to attract new residents looking to establish new roots and inspire existing residents to move within our towns. We are grateful to our communities and look forward to a successful 2023.
With Warm Regards,
Liz Nunan President and CEO





914.220.7000 · HOULIHANLAWRENCE.COM LIST WITH CONFIDENCE. PUT THE POWER OF #1 TO WORK FOR YOU. PROUDLY CLOSED $8 BILLION IN SALES AND REPRESENTED OVER 7,000 BUYERS AND SELLERS IN 2022 BROKERAGE NORTH OF NYC Source: OKMLS, MHMLS, CGNDMLS, SMARTMLS, 1/1/2022 – 12/31/2022, total dollar volume of single family homes sold by company, Westchester, Putnam, Dutchess, Columbia and Fairfield Counties combined. Source: 1/1/2022 - 12/31/2022 total sales and rentals both on and off MLS.
WESTCHESTER COUNTY
SingleFamilyHomeOverview
NEW YORK CITY GATEWAY
MountVernon,NewRochelle,Pelham,Yonkers
LOWER WESTCHESTER
Bronxville,Eastchester,Edgemont,Scarsdale, Tuckahoe

THE RIVERTOWNS
Ardsley,BriarcliffManor,DobbsFerry,Elmsford, Hastings,Irvington,MountPleasant,Ossining, Pleasantville,PocanticoHills,Tarrytown
GREATER WHITE PLAINS
Greenburgh,Valhalla,WhitePlains
THE SOUND SHORE
BlindBrook,Harrison,Mamaroneck,Port Chester,RyeCity,RyeNeck
TABLE OF CONTENTS
FOURTH QUARTER 2022
NORTHERN WESTCHESTER
Bedford,ByramHills,Chappaqua,KatonahLewisboro,NorthSalem,Somers
NORTHWEST WESTCHESTER Croton-Harmon,HendrickHudson,Lakeland, Peekskill,Yorktown
WESTCHESTER COUNTY CondominiumOverview

WESTCHESTER COUNTY
Co-OperativeOverview
PUTNAM COUNTY
Brewster,Carmel,Garrison,Haldane,Mahopac, PutnamValley
PUTNAM COUNTY CondominiumOverview
DUTCHESS COUNTY
SingleFamilyHomeOverview
SOUTHEAST DUTCHESS
Beekman,Dover,Pawling,UnionVale
SOUTHWEST DUTCHESS
Beacon,EastFishkill,Fishkill,LaGrange, Poughkeepsie,Poughkeepsie/City,Wappinger
NORTHEAST DUTCHESS
Amenia,NorthEast,PinePlains,Stanford, Washington
NORTHWEST DUTCHESS
Clinton,HydePark,Milan,PleasantValley,Red Hook,Rhinebeck
DUTCHESS COUNTY
CondominiumOverview
HOULIHANLAWRENCE.COM
$0 - $499,999 88 120 1 90 208 1 -2.2% -42.3% $500,000 - $699,999 172 188 1 171 357 1 0.6% -47.3% $700,000 - $999,999 166 180 1 159 251 1 4.4% -28.3% $1,000,000 - $1,499,999 76 90 1 87 141 1 -12.6% -36.2%
$1,500,000 - $1,999,999 55 48 1 57 71 1 -3.5% -32.4% $2,000,000 - $2,499,999 22 31 1 27 33 1 -18.5% -6.1% $2,500,000 - $2,999,999 25 17 1 23 35 1 8.7% -51.4% $3,000,000 - $3,999,999 36 21 2 31 20 2 16.1% 5.0% $4,000,000 and up 65 17 4 60 22 3 8.3% -22.7% MarketTotals

SINGLE
MARKET OVERVIEW
Q4
% CHANGE FULL YEAR
%
PRICE
PRICE PER SQUARE FOOT
% SALE PRICE TO LIST PRICE 99.5 99.5 0.0%
SUPPLY DEMAND ANALYSIS AS OF DECEMBER 31, 2022 AS OF DECEMBER 31,
2021 PRICE RANGE SUPPLY: ACTIVE LISTINGS DEMAND: PENDING SALES SUPPLY/ DEMAND RATIO* SUPPLY: ACTIVE LISTINGS DEMAND: PENDING SALES SUPPLY/ DEMAND RATIO* % CHANGE IN LISTINGS % CHANGE IN PENDINGS
WESTCHESTER COUNTY
FAMILY HOMES QUARTERLY
Q4 2022
2021
2022 FULL YEAR 2021
CHANGE HOMES SOLD 1250 1688 -25.9% 6124 7438 -17.7% AVERAGE SALE PRICE $968,717 $977,630 -0.9% $1,116,579 $1,041,703 7.2% MEDIAN SALE
$752,735 $725,000 3.8% $815,000 $780,000 4.5% AVERAGE
$388 $369 5.1% $410 $373 9.9%
102.6 100.0 2.6%
2021 2022 vs.
High Demand 5-6: Balanced 7-9: Low Demand 10+: Very Low Demand TEN-YEAR MARKET HISTORY Average Sale Price $811,056 $861,164 $836,478 $818,945 $851,137 $856,530 $850,017 $947,353 $1,041,703 $1,116,579 Average Sale Price Average Price/SqFt $297 $308 $311 $309 $318 $320 $320 $337 $373 $410 Average Price/SqFt Days On Market 112 99 94 89 85 75 77 73 49 39 Days On Market %Sale Price to List Price 96.0 96.7 97.0 97.0 97.4 97.2 96.6 98.1 100.0 102.6 %Sale Price to List Price
* Homes sold
2022 are annualized
705 712 1 705 1138 1 0.0% -37.4% *Supply Demand Ratio Key 1-4:
Source: Onekey MLS, SINGLE FAMILY HOMES
for
based on actual sales year-to-date.


NEW
CITY GATEWAY
Preview all our HD Videos of
and
houlihanlawrence.com/communities
SOLD
DISTRICT Q4 2022 Q4 2021 % CHANGE FULL YEAR 2022 FULL YEAR 2021 % CHANGE
37 41
157
70
22
117
131
260
HOMES SOLD 2022 VS. 2021 23% MEDIAN SALE PRICE 2022 VS. 2021 5% MEDIAN SALE PRICE SCHOOL DISTRICT Q4 2022 Q4 2021 % CHANGE FULL YEAR 2022 FULL YEAR 2021 % CHANGE
$610,000 $585,000 4% $610,000 $585,000 4% NEW
$884,000 $784,750 13% $830,000 $801,000 4% PELHAM $1,006,000 $917,000 10% $1,153,000 $1,112,500 4% YONKERS $635,000 $610,000 4% $639,500 $600,000 7% NYCGateway $700,000 $650,000 8% $695,000 $665,000 5% Source: Onekey MLS, Single-family homes, Zones 7 & 8
YORK
SINGLE FAMILY HOMES NEW ROCHELLE
Westchester, Putnam
Dutchess
HOMES
SCHOOL
MOUNT VERNON
-10%
164 -4% NEW ROCHELLE
120 -42% 332 468 -29% PELHAM
28 -21%
156 -25% YONKERS
211 -38% 566 734 -23% NYCGateway
400 -35% 1172 1522 -23% CLICK ON A SCHOOL DISTRICT FOR THE LATEST MONTHLY MARKET REPORT. MOUNT VERNON NEW ROCHELLE PELHAM YONKERS
MOUNT VERNON
ROCHELLE
NEW YORK CITY GATEWAY
SINGLE FAMILY HOMES
MOUNT VERNON, NEW ROCHELLE, PELHAM, YONKERS
Click on a School district to obtain the latest monthly market report.

SUPPLY DEMAND ANALYSIS
AS OF DECEMBER 31, 2022
PRICE RANGE SUPPLY: ACTIVE LISTINGS
DEMAND: PENDING SALES
SUPPLY/ DEMAND RATIO*
SUPPLY: ACTIVE LISTINGS
AS OF DECEMBER 31, 2021 2022 vs. 2021
DEMAND: PENDING SALES
SUPPLY/ DEMAND RATIO*
% CHANGE IN LISTINGS
% CHANGE IN PENDINGS
$0 - $299,999 2 1 2 2 2 1 0.0% -50.0% $300,000 -$399,999 7 13 1 8 18 1 -12.5% -27.8% $400,000 - $499,999 26 25 1 12 38 1 116.7% -34.2% $500,000 - $599,999 35 36 1 25 74 1 40.0% -51.4% $600,000 - $799,999 53 49 1 42 74 1 26.2% -33.8% $800,000 - $999,999 31 20 2 15 27 1 106.7% -25.9% $1,000,000 - $1,999,999 20 20 1 22 31 1 -9.1% -35.5% $2,000,000 and up 7 2 4 7 4 2 0.0% -50.0% MarketTotals
TEN-YEAR MARKET HISTORY
181
166 1 133 268 1 36.1% -38.1% *Supply Demand Ratio Key 1-4: High Demand 5-6: Balanced 7-9: Low Demand 10+: Very Low Demand
Average Sale Price $567,284 $596,124 $603,126 $604,355 $626,880 $643,464 $637,214 $725,426 $770,893 $808,886 Average Sale Price Average Price/SqFt $253 $261 $266 $272 $281 $297 $300 $319 $349 $379 Average Price/SqFt Days On Market 119 102 95 86 86 67 67 67 47 40 Days On Market %Sale Price to List Price 95.8 96.6 97.4 97.6 98.0 97.7 98.1 98.3 100.2 101.9 %Sale Price to List Price Source: Onekey
Single-family homes, Zones 7 & 8 *
sold
MLS,
Homes
for 2022 are annualized based on actual sales year-to-date.
BRONXVILLE


LOWER WESTCHESTER SINGLE
our
FAMILY HOMES SCARSDALE Preview all
HD Videos of Westchester, Putnam and Dutchess houlihanlawrence.com/communities
Q4
Q4 2021 % CHANGE FULL
FULL
% CHANGE
HOMES SOLD SCHOOL DISTRICT
2022
YEAR 2022
YEAR 2021
BRONXVILLE 8 11 -27% 74 68 9% EASTCHESTER 27 30 -10% 124 153 -19% EDGEMONT 9 18 -50% 96 95 1% SCARSDALE 44 48 -8% 278 353 -21% TUCKAHOE 11 12 -8% 60 58 3% LowerWestchester 99 119 -17% 632 727 -13% CLICK ON A SCHOOL DISTRICT FOR THE LATEST MONTHLY MARKET REPORT.
SOLD 2022
13% MEDIAN SALE PRICE 2022
15%
Q4
% CHANGE FULL
% CHANGE
BRONXVILLE EASTCHESTER EDGEMONT SCARSDALE TUCKAHOE HOMES
VS. 2021
VS. 2021
MEDIAN SALE PRICE SCHOOL DISTRICT Q4 2022
2021
YEAR 2022 FULL YEAR 2021
$1,675,000 $2,000,000 -16% $2,575,000 $2,250,000 14%
12%
16%
$1,275,000 $1,175,000 9% $1,509,500 $1,310,000 15%
Onekey
EASTCHESTER $851,000 $762,999
$877,500 $800,000 10% EDGEMONT $920,000 $1,036,249 -11% $1,275,000 $1,190,000 7% SCARSDALE $1,577,500 $1,361,250
$2,000,000 $1,751,000 14% TUCKAHOE $791,700 $1,197,500 -34% $860,500 $930,000 -8% LowerWestchester
Source:
MLS, Single-family homes, Zone 6
LOWER WESTCHESTER
SINGLE FAMILY HOMES
BRONXVILLE, EASTCHESTER, EDGEMONT, SCARSDALE, TUCKAHOE
Click on a School district to obtain the latest monthly market report.

SUPPLY DEMAND ANALYSIS
AS OF DECEMBER 31, 2022
AS OF DECEMBER 31, 2021 2022 vs. 2021
PRICE RANGE
SUPPLY: ACTIVE LISTINGS
DEMAND: PENDING SALES
SUPPLY/ DEMAND RATIO*
SUPPLY: ACTIVE LISTINGS
DEMAND: PENDING SALES
SUPPLY/ DEMAND RATIO*
% CHANGE IN LISTINGS
% CHANGE IN PENDINGS
$0 - $499,999 0 0 Not Valid 0 2 0 0.0% -100.0%
$500,000 - $699,999 2 2 1 7 4 2 -71.4% -50.0% $700,000 - $999,999 13 15 1 17 24 1 -23.5% -37.5% $1,000,000 - $1,499,999 7 7 1 8 18 1 -12.5% -61.1%
$1,500,000 - $1,999,999 9 9 1 8 11 1 12.5% -18.2%
-30.0%
-46.2%
-37.5%
TEN-YEAR MARKET HISTORY
$2,000,000 - $2,499,999 4 7 1 4 10 1 0.0%
$2,500,000 - $2,999,999 7 7 1 5 13 1 40.0%
$3,000,000 - $3,999,999 6 10 1 12 5 2 -50.0% 100.0% $4,000,000 and up 15 5 3 14 8 2 7.1%
MarketTotals 63 62 1 75 95 1 -16.0% -34.7% *Supply Demand Ratio Key 1-4: High Demand 5-6: Balanced 7-9: Low Demand 10+: Very Low Demand
Average Sale Price $1,263,156 $1,388,882 $1,406,473 $1,463,106 $1,632,159 $1,416,955 $1,399,705 $1,514,451 $1,632,770 $1,787,091 Average Sale Price Average Price/SqFt $413 $443 $451 $442 $454 $439 $422 $435 $477 $533 Average Price/SqFt Days On Market 103 76 74 82 92 75 85 83 47 40 Days On Market %Sale Price to List Price 96.3 97.7 97.6 96.4 96.7 96.1 95.7 97.2 99.7 102.5 %Sale Price to List Price
*
Source: Onekey MLS, Single-family homes, Zone 6
Homes sold for 2022 are annualized based on actual sales year-to-date.
THE RIVERTOWNS
SINGLE FAMILY HOMES
HOMES SOLD
SCHOOL DISTRICT
Q4 2022 Q4 2021 % CHANGE FULL YEAR 2022 FULL YEAR 2021 % CHANGE
ARDSLEY 24 34 -29% 121 140 -14%
BRIARCLIFF MANOR 11 13 -15% 60 82 -27%

DOBBS FERRY 10 14 -29% 73 86 -15%
ELMSFORD 19 32 -41% 87 100 -13% HASTINGS 17 12 42% 73 75 -3% IRVINGTON 18 20 -10% 77 97 -21% MOUNT PLEASANT 21 31 -32% 101 116 -13% OSSINING 35 61 -43% 167 251 -34% PLEASANTVILLE 18 31 -42% 94 97 -3% POCANTICO HILLS 3 5 -40% 17 12 42%
TARRYTOWN 13 24 -46% 63 77 -18%
TheRivertowns 189 277 -32% 933 1133 -18%
CLICK ON A SCHOOL DISTRICT FOR THE LATEST MONTHLY MARKET REPORT.
ARDSLEY BRIARCLIFF MANOR DOBBS FERRY ELMSFORD HASTINGS IRVINGTON MOUNT PLEASANT OSSINING PLEASANTVILLE POCANTICO HILLS TARRYTOWN
ARDSLEY
THE RIVERTOWNS

Preview all our HD Videos of Westchester, Putnam and Dutchess houlihanlawrence.com/communities

$799,500 $739,000 8% $780,000 $771,287 1%
BRIARCLIFF MANOR $1,190,000 $970,000 23% $1,140,000 $947,500 20%
DOBBS FERRY $788,500 $712,499 11% $845,000 $790,000 7%
ELMSFORD $605,000 $557,500 9% $603,000 $575,500 5% HASTINGS $950,000 $766,250 24% $950,000 $865,000 10%
IRVINGTON $1,225,500 $1,517,500 -19% $1,275,000 $1,125,000 13% MOUNT PLEASANT $650,000 $702,000 -7% $665,000 $688,500 -3%
OSSINING $615,000 $590,750 4% $606,000 $575,000 5% PLEASANTVILLE $855,000 $761,000 12% $829,000 $725,000 14%
POCANTICO HILLS $1,096,111 $975,000 12% $1,060,000 $864,250 23% TARRYTOWN $1,120,000 $725,000 55% $975,000 $835,000 17%
TheRivertowns $799,000 $715,000 12% $765,000 $728,000 5%
HOMES SOLD
18% MEDIAN SALE PRICE
5%
SALE PRICE
% CHANGE FULL YEAR 2022 FULL YEAR 2021 % CHANGE
2022 VS. 2021
2022 VS. 2021
MEDIAN
SCHOOL DISTRICT Q4 2022 Q4 2021
Source: Onekey
Single-family
Zone 3
MLS,
homes,
THE RIVERTOWNS
SINGLE FAMILY HOMES
ARDSLEY, BRIARCLIFF MANOR, DOBBS FERRY, ELMSFORD, HASTINGS, IRVINGTON, MOUNT PLEASANT OSSINING, PLEASANTVILLE, POCANTICO HILLS, TARRYTOWN Click on a School district to obtain the latest monthly market report.

SUPPLY DEMAND ANALYSIS
AS OF DECEMBER 31, 2022
AS OF DECEMBER 31, 2021 2022 vs. 2021
PRICE RANGE
SUPPLY: ACTIVE LISTINGS
DEMAND: PENDING SALES
SUPPLY/ DEMAND RATIO*
SUPPLY: ACTIVE LISTINGS
DEMAND: PENDING SALES
SUPPLY/ DEMAND RATIO*
% CHANGE IN LISTINGS
% CHANGE IN PENDINGS
-37.5%
-28.6%
-53.3%
-31.9%
Low Demand 10+: Very Low Demand TEN-YEAR MARKET HISTORY Average Sale Price $664,832 $689,728 $692,908 $705,636 $740,572 $765,251 $732,079 $768,144 $839,444 $898,700 Average Sale Price Average Price/SqFt $285 $294 $304 $308 $321 $323 $318 $326 $355 $391 Average Price/SqFt Days On Market 105 100 91 86 77 67 75 73 50 39 Days On Market %Sale Price to List Price 97.5 98.2 97.6 98.7 98.9 100.3 97.6 98.5 100.1 103.5 %Sale Price to List Price Source: Onekey MLS, Single-family homes, Zone 3 * Homes sold for 2022 are annualized based on actual sales year-to-date.
$0 - $299,999 0 0 Not Valid 1 3 1 -100.0% -100.0% $300,000 -$399,999 3 5 1 4 8 1 -25.0%
$400,000 - $499,999 5 15 1 11 21 1 -54.5%
$500,000 - $599,999 9 14 1 17 30 1 -47.1%
$600,000 - $799,999 26 32 1 27 47 1 -3.7%
$800,000 - $999,999 15 21 1 18 25 1 -16.7% -16.0% $1,000,000 - $1,999,999 23 25 1 28 31 1 -17.9% -19.4% $2,000,000 and up 7 6 1 9 5 2 -22.2% 20.0% MarketTotals 88 118 1 115 170 1 -23.5% -30.6% *Supply Demand Ratio Key 1-4: High Demand 5-6: Balanced 7-9:


GREATER WHITE PLAINS SINGLE FAMILY
Preview all our HD Videos of Westchester, Putnam and Dutchess houlihanlawrence.com/communities
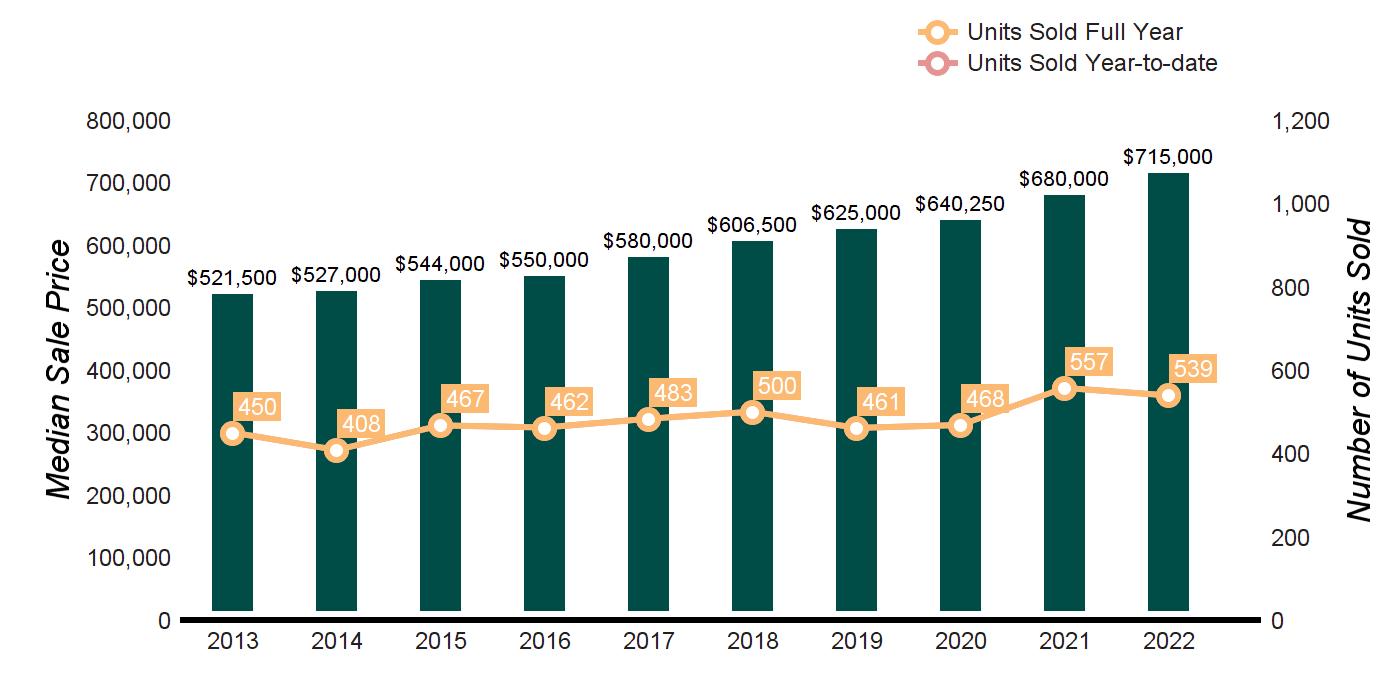
SOLD SCHOOL DISTRICT Q4 2022 Q4 2021 % CHANGE FULL YEAR 2022 FULL YEAR 2021 % CHANGE GREENBURGH 37 47 -21% 193 178 8% VALHALLA 24 18 33% 81 80 1% WHITE PLAINS 64 76 -16% 265 299 -11% GreaterWhitePlains 125 141 -11% 539 557 -3%
HOMES SOLD 2022 VS. 2021 3% MEDIAN SALE PRICE 2022 VS. 2021 5% MEDIAN SALE PRICE SCHOOL DISTRICT Q4 2022 Q4 2021 % CHANGE FULL YEAR 2022 FULL YEAR 2021 % CHANGE GREENBURGH $660,000 $650,000 2% $665,000 $630,000 6% VALHALLA $634,950 $588,000 8% $660,000 $646,450 2% WHITE PLAINS $752,500 $712,500 6% $789,000 $728,000 8% GreaterWhitePlains $679,000 $680,000 0% $715,000 $680,000 5% Source: Onekey MLS, Single-family homes, Zone 4
HOMES WHITE PLAINS
HOMES
CLICK ON A SCHOOL DISTRICT FOR THE LATEST MONTHLY MARKET REPORT. GREENBURGH VALHALLA WHITE PLAINS
GREATER WHITE PLAINS
SINGLE FAMILY HOMES
GREENBURGH, VALHALLA, WHITE PLAINS
Click on a School district to obtain the latest monthly market report.
SUPPLY DEMAND ANALYSIS
AS OF DECEMBER 31, 2022 AS OF DECEMBER 31, 2021 2022 vs. 2021
PRICE RANGE SUPPLY: ACTIVE LISTINGS
DEMAND: PENDING SALES
SUPPLY/ DEMAND RATIO*
SUPPLY: ACTIVE LISTINGS
DEMAND: PENDING SALES
SUPPLY/ DEMAND RATIO*
% CHANGE IN LISTINGS
% CHANGE IN PENDINGS
TEN-YEAR MARKET HISTORY
39 66 1
$0 - $299,999 0 0 Not Valid 0 0 Not Valid 0.0% 0.0% $300,000 -$399,999 0 4 0 1 4 1 -100.0% 0.0% $400,000 - $499,999 3 4 1 2 6 1 50.0% -33.3% $500,000 - $599,999 6 7 1 13 21 1 -53.8% -66.7% $600,000 - $799,999 12 30 1 16 29 1 -25.0% 3.4% $800,000 - $999,999 6 10 1 10 10 1 -40.0% 0.0% $1,000,000 - $1,999,999 11 10 1 9 7 1 22.2% 42.9% $2,000,000 and up 1 1 1 0 0 Not Valid 0.0% 0.0% MarketTotals
51 77 1 -23.5% -14.3% *Supply Demand Ratio Key 1-4: High Demand 5-6: Balanced 7-9: Low Demand 10+: Very Low Demand
Average Sale Price $555,397 $594,770 $606,510 $593,753 $624,937 $650,930 $649,190 $692,816 $732,108 $778,574 Average Sale Price Average Price/SqFt $264 $272 $284 $290 $300 $305 $308 $323 $351 $378 Average Price/SqFt Days On Market 107 93 84 84 68 63 71 59 42 33 Days On Market %Sale Price to List Price 96.8 97.2 97.6 97.6 98.4 98.4 97.8 98.7 100.7 103.2 %Sale Price to List Price
*
Source: Onekey MLS, Single-family homes, Zone 4
Homes sold for 2022 are annualized based on actual sales year-to-date.
HOMES SOLD

MEDIAN SALE PRICE


THE SOUND SHORE SINGLE FAMILY HOMES THE SOUND SHORE Preview all our HD Videos of Westchester, Putnam and Dutchess houlihanlawrence.com/communities
SCHOOL DISTRICT Q4 2022 Q4 2021 % CHANGE FULL YEAR 2022 FULL YEAR 2021 % CHANGE
17% MEDIAN
2%
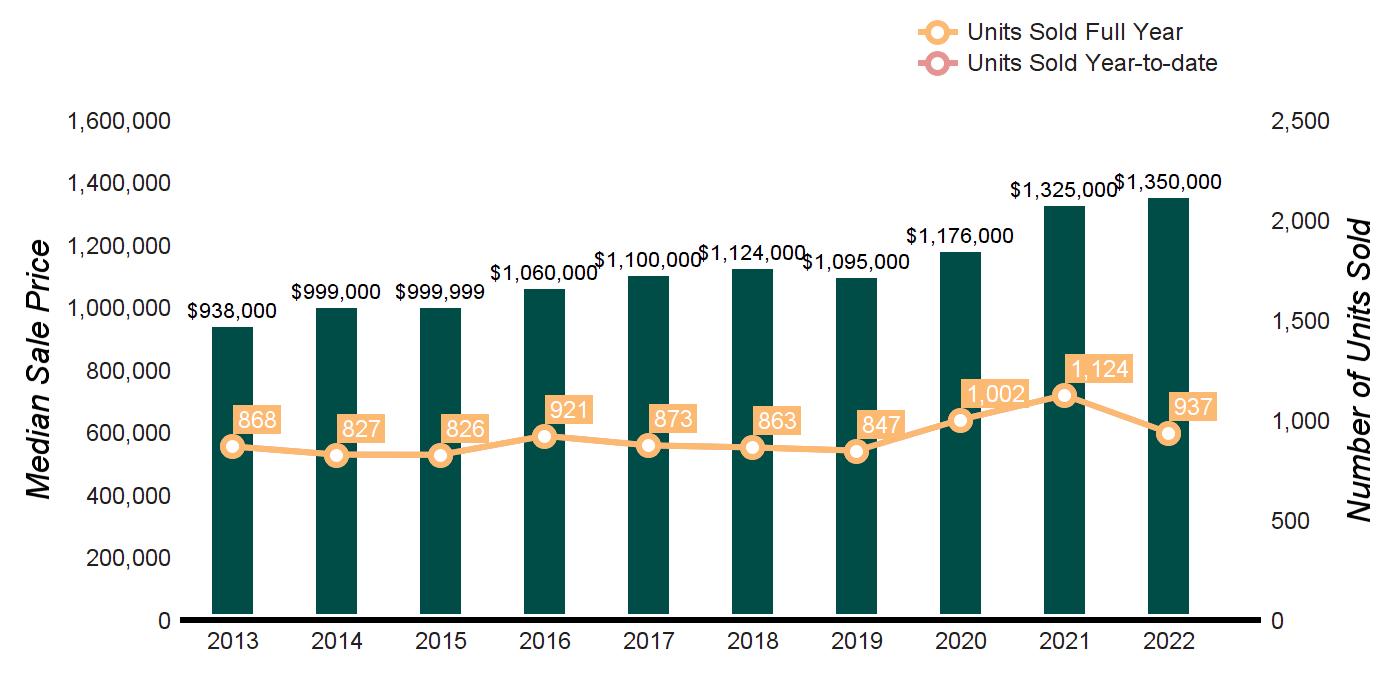
BLIND BROOK 26 35 -26% 131 154 -15% HARRISON 32 46 -30% 174 218 -20% MAMARONECK 43 48 -10% 267 338 -21% PORT CHESTER 24 34 -29% 106 126 -16% RYE CITY 24 26 -8% 166 194 -14% RYE NECK 24 19 26% 93 94 -1% TheSoundShore 173 208 -17% 937 1124 -17% CLICK ON A SCHOOL DISTRICT FOR THE LATEST MONTHLY MARKET REPORT. BLIND BROOK HARRISON MAMARONECK PORT CHESTER RYE CITY RYE NECK HOMES SOLD 2022 VS. 2021
SALE PRICE 2022 VS. 2021
SCHOOL DISTRICT Q4 2022 Q4 2021 % CHANGE FULL YEAR 2022 FULL YEAR 2021 % CHANGE
BLIND BROOK $1,162,500 $1,125,000 3% $1,099,000 $1,026,500 7% HARRISON $1,285,000 $1,512,500 -15% $1,676,000 $1,495,000 12% MAMARONECK $1,251,000 $1,525,000 -18% $1,455,000 $1,498,424 -3%
Onekey
PORT CHESTER $575,000 $585,000 -2% $645,000 $587,000 10% RYE CITY $1,657,500 $1,612,500 3% $2,147,500 $1,937,500 11% RYE NECK $848,750 $870,000 -2% $995,000 $922,999 8% TheSoundShore $1,150,000 $1,189,250 -3% $1,350,000 $1,325,000 2% Source:
MLS, Single-family homes, Zone 5
THE SOUND SHORE
SINGLE FAMILY HOMES
BLIND BROOK, HARRISON, MAMARONECK, PORT CHESTER, RYE CITY, RYE NECK
Click on a School district to obtain the latest monthly market report.
SUPPLY DEMAND ANALYSIS
AS OF DECEMBER 31, 2022
AS OF DECEMBER 31, 2021 2022 vs. 2021
PRICE RANGE
SUPPLY: ACTIVE LISTINGS
DEMAND: PENDING SALES
SUPPLY/ DEMAND RATIO*
SUPPLY: ACTIVE LISTINGS
DEMAND: PENDING SALES
SUPPLY/ DEMAND RATIO*
% CHANGE IN LISTINGS
% CHANGE IN PENDINGS
$0 - $499,999 2 3 1 9 6 2 -77.8% -50.0%
$500,000 - $699,999 15 11 1 19 27 1 -21.1% -59.3% $700,000 - $999,999 16 25 1 19 34 1 -15.8% -26.5% $1,000,000 - $1,499,999 13 14 1 17 31 1 -23.5% -54.8%
$1,500,000 - $1,999,999 10 19 1 12 19 1 -16.7% 0.0%
$2,000,000 - $2,499,999 5 12 1 9 8 1 -44.4% 50.0% $2,500,000 - $2,999,999 6 3 2 5 11 1 20.0% -72.7% $3,000,000 - $3,999,999 15 7 2 6 9 1 150.0% -22.2% $4,000,000 and up 17 9 2 16 8 2 6.3% 12.5% MarketTotals 99 103 1 112 153 1 -11.6% -32.7% *Supply Demand Ratio Key 1-4: High Demand 5-6:
TEN-YEAR MARKET HISTORY
Balanced 7-9: Low Demand 10+: Very Low Demand
Average Sale Price $1,271,109 $1,298,331 $1,367,114 $1,320,302 $1,353,465 $1,404,302 $1,355,790 $1,472,468 $1,592,056 $1,675,983 Average Sale Price Average Price/SqFt $406 $418 $434 $431 $436 $429 $422 $447 $484 $519 Average Price/SqFt Days On Market 100 86 87 77 78 78 81 66 52 38 Days On Market %Sale Price to List Price 96.1 96.9 96.4 96.7 97.1 95.7 95.9 97.8 100.2 103.4 %Sale Price to List Price
Source: Onekey MLS, Single-family homes, Zone 5 * Homes sold for 2022 are annualized based on actual sales year-to-date.
HOMES SOLD
BEDFORD 39 94 -59% 245 348 -30%
BYRAM HILLS 41 41 0% 170 211 -19%


MEDIAN SALE PRICE
BEDFORD
BYRAM HILLS $1,200,000 $1,299,000 -8% $1,420,750 $1,300,000 9%
KATONAH LEWISBORO $850,000 $756,222 12% $887,500 $862,000 3%

NORTHERN WESTCHESTER SINGLE FAMILY HOMES
BEDFORD Preview all our HD Videos of Westchester, Putnam and Dutchess houlihanlawrence.com/communities
SCHOOL DISTRICT Q4 2022 Q4 2021 % CHANGE FULL YEAR 2022 FULL YEAR 2021 % CHANGE
CHAPPAQUA 42 42 0% 214 284 -25%
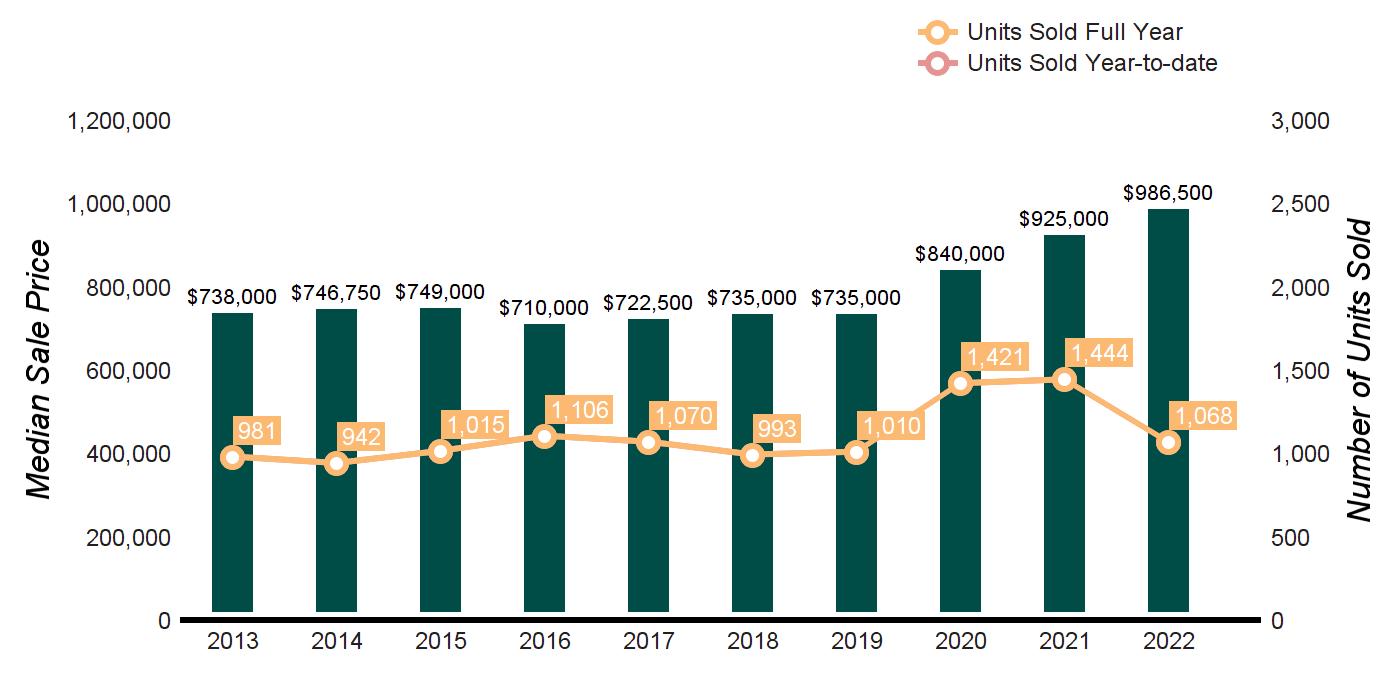
KATONAH LEWISBORO 44 54 -19% 216 283 -24% NORTH SALEM 11 22 -50% 56 87 -36% SOMERS 30 45 -33% 167 231 -28% NorthernWestchester 207 298 -31% 1068 1444 -26% CLICK ON A SCHOOL DISTRICT FOR THE LATEST MONTHLY MARKET REPORT.
26% MEDIAN SALE PRICE
7%
BEDFORD BYRAM HILLS CHAPPAQUA KATONAH-LEWISBORO NORTH SALEM SOMERS HOMES SOLD 2022 VS. 2021
2022 VS. 2021
SCHOOL DISTRICT Q4 2022 Q4 2021 % CHANGE FULL YEAR 2022 FULL YEAR 2021 % CHANGE
$950,000 $983,500 -3% $999,000 $930,000 7%
CHAPPAQUA $958,500 $1,191,250 -20% $1,310,000 $1,125,000 16%
Source: Onekey MLS, Single-family homes, Zone 2
NORTH SALEM $607,500 $677,550 -10% $625,000 $740,000 -16% SOMERS $757,500 $739,000 3% $700,000 $679,000 3% NorthernWestchester $910,000 $912,500 0% $986,500 $925,000 7%
NORTHERN WESTCHESTER
SINGLE FAMILY HOMES
BEDFORD, BYRAM HILLS, CHAPPAQUA, KATONAH-LEWISBORO, NORTH SALEM, SOMERS
Click on a School district to obtain the latest monthly market report.
SUPPLY DEMAND ANALYSIS
AS OF DECEMBER 31, 2022
AS OF DECEMBER 31, 2021 2022 vs. 2021
PRICE RANGE
SUPPLY: ACTIVE LISTINGS
DEMAND: PENDING SALES
SUPPLY/ DEMAND RATIO*
SUPPLY: ACTIVE LISTINGS
DEMAND: PENDING SALES
SUPPLY/ DEMAND RATIO*
% CHANGE IN LISTINGS
% CHANGE IN PENDINGS
$0 - $499,999 14 14 1 14 25 1 0.0% -44.0% $500,000 - $699,999 25 25 1 20 46 1 25.0% -45.7% $700,000 - $999,999 24 26 1 23 59 1 4.3% -55.9%
$1,000,000 - $1,499,999 14 23 1 14 37 1 0.0% -37.8%
$1,500,000 - $1,999,999 17 8 2 14 16 1 21.4% -50.0%
$2,000,000 - $2,499,999 11 7 2 10 8 1 10.0% -12.5% $2,500,000 - $2,999,999 10 4 3 10 8 1 0.0% -50.0% $3,000,000 - $3,999,999 8 4 2 10 6 2 -20.0% -33.3% $4,000,000 and up 26 2 13 22 6 4 18.2% -66.7%
TEN-YEAR MARKET HISTORY
MarketTotals 149 113 1 137 211 1 8.8% -46.4% *Supply Demand Ratio Key 1-4: High Demand 5-6: Balanced 7-9: Low Demand 10+: Very Low Demand
Average Sale Price $929,282 $1,020,339 $901,858 $868,326 $910,250 $893,432 $897,777 $984,186 $1,176,596 $1,314,684 Average Sale Price Average Price/SqFt $278 $284 $284 $277 $284 $277 $280 $292 $340 $387 Average Price/SqFt Days On Market 125 119 110 105 105 96 91 90 54 42 Days On Market %Sale Price to List Price 94.7 94.8 96.1 95.8 96.0 96.0 94.8 98.1 99.1 101.8 %Sale Price to List Price
Source: Onekey MLS, Single-family homes, Zone 2 * Homes sold for 2022 are annualized based on actual sales year-to-date.
HOMES


MEDIAN

NORTHWEST WESTCHESTER
Preview all our HD Videos of
and
houlihanlawrence.com/communities
SINGLE FAMILY HOMES YORKTOWN
Westchester, Putnam
Dutchess
DISTRICT Q4 2022 Q4 2021 % CHANGE FULL YEAR 2022 FULL YEAR 2021 % CHANGE
SOLD SCHOOL
SOLD 2022 VS.
9% MEDIAN SALE PRICE 2022 VS. 2021 5%
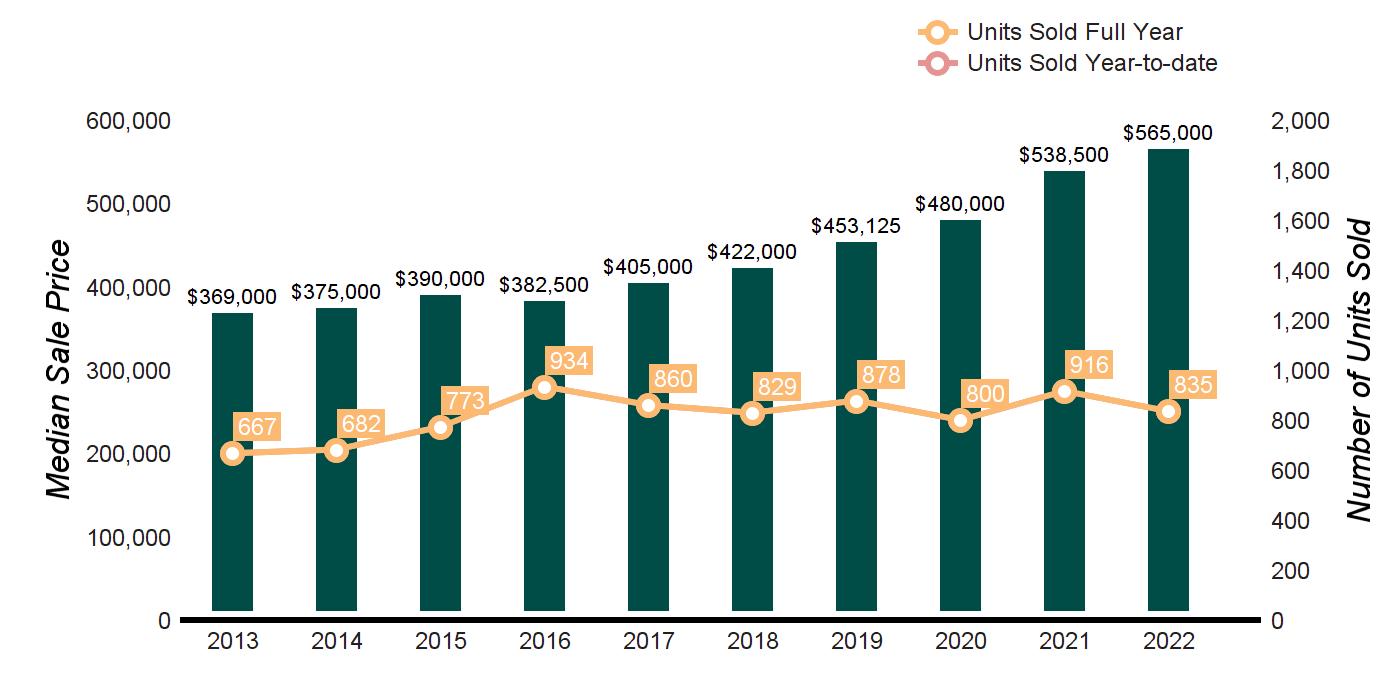
CROTON HARMON 20 29 -31% 99 118 -16% HENDRICK HUDSON 26 49 -47% 138 170 -19% LAKELAND 83 80 4% 311 335 -7% PEEKSKILL 21 28 -25% 109 97 12% YORKTOWN 43 57 -25% 178 196 -9% NorthwestWestchester 193 243 -21% 835 916 -9% CLICK ON A SCHOOL DISTRICT FOR THE LATEST MONTHLY MARKET REPORT. CROTON–HARMON HENDRICK HUDSON LAKELAND PEEKSKILL YORKTOWN HOMES
2021
DISTRICT Q4 2022 Q4 2021 % CHANGE FULL YEAR 2022 FULL YEAR 2021 % CHANGE
$699,500 $647,000 8% $787,000 $715,000 10%
$541,250 $550,000 -2% $574,500 $551,500 4%
$505,000 $497,500 2% $520,000 $490,000 6%
$469,000 $457,500 3% $481,000 $433,500 11%
$650,000 $610,000 7% $650,000 $608,875 7%
$550,000 $560,000 -2% $565,000 $538,500 5% Source: Onekey MLS, Single-family homes, Zone 1
SALE PRICE SCHOOL
CROTON HARMON
HENDRICK HUDSON
LAKELAND
PEEKSKILL
YORKTOWN
NorthwestWestchester
WESTCHESTER
SINGLE FAMILY HOMES
CROTON–HARMON, HENDRICK HUDSON, LAKELAND, PEEKSKILL, YORKTOWN
Click on a School district to obtain the latest monthly market report.
SUPPLY DEMAND ANALYSIS
AS OF DECEMBER 31, 2022
AS OF DECEMBER 31, 2021 2022 vs. 2021
PRICE RANGE
SUPPLY: ACTIVE LISTINGS
DEMAND: PENDING SALES
SUPPLY/ DEMAND RATIO*
SUPPLY: ACTIVE LISTINGS
DEMAND: PENDING SALES
SUPPLY/ DEMAND RATIO*
% CHANGE IN LISTINGS
% CHANGE IN PENDINGS
$0 - $299,999 2 5 1 5 8 1 -60.0% -37.5% $300,000 -$399,999 4 6 1 7 25 1 -42.9% -76.0% $400,000 - $499,999 20 25 1 14 41 1 42.9% -39.0% $500,000 - $599,999 18 22 1 10 39 1 80.0% -43.6%
-46.2%
-25.0%
TEN-YEAR MARKET HISTORY
NORTHWEST
84
$600,000 - $799,999 14 14 1 11 26 1 27.3%
$800,000 - $999,999 17 9 2 20 12 2 -15.0%
$1,000,000 - $1,999,999 6 3 2 12 11 1 -50.0% -72.7% $2,000,000 and up 3 0 Not Valid 2 1 2 50.0% -100.0% MarketTotals
84 1 81 163 1 3.7% -48.5% *Supply Demand Ratio Key 1-4: High Demand 5-6: Balanced 7-9: Low Demand 10+: Very Low Demand
Average Sale Price $398,011 $421,695 $431,339 $419,440 $441,752 $456,746 $483,257 $514,427 $581,831 $626,480 Average Sale Price Average Price/SqFt $194 $202 $208 $210 $221 $229 $240 $256 $286 $308 Average Price/SqFt Days On Market 121 108 102 94 83 72 71 63 46 37 Days On Market %Sale Price to List Price 96.5 96.2 97.7 98.2 98.8 98.9 98.6 99.3 101.3 102.0 %Sale Price to List Price
*
Source: Onekey MLS, Single-family homes, Zone 1
Homes sold for 2022 are annualized based on actual sales year-to-date.
AVERAGE SALE PRICE $570,370 $630,662 -9.6% $570,734 $550,760 3.6% MEDIAN SALE PRICE $435,000 $430,000 1.2% $450,000 $425,000 5.9% AVERAGE PRICE PER SQUARE FOOT $396 $426 -7.0% $402 $383 5.0% AVERAGE DAYS ON MARKET 45 60 -25.0% 51 58 -12.1%

-61.9%
-71.4%
WESTCHESTER COUNTY CONDOMINIUMS
QUARTERLY MARKET OVERVIEW Q4 2022 Q4 2021 % CHANGE FULL YEAR 2022 FULL YEAR 2021 % CHANGE UNITS SOLD 295 460 -35.9% 1491 1669 -10.7%
LIST PRICE
SUPPLY DEMAND ANALYSIS AS OF DECEMBER 31, 2022 AS OF DECEMBER 31, 2021 2022 vs. 2021 PRICE RANGE SUPPLY: ACTIVE LISTINGS DEMAND: PENDING SALES SUPPLY/ DEMAND RATIO* SUPPLY: ACTIVE LISTINGS DEMAND: PENDING SALES SUPPLY/ DEMAND RATIO* % CHANGE IN LISTINGS % CHANGE IN PENDINGS
165 156
271
*Supply Demand Ratio Key 1-4: High Demand 5-6: Balanced 7-9: Low Demand 10+: Very Low Demand TEN-YEAR MARKET HISTORY Average Sale Price $397,179 $423,000 $428,530 $422,642 $443,353 $442,707 $458,771 $482,135 $550,760 $570,734 Average Sale Price Average Price/SqFt $276 $288 $300 $309 $314 $324 $336 $342 $383 $402 Average Price/SqFt Days On Market 111 94 88 83 72 67 69 66 58 51 Days On Market %Sale Price to List Price 96.4 96.8 97.3 97.4 97.8 97.8 97.5 97.8 99.3 100.3 %Sale Price to List Price
MLS, Condominiums * Homes sold
annualized
% SALE PRICE TO
100.3 99.8 0.5% 100.3 99.3 1.0%
$0 - $299,999 30 22 1 52 47 1 -42.3% -53.2% $300,000 -$399,999 32 43 1 60 79 1 -46.7% -45.6% $400,000 - $499,999 34 27 1 54 55 1 -37.0% -50.9% $500,000 - $599,999 14 19 1 31 37 1 -54.8% -48.6% $600,000 - $799,999 8 17 1 27 35 1 -70.4% -51.4% $800,000 - $999,999 9 8 1 8 21 1 12.5%
$1,000,000 - $1,999,999 24 18 1 22 63 1 9.1%
$2,000,000 and up 14 2 7 17 13 1 -17.6% -84.6% MarketTotals
1
350 1 -39.1% -55.4%
Source: Onekey
for 2022 are
based on actual sales year-to-date.

WESTCHESTER
COUNTY CO-OPERATIVES
Q4
%
YEAR
QUARTERLY MARKET OVERVIEW Q4 2022
2021
CHANGE FULL
2022 FULL YEAR 2021 % CHANGE UNITS SOLD 458 555 -17.5% 2144 2145 0.0%
PRICE TO LIST PRICE
SUPPLY DEMAND ANALYSIS AS OF DECEMBER 31, 2022 AS OF DECEMBER 31, 2021 2022 vs. 2021 PRICE RANGE SUPPLY: ACTIVE LISTINGS DEMAND: PENDING SALES SUPPLY/ DEMAND RATIO* SUPPLY: ACTIVE LISTINGS DEMAND: PENDING SALES SUPPLY/ DEMAND RATIO* % CHANGE IN LISTINGS % CHANGE IN PENDINGS
367 402 1 534 521 1
445 465 1 620
*Supply Demand Ratio Key 1-4: High Demand 5-6: Balanced 7-9: Low Demand 10+: Very Low Demand TEN-YEAR MARKET HISTORY Average Sale Price $188,081 $179,697 $179,406 $185,854 $187,907 $198,839 $204,571 $219,766 $222,698 $230,869 Average Sale Price Average Price/SqFt $181 $174 $179 $188 $193 $204 $214 $225 $228 $236 Average Price/SqFt Days On Market 152 139 124 103 95 77 68 66 72 72 Days On Market %Sale Price to List Price 94.8 95.5 96.1 96.8 97.5 97.9 98.0 97.7 97.9 98.5 %Sale Price to List Price
MLS, Co-Operatives *
sold
annualized
AVERAGE SALE PRICE $224,609 $223,880 0.3% $230,869 $222,698 3.7% MEDIAN SALE PRICE $192,750 $190,000 1.4% $195,000 $193,000 1.0% AVERAGE PRICE PER SQUARE FOOT $232 $226 2.7% $236 $228 3.5% AVERAGE DAYS ON MARKET 72 77 -6.5% 72 72 0.0% % SALE
98.4 98.0 0.4% 98.5 97.9 0.6%
$0 - $299,999
-31.3% -22.8% $300,000 -$399,999 45 38 1 52 56 1 -13.5% -32.1% $400,000 - $499,999 16 11 1 18 15 1 -11.1% -26.7% $500,000 - $599,999 6 4 2 2 5 1 200.0% -20.0% $600,000 - $799,999 9 6 2 7 6 1 28.6% 0.0% $800,000 - $999,999 1 3 1 6 3 2 -83.3% 0.0% $1,000,000 - $1,999,999 1 1 1 0 0 Not Valid 0.0% 0.0% $2,000,000 and up 0 0 Not Valid 1 0 Not Valid -100.0% 0.0% MarketTotals
606 1 -28.2% -23.3%
Source: Onekey
Homes
for 2022 are
based on actual sales year-to-date.
HOMES SOLD
BREWSTER 48 70 -31% 220 269 -18% CARMEL 73 102 -28% 326 386 -16% GARRISON 3 9 -67% 30 43 -30% HALDANE 8 14 -43% 47 57 -18% LAKELAND 10 4 150% 44 57 -23% MAHOPAC 64 90 -29% 276 359 -23% PUTNAM VALLEY 41 47 -13% 121 187 -35% Putnamcounty 247 336 -27% 1064 1358 -22% CLICK ON A SCHOOL DISTRICT FOR THE LATEST MONTHLY MARKET REPORT.


PUTNAM COUNTY SINGLE FAMILY HOMES
BREWSTER-MAHOPAC Preview all our HD Videos of Westchester, Putnam and Dutchess houlihanlawrence.com/communities
SCHOOL DISTRICT Q4 2022 Q4 2021 % CHANGE FULL YEAR 2022 FULL YEAR 2021 % CHANGE
SOLD
22% MEDIAN SALE PRICE
11%
SALE
%
BREWSTER CARMEL GARRISON HALDANE LAKELAND MAHOPAC PUTNAM VALLEY HOMES
2022 VS. 2021
2022 VS. 2021
MEDIAN
PRICE SCHOOL DISTRICT Q4 2022 Q4 2021
CHANGE FULL YEAR 2022 FULL YEAR 2021 % CHANGE
BREWSTER $455,000 $452,500 1% $450,000 $405,000 11% CARMEL $410,000 $405,000 1% $415,501 $375,000 11% GARRISON $925,000 $891,000 4% $770,750 $947,500 -19% HALDANE $640,000 $584,000 10% $760,000 $585,000 30%
LAKELAND $535,500 $667,500 -20% $525,000 $443,000 19% MAHOPAC $540,000 $500,250 8% $540,000 $500,000 8% PUTNAM VALLEY $430,000 $400,000 8% $452,000 $396,500 14% Putnamcounty $479,900 $455,750 5% $486,500 $440,000 11% Source: Onekey MLS, Single-family homes, Zone 9
SINGLE FAMILY HOMES
BREWSTER, CARMEL, GARRISON, HALDANE, LAKELAND, MAHOPAC, PUTNAM VALLEY
Click on a School district to obtain the latest monthly market report.

SUPPLY DEMAND ANALYSIS
AS OF DECEMBER 31, 2022
AS OF DECEMBER 31, 2021 2022 vs. 2021
PRICE RANGE
SUPPLY: ACTIVE LISTINGS
DEMAND: PENDING SALES
SUPPLY/ DEMAND RATIO*
SUPPLY: ACTIVE LISTINGS
DEMAND: PENDING SALES
SUPPLY/ DEMAND RATIO*
% CHANGE IN LISTINGS
% CHANGE IN PENDINGS
$0 - $299,999 16 23 1 22 31 1 -27.3% -25.8% $300,000 -$399,999 28 38 1 34 47 1 -17.6% -19.1% $400,000 - $499,999 28 37 1 27 48 1 3.7% -22.9% $500,000 - $599,999 30 17 2 27 28 1 11.1% -39.3%
$600,000 - $799,999 36 31 1 31 38 1 16.1% -18.4% $800,000 - $999,999 21 15 1 15 12 1 40.0% 25.0% $1,000,000 - $1,999,999 18 2 9 19 6 3 -5.3% -66.7% $2,000,000 and up 8 1 8 13 2 7 -38.5% -50.0% MarketTotals
TEN-YEAR MARKET HISTORY
PUTNAM COUNTY
185 164 1 188 212 1 -1.6% -22.6% *Supply Demand Ratio Key 1-4: High Demand 5-6: Balanced 7-9: Low Demand 10+: Very Low Demand
Average Sale Price $358,266 $362,883 $354,312 $358,374 $367,059 $390,203 $381,140 $433,668 $498,629 $541,021 Average Sale Price Average Price/SqFt $173 $175 $174 $176 $183 $195 $197 $210 $246 $267 Average Price/SqFt Days On Market 160 142 136 123 112 90 77 79 58 48 Days On Market %Sale Price to List Price 94.7 94.9 95.8 96.5 96.8 97.4 97.5 97.6 99.9 100.4 %Sale Price to List Price
*
Source: Onekey MLS, Single-family homes, Zone 9
Homes sold for 2022 are annualized based on actual sales year-to-date.
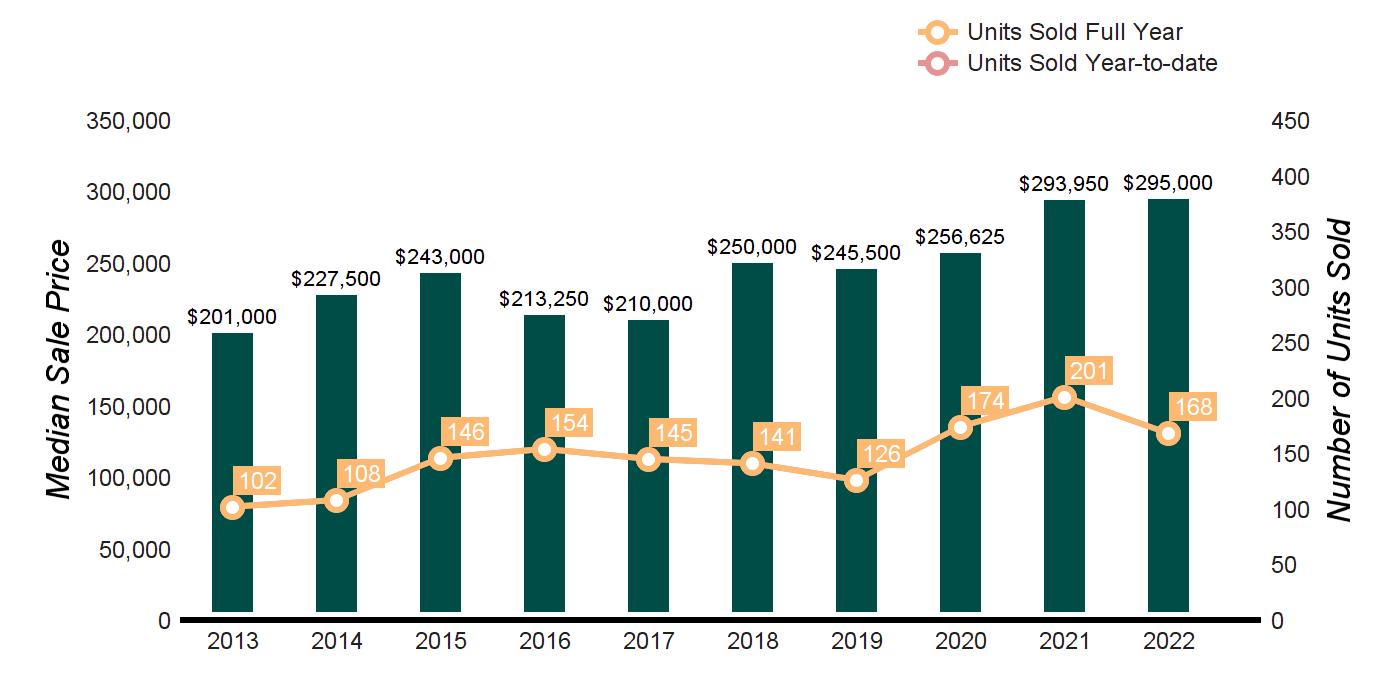
AVERAGE SALE PRICE $311,610 $328,719 -5.2% $317,437 $296,474 7.1% MEDIAN SALE PRICE $294,000 $315,000 -6.7% $295,000 $293,950 0.4% AVERAGE PRICE PER SQUARE FOOT $233 $219 6.4% $241 $215 12.1% AVERAGE DAYS ON MARKET 34 37 -8.1% 41 46 -10.9%
COUNTY
PUTNAM
CONDOMINIUMS
Q4
QUARTERLY MARKET OVERVIEW Q4 2022
2021 % CHANGE FULL YEAR 2022 FULL YEAR 2021 % CHANGE UNITS SOLD 32 43 -25.6% 168 201 -16.4%
PRICE TO LIST PRICE
SUPPLY DEMAND ANALYSIS AS OF DECEMBER 31, 2022 AS OF DECEMBER 31, 2021 2022 vs. 2021 PRICE RANGE SUPPLY: ACTIVE LISTINGS DEMAND: PENDING SALES SUPPLY/ DEMAND RATIO* SUPPLY: ACTIVE LISTINGS DEMAND: PENDING SALES SUPPLY/ DEMAND RATIO* % CHANGE IN LISTINGS % CHANGE IN PENDINGS
3 7 1 10 24 1
7 14 1 5
1 0
0
0
0 0
Valid
2 0
0
Valid
0 0
14 21
17
*Supply Demand Ratio Key 1-4: High Demand 5-6: Balanced 7-9: Low Demand 10+: Very Low Demand TEN-YEAR MARKET HISTORY Average Sale Price $229,906 $254,240 $279,172 $246,529 $241,929 $276,336 $253,968 $262,118 $296,474 $317,437 Average Sale Price Average Price/SqFt $158 $163 $176 $166 $168 $194 $187 $203 $215 $241 Average Price/SqFt Days On Market 197 116 124 121 88 76 64 82 46 41 Days On Market %Sale Price to List Price 95.8 95.8 97.0 97.4 96.9 98.4 98.1 97.9 99.7 101.0 %Sale Price to List Price
*
% SALE
101.7 100.2 1.5% 101.0 99.7 1.3%
$0 - $299,999
-70.0% -70.8% $300,000 -$399,999
17 1 40.0% -17.6% $400,000 - $499,999
Not Valid
1 0 0.0% -100.0% $500,000 - $599,999 1
Not Valid
Not
0.0% 0.0% $600,000 - $799,999
Not Valid 1
Not
100.0% 0.0% $800,000 - $999,999
Not Valid 0 0 Not Valid 0.0% 0.0% $1,000,000 - $1,999,999 0 0 Not Valid 1 0 Not Valid -100.0% 0.0% $2,000,000 and up 0 0 Not Valid 0 0 Not Valid 0.0% 0.0% MarketTotals
1
42 1 -17.6% -50.0%
Source: Onekey MLS, Condominiums
Homes sold for 2022 are annualized based on actual sales year-to-date.
$0 - $299,999 81 48 2 93 104 1 -12.9% -53.8% $300,000 -$399,999 107 91 1 84 166 1 27.4% -45.2% $400,000 - $499,999 92 63 1 67 91 1 37.3% -30.8% $500,000 - $599,999 58 33 2 38 36 1 52.6% -8.3% $600,000 - $799,999 79 42 2 49 43 1 61.2% -2.3% $800,000 - $999,999 33 9 4 24 8 3 37.5% 12.5% $1,000,000 - $1,999,999 50 12 4 38 18 2 31.6% -33.3% $2,000,000 and up 22 5 4 20 10 2 10.0% -50.0% MarketTotals 522 303 2 413 476 1 26.4% -36.3% *Supply Demand Ratio Key 1-4: High Demand 5-6: Balanced 7-9: Low Demand 10+: Very Low Demand TEN-YEAR MARKET HISTORY
DUTCHESS COUNTY SINGLE FAMILY HOMES
OVERVIEW
Q4
%
PER SQUARE FOOT
% SALE PRICE TO LIST PRICE
DEMAND ANALYSIS AS OF DECEMBER 31, 2022 AS OF DECEMBER 31,
PRICE RANGE SUPPLY: ACTIVE LISTINGS DEMAND: PENDING SALES SUPPLY/ DEMAND RATIO* SUPPLY: ACTIVE LISTINGS DEMAND: PENDING SALES SUPPLY/ DEMAND RATIO* % CHANGE IN LISTINGS % CHANGE IN PENDINGS
QUARTERLY MARKET
Q4 2022
2021
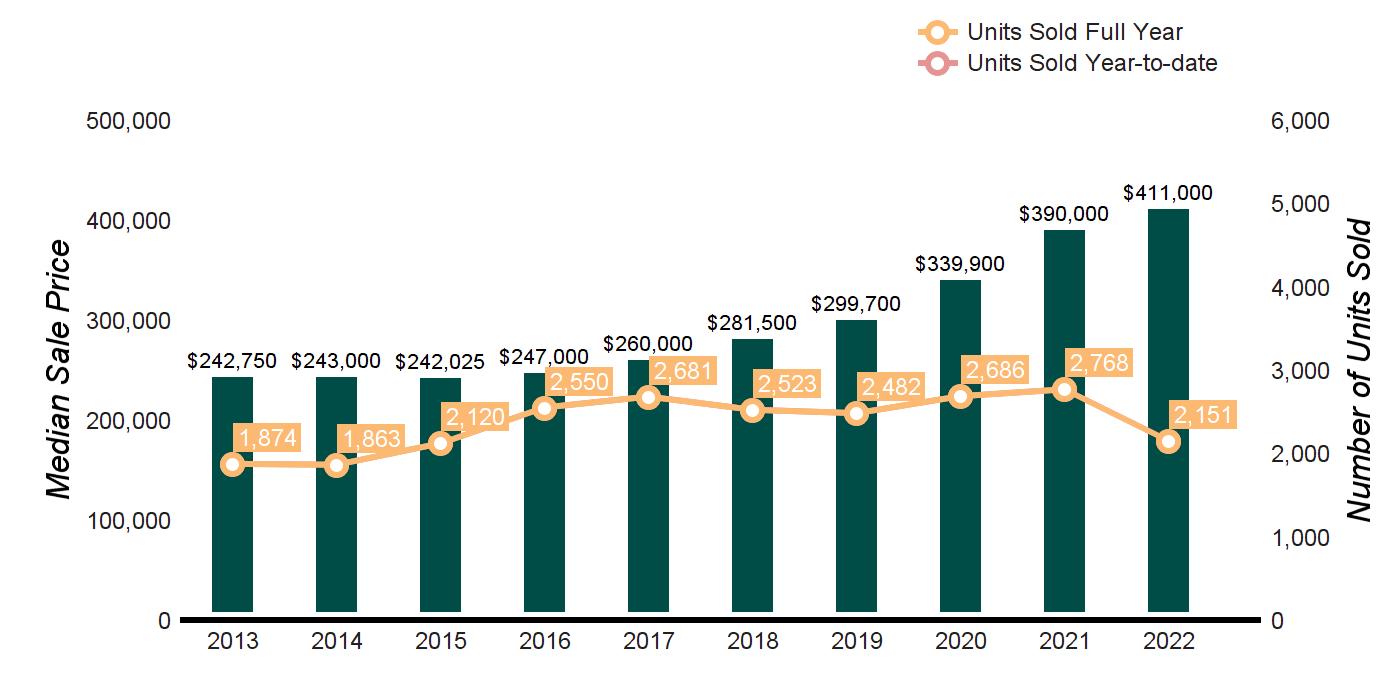
CHANGE FULL YEAR 2022 FULL YEAR 2021 % CHANGE HOMES SOLD 518 674 -23.1% 2151 2768 -22.3% AVERAGE SALE PRICE $475,748 $477,782 -0.4% $509,267 $474,640 7.3% MEDIAN SALE PRICE $397,750 $395,500 0.6% $411,000 $390,000 5.4% AVERAGE PRICE
$226 $224 0.9% $247 $321 -23.1%
98.6 100.9 -2.3% 99.3 99.9 -0.6% SUPPLY
2021 2022 vs. 2021
Average Sale Price $296,375 $287,420 $282,862 $286,860 $298,238 $331,954 $334,166 $419,851 $474,640 $509,267 Average Sale Price Average Price/SqFt $137 $133 $133 $135 $146 $156 $164 $189 $216 $234 Average Price/SqFt Days On Market 180 171 171 173 156 149 141 139 129 105 Days On Market %Sale Price to List Price 94.3 93.7 94.9 96.1 96.8 97.2 97.0 98.6 99.9 99.3 %Sale Price to List Price
Source: Mid-Hudson Multiple Listing Service, Residential-detached homes. * Homes sold for 2022 are annualized based on actual sales year-to-date.
SINGLE FAMILY HOMES
HOMES SOLD
TOWN/CITY
BEACON 19 29 -35% 91 127 -28%
EAST FISHKILL 57 73 -22% 225 309 -27%
FISHKILL 21 23 -9% 106 113 -6%

LA GRANGE 38 42 -10% 161 207 -22%
POUGHKEEPSIE TWP 72 118 -39% 353 464 -24%
POUGHKEEPSIE CITY 37 39 -5% 131 154 -15%
WAPPINGER 39 53 -26% 138 208 -34%
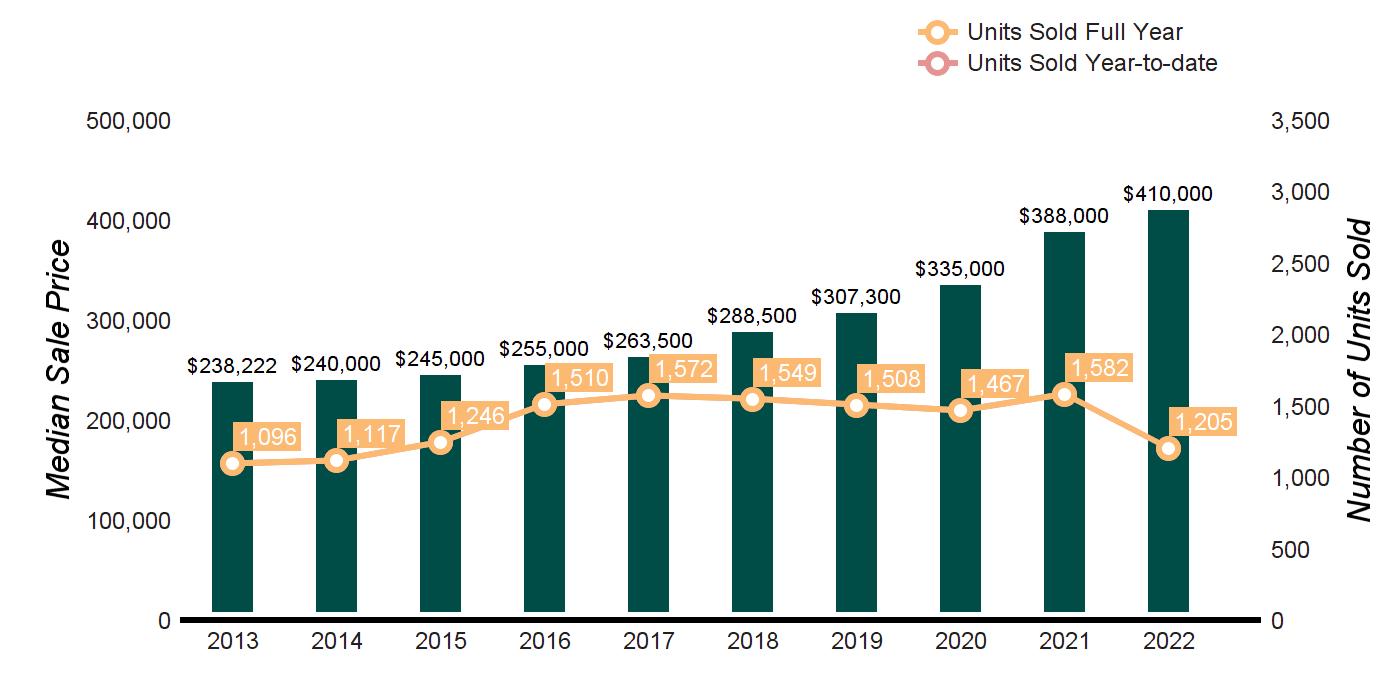
SouthwestDutchess 283 377 -25% 1205 1582 -24%


CLICK TO OBTAIN A SPECIFIC TOWN/CITY MONTHLY MARKET REPORT.
BEACON EAST FISHKILL FISHKILL LA GRANGE
HOMES
SOLD 2022 VS. 2021
Q4 2022 Q4 2021 % CHANGE FULL YEAR 2022 FULL YEAR 2021 % CHANGE
25%
SOUTHWEST DUTCHESS
POUGHKEEPSIE AREA Preview all our HD Videos of Westchester, Putnam and Dutchess houlihanlawrence.com/communities
Q4 2022 Q4 2021 % CHANGE FULL YEAR 2022 FULL YEAR 2021 % CHANGE
24%
POUGHKEEPSIE TWP POUGHKEEPSIE CITY WAPPINGER 6%
AVERAGE SALE PRICE 2022 VS. 2021
AVERAGE SALE PRICE
TOWN/CITY
BEACON
9%
$450,000 $462,000 -3% $525,000 $420,000
EAST FISHKILL $525,000 $501,000 5% $509,750 $469,000
FISHKILL $415,000 $395,000 5% $437,500 $410,000 7% LA GRANGE $420,000 $405,750 4% $439,000 $400,465 10%
POUGHKEEPSIE TWP $352,750 $359,500 -2% $367,500 $350,000 5%
POUGHKEEPSIE CITY $324,900 $325,000 0% $339,200 $290,000 17% WAPPINGER $415,000 $420,000 -1% $426,250 $393,250 8% SouthwestDutchess $400,000 $395,000 1% $410,000 $388,000 6% Source: Mid-Hudson Multiple Listing Service reports the Average Sale Price.
SINGLE FAMILY HOMES
BEACON, EAST FISHKILL, FISHKILL, LA GRANGE, POUGHKEEPSIE TWP, POUGHKEEPSIE CITY,
Click to obtain a specific town/city monthly market report.
SUPPLY DEMAND ANALYSIS
AS OF DECEMBER 31, 2022
PRICE RANGE
SUPPLY: ACTIVE LISTINGS
DEMAND: PENDING SALES
SUPPLY/ DEMAND RATIO*
SUPPLY: ACTIVE LISTINGS
WAPPINGER
AS OF DECEMBER 31, 2021 2022 vs. 2021
DEMAND: PENDING SALES
SUPPLY/ DEMAND RATIO*
% CHANGE IN LISTINGS
% CHANGE IN PENDINGS
$0 - $299,999 38 23 2 44 59 1 -13.6% -61.0% $300,000 -$399,999 64 59 1 46 92 1 39.1% -35.9% $400,000 - $499,999 55 43 1 32 65 1 71.9% -33.8% $500,000 - $599,999 28 20 1 24 21 1 16.7% -4.8% $600,000 - $799,999 45 22 2 22 28 1 104.5% -21.4% $800,000 - $999,999 21 4 5 11 3 4 90.9% 33.3% $1,000,000 - $1,999,999 11 2 6 8 2 4 37.5% 0.0% $2,000,000 and up 2 2 1 0 1 0 0.0% 100.0% MarketTotals
TEN-YEAR MARKET HISTORY
SOUTHWEST DUTCHESS
264 175 2 187 271 1 41.2% -35.4% *Supply Demand Ratio Key 1-4: High Demand 5-6: Balanced 7-9: Low Demand 10+: Very Low Demand
Average Sale Price $265,446 $264,321 $264,243 $275,742 $282,042 $314,304 $323,063 $361,418 $411,024 $447,778 Average Sale Price Average Price/SqFt $130 $126 $128 $133 $141 $152 $163 $178 $203 $223 Average Price/SqFt Days On Market 178 165 164 170 154 144 138 130 125 99 Days On Market %Sale Price to List Price 96.3 96.1 96.5 97.7 98.0 98.9 98.3 99.3 100.9 100.6 %Sale Price to List Price
Source: Mid-Hudson Multiple Listing Service, Residential-detached homes. * Homes sold for 2022 are annualized based on actual sales year-to-date.


SOUTHEAST DUTCHESS SINGLE
Preview
our HD Videos of
and
SOLD
Q4 2022 Q4 2021 % CHANGE FULL YEAR 2022 FULL YEAR 2021 % CHANGE BEEKMAN 20 38 -47% 95 127 -25% DOVER 10 17 -41% 48 47 2% PAWLING 8 15 -47% 41 55 -26% UNION VALE 7 10
44 50
SoutheastDutchess 45 80
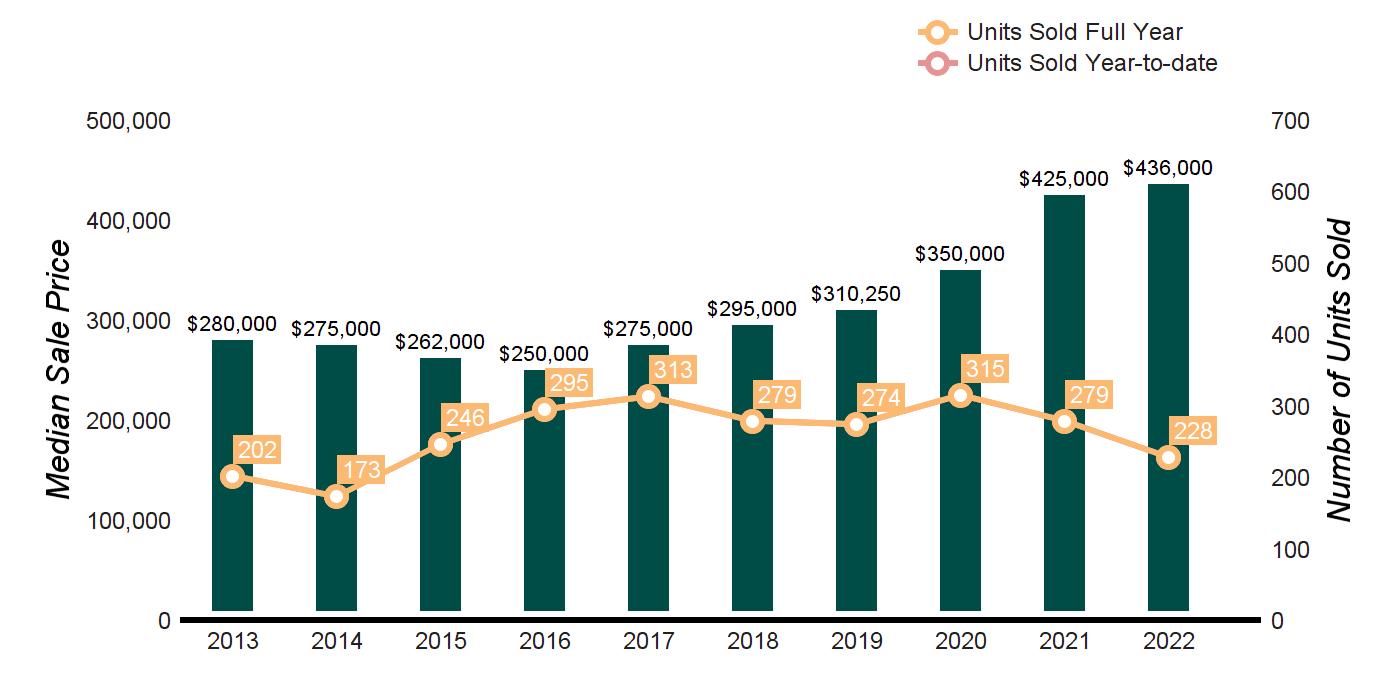
228 279
DOVER PAWLING UNION
HOMES SOLD 2022 VS. 2021 18% AVERAGE SALE PRICE 2022 VS. 2021 3% AVERAGE SALE PRICE TOWN/CITY Q4 2022 Q4 2021 % CHANGE FULL YEAR 2022 FULL YEAR 2021 % CHANGE BEEKMAN $532,500 $444,000 20% $450,000 $450,000 0% DOVER $325,000 $250,000 30% $331,000 $289,750 14% PAWLING $534,450 $436,000 23% $539,900 $436,000 24% UNION VALE $425,000 $480,000 -12% $482,500 $457,500 6% SoutheastDutchess $425,000 $410,000 4% $436,000 $425,000 3%
FAMILY HOMES DUTCHESS COUNTY
all
Westchester, Putnam
Dutchess houlihanlawrence.com/communities HOMES
TOWN/CITY
-30%
-12%
-44%
-18% CLICK TO OBTAIN A SPECIFIC TOWN/CITY MONTHLY MARKET REPORT. BEEKMAN
VALE
Source: Mid-Hudson Multiple Listing Service reports the Average Sale Price.
SINGLE FAMILY HOMES
BEEKMAN, DOVER, PAWLING, UNION VALE
Click to obtain a specific town/city monthly market report.
SUPPLY DEMAND ANALYSIS
AS OF DECEMBER 31, 2022
PRICE RANGE SUPPLY: ACTIVE LISTINGS
DEMAND: PENDING SALES
SUPPLY/ DEMAND RATIO*
SUPPLY: ACTIVE LISTINGS
AS OF DECEMBER 31, 2021 2022 vs. 2021
DEMAND: PENDING SALES
SUPPLY/ DEMAND RATIO*
% CHANGE IN LISTINGS
% CHANGE IN PENDINGS
$0 - $299,999 9 5 2 7 8 1 28.6% -37.5% $300,000 -$399,999 5 8 1 11 17 1 -54.5% -52.9% $400,000 - $499,999 7 5 1 9 15 1 -22.2% -66.7% $500,000 - $599,999 11 4 3 7 7 1 57.1% -42.9% $600,000 - $799,999 13 7 2 12 7 2 8.3% 0.0% $800,000 - $999,999 4 0 Not Valid 1 1 1 300.0% -100.0% $1,000,000 - $1,999,999 6 0 Not Valid 6 1 6 0.0% -100.0% $2,000,000 and up 1 0 Not Valid 4 3 1 -75.0% -100.0% MarketTotals
TEN-YEAR MARKET HISTORY
SOUTHEAST
DUTCHESS
56 29 2 57 59 1 -1.8% -50.8% *Supply Demand Ratio Key 1-4: High Demand 5-6: Balanced 7-9: Low Demand 10+: Very Low Demand
Average Sale Price $327,164 $300,413 $303,007 $290,055 $307,284 $310,391 $334,548 $390,608 $501,923 $494,766 Average Sale Price Average Price/SqFt $143 $131 $134 $130 $134 $157 $155 $178 $212 $213 Average Price/SqFt Days On Market 188 178 195 187 167 156 140 146 135 119 Days On Market %Sale Price to List Price 93.6 95.4 94.1 94.3 95.9 96.2 95.9 97.2 98.8 99.2 %Sale Price to List Price
Source: Mid-Hudson Multiple Listing Service, Residential-detached homes. * Homes sold for 2022 are annualized based on actual sales year-to-date.
HOMES


NORTHWEST DUTCHESS SINGLE
all our HD Videos of
and
FAMILY HOMES DUTCHESS COUNTY Preview
Westchester, Putnam
Dutchess houlihanlawrence.com/communities
Q4 2022 Q4 2021 % CHANGE FULL YEAR 2022 FULL YEAR 2021 % CHANGE
12 9 33% 53 51 4%
52 53 -2% 177 227 -22%
8 7 14% 29 26 12%
24 28 -14% 83 113 -27%
16 22
61 88
15 30
64 120
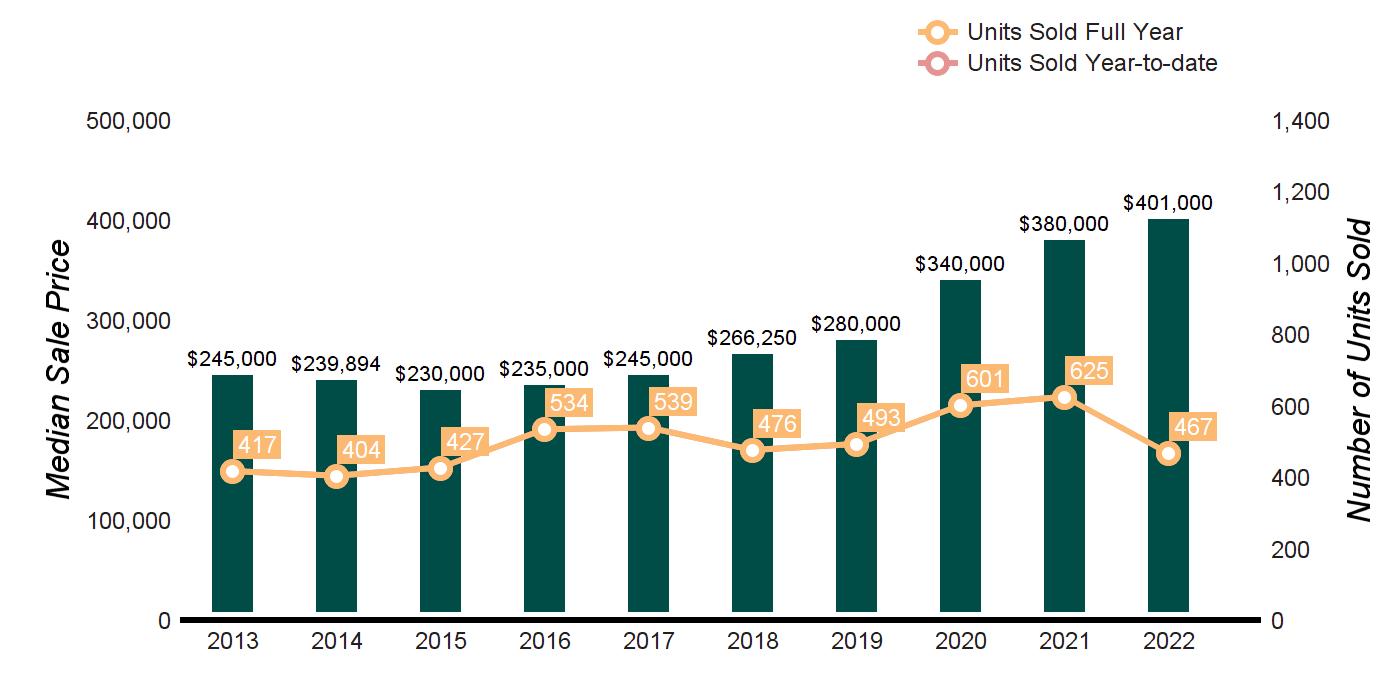
NorthwestDutchess 127 149 -15% 467 625 -25%
SOLD 2022 VS. 2021 25% AVERAGE SALE PRICE 2022 VS. 2021 6%
SALE PRICE
Q4 2022 Q4 2021 % CHANGE FULL YEAR 2022 FULL YEAR 2021 % CHANGE
$470,000 $385,000 22% $650,000 $460,000 41%
$312,500 $313,000 0% $325,000 $300,000 8%
$453,000 $650,000 -30% $605,000 $617,500 -2%
$392,000 $377,500 4% $389,000 $368,750 6%
$386,000 $486,750 -21% $500,000 $457,000 9%
$862,500 $699,500 23% $725,000 $675,500 7% NorthwestDutchess $385,000 $394,000 -2% $401,000 $380,000 6%
SOLD TOWN/CITY
CLINTON
HYDE PARK
MILAN
PLEASANT VALLEY
RED HOOK
-27%
-31% RHINEBECK
-50%
-47%
CLICK TO OBTAIN A SPECIFIC TOWN/CITY MONTHLY MARKET REPORT. CLINTON HYDE PARK MILAN PLEASANT VALLEY RED HOOK RHINEBECK HOMES
AVERAGE
TOWN/CITY
CLINTON
HYDE PARK
MILAN
PLEASANT VALLEY
RED HOOK
RHINEBECK
Source: Mid-Hudson Multiple Listing Service reports the Average Sale Price.
SINGLE FAMILY HOMES
CLINTON, HYDE PARK, MILAN, PLEASANT VALLEY, RED HOOK, RHINEBECK
Click to obtain a specific town/city monthly market report.
SUPPLY DEMAND ANALYSIS
AS OF DECEMBER 31, 2022
AS OF DECEMBER 31, 2021 2022 vs. 2021
PRICE RANGE
SUPPLY: ACTIVE LISTINGS
DEMAND: PENDING SALES
SUPPLY/ DEMAND RATIO*
SUPPLY: ACTIVE LISTINGS
DEMAND: PENDING SALES
SUPPLY/ DEMAND RATIO*
% CHANGE IN LISTINGS
% CHANGE IN PENDINGS
$0 - $299,999 21 17 1 28 28 1 -25.0% -39.3% $300,000 -$399,999 25 13 2 16 38 1 56.3% -65.8% $400,000 - $499,999 16 9 2 15 8 2 6.7% 12.5% $500,000 - $599,999 16 6 3 4 6 1 300.0% 0.0% $600,000 - $799,999 16 11 1 9 6 2 77.8% 83.3% $800,000 - $999,999 5 4 1 6 2 3 -16.7% 100.0% $1,000,000 - $1,999,999 16 6 3 14 9 2 14.3% -33.3% $2,000,000 and up 12 2 6 8 2 4 50.0% 0.0% MarketTotals
TEN-YEAR MARKET HISTORY
NORTHWEST
DUTCHESS
127
68 2 100 99 1 27.0% -31.3% *Supply Demand Ratio Key 1-4: High Demand 5-6: Balanced 7-9: Low Demand 10+: Very Low Demand
Average Sale Price $297,258 $308,849 $282,114 $280,385 $304,969 $343,282 $348,848 $492,055 $530,425 $591,267 Average Sale Price Average Price/SqFt $138 $144 $132 $137 $149 $158 $166 $209 $235 $256 Average Price/SqFt Days On Market 181 176 169 164 153 147 141 143 125 108 Days On Market %Sale Price to List Price 93.6 93.2 94.1 94.8 96.2 95.9 96.1 99.6 100.4 97.6 %Sale Price to List Price
Source: Mid-Hudson Multiple Listing Service, Residential-detached homes. * Homes sold for 2022 are annualized based on actual sales year-to-date.
HOMES


NORTHEAST DUTCHESS
SINGLE FAMILY HOMES DUTCHESS COUNTY Preview all our HD Videos of Westchester, Putnam and Dutchess houlihanlawrence.com/communities
SOLD
Q4 2022 Q4 2021 % CHANGE FULL YEAR 2022 FULL YEAR 2021 % CHANGE
8 9 -11% 41 46 -11%
4 5 -20% 14 15 -7%
6 5 20% 22 23 -4% STANFORD 11 9 22% 35 48
WASHINGTON 12 12 0% 36 49
NortheastDutchess 41 40 3% 148 181
PINE
STANFORD
HOMES SOLD 2022 VS. 2021 18% AVERAGE SALE PRICE 2022 VS. 2021 2% AVERAGE SALE PRICE
Q4 2022 Q4 2021 % CHANGE FULL YEAR 2022 FULL YEAR 2021 % CHANGE
$320,500 $329,900 -3% $362,500 $287,500 26% NORTH EAST $269,000 $621,000 -57% $372,500 $450,000 -17% PINE PLAINS $331,600 $506,500 -35% $348,250 $330,000 6% STANFORD $605,000 $530,000 14% $600,000 $450,000 33% WASHINGTON $483,150 $575,000 -16% $753,750 $785,000 -4% NortheastDutchess $418,000 $525,000 -20% $432,500 $442,500 -2%
TOWN/CITY
AMENIA
NORTH EAST
PINE PLAINS
-27%
-27%
-18% CLICK TO OBTAIN A SPECIFIC TOWN/CITY MONTHLY MARKET REPORT. AMENIA NORTH EAST
PLAINS
WASHINGTON
TOWN/CITY
AMENIA
Source: Mid-Hudson Multiple Listing Service reports the Average Sale Price.
SINGLE FAMILY HOMES
AMENIA, NORTH EAST, PINE PLAINS, STANFORD, WASHINGTON
Click to obtain a specific town/city monthly market report.
SUPPLY DEMAND ANALYSIS
AS OF DECEMBER 31, 2022
PRICE RANGE SUPPLY: ACTIVE LISTINGS
DEMAND: PENDING SALES
SUPPLY/ DEMAND RATIO*
SUPPLY: ACTIVE LISTINGS
AS OF DECEMBER 31, 2021 2022 vs. 2021
DEMAND: PENDING SALES
SUPPLY/ DEMAND RATIO*
% CHANGE IN LISTINGS
% CHANGE IN PENDINGS
$0 - $299,999 11 2 6 11 5 2 0.0% -60.0% $300,000 -$399,999 10 5 2 4 7 1 150.0% -28.6% $400,000 - $499,999 9 4 2 5 2 3 80.0% 100.0% $500,000 - $599,999 2 2 1 1 0 Not Valid 100.0% 0.0% $600,000 - $799,999 4 2 2 6 2 3 -33.3% 0.0% $800,000 - $999,999 3 0 Not Valid 4 2 2 -25.0% -100.0% $1,000,000 - $1,999,999 16 4 4 9 6 2 77.8% -33.3% $2,000,000 and up
TEN-YEAR MARKET HISTORY

NORTHEAST
DUTCHESS
62 20
48
7 1 7 8 4 2 -12.5% -75.0% MarketTotals
3
28 2 29.2% -28.6% *Supply Demand Ratio Key 1-4: High Demand 5-6: Balanced 7-9: Low Demand 10+: Very Low Demand
Average Sale Price $567,693 $463,158 $472,708 $439,423 $430,139 $553,985 $432,414 $684,243 $831,763 $836,715 Average Sale Price Average Price/SqFt $190 $167 $188 $166 $201 $197 $179 $222 $271 $280 Average Price/SqFt Days On Market 197 208 212 212 193 198 186 191 162 130 Days On Market %Sale Price to List Price 87.9 80.5 88.9 91.3 92.6 92.0 91.1 95.3 96.2 97.1 %Sale Price to List Price Source:
Mid-Hudson Multiple Listing Service, Residential-detached homes. * Homes sold for 2022 are annualized based on actual sales year-to-date.
AVERAGE SALE PRICE $295,125 $264,879 11.4% $293,198 $266,743 9.9% MEDIAN SALE PRICE $271,000 $231,056 17.3% $270,000 $235,000 14.9% AVERAGE PRICE PER SQUARE FOOT $214 $201 6.5% $212 $192 10.4% AVERAGE DAYS ON MARKET 95 113 -15.9% 97 127 -23.6%

COUNTY
DUTCHESS
CONDOMINIUMS
Q4
QUARTERLY MARKET OVERVIEW Q4 2022
2021 % CHANGE FULL YEAR 2022 FULL YEAR 2021 % CHANGE UNITS SOLD 110 152 -27.6% 514 628 -18.2%
TO LIST PRICE
SUPPLY DEMAND ANALYSIS AS OF DECEMBER 31, 2022 AS OF DECEMBER 31, 2021 2022 vs. 2021 PRICE RANGE SUPPLY: ACTIVE LISTINGS DEMAND: PENDING SALES SUPPLY/ DEMAND RATIO* SUPPLY: ACTIVE LISTINGS DEMAND: PENDING SALES SUPPLY/ DEMAND RATIO* % CHANGE IN LISTINGS % CHANGE IN PENDINGS
34 36 1 35 67 1
Valid
75 56 1 62 106
*Supply Demand Ratio Key 1-4: High Demand 5-6: Balanced 7-9: Low Demand 10+: Very Low Demand TEN-YEAR MARKET HISTORY Average Sale Price $205,732 $205,677 $191,248 $196,896 $195,776 $208,519 $218,425 $249,159 $266,743 $293,198 Average Sale Price Average Price/SqFt $140 $135 $132 $131 $139 $146 $153 $172 $192 $212 Average Price/SqFt Days On Market 209 178 174 159 137 149 146 131 127 97 Days On Market %Sale Price to List Price 96.7 97.3 96.8 97.5 96.4 98.5 98.3 98.2 98.7 100.8 %Sale Price to List Price
Multiple Listing Service, Residential-attached homes. * Homes sold
2022 are annualized based
% SALE PRICE
99.0 99.6 -0.6% 100.8 98.7 2.1%
$0 - $299,999
-2.9% -46.3% $300,000 -$399,999 9 11 1 9 18 1 0.0% -38.9% $400,000 - $499,999 5 5 1 11 15 1 -54.5% -66.7% $500,000 - $599,999 1 3 1 4 3 1 -75.0% 0.0% $600,000 - $799,999 17 0 Not
2 2 1 750.0% -100.0% $800,000 - $999,999 5 1 5 0 1 0 0.0% 0.0% $1,000,000 - $1,999,999 4 0 Not Valid 1 0 Not Valid 300.0% 0.0% $2,000,000 and up 0 0 Not Valid 0 0 Not Valid 0.0% 0.0% MarketTotals
1 21.0% -47.2%
Source: Mid-Hudson
for
on actual sales year-to-date.
4 GLOBAL NETWORKS – REACHING 56 COUNTRIES & 6 CONTINENTS
Christie’s International Real Estate Leading Real Estates Companies of the World | Luxury Portfolio International Mayfair International Realty | Board of Regents Luxury Real Estate


