Market Report
Q2-2023
WESTCHESTER, PUTNAM & DUTCHESS
EXECUTIVE SUMMARY
Houlihan Lawrence is fortunate to operate within the thriving markets north of New York City. The region offers exceptional housing choices, making it accessible to a broad range of buyers. The cultural richness, abundance of parks, proximity to beaches, and recreational opportunities in our counties is unparalleled. As a result, our strong demand for housing over the decades has remained constant, with a few exceptions.
The real estate market in Westchester, Putnam and Dutchess County faced heightened challenges during the second quarter of 2023, characterized by low inventory levels and the impact of an abrupt increase in mortgage interest rates. A significant majority of homeowners with mortgages are currently paying below the historical average rate of 6.7%, the highest observed in 20 years. This thwarted the trade up, trade down activity in all our markets and further exacerbated the already low levels of properties for sale. The limited inventory of homes, including luxury properties, continued to create strong competition among buyers and led to upward pressure on prices, in many areas. Some locations did start to see the median price decline, where more units sold at lower price levels and fewer at the high end.
This environment has resulted in a beneficial situation for homeowners who decide to sell. Additionally, with mortgage rates currently stabilizing, they are becoming more inclined to make a move. At all price points, sellers are often able to realize top dollar for their properties, when properly priced, and potentially achieve significant returns on their real estate investments.
As the market leader north of New York City, Houlihan Lawrence is uniquely positioned to assist home buyers and sellers navigate this challenging market and, as always, we are grateful for your continued support.
With Warm Regards,
Liz Nunan President and CEO
Q2-2023
REPORT
MARKET




914.220.7000 · HOULIHANLAWRENCE.COM LIST WITH CONFIDENCE. PUT THE POWER OF #1 TO WORK FOR YOU. PROUDLY CLOSED NEARLY $8 BILLION IN SALES AND REPRESENTED OVER 7,000 BUYERS AND SELLERS IN 2022 BROKERAGE NORTH OF NYC Source: OKMLS, MHMLS, CGNDMLS, SMARTMLS, 1/1/2022 – 12/31/2022, total dollar volume of single family homes sold by company, Westchester, Putnam, Dutchess, Columbia and Fairfield Counties combined. Source: 1/1/2022 - 12/31/2022 total sales both on and off MLS
WESTCHESTER COUNTY
SingleFamilyHomeOverview
NEW YORK CITY GATEWAY
MountVernon,NewRochelle,Pelham,Yonkers
LOWER WESTCHESTER
Bronxville,Eastchester,Edgemont,Scarsdale, Tuckahoe
THE RIVERTOWNS
Ardsley,BriarcliffManor,DobbsFerry,Elmsford, Hastings,Irvington,MountPleasant,Ossining, Pleasantville,PocanticoHills,Tarrytown
GREATER WHITE PLAINS
Greenburgh,Valhalla,WhitePlains
THE SOUND SHORE
BlindBrook,Harrison,Mamaroneck,Port Chester,RyeCity,RyeNeck
TABLE OF CONTENTS
SECOND QUARTER 2023
NORTHERN WESTCHESTER

Bedford,ByramHills,Chappaqua,KatonahLewisboro,NorthSalem,Somers
NORTHWEST WESTCHESTER
Croton-Harmon,HendrickHudson,Lakeland, Peekskill,Yorktown
WESTCHESTER COUNTY
CondominiumOverview
WESTCHESTER COUNTY
Co-OperativeOverview
PUTNAM COUNTY
Brewster,Carmel,Garrison,Haldane,Mahopac, PutnamValley
PUTNAM COUNTY
CondominiumOverview
DUTCHESS COUNTY
SingleFamilyHomeOverview
SOUTHEAST DUTCHESS
Beekman,Dover,Pawling,UnionVale
SOUTHWEST DUTCHESS
Beacon,EastFishkill,Fishkill,LaGrange, Poughkeepsie,Poughkeepsie/City,Wappinger
NORTHEAST DUTCHESS
Amenia,NorthEast,PinePlains,Stanford, Washington
NORTHWEST DUTCHESS
Clinton,HydePark,Milan,PleasantValley,Red Hook,Rhinebeck
DUTCHESS COUNTY
CondominiumOverview

HOULIHANLAWRENCE.COM
WESTCHESTER COUNTY
SINGLE FAMILY HOMES
* Homes sold for
are annualized based on actual sales year-to-date.

QUARTERLY MARKET OVERVIEW Q2 2023 Q2 2022 % CHANGE YTD 2023 YTD 2022 % CHANGE HOMES SOLD 1204 1593 -24.4% 2048 2852 -28.2% AVERAGE SALE PRICE $1,132,585 $1,226,077 -7.6% $1,098,403 $1,123,752 -2.3% MEDIAN SALE PRICE $844,000 $880,000 -4.1% $812,500 $810,000 0.3% AVERAGE PRICE PER SQUARE FOOT $430 $427 0.7% $414 $405 2.2% % SALE PRICE TO LIST PRICE 102.6 104.6 -1.9% 100.9 102.9 -1.9% SUPPLY DEMAND ANALYSIS AS OF JUNE 30, 2023 AS OF JUNE 30, 2022 2023 vs. 2022 PRICE RANGE SUPPLY: ACTIVE LISTINGS DEMAND: PENDING SALES SUPPLY/ DEMAND RATIO* SUPPLY: ACTIVE LISTINGS DEMAND: PENDING SALES SUPPLY/ DEMAND RATIO* % CHANGE IN LISTINGS % CHANGE IN PENDINGS $0 - $499,999 78 122 1 120 162 1 -35.0% -24.7% $500,000 - $699,999 153 286 1 334 390 1 -54.2% -26.7% $700,000 - $999,999 198 353 1 345 420 1 -42.6% -16.0% $1,000,000 - $1,499,999 137 239 1 195 288 1 -29.7% -17.0% $1,500,000 - $1,999,999 109 135 1 115 164 1 -5.2% -17.7% $2,000,000 - $2,499,999 38 56 1 60 60 1 -36.7% -6.7% $2,500,000 - $2,999,999 52 55 1 62 58 1 -16.1% -5.2% $3,000,000 - $3,999,999 44 43 1 48 57 1 -8.3% -24.6% $4,000,000 and up 82 32 3 90 33 3 -8.9% -3.0% MarketTotals 891 1321 1 1369 1632 1 -34.9% -19.1% *Supply Demand Ratio Key 1-4: High Demand 5-6: Balanced 7-9: Low Demand 10+: Very Low Demand TEN-YEAR MARKET HISTORY Average Sale Price $861,164 $836,478 $818,945 $851,137 $856,530 $850,017 $947,353 $1,041,703 $1,116,014 $1,098,403 Average Sale Price Average Price/SqFt $308 $311 $309 $318 $320 $320 $337 $373 $410 $414 Average Price/SqFt Days On Market 99 94 89 85 75 77 73 49 39 50 Days On Market %Sale Price to List Price 96.7 97.0 97.0 97.4 97.2 96.6 98.1 100.0 102.6 100.9 %Sale Price to List Price
Onekey MLS, SINGLE FAMILY HOMES
Source:
2023
NEW YORK CITY GATEWAY
SINGLE FAMILY HOMES
CLICK ON A SCHOOL DISTRICT FOR THE LATEST MONTHLY MARKET REPORT.


NEW ROCHELLE Preview all our HD Videos of Westchester, Putnam and Dutchess houlihanlawrence.com/communities
SCHOOL DISTRICT Q2 2023 Q2 2022 % CHANGE YTD 2023 YTD 2022 % CHANGE MOUNT VERNON 28 33 -15% 63 70 -10% NEW ROCHELLE 83 102 -19% 134 160 -16% PELHAM 30 36 -17% 45 56 -20% YONKERS 106 129 -18% 207 273 -24% NYCGateway 247 300 -18% 449 559 -20%
HOMES SOLD
MOUNT VERNON NEW ROCHELLE PELHAM YONKERS HOMES SOLD Q 2 - 2023 VS. Q 2 - 2022 18% MEDIAN SALE PRICE Q 2 - 2023 VS. Q 2 - 2022 4% MEDIAN SALE PRICE SCHOOL DISTRICT Q2 2023 Q2 2022 % CHANGE YTD 2023 YTD 2022 % CHANGE MOUNT VERNON $620,000 $639,000 -3% $615,000 $582,000 6% NEW ROCHELLE $865,000 $845,000 2% $843,000 $807,500 4% PELHAM $1,053,000 $1,058,750 -1% $1,085,000 $1,111,250 -2% YONKERS $637,500 $675,000 -6% $625,000 $640,000 -2% NYCGateway $720,000 $747,250 -4% $678,000 $695,000 -2%
Source: Onekey MLS, Single-family homes, Zones 7 & 8
NEW YORK CITY GATEWAY
SINGLE FAMILY HOMES
MOUNT VERNON, NEW ROCHELLE, PELHAM, YONKERS
Click on a School district to obtain the latest monthly market report.
SUPPLY DEMAND ANALYSIS
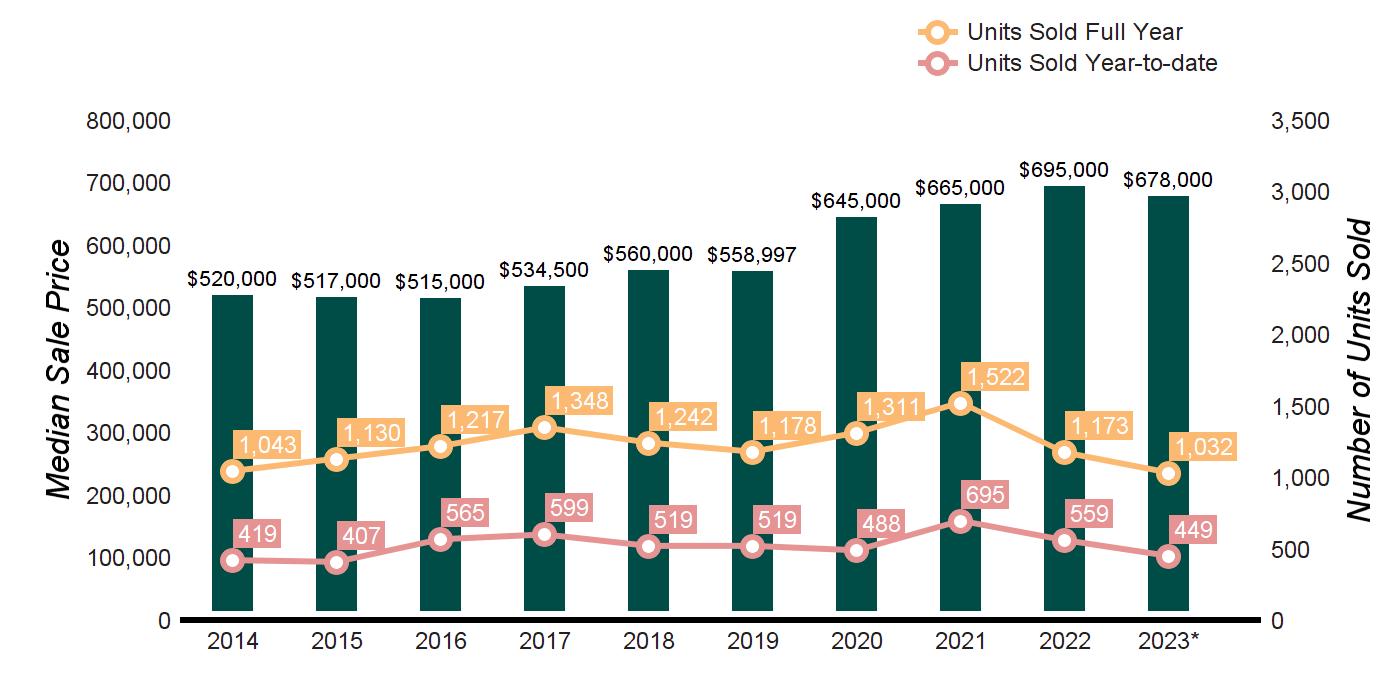
TEN-YEAR MARKET HISTORY
AS OF JUNE 30, 2023 AS OF JUNE 30, 2022 2023 vs. 2022 PRICE RANGE SUPPLY: ACTIVE LISTINGS DEMAND: PENDING SALES SUPPLY/ DEMAND RATIO* SUPPLY: ACTIVE LISTINGS DEMAND: PENDING SALES SUPPLY/ DEMAND RATIO* % CHANGE IN LISTINGS % CHANGE IN PENDINGS $0 - $299,999 1 1 1 3 1 3 -66.7% 0.0% $300,000 -$399,999 8 9 1 10 17 1 -20.0% -47.1% $400,000 - $499,999 18 27 1 32 24 1 -43.8% 12.5% $500,000 - $599,999 31 37 1 50 57 1 -38.0% -35.1% $600,000 - $799,999 57 69 1 98 97 1 -41.8% -28.9% $800,000 - $999,999 21 50 1 48 43 1 -56.3% 16.3% $1,000,000 - $1,999,999 31 39 1 44 48 1 -29.5% -18.8% $2,000,000 and up 17 10 2 13 3 4 30.8% 233.3% MarketTotals 184 242 1 298 290 1 -38.3% -16.6%
*Supply Demand Ratio Key 1-4: High Demand 5-6: Balanced 7-9: Low Demand 10+: Very Low Demand
Average Sale Price $596,124 $603,126 $604,355 $626,880 $643,464 $637,214 $725,426 $770,893 $808,695 $802,653 Average Sale Price Average Price/SqFt $261 $266 $272 $281 $297 $300 $319 $349 $380 $372 Average Price/SqFt Days On Market 102 95 86 86 67 67 67 47 40 54 Days On Market %Sale Price to List Price 96.6 97.4 97.6 98.0 97.7 98.1 98.3 100.2 101.9 100.8 %Sale Price to List Price
Single-family homes, Zones 7 & 8 * Homes sold for 2023 are annualized based on actual sales year-to-date.
Source: Onekey MLS,
SCARSDALE
LOWER WESTCHESTER
SINGLE FAMILY HOMES
HOMES SOLD
houlihanlawrence.com/communities
CLICK ON A SCHOOL DISTRICT FOR THE LATEST MONTHLY MARKET REPORT.

Preview all our HD Videos of Westchester, Putnam and Dutchess
SCHOOL DISTRICT Q2 2023 Q2 2022 % CHANGE YTD 2023 YTD 2022 % CHANGE BRONXVILLE 24 26 -8% 31 43 -28% EASTCHESTER 16 31 -48% 30 55 -46% EDGEMONT 23 21 10% 35 37 -5% SCARSDALE 44 89 -51% 76 123 -38% TUCKAHOE 13 18 -28% 17 33 -49% LowerWestchester 120 185 -35% 189 291 -35%
EDGEMONT SCARSDALE TUCKAHOE HOMES SOLD Q 2 - 2023 VS. Q 2 - 2022 35% MEDIAN SALE PRICE Q 2 - 2023 VS. Q 2 - 2022 8% MEDIAN SALE PRICE SCHOOL DISTRICT Q2 2023 Q2 2022 % CHANGE YTD 2023 YTD 2022 % CHANGE BRONXVILLE $2,475,000 $2,605,000 -5% $2,500,000 $2,690,000 -7% EASTCHESTER $827,500 $849,000 -3% $855,000 $830,000 3% EDGEMONT $1,350,000 $1,347,000 0% $1,350,000 $1,200,000 13% SCARSDALE $2,250,000 $2,050,000 10% $1,975,000 $2,050,000 -4% TUCKAHOE $915,000 $825,000 11% $859,000 $835,000 3% LowerWestchester $1,505,000 $1,635,000 -8% $1,500,000 $1,550,000 -3% Source: Onekey MLS, Single-family homes, Zone 6
BRONXVILLE EASTCHESTER
LOWER WESTCHESTER
SINGLE FAMILY HOMES
BRONXVILLE, EASTCHESTER, EDGEMONT, SCARSDALE, TUCKAHOE
Click on a School district to obtain the latest monthly market report.
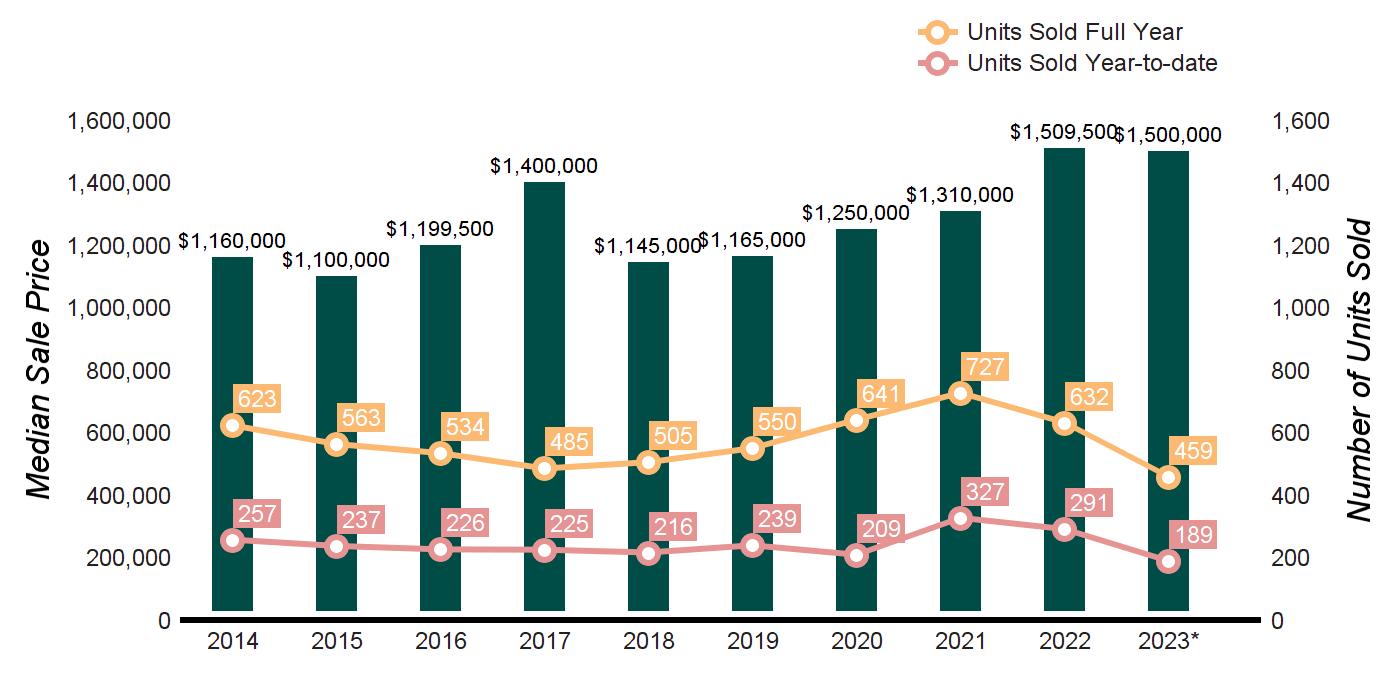
TEN-YEAR MARKET HISTORY
DEMAND ANALYSIS AS OF JUNE 30, 2023 AS OF JUNE 30, 2022 2023 vs. 2022 PRICE RANGE SUPPLY: ACTIVE LISTINGS DEMAND: PENDING SALES SUPPLY/ DEMAND RATIO* SUPPLY: ACTIVE LISTINGS DEMAND: PENDING SALES SUPPLY/ DEMAND RATIO* % CHANGE IN LISTINGS % CHANGE IN PENDINGS $0 - $499,999 0 2 0 0 0 Not Valid 0.0% 0.0% $500,000 - $699,999 0 3 0 8 2 4 -100.0% 50.0% $700,000 - $999,999 17 32 1 30 45 1 -43.3% -28.9% $1,000,000 - $1,499,999 21 43 1 24 48 1 -12.5% -10.4% $1,500,000 - $1,999,999 28 26 1 25 37 1 12.0% -29.7% $2,000,000 - $2,499,999 10 16 1 16 18 1 -37.5% -11.1% $2,500,000 - $2,999,999 11 20 1 19 28 1 -42.1% -28.6% $3,000,000 - $3,999,999 9 16 1 15 23 1 -40.0% -30.4% $4,000,000 and up 23 12 2 26 10 3 -11.5% 20.0% MarketTotals 119 170 1 163 211 1 -27.0% -19.4% *Supply Demand Ratio Key 1-4: High Demand 5-6: Balanced 7-9: Low Demand 10+: Very Low Demand
SUPPLY
Average Sale Price $1,388,882 $1,406,473 $1,463,106 $1,632,159 $1,416,955 $1,399,705 $1,514,451 $1,632,770 $1,787,091 $1,893,349 Average Sale Price Average Price/SqFt $443 $451 $442 $454 $439 $422 $435 $477 $533 $539 Average Price/SqFt Days On Market 76 74 82 92 75 85 83 47 40 51 Days On Market %Sale Price to List Price 97.7 97.6 96.4 96.7 96.1 95.7 97.2 99.7 102.5 99.9 %Sale Price to List Price
6
Source: Onekey MLS, Single-family homes, Zone
* Homes sold for 2023 are annualized based on actual sales year-to-date.
THE RIVERTOWNS
SINGLE FAMILY HOMES
HOMES SOLD
CLICK ON A SCHOOL DISTRICT FOR THE LATEST MONTHLY MARKET REPORT.


RIVERTOWNS Preview all our HD Videos of Westchester, Putnam and Dutchess houlihanlawrence.com/communities
THE
SCHOOL DISTRICT Q2 2023 Q2 2022 % CHANGE YTD 2023 YTD 2022 % CHANGE ARDSLEY 16 34 -53% 36 59 -39% BRIARCLIFF MANOR 13 18 -28% 17 28 -39% DOBBS FERRY 17 19 -11% 24 33 -27% ELMSFORD 7 29 -76% 16 42 -62% HASTINGS 16 21 -24% 29 31 -7% IRVINGTON 14 18 -22% 29 34 -15% MOUNT PLEASANT 14 28 -50% 35 48 -27% OSSINING 33 34 -3% 62 80 -23% PLEASANTVILLE 17 20 -15% 24 43 -44% POCANTICO HILLS 2 3 -33% 5 8 -38% TARRYTOWN 8 14 -43% 17 25 -32% TheRivertowns 157 238 -34% 294 431 -32%
ARDSLEY BRIARCLIFF MANOR DOBBS FERRY ELMSFORD HASTINGS IRVINGTON MOUNT PLEASANT OSSINING PLEASANTVILLE POCANTICO HILLS TARRYTOWN HOMES SOLD Q 2 - 2023 VS. Q 2 - 2022 34% MEDIAN SALE PRICE Q 2 - 2023 VS. Q 2 - 2022 7% MEDIAN SALE PRICE SCHOOL DISTRICT Q2 2023 Q2 2022 % CHANGE YTD 2023 YTD 2022 % CHANGE ARDSLEY $825,000 $787,500 5% $772,500 $750,000 3% BRIARCLIFF MANOR $940,000 $1,222,500 -23% $950,000 $1,153,650 -18% DOBBS FERRY $858,000 $852,500 1% $867,500 $845,000 3% ELMSFORD $525,000 $590,000 -11% $545,000 $590,000 -8% HASTINGS $975,624 $950,000 3% $999,999 $945,000 6% IRVINGTON $927,500 $1,303,000 -29% $1,125,000 $1,275,500 -12% MOUNT PLEASANT $655,000 $688,000 -5% $700,000 $657,500 7% OSSINING $600,000 $614,000 -2% $608,500 $555,000 10% PLEASANTVILLE $839,000 $799,500 5% $747,500 $784,000 -5% POCANTICO HILLS $1,935,000 $1,400,000 38% $862,500 $1,183,750 -27% TARRYTOWN $943,500 $1,100,944 -14% $849,900 $875,000 -3% TheRivertowns $825,000 $771,500 7% $792,500 $730,000 9% Source: Onekey MLS, Single-family homes, Zone 3
THE RIVERTOWNS
SINGLE FAMILY HOMES
ARDSLEY, BRIARCLIFF MANOR, DOBBS FERRY, ELMSFORD, HASTINGS, IRVINGTON, MOUNT PLEASANT
OSSINING, PLEASANTVILLE, POCANTICO HILLS, TARRYTOWN
Click on a School district to obtain the latest monthly market report. SUPPLY
TEN-YEAR MARKET HISTORY
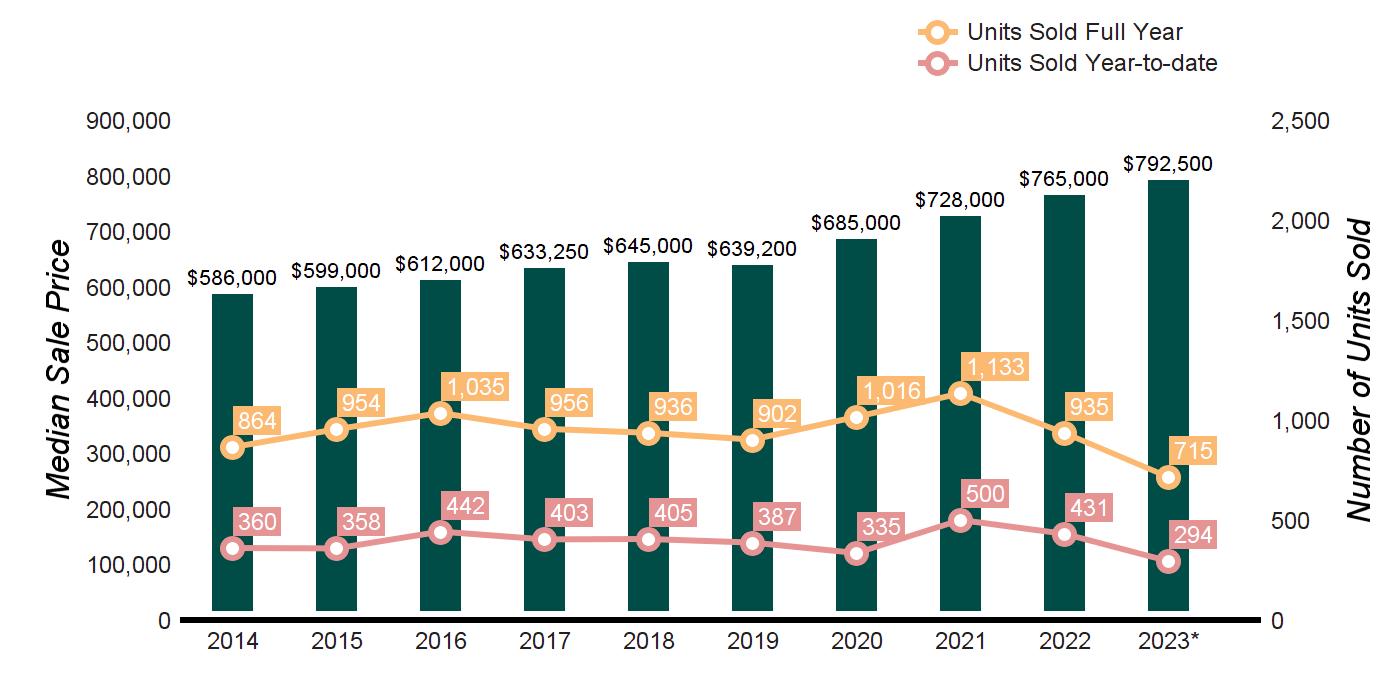
AS OF JUNE 30, 2023 AS OF JUNE 30, 2022 2023 vs. 2022 PRICE RANGE SUPPLY: ACTIVE LISTINGS DEMAND: PENDING SALES SUPPLY/ DEMAND RATIO* SUPPLY: ACTIVE LISTINGS DEMAND: PENDING SALES SUPPLY/ DEMAND RATIO* % CHANGE IN LISTINGS % CHANGE IN PENDINGS $0 - $299,999 0 1 0 1 1 1 -100.0% 0.0% $300,000 -$399,999 1 2 1 4 2 2 -75.0% 0.0% $400,000 - $499,999 11 11 1 12 17 1 -8.3% -35.3% $500,000 - $599,999 16 20 1 33 35 1 -51.5% -42.9% $600,000 - $799,999 24 63 1 57 75 1 -57.9% -16.0% $800,000 - $999,999 18 55 1 34 44 1 -47.1% 25.0% $1,000,000 - $1,999,999 48 64 1 40 61 1 20.0% 4.9% $2,000,000 and up 19 5 4 18 8 2 5.6% -37.5% MarketTotals 137 221 1 199 243 1 -31.2% -9.1% *Supply Demand Ratio Key 1-4: High Demand 5-6: Balanced 7-9: Low
Very Low Demand
DEMAND ANALYSIS
Demand 10+:
Average Sale Price $689,728 $692,908 $705,636 $740,572 $765,251 $732,079 $768,144 $839,444 $898,515 $905,157 Average Sale Price Average Price/SqFt $294 $304 $308 $321 $323 $318 $326 $355 $391 $394 Average Price/SqFt Days On Market 100 91 86 77 67 75 73 50 39 47 Days On Market %Sale Price to List Price 98.2 97.6 98.7 98.9 100.3 97.6 98.5 100.1 103.4 101.4 %Sale Price to List Price Source: Onekey MLS, Single-family homes, Zone 3 * Homes sold for 2023 are annualized based on actual sales year-to-date.
GREATER WHITE PLAINS

SINGLE FAMILY HOMES
CLICK ON A SCHOOL DISTRICT FOR THE LATEST MONTHLY MARKET REPORT.

WHITE PLAINS Preview all our HD Videos of Westchester, Putnam and Dutchess houlihanlawrence.com/communities
SOLD SCHOOL DISTRICT Q2 2023 Q2 2022 % CHANGE YTD 2023 YTD 2022 % CHANGE GREENBURGH 30 53 -43% 52 93 -44% VALHALLA 14 25 -44% 27 39 -31% WHITE PLAINS 51 59 -14% 93 113 -18% GreaterWhitePlains 95 137 -31% 172 245 -30%
HOMES
GREENBURGH VALHALLA WHITE PLAINS HOMES SOLD Q 2 - 2023 VS. Q 2 - 2022 31% MEDIAN SALE PRICE Q 2 - 2023 VS. Q 2 - 2022 2% MEDIAN SALE PRICE SCHOOL DISTRICT Q2 2023 Q2 2022 % CHANGE YTD 2023 YTD 2022 % CHANGE GREENBURGH $691,250 $685,000 1% $691,250 $640,000 8% VALHALLA $717,500 $710,000 1% $675,000 $670,000 1% WHITE PLAINS $885,000 $851,000 4% $878,000 $790,000 11% GreaterWhitePlains $754,000 $742,000 2% $750,000 $699,000 7% Source: Onekey MLS, Single-family homes, Zone 4
GREATER WHITE PLAINS SINGLE
GREENBURGH, VALHALLA, WHITE PLAINS
Click on a School district to obtain the latest monthly market report.

FAMILY HOMES
TEN-YEAR MARKET HISTORY
DEMAND ANALYSIS AS OF JUNE 30, 2023 AS OF JUNE 30, 2022 2023 vs. 2022 PRICE RANGE SUPPLY: ACTIVE LISTINGS DEMAND: PENDING SALES SUPPLY/ DEMAND RATIO* SUPPLY: ACTIVE LISTINGS DEMAND: PENDING SALES SUPPLY/ DEMAND RATIO* % CHANGE IN LISTINGS % CHANGE IN PENDINGS $0 - $299,999 0 0 Not Valid 0 0 Not Valid 0.0% 0.0% $300,000 -$399,999 0 2 0 0 3 0 0.0% -33.3% $400,000 - $499,999 3 10 1 2 3 1 50.0% 233.3% $500,000 - $599,999 3 8 1 15 22 1 -80.0% -63.6% $600,000 - $799,999 19 28 1 34 56 1 -44.1% -50.0% $800,000 - $999,999 7 22 1 11 23 1 -36.4% -4.3% $1,000,000 - $1,999,999 17 21 1 18 20 1 -5.6% 5.0% $2,000,000 and up 2 0 Not Valid 1 0 Not Valid 100.0% 0.0% MarketTotals 51 91 1 81 127 1 -37.0% -28.3% *Supply Demand Ratio Key 1-4: High Demand 5-6: Balanced 7-9: Low Demand 10+: Very Low Demand
SUPPLY
Average Sale Price $594,770 $606,510 $593,753 $624,937 $650,930 $649,190 $692,816 $732,108 $777,058 $821,834 Average Sale Price Average Price/SqFt $272 $284 $290 $300 $305 $308 $323 $351 $378 $394 Average Price/SqFt Days On Market 93 84 84 68 63 71 59 42 33 38 Days On Market %Sale Price to List Price 97.2 97.6 97.6 98.4 98.4 97.8 98.7 100.7 103.2 102.7 %Sale Price to List Price Source: Onekey MLS, Single-family homes, Zone 4 * Homes sold for 2023 are annualized based on actual sales year-to-date.
THE SOUND SHORE
SINGLE FAMILY HOMES
CLICK ON A SCHOOL DISTRICT FOR THE LATEST MONTHLY MARKET REPORT.

THE SOUND SHORE Preview all our HD Videos of Westchester, Putnam and Dutchess houlihanlawrence.com/communities
SCHOOL DISTRICT Q2 2023 Q2 2022 % CHANGE YTD 2023 YTD 2022 % CHANGE BLIND BROOK 25 47 -47% 42 69 -39% HARRISON 41 41 0% 58 80 -28% MAMARONECK 62 77 -20% 97 123 -21% PORT CHESTER 27 35 -23% 43 63 -32% RYE CITY 38 58 -35% 63 82 -23% RYE NECK 12 21 -43% 21 35 -40% TheSoundShore 205 279 -27% 324 452 -28%
BLIND BROOK HARRISON MAMARONECK PORT CHESTER RYE CITY RYE NECK HOMES SOLD Q 2 - 2023 VS. Q 2 - 2022 27% MEDIAN SALE PRICE Q 2 - 2023 VS. Q 2 - 2022 8% MEDIAN SALE PRICE SCHOOL DISTRICT Q2 2023 Q2 2022 % CHANGE YTD 2023 YTD 2022 % CHANGE BLIND BROOK $999,000 $1,100,000 -9% $999,000 $1,068,000 -7% HARRISON $1,699,455 $1,700,000 0% $1,735,603 $1,629,250 7% MAMARONECK $1,774,500 $1,710,000 4% $1,710,000 $1,487,500 15% PORT CHESTER $640,000 $665,000 -4% $630,000 $650,000 -3% RYE CITY $1,785,000 $2,387,500 -25% $1,825,000 $2,232,500 -18% RYE NECK $832,000 $995,000 -16% $1,030,000 $1,100,000 -6% TheSoundShore $1,357,000 $1,475,000 -8% $1,370,000 $1,350,000 2% Source: Onekey MLS, Single-family homes, Zone 5
HOMES SOLD
THE SOUND SHORE
SINGLE FAMILY HOMES
BLIND BROOK, HARRISON, MAMARONECK, PORT CHESTER, RYE CITY, RYE NECK
Click on a School district to obtain the latest monthly market report.
TEN-YEAR MARKET HISTORY
* Homes sold for 2023 are annualized based on actual sales year-to-date.
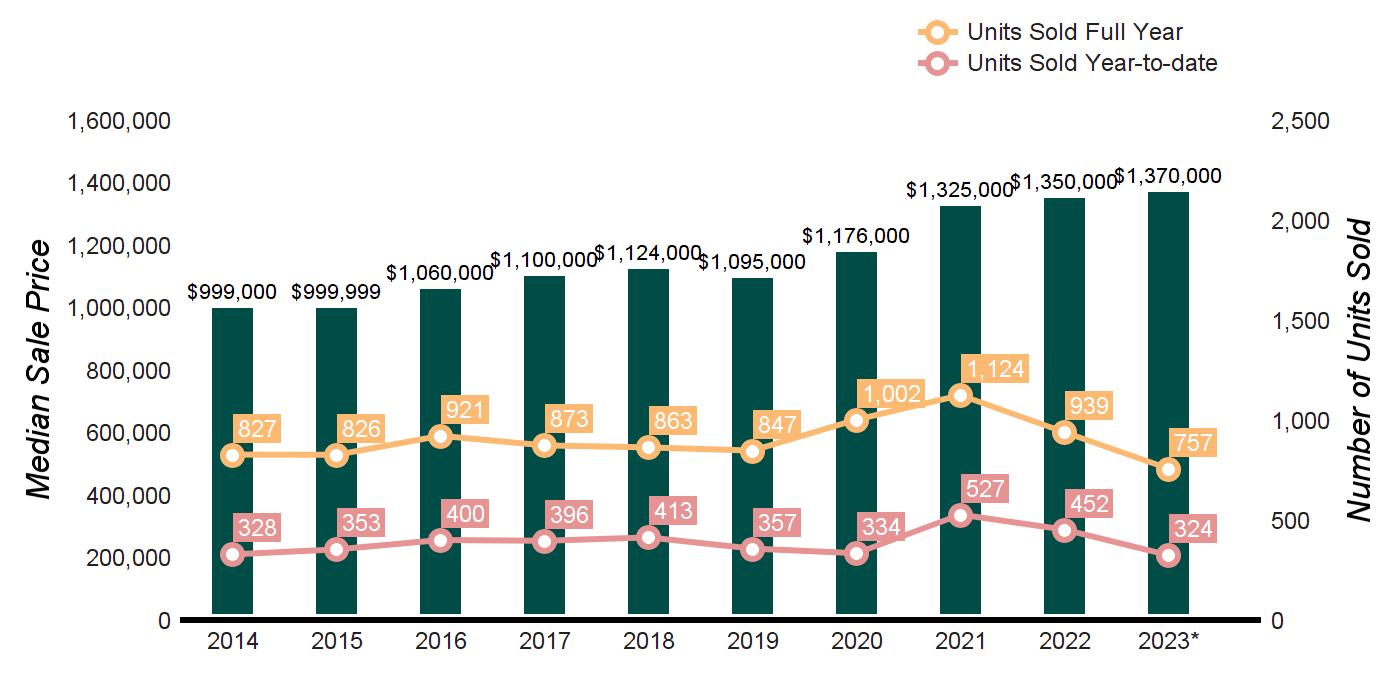
SUPPLY DEMAND ANALYSIS AS OF JUNE 30, 2023 AS OF JUNE 30, 2022 2023 vs. 2022 PRICE RANGE SUPPLY: ACTIVE LISTINGS DEMAND: PENDING SALES SUPPLY/ DEMAND RATIO* SUPPLY: ACTIVE LISTINGS DEMAND: PENDING SALES SUPPLY/ DEMAND RATIO* % CHANGE IN LISTINGS % CHANGE IN PENDINGS $0 - $499,999 1 3 1 5 4 1 -80.0% -25.0% $500,000 - $699,999 8 19 1 26 23 1 -69.2% -17.4% $700,000 - $999,999 19 47 1 31 45 1 -38.7% 4.4% $1,000,000 - $1,499,999 11 41 1 32 63 1 -65.6% -34.9% $1,500,000 - $1,999,999 21 34 1 23 62 1 -8.7% -45.2% $2,000,000 - $2,499,999 8 18 1 16 23 1 -50.0% -21.7% $2,500,000 - $2,999,999 13 19 1 14 20 1 -7.1% -5.0% $3,000,000 - $3,999,999 14 18 1 22 24 1 -36.4% -25.0% $4,000,000 and up 22 13 2 21 12 2 4.8% 8.3% MarketTotals 117 212 1 190 276 1 -38.4% -23.2% *Supply Demand Ratio Key 1-4: High Demand 5-6: Balanced 7-9: Low Demand 10+: Very Low Demand
Average Sale Price $1,298,331 $1,367,114 $1,320,302 $1,353,465 $1,404,302 $1,355,790 $1,472,468 $1,592,056 $1,673,941 $1,658,002 Average Sale Price Average Price/SqFt $418 $434 $431 $436 $429 $422 $447 $484 $519 $542 Average Price/SqFt Days On Market 86 87 77 78 78 81 66 52 38 53 Days On Market %Sale Price to List Price 96.9 96.4 96.7 97.1 95.7 95.9 97.8 100.2 103.4 101.7 %Sale Price to List Price
5
Source: Onekey MLS, Single-family homes, Zone
NORTHERN WESTCHESTER
SINGLE FAMILY HOMES BEDFORD
Preview all our HD Videos of Westchester, Putnam and Dutchess
houlihanlawrence.com/communities
HOMES SOLD
CLICK ON A SCHOOL DISTRICT FOR THE LATEST MONTHLY MARKET REPORT.

SCHOOL DISTRICT Q2 2023 Q2 2022 % CHANGE YTD 2023 YTD 2022 % CHANGE BEDFORD 65 77 -16% 100 130 -23% BYRAM HILLS 25 42 -41% 41 70 -41% CHAPPAQUA 35 61 -43% 59 92 -36% KATONAH LEWISBORO 40 56 -29% 71 106 -33% NORTH SALEM 13 9 44% 19 28 -32% SOMERS 37 39 -5% 62 78 -21% NorthernWestchester 215 284 -24% 352 504 -30%
BEDFORD BYRAM HILLS CHAPPAQUA KATONAH-LEWISBORO NORTH SALEM SOMERS HOMES SOLD Q 2 - 2023 VS. Q 2 - 2022 24% MEDIAN SALE PRICE Q 2 - 2023 VS. Q 2 - 2022 14% MEDIAN SALE PRICE SCHOOL DISTRICT Q2 2023 Q2 2022 % CHANGE YTD 2023 YTD 2022 % CHANGE BEDFORD $965,000 $1,105,000 -13% $975,000 $998,849 -2% BYRAM HILLS $1,550,000 $1,590,000 -3% $1,550,000 $1,489,600 4% CHAPPAQUA $1,276,000 $1,341,000 -5% $1,220,000 $1,317,500 -7% KATONAH LEWISBORO $957,499 $890,000 8% $843,000 $848,750 -1% NORTH SALEM $653,500 $659,000 -1% $652,500 $626,250 4% SOMERS $716,100 $660,000 9% $653,250 $673,500 -3% NorthernWestchester $944,000 $1,090,750 -14% $922,500 $975,000 -5% Source: Onekey MLS, Single-family homes, Zone 2
NORTHERN WESTCHESTER
SINGLE FAMILY HOMES
BEDFORD, BYRAM HILLS, CHAPPAQUA, KATONAH-LEWISBORO, NORTH SALEM, SOMERS
Click on a School district to obtain the latest monthly market report.
TEN-YEAR MARKET HISTORY

SUPPLY DEMAND ANALYSIS AS OF JUNE 30, 2023 AS OF JUNE 30, 2022 2023 vs. 2022 PRICE RANGE SUPPLY: ACTIVE LISTINGS DEMAND: PENDING SALES SUPPLY/ DEMAND RATIO* SUPPLY: ACTIVE LISTINGS DEMAND: PENDING SALES SUPPLY/ DEMAND RATIO* % CHANGE IN LISTINGS % CHANGE IN PENDINGS $0 - $499,999 11 11 1 15 21 1 -26.7% -47.6% $500,000 - $699,999 20 33 1 48 49 1 -58.3% -32.7% $700,000 - $999,999 31 58 1 61 71 1 -49.2% -18.3% $1,000,000 - $1,499,999 32 65 1 56 67 1 -42.9% -3.0% $1,500,000 - $1,999,999 19 34 1 33 32 1 -42.4% 6.3% $2,000,000 - $2,499,999 12 8 2 17 14 1 -29.4% -42.9% $2,500,000 - $2,999,999 15 14 1 20 7 3 -25.0% 100.0% $3,000,000 - $3,999,999 17 9 2 8 8 1 112.5% 12.5% $4,000,000 and up 21 6 4 32 10 3 -34.4% -40.0% MarketTotals 178 238 1 290 279 1 -38.6% -14.7% *Supply Demand Ratio Key 1-4: High Demand 5-6: Balanced 7-9: Low Demand 10+: Very Low Demand
Average Sale Price $1,020,339 $901,858 $868,326 $910,250 $893,432 $897,777 $984,186 $1,176,596 $1,314,679 $1,201,984 Average Sale Price Average Price/SqFt $284 $284 $277 $284 $277 $280 $292 $340 $387 $387 Average Price/SqFt Days On Market 119 110 105 105 96 91 90 54 42 51 Days On Market %Sale Price to List Price 94.8 96.1 95.8 96.0 96.0 94.8 98.1 99.1 101.8 99.6 %Sale Price to List Price
Onekey MLS, Single-family homes, Zone 2
Source:
* Homes sold for 2023 are annualized based on actual sales year-to-date.
Preview all our HD Videos of Westchester, Putnam and Dutchess
houlihanlawrence.com/communities
NORTHWEST WESTCHESTER
SINGLE FAMILY HOMES
HOMES SOLD
CLICK ON A SCHOOL DISTRICT FOR THE LATEST MONTHLY MARKET REPORT.


YORKTOWN
SCHOOL DISTRICT Q2 2023 Q2 2022 % CHANGE YTD 2023 YTD 2022 % CHANGE CROTON HARMON 24 16 50% 36 50 -28% HENDRICK HUDSON 26 32 -19% 48 65 -26% LAKELAND 49 65 -25% 83 128 -35% PEEKSKILL 18 21 -14% 25 52 -52% YORKTOWN 46 34 35% 73 72 1% NorthwestWestchester 163 168 -3% 265 367 -28%
CROTON–HARMON HENDRICK HUDSON LAKELAND PEEKSKILL YORKTOWN HOMES SOLD Q 2 - 2023 VS. Q 2 - 2022 3% MEDIAN SALE PRICE Q 2 - 2023 VS. Q 2 - 2022 3% MEDIAN SALE PRICE SCHOOL DISTRICT Q2 2023 Q2 2022 % CHANGE YTD 2023 YTD 2022 % CHANGE CROTON HARMON $874,500 $901,750 -3% $749,500 $824,611 -9% HENDRICK HUDSON $608,250 $607,500 0% $565,000 $550,000 3% LAKELAND $520,000 $540,000 -4% $510,000 $517,500 -1% PEEKSKILL $462,000 $490,000 -6% $469,000 $483,000 -3% YORKTOWN $616,500 $680,000 -9% $600,000 $635,000 -6% NorthwestWestchester $600,000 $580,063 3% $575,000 $555,000 4% Source: Onekey MLS, Single-family homes, Zone 1
NORTHWEST WESTCHESTER
SINGLE FAMILY HOMES
CROTON–HARMON, HENDRICK HUDSON, LAKELAND, PEEKSKILL, YORKTOWN
Click on a School district to obtain the latest monthly market report.
SUPPLY
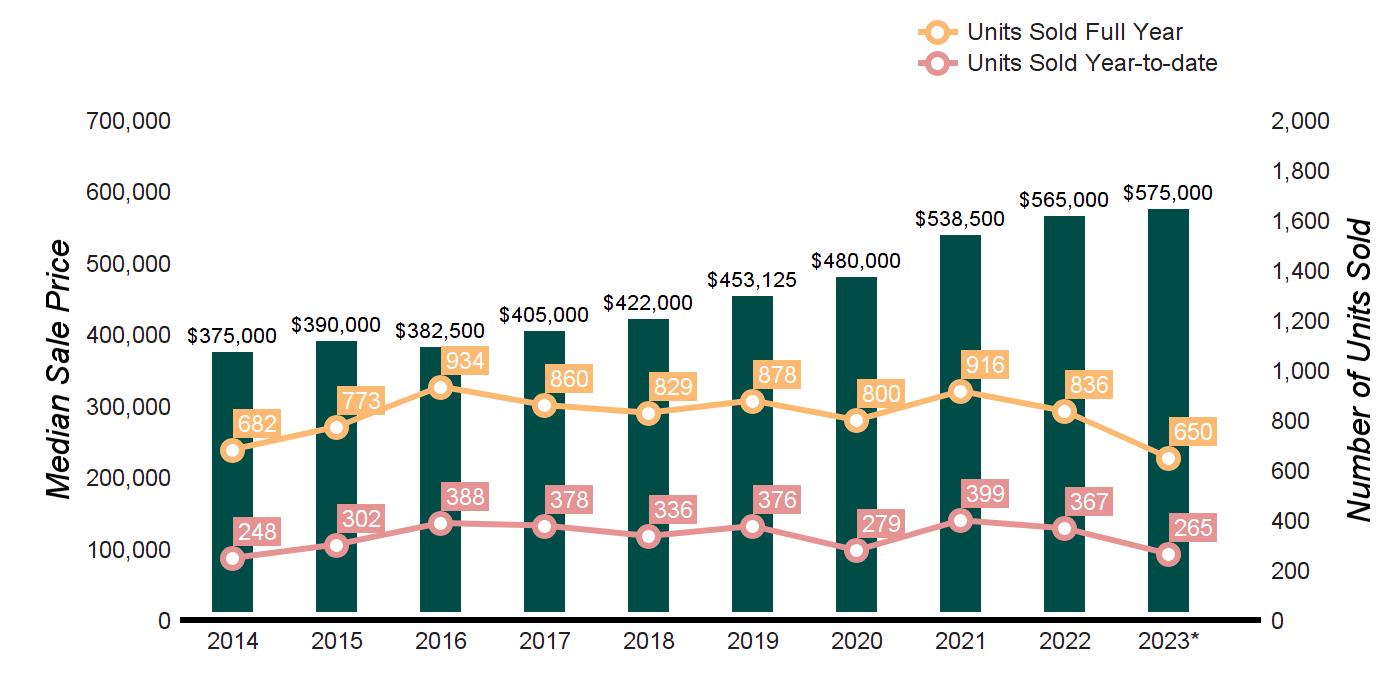
TEN-YEAR MARKET HISTORY
DEMAND ANALYSIS AS OF JUNE 30, 2023 AS OF JUNE 30, 2022 2023 vs. 2022 PRICE RANGE SUPPLY: ACTIVE LISTINGS DEMAND: PENDING SALES SUPPLY/ DEMAND RATIO* SUPPLY: ACTIVE LISTINGS DEMAND: PENDING SALES SUPPLY/ DEMAND RATIO* % CHANGE IN LISTINGS % CHANGE IN PENDINGS $0 - $299,999 5 9 1 4 3 1 25.0% 200.0% $300,000 -$399,999 5 7 1 10 19 1 -50.0% -63.2% $400,000 - $499,999 13 27 1 22 46 1 -40.9% -41.3% $500,000 - $599,999 14 39 1 30 48 1 -53.3% -18.8% $600,000 - $799,999 32 42 1 35 53 1 -8.6% -20.8% $800,000 - $999,999 13 12 1 29 21 1 -55.2% -42.9% $1,000,000 - $1,999,999 18 7 3 15 14 1 20.0% -50.0% $2,000,000 and up 3 2 2 2 0 Not Valid 50.0% 0.0% MarketTotals 103 145 1 147 204 1 -29.9% -28.9% *Supply Demand Ratio Key 1-4: High Demand 5-6: Balanced 7-9: Low Demand 10+: Very Low Demand
Average Sale Price $421,695 $431,339 $419,440 $441,752 $456,746 $483,257 $514,427 $581,831 $626,629 $611,582 Average Sale Price Average Price/SqFt $202 $208 $210 $221 $229 $240 $256 $286 $308 $312 Average Price/SqFt Days On Market 108 102 94 83 72 71 63 46 37 45 Days On Market %Sale Price to List Price 96.2 97.7 98.2 98.8 98.9 98.6 99.3 101.3 102.0 101.3 %Sale Price to List Price Source: Onekey MLS, Single-family homes, Zone 1 * Homes sold for 2023 are annualized based on actual sales year-to-date.
WESTCHESTER COUNTY CONDOMINIUMS
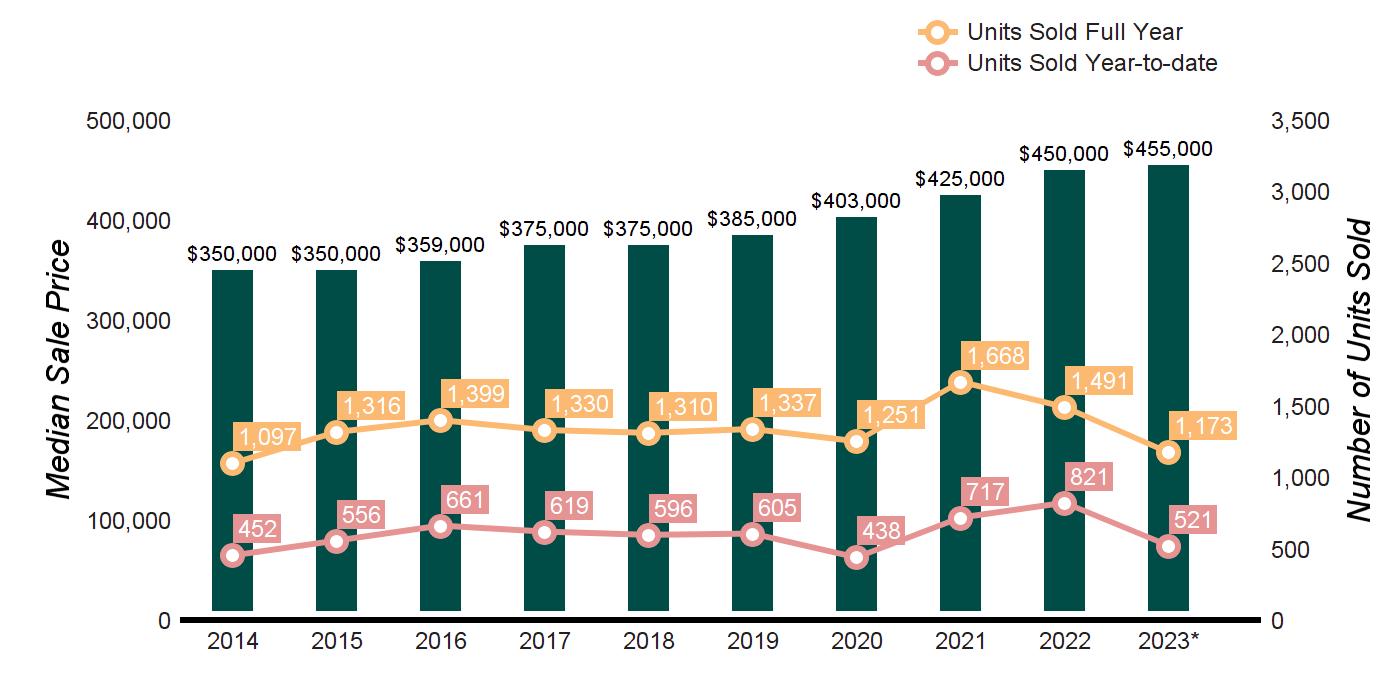
QUARTERLY MARKET OVERVIEW Q2 2023 Q2 2022 % CHANGE YTD 2023 YTD 2022 % CHANGE UNITS SOLD 319 425 -24.9% 521 821 -36.5% AVERAGE SALE PRICE $625,229 $581,407 7.5% $582,930 $582,360 0.1% MEDIAN SALE PRICE $470,000 $450,000 4.4% $455,000 $450,000 1.1% AVERAGE PRICE PER SQUARE FOOT $425 $412 3.2% $404 $409 -1.2% AVERAGE DAYS ON MARKET 45 48 -6.3% 53 56 -5.4% % SALE PRICE TO LIST PRICE 100.0 100.7 -0.7% 99.7 100.1 -0.4% SUPPLY DEMAND ANALYSIS AS OF JUNE 30, 2023 AS OF JUNE 30, 2022 2023 vs. 2022 PRICE RANGE SUPPLY: ACTIVE LISTINGS DEMAND: PENDING SALES SUPPLY/ DEMAND RATIO* SUPPLY: ACTIVE LISTINGS DEMAND: PENDING SALES SUPPLY/ DEMAND RATIO* % CHANGE IN LISTINGS % CHANGE IN PENDINGS $0 - $299,999 25 26 1 47 41 1 -46.8% -36.6% $300,000 -$399,999 38 49 1 51 64 1 -25.5% -23.4% $400,000 - $499,999 39 55 1 41 53 1 -4.9% 3.8% $500,000 - $599,999 22 26 1 18 32 1 22.2% -18.8% $600,000 - $799,999 29 27 1 38 39 1 -23.7% -30.8% $800,000 - $999,999 13 16 1 12 23 1 8.3% -30.4% $1,000,000 - $1,999,999 50 33 2 21 42 1 138.1% -21.4% $2,000,000 and up 14 2 7 12 2 6 16.7% 0.0% MarketTotals 230 234 1 240 296 1 -4.2% -20.9% *Supply Demand Ratio Key 1-4: High Demand 5-6: Balanced 7-9: Low Demand 10+: Very Low Demand TEN-YEAR MARKET HISTORY Average Sale Price $423,000 $428,530 $422,642 $443,353 $442,707 $458,771 $482,135 $550,550 $570,734 $582,930 Average Sale Price Average Price/SqFt $288 $300 $309 $314 $324 $336 $342 $383 $402 $404 Average Price/SqFt Days On Market 94 88 83 72 67 69 66 58 51 53 Days On Market %Sale Price to List Price 96.8 97.3 97.4 97.8 97.8 97.5 97.8 99.3 100.3 99.7 %Sale Price to List Price Source: Onekey MLS, Condominiums * Homes sold for 2023 are annualized based on actual sales year-to-date.
WESTCHESTER COUNTY
CO-OPERATIVES
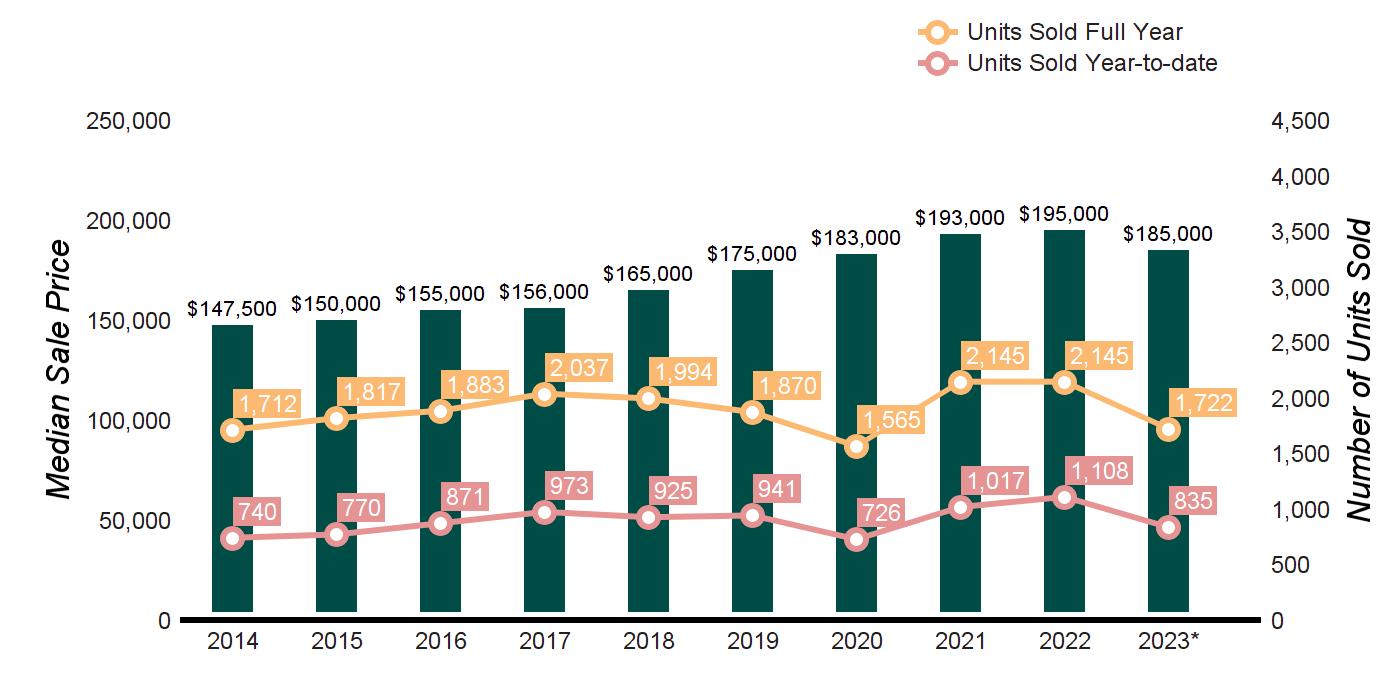
QUARTERLY MARKET OVERVIEW Q2 2023 Q2 2022 % CHANGE YTD 2023 YTD 2022 % CHANGE UNITS SOLD 429 596 -28.0% 835 1108 -24.6% AVERAGE SALE PRICE $217,475 $236,896 -8.2% $222,092 $228,900 -3.0% MEDIAN SALE PRICE $185,000 $202,250 -8.5% $185,000 $195,000 -5.1% AVERAGE PRICE PER SQUARE FOOT $231 $237 -2.5% $233 $234 -0.4% AVERAGE DAYS ON MARKET 77 69 11.6% 78 73 6.8% % SALE PRICE TO LIST PRICE 98.2 98.5 -0.3% 98.0 98.4 -0.4% SUPPLY DEMAND ANALYSIS AS OF JUNE 30, 2023 AS OF JUNE 30, 2022 2023 vs. 2022 PRICE RANGE SUPPLY: ACTIVE LISTINGS DEMAND: PENDING SALES SUPPLY/ DEMAND RATIO* SUPPLY: ACTIVE LISTINGS DEMAND: PENDING SALES SUPPLY/ DEMAND RATIO* % CHANGE IN LISTINGS % CHANGE IN PENDINGS $0 - $299,999 361 467 1 546 531 1 -33.9% -12.1% $300,000 -$399,999 44 52 1 64 75 1 -31.3% -30.7% $400,000 - $499,999 20 17 1 20 20 1 0.0% -15.0% $500,000 - $599,999 6 10 1 7 5 1 -14.3% 100.0% $600,000 - $799,999 8 8 1 8 13 1 0.0% -38.5% $800,000 - $999,999 8 1 8 5 3 2 60.0% -66.7% $1,000,000 - $1,999,999 1 2 1 1 4 1 0.0% -50.0% $2,000,000 and up 0 0 Not Valid 0 0 Not Valid 0.0% 0.0% MarketTotals 448 557 1 651 651 1 -31.2% -14.4% *Supply Demand Ratio Key 1-4: High Demand 5-6: Balanced 7-9: Low Demand 10+: Very Low Demand TEN-YEAR MARKET HISTORY Average Sale Price $179,697 $179,406 $185,854 $187,907 $198,839 $204,571 $219,766 $222,699 $230,853 $222,092 Average Sale Price Average Price/SqFt $174 $179 $188 $193 $204 $214 $225 $228 $236 $233 Average Price/SqFt Days On Market 139 124 103 95 77 68 66 72 72 78 Days On Market %Sale Price to List Price 95.5 96.1 96.8 97.5 97.9 98.0 97.7 97.9 98.5 98.0 %Sale Price to List Price Source: Onekey MLS, Co-Operatives * Homes sold for 2023 are annualized based on actual sales year-to-date.
BREWSTER-MAHOPAC
PUTNAM COUNTY

SINGLE FAMILY HOMES
HOMES SOLD
Preview all our HD Videos of Westchester, Putnam and Dutchess
houlihanlawrence.com/communities

CLICK ON A SCHOOL DISTRICT FOR THE LATEST MONTHLY MARKET REPORT.
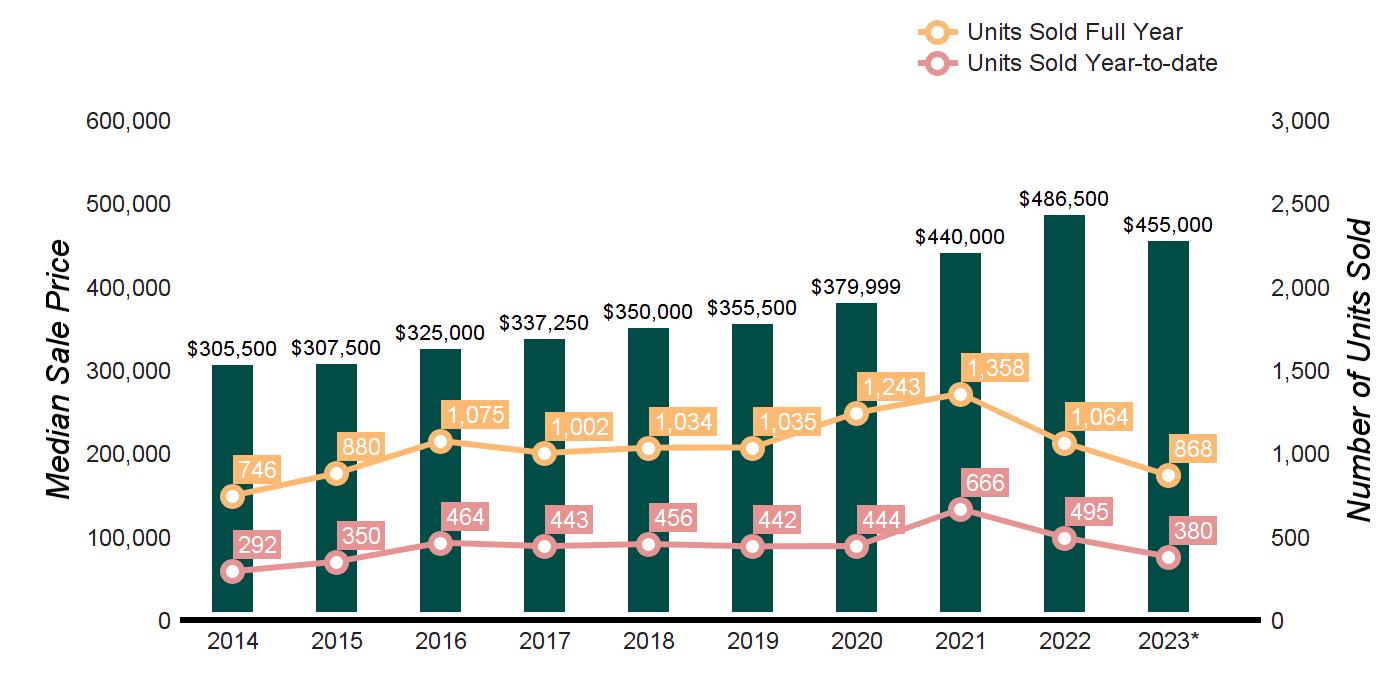
SCHOOL DISTRICT Q2 2023 Q2 2022 % CHANGE YTD 2023 YTD 2022 % CHANGE BREWSTER 41 42 -2% 82 104 -21% CARMEL 70 81 -14% 132 163 -19% GARRISON 6 4 50% 13 15 -13% HALDANE 14 16 -13% 21 29 -28% LAKELAND 4 10 -60% 9 20 -55% MAHOPAC 44 62 -29% 82 122 -33% PUTNAM VALLEY 22 26 -15% 41 42 -2% Putnamcounty 201 241 -17% 380 495 -23%
BREWSTER CARMEL GARRISON HALDANE LAKELAND MAHOPAC PUTNAM VALLEY HOMES SOLD Q 2 - 2023 VS. Q 2 - 2022 17% MEDIAN SALE PRICE Q 2 - 2023 VS. Q 2 - 2022 0% MEDIAN SALE PRICE SCHOOL DISTRICT Q2 2023 Q2 2022 % CHANGE YTD 2023 YTD 2022 % CHANGE BREWSTER $477,000 $430,000 11% $432,500 $408,094 6% CARMEL $425,000 $430,000 -1% $410,000 $430,000 -5% GARRISON $1,255,000 $533,500 135% $972,500 $580,000 68% HALDANE $542,500 $1,074,999 -50% $649,000 $935,000 -31% LAKELAND $520,200 $509,250 2% $510,000 $505,000 1% MAHOPAC $523,750 $548,750 -5% $487,250 $530,000 -8% PUTNAM VALLEY $400,450 $436,000 -8% $445,000 $430,000 4% Putnamcounty $480,000 $480,000 0% $455,000 $475,000 -4% Source: Onekey MLS, Single-family homes, Zone 9
PUTNAM COUNTY
SINGLE FAMILY HOMES
BREWSTER, CARMEL, GARRISON, HALDANE, LAKELAND, MAHOPAC, PUTNAM VALLEY
Click on a School district to obtain the latest monthly market report. SUPPLY
TEN-YEAR MARKET HISTORY
DEMAND ANALYSIS AS OF JUNE 30, 2023 AS OF JUNE 30, 2022 2023 vs. 2022 PRICE RANGE SUPPLY: ACTIVE LISTINGS DEMAND: PENDING SALES SUPPLY/ DEMAND RATIO* SUPPLY: ACTIVE LISTINGS DEMAND: PENDING SALES SUPPLY/ DEMAND RATIO* % CHANGE IN LISTINGS % CHANGE IN PENDINGS $0 - $299,999 9 16 1 36 23 2 -75.0% -30.4% $300,000 -$399,999 20 32 1 35 57 1 -42.9% -43.9% $400,000 - $499,999 25 40 1 50 52 1 -50.0% -23.1% $500,000 - $599,999 22 26 1 31 42 1 -29.0% -38.1% $600,000 - $799,999 39 39 1 55 66 1 -29.1% -40.9% $800,000 - $999,999 23 9 3 25 19 1 -8.0% -52.6% $1,000,000 - $1,999,999 24 2 12 16 6 3 50.0% -66.7% $2,000,000 and up 12 0 Not Valid 11 2 6 9.1% -100.0% MarketTotals 174 164 1 259 267 1 -32.8% -38.6% *Supply Demand Ratio Key 1-4: High Demand 5-6: Balanced 7-9: Low Demand 10+: Very Low Demand
Average Sale Price $362,883 $354,312 $358,374 $367,059 $390,203 $381,140 $433,668 $498,629 $541,021 $514,896 Average Sale Price Average Price/SqFt $175 $174 $176 $183 $195 $197 $210 $246 $267 $266 Average Price/SqFt Days On Market 142 136 123 112 90 77 79 58 48 68 Days On Market %Sale Price to List Price 94.9 95.8 96.5 96.8 97.4 97.5 97.6 99.9 100.4 100.1 %Sale Price to List Price Source: Onekey MLS, Single-family homes, Zone 9 * Homes sold for 2023 are annualized based on actual sales year-to-date.
PUTNAM COUNTY CONDOMINIUMS
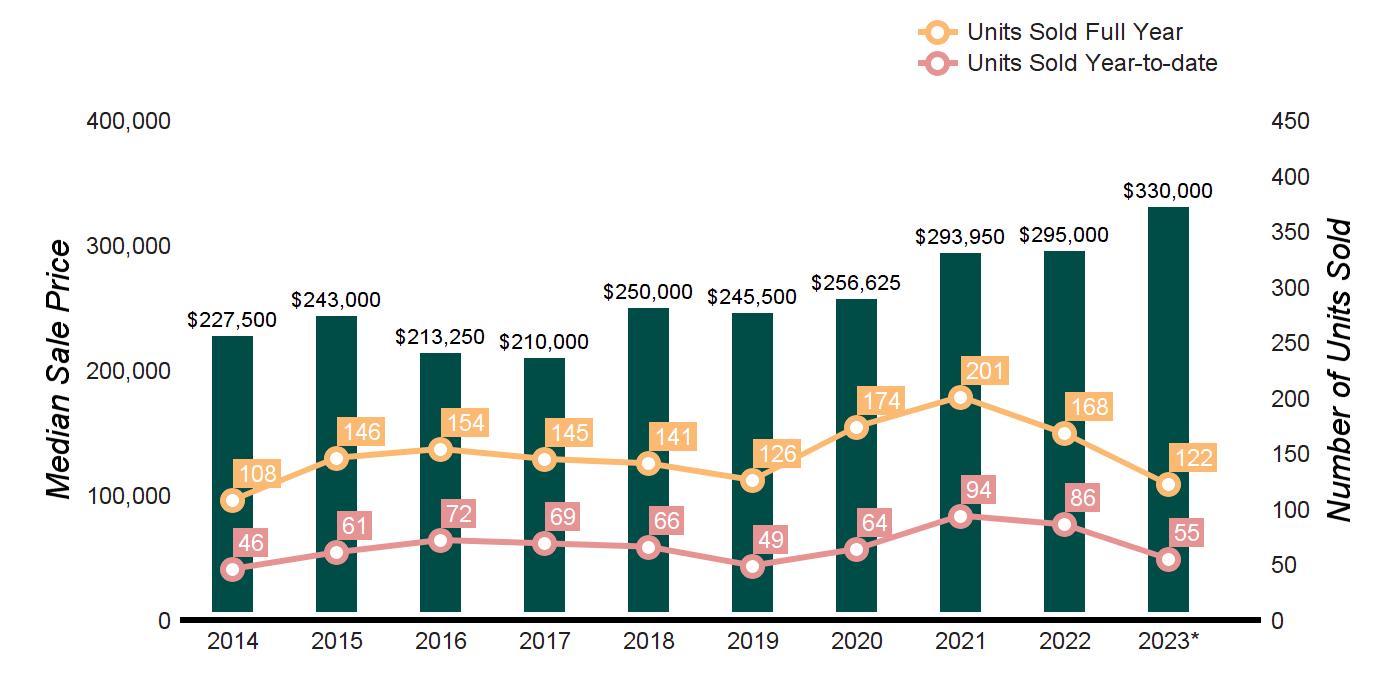
MARKET OVERVIEW Q2 2023 Q2 2022 % CHANGE YTD 2023 YTD 2022 % CHANGE UNITS SOLD 28 37 -24.3% 55 86 -36.0% AVERAGE SALE PRICE $345,471 $311,190 11.0% $338,119 $307,320 10.0% MEDIAN SALE PRICE $342,450 $275,000 24.5% $330,000 $275,000 20.0% AVERAGE PRICE PER SQUARE FOOT $270 $246 9.8% $267 $235 13.6% AVERAGE DAYS ON MARKET 49 47 4.3% 58 44 31.8% % SALE PRICE TO LIST PRICE 101.6 102.3 -0.7% 101.0 100.1 0.9% SUPPLY DEMAND ANALYSIS AS OF JUNE 30, 2023 AS OF JUNE 30, 2022 2023 vs. 2022 PRICE RANGE SUPPLY: ACTIVE LISTINGS DEMAND: PENDING SALES SUPPLY/ DEMAND RATIO* SUPPLY: ACTIVE LISTINGS DEMAND: PENDING SALES SUPPLY/ DEMAND RATIO* % CHANGE IN LISTINGS % CHANGE IN PENDINGS $0 - $299,999 2 3 1 4 11 1 -50.0% -72.7% $300,000 -$399,999 3 11 1 10 18 1 -70.0% -38.9% $400,000 - $499,999 3 2 2 1 5 1 200.0% -60.0% $500,000 - $599,999 0 0 Not Valid 0 0 Not Valid 0.0% 0.0% $600,000 - $799,999 0 0 Not Valid 0 1 0 0.0% -100.0% $800,000 - $999,999 0 0 Not Valid 0 0 Not Valid 0.0% 0.0% $1,000,000 - $1,999,999 0 0 Not Valid 0 1 0 0.0% -100.0% $2,000,000 and up 0 0 Not Valid 0 0 Not Valid 0.0% 0.0% MarketTotals 8 16 1 15 36 1 -46.7% -55.6% *Supply Demand Ratio Key 1-4: High Demand 5-6: Balanced 7-9: Low Demand 10+: Very Low Demand TEN-YEAR MARKET HISTORY Average Sale Price $254,240 $279,172 $246,529 $241,929 $276,336 $253,968 $262,118 $296,474 $317,437 $338,119 Average Sale Price Average Price/SqFt $163 $176 $166 $168 $194 $187 $203 $215 $241 $267 Average Price/SqFt Days On Market 116 124 121 88 76 64 82 46 41 58 Days On Market %Sale Price to List Price 95.8 97.0 97.4 96.9 98.4 98.1 97.9 99.7 101.0 101.0 %Sale Price to List Price Source: Onekey MLS, Condominiums * Homes sold for 2023 are annualized based on actual sales year-to-date.
QUARTERLY
DUTCHESS COUNTY
SINGLE FAMILY HOMES
*Supply Demand Ratio Key 1-4: High Demand 5-6: Balanced 7-9: Low Demand 10+: Very Low Demand
TEN-YEAR MARKET HISTORY

QUARTERLY MARKET OVERVIEW Q2 2023 Q2 2022 % CHANGE YTD 2023 YTD 2022 % CHANGE HOMES SOLD 412 501 -17.8% 795 1028 -22.7% AVERAGE SALE PRICE $484,874 $535,901 -9.5% $466,898 $509,868 -8.4% MEDIAN SALE PRICE $430,000 $435,000 -1.1% $407,000 $410,000 -0.7% AVERAGE PRICE PER SQUARE FOOT $236 $239 -1.3% $230 $263 -12.5% % SALE PRICE TO LIST PRICE 100.0 100.3 -0.3% 98.8 100.0 -1.2% SUPPLY DEMAND ANALYSIS AS OF JUNE 30, 2023 AS OF JUNE 30, 2022 2023 vs. 2022 PRICE RANGE SUPPLY: ACTIVE LISTINGS DEMAND: PENDING SALES SUPPLY/ DEMAND RATIO* SUPPLY: ACTIVE LISTINGS DEMAND: PENDING SALES SUPPLY/ DEMAND RATIO* % CHANGE IN LISTINGS % CHANGE IN PENDINGS $0 - $299,999 61 47 1 90 74 1 -32.2% -36.5% $300,000 -$399,999 96 104 1 123 134 1 -22.0% -22.4% $400,000 - $499,999 67 97 1 104 87 1 -35.6% 11.5% $500,000 - $599,999 58 56 1 73 59 1 -20.5% -5.1% $600,000 - $799,999 83 46 2 89 40 2 -6.7% 15.0% $800,000 - $999,999 34 17 2 45 18 3 -24.4% -5.6% $1,000,000 - $1,999,999 59 13 5 55 13 4 7.3% 0.0% $2,000,000 and up 34 6 6 23 8 3 47.8% -25.0% MarketTotals 492 386 1 602 433 1 -18.3% -10.9%
Average Sale Price $287,420 $282,862 $286,860 $298,238 $331,954 $334,166 $419,851 $474,640 $509,529 $466,898 Average Sale Price Average Price/SqFt $133 $133 $135 $146 $156 $164 $189 $216 $234 $230 Average Price/SqFt Days On Market 171 171 173 156 149 141 139 129 105 102 Days On Market %Sale Price to List Price 93.7 94.9 96.1 96.8 97.2 97.0 98.6 99.9 99.3 98.8 %Sale Price to List Price Source: Mid-Hudson Multiple Listing Service, Residential-detached homes. * Homes sold for 2023 are annualized based on actual sales year-to-date.
POUGHKEEPSIE AREA
SOUTHWEST DUTCHESS
SINGLE FAMILY HOMES
HOMES SOLD
Preview all our HD Videos of Westchester, Putnam and Dutchess houlihanlawrence.com/communities


CLICK TO OBTAIN A SPECIFIC TOWN/CITY MONTHLY MARKET REPORT.
EAST FISHKILL FISHKILL LA GRANGE
10%
TOWN/CITY Q2 2023 Q2 2022 % CHANGE YTD 2023 YTD 2022 % CHANGE BEACON 14 25 -44% 21 45 -53% EAST FISHKILL 42 44 -5% 66 105 -37% FISHKILL 17 26 -35% 37 57 -35% LA GRANGE 34 37 -8% 72 69 4% POUGHKEEPSIE TWP 86 82 5% 152 176 -14% POUGHKEEPSIE CITY 16 24 -33% 42 63 -33% WAPPINGER 31 29 7% 60 50 20% SouthwestDutchess 240 267 -10% 450 565 -20%
BEACON
POUGHKEEPSIE
WAPPINGER HOMES SOLD Q 2 - 2023 VS. Q 2 - 2022
AVERAGE SALE PRICE Q 2 - 2023 VS. Q 2 - 2022
TOWN/CITY Q2 2023 Q2 2022 % CHANGE YTD 2023 YTD 2022 % CHANGE BEACON $562,500 $525,000 7% $524,900 $525,000 0% EAST FISHKILL $550,000 $600,000 -8% $530,000 $499,900 6% FISHKILL $460,000 $472,700 -3% $450,000 $426,000 6% LA GRANGE $510,618 $445,000 15% $432,250 $431,000 0% POUGHKEEPSIE TWP $373,000 $356,000 5% $367,250 $352,000 4% POUGHKEEPSIE CITY $316,200 $358,750 -12% $349,250 $340,000 3% WAPPINGER $405,000 $427,500 -5% $394,500 $422,500 -7% SouthwestDutchess $425,500 $431,000 -1% $404,375 $410,000 -1%
TWP POUGHKEEPSIE CITY
1% AVERAGE SALE PRICE
Source: Mid-Hudson Multiple Listing Service reports the Average Sale Price.
SOUTHWEST DUTCHESS
SINGLE FAMILY HOMES
BEACON, EAST FISHKILL, FISHKILL, LA GRANGE, POUGHKEEPSIE TWP, POUGHKEEPSIE CITY, WAPPINGER
Click to obtain a specific town/city monthly market report.
SUPPLY DEMAND ANALYSIS
TEN-YEAR MARKET HISTORY
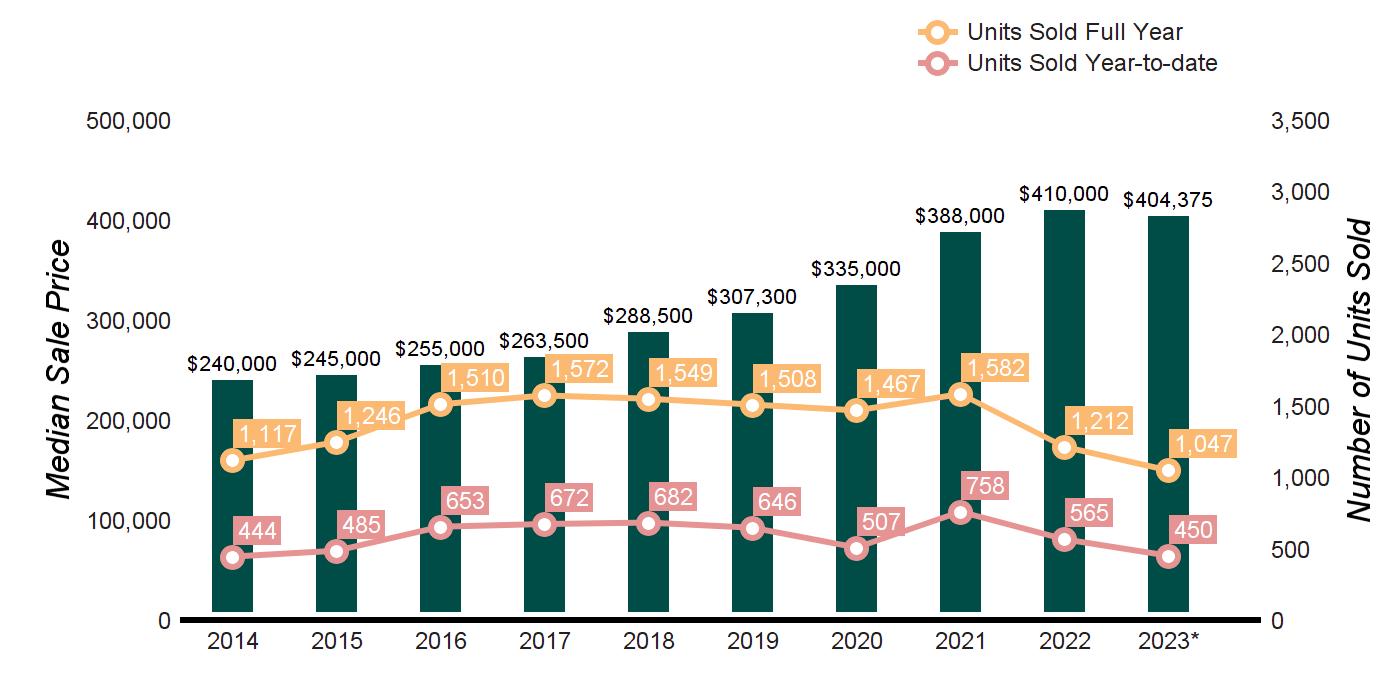
AS OF JUNE 30, 2023 AS OF JUNE 30, 2022 2023 vs. 2022 PRICE RANGE SUPPLY: ACTIVE LISTINGS DEMAND: PENDING SALES SUPPLY/ DEMAND RATIO* SUPPLY: ACTIVE LISTINGS DEMAND: PENDING SALES SUPPLY/ DEMAND RATIO* % CHANGE IN LISTINGS % CHANGE IN PENDINGS $0 - $299,999 15 30 1 47 43 1 -68.1% -30.2% $300,000 -$399,999 64 60 1 67 90 1 -4.5% -33.3% $400,000 - $499,999 40 63 1 53 68 1 -24.5% -7.4% $500,000 - $599,999 30 36 1 38 38 1 -21.1% -5.3% $600,000 - $799,999 47 32 1 54 22 2 -13.0% 45.5% $800,000 - $999,999 16 9 2 25 13 2 -36.0% -30.8% $1,000,000 - $1,999,999 15 4 4 13 4 3 15.4% 0.0% $2,000,000 and up 4 1 4 3 0 Not Valid 33.3% 0.0% MarketTotals 231 235 1 300 278 1 -23.0% -15.5% *Supply Demand Ratio Key 1-4: High Demand 5-6: Balanced 7-9: Low Demand 10+: Very Low Demand
Average Sale Price $264,321 $264,243 $275,742 $282,042 $314,304 $323,063 $361,418 $411,024 $447,518 $446,071 Average Sale Price Average Price/SqFt $126 $128 $133 $141 $152 $163 $178 $203 $223 $223 Average Price/SqFt Days On Market 165 164 170 154 144 138 130 125 99 98 Days On Market %Sale Price to List Price 96.1 96.5 97.7 98.0 98.9 98.3 99.3 100.9 100.6 99.1 %Sale Price to List Price Source: Mid-Hudson Multiple Listing Service, Residential-detached homes. * Homes sold for 2023 are annualized based on actual sales year-to-date.
SOUTHEAST DUTCHESS

SINGLE FAMILY HOMES
HOMES SOLD
CLICK TO OBTAIN A SPECIFIC TOWN/CITY MONTHLY MARKET REPORT.

AVERAGE

Preview all our HD Videos of Westchester, Putnam and Dutchess houlihanlawrence.com/communities
DUTCHESS COUNTY
TOWN/CITY Q2 2023 Q2 2022 % CHANGE YTD 2023 YTD 2022 % CHANGE BEEKMAN 13 20 -35% 24 42 -43% DOVER 9 10 -10% 17 24 -29% PAWLING 6 11 -46% 12 23 -48% UNION VALE 14 14 0% 24 25 -4% SoutheastDutchess 42 55 -24% 77 114 -33%
BEEKMAN DOVER PAWLING UNION VALE HOMES SOLD Q 2 - 2023 VS. Q 2 - 2022 24% AVERAGE SALE PRICE Q 2 - 2023 VS. Q 2 - 2022 5%
SALE PRICE TOWN/CITY Q2 2023 Q2 2022 % CHANGE YTD 2023 YTD 2022 % CHANGE BEEKMAN $560,000 $445,000 26% $565,000 $436,000 30% DOVER $299,900 $367,500 -18% $287,050 $338,500 -15% PAWLING $622,500 $545,000 14% $574,500 $545,000 5% UNION VALE $500,000 $469,000 7% $500,000 $485,000 3% SoutheastDutchess $485,000 $460,000 5% $469,900 $445,000 6%
Listing Service
Average Sale
Source: Mid-Hudson Multiple
reports the
Price.
SOUTHEAST DUTCHESS
SINGLE FAMILY HOMES
BEEKMAN, DOVER, PAWLING, UNION VALE
Click to obtain a specific town/city monthly market report.
SUPPLY
TEN-YEAR MARKET HISTORY
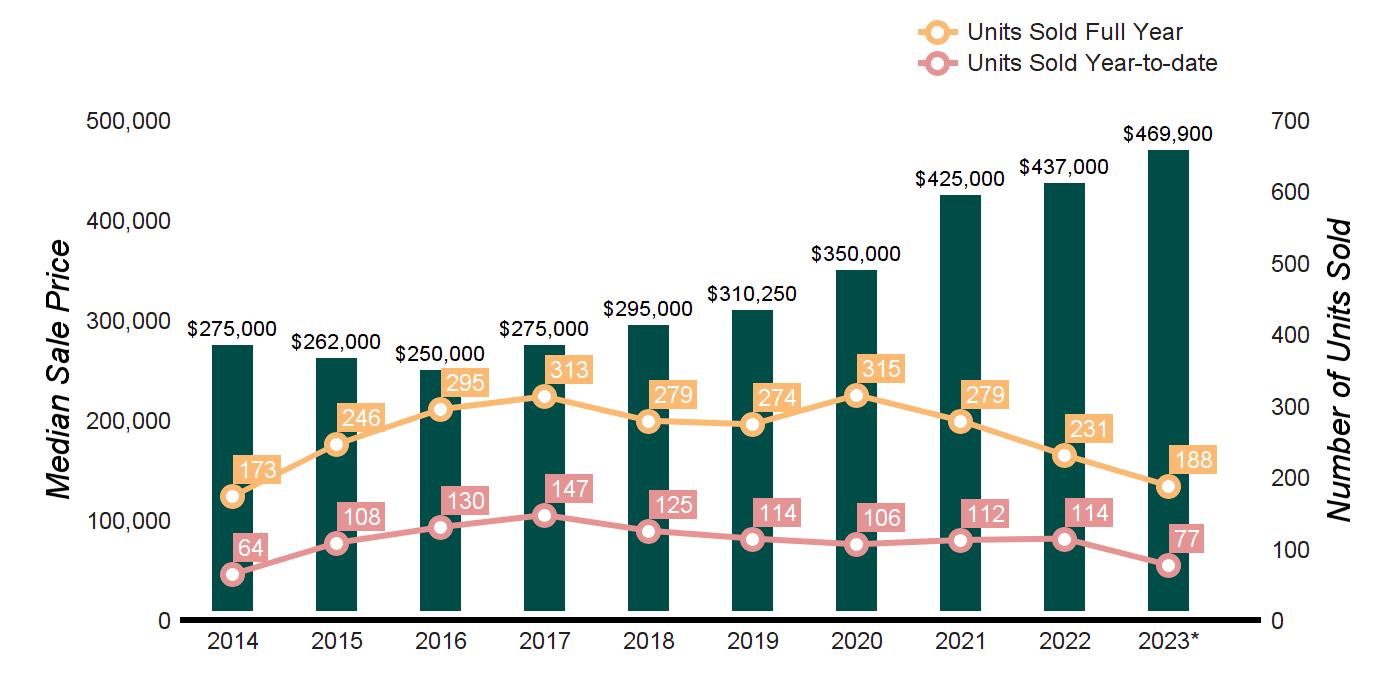
OF JUNE 30, 2023 AS OF JUNE 30, 2022 2023 vs. 2022 PRICE RANGE SUPPLY: ACTIVE LISTINGS DEMAND: PENDING SALES SUPPLY/ DEMAND RATIO* SUPPLY: ACTIVE LISTINGS DEMAND: PENDING SALES SUPPLY/ DEMAND RATIO* % CHANGE IN LISTINGS % CHANGE IN PENDINGS $0 - $299,999 5 6 1 9 13 1 -44.4% -53.8% $300,000 -$399,999 5 3 2 12 6 2 -58.3% -50.0% $400,000 - $499,999 7 8 1 10 6 2 -30.0% 33.3% $500,000 - $599,999 13 8 2 13 12 1 0.0% -33.3% $600,000 - $799,999 5 4 1 11 6 2 -54.5% -33.3% $800,000 - $999,999 2 1 2 4 1 4 -50.0% 0.0% $1,000,000 - $1,999,999 9 3 3 8 0 Not Valid 12.5% 0.0% $2,000,000 and up 2 0 Not Valid 2 1 2 0.0% -100.0% MarketTotals 48 33 1 69 45 2 -30.4% -26.7% *Supply Demand Ratio Key 1-4: High Demand 5-6: Balanced 7-9: Low Demand 10+: Very Low Demand
DEMAND ANALYSIS AS
Average Sale Price $300,413 $303,007 $290,055 $307,284 $310,391 $334,548 $390,608 $501,923 $494,267 $469,340 Average Sale Price Average Price/SqFt $131 $134 $130 $134 $157 $155 $178 $212 $213 $215 Average Price/SqFt Days On Market 178 195 187 167 156 140 146 135 119 106 Days On Market %Sale Price to List Price 95.4 94.1 94.3 95.9 96.2 95.9 97.2 98.8 99.2 99.9 %Sale Price to List Price Source: Mid-Hudson Multiple Listing Service, Residential-detached homes. * Homes sold for 2023 are annualized based on actual sales year-to-date.
NORTHWEST DUTCHESS

SINGLE FAMILY HOMES
HOMES
CLICK TO OBTAIN A SPECIFIC TOWN/CITY MONTHLY MARKET REPORT.

COUNTY Preview all our HD Videos of Westchester, Putnam and Dutchess houlihanlawrence.com/communities
DUTCHESS
SOLD TOWN/CITY Q2 2023 Q2 2022 % CHANGE YTD 2023 YTD 2022 % CHANGE CLINTON 11 15 -27% 18 27 -33% HYDE PARK 34 32 6% 71 78 -9% MILAN 3 9 -67% 7 12 -42% PLEASANT VALLEY 17 16 6% 33 39 -15% RED HOOK 12 15 -20% 25 24 4% RHINEBECK 12 15 -20% 28 33 -15% NorthwestDutchess 89 102 -13% 182 213 -15%
CLINTON HYDE PARK MILAN PLEASANT VALLEY RED HOOK RHINEBECK HOMES SOLD Q 2 - 2023 VS. Q 2 - 2022 13% AVERAGE SALE PRICE Q 2 - 2023 VS. Q 2 - 2022 3% AVERAGE SALE PRICE TOWN/CITY Q2 2023 Q2 2022 % CHANGE YTD 2023 YTD 2022 % CHANGE CLINTON $749,000 $720,000 4% $644,500 $715,000 -10% HYDE PARK $360,000 $322,500 12% $331,000 $310,000 7% MILAN $507,500 $735,000 -31% $507,500 $694,500 -27% PLEASANT VALLEY $372,500 $432,500 -14% $372,500 $365,000 2% RED HOOK $467,500 $520,000 -10% $455,000 $507,500 -10% RHINEBECK $694,588 $865,000 -20% $646,750 $695,000 -7% NorthwestDutchess $430,000 $444,500 -3% $403,495 $395,000 2% Source: Mid-Hudson Multiple Listing Service reports the Average Sale Price.
NORTHWEST DUTCHESS
SINGLE FAMILY HOMES
CLINTON, HYDE PARK, MILAN, PLEASANT VALLEY, RED HOOK, RHINEBECK
Click to obtain a specific town/city monthly market report.
SUPPLY DEMAND ANALYSIS AS
TEN-YEAR MARKET HISTORY
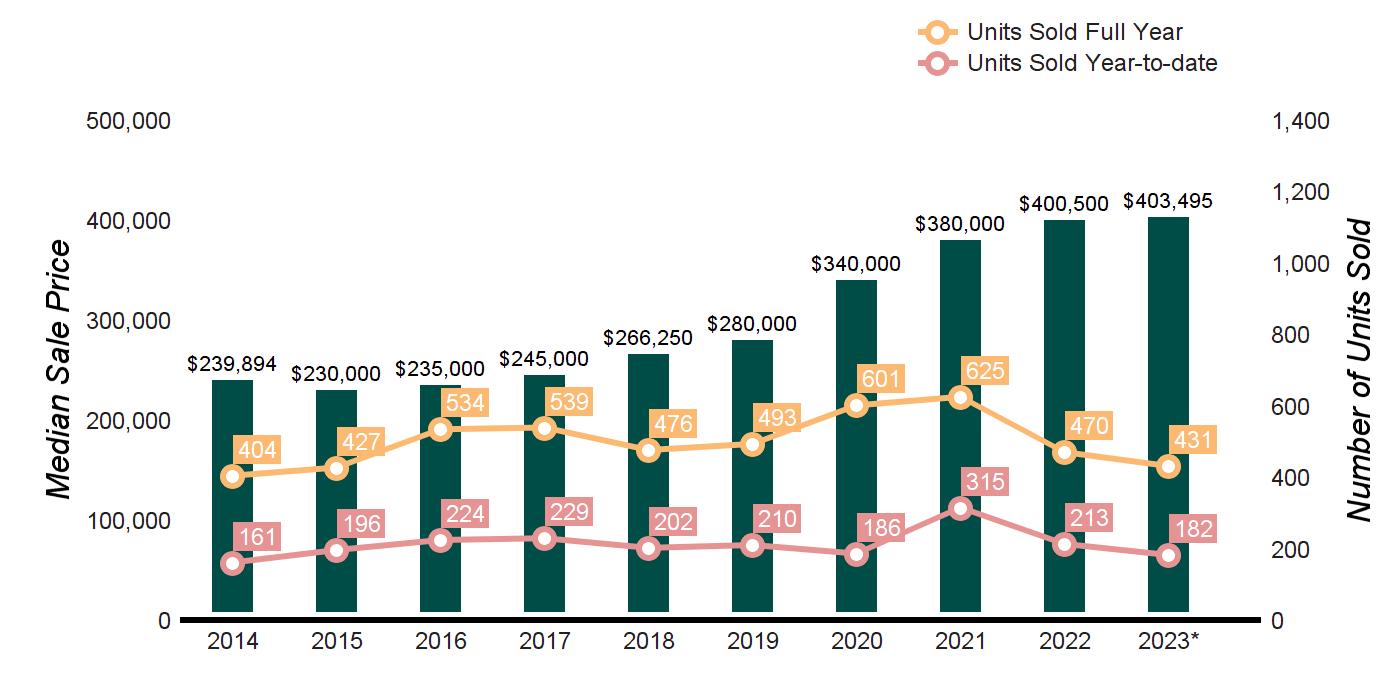
OF JUNE 30, 2023 AS OF JUNE 30, 2022 2023 vs. 2022 PRICE RANGE SUPPLY: ACTIVE LISTINGS DEMAND: PENDING SALES SUPPLY/ DEMAND RATIO* SUPPLY: ACTIVE LISTINGS DEMAND: PENDING SALES SUPPLY/ DEMAND RATIO* % CHANGE IN LISTINGS % CHANGE IN PENDINGS $0 - $299,999 26 9 3 22 15 1 18.2% -40.0% $300,000 -$399,999 20 31 1 31 25 1 -35.5% 24.0% $400,000 - $499,999 13 16 1 28 9 3 -53.6% 77.8% $500,000 - $599,999 12 9 1 17 7 2 -29.4% 28.6% $600,000 - $799,999 24 7 3 21 9 2 14.3% -22.2% $800,000 - $999,999 13 5 3 12 2 6 8.3% 150.0% $1,000,000 - $1,999,999 19 4 5 20 6 3 -5.0% -33.3% $2,000,000 and up 11 5 2 7 4 2 57.1% 25.0% MarketTotals 138 86 2 158 77 2 -12.7% 11.7% *Supply Demand Ratio Key 1-4: High Demand 5-6: Balanced 7-9: Low Demand 10+:
Low Demand
Very
Average Sale Price $308,849 $282,114 $280,385 $304,969 $343,282 $348,848 $492,055 $530,425 $592,518 $484,085 Average Sale Price Average Price/SqFt $144 $132 $137 $149 $158 $166 $209 $235 $257 $241 Average Price/SqFt Days On Market 176 169 164 153 147 141 143 125 107 103 Days On Market %Sale Price to List Price 93.2 94.1 94.8 96.2 95.9 96.1 99.6 100.4 97.6 98.9 %Sale Price to List Price Source: Mid-Hudson Multiple Listing Service, Residential-detached homes. * Homes sold for 2023 are annualized based on actual sales year-to-date.
NORTHEAST DUTCHESS

SINGLE FAMILY HOMES
HOMES
CLICK TO OBTAIN A SPECIFIC TOWN/CITY MONTHLY MARKET REPORT.

COUNTY Preview all our HD Videos of Westchester, Putnam and Dutchess houlihanlawrence.com/communities
DUTCHESS
SOLD TOWN/CITY Q2 2023 Q2 2022 % CHANGE YTD 2023 YTD 2022 % CHANGE AMENIA 6 14 -57% 16 24 -33% NORTH EAST 2 5 -60% 3 8 -63% PINE PLAINS 7 6 17% 12 11 9% STANFORD 5 12 -58% 12 16 -25% WASHINGTON 2 11 -82% 13 16 -19% NortheastDutchess 22 48 -54% 56 75 -25%
AMENIA NORTH EAST PINE PLAINS STANFORD WASHINGTON HOMES SOLD Q 2 - 2023 VS. Q 2 - 2022 54% AVERAGE SALE PRICE Q 2 - 2023 VS. Q 2 - 2022 23% AVERAGE SALE PRICE TOWN/CITY Q2 2023 Q2 2022 % CHANGE YTD 2023 YTD 2022 % CHANGE AMENIA $585,000 $427,700 37% $268,750 $476,000 -44% NORTH EAST $911,250 $365,000 150% $435,000 $389,225 12% PINE PLAINS $345,000 $332,500 4% $347,500 $346,500 0% STANFORD $310,000 $589,000 -47% $382,500 $480,000 -20% WASHINGTON $1,166,000 $1,150,000 1% $700,000 $1,067,499 -34% NortheastDutchess $427,500 $552,947 -23% $382,500 $530,000 -28% Source: Mid-Hudson Multiple Listing Service reports the Average Sale Price.
NORTHEAST DUTCHESS
SINGLE FAMILY HOMES
AMENIA, NORTH EAST, PINE PLAINS, STANFORD, WASHINGTON
Click to obtain a specific town/city monthly market report.
SUPPLY DEMAND ANALYSIS
TEN-YEAR MARKET HISTORY
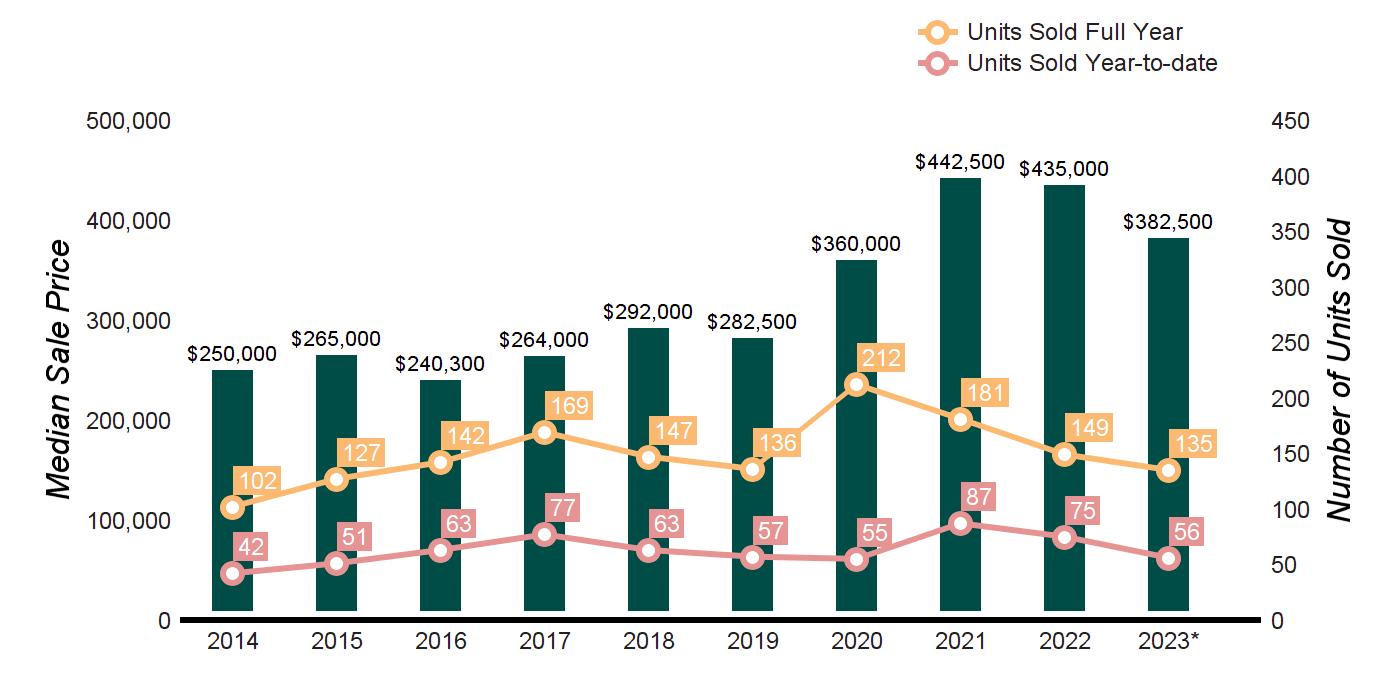
AS OF JUNE 30, 2023 AS OF JUNE 30, 2022 2023 vs. 2022 PRICE RANGE SUPPLY: ACTIVE LISTINGS DEMAND: PENDING SALES SUPPLY/ DEMAND RATIO* SUPPLY: ACTIVE LISTINGS DEMAND: PENDING SALES SUPPLY/ DEMAND RATIO* % CHANGE IN LISTINGS % CHANGE IN PENDINGS $0 - $299,999 14 2 7 9 2 5 55.6% 0.0% $300,000 -$399,999 4 2 2 5 8 1 -20.0% -75.0% $400,000 - $499,999 4 6 1 8 2 4 -50.0% 200.0% $500,000 - $599,999 3 3 1 2 1 2 50.0% 200.0% $600,000 - $799,999 7 3 2 2 2 1 250.0% 50.0% $800,000 - $999,999 3 2 2 3 2 2 0.0% 0.0% $1,000,000 - $1,999,999 13 1 13 13 3 4 0.0% -66.7% $2,000,000 and up 17 0 Not Valid 10 3 3 70.0% -100.0% MarketTotals 65 19 3 52 23 2 25.0% -17.4% *Supply Demand Ratio Key 1-4: High Demand 5-6: Balanced 7-9: Low Demand 10+: Very Low Demand
Average Sale Price $463,158 $472,708 $439,423 $430,139 $553,985 $432,414 $684,243 $831,763 $835,798 $569,070 Average Sale Price Average Price/SqFt $167 $188 $166 $201 $197 $179 $222 $271 $280 $242 Average Price/SqFt Days On Market 208 212 212 193 198 186 191 162 130 139 Days On Market %Sale Price to List Price 80.5 88.9 91.3 92.6 92.0 91.1 95.3 96.2 97.1 93.2 %Sale Price to List Price Source: Mid-Hudson Multiple Listing Service, Residential-detached homes. * Homes sold for 2023 are annualized based on actual sales year-to-date.
DUTCHESS COUNTY CONDOMINIUMS
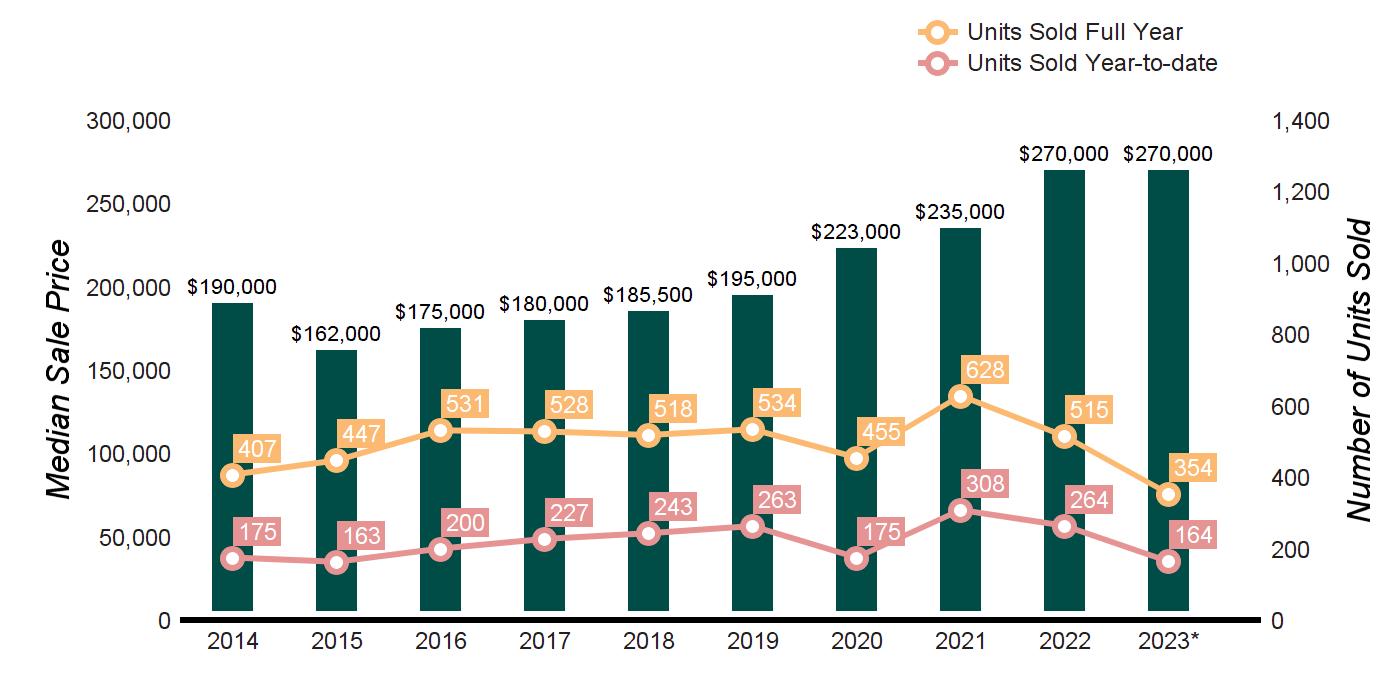
QUARTERLY MARKET OVERVIEW Q2 2023 Q2 2022 % CHANGE YTD 2023 YTD 2022 % CHANGE UNITS SOLD 78 127 -38.6% 164 264 -37.9% AVERAGE SALE PRICE $341,068 $299,060 14.0% $318,208 $286,729 11.0% MEDIAN SALE PRICE $317,500 $280,000 13.4% $270,000 $263,250 2.6% AVERAGE PRICE PER SQUARE FOOT $221 $217 1.8% $213 $208 2.4% AVERAGE DAYS ON MARKET 92 96 -4.2% 90 111 -18.9% % SALE PRICE TO LIST PRICE 100.3 102.0 -1.7% 99.6 101.3 -1.7% SUPPLY DEMAND ANALYSIS AS OF JUNE 30, 2023 AS OF JUNE 30, 2022 2023 vs. 2022 PRICE RANGE SUPPLY: ACTIVE LISTINGS DEMAND: PENDING SALES SUPPLY/ DEMAND RATIO* SUPPLY: ACTIVE LISTINGS DEMAND: PENDING SALES SUPPLY/ DEMAND RATIO* % CHANGE IN LISTINGS % CHANGE IN PENDINGS $0 - $299,999 35 35 1 54 47 1 -35.2% -25.5% $300,000 -$399,999 18 10 2 12 21 1 50.0% -52.4% $400,000 - $499,999 13 7 2 8 11 1 62.5% -36.4% $500,000 - $599,999 6 6 1 7 5 1 -14.3% 20.0% $600,000 - $799,999 13 8 2 9 4 2 44.4% 100.0% $800,000 - $999,999 9 5 2 2 0 Not Valid 350.0% 0.0% $1,000,000 - $1,999,999 4 1 4 3 0 Not Valid 33.3% 0.0% $2,000,000 and up 0 0 Not Valid 0 0 Not Valid 0.0% 0.0% MarketTotals 98 72 1 95 88 1 3.2% -18.2% *Supply Demand Ratio Key 1-4: High Demand 5-6: Balanced 7-9: Low Demand 10+: Very Low Demand TEN-YEAR MARKET HISTORY Average Sale Price $205,677 $191,248 $196,896 $195,776 $208,519 $218,425 $249,159 $266,743 $292,901 $318,208 Average Sale Price Average Price/SqFt $135 $132 $131 $139 $146 $153 $172 $192 $212 $213 Average Price/SqFt Days On Market 178 174 159 137 149 146 131 127 97 90 Days On Market %Sale Price to List Price 97.3 96.8 97.5 96.4 98.5 98.3 98.2 98.7 100.8 99.6 %Sale Price to List Price Source: Mid-Hudson Multiple Listing Service, Residential-attached homes. * Homes sold for 2023 are annualized based on actual sales year-to-date.
4 GLOBAL NETWORKS – REACHING 56 COUNTRIES & 6 CONTINENTS Christie’s International Real Estate Leading Real Estates Companies of the World | Luxury Portfolio International Mayfair International Realty | Board of Regents Luxury Real Estate


