3 minute read
03 Research Method
03
RESEARCH METHOD
Advertisement
The research approaches the research question in two stages (observations from past and lessons for future), to obtain recommendations for Public-Private Partnership in the Australian Social Housing System. However, it is to be noted that the established analytical framework, through the comprehensive review of scholarly articles in the preceding literature review section, forms the foundational basis for analyzing both these stages.
A case study approach, of two contrasting ‘social housing through public housing renewal’ projects in Australia has been employed at both stages. The selection of ‘Bonnyrigg Public Housing Estate Renewal, Sydney and ‘Carlton Public Housing Redevelopment, Melbourne’ for their varied PPP structure, project size (81-hectare vs 7.5-hectare), location (inner vs outer suburb), is attempt to include diverse attributes in the study sample set. However, it is to be noted that attribute of a similar timeframe (through the Global Financial Crisis), justifies the rationale to study both these cases simultaneously (Stubbs et al. 2005, 2017). Although the case study method generates detailed data for analysis, which is vital to understand the influence of the ‘Actors’ on the ‘Place’ outcomes, however, it is to be noted that it introduces limitations like excluding the attributes that are unfound in the selected case studies.
Stage one of the data analysis employs a qualitative observation of both the selected case studies individually. The data collected from varied secondary sources including, baseline & longitudinal surveys, contracts, thesis, journal articles, conference proceedings, government, industry & academic reports, have been organised to understand the project context, the relation between the ‘Actors’ (policy framework, contract) and outcomes (physical, social & economic) of the ‘Place’. Although, the secondary sources have provided detailed insights, it may carry the limitations, biases that were inherent with the data. The table in the Appendix, provides an overview of different data sources with their possible limitations/biases.
Stage two of the data analysis employs a comparative analysis approach through a mix of qualitative and quantitative research methods. While stage one of the analysis provides insight on ‘Actors’ and ‘Place’, the comparative analysis provides the opportunity to introduce context and relate the
dynamics between the ‘Actors’ to the outcome of the ‘Place’. The established analytical framework has been meticulously followed as the standard for comparison and as a strategy to avoid biases from the researcher.
While most of the comparative analyses have been done qualitatively, the outcome of the policy framework has been compared quantitatively. The quantitative research method to compare the outcome of ‘social mix’ policy has used data from ‘Counting Dwelling, Place of Enumeration’ database of ABS (2016) to find the proportion of social housing ‘Landlord’ (State + Housing Cooperative) within the mesh block (MB) geographical level. Although, ‘social mix’ could imply a mix of different attributes, the ‘landlord’ type has been chosen, as ‘social mix’ is practiced as tenure mix in the Australian context (Darcy & Rogers 2019). Although, mesh block (MB) as the spatial level is employed to study social mix at a detailed level, the use of ABS (2016) data, limits the understanding until the project’s completed stages by the year 2016.
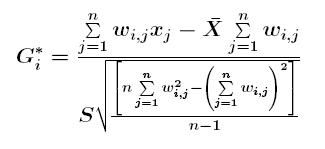
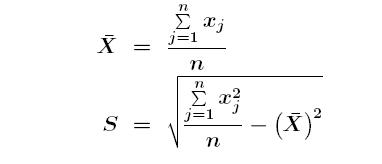
Getis-Ord gi* algorithm has been employed to analyse the concentration of social housing at the selected scale (estate scale) using the open-source qgis software. The algorithm is chosen for its ability to consider the ‘context’, and account for continuing ‘social networks’. While the excerpt below explains the algorithm statistically, a simpler understanding would be, it considers a mesh block to be a hotspot for social housing if the MB has a high concentration of social housing and is also surrounded by highly concentrated MB. Although, the algorithm through the plugin in qgis supports identifying hotspots, it provides limited user control in modifying the threshold of high concentration.
How Hot Spot Analysis (Getis-Ord Gi*) works?
The Getis-Ord Gi* (pronounced G-i-star) statistical analysis considers the null hypothesis of complete spatial randomness (CSR) (i.e., all the attributes of high concentration are randomly spatially dispersed). The analysis returns z-score (standard deviation, as in Figure 2) and p-values (probability) or each attribute (i.e., mesh block). When an attribute with high z-score ( i.e., high concentration), low p-value (rejecting the null hypothesis), then it is considered as a hot spot (ArcGIS Pro 2021).

Figure 2: Calculation of z-score (standard deviation) (ArcGIS Pro 2021)


