2 minute read
Analytics

The graph "Traffic Over Time" depicts the daily site sessions from December 31 to June 16. The traffic shows significant fluctuations, with notable peaks in early February, early March, mid-April, and late May
The highest traffic day appears to be in mid-February, with sessions reaching nearly 400K. Overall, the traffic trend is quite variable, indicating periods of high activity interspersed with lower traffic days
This trend is influenced by the type of social media and website ads deployed during these periods.

D A S H B O A R D
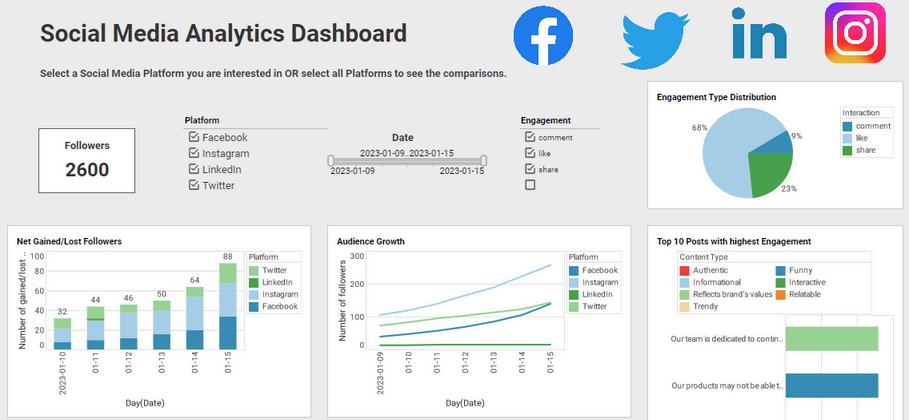
A N A L Y T I C S S U M M A R Y
F O R S O C I A L M E D I A
Objective: Track and analyze social media performance to optimize content strategy and increase engagement
Priority: Monitor follower growth, engagement types, and top performing posts across platforms e b s i t e s
Focus: Identify trends in audience growth, net gained/lost followers, and content types that drive highest engagement.
Exposure: Utilize insights to improve content distribution, enhance engagement strategies, and target key audience segments effectively.


W E B S I T E
D E S I G N
Objective: Create a userfriendly, visually appealing website that effectively communicates the brand message and services.
Priority: Ensure the website is responsive, fast-loading, and optimized for both desktop and mobile devices.
Focus: Highlight key services and products prominently on the homepage, with intuitive navigation to other sections.
Exposure: Implement SEO best practices and integrate social media sharing features to maximize online visibility and traffic


