
Keywords
6Department of marine biology, Faculty of Science and Technology, University of Comoros, Moroni 269, Comoros 01 Jul 2022, in revised form: 26 Jul 2022, 30 July 2022, Available online: 09 Aug 2022 Author(s). Published by AI This is an open access article under the CC BY license y/4.0/(https://creativecommons.org/licenses/b). Leaves phyllosphere, Mangroves, Leaf-wax, Seawater, Canopycover,Bacterialcomposition
4Hubei Provincial Engineering Laboratory for New Fertilizers, Huazhong Agricultural University, Hubei Province, Wuhan 430070, China
Accepted:
International Journal of Advanced Engineering Research and Science (IJAERS) Peer Reviewed Journal ISSN: 2349 6495(P) | 2456 1908(O) Vol 9, Issue 8; Aug, 2022 Journal Home Page Available: https://ijaers.com/ Article DOI: https://dx.doi.org/10.22161/ijaers.98.8 www.ijaers.com Page | 42 Impact of seawater and canopy cover on the phyllosphere bacterial community of Rhizophora mucronata leaves Soudjay Asnat1‡, Said Hassane Fahimat1‡, Allaouia Allaoui Said Ahmed1, An icha Mohamed1, Nemati Mohamed Abdou1 , Soifiata Said Ismail1, Youssouf Abdou Karima, Raissa Sailine1 , Boundjadi Hamdane Aladine5 , Nadjim Ahmed Mohamed1,6 , Ali Mohamed Elyamine1, 2,3, 4* 1Department of Life Science, Faculty of Science and Technology, University of Comoros, Moroni 269, Comoros 2Key Laboratory of Resources and Environmental Microbiology, Department of Biology, Shantou University, Shantou city, Guangdong 515063, R.P of China 3key Laboratory of Arable Land Conservation (Middle and Lower Reaches of Yangtze River), Ministry of Agriculture, Research Center of Micro elements, College of Resource and Environment, Huazhong Agricultural University, Hubei Province, Wuhan 430070, China
5Department of Earth Science, Faculty of Science and Technology, University of Comoros, Moroni 269, Comoros
Received
Publication.
Abstract The plant microorganism interaction is a well studied topic in the world of science due to the sustainable management of the ecosystems. The phyllosphere remains the habitat of some microorganisms where several interactions take place. In order to assess whether the mangrove leaves can harbor a bacterial population and analyze the abundance in these leaves microbiotas, leaf samples of mangroves species (Rhizophora mucronata) were collected in the mangroves of Ouroveni in East Mbandjini, Grande Comoros Through the 16S rRNA genes sequencing, the results showed that in the different experimental group, 105303, 110873, 124703, 146954 and 112225 OTUs were identified respectively, where the canopy was open (C1), semi open (C2), completely closed (C3), and where the plants are submerged (S) and non submerged (NS) in seawater. The identified OTUs was positively correlated with leaves wax (p < 0.05, r2 = 0.91), nitrogen (r2 = 0.72), phosphorus content (r2 = 0.62) and the factor “seawater” (r2 = 0.93). It was however highly and negatively correlated with the canopy cover (r2 = 0.93). Considering the factor "seawater", the relative abundance of bacteria in the submerged leaves was significantly higher compared to that from the non submerged plants. By taking into account the factor “canopy cover”, it was revealed that more the canopy cover was open, the less was the relative abundance of bacteria. Thus, the finding of this present study affirm that the leaves of mangroves can be a major habitat to host a large population of bacteria that can be influenced by local abiotic factor author: elyoh@hotmail.fr (A.M.E) ‡ the two authors have contributed equally
* Corresponding
Received:
©2022 The


The symbiotic relationship between plants and microorganisms is an interesting studied subject in the world of science. They can cohabit together in such a way that each of these two hetero specific organisms benefit from this association Until these several years, the research were mainly focused on microorganisms and their relationships with their host plants (Fatima and Senthil Kumar 2015; Fester et al. 2014). However, several reports showed that different parts zone of plant host can harbor microorganisms which can be used for different scientific need. We distinguished therefore, phyllosphere, the endosphere and the rhizosphere which are considered as a habitat for microorganisms. The phyllosphere is the aerial part of plants mainly the leaf surface, which is an environment largely inhabited by microorganisms (Koskella 2020), while the rhizosphere is the part of the soil penetrated by plant roots and associated microorganisms (Liu et al. 2020). Studies by the rhizosphere are much more advanced compared to that of the phyllosphere. However, quite a large number of the phyllosphere reports are reported recently due to the massive production of data resulting from the use of omics and related technique. This enhanced a significant advance in the understanding of microbial dynamics in the aerial organs of plants, mainly in the leaves. The community of microorganisms living both on the surfaces of plant organs (phylloplane) or inside plant tissues (endosphere), is composed by bacteria, viruses, fungi, algae, archaea and rarely by protozoa and nematodes (Vacher et al. 2016). The phyllosphere designates the community of microorganisms that live in a symbiotic relationship with plants, in particular on leaves, stems, buds and flowers. It is a complex and relatively unknown world of microbes interacting with each other and with host plants, especially with aerial organs.
Nowadays, scientific studies are looking at this new world for a better understanding of this new subject (Lindow and Brandl 2003) and for other interests such as phylloremediation (Wei et al. 2017), pest control (Tripathi et al. 2020), invasion of pathogenic microorganisms on plants in general and leaves in particular (Wang et al. 2019), services for agriculture (Zhang et al. 2019), forestry,Theetc.microbiota of the phyllosphere can be translated to the overall microbial habitat potentially influencing the fitness and functions of their host; which would have an impact on plant biogeography and ecosystem functioning (Yuan et al. 2018). Following this consensus, the microbiota phyllosphere of several plant species, including economically important crop plants, has been explored for their agro alimentary functions. It is now well documented that phyllosphere microbial consortia regulate many plants that have a vital role in plant health as well as plant production (Yuan et al. 2018). Due to their agricultural potential, the phyllosphere microbiota serves as an imperative alternative to chemical fertilizers, which not only facilitate crops to thrive in poor resource and stressful environments, but also provide resistance to combat dangerous pathogens without disrupt the essential ecosystem balance (Weyens et al. 2015).
Asnat et al. International Journal of Advanced Engineering Research and Science, 9(8) 2022 www.ijaers.com Page | 43 I. INTRODUCTION
Recent advanced development in molecular tools, high throughput screening procedures and fusion of omics techniques has greatly improved the understanding of bacterial communities associated with phyllosphere including their structural, functional and ecological properties. Among the phyllosphere microorganisms living on the leaf surface, bacteria is far outnumber other epiphyte groups, both in cell numbers and in diversity of taxonomic groups (Zada et al. 2021). After the soil, the phyllosphere ranks second as the habitat containing the greatest concentration of microorganisms on earth. Indeed, the leaf area of terrestrial plants is estimated at more than 6.4 *108 Km² (Izuno et al. 2016). Given that the bacterial density on the leaf surface reaches 106 107 cells per cm² (Zhang et al. 2019), the phyllosphere remains an indisputable habitat for different types of microorganisms.
Our present study joins recent efforts to highlight the beneficial plant microbe interaction in nature with particular reference to phyllosphere microbiota which can be used in the agricultural, or ecotoxicological sector to respectively boost global food security in conjunction with maintaining environmental sustainability. However, most studies on the microbe plant relationship focus on terrestrial plants and little research is carried out on the marine domain and more particularly on mangroves. Given their particular ecology and the variable environmental conditions faced by these plants of the intertidal zone, it is obvious that these plants could constitute an exceptional habitat for phyllosphere microorganisms and bacteria in particular. This study aims to (i) highlight that the leaves of mangroves (Rhizophora mucronata) can host a large population of bacteria, (ii) analyze the abundance of bacteria in the leaves of Rhizophora mucronata taking into account different factors such as canopy cover and the seawater and (iii) express a correlation between leaf nutrients and the relative abundance of the bacterial population present on the leaves of R. mucronate.
In laboratory, the samples were used to extract phyllosphere bacteria in the leaves surfaces. Leaves were transferred in sterile 500 mL Erlenmeyer where was already added autoclaved water, to suspend the leaves phyllosphere bacteria extract. The sample was alternately manually shaken, four times in total. The leaves were then removed and the solution was used as the phyllosphere bacteria extract.
2 Determination of leaves characteristics
Total genomic DNA of the different sample was extracted using an Ultra Clean Microbial DNA Isolation Kit (MoBio Laboratories, Carlsbad, CA, USA). Polymerase Chain Reaction (PCR) amplification of the 16S rRNA genes from the V3 V4 region of each sample was conducted by using the universal primers, 338F (5'
Design and collection of samples
Data were subjected to statistical analysis of variance (ANOVA) in SPSS (20) software. Differences between
1
The leaves of the mangrove species (Rizhophora mucronata) were collected in the intertidal zone of Ouroveni in East Mbandjini, Grande Comoros (longitude: 11°54’45 S, latitude: 43°41’08 E and altitude: 0 m)
Leaf water content (%)=fresh weight dried weight sample weight *100 eq (1) Leaf wax(%)=reweightflask preweightflash sampleweight ∗100 eq(2)
Leaves samples were collected by considering the canopy cover state and seawater as separate factors. Considering the canopy factor, three sampling zones were established: zone 1 corresponding to the canopy fully open (0 10%) and denoted C1; zone 2 corresponding to the semi open/close of the canopy (50 70%) and denoted C2 and zone 3 corresponding to the canopy fully close (100%) denoted C3. The percentage of the canopy was estimated by using a densiometer at a fixed point and rotating through the four cardinal points. The canopy percentage was then calculated according to occupied small square, as was described in (Elyamine 2012). In each branch where leaves were collected, we considered three levels which were basal denoted Ci 1, medium (Ci 2) and apical denoted Ci 3 where i can be 1, 2 or 3 accordingly. In addition to the canopy factor, plants submerged and not submerged in seawater were also considered. Leaves were collected with sterilized scissors with 70% ethanol on site. Twenty seven healthy green and mature leaves were collected for each mangrove zone at 1.5 2 m height. They were then sealed in a sterile 500 mL PVC bags and brought to the laboratory. After collect, leaves samples were divided into two groups; the first one was used for bacterial experimental purposes and the second one for the determination of leaves characteristics. An empty bag without leaves was considered as control denoted CR.
The de duplication and filter qualification of the raw fastq files, sequences classification, annotation and beta diversity distance calculation were performed by using Quantitative Insights Into Microbial Ecology (QIIME Version 1.9). UPARSE software (version 7.0.1001) was used to group the filtered sequences OTUs clustered with a 97% similarity cutoff. At 97% of confidence threshold, the taxonomy of each 16S rRNA gene sequence was analyzed using 16S rRNA database and the RDP Classifier (version 2.11). Different functional genes composition of bacterial community was determined by using PICRUST.
A party of mangroves species leaves were used to determine leaves surface area. Graph paper was used to draw the outer shape of leaf and calculate the surface area in square meters as was reported in (Pandey and Singh 2011). Ohers characteristics were determined in the laboratory of environmental microbiology at Shantou University, Guangdong, China. Leaves water and wax contents were expressed as the percentage of fresh weight and determined as was described in (Waight et al. 2007) Briefly, to determine leaf water content, the leaves samples were weighed (4 g) and dried for 24 h at 105°C in an oven. Thereafter, the dried sample was cooled in a desiccator and weighed. The percentage of leaf water content was calculated by using the following equation (1). The same weight of sample (4 g) was weighted and used to extract wax content with 20 mL hexane in a microwave extractor. The GF/C filter was used to filter the extract into a round bottom drying flask. The total was pre weighed before drying by rotary evaporator. After drying, the round bottomed flask was reweighed and the percentage of wax was calculated by using the following equation (2). Nitrogen (N) and phosphorus (P) contents were analyzed by using respectively, Kjeldahl method and double digestion with H2SO4 and perchloric acid method.
3- Leaves phyllosphere bacteria extraction
6 Statistical Analysis
Asnat et al. International Journal of Advanced Engineering Research and Science, 9(8) 2022 www.ijaers.com Page | 44 II. MATERIALS AND METHOD
ACTCCTACGGGAGGCAGCAG 3') and 806R (5' GGACTACHVGGGTWTCTAAT 3') as was described in (Huang et al. 2014). The extracted DNA was sent to Sangon Biotec Institute (SBI) platform at Shanghai, China, to be sequenced. DNA concentrations and purity were measured using a NanoDrop 2000 spectrophotometer (Thermo Fisher Scientific, USA).
4- DNA Extraction and amplification
5 Computational analysis
Data are the mean of three replicate ± SD and were compared by Duncan's multiple range tests at p < 0.05.
1- Leaves characteristics
Asnat et al. International Journal of Advanced Engineering Research and Science, 9(8) 2022 www.ijaers.com Page | 45 means and multiples stepwise were performed using the appropriate post hoc with a 95% confidence level. ANOSIM was used to evaluate similarities among different experimental group. The Shannon index was calculated to describe α diversity and the richness of microbiota. Different graphs were performed by using SigmaPlot and Origin pro. III. RESULTS
Leaf area, water content, leaf wax content and nutrients such as nitrogen and phosphorus were determined in leaves of R. mucronata species and plotted on the Table 1. Statistical results of leaf area in different collection areas show no significant difference. However, although no difference was observed, the leaves collected from the plants submerged in seawater (S1, S2 and S3) had a slightly reduced surface area. The leaves water content of this mangrove species was also measured. It was observed that the water content in the leaves of submerged plants (S1, S2 and S3) was significantly higher compared to that in the leaves of non submerged plants (NS1, NS2 and NS3). The leaves of the plants collected from the different plants showed a significant difference in wax content. Leaf wax content in non submerged plants (NS1, NS2, and NS3) was higher compared to that in leaves of plants from submerged ones. Therefore, the order of leaf wax content was arranged as follows: Ci<S<NS. The nitrogen content in the green leaves of different mangrove plants was also determined. The leaf N content of non submerged plants (NS1, NS2, and NS3) was significantly higher than that of submerged plants (S1, S2, and S3). Additionally, considering the canopy cover, the leaves collected in the zone where the canopy was totally closed (C3), the N content was more considerable compared to that in the leaves in the other two zones (C1 and C2).The phosphorus content of the leaves of the plants collected in the different zones was also measured. The P content in leaves of non submerged mangrove plants (NS1, NS2, and NS3) was slightly higher than that of submerged plants. The order of P content in the leaves of different mangrove plants was as follows: Ci<S<NS. S3 NS2 ± 0.7 NS3 27.23 ± 8.7 26.75 ± 4.4 21.98 ± 4.5 2.34 ± 2.2 0.29 ± 0.7
24.77 ± 6.5 43.12 ± 7.4 16.46 ± 4.1 1.98 ± 1.5 0.13 ± 1.7 NS1 28.98 ± 6.4 27.76 ± 4.1 22.87 ± 5.6 2.98 ± 0.3 0.29 ± 0.6
Table.1: leaves characteristics including the surface, water, wax, nitrogen and phosphorus content experimentalGroup Leaves(cmSurface 2) contentWater(%) Wax(%)contents Nitrogen(mg/Kg) Phosphorus(mg/Kg) C1 24.76 ± 9.5 26.85 ± 3.8 17.36 ± 4.3 0.95 ± 0.3 0.08 ± 0.2 C2 28.04 ± 7.6 29.67 ± 2.4 14.75 ± 7.2 0.99 ± 1.2 0.07 ± 06 C3 29.54 ± 5.3 28.68 ± 2.7 16.45 ± 6.6 1.05 ± 1.2 0.05 ± 1.4 S1 27.66 ± 4.5 39.65 ± 4.2 17.56 ± 4.4 1.86 ± 0.4 0.11 ± 1.1 S2 25.25 ± 8.2 41.85 ± 7.2 15.65 ± 7.2 1.67 ± 2.6 0.10 ± 0.3
2 Bacterial community in the leaves of the species R. mucronata After sequencing the 16S rRNA genes, the number of OTUs identified in the different leaves of mangrove plants was significantly higher compared to those identified in the control (CR1 and CR2). In the different experimental groups, 105303, 110873, 124703, 146954 and 112225 OTUs were identified respectively in the leaves where the canopy was fully open (C1), semi open/closed (C2), totally closed (C3), where the plants were submerged in seawater (S) and where the plants were out of the water (NS) (Table 2). The OTUs identified were different in the three different areas, taking into account the canopy cover. The results show that the more the canopy is closed, the more the number of OTU increases. On the other hand, considering seawater as a factor, the number of OTUs identified on the leaves of submerged plants was significantly higher than that identified in non submerged plants. These results suggest that the number of OTUs in
27.46 ± 8.9 27.78 ± 8.5 22.98 ± 4.3 2.65 ± 0.3 0.19
4.1 Based on class level
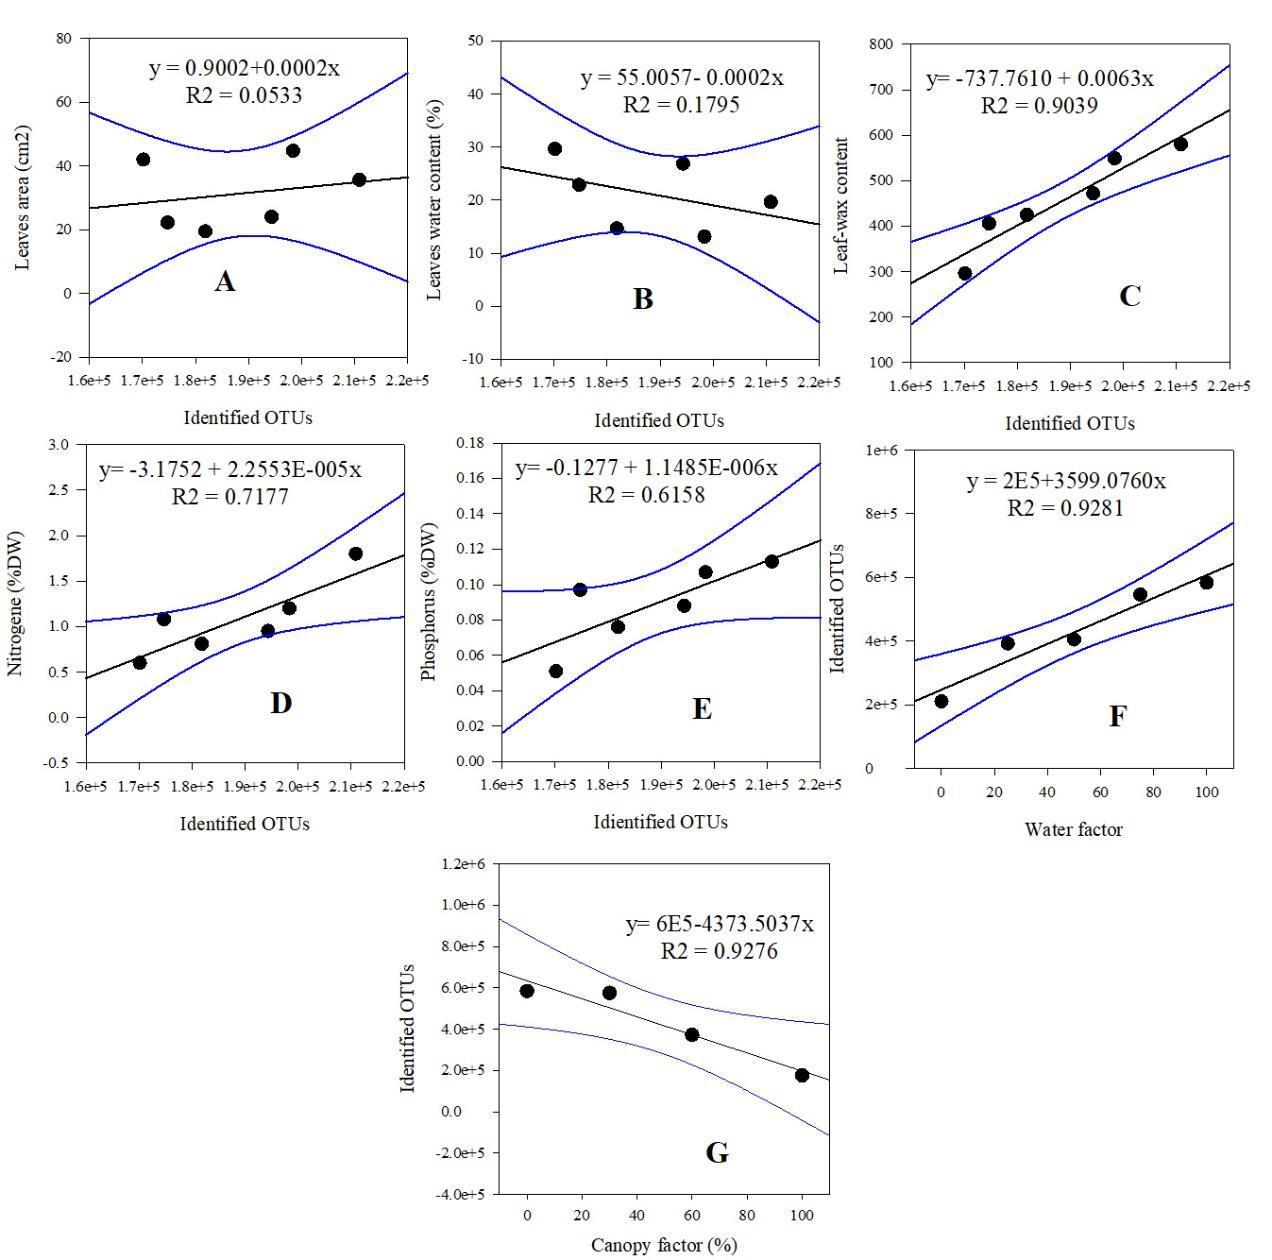
Correlation test was performed to assess the possible relationship between different leaves characteristics (leaves surface area, leaves water content, leaf wax, nitrogen and phosphorus content) and local abiotic environmental factor (canopy cover and seawater) with the abundance of bacteria in the different mangroves leaves (Figure 1). It was revealed that bacterial abundance moderately correlated to plant leaves surface area (Fig 1A, r2 = 0.053). However it showed no correlation with plant leaves water content (Fig 1B, r2 = 0.1795). The identified OTUs in all different mangroves leaves was found to positively correlated with leaf wax, nitrogen and phospgorus content and the factor seawater (Fig 1C, r2 = 0.904, Fig 1D, r2 = 0.72, Fig 1E, r2 = 0.62 and Fig 1F, r2 = 0.93) respectively. On the other hand, the abundance of identified OTUs was negatively correleted with the factor canopy cover (Fig 3G, r2 = 0.93).
The bacterial relative abundance of R. mucronata leaves was assessed at the class level (Figure 2). It was shown that in the three experimental groups (Ci, Si and NSi), Gammaprotebacteria was the most dominated class with more than 50% on average of the total bacteria identified. Betaprotebacteria and Bacilli are the next with 23% and 19% respectively. The relative abundance of Proteobacteria in general including Gamma, Alpha and Betaproteobacteria is far the highest with more than 78%. Compared to the control, apart from individuals belonging to the class of Gammaproteobacteria, most of the bacteria identified presented less than 1%.
The relative abundance of bacteria in R. mucronata leaves was further assessed at the family level (Figure 3). Enterobacteraceae were the most dominant bacterial family in the leaves of all the collected mangrove plants, whether they were in where the canopy was open (C1), semi open (C2) or fully closed (C3), or where plants are submerged or not (Si or NSi). Rhodocyclaceae is the
IV. BACTERIAL COMPOSITION ON THE R. MUCRONATA LEAVES
4.2 Based on family level
Asnat et al. International Journal of Advanced Engineering Research and Science, 9(8) 2022 www.ijaers.com Page | 46 the phyllosphere depends not only on water availability, but also on canopy cover. The richness estimated by the Shannon and Chao indices showed a slight difference in favor of the presence of seawater (S) and also at canopy closure (C3). However, no significant difference was noted when comparing the results from the leaves of submerged and non submerged plants. Table 2: Different bacterial OTUs and estimated bacterial abundance and diversity alpha indexes in different mangroves species leaves ExperimentalGroup Code bar Seq_Num Num- OTUs Shannon index Chao index CR1 TCCGAC 45372 68563 2.06 ± 0.23 356.28 ± 36.33 CR2 AGCTAG 42387 59564 2.02 ± 0.24 346.14 ± 41.33 C1 CTGACG 61408 105303 2.18 ± 0.23 376.18 ± 46.33 C2 CACGAT 78803 110873 3.39 ± 0.67 411.14 ± 30.87 C3 CGCATA 89494 124703 3.48 ± 0.22 445.11 ± 28.42 S1 CGCCAT 91882 148373 4.39 ± 0.24 478.17 ± 32.86 S2 TCTATT 91075 147330 4.34 ± 0.26 467.16 ± 30.59 S3 AGGCGG 91930 145160 4.53 ± 0.45 483.15 ± 34.61 NS1 ATTGTG 73480 111830 3.13 ± 0.47 444.15 ± 37.38 NS2 TATCGA 74961 112982 3.62 ± 0.55 456.13 ± 41.18 NS3 GCCGCT 73712 111863 3.35 ± 0.74 444.15 ± 31.18 Data are the mean of three replicate ± SD and were compared by Duncan's multiple range tests at p < 0.05. Seq_Num is the quality number of samples reads and Num OTUs is the 16S rRNA sequences OTUs obtained by sample clustering and normalized.
3 Correlation between different identified OTUs and different factors
Asnat et al. International Journal of Advanced Engineering Research and Science, 9(8) 2022
Page
Fig 1 : Correlation between leaves areas (A), leaves water content (B), leaves wax (C), leaves nitrogen (D), phosphorus (E) and local abiotic factors (F and G) with bacterial identified OTUs. Bacterial identified OTUs moderately correlated to plant leaves surface area (r2 = 0.053), showed no correlation with plant leaves water content (r2 = 0.1795), positively correlated with leaf wax, nitrogen and phospgorus content and the factor seawater (r2 = 0.904, r2 = 0.72, r2 = 0.62 and r2 = 0.93) respectively and negatively (p < 0.05, r2 = 0.93) with the canopy cover factor.
www.ijaers.com | 47 second family identified on the leaves of the species R. mucronata with 21%. 4.3 Based on genus level The relative abundance of bacteria in the leaves of R. mucronata was finally assessed at the genus level (Figure 4). The genus Pantoa was the most abundant in C3 3, S 1, S 3, N S1, and NS 3 with more than 60% on average and less abundant or even almost absent in CR1, C1 1, C1 2 and C3 1. On the other hand, the genus Metthyloversalitis was rather more dominant in CR2, C1 1, C2 2, C3 1 and C3 2. In the experimental groups C1 3, C2 1 and C2 3, more than half of the bacteria belonging to the Enterobacteriaceae family are unclassified.
0 20 40 60 80 100 relative(%)Abondance Groupeexperimental Other Sphingobacteriia Actinobacteria Alphaproteobacteria Deinococci Bacilli Betaproteobacteria Gammaproteobacteria CR1CR2C1-1C1-2C1-3C2-1C2-2C2-3C3-1C3-2C3-3S-1S-2S-3NS-1NS-2NS-3 0 10 20 30 40 50 60 70 80 90 100 relative(%)Abondance Groupexperimental Other Bradyrhizobiaceae Staphylococcaceae Micrococcaceae Burkholderiaceae Chitinophagaceae Sphingomonadaceae Rhizobiaceae Enterococcaceae Bacillaceae_1 Caulobacteraceae Xanthomonadaceae Microbacteriaceae Comamonadaceae Streptococcaceae Pseudomonadaceae Moraxellaceae Thermaceae Rhodocyclaceae Enterobacteriaceae
CR1CR2C1-1C1-2C1-3C2-1C2-2C2-3C3-1C3-2C3-3S-1S-2S-3NS-1NS-2NS-3
different classes
Asnat et al. International Journal of Advanced Engineering Research and Science, 9(8) 2022 www.ijaers.com Page | 48
classes
Fig 2 : Bacterial relative abundance at the class level. The horizontal and vertical axis represent respectively the name of each sample and the abundance ratio in three replications. Each color corresponds to the name of the class and at the same time indicates the abundance of the different
Fig 3: Bacterial relative abundance at the family level. The horizontal and vertical axis represent respectively the name of each sample and the abundance ratio in three replications. Each color corresponds to the name of the class and at the same time indicates the abundance of the
The relative abundance of bacteria present on R. mucronata leaves was assessed at the family level, by considering the factor “canopy cover” (Figure 5). Among the different identified families, it was noted that the more the canopy cover was open, the lower was the relative abundance of bacteria. Enterobacteriaceae are the most dominant with more than 67% of all the identified bacteria in zone C. On the other hand, in comparison with the control, the relative abundance of bacteria in zone C1 1, C2 1 and C3 1 was lower. This supports the results that the relative abundance of bacteria is dependent on the state of the canopy cover.
Ralstonia
Experimentalgroup Other unclassified_Rhizobiaceae unclassified_Microbacteriaceae unclassified_Enterobacteriaceae Novosphingobium Staphylococcus Xanthomonas Micrococcus Burkholderia Bacillus Sediminibacterium Sphingomonas Rhizobium Hafnia Anoxybacillus Escherichia_Shigella Vulcaniibacterium Enterococcus Phenylobacterium Zoogloea Schlegelella Lactococcus Pseudomonas Acinetobacter Thermus Methyloversatilis Pantoea Fig 4 : Bacterial relative abundance at the genus level. The horizontal and vertical axis represent respectively the name of each sample and the abundance ratio in three replications. Each color corresponds to the name of the class and at the same time indicates the abundance of the different classes IMPACT OF LOCAL ABIOTIC FACTOR ON R.MUCRONATA LEAVES BACTERIA
The relative abundance of bacteria present on R. mucronata leaves was further evaluated at the family level by considering the factor “seawater” (Figure 6). In general, the results obtained in the different experimental groups (Si and NSi) are important compared to those found in the control. However, the variation in relative abundance of the different bacteria correlated with the factor seawater. The relative abundance of bacteria in leaves collected from submerged plants was significantly higher compared to that in the leaves collected from non submerged plants. This again supports the fact that the relative abundance of bacteria was dependent on the water factor.
V.
5.1. Influence of canopy cover
Asnat et al. International Journal of Advanced Engineering Research and Science, 9(8) 2022 www.ijaers.com Page | 49 CR1CR2C1-1C1-2C1-3C2-1C2-2C2-3C3-1C3-2C3-3S-1S-2S-3NS-1NS-2NS-3 0 10 20 30 40 50 60 70 80 90 100 (%)abundancerelative
5.2. Influence of seawater
Experimentalgroup
Experimentalgroup
(%)abundanceRelative
Fig 6: Bacterial relative abundance at the family level taking into account the seawater factor. The horizontal and vertical axis represent respectively the name of each sample and the abundance ratio in three repetitions. Each color corresponds to the name of the class and at the same time indicates the abundance of the different families.
Other Bradyrhizobiaceae Staphylococcaceae Micrococcaceae Burkholderiaceae Chitinophagaceae Sphingomonadaceae Rhizobiaceae Enterococcaceae Bacillaceae_1 Caulobacteraceae Xanthomonadaceae Microbacteriaceae Comamonadaceae Streptococcaceae Pseudomonadaceae Moraxellaceae Thermaceae Rhodocyclaceae Enterobacteriaceae
Asnat et al. International Journal of Advanced Engineering Research and Science, 9(8) 2022 www.ijaers.com Page | 50 CR1 C1-1 C1-2 C1-3 C2-1 C2-2 C2-3 C3-1 C3-2 C3-3 0 10 20 30 40 50 60 70 80 90 100
30 40 50 60 70 80 90
Fig 5: Relative bacterial abundance at the family level taking into account the factor canopy. The horizontal and vertical axis represent respectively the name of each sample and the abundance ratio in three repanditions. Each color corresponds to the name of the class and at the same time indicates the abundance of the different families. CR2 S-1 S-2 S-3 NS-1 NS-2 NS-3 NS-3 0 10 20 100
(%)abundanceRelative
Other Bradyrhizobiaceae Staphylococcaceae Micrococcaceae Burkholderiaceae Chitinophagaceae Sphingomonadaceae Rhizobiaceae Enterococcaceae Bacillaceae_1 Caulobacteraceae Xanthomonadaceae Microbacteriaceae Comamonadaceae Streptococcaceae Pseudomonadaceae Moraxellaceae Thermaceae Rhodocyclaceae Enterobacteriaceae
The present study showed that the leaves of the mangroves (Rhizophora mucronata) constitute a special environment capable of hosting a diverse bacterial community. The analysis of bacteria abundance and composition revealed that factors which influenced diversity and abundance of the different microbial taxa included the local abiotic environment to which the plant and its leaves are exposed, the nutrients and characteristics of the leaves. However, although much information has been obtained from individual studies on the plant microbiome, the present study suggest that meta analyses controlling and others different methodologies are needed
VII. CONCLUSION
The wax content of the leaves has proven to be a critical parameter not only for the water conservation of the leaves, but also for the dynamism of the bacterial community phyllosphere of plant leaves. Studies have shown that, unlike the presence of trichomes (Reisberg et al. 2012), the composition of the cuticular wax influences the composition of bacterial communities in the phyllosphere (Reisberg et al. 2013; Bodenhausen et al. 2014) The leaf wax content in the different leaves of the species R. mucronata was different (Table 1). This result was consistent with that found by (Wang et al. 2008) which reported that the leaf wax content in Rhizophora stylosa was important. Leaf wax content was found to be positively correlated with OTUs identified. The leaves of plants, as organs is constantly exposed to pressures environmental, and exhibit several adaptive characteristics, such as the production of varieties of primary and secondary metabolites, among which are the constituents of the epicuticular wax that lines the leaf surface (Barthlott et al. 1998) These complex compounds consisting of long chain aliphatic and cyclic components, including hydrocarbons, alcohols, aldehydes, flavonoids, etc., coat the outer surface of the epidermis of all the leaves of higher plants (Medina et al. 2006; Kunst and Samuels 2009) and plays an important role in the restriction of cuticularWatertranspiration.isanincontestable living factor for all organisms (animals, plants and microorganism). It absence could not only impact plant viability, but also affect the microbial community on plant leaves. Naturally, plants exposed to permanent water conditions exhibit low quantity of epicuticular wax than those in drought conditions (Oliveira et al. 2003; Cordeiro et al. 2011) This could explain the difference in the results observed among submerged and non submerged mangrove species. The amount and distribution of water on the leaf is another highly dynamics of the foliar microclimate which greatly influences the development of micro organizations (Morris 2001) (Yadav et al. 2005) showed that leaf water content is the main factor in the abundance of phyllosphere bacteria in trees and shrubs Mediterranean, followed by leaf phosphorus content. The water content of the leaves of submerged mangroves was significantly higher than that of non submerged mangroves (Table 1). Naturally, water in the leaves favors chemical reactions between the compounds dissolved in rain or dew water and those that escape from leaf. These reactions in turn have an effect on the microorganisms of the phyllosphere by altering water pH and nutrient availability (Morris 2001)
Asnat et al. International Journal of Advanced Engineering Research and Science, 9(8) 2022 www.ijaers.com Page | 51 VI. DISCUSSION
The results of the nitrogen and phosphorus content of the leaves were in agreement with that found by (Kembel and Mueller 2014) which reported that nutrients such as N and P influence bacterial community structure in tropical trees. Besides the nutrients on the mangroves leaves, it was found that the canopy cover was negatively correlated with the identified OTUs. Indeed, the greater was open the canopy cover, the lower the relative abundance of the identified bacteria was. Studies have shown that the environmental factors can alter the size and structure of communities in the phyllosphere in several ways, including environmental events such as rain (Vorholt 2012), the host plants and canopy cover (Khondoker et al. 2020). Studies by (Truchado et al. 2019; Aydogan et al. 2018) have shown as environmental factors such as temperature and solar radiation (prevent or promote canopy cover) have been implicated in themodification of the microbial community. The correlation test revealed that the abundance of identified OTUs was not correlated with the surface of plant leaves. As a reminder, mangroves are halophilic plants i.e. that resist and thrive in saline conditions. The leaves of the mangroves are therefore known to secrete salt through salt glands located at their base. Studies on mangroves have shown a high accumulation of salt on their leaves, linked to the ability to the plant to resist salinity (Dias et al. 2012; Clough 1984). Although we know nothing about the effects of salt accumulation in the leaves on the microbial communities of the phyllosphere, due to salt exudation, it can be easily to imagine an impact negative on the whole microbial community. However, the non correlation of the abundance of OTUs identified with leaf area suggested that the relationship between microorganisms and mangrove leaves could have another factor besides saline exudation and the adhesion surface which are considered to be contributors to the survival of the phyllosphere, as a means of dispersal (Grinberg et al. 2019)
[4] Clough, B. 1984. Growth and salt balance of the mangroves Avicennia marina (Forsk.) Vierh. and Rhizophora stylosa Griff. in relation to salinity. Functional Plant Biology 11 (5):419 430.
[23] Reisberg, E. E., U. Hildebrandt, M. Riederer, and U. Hentschel. 2012. Phyllosphere bacterial communities of trichome bearing and trichomeless Arabidopsis thaliana leaves. Antonie Van Leeuwenhoek 101 (3):551 560.
[11] Huang, J., Z. Li, X. Nie, J. Zhang, Z. Tang, W. Ma, W. Yu, and G. Zeng. 2014. Microbial responses to soil rewetting in erosional and depositional environments in relation to the organic carbon dynamics. Geomorphology 204:256 264.
[2] Barthlott, W., C. Neinhuis, D. Cutler, F. Ditsch, I. Meusel, I. Theisen, and H. Wilhelmi. 1998. Classification and terminology of plant epicuticular waxes. Botanical journal of the Linnean society 126 (3):237 260.
[8] Fatima, U., and M. Senthil Kumar. 2015. Plant and pathogen nutrient acquisition strategies. Front Plant Sci 6:750.
[14] Khondoker, M. G. D., Farzana Haque Tumpa, Afruja Sultana, Mst Arjina Akter, and A. Chakraborty. 2020. Plant microbiome an account of the factors that shape community composition and diversity. Current Plant Biology 23 (100161).
[22] Pandey, S., and H. Singh. 2011. A simple, cost effective method for leaf area estimation. Journal of botany 2011 (2011):1 6.
[12] Izuno, A., A. S. Tanabe, H. Toju, M. Yamasaki, S. Indrioko, and Y. Isagi. 2016. Structure of phyllosphere fungal communities in a tropical dipterocarp plantation: A massively parallel next generation sequencing analysis. Mycoscience 57 (3):171 180.
[13] Kembel, S. W., and R. C. Mueller. 2014. Plant traits and taxonomy drive host associations in tropical phyllosphere fungal communities. Botany 92 (4):303 311.
[10] Grinberg, M., T. Orevi, and N. Kashtan. 2019. Bacterial surface colonization, preferential attachment and fitness under periodic stress. PLoS computational biology 15 (3):e1006815.
Asnat et al. International Journal of Advanced Engineering Research and Science, 9(8) 2022 www.ijaers.com Page | 52 to better understand the leaf microbe associations of mangroves and whether they are suitable for particular beneficial effects. ACKNOWLEDGMENTS
REFERENCES
[6] Dias, A. C. F., Rodrigo. Gouveia Taketani, Fernando. Dini Andreote, and Dani. 2012. Interspecific Variation Of The Bacterial Community Structure In The Phyllosphere Of The Three Major Plant Components Of Mangrove Forests. Brazilian Journal of Microbiology: 653 660.
[15] Koskella, B. 2020. The phyllosphere. Curr Biol 30 (19):R1143 R1146. [16] Kunst, L., and L. Samuels. 2009. Plant cuticles shine: advances in wax biosynthesis and export. Current opinion in plant biology 12 (6):721 727.
[17] Lindow, S. E., and M. T. Brandl. 2003. Microbiology of the phyllosphere. Applied Environmental Microbiology 69 (4):1875 1883. [18] Liu, M., S. Adl, X. Cui, Y. Tian, X. Xu, and Y. Kuzyakov. 2020. In situ methods of plant microbial interactions for nitrogen in rhizosphere. Rhizosphere 13:100186.
[20] Morris, C. E. 2001. Phyllosphere. e LS [21] Oliveira, A. F., S. T. Meirelles, and A. Salatino. 2003. Epicuticular waxes from caatinga and cerrado species and their efficiency against water loss. Anais da Academia Brasileira de Ciências 75:431 439.
[24] Reisberg, E. E., U. Hildebrandt, M. Riederer, and U. Hentschel. 2013. Distinct phyllosphere bacterial communities on Arabidopsis wax mutant leaves. Plos One 8 (11):e78613. [25] Tripathi, S., V. K. Singh, P. Srivastava, R. Singh, R. S. Devi, A. Kumar, and R. Bhadouria. 2020. Phytoremediation of organic pollutants. In Abatement of Environmental Pollutants, 81 105.
[26] Truchado, P., M. I. Gil, M. Moreno Candel, and A. Allende. 2019. Impact of weather conditions, leaf age and irrigation water disinfection on the major epiphytic bacterial genera of baby spinach grown in an open field. Food microbiology 78:46 52. [27] Vacher, C., A. Hampe, A. J. Porté, U. Sauer, S. Compant, and C. E. Morris. 2016. The Phyllosphere: Microbial Jungle
[3] Bodenhausen, N., M. Bortfeld Miller, M. Ackermann, and J. A. Vorholt. 2014. A synthetic community approach reveals plant genotypes affecting the phyllosphere microbiota. PLoS genetics 10 (4):e1004283.
The authors gratefully acknowledge the laboratory of environmental microbiology of Shantou University for their remarkable support.
[1] Aydogan, E. L., G. Moser, C. Müller, P. Kämpfer, and S. P. Glaeser. 2018. Long term warming shifts the composition of bacterial communities in the phyllosphere of Galium album in a permanent grassland field experiment. Frontiers in Microbiology 9:144.
[19] Medina, E., G. Aguiar, M. Gomez, J. Aranda, J. Medina, and K. Winter. 2006. Taxonomic significance of the epicuticular wax composition in species of the genus Clusia from Panama. Biochemical Systematics Ecology 34 (4):319 326.
[5] Cordeiro, S. Z., N. K. Simas, R. d. C. de Oliveira Arruda, and A. Sato. 2011. Composition of epicuticular wax layer of two species of Mandevilla (Apocynoideae, Apocynaceae) from Rio de Janeiro, Brazil. Biochemical Systematics Ecology 39 (3):198 202.
[9] Fester, T., J. Giebler, L. Y. Wick, D. Schlosser, and M. Kastner. 2014. Plant microbe interactions as drivers of ecosystem functions relevant for the biodegradation of organic contaminants. Curr Opin Biotechnol 27:168 175.
[7] Elyamine, A. M. 2012. Etude De La Distribution Et De L’habitat Des Reptiles Nocturnes D’anjouan Comores. Master, Faculte des Sciences et Techniques, Universite des Comores, Moroni.
[30] Wang, P., K. Z. Du, Y. X. Zhu, and Y. Zhang. 2008. A novel analytical approach for investigation of anthracene adsorption onto mangrove leaves. Talanta 76 (5):1177 1182.
[31] Wang, Q., H. Sun, C. Xu, L. Ma, M. Li, C. Shao, Y. Guan, N. Liu, Z. Liu, S. Zhang, L. Zhang, and Y. Zhang. 2019. Analysis of rhizosphere bacterial and fungal communities associated with rusty root disease of Panax ginseng. Applied Soil Ecology 138:245 252.
Asnat et al. International Journal of Advanced Engineering Research and Science, 9(8) 2022 www.ijaers.com Page | 53 at the Plant Climate Interface. Annual Review of Ecology, Evolution, and Systematics 47 (1):1 24. [28] Vorholt, J. A. 2012. Microbial life in the phyllosphere. Nat Rev Microbiol 10 (12):828 840. [29] Waight, K., O. Pinyakong, and E. Luepromchai. 2007. Degradation of phenanthrene on plant leaves by phyllosphere bacteria. The Journal of general applied microbiology 53 (5):265 272.
[34] Yadav, R., K. Karamanoli, and D. Vokou. 2005. Bacterial colonization of the phyllosphere of Mediterranean perennial species as influenced by leaf structural and chemical features. Microbial Ecology 50 (2):185 196.
[33] Weyens, N., S. Thijs, R. Popek, N. Witters, A. Przybysz, J. Espenshade, H. Gawronska, J. Vangronsveld, and S. W. Gawronski. 2015. The Role of Plant Microbe Interactions and Their Exploitation for Phytoremediation of Air Pollutants. Int J Mol Sci 16 (10):25576 25604.
[32] Wei, X., S. Lyu, Y. Yu, Z. Wang, H. Liu, D. Pan, and J. Chen. 2017. Phylloremediation of Air Pollutants: Exploiting the Potential of Plant Leaves and Leaf Associated Microbes. Front Plant Sci 8:1318.
[35] Yuan, J., Y. Wu, M. Zhao, T. Wen, Q. Huang, and Q. Shen. 2018. Effect of phenolic acids from banana root exudates on root colonization and pathogen suppressive properties of Bacillus amyloliquefaciens NJN 6 Biological Control 125:131 137. [36] Zada, S., H. Zhou, J. Xie, Z. Hu, S. Ali, W. Sajjad, and H. Wang. 2021. Bacterial degradation of pyrene: Biochemical reactions and mechanisms. International Biodeterioration & Biodegradation 162. [37]Zhang, X., G. Gao, Z. Wu, X. Wen, H. Zhong, Z. Zhong, F. Bian, and X. Gai. 2019. Agroforestry alters the rhizosphere soil bacterial and fungal communities of moso bamboo plantations in subtropical China. Applied Soil Ecology 143:192 200.