
2
Abstract Land cover information based on remote sensing imagery is effective information for land use management. The use of Sentinel 2 imagery is considered to be able to provide better information on land cover because it has a spatial accuracy of 10 meters. Convolutional Neural Networks is one of the deep learning methods that can be used for image interpretation in order to obtain image classification results which will later obtain information about land cover. PCA CNN (Principal Component Analysis Convolutional Neural Network) is a development method of the Convolutional Neural Network method which gives special treatment to the dimension reduction process in the input data. The dimension reduction process is carried out by utilizing the PCA method so that the data processing process becomes faster without losing important information so that better method performance is obtained. The PCA CNN method is implemented on a dataset of the Situbondo district which is classified into five land cover classes. The results of the PCA CNN method have an Overall Accuracy of 94.4% and Kappa Indeks 0,92 with 100 epochs of repeated experiments.
Received:
Publication.
1 Departmen of matematic. FMIPA. UniversitasJember, Indonesia
Keywords Land Cover, Sentinel-2, Deep Learning, PCA, CNN.
I. INTRODUCTION
Email:
Email: afhadi@unej.ac.id 3 Departmen of Agricultural Engineering.FTP. UniversitasJember, Indonesia indarto.ftp@unej.ac.id 09 Jul 2022, Received in revised form: 01 Aug 2022, 07 Aug 2022, Available online: 15 Aug 2022 ©2022 The Author(s). Published by AI This is an open access article under the CC BY license (https://creativecommons.org/licenses/by/4.0/).
Email: rizqipradana07@gmail.com Departmen of matematic. FMIPA. UniversitasJember, Indonesia
Accepted:
The large area and the mapping of the Situbondo area that has not been mapped properly are separate obstacles in the process of developing and planning the area. Automation of land cover monitoring and classification is required to monitor existing land use. The technology needed to analyze the earth's land cover automatically and cover a large area is by utilizing geospatial data in the form of satellite image data. One of the satellite images that can be used is the Sentinel 2. Sentinel 2 imagery is an image generated from remote sensing by the Sentinel 2 satellite. The Sentinel 2 satellite is equipped with a multispectral and has 13 bands obtained from the multispectral imager [11]. Automation methods for processing Sentinel 2 satellite imagery include the use of deep learning. Deep learning is a learning method for data that aims to create a multilevel data representation [1]. The most important thing about deep learning emphasizes that the data representation is not made explicitly by humans but is generated by an algorithm [5]. According to Heryadi and [5] in the last ten years the application of deep learning shows that models based on Convolutional Neural Networks (CNN) with deep structures have excellent performance in the field of
International Journal of Advanced Engineering Research and Science (IJAERS) Peer Reviewed Journal ISSN: 2349-6495(P) | 2456-1908(O) Vol-9, Issue-8; Aug, 2022 Journal Home Page Available: https://ijaers.com/ Article DOI: https://dx.doi.org/10.22161/ijaers.98.22 www.ijaers.com Page | 188 Application of PCA-CNN (Principal ComponentAnalysis – Convolutional Neural Networks) Method on Sentinel-2 Image Classification for Land Cover Mapping Ahmad Rizqi Pradana1, Alfian Futuhul Hadi2, Indarto3


�� = 1 ��∑ ���� �� ��=1 3.
Pradana et al. International Journal of Advanced Engineering Research and Science, 9(8) 2022 www.ijaers.com Page | 189 pattern processing, such as object classification in images. CNN or ConvNet is a deep feed forward artificial neural network that is widely applied in image analysis. CNN consists of one input layer (input layer), one output layer (output layer), and a number of hidden layers [10].
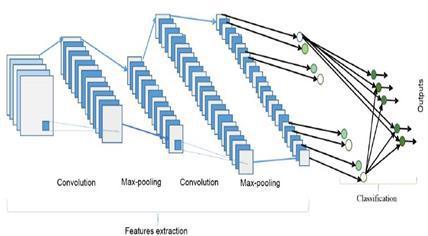
Dimensional reduction is a process carried out to simplify the existing variables to be fewer without losing the information contained in the initial data. One of the methods used in dimension reduction is Principal Component Analysis (PCA). The workings of PCA is to change the initial variable as many as n variables are reduced to k new variables called Principal Component (PC). Sum The number of k is less than n but by using a number of k(PC) can produce a value that is close to the same using n variables. PC that is formed is a linear combination of the initial variables that are independent or not correlated with PC other. The following are the steps to perform dimension reduction using PCA: Compile the input matrix X as one of the k attribute vector data ������ where �� =1,2,…,�� and ��=1,2,…,�� �� =[��11 ��21 ⋮ ����1 ��12 ��22 ⋮ ����2 … ⋱ ��1�� �� Calculating the mean which statisfies the following equation Calculating the covariance matrix C which satisfies the following equation Calculating the eigen values satisfies the following equation Calculating the eigen vector �� which satisfies the following equation Extract the diagonal values 2.2 Convolutional Neural Networks (CNN) Convolutional Neural Networks (CNN) or ConvNet is a deep feed forward artificial neural network that is widely applied in image analysis. CNN consists of an input layer (input layer), an output layer (output layer), and a number of hidden layers (hidden layer). Hidden layers generally contain convolutional layers, pooling layers, normalization layers, ReLu layers, full connected layers, and loss layers. All the layers are arranged in a pile. CNN uses a three dimensional architecture, namely width, height, and depth. The width and height dimensions on CNN are representations of the image (texture and morphology) while the inner dimensions represent color channels [11]. The following is the architecture of CNN can be seen in Figure 1 [1].
1.
�� which
|�� ����|= 0 5.
�� =��
Fig 1. CNN Architecture 2.3 Sentinel 2 The Sentinel 2 satellite is a European optical imaging satellite that was first launched in 2015 which was launched as the Europe Space Agency (ESA) Copernicus program. The Sentinel 2 satellite has 13 spectral bands carrying various swaths of high resolution multispectral imager. The Sentinel 2 satellite system is often referred to as a twin satellite, namely Sentinel 2A (S2A) and Sentinel
2.1 Principal Component Analysis (PCA)
2�� ⋮ ������] 2.
�� = 1 �� 1(�� ��)(�� ��)�� 4.
[�� ����][��]=0 6.
II. METHODOLOGY
from the eigen values and sort them in descending 7. Here are some ways to determine I column eigen vector to be selected as PC a. Using a scree plot of the proportion of variance, based on the point of the curve that no longer decreases sharply and generally shows PC with eigen values of more than 1. b. Using the cumulative proportion of variance which is formulate as follows �������� = ∑ ���� �� ��=1 ∑ ���� �� ��=�� ×100% with ��1 >��2 >⋯>����. The number PCs has at least a cumulative proportion of variance of 80% [8]. 8. The new variable resulting from the reduction is obtained by using an eigen vector matrix with an input. ����1 =��1 ′��′ =��11��1 ′ +��21��2 ′ +����1���� ′ ����2 =��2 ′��′ =��12��1 ′ +��22��2 ′ +����2���� ′ ⋮ ������ =���� ′��′ =��1����1 ′ +��2����2 ′ ⋱ ⋮ +���������� ′
dataGoogle
2.4 Evaluation of the model
data
“S2A
T 022551 N0301 R046T49MHM 20210714 T070327”. 3.2
Pradana et al. International Journal of Advanced Engineering Research and Science, 9(8) 2022 www.ijaers.com Page | 190 2B (S2B) because it works in sync so that it looks like one satellite. Each satellite has a revisit frequency (temporal resolution) every 10 days. Sentinel 2A and Sentinel 2B satellites have a revisit time offset of 5 days (phase shift 1800), so that the same location on the earth's surface will be recorded by Sentinel 2A (S2A) and Sentinel 2B (S2B) every 5 days alternately. The Sentinel 2 satellite has several sensors, including Visible and Near Infrared (VNIR) and Near Infrared (NIR) to Short Wafe Infrared (SWIR). The Sentinel 2 satellite can be used for supporting services such as forest monitoring, land cover change detection and natural disaster management [2].
III. RESEARCH 3.1 Study area and data source The research was conducted in January July 2022. The research area covers part of Situbondo Regency. Data collection was carried out based on the Sentinel 2 satellite image from the https://scihub.copernicus.eu/. The tools and materials used in this study are a laptop with specifications Intel® Core™ i5 3337U CPU @ 1.80GHz, 8.00 GB RAM, NVIDIA GeForce GT720M with 2GB VRAM and 64 bit OS.Software ESA SNAP8.0 used for preprocessing Colab Software used the classification process. Sentinel 2 data used in this study is part of the Situbondo district, East Java province. Image was taken on July 14, 2021 at 02:25:41 GMT. The following is a Sentinel 2 image format that was successfully downloaded MSIL2A 20210714 Model Input Variables and Parameters PCA CNN PCA CNN. Modeling on satellite imagery for land cover analysis in Situbondo Regency has several stages. The first stage is the determination of parameters. The parameters used in the PCA CNN model include the determination of the number of convolutional layers, the selection of the pooling and the activation function. Parameters on the PCA CNN model can be seen in appendix 4. The second step is to determine the batch_size and the number of
Size of Classification Evaluation
for
is
data
Table
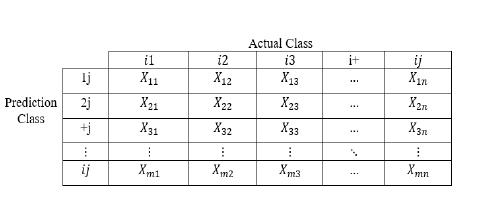
No Ukuran Rumus 1. Producer'sAccuracy ������ ��+�� 100% 2. AccuracyUser ������ ����+ 100% 3. AccuracyOverall ∑ ������ �� ��=1 ������ 100% 4. IndeksKappa ∑ ������ �� ��=1 ������ ∑ ����+��+�� �� ��=1 1 ∑ ����+��+�� �� ��=1 100% Where ������ is the diagonal value of the i th row and i th column matrix. ��+�� is the number of pixels in the j th column, ����+ is the number of pixels in the i th and ������ is the number of pixels in the example. The following is a description of the confusion matrix as illustrated in Figure 2 Fig 2. Confusion Matrix According to [8] the following is a suitability category between the two tools or methods of measuring the kappa index. as shown in Table 2. Table 2. Strength Of Kappa Index Kappa Index (%) (Strength of Agreement) <0,20 Poor 0,21 0,40 Fair 0,41 0,60 Moderate 0,61 0,80 Strong
The evaluation of the model in this study was carried out based on accuracy tests performed using a confusion matrix to determine the producer's accuracy,user accuracy, overall accuracy and kappa index. Producer's accuracy is the accuracy seen from the side of the map producer, while user accuracy is the accuracy seen from the side of the map user. Overall accuracy is the model's accuracy value, while the kappa index is a measure that states the consistency between two measurement tools or methods. Mathematically it can be seen in Table 1. 1. Model 0,81 0,99 Very strong
The following are the results of the classification process using the PCA CNN model which are presented in the “Training and test accuracy” graph and the “Training and test loss” graph can be seen in Figure 3.a and Figure 3.b.
The PCA CNN method as a whole can be applied to land cover classification using Sentinel 2 imagery with
Seen from graph 3a. The blue line shows the accuracy of the training. The results that show an increase in accuracy in each iteration indicate that the model runs well at the training so that the accuracy results are stable and continue to increase. Different things are shown in the orange line which shows the accuracy of the test results. The results obtained in the test process indicate the value of the test accuracy is fluctuating. These results indicate that the model experiences heavy learning in each iteration of the test results. The test results at the end of the iteration show an accuracy value that is not too far from the training so that the model can be said not to be overfitting or fail to guess the results of the predictions.The results obtained in graph 3.a will be equivalent to the results that occur in graph 3.b The results in graph 3.b show the ability of the model to make errors in the classification process. If in graph 3.a the results show a high accuracy value, then the results in graph 3.b will show a loss in the same iteration. The detailed results of the PCA CNN model classification process are shown in the confusin matrix in Figure 4.
Fig 3.a Graph of “Training and Test Loss”
The model test is carried out using testing originating from the distribution of data sets using the hold out method. The model test carried out provides predictive results from the PCA CNN method which can be seen in Table 2
Pradana et al. International Journal of Advanced Engineering Research and Science, 9(8) 2022
IV. CONCLUSION
www.ijaers.com | 191 iterations (epochs) on the model to be run. The PCA CNN model uses batch_size = 20 and the number of iterations (epochs) = 100. A total of 1000 images are used as training data for each class and 500 images are used as testing data for each class 3.3 Classification Result and Visual Assessment
Fig 3.a Graph of “Training and Test Accuracy”
Fig 4. Confusin Matrix Of PCA CNN Model 3.4 Classification accuracy assessment
Table 2. PCA CNN Model Prediction Results Kelas PCA CNN AccuracyProducer(%) User Accuracy(%) Kebun 90,5 95,9 Perumahan 100 93,6 Pertanian Lahan Kering 88,54 99,23 Sawah 96,9 87,5 Tubuh Air 97,5 95,5 Overall Accuracy (%) Indeks Kappa 94,4 0,92 Values from Table 1 are obtained from the confusion matrix Figure 4 above. Table 1 shows that the highest accuracy value for the prediction of the five land cover classes is the Producer Accuracy in the housing class, which is 100%. That is, by using the PCA CNN Producer Accuracy on the housing class, each prediction is successfully guessed accurately for each existing data.Overall Accuracy of the PCA CNN model has a value of 94.4% with a kappa index of 0.92. This value shows the results of the model prediction on the test data are very good, which is above 80%.
Page


Sentinel 2 User Handbook.z ESA Standard Document User Handbook:EuropeSpaceAgency.
Page
[6] Indarto. 2017. Pengindraan Jauh Metode Analisis dan InterpretasiCitra Satelit. Yogyakarta: Andi
[3] Hakim F. L. 2019. Interpretasi Citra Satelit Landsat 8 untuk Pemetaan Tutupan Lahan Provinsi Jawa Timur. Jember: Universiats Jember.
REFERENCES
[4] Han J, M. Kembler, dan J. Pei. 2012. Data Mining: Concepts and Techniques Thrid. Elsevier [5] Heryadi Y. dan E. Irwansyah. 2020. Deep Learning dan Aplikasnya Dibidang Informasi Geosapsial. Depok: ArtifisiaWahanaInformaTeknologi.
www.ijaers.com | 192 five main classes namely kebun, perumahan, Pertanian lahan kering, sawah, and Tubuh Air. The PCA CNN method has the Overall Accuracy of the PCA CNN model which has a value of 94.4% with a kappa index of 0.92.
[12] Sampurno, R. dan Toriq, A. 2016. Klasifikasi Tututpan Lahan Menggunakan Citra Landsat 8 operational Land Imager (OLI) di Kabupaten Sumedang. Jurnal Teknotan 10(2): 61 70.
[17] Yu, S, S. Jia., dan C. Xu. 2017. Convolutional Neural Networks for Hyperspektral Image Classification. Neourocomputing 219(1):88 98. [18] Zang, C, X. Pan., H. Li., A. Gardiner., I. Sargent., J. Hare., P.M. Atkinson. 2018. A Hybrid MLP CNN classifier for very fine resolution remotely sensed image classification. International Society for Photogrammetry and Remote Sensing (ISPRS)140(1):133 144.
Pradana et al. International Journal of Advanced Engineering Research and Science, 9(8) 2022
[7] Jia, K., Xiangqin, W., Xiangfa, G., Yunjun, Y., Xianhong, X. Bin, L. 2014. Land Cover Classification Using Landsat 8 Operational Land Imager Data in Beijing, China. Geocarto International 29(1):941 951.
[8] Jhonson, R. A. dan D. W. Wichern. 2007. Applied MultivariateStatisticalAnalysis. Pearson PrenticeHill. [9] Munir, R. 2004. Pengolahan Citra Digital. Bandung: InstitutTeknologiBandung.
[13] Sutojo T, P.N Andono, dan Muljono. 2017. Pengolahan CitraDigital. Yogyakarta:Penerbit Andi. [14] Suyanto. 2018. Machine Learning Tingkat Dasar dan Lanjut.Bandung: Informatika. [15]Suyanto. 2019. DeepLearningModernisasiMachine LearninguntukBig Data. Bandung: Informatika. [16] Wuryandari, M. D dan I. Afrianto. 2012. Perbandingan Metode Jaringan Saraf Tiruan Backpropagation dan Learning Vector Quantization pada Pengenalan Wajah. Jurnal Komputer dan Informatika (KOMPUTA) 1(1) : 45 51.
[10] Putra I.W.S.E, A.Y. Wijaya., R. Soelaiman. 2016. Klasifikasi Citra Menggunakan Convolutional Neural Network (CNN) pada Caltech 101. Jurnal Teknik ITS 5(1): 1 5.
[11] Saadat. H., J. Adamowski, R. Bonnell, F. Sharifi, M. Namdar, S. Ale Ebrahim. 2011. Land use and land cover classification over a large area in Iran based on single.date analysis of satellite imagery. ISPRS Journal of PhotogrammetryandRemoteSensing 66(5):608 619.
[1] Alom, Taha, Yakopic, Westbreg, Sidike, Nasrin, Esesn, Abdul, Asari. 2018. The History Began from AlexNet: A ComprehensiveSurveyon [2]https://arxiv.org/abs/1803.01164v2DeepLearningApproachesESA.2015.