(IJAERS)
Peer Reviewed Journal

ISSN: 2349 6495(P) | 2456 1908(O) Vol 9, Issue 11; Nov, 2022
Journal Home Page Available: https://ijaers.com/ Article DOI: https://dx.doi.org/10.22161/ijaers.911.22

Peer Reviewed Journal
ISSN: 2349 6495(P) | 2456 1908(O) Vol 9, Issue 11; Nov, 2022
Journal Home Page Available: https://ijaers.com/ Article DOI: https://dx.doi.org/10.22161/ijaers.911.22
1Professor at the Department of Mechanical Engineering, Federal University of Paraná UFPR and Professor of the Postgraduate Course in Numerical Methods in Engineering PPGMNE UFPR, Brasil
2Professor at the Department of Mechanical Engineering, Federal University of Paraná UFPR, Brasil
3Graduating from the Mechanical Engineering University of Paraná UFPR, Brasil
Received: 18 Oct 2022,
Received in revised form: 05 Nov 2022, Accepted: 11 Nov 2022, Available online: 16 Nov 2022
©2022 The Author(s). Published by AI Publication. This is an open access article under the CC BY license (https://creativecommons.org/licenses/by/4.0/).
Keywords Leakage rate, natural gas networks, hole diameter
Abstract The natural gas leakage rate plays an important factor in simulating leaks in gas transportation and distribution pipelines. The method for leakage rate calculation involves identifying the geometry and type of leak opening, associated with the application of the theories of thermodynamics and gas dynamics, as well as energy conservation equations. In this article, a review and analysis of the flow of gas released into the atmosphere in cases of accidents of this nature is carried out. Such a situation is critical, given that certain leaks can create very extensive danger zones around the immediate vicinity of the leak point.
Natural gas as a source of clean and high quality energy has enormous potential for use as a type of energy resource. With the development of the natural gas industry and the establishment of the gas pipelines and distribution networks, situations of possible leaks have been shown to be a major problem in economic matters and, mainly, in safety. Any leaks in natural gas pipelines will certainly cause contamination and environmental pollution problems. Threats become even more serious when natural gas and air mix in explosive concentrations, which may cause fires and even explosions.
The study of leaks in distribution networks and natural gas pipelines depends directly on the rate of leakage that has occurred, which will be the basis for studying the diffusion of gas and for predicting the consequences of the accident. In this line, it is possible to highlight the work of Montiel (1998), in which he proposed the study of models of holes with large dimensions, from holes of small dimensions. Zou et al. (2008) analyzed the thermal process
of emission from a natural gas reservoir, establishing a corresponding mathematical model. Azman et al. (2011) a leak model established for the completely ruptured pipes, analyzing the corresponding pressure drop along the pipeline.

Hou et al. (2011) proposed the use of the FLUENT software, which corresponds to a computer simulation software in the area of fluid dynamics, aiming to simulate the diffusion of natural gas in the atmosphere as a result of leaks.
The process of leakage and diffusion of natural gas into the atmosphere characterizes the condition of a diffuse accident, with no reliable basis for an effective solution. In this context, the initial forecast of the volume of gas released into the atmosphere, after the occurrence of the leak, would allow initial actions to quantify the incident and, consequently, take appropriate actions to reduce risks and losses
European Pipeline Incident Data Group (EGIG) classifies pipeline leaks into three distinct groups: a) leaks occurring from small holes (leak hole diameter less than 20 mm); b) leaks occurring from holes with large dimensions (hole diameter greater than 20 mm, but smaller than the pipe diameter); c) complete rupture of the pipeline.
2.1 Leaks occurring from small holes for the present case, the following simplifying assumptions are assumed: (a) the flow is isentropic at the gas release point and adiabatic in the pipeline; (b) the flow model is essentially 1D; (c) the pipeline can be regarded as non deformable and the interaction between the fluid and the pipeline due to vibration problems is negligible. From the differential equation of Euler kinematics, the adiabatic equation and the equation of an ideal gas, we have:
M = molecular weight [kg.kmol 1]; p = gas pressure [Pa]; patm = atmospheric pressure [Pa]; T = gas temperature [K]; Z = gas compressibility factor; u = gas velocity [m/s]; Co = discharge coefficient ( 0.72); k = specific heat ratio; R = 8314 = universal gas constant [J.kmol 1.K 1]
The ratio (patm/p2 > CPR) corresponds to a subsonic flow while the ratio (patm/p2 ≤ CPR) corresponds to a sonic flow. For the sonic flow condition, equation (3) can be written in the following simplified form: �� =������2 ��√ ���� ������2 ( 2 ��+1) ��+1 �� 1 (4) and, for subsonic flow: �� =������2��√ 2�� �� 1 �� ������2 [(�������� ��2 ) 2 �� (�������� ��2 ) ��+1 �� ] (5) 2 2 Leaks occurring from large holes in these circumstances it becomes necessary to evaluate the flow conditions existing in the hole and in the pipeline.
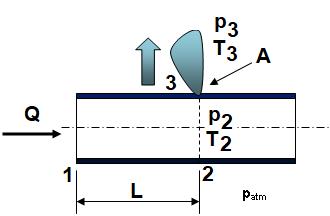
Fig. 1: Schematic of possible leakage
Replacing Eq. (1) in the leakage mass flow equation, we can get the leakage rate:
(2) The classification of the flow at the leakage point as sonic or subsonic can also be performed by comparing it with the so called critical pressure ratio (CPR) given by:
2.2.1 Subsonic flow in the tube and sonic flow in the hole if confirmed, the following conditions: (�������� ��2 )<������ ��2 >��1����1√2+(�� 1)����1 2 ��+1
(6)
Eq.(4) prevails for calculating the rate of gas released into the atmosphere.
Ma corresponds to the Mach number, whose value translates a ratio between the relative speed of the gas and the speed of sound in this medium. Your expression is: ���� = �� √������ ��
(7)
2.2.2 Subsonic flow in the pipe and at the hole now if confirmed, the following conditions: (�������� ��2 )≥������ ��2 >��1����1√2+(�� 1)����1 2 ��+1
(8)
Eq.(5) prevails for calculating the rate of gas released into the atmosphere.
2.3 Leaks that occur in the complete rupture of the pipeline when the pipeline is completely ruptured, the mass flow rate of the natural gas pipeline:
Considering a typical chemical composition for natural gas natural gas distributed by PETROBRAS in southern Brazil we have:
n C6H14 0.0008 1673.1 1576.6
N2 0.0067 1037.5 740.71
CO2 0.0154 869.34 680.43
Natural Gas 1.0000 2096.0 1643.6 �� = ���� ���� = 2096 1643.6=1,275 (10) �� ≅1,00 (11)
Table.1: Natural Gas Typical composition chemical Components Molar fraction (%)
Molar mass (kg/kmol)
pc (MPa) Tc (K)
CH4 0.8901 16.043 4.596 190.6 C2H6 0.0593 30.069 4.883 305.4 C3H8 0.0185 44.096 4.250 369.8 n C4H10 0.0042 58.123 3.796 425.2 i C4H10 0.0031 58.123 3.648 408.2 n C5H12 0.0011 72.151 3.370 469.70 i C5H12 0.0008 72.151 3.380 460.4 n C6H14 0.0008 86.178 3.010 507.5 N2 0.0067 28.013 3.400 126.3 CO2 0.0154 44.010 7.382 304.2 Natural Gas 1.0000 18.374 4.632 204.48
A section of carbon steel pipe with a diameter of 8 in ( 203.2 mm) is also considered, transporting natural gas at a pressure p1 = 35 bar = 3.5 MPa, being subjected to a leak located at a point (L) where the pressure p2 = 27 bar = 2.7 MPa For a supposedly constant gas flow temperature of 25°C, we have (patm = 1 bar = 0.1 MPa):
Cp Cv
Table.2: Natural Gas Specific heats [J/kg.K] Components Molar fraction (%)
CH4 0.8901 2253.3 1735.1 C2H6 0.0593 1754.3 1477.8
C3H8 0.0185 1672.9 1484.4
n C4H10 0.0042 1708.9 1565.9
i C4H10 0.0031 1673.5 1530.5
n C5H12 0.0011 1649.1 1533.9
i C5H12 0.0008 1645.0 1529.8
3
3
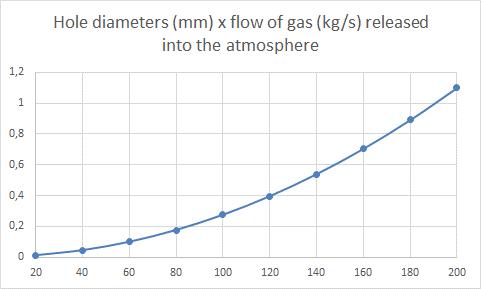
2 Assuming now holes varying between 20 and 200 mm (smaller than the pipe diameter), the values are obtained: Table.4: Hole diameters x flow of gas released into the atmosphere Hole diameters (mm) Leakage mass flow (kg/s) 20 1 10 x 10 6 40 4 40 x 10 6 60 9 90 x 10 6 80 1.76 x 10 5 100 2.75 x 10 5 120 3.96 x 10 5 140 5 39 x 10 5 160 7.04 x 10 5 180 8 91 x 10 5 200 1 10 x 10 4
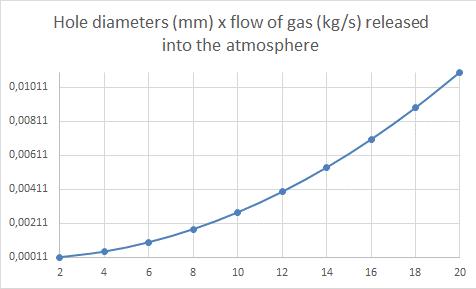
Fig. 3: Hole diameters x flow of gas released into the atmosphere
This article presents a comparative study of the volume of natural gas released into the atmosphere in situations of eventual leaks in the pipeline. In addition to the mathematical review of the respective models, a comparative analysis of problems is carried out considering small holes (< 20 mm) and holes with larger dimensions (above 20 mm, but below the pipe diameter). It is noted that the flow of gas released into the atmosphere is not negligible, identifying that the problem must be dealt with responsibly and in a time of action as soon as possible. Obviously, in these circumstances, it is assumed that the eventual leak is easily detectable by one of the several alternatives available for monitoring this type of situation.
[1] H. R. Zhang, Y. T. Liang, W. Zhang, N. Xu, Z. L. Guo, and G. M. Wu, “Improved pso based method for leak detection and localization in liquid pipelines,” IEEE Transactions on Industrial Informatics, vol. 14, pp. 3143 3154, 2018.
[2] Z. B. Li, H. X. Feng, Y. T. Liang, N. Xu, S. M. Nie, and H. R. Zhang, “A leakage risk assessment method for hazardous liquid pipeline based on markov chain monte carlo,” International Journal of Critical Infrastructure Protection, vol. 27, 2019.
[3] H. Montiel, J. Vilchez, J. Casal, and J. Arnaldos, “Mathematical modelling of accidental gas releases,” Journal of Hazardous Materials, vol. 59, no. 2, pp. 211 233, 1998.
[4] J. D. Young and A. J. Bum, “A simple model for the release rate of hazardous gas from a hole on high pressure pilelines,” Journal of Hazardous Materials, vol. 97, pp. 31 46, 2003.
[5] J. D. Young and A. J. Bum, “Analysis of hazard areas associated with high pressure natural gas pipelines,” Journal of Prevention in the Process Industries, vol. 15, no. 3, pp. 179 198, 2002.
[6] Y. H. Dong, “,The calculation of the steady state rate of gas leakage in long distance pipeline,” Oil and Gas Storage and Transportation, vol. 34, pp. 11 15, 2002.
[7] J. C. Almeida, J. A. Velasquez and R. Barbieri, Development and experimental validation of a computational model for the analysis of transient events in a natural gas distribution network. The Canadian Journal of Chemical Engineering, vol. 9999, pp. 01 07, 2014.
[8] Zhou X.T., Tao X.H, Liang D.Q. and Fan S.S., Simulation of the decomposition of natural gas hydrate in porous media by hot water injection. Energy Exploration & Exploitation 26(4), pp. 267 279, 2008.