
CNN-Based Covid-19 Data Analysis and Case Prediction
 Mr.Dilipkumar.E Mr.Ramachandran.G
Abstract: This project aims to propose a machine learning model to detect COVID 19 positive cases more precisely utilizing chest X ray images. I have collected and merged all the publicly available chest X ray datasets of COVID 19 infected patients from Kaggle and Github, and pre processed it using random sampling approach. Then, I proposed and applied an enhanced convolutional neural network (CNN) model to this dataset and obtained a 94.03% accuracy, 95.52% AUC and 94.03% f measure for detecting COVID 19 positive patients. I have also performed a comparative performance between our proposed CNN model with several state of the art machine learning classifiers including support vector machine, random forest, k nearest neighbor, logistic regression, gaussian naïve bayes, bernoulli naïve bayes, decision tree, Xgboost, multilayer perceptron, nearest centroid and perceptron as well as deep learning and pre trained models such as deep neural network, residual neural network, visual geometry group network 16, and inception network V3 were employed, where our model yielded outperforming results compared to all other models. While evaluating the performance of our models, we have emphasized on specificity along with accuracy to identify non COVID 19 individuals more accurately, which may potentially facilitate the early detection of COVID 19 patients for their preliminary screening, especially in under resourced health infrastructure with insufficient PCR testing systems and testing facilities. Moreover, this model could also be applicable to the casesofother lunginfections.
I. INTRODUCTION

The novel corona virus disease 2019 (COVID 19) pandemic caused by the SARS CoV 2 continues to pose a critical and urgent threat to global health. The outbreak in early December 2019 in the Hubei province of the People’s Republic of China has spread worldwide. As of October 2020, the overall number of patients confirmed to have the disease has exceeded 39,500,000, in >180 countries, though the number of people infected is probably much higher. More than 1,110,000 people have died from COVID 191. This pandemic continues to challenge medical systems worldwide in many aspects, including sharp increases in demands for hospital beds and critical shortages in medical equipment, while many healthcare workers have themselves been infected. Thus, the capacity for immediate clinical decisions and effective usage of healthcare resources is crucial. The most validated diagnosis test for COVID 19, using reverse transcriptase polymerase chain reaction (RT PCR), has long been in shortage in developing countries. This contributes to increased infection ratesand delayscritical preventive measures. Effective screening enables quick and efficient diagnosis of COVID 19 and can mitigate the burden on healthcare systems. Prediction models that combine several features to estimate the risk of
infection have been developed, in the hope of assisting medical staff worldwide in triaging patients, especially in the context of limited healthcare resources. These models use features such as computer tomography (CT) scans, clinical symptoms, laboratory tests, and an integration of these features. However, most previous models were based on data from hospitalized patients, thus are not effective in screening for SARS CoV 2 in the general population.
The Israeli Ministry of Health publicly released data of all individuals who were tested for SARS CoV 2 via RT PCR assay of a nasopharyngeal swab. During the first months of the COVID 19 pandemic in Israel, all diagnostic laboratory tests for COVID 19 were performed according to criteria determined by the Israeli Ministry of Health. While subject to change, the criteria implemented during the study period included the presence and severity of clinical symptoms, possible exposure to individuals confirmed to have COVID 19, certain geographical areas, and the risk of complications if infected. Except for a small minority who were tested under surveys among healthcare workers, all the individuals tested had indications for testing. Thus, there was no apparent referral bias regarding the vast majority of the subjects in the dataset used in this study; this contrasts withprevious studies, for which such bias wasa drawback. In addition, all negative and positive COVID 19 casesthisdataset were confirmed via RT PCRassay.
Department of Mca
Department of Mca Dhanalakshmi College of Dhanalakshmi College of Engineering and Technology Engineering and Technology
of Advanced Research
In this paper, we propose a machine learning model that predicts a positive SARS CoV 2 infection in a RT PCR test by asking eight basic questions. The model was trained on data of all individuals in Israel tested for SARS CoV 2 duringthe first monthsofthe COVID 19 pandemic. Thus, our model can be implemented globally for effective screening and prioritization of testing for the virus in the general population. Then, I proposed and applied an enhanced convolutional neural network (CNN) model to this dataset and obtained a 94.03% accuracy, 95.52% AUC and 94.03% f measure for detecting COVID 19 positive patients. I have also performed a comparative performance between our proposed CNN model with several state of the art machine learning classifiers including support vector machine, random forest, k nearest neighbor, logistic regression, gaussian naïve bayes, bernoulli naïve bayes, decision tree, Xgboost, multilayer perceptron, nearest centroid and perceptron as well as deep learning and pre trained models such as deep neural network, residual neural network, visual geometry group network 16, and inception network V3 were employed, where our model yielded outperforming resultscompared to all other models.
SYSTEM ANAYSIS
System Analysisis the term used to describe the process of collecting and analyzing facts in respect of an existing operation of a situation so that an effective computerized system may be designed and implemented ifproved feasible.
System Analysis can be viewed as the most recent and perhaps the most comprehensive techniques for solvingcomputer problems.
System Analysis also embraces system design, which is an activity concerned with the design of a computerized application based on facts disclosed duringthe analysisstage.

System analysis basically is an approach towards viewing process, activities and complex problems.
Thusspecifically:
It offers a method for greater understanding of the complexstructures.
It is a tool for tradeoff between functional requirement of a subsystem and its immediately related sub system.
It helps in understanding and comparing functional impacts of sub systems to the total systems.
Finally, it helps in placing each sub system in the proper prospective and context so that the system as a whole may achieve its objectives with minimum available resources. It thus creates synchronization between the system and objectives.
EXISITING SYSTEM :
in Engineering
Technology
Prediction was performed on COVID 19 cases based on different machine learning techniques which are based on x ray data set collected from COVID 19 patients
Disease prediction from x ray images is done usingdeep learningtechniques..
DISADVANTAGES OF EXISITING SYSTEM :
Data set used for predicting disease is different compare to one we are usingfor thisproject.
Image processingtechniquesare used.
PROPOSED SYSTEM :
Using data set pre processing is performed on the collected data set and various steps for deep learning model is performed and prediction of cases is done then data analysis is done on various factors.
PROPOSED SYSTEM ADVANTAGES :
Data analysis and prediction is performed on textual data
Deep learning models are generated for predictingfuture cases.
MATERIAL AND METHODS
1) X ray image Data Set
The working methodology has been used to detect COVID 19 patients from the publicly available datasets. Figure 5.1.2 illustrates these steps that can be split into different sections such as data collection, pre processing, classification and evaluation respectively. This approach isdescribed brieflyas follows:
2) 5.1.3 Data Collection :
3) The primary chest X ray images have been obtained from the COVID 19 Radiography Database . It contained 1,341 normal, 1,345 viral pneumonia, and 219 COVID 19 patient’s images, which have been taken as primary dataset. However, the distribution of different types of images was not the same. To balance this dataset, we collected 66 images from and added them with COVID 19 images of primary dataset. For other classes (normal and pneumonia), a random under sampling method has been used and
Engineering
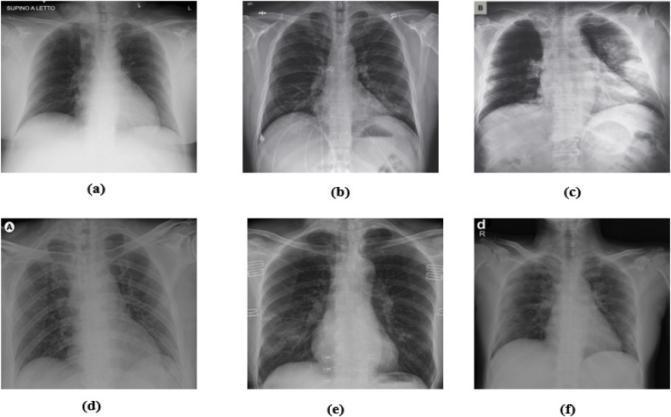
generated balanced instances of each class. Finally, this experimental dataset had been contained 285 normal, viral pneumonia and COVID 19 images respectively. For instance, Figure 5.1.3 illustrates the three types of chest X rayimages, respectively.
Technology
4) THE PROPOSED CONVOLUTIONAL NEURAL NETWORK(CNN)

5) Data Preprocessing :
6) Inthisstep, we normalized training set into grayscale images. Then, all baseline classifiers have been implemented with transformed dataset respectively. But, pre trained CNN models such as VGG16, ResNet50, InceptionV3 cannot support grayscale images, hence we directly employed them into primarydataset.
7) Convolutional Neural Networks :
8) Convolutional Neural Networks (CNN) is a special class of artificial neural network (ANN) that manipulates an input layer along with the sequence of hidden and output layers. It maintains a sparse connection between layers and weights that shares them with output neurons in the hidden layers. Like regular ANN, CNN contains a sequence of hidden layers, which are denoted as convolutional and polling layer. In addition, the operations of these layers are called convolutional and polling operation, respectively. Alternatively, they are stacked to lead a series of fully connected layers followed by an output layer. In many research fields including image recognition, object detection, semantic segmentation and medical image analysis, CNN models yield considerably higher performances compared to the state of the arts.
9)
10) Convolutional Layers :
11) Convolution layer is the core structure of a CNN that manipulates convolution operation (represented by *) instead of general matrix multiplication. This layer accomplishes most of the computations of CNN model. The count of filters, size of local region, stride, and padding are mentioned as hyper parameters of this layer. Convolution layers extract and learn about features using these filters. Hence, it is known as the feature extraction layer. These parameters are necessary where the similar filter is traversed across the whole image for a single feature.
The main objective of this layer is to identify common features of input images and map their appearance to the feature map. The convolution operationisgiven as:
12)
13)
To introduce non linearity, the output of each convolutional layer is fed to an activation function. Numerous activation functions are available but Rectified Linear Unit (ReLU) is widely used in the deep learning field. It is mathematicallycalculated asfollows:
14)
15) In this model, we have used fewer layers and filters, which consists of two convolutional layers and gradually increased the number of filters from 32 to 64, respectively, where an image of size 100 100 and the pixel values of them are either 0 or 1. In the first convolutional layer, this image is convoluted with 3 × 3 kernel for 32 filtersand producesthe feature map 100 × 100 × 32. Subsequently, this output has been forwarded to the second convolutional layer where we consider 3 × 3 sized kernel for 64 filters that is also convoluted with 100 × 100× 32 extracted features and produced 100 × 100 × 64 sized output feature map is produced in this layer.
16) 5.1.4.4 Pooling Layer :
17) In CNN, the sequence of convolution layer is followed by an optional pooling or down sampling layer to lessen the volume of input images and number of parameters. This layer computes fast and precludes over fitting. The most common pooling technique is called Max Pooling, which merely generates the highest result of the input region. Other pooling options are average pooling and sum pooling. Two hyper parameters are essential for the pooling layer, namely filter and stride. In this model, we implement 2 × 2 filter into 100 × 100 × 64 sized output feature map and create 50 × 50 × 64 reduced feature map.
18) Flatten Layer :
19) After implementing the pooling layer, a flatten layer has been employed to flat the entire
network. It converts the entire pooled feature map matrixinto a single column.
20) Dence Layer :
21) Then, we have implemented three dense layers which are also known as a fully connected layer. In this layer, the input of previous layers is flattened from a matrix into a vector and forwarded it to this layer like a neural network. This layer viewed the output of past layers and decided which features are mostly matched with the individual class. Therefore, a fully connected layer can yield accurate probabilities for the different classes. The outputs are classified by using the activation function at the output layer, which in our case was the Softmax function to calculate the probability of particular classesdefined bythe followingthisequation:
22) Dropout Layer :

23) When a large feed forward neural network is investigated with a small training set, it usually shows poor performance on held out test data, and dropout is a useful procedure to mitigate this problem. In our model, we used dropout layer after each dense layer and to reduce over fitting by preventing complex co adaptations on the training data.

24)
The proposed model has 17 convolution layers. each DN (DarkNet) layer has one convolutional layer followed by BatchNorm, and LeakyReLU operations, while each 3 × Conv layer has the same setup three times in successive form. The batch normalization operation is used to standardize the inputs, and this operation has other benefits, such as reducing training time and increasing stability of the model. LeakyReLU is a variation of the ReLU operation used to prevent dying neurons. Unlike ReLU or sigmoid activation functions, which have zero value in the negative part of their derivatives, LeakyReLU has a small epsilon value to
of Advanced Research
overcome the dying neuron problem. Similar to the Darknet 19 model, the Maxpool method is used in all the pooling operations. Maxpool downsizes an input by taking the maximum of a region determined by its filter.
EXPERIMENTAL RESULTS
We performed experiments to detect and classify COVID 19 using X ray images in two different scenarios. First, we have trained the Dark CovidNet machine learning model to classifyX rayimages into three categories: COVID 1, No Findings, Secondly, the Dark CovidNet model is trained to detect two classes: COVID 19 and No Findings categories. The performance of the proposed model is evaluated using the 5 fold cross validation procedure for both the binary and triple classification problem. Eighty percent of X ray images are used for training and 20% for validation. The experiments are repeated five times as shown. All of the split k pieces are wrapped in folds to use in the validation stage. We have trained Dark CovidNet for 100 epochs. The training and validation loss graphs of the multi class classificationand validationaccuracygraphs.
TRAINING AND TESTING SET FOR XCeption NET MODEL :
in Engineering
Technology
After preprocessing of the dataset, the final dataset consisted of a total of 900 X ray images. For training and testing the proposed CNN, the dataset was partitioned into two subsets. The training dataset contained 400 COVID 19 X ray images and 400 normal X ray images, making a total of 800 X ray images. The testing dataset similarly contained 100 X ray images, in which 50 X ray images were from each class COVID 19 positive and normal. Then, the training subset containing 800 X ray images has been passed to the model with 25% validation size. So, out of 800 X ray images, with each epoch, 600 X ray images train the model, and 200 X ray Images validate the model. As mentioned in the proposed architecture of the CNN model, it consisted of 38 layers in which 6 are convolutional, 6 max pooling layers, 6 dropout layers, 8 activation function layers, 8 batch normalization layers, 1 flattening layer, and 3 fully connected layers. The CNN model thus achieved an extraordinary performance with an accuracy of 100% with the test data subset used from the processed dataset of this study with a precision of 1.0, with the model parameter values. To evaluate the overall performance, in addition to accuracy, other important metrics have been adopted in this study including F1 score, precision, sensitivity, specificity, and ROC AUC. The scores of these parametersare reported inTable Confusion Matrix :
Training and Testing Loss of Xception Net with successive epochs. Training and Testing Accuracy ofXceptionNet withsuccessive epochs
The confusion matrix of the model is shown in Figure 6.1. show the curve of accuracy and loss between training and testing, respectively. According to the confusion matrix, the CNN model test uses the 100 X ray images from the GitHub dataset, where 50 images belong to the COVID 19 class and 50 to the normal images. The CNN model shows significant performance on testing and predicts all 100 images correctly with 0% error rate as reported in the confusion matrix of Figure 6.1. shows the model accuracy during the training and validation as a graph where the curve drawn in blue color shows the training accuracy of CNN, while the curve with orange color showsthe validationaccuracy. Trainingaccuracyof the CNN according to remains consistent after the 5 epochs and the CNN also shows a consistent validation accuracy after the 25 epochs. The plot in shows the loss during the training and validation of CNN. The training loss of CNN is minimum and consistent from the 1st epoch while validation loss becomes minimum after 5 epochs and remains consistent till the last epoch. The above results show the efficiency of the CNN model proposed inthis study.


MODULE SPECIFICATION
26) MODULE DESCRIPTION
CNN TRAINING MODULE
The ResNet was built by several stacked residual units and developed with many different numbers of layers: 18, 34, 50, 101, 152, and 1202. However, the number of the operations can be varied depending on the different architectures. For all of the above, the residual units are composed of convolutional, pooling, and layers. ResNet is similar to VGG net, but ResNet is about eight times deeper than VGG. ResNet 50 contains 49 convolutional layers and a fully connected layer at the end of the network. For saving computing resources and training time, ResNet 50 was chosen for the development of the present work. It was utilized to obtain the most important features from all input images. As the ResNet 50 is defined, the number of categories is specified, the new learnable layer is obtained, and then, last layers are replaced with new ones. The training parameters were chosen by continuous trials
asfollows:
5(It gives the best loss without sacrificingspeed oftraining)
as a start point, then the size was reduced to 16, and finallyit wassetto 8 to reduce memoryspace needed)
epochs wastried, then 50, and finallyit was found that 40 epochs were enough to get the acceptable error rate)Training images are then scaled to 224*224 to be compatible with ResNet architecture. After training, testingimagesare resized also to 224*224.
DATA PREPROCESSING MODULE
Dataset
A public database of pneumonia cases with chest X rays, especially, COVID 19 cases. Data were collected from public sources as well as through agreements with hospitals and physicians with the consent of their patients. Data were divided into 2 folders; normal cases and COVID 19 cases. Each folder contains 25 images with 'jpeg' format and variable size ranging from 700*630 up to 3342*4095.
Preprocessing
Some images were observed to be 3 dimensional. As a first step, they were transformed into gray scale. To normalize dataset, images were resized to 400*400. Histogram equalization was utilized to enhance the contrastofall images for better detection.
Data Augmentation
The sampling distribution of COVID 19 cases and normal cases is equal. There are 25 images of both classes which represents an equal distribution with no class imbalance. Data augmentation techniques, including random rotation [ 5o 5o], random reflection, random shear operation, were applied on original dataset to enhance the dataset size and to prevent over fitting. Data were split into 15 folds for analysis. This means 15 different algorithms would be trained using different set of images from the dataset. This had given a better performance compared with the hold out validation method which had been tried previously. In the hold out validation, the number of folds is equal to the number of instances in the data set and the learning algorithm is applied once for each instance, using all other instances as a training set and using the selected instance as a single itemtestset.

COMPARING GENERATED RESULTS VS ACTUAL RESULTS MODULE
At the final stage, the output generated by the cnn module by giving the chest X ray images as input, is then compared with the actual results to show the accuracy of themodule and to compare the results.
OUTPUT MODULE
By giving the chest X ray images as input, to the pre trained cnn module,, we can obtain the results whether the given chest X ray image is covid positive or not.Here

Advanced Research
0 is considered as positive and 1 as negative. Results are marked under the X rayimages
INPUT DESIGN
In an information system, input is the raw data that is processed to produce output. During the input design, the developers must consider the input devicessuchasPC, MICR, OMR, etc.
Therefore, the quality of system input determines the quality of system output. Well designed input formsand screens havefollowingproperties−
It should serve specific purpose effectively such as storing, recording, and retrieving the information.
Itensuresproper completion withaccuracy.
Itshould be easyto filland straightforward.
It should focus on user’s attention, consistency, and simplicity.
All these objectives are obtained using the knowledge of basic design principles regarding−
o What are the inputs needed for the system?
o How end users respond to different elements of forms and screens.
27) Objectives for Input Design
Theobjectivesofinputdesignare−
Todesigndata entryand input procedures
Toreduce inputvolume
To design source documents for data capture or devise other data capture methods
To design input data records, data entry screens, user interface screens, etc.
use validation checks and develop effective inputcontrols.
28) Data Input Methods
It is important to design appropriate data input methods to prevent errors while entering data. These methods depend on whether the data is entered by customers in forms manually and later entered by data entry operators, or data is directly entered byusersonthe PCs.
3785 (Online)
www.ijartet.com
Engineering and Technology
A system should prevent user from making mistakes by −
Clear formdesignbyleaving enough space for writinglegibly.
Clear instructionsto fill form.
Clear formdesign.
Reducing keystrokes.
Immediate error feedback.
Some of the popular data input methods are Batch input method (Offline data input method)
Online data input method
Computer readable forms
Interactive data input
29) Input Integrity Controls
Input integrity controls include a number of methods to eliminate common input errors by end users. They also include checks on the value of individual fields;both for format and the completenessofall inputs.
Audit trails for data entry and other system operations are created using transaction logs which gives a record of all changes introduced in the database to provide securityand meansofrecoveryincase ofany failure.
OUTPUT DESIGN
The design of output is the most important task of any system. During output design, developers identify the type of outputs needed, and consider the necessary outputcontrolsand prototype reportlayouts.
30) 10.3.5 Objectives of Output Design
Theobjectivesofinputdesignare−
To develop output design that serves the intended purpose and eliminates the production ofunwanted output.
To develop the output design that meets the end usersrequirements.
Todeliver the appropriate quantityofoutput.
To form the output in appropriate format and directit to the rightperson.
To make the output available on time for makinggood decisions.
Letusnowgothroughvarioustypesofoutputs−
31) External Outputs
Manufacturers create and design external outputs for printers. External outputs enable the system to leave the
ISSN 2394 3777 (Print)
ISSN 2394 3785 (Online)
Available online at www.ijartet.com
International Journal of Advanced Research Trends in Engineering and Technology (IJARTET) Vol. 9, Issue 8, August 2022
trigger actions on the part of their recipients or confirmactionsto their recipients.
Some of the external outputs are designed as turnaround outputs, which are implemented as a formand re enter the systemasaninput.
32) Internal outputs
Internal outputs are present inside the system, and used by end users and managers. They support the managementindecision makingand reporting.
There are three types of reports produced by managementinformation−
Detailed Reports − they contain present information which has almost no filtering or restriction generated to assist managementplanningand control.
Summary Reports − they contain trends and potential problems which are categorized and summarized that are generated for managers who do not want details.
Exception Reports − they contain exceptions, filtered data to some condition or standard before presenting it to the manager, asinformation.
33) Output Integrity Controls
Output integrity controls include routing codes to identify the receiving system, and verification messages to confirm successful receipt of messages that are handled bynetworkprotocol.
Printed or screen format reports should include a date/time for report printing and the data. Multipage reports contain report title or description, and pagination. Pre printed forms usually include a version number and effective date.
SYSTEM TESTING AND MAINTANANCE
Software Testing is the process of executing software in a controlled manner, in order to answer the question Does the software behave as specified? Software testing is often used in association with the terms verification and validation. Validation is the checking or testing of items, includes software, for conformance and consistency with an associated specification. Software testing is just one kind of verification, which also uses techniques suchas reviews, analysis, inspections, and walkthroughs. Validation is the process of checking that what has been specified is what the user actually wanted.
Software testing should not be confused with debugging. Debugging is the process of analysing and localizing bugs when software does not behave as expected. Although the identification of some bugs will be obvious from playing with the software, a methodical approach to software testing is a much more thorough means for identifying bugs. Debuggingistherefore anactivity which supportstesting, butcannotreplace testing.
There are three ways to test program
For correctness
For implementationefficiency
For computational complexity
Testfor correctnessare supposed to verifythat a program doesexactlywhat it was designed to do.Thisis much more difficultthanit mayat firstappear, especiallyfor large programs.
TEST PLAN
A test plan implies a series of desired course of action to be followed in accomplishing various testing methods. The Test Plan acts as a blue print for the action that is to be followed. The software engineers create a computer program, its documentation and related data structures. The software developers is always responsible for testing the individual units of the programs, ensuring that each performs the function for which it wasdesigned.
The levelsoftestinginclude:
Unittesting
Data validationtesting Integrationtesting Outputtesting Unit testing Unit testing focuses verification effort on the smallest unit of software design the software component or module. Using the component level design description as a guide, important control paths are tested to uncover errors within the boundary of the module. The relative complexity of tests and uncovered scope established for unit testing. The unit testing is white box oriented, and step can be conducted in parallel for multiple components. The modular interface is tested to ensure that information properly flows into and outofthe programunitunder test.
Validation testing
Attemptsto find the errorsinthe followingcategories
Incorrector missing functions
errors and initialization
errors
indata structure
access
Output testing
The system considered is tested for user acceptance; here it should satisfy the firm’s need. The software should keep in touch with perspective system; user at the time of developing and making changes whenever required. This done with respect to the followingpoints
input screendesign
outputscreendesign
RESULT
The confusion matrix gives false positive (FP), false negative (FN), true positive (TP), and true negative (TN) cases. False positive means that normal cases were misclassified and represented as infectious cases. True positive corresponds to the correctly detected COVID 19 cases. True negative means that normal cases were correctly classified as being non infectious. The worst possibility is the false negative case which means that COVID 19 cases were misclassified as normal. Figure (6) shows the confusion matrix. It can be used to get sensitivity, precision, accuracy, specificity, and negative predictive value.
The suggested algorithm has given 96.2% sensitivity, 100% precision, 98% accuracy, 100% specificity, and 96% negative predictive value. Results had shown that the accuracy of the proposed method is 98% which ensures that true results, either true positive or true negative, are fairly high. The high accuracy is a must in the COVID 19 diagnosis. Moreover, the sensitivity of 96.2% is acceptable as it guaranteeslow false negative results whichconstitute the major source of infection. The proposed method is suitable also for real time applications. The processing time was about 0.56 seconds on a machine with Core i7 processor and 8 GB RAM. This makes the proposed method reliable for clinical application. Two important performance measures were evaluated; the receiver operating characteristics (RoC) curve which could help physicians to select the operating region using FP and detection rate and the area under the curve (AUC). This area is important as it doesn't vary with scale. It measures how well predictions are ordered, regardless their absolute values. Moreover, AUC doesn't vary with classification threshold. Figure (7) gives the RoC curve. The AUC was calculated and found to be equal to 0.9888. Table (1) gives a short comparison withother deep learning methods.
PERFORMANCE AND LIMTATION
CONCLUSION
A deep convolutional neural network had been utilized to classify COVID 19 X ray images in an accurate and simple manner. ResNet 50 had been adopted as it is the most common architecture used in biomedical imaging. The implemented system has shown great performance measures in terms of precision, sensitivity, accuracy, specificity, RoC, and AUC. Moreover, the algorithm can be easily modified to add extra images (normal and COVID 19) to improve performance. The proposed system introduces a great help to all nations to screen and diagnose COVID 19 as a faster alternative compared withconventional method that usesPCR.
LIMITATIONS AND FUTURE ENHANCEMENT
One of the limitations of this work was the imbalance of data in the datasets used for training and testing. In general, balanced data set with an equal number of normal and COVID 19 X ray images makes the model building more comfortable, and the developed model can provide better prediction accuracy. Furthermore, the classification algorithm finds it easier to learn from a balanced dataset. Naturally, in any open source database the number of normal images would be higher than the COVID 19 positive images. As the images used in this study were taken from open source databases, the imbalance in the training and testing data sets was obvious. However, the ratio between the number of normal and COVID 19 images was maintained at 1.57 in both the training and testing data sets in order to alleviate the data imbalance problemto some extent. Another limitationof this studyisthe small number of X ray images. New images are continuously being made available around the world. In order to further improve the robustness and accuracy of the model, a number of images will be added to the training data set. The trained model can be stored in the cloud. A mobile app can be developed to diagnose COVID 19 within seconds in order to reduce the workload of clinicians in the hospitals. The future work will focus on the fusion of HOG and CNN features for three dimensional volume analysis. In addition, more efficient methods can be developed by exploring other fusion approaches to improve the result. In order to respond to the global challenge of quickly identifying COVID 19, a large number of studies were carried out in 2020 by applying deep learning techniques on lung X ray images. The studies varied significantly in terms of deep learning architecture, feature selection technique, number of images in the training and testing data sets, testing protocols, etc. However, the majority of the studies reported high classification perfor mances in discriminating COVID 19 using different deep learning techniques.about the effectiveness in practical applications of the classification models with chest X ray images . Learning bias has been highlighted as one of the key challenges for the development of a robust and
statistically stable deep learning model, which can confidently make the prediction for an unseen data set with similar values of the performance metrics. The bias could be due to a small number of the COVID 19 images with a publicly available large number of non COVID 19 images. Further more, the learning bias could be due to the source data set, meaning that the model could learn features that are related to the characteristics of the datasets (text label, scan setting, or similar age and sex) rather than the features specific to the disease impacting the overall validity of the model and its significance in clinical use even without containing a major part of the lungs in the X ray images within a dataset could produce similar classification results compared to the dataset of X ray images, including lungs . Designing a fair testing protocol could be highly challenging when different datasets were merged with large differences among them. This could generate misleading results. Therefore, assessing the validity of the available testing protocol must be carefully dealt with. In this study, despite taking some preventative measures to avoid bias, such as using relatively large data set (3111 non COVID and 1979 COVID 19 images) without huge data imbalanced, preprocessing of images (e.g., removing text labels) to remove datasetdependent features, extracting features by two techniques and feature fusion and testing with a set of data different from the training set, still, the trained model would not be completely free from the learning bias. Yasar et al. compiled
testing protocols must be sought to make sure the developed model would be free of any learning bias for an accurate prediction of the outcome. This could be possible in the future when the continuous effort of collecting X ray images will create a large balanced dataset to determine if deep learning can provide a solutioninthe fightagainstthe COVID 19 pandemic.
APPENDICE : SCREENSHOT
INPUT SCREEN
14.3 OUTPUT SCREEN
Radiologist:
results for the COVID 19 detection by recent studies using the X ray images and found that seven out of sixteen (44%) studies used k fold validation . This represented that k fold was a popular validation technique. In this study, during k fold validation, as the images were taken from the same training and testing datasets, unlike the generalization technique where new data set were used for the validation, it provided accuracy close to the testing accuracy. This supported the argument that k fold validation could be an unfair testing protocol. Although k fold cross validation balanced out the predicted features’ classes with the unbalanced dataset used in this study to a certain extent, still innovative and effective
Radiologist:

REFERENCES
[
1] World Health Organization, https://www.who.int/ , May, 2020.
[2] C. Carver, N. Jones. "Comparative Accuracy of Oropharyngeal and Nasopharyngeal Swabs for Diagnosis ofCOVID 19", Universityof Oxford, March, 2020.
[3] S. Yoon, L. Kyung, J. Kim, Y. Lee, H. Ko, K. Kim, C. Park, and Y. Kim, "Chest Radiographic and CT Findings of the 2019 Novel Coronavirus Disease (COVID 19): Analysis of Nine Patients Treated in Korea", KoreanJournal ofRadiology.2020.


[4] Y. Li, "Coronavirus Disease 2019 (COVID 19): Role of Chest CT in Diagnosis and Management", AJR, October 2020.

ISSN 2394 3777 (Print)
ISSN 2394 3785 (Online)
Available online at www.ijartet.com
International Journal of Advanced Research Trends in Engineering and Technology (IJARTET) Vol. 9, Issue 8, August 2022
[5] J. Cohen, COVID 19 Chest X ray Dataset, https://github.com/ieee8023/covid chestxray dataset , March2020.
[6] Q. Shi et al., "Deep CNN with Multi Scale Rotation Invariance Features for Ship Classification", IEEE Access, Vol. 6, 2018.
[7] A. Reddy, D. Julliet, "Transfer Learning with ResNet 50 for Malaria Cell Image Classification", IEEE explore, International Conference on
Communication and Signal Processing (ICCSP), India, 2019.
[8] S. Visa et al., "Confusion Matrix based Feature Selection", Proceedings of the 22nd Midwest Artificial Intelligence and Cognitive Science Conference, Cincinnati, Ohio, USA, April, 2011. X[9] I. Apostolopoulos1, T. Bessiana, "COVID 19: Automatic Detection from X Ray Images Utilizing Transfer Learning with Convolutional Neural Networks", arXiv: 2003.11617,2020.