
Health Insurance Claim Fraud Prediction Using Supervised Machine Learning Techniques
Mrs.Savithri.SDepartment of Mca
Ms.Premila.KAbstract: The healthcare industry is a complex system and it is expanding at a rapid pace. At the same time fraud in this industry is turning into a critical problem. One of the issues is the misuse of the medical insurance systems. Machine learning and data mining techniques are used for automatically detecting the healthcare frauds. In this paper, we attempt to give a review on frauds in healthcare industry and the techniques for detecting such frauds. With an emphasis on the techniques used, determining the significant sources and the features of the healthcare data we proposed a machine learning model to tackle the issues related to the health insurance claims. The univariate and bivariate analysis are applied on the data to know the features pattern and then proper visualisation of data to know which feature affects the most and a machine learning model is built on the pre processed data.
I. INTRODUCTION


Machine learning is to predict the future from past data. Machine learning (ML) is a type of artificial intelligence (AI) that provides computers with the ability to learn without being explicitly programmed. Machine learning focuses on the development of Computer Programs that can change when exposed to new data and the basics of Machine Learning, implementation of a simple machine learning algorithm using python. Process of training and prediction involves use of specialized algorithms. It feed the training data to an algorithm, and the algorithm uses this training data to give predictions on a new test data. Machine learning can be roughly separated in to three categories. There are supervised learning, unsupervised learning and reinforcement learning. Supervised learning program is both given the input data and the corresponding labeling to learn data has to be labeled by a human being beforehand. Unsupervised learning is no labels. It provided to the learning algorithm. This algorithm has to figure out the clustering of the input data. Finally, Reinforcement learning dynamically interacts with its environment and it receives positive or negative feedback to improve its performance.

Data scientists use many different kinds of machine learning algorithms to discover patterns in python that lead to actionable insights. At a high level, these different algorithms can be classified into two groups based on the way they “learn” about data to make predictions: supervised and unsupervised learning. Classification is the process of predicting the class of given data points. Classes are sometimes called as targets/ labels
or categories. Classification predictive modeling is the task of approximating a mapping function from input variables(X) to discrete output variables(y). In machine learning and statistics, classification is a supervised learning approach in which the computer program learns from the data input given to it and then uses this learning to classify new observation. This data set may simply be bi class (like identifying whether the person is male or female or that the mail is spam or non spam) or it may be multi class too. Some examples of classification problems are: speech recognition, handwriting recognition, bio metric identification, document classification etc.
Supervised Machine Learningis the majority of practical machine learning uses supervised learning. Supervised learning is where have input variables (X) and an output variable (y) and use an algorithm to learn the mapping function from the input to the output is y = f(X).The goal is to approximate the mapping function so well that when you have new input data (X) that you can predict the output variables (y) for that data. Techniques of Supervised Machine Learning algorithms includelogistic regression, multi class classification, Decision Trees and support vector machines etc. Supervised learning requires that the data used to train the algorithm is already labeled with correct answers. Supervised learning problems can be further grouped into Classification problems. This problem has as goal the construction of a
Department of Mca Dhanalakshmi College of Dhanalakshmi College of Engineering and Technology Engineering and Technology
succinct model that can predict the value of the dependent attribute from the attribute variables. The difference between the two tasks is the fact that the dependent attribute is numerical for categorical for classification. A classification model attempts to draw some conclusion from observed values. Given one or more inputs a classification model will try to predict the value of one or more outcomes. A classification problem is when the outputvariableisacategory,suchas“red”or“blue”.
SYSTEM ANALYSIS
Existing System
They introduced a clinical concepts over procedure and diagnosis codes as a new representation learning approach. Assumed that every claim is a representation of latent or obvious Mixtures of Clinical Concepts which in turn are mixtures of diagnosis and procedure codes. The problem of fraudulent insurance claim identification as a feature generation and classification process. They formulated the problem over a minimal, definitive claim data consisting of procedure and diagnosis codes, because accessing richer datasets are often prohibited by law and present inconsistencies among different software systems. They extended the MCC model using Long Short Term Memory network (MCC + LSTM) and Robust Principal Component Analysis (MCC + RPCA) to filter the significant concepts from claims and classify them as fraudulent or non fraudulent. Our results demonstrate an improvement scope to find fraudulent healthcare claims with minimal information. Both MCC and MCC + RPCA exhibit consistent behaviour for varying concept sizes and replacement probabilities in the negative claim generation process.
Disadvantages
Their process takes a lot of time and more computational sources to classify the output.
Parameters like confusion matrix, sensitivity and specificity are not evaluated and mentioned.
PROPOSED SYSTEM
Healthcare is considered as one of the complex industry and it’s especially need in this pandemic period. Many people are getting infected in this pandemic period and everyone can’t afford payment.In this time insurance comes handy for the people to reduce their financial burden.But there are frauds happening in this also so it is very difficult and some may not get proper response due to this. So there is a need to address this problem. Machine learning is mainly used to tackle these issues so we will be a building a machine learning model where the model is made to train on the previous data and made to learn to find the pattern so that it is capable of analyising and prediction the insurance claim is fraud or not.
Advantages
Machine learning algorithms takes less time and computational power than the existing system methods.
As the system can be automated it will be helpful to healthcare industry to serve the people right.
ALGORITHM AND TECHNIQUES
Algorithm Explanation
• In machine learning and statistics, classification is a supervised learning approach in which the computer program learns from the data input given to it and then uses this learning to classify new observation.
• This data set may simply be bi class (like identifying whether the person is male or female or that the mail is spam or non spam) or it may be multi class too.
• Some examples of classification problems are: speech recognition, handwriting recognition, bio metric identification, document classification etc.
Logistic Regression
It is a statistical method for analysing a data set in which there are one or more independent variables that determine an outcome. The outcome is measured with a dichotomous variable (in which there are only two possible outcomes). The goal of logistic regression is to find the best fitting model to describe the relationship between the dichotomous characteristic of interest (dependent variable = response or outcome variable) and a set of independent (predictor or explanatory) variables. Logistic regression is a Machine Learning classification algorithm that is used to predict the probability of a categorical dependent variable. In logistic regression, the dependent variable is a binary variable that contains data coded as 1 (yes, success, etc.) or 0 (no, failure, etc.).
In other words, the logistic regression model predicts P(Y=1) as a function of X. Logistic regression Assumptions:
Binary logistic regression requires the dependent variable to be binary.
For a binary regression, the factor level 1 of the dependent variable should represent the desired outcome.
Only the meaningful variables should be included.
International Journal of Advanced Research
The independent variables should be independent of each other. That is, the model should have little.
The independent variables are linearly related to the log odds.
Logistic regression requires quite large sample sizes.
MODULE DIAGRAM
in Engineering
Technology
data and its properties; this knowledge will help you choose which algorithm to use to build your model.A number of different data cleaning tasks using Python’s Pandas library and specifically, it focus on probably the biggest data cleaning task, missing valuesand it able to more quickly clean data. It wants to spend lesstime cleaning data, and more time exploring and modeling.

Some of these sources are just simple random mistakes. Other times, there can be a deeper reason why data is missing. It’s important to understand these different types of missing data from a statistics point of view. The type of missing data will influence how to deal with filling
GIVEN INPUT EXPECTED OUTPUT
input : data values output : predicting output MODULE DESCRIPTION

List of Modules
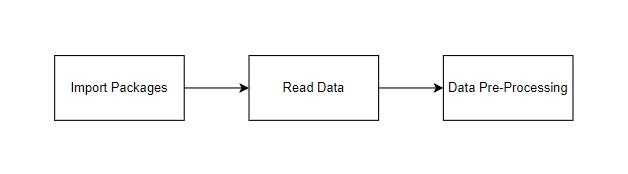
Data Pre processing
Data Analysis of Visualization
Comparing Algorithm with prediction in the form of best accuracy result
Deployment Using Flask
Module description
Data Pre processing
Validation techniques in machine learning are used to get the error rate of the Machine Learning (ML) model, which can be considered as close to the true error rate of the dataset. If the data volume is large enough to be representative of the population, you may not need the validation techniques. However, in real world scenarios, to work with samples of data that may not be a true representative of the population of given dataset. To finding the missing value, duplicate value and description of data type whether it is float variable or integer. The sample of data used to provide an unbiased evaluation of a model fit on the training dataset while tuning model hyper parameters.
The evaluation becomes more biased as skill on the validation dataset is incorporated into the model configuration. The validation set is used to evaluate a given model, but this is for frequent evaluation. It as machine learning engineers use this data to fine tune the model hyper parameters. Data collection, data analysis, and the process of addressing data content, quality, and structure can add up to a time consuming to do list. During the process of data identification, it helps to understand your
in the missing values and to detect missing values, and do some basic imputation and detailed statistical approach for dealing with missing data. Before, joint into code, it’s important to understand the sources of missing data. Here are some typical reasons why data is missing:
User forgot to fill in a field.
Data was lost while transferring manually from a legacy database.
There was a programming error.
Users chose not to fill out a field tied to their beliefs about how the results would be used or interpreted.
Variable identification with Uni variate, Bi variate and Multi variate analysis:
import libraries for access and functional purpose and read the given dataset
General Properties of Analyzing the given dataset
Display the given dataset in the form of data frame
show columns
shape of the data frame
describe the data frame
data type and information about dataset
Checking for duplicate data
Missing values of data

unique values of data
count values of
drop the
Data Validation/ Cleaning/Preparing Process
Importing the library packages with loading given dataset. To analyzing the variable identification by data shape, data type and evaluating the missing values, duplicate values. A validation dataset is a sample of data held back from training your model that is used to give an estimate of model skill while tuning model's and procedures that you can use to make the best use of validation and test datasets when evaluating your models. Data cleaning / preparing by rename the given dataset and drop the column etc. to analyze the uni variate, bi variate and multi variate process. The steps and techniques for data cleaning will vary from dataset to dataset. The primary goal of data cleaning is to detect and remove rrors and anomalies to increase the value of data in analytics and decision making.
MODULE DIAGRAM
identifying patterns, corrupt data, outliers, and much more.
With a little domain knowledge, data visualizations can be used to express and demonstrate key relationships in plots and charts that are more visceral and stakeholders than
GIVEN INPUT EXPECTED OUTPUT
input : data output : removing noisy data Exploration data analysis of visualization

Data visualization is an important skill in applied statistics and machine learning. Statistics does indeed focus on quantitative descriptions and estimations of data. Data visualization provides an important suite of tools for gaining a qualitative understanding. This can be helpful when exploring and getting to know a dataset and can help
measures of association or significance. Data visualization and exploratory data analysis are whole fields themselves and it will recommend a deeper dive into some the books mentioned at end.
Sometimes data does not make sense until it can look at in a visual form, such as with charts and plots. Being able to quickly visualize of data samples and others is an important skill both in applied statistics and in applied machine learning. It will discover the many types of plots that you will need to know when visualizing data in Python and how to use them to better understand your data

How to chart time series data with line plots and categorical quantities with bar charts.

MODULE DIAGRAM
GIVEN INPUT EXPECTED OUTPUT
Comparing Algorithm with prediction in the form of best accuracy result
is important to compare the performance of multiple different machine learning algorithms consistently and it will discover to create a test harness to compare multiple different machine learning algorithms in Python with scikit learn. It can use this test harness as a template on your own machine learning problems and add
more and different algorithms to compare. Each model will have different performance characteristics. Using resampling methods like cross validation, you can get an estimate for how accurate each model may be on unseen data. It needs to be able to use these estimates to choose one or two best models from the suite of models that you have created. When have a new dataset, it is a good idea to visualize the data using different techniques in order to look at the data from different perspectives. The same idea applies to model selection. You should use a number of different ways of looking at the estimated accuracy of your machine learning algorithms in order to choose the one or two to finalize. A way to do this is to use different visualization methods to show the average accuracy, variance and other properties of the distribution of model accuracies.
In the next section you will discover exactly how you can do that in Python with scikit learn. The key to a fair comparison of machine learning algorithms is ensuring that each algorithm is evaluated in the same way on the same data and it can achieve this by forcing each algorithm to be evaluated on a consistent test harness.
In the example below 4 different algorithms are compared:
Logistic Regression


Random Forest
Decision Tree Classifier
Naive Bayes
The K fold cross validation procedure is used to evaluate each algorithm, importantly configured with the same random seed to ensure that the same splits to the training data are performed and that each algorithm is evaluated in precisely the same way. Before that comparing algorithm, Building a Machine Learning Model using install Scikit Learn libraries. In this library package have to done preprocessing, linear model with logistic regression method, cross validating by KFold method, ensemble with random forest method and tree with decision tree classifier. Additionally, splitting the train set and test set. To predicting the result by comparing accuracy.
Prediction result by accuracy: Logistic regression algorithm also uses a linear equation with independent predictors to predict a value. The predicted value can be anywhere between negative infinity to positive infinity. It need the output of the algorithm to be classified variable data. Higher accuracy predicting result is logistic regression model by comparing the best accuracy.

Pre processing refers to the transformations applied to our data before feeding it to the algorithm.Data Preprocessing is a technique that is used to convert the raw data into a clean data set. In other words, whenever the data is gathered from different sources it is collected in raw format which is not feasible for the analysis. To achieving better results from the applied model in Machine Learning method of the data has to be in a proper manner. Some specified Machine Learning model needs information in a specified format, for example, Random Forest algorithm does not support null values. Therefore, to execute random forest algorithm null values have to be managed from the original raw data set. And another aspect is that data set should be formatted in such a way that more than one Machine Learning and Deep Learning algorithms are executed in given dataset.
False Positives (FP): A person who will pay predicted as defaulter. When actual class is no and predicted class is yes. E.g. if actual class says this passenger did not survive but predicted class tells you that this passenger will survive.
False Negatives (FN): A person who default predicted as payer. When actual class is yes but predicted class in no. E.g. if actual class value indicates that this passenger survived and predicted class tells you that passenger will die.
True Positives (TP): A person who will not pay predicted as defaulter. These are the correctly predicted positive values which means that the value of actual class is yes and the value of predicted class is also yes. E.g. if actual class value indicates that this passenger survived and predicted class tells you the same thing.
True Negatives (TN): A person who default predicted as payer. These are the correctly predicted negative values which means that the value of actual class is no and value of predicted class is also no. E.g. if actual class says this passenger did not survive and predicted class tells you the same thing.
True Positive Rate(TPR) = TP / (TP + FN)
False Positive rate(FPR) = FP / (FP + TN)
Accuracy: The Proportion of the total number of predictions that is correct otherwise overall how often the model predicts correctly defaulters and non defaulters.
Accuracy calculation:
Accuracy = (TP + TN) / (TP + TN + FP + FN)
Accuracy is the most intuitive performance measure and it is simply a ratio of correctly predicted observation to the total observations. One may think that, if we have high accuracy then our model is best. Yes, accuracy is a great measure but only when you have symmetric datasets where values of false positive and false negatives are almost same.
Precision: The proportion of positive predictions that are actually correct.
Precision = TP / (TP + FP)
Precision is the ratio of correctly predicted positive observations to the total predicted positive observations. The question that this metric answer is of all passengers that labeled as survived, how many actually survived?
High precision relates to the low false positive rate. We have got 0.788 precision which is pretty good.
Recall: The proportion of positive observed values correctly predicted. (The proportion of actual defaulters that the model will correctly predict)
Recall = TP / (TP + FN)
Recall(Sensitivity) Recall is the ratio of correctly predicted positive observations to the all observations in actual class yes.
F1 Score is the weighted average of Precision and Recall. Therefore, this score takes both false positives and false negatives into account. Intuitively it is not as easy to understand as accuracy, but F1 is usually more useful than accuracy, especially if you have an uneven class distribution. Accuracy works best if false positives and false negatives have similar cost. If the cost of false positives and false negatives are very different, it’s better to look at both Precision and Recall.
General Formula:
F Measure = 2TP / (2TP + FP + FN)
F1 Score Formula:
F1 Score = 2*(Recall * Precision) / (Recall + Precision) 1)
2) SYSTEM DESIGN
System Architecture
SYSTEM TESTING
System testing ensures that the entire integrated software system meets requirements. It tests a configuration to ensure known and predictable results. An example of system testing is the configuration oriented system integration test. System testing is based on process descriptions and flows, emphasizing pre driven process links and integration points.

Integration tests are designed to test integrated software components to determine if they actually run as one program. Testing is event driven and is more concerned with the basic outcome of screens or fields. Integration tests demonstrate that although the components were individually satisfaction, as shown by successfully unit testing, the combination of components is correct and consistent. Integration testing is specifically aimed at exposing the problems that arise from the combination of components.
Organization and preparation of functional tests is focused on requirements, key functions, or special test cases. In addition, systematic coverage pertaining to identify Business process flows; data fields, predefined processes, and successive processes must be considered for testing. Before functional testing is complete, additional tests are identified and the effective value of current tests is determined. Conclusion
The analytical process started from data cleaning and processing, missing value, exploratory analysis and finally model building and evaluation. The best accuracy on public test set is higher accuracy score will be find out. This application can help to find the Prediction of Insurance Claim Fraud.
REFERENCES
[1] National Health Care Anti Fraud Association, “The challenge of health care fraud,” https://www.nhcaa.org/resources/health care antifraud resources/the challenge of health care fraud.aspx, 2020, accessed January, 2020.

[2] Font Awesome, “Image generated by free icons,” https://fontawesome.com/license/free, 2020, online.