URTeC: 3830016
Fracturing Fluid Chemistry and Job Placement Design Optimized for Formation Skin Damage Reduction Improves Well Performance: A Permian Midland Basin Case Study
John Blevins*, Hibernia Resources III LLC; Timothy C. Svarczkopf*, Kira Demitrus*, and Jordan Gist*, Imperative Chemical Partners
Copyright 2023, Unconventional Resources Technology Conference (URTeC) DOI 10.15530/urtec-2023-3830016

This paper was prepared for presentation at the Unconventional Resources Technology Conference held in Denver, Colorado, USA, 13-15 June 2023.
The URTeC Technical Program Committee accepted this presentation on the basis of information contained in an abstract submitted by the author(s). The contents of this paper have not been reviewed by URTeC and URTeC does not warrant the accuracy, reliability, or timeliness of any information herein. All information is the responsibility of, and, is subject to corrections by the author(s). Any person or entity that relies on any information obtained from this paper does so at their own risk. The information herein does not necessarily reflect any position of URTeC. Any reproduction, distribution, or storage of any part of this paper by anyone other than the author without the written consent of URTeC is prohibited.
Abstract
Large volume slick-water treatments are standard practice for stimulating JoMill, Lower Spraberry, Middle Spraberry, Wolfcamp A, Wolfcamp B, and Wolfcamp D pay zones in the Midland basin. While deployment of scale inhibitors, biocides, surfactants, and breakers have seen varied acceptance as part of the fracturing fluid chemistry package, friction reducers are always required to achieve desired job placement given the inherent friction associated with long pipe lengths encountered. Friction reducers have become a commodity with many suppliers providing similar chemistries at ever decreasing costs that correlate with reduced value delivery. Extremely high friction reducer rates (> 1.0 GPT) are now commonplace. These high friction reducer rates are deleterious to well performance given the plugging of pore throats that occurs at the fracture face.
An alternative approach has been developed for the design of stimulation fluid chemistry in conjunction with a job fluid placement design that mitigates skin damage associated with the fluid package deployed. The fracturing fluid laboratory workflow allows for friction reducer development that results in the lowest friction reducer treat rates possible. While this is certainly beneficial from a cost perspective, the real driver of lower friction reducer treat rates is to minimize formation skin damage. Better fluids that reduce skin damage result in improved well performance. The job placement design is engineered to minimize perf friction and to utilize lower stimulation rates. This has the net effect of routinely reducing friction reducer treat rates to as low as 0.15 GPT, keeping the fracture network in zone, and subsequently increasing well performance. The laboratory workflow includes rock/fluid interaction and pore throat simulation experiments that ensure fracturing fluid compatibility with formation geochemistry, chemistry of the native oil, chemistry of the native pore water, and chemistry of source waters utilized for fracturing. The laboratory workflow also results in customized
fracturing fluids for each thermal maturity encountered and reliable job placement at design conditions. After extensive experimentation, new polymerization mechanisms that cause fracture face skin damage were identified and used to develop customized chemistries.
The new job design and fracturing fluid chemistry approach has been deployed on a full pad for field comparison against offset pads. 18 month cumulative well oil production data from the first multi-well experiment demonstrates that the new job design results in a 29.3% and 51.5% increase in well production over adjacent pad parent wells landed in Wolfcamp Upper B and Wolfcamp Lower B respectively, an 83.7% increase over Wolfcamp Upper B adjacent child wells, and a 110.5% increase over adjacent Wolfcamp Lower B child wells. As of this writing, the approach has been deployed in 341 Midland Basin wells.
This study highlights the importance of custom formulating fracturing fluids based on thermal maturity windows and landing zones with the express purpose of minimizing skin damage caused by polymerant mass formation to increase well productivity. Further, the study highlights the need and ability to engineer job designs that reduce friction reducer treatment rates required to place the job.
Introduction: Optimizing Fracturing Fluid Chemistry in Order to Enable Increased Well Performance
Given the excellent return on investment offered by multiple stacked pay landing zones in the Permian Midland Basin, a factory approach has been taken to optimize drilling and completion times. The value of an operator has largely been based on ability to achieve year over year gains in production with the least capital deployment. Rather than focusing on well performance improvements to increase production, it has been profitable to simply drill and complete more wells year over year Demand destruction in the COVID-19 era has led many operators to change strategy and increase $/bbl margins via increased well performance per dollar spent. Laboratory workflows and resulting stimulation fluid chemistries can be used to support this value delivery approach. The laboratory workflow must be holistic in its’ approach and consider job placement efficiency, compatibility with formation oils, compatibility with formation water, compatibility with formation geochemistry, compatibility with water available for fracturing, compatibility with sand sources, and compatibility with other required fluid components such as biocides, scale inhibitors, corrosion inhibitors, and breakers.
Laboratory Workflow
Friction Flow Loop Investigations
Completions operations must maintain a factory model for efficient deployment of capital. Therefore, the primary objective of any stimulation fluid laboratory workflow must be to ensure efficient job placement. Given the need to investigate many fluid combinations for optimizing resource recovery, it is imperative that a friction flow loop adequately simulates the hydraulic engineering of a modern well bore. Gaps in this capability have been resolved by technology represented in Patent Number US 11,175,209 B1 (Svarczkopf 2021a) Rather than a simplistic reporting of friction reduction that may not reflect well bore hydraulic engineering, the new technology determines:
1) friction reduction at well bore hydraulic engineering conditions
2) hydration speed
3) shear effects
4) friction barrier film strength and duration
5) friction reducer threshold dosage
6) fluid viscosity available at the perf
The friction flow loop instrument has excellent agreement with field performance (Fig. 1) This laboratory predictive tool enables the ability to investigate hundreds of fluid combinations created for the express intent of increasing well productivity without the need for cumbersome field tote trials. A friction reducer must be type matched to the water available for fracturing and to the hydraulic engineering conditions desired by the operator. For example, water quality ranges from <1000 ppm TDS fresh water to 180,000 TDS reuse water, treating rates have been observed to range from 80 BPM to 120 BPM through 4.778” ID pipes, and lateral lengths can range from 2 miles to 3 miles. An 80 BPM treating rate, 2.5 PPG sand concentration, and a 19,500 foot pipe length (2 mile lateral) represents a shear rate of 1208 sec-1 and a pipe residence time of 5.4 minutes. A 120 BPM treating rate, 2.5 PPG sand concentration, and 24,750 foot pipe length (3 mile lateral) represents a shear rate of 1812 sec-1 and a pipe residence time of 4.6 minutes. These conditions are dramatically different than those typically present in traditional flow loops, which creates the need for a more sophisticated testing apparatus.
Once the appropriate friction reducer is selected for a particular well bore hydraulic engineering condition, frac water source quality must be considered for friction reducer evaluation. The flow loop experimental design matrix must consider additives utilized in water reuse treating operations. Common errors in water reuse treatment include utilization of polyaluminum chloride for floc and drop clarification in fracs that deploy anionic stimulation fluid systems. Polyaluminum chloride compounds, while suitable for cationic fluid systems, are cationic compounds and incompatible with anionic systems. Solution polymer anionic flocculants are compatible with anionic fluid systems and remove iron and suspended solids from produced water. Another common error is failure to control oxidizer deployment utilizing oxidation reduction potential (ORP) process controls. ORP values less than 350 mV are not likely to provide enough oxidation to kill bacteria and oxidize metals for precipitation. ORP values greater than 450 mV oxidize important fluid chemistries like friction reducers, scale inhibitors, and the like indiscriminately. Proper KPI’s for treating produced water for reuse are:
1) pH = 6.0 to 8.0
2) ORP = 350mV to 450mV
3) Turbidity < 15 NTU
4) Fe < 2 ppm
5) H2S = Non Detect
6) Sulfate-Reducing Bacteria = Non Detect
7) Oil and Grease (TPH) < 10 ppm
8) Flocculant charge matched to the intended stimulation fluid design as opposite charges react.
The experimental design matrix needs to consider the pragmatic band width of process control for a given water reuse treating operation. Friction reducer flow loop investigations utilizing field frac water sources typically need to be conducted ahead of every well pad given ever increasing and varied amounts of reuse water being utilized. Full ion chromatography (IC) and inductively coupled plasma (ICP) water analyses

need to be completed for water sources ahead of fracs. The data should be utilized to run mineral saturation models to determine risk of scaling for various blends of the water sources and risks created as stimulation fluid invades native water in the formation.
Competing ion effects from the high molecular weights and charge densities of friction reducers require that friction reducers become the building block for which the rest of the fracturing fluid must be built around to utilize the fluid to increase well performance over preceding type curves. Also, the goal must be to utilize the least amount of friction reducer possible to reduce fracture face skin damage.
Formation Geochemistry
Drill cuttings should be collected throughout the lateral for x-ray diffraction analyses that can inform the best stimulation fluid compositions that are compatible with the formation. Some examples as to how geochemistry can inform stimulation fluid choices are:
A) Siderite The iron carbonates have some level of solubility during HCl formation acid breakdown and in water. Soluble iron can greatly impact friction reducer performance. Siderite scales can be difficult to manage both at the fracture face and during production.
B) Ankerite The iron/manganese carbonates and excess calcium carbonates would present the same stimulation fluid concerns as siderite. Excess calcium could increase the formation cationic charge to the extent cationic fluids are required if enough excess calcium is present.
C) Sphalerite Iron and zinc sulfides are largely inert to water and acid. Knowing sulfide compositions does inform that sulfate-reducing bacteria were part of the depositional environment and can inform microbiological control needs.
D) Halite The solubility of NaCl in acid and water is significant and can impact many stimulation fluid components.
E) Anhydrite and Gypsum Calcium sulfate scales can be painful to manage both at the fracture face and during production.
F) Fluoroapatite There could be phosphate release from an acid breakdown step that could result in significant scaling and microbiological control issues. Detectable levels of this mineral have not yet been observed in any of the Midland basin formations thus studies regarding water or HCl solubility have not yet been prioritized.
G) Marcasite Same concerns as for pyrite and sphalerite.
H) Kaolinite Kaolinite is a soft clay so fines migration in high velocity fracturing operations is a concern.
I) Chlorite Chlorite has a deleterious reaction with acid break down steps and fouls the fracture face. People typically have such trouble pumping jobs when chlorite is present that HCl formation breakdown steps get abandoned quickly.
J) Calcite/dolomite HCl addition can be very helpful in creating fracture initiation sites and reducing near well bore tortuosity in formations with high concentrations of these minerals.
K) Smectite Smectite clays are swelling, migrating clays that can severely foul fracture faces at very low concentrations. It is important to use cationic fluid systems in desiccated rock formation s.
Formation Hydrocarbon and Native Water Geochemistry
Gas chromatography oil finger printing, API gravity, cloud point, and PARA (paraffins, asphaltenes, resins, aromatics) analyses on analog well produced oils should be utilized to inform stimulation fluid development for the express intent of increasing well productivity. Full IC/ICP work ups should be completed on analog well produced water. It is desirable to collect well head samples and to wait until the time of laboratory analysis to separate the oil and water components to prevent oxidation of soluble iron species in the produced water as the oil layer on top prevents oxidation. In one of the simplest skin damage formation mechanisms to consider, many of the oils encountered in the Midland basin stacked pays have cloud points greater than 70 deg F. In many months of the year, water temperatures used for fracturing are well below 70 deg F so paraffin polymerization that combines with rock fines should be expected to cause permanent skin damage at the fracture face Another interesting observation is that the shallower target zones in the Midland basin stacked pay are less thermally mature and have higher molecular weight paraffin, asphaltene, and resin concentrations that can cause skin damage. The deeper formation targets like Wolfcamp D are more thermally mature and the high molecular weight paraffins, asphaltenes, and resins have cooked away to form kerogen and bitumen in the rock resulting in few color bodies (Fig. 2f) Generally, but not always, an operator can get away with less than adequate fluids on the deeper formation targets without suffering a severe well productivity penalty

Once the friction reducer(s) of interest have been selected based on the friction flow loop laboratory and geochemistry workflows, emulsion and foaming tests need to be completed at shear rates reflective of well bore hydraulic engineering conditions. Stimulation fluids should be designed to eliminate the need for defoamers and demulsifiers on flow back to protect the surface facility. Acceptable foaming does not significantly change the volume of the combined fluids (Fig. 3a) Acceptable emulsions are flowable (Fig. 3b) Unacceptable foaming and emulsions (Fig. 3c-e) are caused by incompatible chemistry within the fracturing fluid and as fracturing fluids are reacted with native pore fluids. Analog well head samples within 5 miles of the pad to be fractured should be utilized for the experiments.

Optimized Pore Throat Investigations and Solutions (OPTIS™1)
Pore throat level investigations are required to investigate the capabilities of the holistic fluid to mitigate the polymerization that causes skin damage and reduced well productivity. Patent s US 11,060,364 B1 (Svarczkopf 2021b), US 11,092,586 B1 (Svarczkopf 2021c), and US 11,549,322 B1 (Svarczkopf 2023) fill a technology gap that has heretofore existed. The technology represented by these patents enable factory quantity investigation of fracturing fluid/formation fluid interactions and fracturing fluid/rock interactions. The methods have proven that skin damage (pore throat fouling) due to these interactions are a driver of poor well performance that can be mitigated. Unfortunately, indiscriminate use of surfactants justified by utilizing experimental methods like interfacial tension and contact angles have proven to be unreliable and sometimes even damaging to well productivity due to the skin damage that they can cause A two mile (10,560 foot) lateral stimulated to create a fracture half-length of 180 feet results in a stimulated rock volume of 1,368,576,000 cubic feet. At 20% porosity (US Energy Administration 2020), 20% water saturation (Wood Mackenzie 2018), and 7.48 gallons per cubic foot of water, the stimulated rock volume contains 409,477,939 gallons of water by calculation For a stimulation fluid loading of 75 bbl per foot, the stimulation injects 33,264,000 gallons of fluid for a 10,560 foot lateral length. Mathematically, the injected fluid would have to change the physical properties of 12.3 times the injected volume to impact the entire volume of water contained in the stimulated rock volume. When calculating for the same oil saturation occupying the same pore space, the injected fluid would have to be able to chemically alter 24.6 times the injected volume of fluid. Mitigating pore throat fouling at the fracture face and some limited depth beyond it has a much higher mathematical probability
Skin Factor Experiments
Skin factor experiments measure the speed at which fracturing fluids can pass through pore throats. The experiments take into account the pore throat diameter of the connected porosity that enable well productivity. Bottom hole pressure gauge data from Permian Midland basin formation targets indicate that fracturing builds bottom hole pressures to approximately 5100 PSI for any given area. Within 3 to 6 weeks, bottom hole pressures drop to approximately 2100 PSI. The gas velocity of this high-pressure regime represents a significant drive velocity for propelling fluids (oil, native water, and fracturing fluid) out of the formation. Maintaining open pore throats so that as much fluid can move toward the fracture face as quickly as possible is critical to this production mechanism. The skin factor experimental method enables the ability to look at hundreds of fluid combinations for any given formation target thermal maturity to select the best fluid that mitigates pore throat fouling. The experiments are performed at temperatures that mimic the fracturing fluid temperature and repeated at formation temperatures.
Polymerant Mass Experiments
Polymerant mass experiments measure the quantity of pore throat foulants formed during reaction of the fracturing fluid with native fluids that stay stuck in the pore matrix. The method proves that up to 10,000 tons per 2 mile lateral horizontal well of polymerant mass can be formed from these interactions causing severe skin damage and subsequent well productivity decreases. The method is designed to enable investigation of hundreds of fluids and with the same temperature considerations as the skin facto r experiments.
Composite Core Effective Permeability Experiments
The technology represented in the patents (Svarczkopf 2021b, 2021c, 2023) enables the ability to take drill cuttings and form them into composite core. These composite cores can be formed at various porosities, permeabilities, and fluid saturations for rock/fluid interaction investigations. The technology enables effective permeability (imbibition/displacement) experiments at a factory speed to determine how
fracturing fluids interact with target formation geochemistry and which fluids maintain pore throat openings.

Laboratory Workflow Summary
The holistic laboratory workflow demonstrated that 2-acrylamido-2-methylpropane sulfonic acid (AMPS)-based anionic friction reducers were most suitable for preventing skin damage. It was a significant finding to determine that the utilization of certain AMPS architecture in fresh water reduced polymerization reactions with formation fluids. Sulfonated compounds have been utilized for many years in water floods to increase well productivity but were not historically used in fresh water fracs. The current trend to ever increasing amounts of produced water reuse has required the development of several generations of AMPS architecture in order to keep friction reducer treating rates low to enable optimum well performance. Current anionic AMPS technology enables high brine reuse at low friction reducer treating rates that was heretofore only possible with cationic fluid systems.
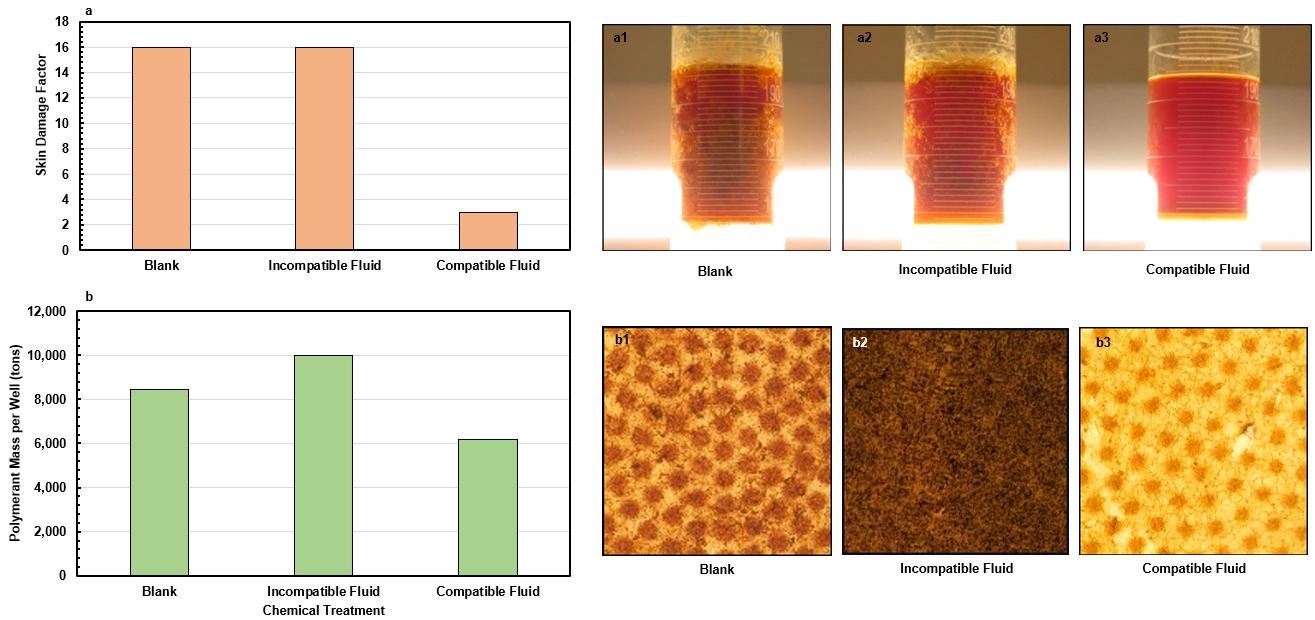
The holistic laboratory workflow also determined that a new class of chemistry needed to be developed to prevent skin damage. These newly invented chemistries are referred to as non-emulsifying skin damage reductants (NESDR™2). The Permian Midland Basin oils can be characterized as having high molecular weight free radical paraffins, asphaltenes, and resins. Carboxy free radicals, peroxy free radicals, and metal free radicals in the produced water get intensely remixed back into the oils during the hydraulic fracturing pressure wave forming the polymerants that foul pore throats. It was a significant finding of the laboratory workflow to determine how severely many of the Midland Basin formation targets can foul pore throats (Fig. 4).
There has been very good correlation of NESDR performance in the laboratory workflow to increases in well performance. NESDR success is primarily based upon the increase in speed at which fluid can traffic through pore throats and elimination of foulant that permanently blocks pore throats. Reductions of skin factors and polymerant mass of 20% to 45% correlate to the same well productivity increases (Fig. 5, Case History 1, Case History 2). The laboratory workflow has enabled the development of 4 generations of NESDR to date.
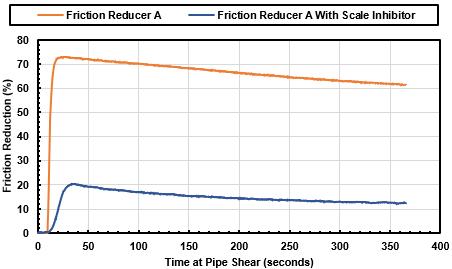
Once the laboratory workflow determines optimal water reuse treating methods, friction reducer, and NESDR components, compatible adjuncts like scale inhibitors, biocides, corrosion inhibitors, breakers and the like must demonstrate compatibility with the previously selected fluid components, formation fluids, and geochemistry. Production chemistry experimental methods such as dynamic scale loops, paraffin loops, and linear polarization resistance loops are well studied for selection of these compounds and the risk mitigation afforded by them. While the selection of these adjuncts and incorporating them into a fracturing fluid seems simple, many mistakes are easily made in this process. It takes a lot of proprietary laboratory workflow investigation to avoid them. One of the more common mistakes is using cationic glut/quat biocides in anionic fluid systems. One significant finding in the laboratory workflow was determining that a near nonionic scale inhibitor could debilitate a friction reducer (Fig. 6).
Another significant finding was that certain friction reducers can form a solid mass when reacted with formation oil and water. Acrylamide slurries that utilize organoclay suspension agents are particularly prone to these adverse reactions (Fig. 3e)
Job Fluid Placement Design
Once the fracturing fluid design team agrees to reducing friction reducer treating rates to the lowest practical dosage and the appropriate laboratory workflow is complete, job design becomes the limiting factor. The sources of horsepower demand are:
1) pipe friction
2) perforation friction
3) near well bore tortuosity
4) sand friction
5) earth’s ability to crack (frac gradient)
Pipe friction is governed by pipe ID, pipe length, and treating rate. For example, a 19,500 foot, 4.778 inch I.D. pipe typical of a 2 mile long horizontal lateral and 2.5 PPG sand concentration results in theoretical pipe friction of 16,953 PSI and 36,967 PSI for treating rates of 80 BPM and 120 BPM respectively. The pipe friction increases to 25,492 PSI and 56,646 PSI at 80 BPM and 120 BPM respectively for a 24,750 foot pipe typical of a 3 mile long lateral. The best friction reducers can reach nearly 80% friction reduction but as the fluid shears down the full residence time of the pipe, effective friction reduction across the entire pipe length is several percentage points lower. Some of the worst-inclass friction reducers provide only 55% peak friction reduction. In summary, pipe ID, pipe length, stimulation rate, and friction reducer selection are very important levers for keeping friction reducer application rates as low as possible.
Tribal knowledge from the past provided a rule of thumb that treating rates need to be 1 to 3 BPM per perforation for limited entry job designs to open the majority of the perforations. Use of the orifice flow equation has increased the precision of perforating operations. The orifice flow equation is as follows:
Where:
dP = total perforation friction in psi
� = fluid density in lb/gallon
Q = flow rate in BPM per perforation
D = perforation diameter in inches
C = discharge coefficient = perforation coefficient = coefficient of roundness
Utilizing the orifice flow equation for a 0.36” diameter perforation using standard water density and a 0.95 discharge coefficient, the perforation pressure drop is 130.49 PSI for a 1 BPM treating rate and 1174.38 PSI for 3 BPM treating rate. For a 0.54” diameter perforation using standard water density and 0.95 discharge coefficient, the perforation pressure drop is 25.78 PSI for a 1 BPM treating rate and 231.98
PSI for a 3 BPM treating rate. These relatively low modeled pressure drops seem to have minimal impact on surface horsepower requirements. However, more attention is being paid to perforation reliability and coefficient of roundness and for good reason For example, if a perf gun centralizer is not used or vertical phasing deployed, slotted perforations can be created instead of round ones as the perforating gun lifts off the bottom of the casing. For the 0.36” perf diameter case at 3 BPM and a coefficient of roundness reduced to 0.25, the calculated pressure drop is 16,958.07 PSI! Operators can obtain a specific hole size of their request within about .02 inches (Snider, 2019). The friction reducer is typically blamed first when jobs fail to pump. Questions of friction reducer performance are eliminated when products are selected and quality checked by the technology embodied in Patent Number US 11,175,209 B1 (Svarczkopf, 2021). Frac gradient is also regularly blamed when jobs won’t pump. In reality, perforation reliability is often causal to difficult job placement. Perforating charge specification and cluster design can be significant levers for reducing surface horsepower and friction reducer requirements Fluids following the
path of least resistance is a commonly understood hydraulic engineering principle. The industry clearly observes this phenomena when frac hits happen miles from a well bore being fracture stimulated. Fluids preferentially flow to the connected porosity and/or natural fracture swarms. Once pipe pressure during fracturing is equalized, flow will tend to go through those clusters offering the least resistance preferentially. Since pipe friction can be as high as 1.5 PSI/foot, 150 foot spacing of clusters can result in the perf clusters furthest from the pump having 225 PSI reduced pressure force for opening perforations. Given the possibility, it doesn’t seem wise to engineer all clusters along a 150 foot lateral section equally. Fewer perforations in clusters closest to the pump would seem to give those clusters furthest from the pump a better opportunity to receive fluid. An example perf cluster configuration to more equally distribute flow across 150 feet of lateral is provided in Fig. 7.
Acid breakdown of calcareous formations create fracture initiation sites and reduce near well tortuosity. This lowers surface horsepower and friction reducer demand. Sand placement designs can also affect friction reducer and horsepower requirements. The viscosity of a fluid required to place a 5 ppg sand concentration fluid is far different than one required to place a peak 3 ppg sand concentration. Fluid friction reducer requirements also increase when tailing in with 40/70 and 30/50 coarser sands. There is an optimal fluid viscosity that must be available at the perforation to transport sand. If there is too little fluid viscosity, fluid leak off into natural micro swarm fractures occurs causing sand duning. This results in higher horsepower requirements and difficult job placement. If the fluid viscosity is too high, sand bridging across far field micro fractures occurs which increases treating pressures in order to move fluid into distant fractures. Depending on job design and friction reducer type, the optimal viscosity build ranges between a 2% to 8% increase over the baseline fluid available at the perf based on years of data generated by the technology embodied in Patent Number US 11,175,209 B1
Case History 1 – Hibernia Mary Rose Pad versus James Pad Wolfcamp Upper B Formation Target
The James pad is adjacent to the Hibernia Mary Rose pad in Reagan County, Texas. The pads are suitable for benchmarking the Wolfcamp Upper B and Wolfcamp Lower B formation targets. A gun barrel diagram follows as Fig. 8.

This case history compares Wolfcamp Upper B formation target wells. The James N 45-50 4314H well represents the parent well for the Wolfcamp Upper B formation for the area. The remainder of all wells compared are child wells.
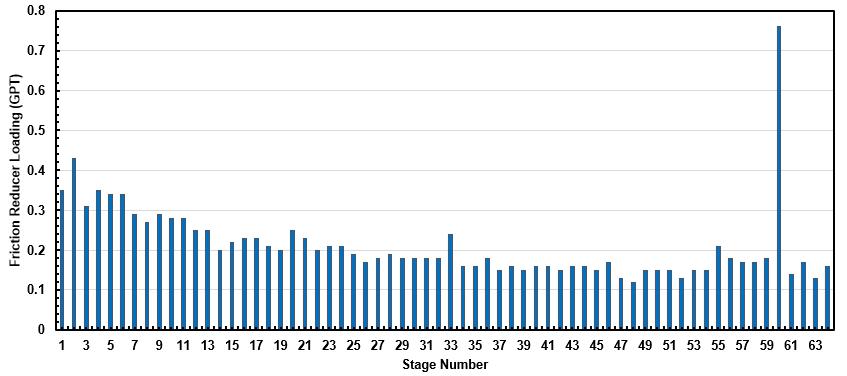
The Imperative Chemical Partners optimized pore throat investigations and solutions (OPTIS) proprietary laboratory workflow and patented methods were utilized to select the optimal fluid package for the Hibernia Mary Rose wells. Even though fresh water was utilized for the Mary Rose wells, a 50% solids slurry AMPS terpolymer friction reducer was deployed based on skin damage experimental results. The fluid goal was to maintain friction reducer treating rates as low as possible. Other fluid package components specified were: a) HCl-1,000 gallons per stage b) 1.0 GPT solvent based NESDR c) 0.3 GPT polyacrylate based scale inhibitor and d) 0.1 GPT glutaraldehyde based friction reducer. The friction reducer treating rates (Fig. 9) were kept very low at 0.21 GPT as was predicted by the patented friction flow loop
Other benchmarking data relative to the James pad wells post completion are:
Note: EUR values calculated using a $75/bbl oil and $2.50/Mcf price deck.
Based on the data, the following conclusions are offered:
1
2
3
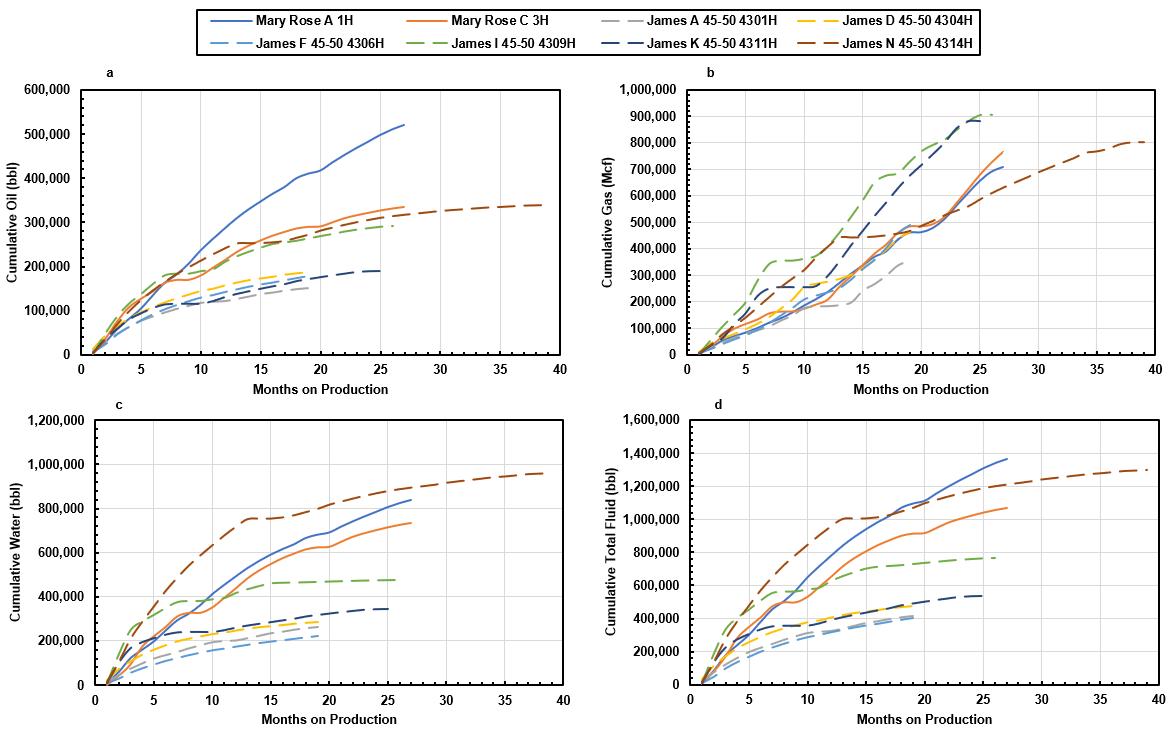
After 18 months, the Hibernia Mary Rose Wolfcamp Upper B wells averaged 342,869 bbl of cumulative oil production per well (Fig. 10a).
After 18 months, James Wolfcamp Upper B wells averaged 199,776 bbl of cumulative oil production per well inclusive of the N 45-50 4314H parent well (Fig. 10a).
After 18 months, the Hibernia Mary Rose Wolfcamp Upper B wells produced an average of 143,093 bbl additional oil per well over the James wells. At a $75 per bbl price deck, this represents an increased value of $10,731,975 per well within the first 18 months (Fig. 10a).
4 – Enverus calculated EUR data results in a predicted lifetime economic value of $117,470,668 for Mary Rose Wolfcamp Upper B wells versus $46,085,955 for James Wolfcamp Upper B wells at a price deck of $75/bbl for oil and $2.50/Mcf natural gas (Table 3)
5 – Potential rationale for the increased Hibernia Mary Rose Wolfcamp Upper well productivity:
a) Vastly different completion fluids were utilized on the Mary Rose wells
b) Different perf cluster designs were utilized to complete the Mary Rose wells (Table 1).
c) Sand loadings were lower for three of the six James wells. However, the three James wells with similar sand loadings (4314, 4309, 4311) to the Mary Rose wells performed poorly in comparison especially given that one of the wells was a parent well (Table 2).
d) Except for the 4314 parent well which was unbounded at the time of fracturing, the James wells were spaced between 750 feet and 990 feet apart. The Hibernia Mary Rose wells were spaced 1320 feet apart.
e) A geologic reservoir anomaly could be present. However, this is considered unlikely as the comparison offset was 1320 feet away.
f) Based on cumulative gas production, the James 4309 and 4311 had the most gas production to drive oil from the formation but did not make competitive amounts of cumulative oil production compared to Mary Rose.
g) The Mary Rose job design and fluid characteristics likely connected to the formation in a manner that the initial gas velocity was levered to move more oil closer to the fracture face for increased well oil productivity for the life of the well.
Case History 2
Hibernia Mary Rose Pad versus James Pad Wolfcamp Lower B Formation Target
The James pad is adjacent to the Hibernia Mary Rose pad in Reagan County, Texas. The pads are suitable for benchmarking the Wolfcamp Upper B and Wolfcamp Lower B formation targets. A gun barrel diagram follows as Fig. 11.
This case history compares Wolfcamp Lower B formation target wells. The James N 45-50 4415H well represents the parent well for the Wolfcamp Lower B formation for the area. The remainder of all wells compared are child wells.

The Imperative Chemical Partners optimized pore throat investigations and solutions (OPTIS) proprietary laboratory workflow and patented methods were utilized to select the optimal fluid package for the Hibernia Mary Rose wells. Even though fresh water was utilized for the Mary Rose wells, a 50% solids slurry AMPS terpolymer friction reducer was deployed based on skin damage experimental results. The fluid goal was to maintain friction reducer treating rates as low as possible. Other fluid package components specified were: a) HCl-1,000 gallons per stage. b) 1.0 GPT solvent based NESDR. c) 0.3 GPT polyacrylate based scale inhibitor and d) 0.1 GPT glutaraldehyde based friction reducer.
The friction reducer treating rates were kept very low at 0.21 GPT as was predicted by the patented friction flow loop (Fig. 12)
Other benchmarking data relative to the James pad wells post completion are:
Note: Casing issues in the Mary Rose B 2H resulted in reduced stimulated lateral length

Note: EUR values calculated using a $75/bbl oil and $2.50/Mcf price deck.
Based on the data, the following conclusions are offered:
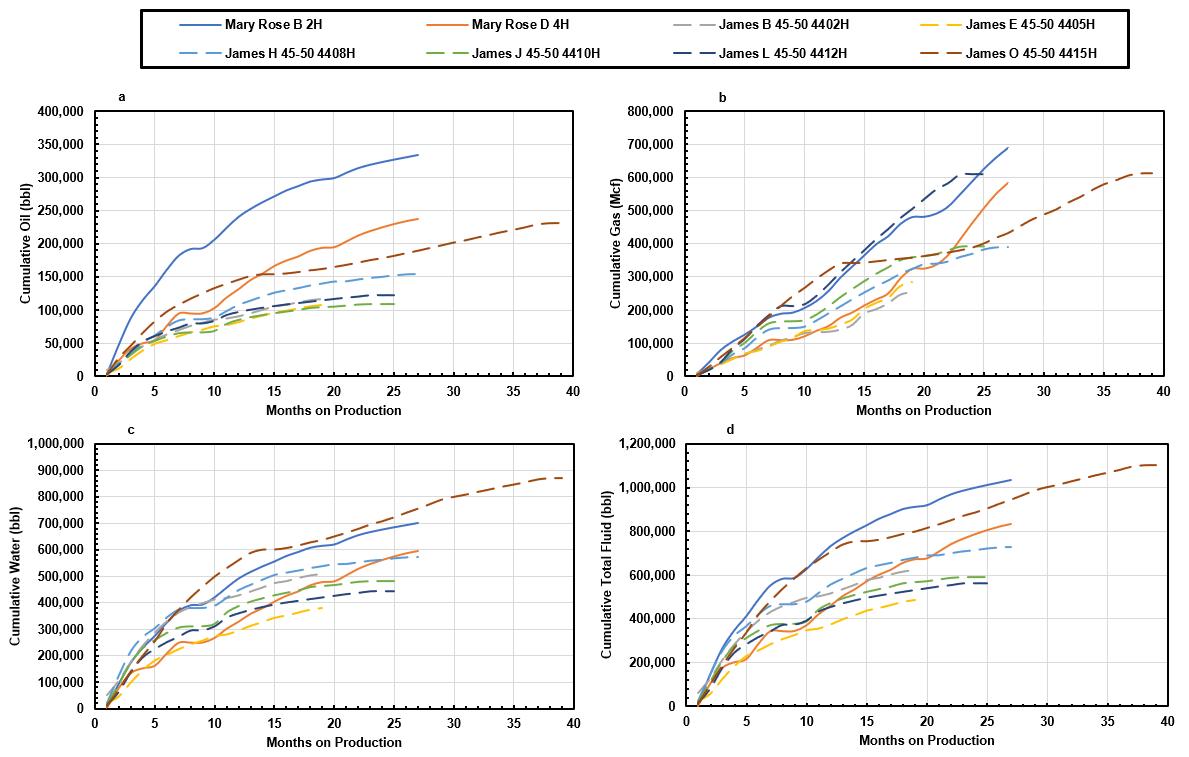
1 – After 18 months, the Hibernia Mary Rose Wolfcamp Lower B wells averaged 242,070 bbl of cumulative oil production per well (Fig. 13a).
2 – After 18 months, James Wolfcamp Lower B wells averaged 122,435 bbl of cumulative oil production per well inclusive of the N 45-50 4415H parent well (Fig. 13a).
3
4
5
After 18 months, the Hibernia Mary Rose Wolfcamp Lower B wells produce an average of 119,635 bbl additional oil per well over the James wells. At a $75 per bbl price deck, this represents an increased value of $8,972,611 per well (Fig. 13a).
Enverus calculated EUR data results in a predicted lifetime economic value of $67,463,132 for Mary Rose Wolfcamp Lower B wells versus $32,651,867 for James Wolfcamp Lower B wells at a price deck of $75/bbl for oil and $2.50/Mcf natural gas (Table 6).
Potential rationale for the increased Hibernia Mary Rose Wolfcamp Upper well productivity:
a) Vastly different completion fluids were utilized on the Mary Rose wells.
b) Different perf cluster designs were utilized to complete the wells (Table 4).
c) Sand loadings were lower for three of the six James wells. However, the three James wells with similar sand loadings (4410, 4412, 4415) to the Mary Rose wells performed poorly in comparison especially given that one of the wells was a parent well (Table 5).
d) Except for the 4415 parent well which was unbounded at the time of fracturing, the James wells were spaced between 750 feet and 990 feet apart. The Hibernia Mary Rose wells were space 1320 feet apart.
e) A geologic reservoir anomaly could be present. However, this is considered unlikely as the comparison offset was 1320 feet away.
f) Based on cumulative gas production, the James 4412 had the most gas production to drive oil from the formation but did not make competitive amounts of cumulative oil product compared to Mary Rose.
g) The Mary Rose job design and fluid characteristics likely connected to the formation in a manner that the initial gas velocity was levered to move more oil closer to the fracture face for increased well oil productivity for the life of the well.
Case History 3 – Hibernia Type Curves By Formation Compared To Peers In Their Area Within The Midland Basin
This case history compares Hibernia cumulative oil production type curves to the peer group in its’ operating area by formation target. Enverus filters utilized were:
1
Midland Basin.
2 – Wolfcamp A and Wolfcamp B formation targets.
3
Cumulative oil production normalized to 10,000 foot lateral length.
4
Horizontal wells.
5
Reagan and Upton counties.

6 – Gas lift.
7 – Wells with first production date between 1/1/2020 and 6/1/2022.
8
Type curves stop getting calculated when less than 65% of the original data set remain. (ex: if only 64 out of 100 wells in a dataset have data points at 12 months, the type curves stop at 11 months)
For the Wolfcamp A formation target, the Enverus data search resulted in 10 wells for the Hibernia data set and 155 wells for the peer group operator data set.
For Wolfcamp B formation target, the Enverus data search resulted in 25 wells for the Hibernia data set and 140 wells for the peer group operator data set.
Based on the data, the following conclusions are offered:
1
For the Wolfcamp A formation target, Hibernia increased averaged cumulative oil production over the peer operator group by 45% at 9 months (Fig. 14a).
2 – For the Wolfcamp B formation target, Hibernia increased average cumulative oil production over the peer operator group by 19% at 17 months (Fig. 14b).
Case History 4 – Imperative Chemical Partners NESDR Treated Well Type Curves By Formation Compared To Peers In The Midland Basin
This case history compares Imperative Chemical Partners NESDR treated well cumulative oil production type curves to the peer group in its’ operating area by formation target. Enverus filters utilized were:
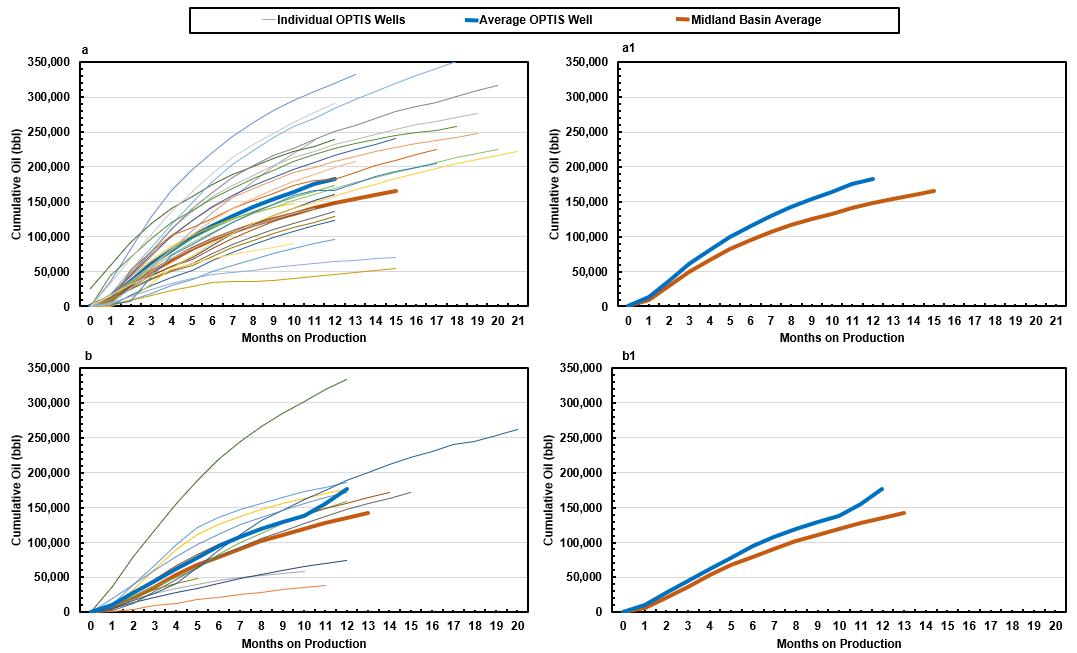
1 – Midland Basin.
2 – Lower Spraberry, Middle Spraberry, Wolfcamp A and Wolfcamp B formation targets.
3
Cumulative oil production normalized to 10,000 foot lateral length.
4 – Horizontal wells.
5 – Wells with first production date between 1/1/2020 and 6/1/2022.
6 – Type curves stop getting calculated when less than 65% of the original data set remain. (ex: if only 64 out of 100 wells in a dataset have data points at 12 months, the type curves stop at 11 months)
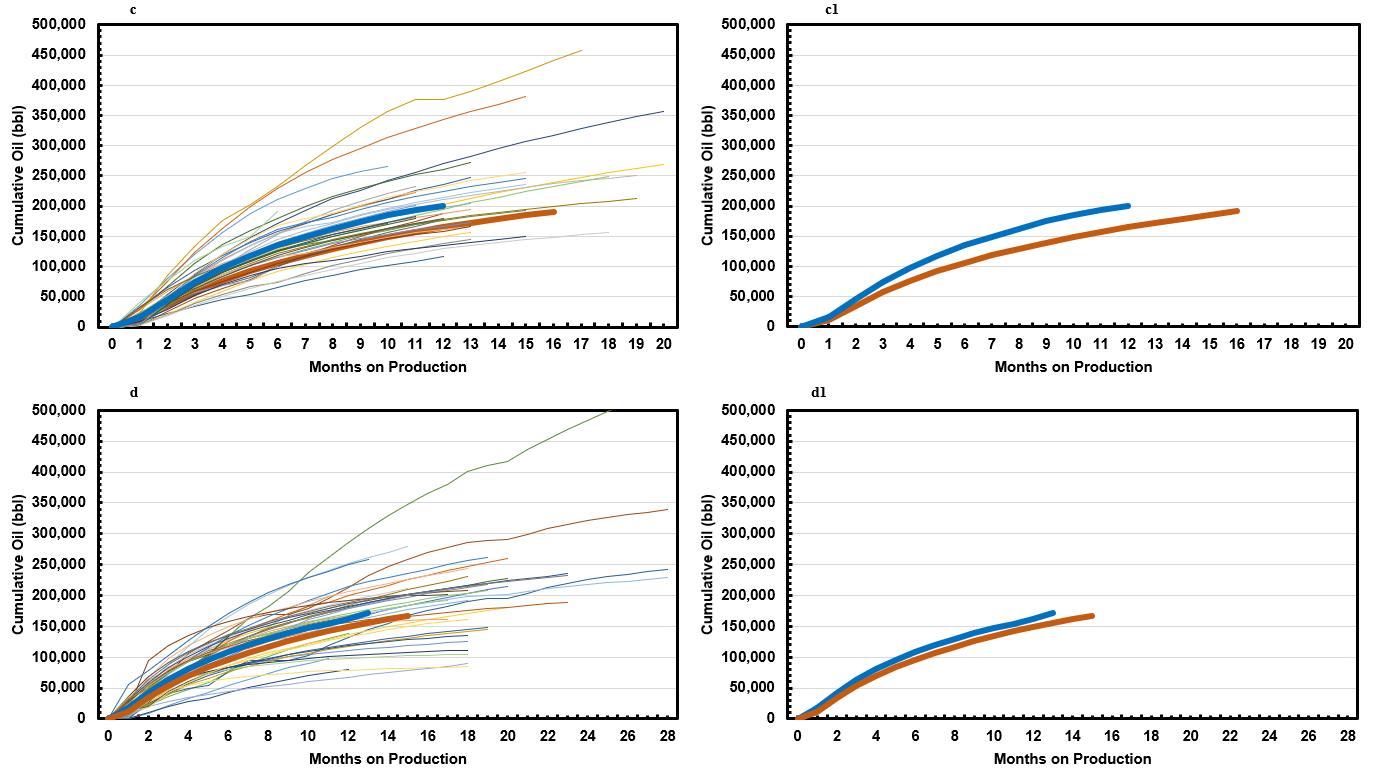
For the Lower Spraberry formation target, the Enverus data search resulted in 27 wells for the Imperative Chemical Partners NESDR data set and 1347 wells for the peer group operator data set.
For the Middle Spraberry formation target, the Enverus data search resulted in 11 wells for the Imperative Chemical Partners NESDR data set and 285 wells for the peer group operator data set.
For the Wolfcamp A formation target, the Enverus data search resulted in 33 wells for the Imperative Chemical Partners NESDR data set and 1582 wells for the peer group operator data set.
For the Wolfcamp B formation target, the Enverus data search resulted in 52 wells for the Imperative Chemical Partners NESDR data set and 1287 wells for the peer group operator data set.
Based on the data, the following conclusions are offered:
1
For the Lower Spraberry formation target, Imperative Chemical Partners NESDR increased averaged cumulative oil production over the peer operator group by 24% at 11 months (Fig. 15a1).
2 – For the Middle Spraberry formation target, Imperative Chemical Partners NESDR increased averaged cumulative oil production over the peer operator group by 31% at 12 months (Fig. 15b1).
3 – For the Wolfcamp A formation target, Imperative Chemical Partners NESDR increased averaged cumulative oil production over the peer operator group by 21% at 12 months (Fig. 15c1).
4 – For the Wolfcamp B formation target, Imperative Chemical Partners NESDR increased averaged cumulative oil production over the peer operator group by 10% at 13 months (Fig. 15d1).
Conclusions
• Customized fracturing fluids and job placement design can reduce friction reducer treatment rates (<0.15 GPT) and minimize skin damage for increased well performance.
• A new class of Non-Emulsifying Skin Damage Reductant (NESDR) chemistry has been developed for increased well performance.
• Laboratory workflows can ensure fracturing fluid compatibility with formation geochemistry, chemistry of the native oil, chemistry of the native pore water, and chemistry of source waters utilized for fracturing.
• This approach has been used to increase well performance in the Permian Midland Basin by as much as 110.5% over analog child wells.
Future Work
• Seek best practices across the basin for cluster design and treating rate.
• Utilize the Enverus database to seek out high performing wells treated with NESDR to further identify rationale behind performance.
• Continue to lever the OPTIS laboratory database to further correlate laboratory performance to field well performance.
• Increase focus on developing fracturing fluids utilizing oil saturated composite core technology and effective permeability testing.
• Utilize the laboratory workflow technology to develop fluid chemistry for well restimulation.
References
2NESDR™. 2022. Imperative Chemical Partners, Midland, TX, USA.
1OPTIS™. 2022. Imperative Chemical Partners, Midland, TX, USA.
Svarczkopf, Timothy C. 2021. Friction Flow Loop Test Method and Apparatus. US Patent No. 11,175,209 B1.
Popova, Olga. 2020. Wolfcamp Shale Play of the Midland Basin, Geology Review. U.S. Energy Information Administration. Washington, DC (August 2020).
Snider, Phil 2019. Recent Trends In Perforating For Limited-entry Stimulation. E+P, 11/01/2019.
Svarczkopf, Timothy C. 2021. Drill Cuttings Composite Core Manufacturing Method and Apparatus. US Patent No. 11,060,364 B1.
Svarczkopf, Timothy C. 2021. Evaluating Spontaneous Hydraulic Fracturing Fluid Imbibition and Oil Displacement Method and Apparatus. US Patent No. 11,092,586 B1.
Svarczkopf, Timothy C. 2023. Drill Cuttings Composite Core Manufacturing Method and Apparatus. US Patent No. 11,549,322 B1.
Wood Mackenzie. 2018 Water saturation in the Delaware and Midland basins for Wolfcamp B bench wells Wood Mackenzie Insight, Houston, Texas.
