Means of BMI from day1 to day 30
The survey revealed that product satisfactions were high in most aspects, namely taste was 457, smell was 447, dissolve was 457, package was 477 and reducing weight was 469
From the scale 5: taste was 457, smell was 447, dissolve was 457, packaging was 477 and feeling of weight reductionwas 469
4. Conclusion
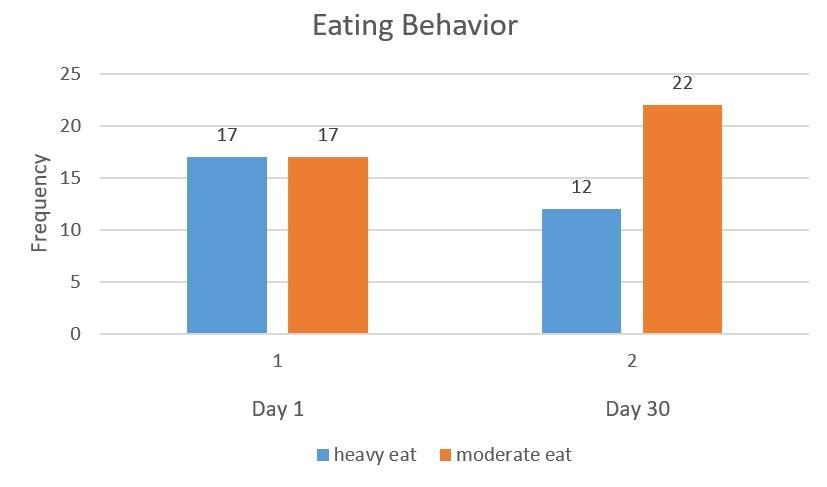
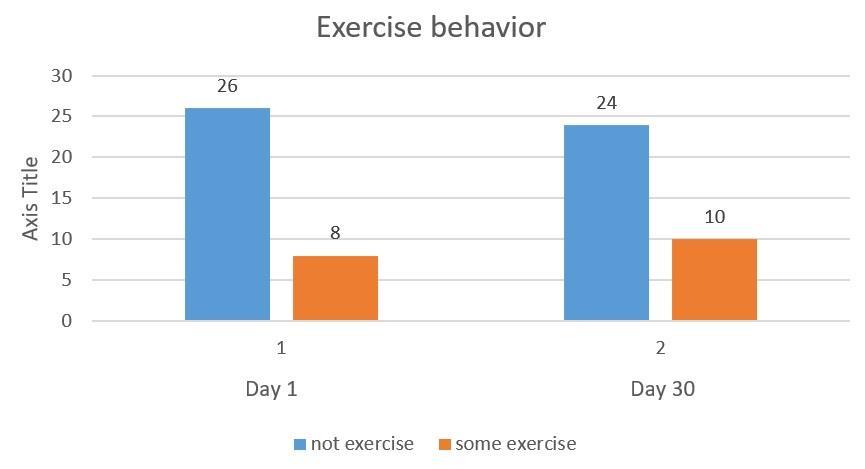
This experiment confirmed that when eating behavior and exercise activities were controlled, the weightandBMIofrandomlyselected34participantsweresignificantlyreducedwhen tookThaidietary supplements food 1 time/day replacedinner for 30 days The result of this study supported the pristine investigation by Machek et al (2019) and Roberfroid et al (2019) Moreover, this survey confirmed that participants were highly satisfied with the dietary supplement food
Onnim et al OP3 Page 6
Figure 4 Graph showed the average BMI of participants measured on day 1, 7, 14, 21 and 30
Figure 5Product satisfaction scores
24.47 24.36 24.09 23.86 23.66 22.80 23.00 23.20 23.40 23.60 23.80 24.00 24.20 24.40 24.60 24.80 day 1 day 7 day 14 day 21 day 30 BMI (kg/m2) Day
4.57 4.47 4.57 4.77 4.69 4.20 4.30 4.40 4.50 4.60 4.70 4.80 4.90 Taste Smell
Package
Satisfaction Product characteristics Product satisfaction * * * * *
Dissolve
Reduce wt.
5. Acknowledgements
The authors would like to thank The Faculty of Pharmaceutical Sciences, Burapha University, Thailand for funding this research The authors would also like to thank a dedicated group of subjects and the Health Buddy Company who kindly supported only the Fit-U dietary supplements food for this experiment The company would accept the result of this study no matter what it was, unconditionally. There was absolutely no conflict of interests between authors and the Health Buddy Company.
6 References
Aekplakorn, W, Inthawong, R, Kessomboon, P, Sangthong, R, Chariyalertsak, S, Putwatana, P, & Taneepanichskul, S. (2014). Prevalence and trends of obesity and association with socioeconomic status in Thai adults: National Health Examination Surveys, 1991-2009 Journal of obesity, 2014, 410259 https://doiorg/101155/2014/410259
Cohen, J. (1977). Statistical Power Analysis for the Behavioral Sciences second edition, Lawrence Erlbaum Associates, Publishers.Jitnarin, N, Kosulwat, V, Rojroongwasinkul, N, Boonpraderm, A, Haddock, C K, & Poston, W S. (2011). Prevalence of overweight and obesity in Thai population: results of the National Thai Food Consumption Survey Eating and weight disorders: EWD, 16(4), e242–e249 https://doiorg/101007/BF03327467
Lee, J. (2014). A Survey on Intake of Protein Supplement of University Students Majoring in Physical Education Journal of The Korean Society of Food Science and Nutrition, 43, 1607-1613
Machek, M L, Sonnenschein, H A, Graham, S I, Shikwana, F, Kim, S L, Garcia DuBar, S, Minzer, I D,Wey,R,& Bell,J K. (2019). Predictingandvalidatingamodel ofsuppressorofIKKepsilon throughbiophysicalcharacterization Proteinscience : apublicationoftheProteinSociety,28(8), 1423–1436 https://doiorg/101002/pro3640
Park, Y, Park, H Y, Kim, J, Hwang, H, Jung, Y, Kreider, R, & Lim, K. (2019). Effects of whey protein supplementation prior to, and following, resistance exercise on body composition and training responses: A randomized double-blind placebo-controlled study Journal of exercise nutrition & biochemistry, 23(2), 34–44 https://doiorg/1020463/jenb20190015
Pitkanen, H T, Nykanen, T, Knuutinen, J, Lahti, K, Keinanen, O, Alen, M, Komi, P V, & Mero, A A. (2003). Free amino acid pool and muscle protein balance after resistance exercise Medicine and science in sports and exercise, 35(5), 784–792 https://doiorg/101249/01MSS000006493451751F9
Roberfroid,M,Gibson,G R,Hoyles,L,McCartney,A L,Rastall,R,Rowland,I,Wolvers,D,Watzl, B, Szajewska, H, Stahl, B, Guarner, F, Respondek, F, Whelan, K, Coxam, V, Davicco, M J, Léotoing, L,Wittrant, Y, Delzenne,N M, Cani, P D, Neyrinck,A M, Meheust, A. (2010).
Prebiotic effects: metabolic and health benefits The British journal of nutrition, 104 Suppl 2, S1–S63 https://doiorg/101017/S0007114510003363
Soft drinks in Thailand London: Euromonitor International; (2016). Available from: https://wwweuromonitorcom/soft-drinks-in-Thailand/report World Health Organization. (2022). Obesity and overweight Available from: https://wwwwhoint/news-room/fact-sheets/detail/obesity-and-overweight
Onnim et al OP3 Page 7
Proceeding of Cosmetic & Beauty International Conference 2022 Future of the Next Beauty (CBIC 2022)

7th-9th December 2022
Comparison of effectiveness and satisfaction between Thai liniment and Singapore liniment
Suthabordee Muongmee1 , Nuttinee Teerakulkittipong1 , Phatsakorn Onnim1 , Pongpan Siriyong1, Phakdee Sukpornsawan1, Yutthapoom Meepradist1 , Krittaphas Kangwanrattanakul1, Chamipa Phanudulkitti1, Nattanichcha Kulthanachairojana1 , Pinkamon Sompeewong2, Nathamon Ngamsom3 , Yu Yu Win3, and Titinun Auamnoy1*
1Lecturer Faculty of Pharmaceutical Sciences, Burapha University, Chonburi, Thailand 20131
2 Lecturer Praboromarajchanok Institute, Sirindhorn College of Public Health Chonburi, Thailand
3Student Faculty of Pharmaceutical Sciences, Burapha University, Chonburi, Thailand 20131
*Corresponding author. E-mail: Titinun.a@pharm.chula.ac.th
Abstract
Liniment is a liquid or lotion, especially one made with oil, for rubbing on the body to relieve pain. Patients not only therapeutic effect desired, but also the quality of cosmetic grade of oil preferred. Objectives: to compare effectiveness and qualifications of Thai and Singapore liniments in 3 dimensions including: 1) Effectiveness i.e. onset and duration of pain relieving
2)Satisfaction i.e. color,viscosity, and heat sensation, 3) Consumer riski.e.price, performance and side effect. Method: A true crossing over experimental design was performed to compare two liniment brands. Two sampling techniques were used: 1) Simple random sampling one Thai liniment brand and one Singapore liniment brand were chosen to be the representatives.
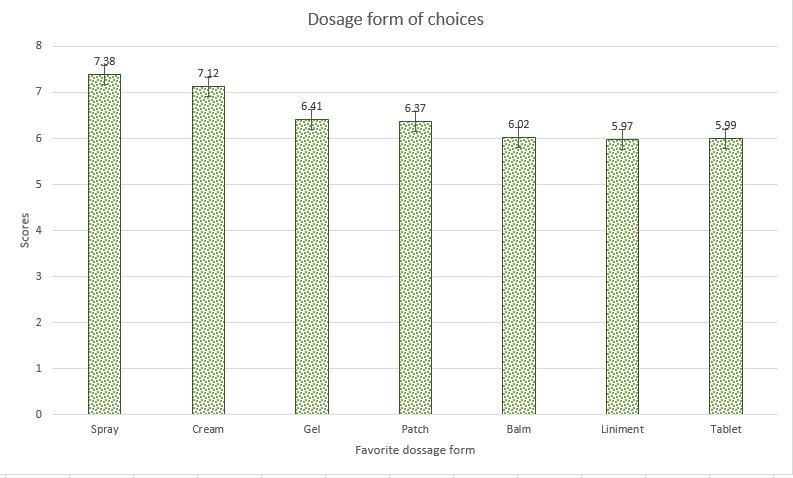
2)Burapha university student sport men from 10 kinds of sports were randomly selected. Sample size was calculated via Jacob Cohen’s table 1978, with α=0.05, β=0.20, power=0.80 and effect size=0.40. Calculated sample size was n=26 in each group. Total sample size (N) was 52. The Visual Analogue Scale was used to measure pain relieving satisfaction into ratio scale. Paired t-test and ANOVA were employed to identify the significance of the mean differences. Results: The most favored pain relieved products dosage form among sport-men were sprays 7.38±1.06, creams 7.12±1.89, gels 6.41±1.37, patches 6.37±1.79, balms 6.02±1.51, liniments 5.97±1.08, and tablets 5.92±1.34.The mean differences of between effectiveness, satisfaction and consumer risk between Thai liniment brand and Singapore liniment brand were not significantly differences (p≥0.05) however the price of Thai liniment brand was significantly cheaper than Singapore liniment brand (p<0.05). Conclusion: We confirmed that Thai liniment brand and Singapore liniment brand liniment were not significantly different in all aspects namely, effectiveness, satisfaction and consumer risk except Thai price was cheaper. Therefore, Thai government should support Thai small industry likes the OTOP liniment products to compete and survive in international market.
Keywords: Liniment; Crossing-over; True experimental design; ANOVA, Paired t-test
1. Introduction
Linimentis a liquidor lotion,especiallyone madewith oil, forrubbing on the body to relievepain. Patients not only therapeutic effect desired, but also the quality of cosmetic grade of oil preferred for residual left on skin, counterirritant, color, smell, viscosity and side effect.
OP4 Page 8
Liniment is a medicated topical preparation for application to the skin. Sometimes called a heat rub, a liniment may have viscosity similar to that of water, or may be formulated as a lotion or balm and are usually rubbed on skin to allow penetration of the active ingredients. Patches, sticks, and sprays are also available (De Belilovsky, Boyer, Bellemere, & Baudouin, 2020; DOWNING, 1946).
Liniments are usually sold to relieve pain, like from painful muscle aches and strains, or swelling. Liniments are normally formulated from alcohol, acetone, or similar rapidly-vaporizing solvents and contain counterirritant scented chemical compounds, such as methyl salicylate, benzoin resin, and menthol.They producea sense of hotnesswithinthe muscleof the areawhere the linimentsareapplied. Sports liniments are typically viscous, and a gentle massage is necessary whereas applying sports liniment on the skin. Liniment gives fast relief to the stresses and muscular pain. Liniment is presented in diverseforms,such as compressedliquid,semi-solid,and liquid.Because of the fast-relieving ability to pain,sportsliniment isexpectedtoremainpositiveinthe globalmarket (MaximizeMarketResearch, 2020; Stevenson, 2020).
2.Materials and Methods
2.1 Methods
A true crossing-over experimental design was performed to compare two liniment brands. This experiment was conducted during July to November 2018. The protocol of this study was approved by Burapha University Ethics Committee on June 2018.
2.2 Liniments selection processes
Firstly,three experts from Burapha University were agreed to set criteria to review and investigate the profileof all 36 Thai linimentand Singaporelinimentbrands in the Thai linimentmarket.Secondly, only8 qualifiedThailinimentbrandsandone Singaporebrand werequalifiedtobe chosento thisstudy Thirdly,onlyonebrandfrom8qualifiedThailinimentbrandswasrandomlyselectedtothisexperiment Then a qualifiedSingaporelinimentbrandwas selected. Finally,researcherscontactedthe chosen Thai liniment company and presented the protocol of the study. The company accepted the protocol and agreed to support its Thai liniment oil and also support the chosen Singapore liniment for this experiment.
2.3 Participants selection process
Population was all student athlete from 10 sports of The Burapha University in the year 2019. The selected sports were; football, basketball, volleyball, sepak-takro, boxing, swimming, running, badminton, tennis, and athlete
Samplesize was calculatedvia JacobCohen’stable1988 (Cohen,1988). α was set at 0.05, β=0.20, power=0.80, effect size=0.40, yielded n=26 in each group. Total sample size (N) was 26*2=52. Probability simple random sampling was executed to select samples (sport-men students)
1. Fifty-two (52) sport men from 10 sports from Burapha University were randomly chosen to be samples in this experiment. 2. Samples were randomly assigned into two groups (A and B) 3. The two groups were randomly selected to be treatment group A (Thai liniment treatment first, then Singapore liniment treatment) and group B (Singapore liniment treatment first, then Thai liniment treatment)
Crossing-over experimentaldesignwas performed Group A startedusing Thai linimentfor 7 days and answered the questionnaire. Three days-washout period-was deferred to let body eliminate the effect of Thai liniment. Then started using Singapore liniment for 7 days and answered the questionnaire. Whereas, Group B started using Singapore liniment for 7 days and answered the questionnaire. Three days-washout period-was deferred to let body eliminate the effect of Singapore liniment. Then started using Thai liniment for 7 days and answered the questionnaire.
2.4 Instrument:
The self-administrative questionnaire was consisted of 19 questions divided into four parts. 1. Demographic data; age, kind of sports. 2 Effectiveness i.e., onset and duration of pain relief 3. Satisfactioni.e., color, smell,viscosity,residualleft on skin and counterirritant effect,4. Consumer risk i.e., price, performance and side effect. The Visual Analogue Scale was used to measure all three dimensions (10 measurement variables) namely; effectiveness, satisfaction and consumer risks in ratio
Muongmee, et al OP4 Page 9
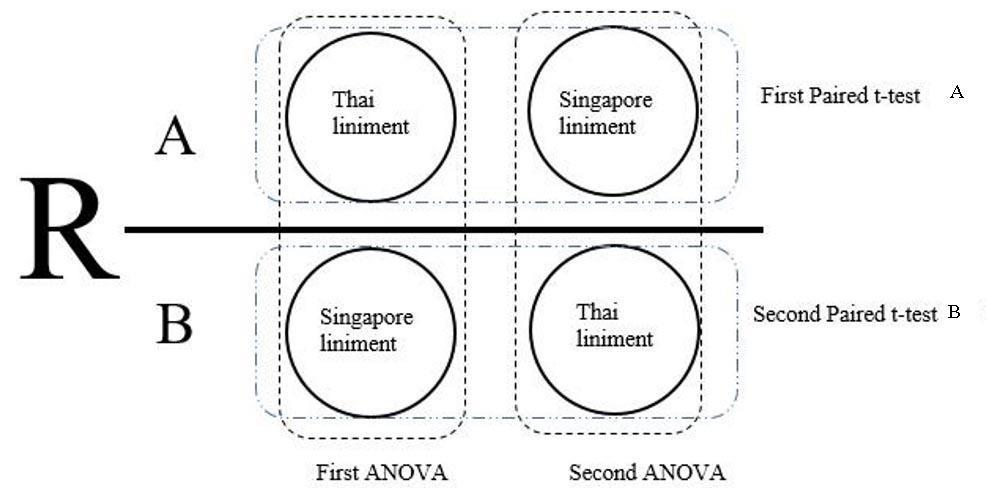
scale The collected data were analyzed using the Statistical Package for the Social Sciences (SPSS) version 17.0. Demographic characteristics were summarized using descriptive statistics. The nominal or ordinal scale variables were expressed in frequencies and percentages whereas the ratio scale results were presents in mean±standard deviation. parametric paired t-test was used to compare means before (treatment A-Thai liniment) and after (treatment B-Singapore liniment) of group A and to compare means before (treatment B-Singapore liniment) and after (treatment A-Thai liniment) of group B. Whereas, one way ANOVA was used to compare means of the two independent groups (A and B, 2 times) A p<0.05 was considered statistically significant in all directional (one-tailed) tests (Figure 1)
Crossing-over experimental design
Figure 1 Crossing-over experimental design and plan to designate statistical procedures in this experiment. (Campbell and Stanley, 2015; Steven, 1986)
3.Results and Discussion
All 52 (100.00 %) samples were completely collected data Most participants were male 41 (78.80%), female 11 (21.20%), group A (start using Thai liniment, then Singapore liniment) 26 (50.00%), B (start using Singapore liniment, then Thai liniment) 26 (50.00%), football 6 (11.50%), basketball 4 (7.70%), volleyball 4 (7.70%), sepak-takrow 4 (7.70%), boxing 6 (11.59%), swimming 6 (11.59%), running 6 (11.59%), badminton 6 (11.59%), tennis 6 (11.59%) and athlete 4 (7.70%) (Table 1).
Groups A (start using Thai liniment, then Singapore liniment)
(start using Singapore liniment, then Thai liniment)
Muongmee, et al OP4 Page 10
Variables Attributes Frequency Percent Gender Male Female 41 11 78.80 21.20
Table 1 Demographic data (nonmetric variables).
B
26 26 50.00 50.00 Sports Football 6 11.50 Basketball 4 7.70 Volleyball 4 7.70 Sepak-takrow 4 7.70 Boxing 6 11.50 Swimming 6 11.50 Running 6 11.50 Badminton 6 11.50 Tennis 6 11.50 Athlete 4 7.70
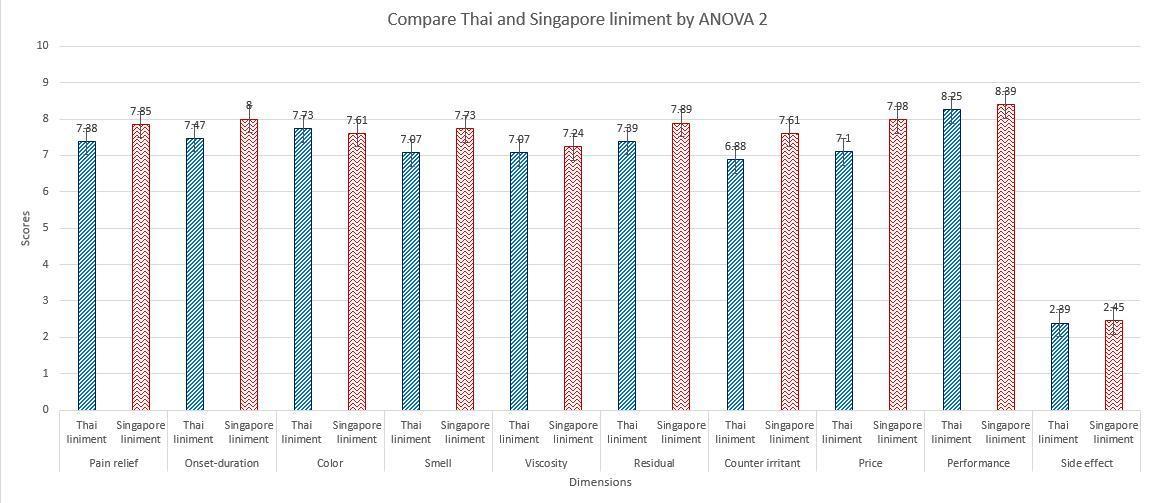
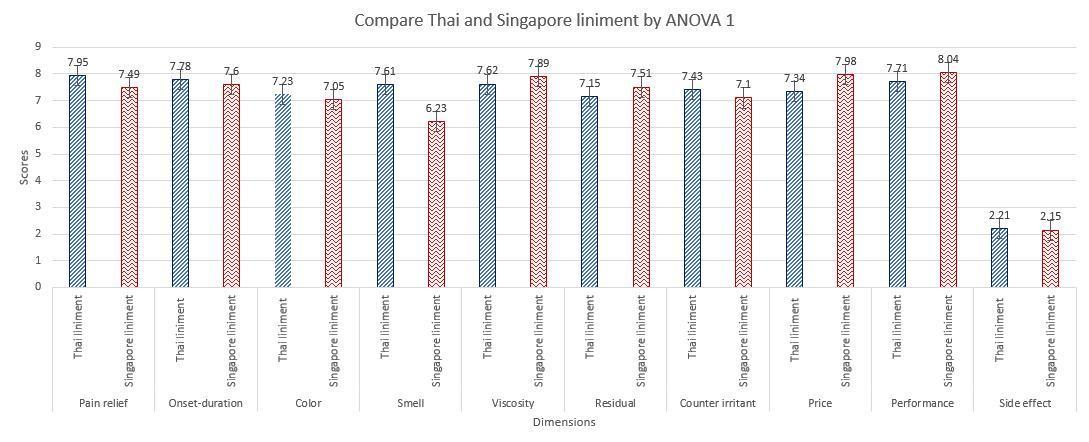
The firstANOVA test was employedto comparemeansof 10 aspectsbetween Thai and Singapore liniment. The results were; pain relief, onset and duration, color, smell, viscosity, residual, counterirritant, performanceand side effect were not significantly different (p≥0.05), however only the price of Thai liniment was significantly cheaper than Singapore liniment (p<0.05) (Table 2)
The second ANOVA test was employed to compare means of 10 aspects between Thai and Singapore liniment. The results were; pain relief, onset and duration, color, smell, viscosity, residual, counterirritant, performance and side effect were not significantly different (p≥0.05), however only the price of Thai liniment was significantly cheaper than Singapore liniment (p<0.05) (Table 2)
Paired t-test A was executed to compare means of pain relief, onset and duration, color, smell, viscosity, residual, counterirritant, price, performance and side effect. There were not significantly different between Thai and Singapore liniment in all aspects (p≥0.05) (Table 3)
Paired t-test B was executed to compare means of pain relief, onset and duration, color, smell, viscosity, residual, counterirritant, price, performance and side effect. There were not significantly different between Thai and Singapore liniment in all aspects (p≥0.05) (Table 4).
Muongmee, et al OP4 Page 11
Figure 1 Compare means by the first ANOVA of Thai and Singapore liniment in 10 aspects namely; pain relief, onset and duration, color, smell, viscosity, residual, counterirritant, price, performance and side effect.
Figure 2 Compare means by the second ANOVA of Thai and Singapore liniment in 10 aspects namely; pain relief, onset and duration, color, smell, viscosity, residual, counterirritant, price, performance and side effect.
*P<0.05According to 2 Times ANOVA test by crossing-over design, only price was significantly different. Thai liniment was significantly cheaper than Singapore liniment.
Table 3 Compare means of 10 aspects of Thai and Singapore liniment in group A by Paired t-test A Thai liniment Singapore liniment
This crossing-over experimental design confirmed by employed 2 ANOVA and 2 paired t-test that there werenosignificantlydifferencesbetweenThai and Singaporeliniment interm of painrelief,onset and duration, color, smell, viscosity, residual, counterirritant, performance and side effect (p≥0.05). However, price of Thai liniment was significantly cheaper than Singapore liniment (p<0.05).
OP4 Page 12
Muongmee, et al
First ANOVA test Second ANOVA test Concepts Country Mean±SD p-value Mean±SD p-value Pain relief Thai liniment 7.95±1.54 0.289 7.38±1.63 0.260 Singapore liniment 7.49±1.55 7.85±1.38 Onsetduration Thai liniment 7.78±1.48 0.929 7.47±1.58 0.061 Singapore liniment 7.60±1.46 8.00±1.32 Color Thai liniment 7.23±1.11 0.558 7.73±1.11 0.074 Singapore liniment 7.05±1.05 7.61±1.01 Smell Thai liniment 7.61±1.40 0.026 7.07±1.47 0.073 Singapore liniment 6.23±1.19 7.73±1.12 Viscosity Thai liniment 7.62±1.32 0.624 7.07±1.32 0.066 Singapore liniment 7.89±1.20 7.24±1.18 Residual Thai liniment 7.15±1.69 0.399 7.39±1.70 0.259 Singapore liniment 7.51±1.59 7.89±1.39 Counterirritant Thai liniment 7.43±1.49 0.371 6.88±1.60 0.055 Singapore liniment 7.10±1.11 7.61±1.03 Price Thai liniment 7.34±1.48 *0.047 7.10±1.50 *0.042 Singapore liniment 7.98±1.29 7.98±1.17 Performance Thai liniment 7.71±1.50 0.453 8.25±1.54 0.121 Singapore liniment 8.04±1.60 8.39±1.42 Side effect Thai liniment 2.21±1.33 0.384 2.39±1.34 0.225 Singapore liniment 2.15±1.01 2.45±0.91
Table 2 Compare means of 10 metric measurement variables by ANOVA 2 times (crossing-over)
Group A Mean±Std. Deviation Mean±Std. Deviation p-value Pain-relief 7.49±1.55 7.85±1.38 0.170 Onset 7.60±1.46 8.00±1.32 0.680 Color 7.05±1.05 7.61±1.01 0.720 Smell 7.23±1.19 7.73±1.11 0.855 Viscosity 7.45±1.20 7.94±1.18 0.737 Residual 7.51±1.59 7.89±1.39 0.383 Counterirritant 7.10±1.11 7.61±1.03 0.822 Price 7.34±1.29 7.85±1.17 0 064 Performance 8.04±1.60 8.39±1.42 0.433 Side effect 3.88±1.00 3.33±0.91 0.058
4.Conclusion
We found that Thai liniment brand and Singapore liniment brand liniment were not significantly different in most aspects namely, effectiveness, satisfaction and consumer risk, however Thai liniment was cheaper than Singapore liniment. Therefore, Thai government should support Thai small industry likes the OTOP liniment products to compete and survive in international market.
5.Acknowledgements
The authors would like to thank The Faculty of Pharmaceutical Sciences, Burapha University, Thailand for funding this research. The authors would also like to thank a dedicated group of subjects and The Gold-Cross Co, Ltd. Company who kindly supported Gold-Cross liniment product and Singapore liniment
Muongmee, et al OP4 Page 13
Thai liniment Singapore
Group A Mean±Std. Deviation Mean±Std. Deviation p-value Pain-relief 7.95±1.54 7.38±1.63 0.147 Onset 7.56±1.48 7.19±1.58 0.602 Color 7.23±1.11 6.73±1.11 0.741 Smell 7.61±1.40 7.07±1.47 0 711 Viscosity 7.62±1.32 7.07±1.32 0 678 Residual 7.90±1.69 7.39±1.70 0.382 Counterirritant 7.43±1.49 6 88±1.60 0 780 Price 7.54±1.48 7.10±1.50 0 064 Performance 7.71±1.50 7.25±1.54 0.414 Side effect 3.16±1.33 3.59±1.34 0.058
Table 4 Compare means of 10 aspects of Singapore and Thai liniment in group B by Paired t-test B
liniment
Figure 3 Dosage form of choices scores confirmed that sport-man liked spray > cream > gel > patch > balm > liniment > tablet
6.References
De Belilovsky, C., Boyer, G., Bellemere, G., & Baudouin, C. (2020). 13189 Evaluation of tolerability and cleansing properties of liniment in comparison to water in the diaper area skin care in a pediatric population. Journal of the American Academy of Dermatology, 83, AB116. doi:10.1016/j.jaad.2020.06.553
Dowing, J.G. (1946). A Modified calamine liniment Archives of Dermatology and Syphilology, 54(1), 67-67. doi:10.1001/archderm.1946.01510360071014
Steven, J. (1986). Applied Multivariate Statistics for the Social Sciences.
Stevenson, J. (2020). Quasi-Experimental Designs. doi:10.4135/9781526421036914289
Cohen, J. (1988). Statistical Power Analysis for the Behavioral Sciences second edition, Lawrence Erlbaum Associates, Publishers
Maximize Market Research. (Oct 2020). Global Sports Liniment Market: Industry Analysis and Forecast (2020-2027). Retrieved from https://www.maximizemarketresearch.com/marketreport/global-sports-liniment-market/73797/
Page 14
Muongmee, et al OP4
Bioactive content, anti-tyrosinase, and antioxidant activities of ethanolicGiant Granadilla (Passiflora quadrangularis L.) fruit extracts for cosmetic applications
1Department of Pharmaceutical Science, Faculty of Pharmacy, Chiang Mai University, Chiang Mai, 50200, THAILAND
2TNK Beauty Ltd, 15/4 Soi Phra Mae Maha Karun 25, Ban Mai, Pak Kred District, Nonthaburi, 11120, THAILAND
*E-mail address of the corresponding author: nareekan_ya@cmu.ac.th
Abstract
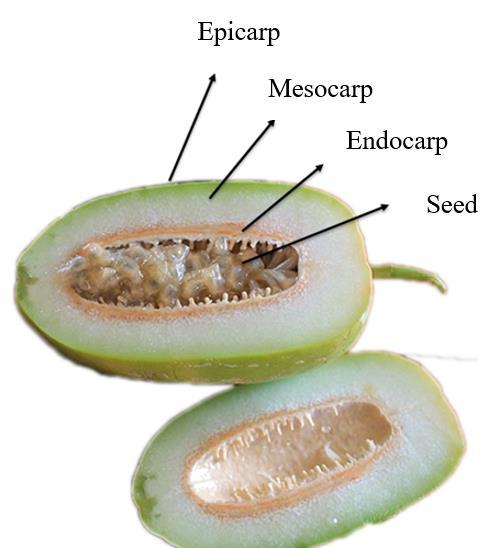
The Passifloraceae family has received attention in recent years due to its unique and excellent fruit flavor, and health benefits. Giant Granadilla (Passiflora quadrangularis L.) is the largest fruit in its genus (1-3 kg), therefore has gained attention from local growers. The objectives of this research were to study the bioactives, antioxidant activity and anti-tyrosinase activity of P. quadrangularis extracts by comparing different parts of the fruit (epicarp, mesocarp, endocarp, and seed) and develop skincare product containing P. quadrangularis extract. The experiment was performed by analyzing the total phenolic content, total flavonoid content, anti-tyrosinase, and antioxidantactivitieswith DPPHandABTS methods oftheethanolicextracts. Theresults revealed that the epicarp extract contained the highest amount of total phenolic content (32.57±0.02 mg GAE/g extract), whereas the seed extract contained the highest amount of total flavonoid content (113.29±0.07 mg QE/g extract). The study of antioxidant activity revealed that the seed extract had the lowest IC50 value for both DPPH and ABTS assays. While the study of anti-tyrosinase activity revealed that the epicarp and endocarp extract had the highest % inhibition value by using L-tyrosine (83.70±0.83%) and L-DOPA (88.43±0.50%) as substrates, followed by the seed and mesocarp, respectively. The skincare product containing P. quadrangularis fruit extract from the epicarp and endocarp part was formulated. The formulation exhibited acceptable physical characteristics and good stability under accelerated conditions. The cream texture was yellowish color with a pH of 5.6. Subsequently, the safety was evaluated on 20 healthy volunteers, the result showed non-irritating and good cutaneous compatibility. A satisfactory survey was implemented using a questionnaire, and volunteer satisfaction scores were high for the product’s texture and moisturizing efficacy. This paper presents the fruit value and profitability in agribusiness for phytocosmetic as a multifunction ingredient.
Keywords: Antioxidant; Anti-tyrosinase; Giant Granadilla; Passiflora quadrangularis L; Skincare
Abstract of Cosmetic & Beauty International Conference 2022 Future of the Next Beauty (CBIC 2022) 7th-9th December 2022
Page 15
OP6
Nareekan Yanasan1; Surapol Natakankitkul1*; Kanokwan Kiattisin1; Natthanan Phupaisan1; Supaporn Inkongngam1; Worrapon Wangkananon2
1. Introduction
Giant granadilla fruit (Passiflora quadrangularis L.) belongs to the family Passifloraceae. The Passiflora fruit has received attention worldwide due to its fresh, unique aroma and flavor which are the resultsof naturalcombinationsof volatileconstituentsin a well-balancedsystem includingminerals,sugar, organic acids, and phenolic compounds. The giant granadilla plant is native to South America. It grows well in hot and humid climates. The optimum temperature is 18–30 °C. Fruits can be harvested from July to October (Morton, 1987). Approximately 100 g of the giant granadilla fruit contains 70.8 mg of vitamin C, 0.8 mg of iron, 17.1 mg of phosphorus, 0.378 mg of vitamin B3 and 13.8 mg of calcium, respectively (Health Benefits Times, 2020) Ramaiya et al, (2021) studied the antioxidant activities and secondary metabolites of the P. quadrangularis fruit. Findings revealed that the mesocarp and endocarp parts of the fruit have phenolic and flavonoid compounds that are associated with antioxidant activity including eriocitrin and isopropyl methoxycinnamic acid According to the study by Guevara et al, (2019), giant granadilla was extracted with hydroalcoholic substances. The total phenol content, total flavonoid content, and vitamin C content were determined and found of 3 24±0.36 mg GAE/g FW, 1.79±0.24 mg Cateq/g FW,and 2 77±0.22mgVitC/gFW, respectively.Total antioxidantactivitywas thenanalyzedby theFRAP and DPPH methods, found of 387.89±33.11 and 90.68±8.05 µmol TEq/g FW, respectively. Matsui et al, (2010)investigatedthe activityof piceatannol,whichis thephenoliccompoundin the P edulis seed extract that has antioxidant activity by scavenging reactive oxygen species (ROS) free radicals in the body, resulting in the inhibition of melanin production and reducing the number of matrix metalloproteinases-1 (MMP-1),whichis anenzymeresponsibleforbreakingdown collagen.Theincreaseof collagenand elastin causes an increase in moisture content within the skin. Piceatannol also has an inhibitory effect on the tyrosinaseenzyme,whichisthemainenzymein melanogenesis,causingmelanininhibitionandbrightening the skin. Ingale and Hivrale, (2010) reported the pharmacological activity of different parts of passion fruit such as leaves, flowers, stems, and fruits due to the presence of important substances in the group of glycosides, alkaloids, phenols, and glycosyl flavonoids. Therefore, the giant granadillafruit which belongs to the same family together with passion fruit has the potential to be an active ingredient in the cosmetic industry that will increase the value and the profitability of agribusiness.
From the researcher's study reports above, extracts from various parts of the fruit are exhaustively conducted for accessibility achievement towards low-cost antioxidants containing such as polyphenol, flavonoids,vitamins,andmineralsimprovinghealthqualityaccordingly.Recoveryofbioactivecompounds from agri-food industry waste for pharmaceutical, food industry, and cosmetics is currently of interest. As in the parts of the passion fruit that can help add moisture to the skin. stimulate collagen production and inhibit melanin formation. However, due to a lack of data on research studies on giant granadilla extract and its use in cosmetic products. Therefore, the aims of this research were to study the bioactives, antioxidantactivity,andanti-tyrosinaseactivityof P. quadrangularis extractsanddevelopskincareproduct containing P. quadrangularis extract.
2.Materials and Methods
2.1 Preparation of P. quadrangularis fruit extract
The giant granadillafruit (Passiflora quadrangularis L.) was cultivatedby the Chiang Rai Community EnterpriseFarmers Group in Chiang Rai, the northern province of Thailand, and received in October 2022. Allpartsoffreshfruitswereseparated.Variouspartssuchaspeel(epicarporexocarp),mesocarp,endocarp, and seed were washed and dried in a hot air oven at 45°C for 3-4 days until dry, then each part was crushed to reduce the size and stored in a sealed container. The dried plant parts were then weighed in the amount of 100-150 g and extracted by maceration method using 95%v/v ethanol as the solvent at a 1:2 ratio for 72 h at room temperature. After that, each part of the extract was filtered and evaporated the ethanol using a rotaryvacuum evaporator,where differentparts of the extract can be calculatedfor the percentageyield (% yield).
Yanasan et al. OP6 Page 16
2.2 Determination of total phenolic content
The P. quadrangularis extracts were determined for the total phenolic content by using the FolinCiocalteu’s reagent following the protocol of Pourmorad et al, (2006) with some modifications. The gallic acid standard solution was prepared with a serial dilution range of 10-60 mg/ml and the sample solution at a concentration of 1 mg/ml in absolute ethanol. Then pipet 1 ml of sample solution into a test tube and add 4 ml of 7.5%w/v sodium bicarbonateand 2 ml of Folin-Ciocalteu’s reagent,mix well and stand for 30 min. Theabsorbancewasmeasuredatawavelengthof765nmbyUV-VisSpectrophotometer.Thetotalphenolic content in each extract was compared with the standard gallic acid and expressed as milligram gallic acid equivalents per gram extract (mg GAE/g extract).
2.3 Determination of total flavonoid content
The extracts were determined for total flavonoid content using the method of Pourmorad et al, (2006) with some modifications. The quercetin standard solution was prepared with a serial dilution range of 100 - 500 mg/ml as well as a sample dilution of 1-10 mg/ml in absolute ethanol. Then pipet 1 ml of sample solution into a test tube, add 4 ml of distilled water and 0.3 ml of 5%w/v NaNO3, then stand for 5 min. After that, add 0.3 ml of 10%w/v AlCl3 and stand for 1 min. Next, add 2 ml of 1 M NaOH and 10 ml of distilled water. The absorbance was measured at a wavelength of 510nm by UV-Vis Spectrophotometer. Total flavonoid content was calculated compared with the standard quercetin and expressed as milligram equivalents of quercetin per gram extract (mg eq QE/g extract).
2.4 Assessment of antioxidant activities
2.4.1 2,2-diphenyl-1-picrylhydrazyl radical (DPPH) radical scavenging assay
The scavenging activity of the extracts on DPPH radical was determined using the method of Pourmorad et al, (2006) with some modifications. The DPPH solution was prepared to contain 0.0066 g in 100 ml of absolute ethanol and sample at a concentration of 0.039 - 10 mg/ml in absolute ethanol. The 20 µl of each sample in a 96-well plate was allowed to react with 180 µl of DPPH at room temperature for 30 min in the dark. The absorbance was measured at a wavelength of 520 nm with a microplate reader and the IC50 was calculated compared with the Trolox standard
2.4.2 2,2’-azino-bis(3-ethylbenzothaiazoline)-6-sulfonic
acid (ABTS) assay
The ABTS scavengingactivityof the extracts was determinedby using the method of Pourmorad et al, (2006) with some modifications. The stock 7 mM ABTS solution and 140 mM potassium persulfate solution were prepared in deionized water (DI water). Then mix these two prepared solutions together and store in a light protection container for 16 h. Before use, the solution was diluted with approximately 80120 ml of absolute ethanol to obtain an absorbance in the range of 0.5-0.8. In the assay, prepare the sample solution at a concentration of 0.1953 - 10 mg/ml in absolute ethanol, then pipette 2 µl of sample solution into a 96-well plate and add 200 µl of ABTS solution The absorbance at 734 nm was determined after 6 min of mixing. The IC50 was calculated compared with the Trolox standard.
2.5 Assessment of anti-tyrosinase activity
The tyrosinase enzyme inhibition of the extracts was determined using the method of Yoshimura et al, (2005)withsomemodifications.Thesamplesolutionwaspreparedat aconcentrationof5mg/mlin20%v/v DMSO. Then, 70 µl of the sample solution is mixed with 70 µl of 20 mM sodium phosphate buffer (pH 6.8) solutionand 70 µl of 500 U/mL of mushroom tyrosinase ina 96-well plate. The mixturewas incubated at room temperaturefor 10 min. After that, add 70 µl of 0.85 mM L-tyrosine or L-dopa to each well. Shake well and incubate at room temperature for 20 min. The absorbance was measured at a wavelength of 492 nm with a microplate reader and using kojic acid as a standard.
Yanasan et al. OP6 Page 17
2.6 Preparation of skincare product containing P. quadrangularis extract
The extract from the part of P. quadrangularis fruit which has high bioactive content and excellent activities was selected to prepare the formulation The skincare product was performed by preparing an oil phase and an aqueous phase. Each phase was heated over a water bath to about 70°C, then the aqueous phase is slowly added to the oil phase while stirring continuously by using a homogenizer until homogeneous. The formulation was left cool at room temperature. The extract was mixed with the cream base in the form of an emulsion at a concentration of 1%. The cream base contains purified water, jojoba oil, 1,3-butylene glycol, glycerine, isononyl isononanoate, glycereth-26, carbopol 940, phenoxyethanol, triethanolamine, allantoin, and liquid polymer.
2.7 Stability study
The formulation was tested under accelerated conditions by heating-cooling cycling. The formulation was stored in an incubator at 45°C for 48 h, and then refrigerated at 4°C for 48 h, repeated for 6 cycles. To determine the stability under actual storage conditions, the product was stored at room temperature (30 °C/75% RH) for 1 month. The physicochemical properties including appearance, viscosity, and pH value were recorded
2.8 Clinical study of safety and satisfaction assessment of the skincare product
2.8.1 Clinical evaluation of volunteers
ThestudyprotocolwasapprovedbytheHumanResearchEthicsCommitteeoftheFacultyofPharmacy Chiang Mai University (No. 44/2563) and in accordance with international standards (Cosmetics Europe, 2004) The evaluation was performed on 20 volunteers aged 25-55 years All participants did not have a history of skin allergy, were not under any treatment or receiving any medical drugs, not during pregnancy or breastfeeding, and had no history of allergy to any ingredients in the formulation. Before being enrolled inthestudy,eachvolunteerreceivedtheinformationprotocolthat containedinformationabout theproducts and study methods and signed an informed consent form.
2.8.2 Safety evaluation
To confirm the safety of the products, a patch test protocol was used for the evaluation. After cleaning theexperimentalareawith deionizedwater,the Finnchamber®occlusivepatchcontainingthetest product, 2%v/v extract,and 2%w/v sodium lauryl sulfate (SLS) was appliedto the forearm of the participants.After 4 h of application, the Finn chamber® was removed. The erythema and edema parameters were observed and recorded the relevantscores. The evaluation was obtained immediatelyafter removingthe patch and at 24 h, 48 h, and 72 h after removing the patch, then calculated the primary dermal irritation index (PII)
2.8.3 Satisfaction Assessment
Aftercompletingtheskinirritationstudyand excludingtheparticipantsthatdidnot compiletheresults, a satisfaction assessment by questionnairewas conducted to survey the satisfaction of the participantswith the skincareproduct.The questionnaire for satisfactionassessmentof the test product was developedbased on product appearance, performance, and how the participants felt about the product after applying the product on the forearm once daily for 28 days. Satisfaction scores were divided into five levels and expressed as a percentage.
2.9 Statistical Analysis
Data were presented as the mean ± standard deviation (SD) and a one-way ANOVA test was used to evaluate the difference between groups using the program SPSS version 16.0. The level of statistical significance was p < 0.05.
Yanasan et al. OP6 Page 18
3.Results and Discussion
The current passion fruit market has a tendency towards healthy and functional products at affordable prices (Das et al., 2013). The demand has increased not only because of its sweet and characteristic flavor but also due to its essential nutrient composition and antioxidant properties (Phamiwon et al., 2016; Ramaiya et al., 2019). Recently, P. quadrangularis L., known as the giant granadilla, has gained attention from local growers due to its relatively large fruit size (~1-3 kg), aromatic flavor, and health benefits. Passiflora species are rich in phytochemicals such as flavonoids, tannins, phenols, glycosides, fatty acids, and alkaloids (Ingale & Hivrale, 2010).
3.1 The Passiflora quadrangularis L. fruit extracts
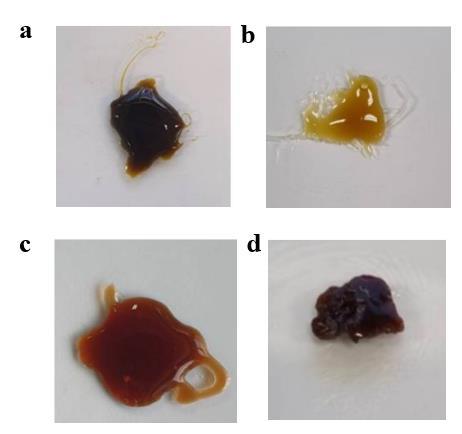
The P. quadrangularis fruit and different parts of the ethanolicextracts are shown in Figure 1. Where the epicarp was a brown viscous extract, the mesocarp was a dark yellowish viscous extract, the endocarp was an orange-brown viscous extract, and the seed was a dark brown viscous extract. The different parts of the extract can be calculated for the percentage yield (% yield) and reported in Table 1. It was found that the endocarp extract has the highest percentage yield (25.22%), followed by the mesocarp (23.62%), epicarp (8.67%), and seed extract (6.00%), respectively.
3.2 Bioactive content and biological activities of P. quadrangularis fruit extracts
The determination of total phenolic and total flavonoid contents is associated with the antioxidant activity of naturally derived compounds (Craft et al, 2012) Total phenolic content and total flavonoid contents were determined and characterized for quality control and standard aspect. The total phenolic content of the different partsof the ethanolicextractswas calculatedfrom the gallicacid standardcurve (R2 = 0.9976), and the total flavonoid content (R2 = 0.9908) as shown in Table 1. The results showed that the epicarp extract has the highest total phenolic content (32.57±0.02 mg GAE/g extract), followed by the seed, endocarp, and mesocarp extract,respectively. Whereas, the total flavonoid content of the seed extract was highest far apart comparedwith other parts(113.29± 0.07mg QE/g extract),followedby the endocarp, epicarp, and mesocarp extract, respectively. There were significant differences between each part of the fruit extracts.
Free radical scavenging activities in plant extracts are widely evaluated by ABTS and DPPH assays due to their similar mechanism on a single electron transferring efficiency. These assays were therefore conducted in parallel to confirm the activity (Lourith and Kanlayavattanakul, 2013). From the study of the antioxidant activity of various extracts of the P. quadrangularis fruit by DPPH and ABTS methods, the results were reported as IC50, which means the test substance concentration that can inhibit free radicals by 50%. The low value of IC50 showed a high antioxidant capacity. It was found that seed extract had the best inhibitory effect on DPPH (3.65± 0.02 mg/ml), followed by epicarp, endocarp, and mesocarp extracts,
Yanasan et al. OP6 Page 19
Figure 1 Giant granadilla (Passiflora quadrangularis L.) and different parts of the ethanolic extracts:
(a)Epicarp, (b) Mesocarp, (c) Endocarp, (d) Seed
Values are given as mean ± S.D. from triplicate. Different letters in the same column indicate significant differences (p<0.05). respectively. As a result of the ABTS assay, the seed extract also had the best inhibitory effect (6.61±0.38 mg/ml),followed by mesocarp, epicarp, and endocarp extracts, respectively. This may be due to the higher content of free radical inhibitors such as phenolic and flavonoid compounds in the seed extract than the other parts. However, the antioxidant potency was less than Trolox, which was used as a positive control (Table 2)
The tyrosinase enzyme is a key enzyme for melanin synthesis that catalyzes the oxidation of the Ltyrosine to L-DOPA with subsequent transformation to melanin pigment. The tyrosinase inhibitory effect was evaluated for the application for prevention of darkening of human skin. The results showed that the epicarp extract exhibited the most tyrosinase inhibitory effect by using L-tyrosine as a substrate (83.70±0.83%), followed by the seed, endocarp, and mesocarp extract, respectively. While the results of the analysis of tyrosinase inhibition by using L-DOPA as a substrate found that the endocarp extract had the highest %inhibition values (88.43±0.50%), followed by the epicarp, seed, and mesocarp extract, respectively. It has been shown that the mechanism of tyrosinase inhibition has several sites. However, the activity of the extracts was less than kojic acid, which was used as a positive control as shown in Table 2
Values are given as mean ± S.D. from triplicate. Different letters in the same column indicate significant differences (p<0.05).
3.3 Formulation development of skincare product containing P. quadrangularis extract
The skincare product containing P. quadrangularis extract was formulated by using both epicarp and endocarp extracts because of the highest yield and bioactive content with excellent anti-tyrosinaseactivity. The product has a yellowish color with a pH value of 5.6. The stability test was tested under accelerated conditions by using Heating-Cooling cycling and at room temperature (30 °C/75% RH) The HeatingCoolingof a totalof 6 cycleswas performedas shownin Table 3 The productwas stablewithoutcreaming or sedimentation. The color was slightly darkened after storage under accelerated storage, as shown in Page 20
Yanasan et al. OP6
Sample %Yield Total Phenolic content (mg GAE/g extract) Total flavonoid content (mg QE/g extract) Endocarp 25.22 27.47±0.00c 19.44±0.01b Epicarp 8.67 32.57±0.02a 14.70±0.01c Mesocarp 23.62 4.54±0.00d 5.521±0.03d Seed 6.00 28.28±0.01b 113.29±0.07a
Table 1 Extraction yield and bioactive content of ethanolic P. quadrangularis L. fruit extracts.
Sample DPPH ABTS %Tyrosinase inhibition (Conc. 5 mg/ml) (IC50±SD, mg/ml) L-tyrosine L-DOPA Endocarp 8.60±0.19b 27.06±1.05a 29.22±1.07d 88.43±0.50b Epicarp 4.22±0.60c 17.67±0.01b 83.70±0.83b 77.05±0.13c Mesocarp 12.35±0.17a 15.60±0.43c 18.65±0.33e 27.66±0.47e Seed 3.65±0.02d 6.61±0.38d 52.36±0.75c 42.32±0.17d Trolox 0.08±0.00e 0.65±0.04e -Kojic acid - - 100±0.00a 96.66±0.13a
Table 2 Antioxidant and anti-tyrosinase activities of ethanolic P. quadrangularis L. fruit extracts.
Values are given as mean ± S.D. from triplicate.
3.4 Clinical study of safety and satisfaction assessment of the P. quadrangularis extract cream
An irritation test on healthy volunteers was performed to guide the safety of the product application. From the patch test results, it was found that the PII index of the extract and skincare product was 0.23 and 0.15, which indicated no irritation in the volunteers compared to 2%w/w SLS (0.50), which was classified as being slightly irritated
The satisfaction of the volunteers was evaluated after 28 days of using the skincare product as shown in Figure 3. The topics to evaluate satisfaction include the product appearance and perception of the skin condition of the volunteers. The satisfaction assessment was divided into five levels. Level 1 was very dissatisfied, and level 5 was very satisfied. The results of the overall satisfaction were that 45% of the subjects were very satisfied and satisfied with the product, indicating the cream is pleasant to use and acceptable to consumers. For the appearance of the product, 80% reported that they were satisfied or very satisfiedwith the cream texture.In the perceptionof the skin condition,most of the volunteersreportedthat theyweresatisfiedorverysatisfiedwiththedoesnot stickiness,givesskinhydration,givessoft andsmooth skin, and does not skin irritation.
4.Conclusion
P.quadrangularis extract contains bioactive compounds including phenolics and flavonoids. The epicarp extract had the most total phenolic content significantly higher than the other parts, whereas the seed extract had the highest total flavonoid content far apart from the other parts. For the analysis of the activities, the most potent antioxidant was the seed extract significantly better than the other parts for both DPPH and ABTS assays Additionally, the epicarp extract exhibited the most tyrosinase inhibitory effect by using L-tyrosine as a substrate, while the endocarp extract had the most tyrosinase inhibitory effect by using L-dopa as a substrate The skincare product containing epicarp and endocarp extracts of the P. quadrangularis fruit wassuccessfullydevelopedandexhibitedacceptablephysicalcharacteristicsandgood stability under accelerated conditions. The product did not cause irritation in the volunteers and indicated
Yanasan et al. OP6 Page 21
Figure 2 While the pH and viscosity were slightly changed, but there were no statistically significant differences (p > 0.05).
Storage condition pH Viscosity (Pa.s) Day 0 5.60±0.00 0.425±0.01 Heating-Cooling cycle (6 cycles) 5.58±0.01 0.410±0.06 30 °C/75% RH (1 month) 5.60±0.00 0.415±0.07
Table 3 The stability study of the skincare product containing P. quadrangularis extract
Figure 2 The stability of the skincare product under different storage conditions: (Left) Day 0, (Center) Heating-Cooling cycle, (Right) Room temperature
Figure 3
Percentage of satisfaction with appearance and the perception of the skin condition of the volunteers after using skincare product containing P. quadrangularis extract the product was safe. The satisfaction assessment of the volunteers on the overall product was that 45% of the subjectswere very satisfiedand satisfiedwith the product,which was in the moderatesatisfactionrange but was in the high range for the product’s texture and moisturizing efficacy. In conclusion, P. quadrangularis fruit is valuable and profitable in agribusiness for phytocosmetic as a multifunction ingredient.
5.Acknowledgements
This research was financially supported by the Industrial Research and Technology Capacity Development Program (IRTC No.195/2021) Northern Science Park (CMU STEP).
6.References
ASEAN. Guidelines for safety evaluation of cosmetic products. 1-16. Cosmetics Europe. (2004). Guideline for the safety assessment of a cosmetic product. Colipa/CTFA. 1-23.
Craft, B. D., Kerrihard, A. L., Amarowicz, R., & Pegg, R. B. (2012). Phenol-Based Antioxidants and the In Vitro Methods Used for Their Assessment. Comprehensive Reviews in Food Science and Food Safety, 11(2), 148–173.
https://doi.org/10.1111/j.1541-4337.2011.00173.x
Das, M. R., Hossain, T., Baset Mis, M. A., Ahmed, J. U., Sirajul Karim, A. J. M., & Hossain, M. M. (2013). Fruit setting behaviour of passion fruit. American Journal of Plant Science, 4(5), 1066-1073.
https://doi.org/10.4236/ajps.2013.45132
Guevara, M., Tejera, E., Granda-Albuja, M. G., Iturralde, G., Chisaguano-Tonato, M., Granda-Albuja, S., ... Alvarez-Suarez, J. M. (2019). Chemical composition and antioxidant activity of the main fruits consumed in the western coastal region of Ecuador as a source of health-promoting compounds. Antioxidants, 8(9), 387. https://doi:10.3390/antiox8090387
Health Benefits Times. (2020, Apr 3). Giant granadilla Passiflora quadrangularis
Yanasan et al. OP6 Page 22
0 20 40 60 80 100 Product texture Product color Product odor Does not stickiness Gives skin hydration Gives skin tightness Gives soft and smooth skin Gives skin whitening Gives an even skin tone Does not skin irritation Overall satisfaction Very dissatisfied Dissatisfied Moderate Satisfied Very satisfied
https://www.healthbenefitstimes.com/giant-granadilla/
Ingale, A. G. & Hivrale, A. U. (2010). Pharmacological studies of Passiflora sp. and their bioactive compounds. African Journal of Plant Science, 4(10), 417-426.
https://doi.org/10.5897/AJPS.9000185
Lourith, N. & Kanlayavattanakul, M. (2013). Antioxidant activities and phenolics of Passiflora edulis seed recovered from juice production residue. Journal of Oleo Science, 62(4), 235-240.
https://doi.org/10.5650/jos.62.235
Matsui, Y., Sugiyama, K., Kamei, M., Takahashi, T., Suzuki, T., Katagata, Y., & Ito, T. (2010). Extract of passion fruit (Passiflora edulis) seed containing high amounts of piceatannol inhibits melanogenesisandpromotescollagensynthesis.Journal ofagricultural andfoodchemistry,58(20), 11112-11118. https://doi.org/10.1021/jf102650d
Morton, J.F. (1987). Giant Granadilla. Fruits of warm climates.
Phamiwon, Z. A. S., & John, S. (2015). Diabetesand medicinal benefits of Passiflora edulis.World Journal of Pharmaceutical Research, 5(3), 453-659.
Pourmorad, F., Hosseinimehr, S. J., & Shahabimajd, N. (2006). Antioxidant activity, phenol and flavonoid contents of some selected Iranian medicinal plants. African journal of biotechnology, 5(11), 11421145.
Ramaiya, S. D., Bujang, J. B., Zakaria, M. H., & Saupi, N. (2019). Nutritional, mineral and organic acid composition of passion fruit (Passiflora species). Food Research, 3(3), 231-240.
https://doi.org/10.26656/fr.2017.3(3).233
Ramaiya, S. D., Lee, H. H., Xiao, Y. J., Shahbani, N. S., Zakaria, M. H., & Bujang, J. S. (2021). Organic cultivation practices enhanced antioxidant activities and secondary metabolites in giant granadilla (Passiflora quadrangularis L.). PloS one, 16(7), e0255059.
https://doi.org/10.1371/journal.pone.0255059
Yoshimura, M., Watanabe, Y., Kasai, K., Yamakoshi, J., & Koga, T. (2005). Inhibitory effect of an ellagic acid-rich pomegranate extract on tyrosinase activity and ultraviolet-induced pigmentation. Bioscience, biotechnology, and biochemistry, 69(12), 2368-2373.
https://doi.org/10.1271/bbb.69.2368
Yanasan et al. OP6 Page 23
Production and antioxidant activity of pectin-oligosaccharides from early immature durian fruit
Aunchiya
Pitaksa1 and Supaart Sirikantaramas1*
1Center of Excellence in Molecular Crop, Department of Biochemistry, Faculty of Science, Chulalongkorn University, Bangkok, Thailand
*e-mail: Supaart.s@chula.ac.th
Abstract
Early immature durian (Durio zibethinus L.) fruit (30-45 days after anthesis with 6-12 cm in length) is considered as an agricultural waste from cultivation. It has been known that durian rinds of mature fruit contain pectin. However, the early immature durian (EID) fruit has not been reported if it contains pectin. Therefore, the aim of this study was to confirm pectin content in the EID fruit. We performed an extraction from EID fruit using distilled water at different temperatures (25, 50,and 75 oC)for 1 h to investigate the pectin content. Instrumental analyses including X-ray diffraction (XRD) and Fourier-transform infrared spectroscopy (FTIR) suggest that EID extract contains pectin. To increased biological activities, we utilized Viscozyme®, a mixture of carbohydrases, to degrade pectin into pectin-oligosaccharides (POS). Antioxidant activity was subsequently measured in terms of free radical scavenging capacity using the 1,1-diphenyl-2-picrylhydrazy (DPPH) and 2,2′-azino-bis (3ethylbenzothiazoline-6-sulphonic acid) (ABTS) assays. The results revealed that the Viscozyme® -treated extract can degrade pectin to pectin oligosaccharides (POS) with improved antioxidant property. Therefore, we have successfully developed the extraction method and hydrolysis process to improve the biological activity of the extract that can be further exploited.
Keywords: Early immature durian; Enzyme hydrolysis; Pectin oligosaccharides; Antioxidant activity
1. Introduction
In Thailand, durian (Durio zibethinus. L) as the king of fruits, is widely consumed. Many of the early immature durian fruit (EID) (30-45 days after anthesis with the length of 6 - 12 cm) were thinned to retain the fruit's qualities, including size and flavor Thus, the farmers prefer to cut the fruit at this stage Therefore, it is important to convert thisagricultural waste intoa value-addedproduct. It hasbeen known that whole durian fruit is inedible consisting of the outer prickly rind and inner perigones (nonedible perianth). The two parts contain pectin as a component (Begum et al., 2014). Pectin is a common component biomass byproduct (Shalini & Gupta, 2010). Pectin is a complex and colloidal heteropolysaccharide It is composed of structurally distinct regions or domains including homogalacturonan (HG), rhamnogalacturonan (RG-I), rhamnogalacturonan (RG-II) HG, accounting for approximately 65% of pectin, is a linear polymer of α-1,4 linked galacturonic acid that is partially methyl-esterified at C-6 and O-acetylated in positions 2 and 3. (Figure 1) (Mao et al., 2019)
Galacturonic acid and its oligomers are produced by the enzymatic degradation of pectin. Pectin oligosaccharide (POS) has various applications such a signal molecules in plant defenses and plant growthdevelopment POS is alsousedin thefoodindustry,medicine, pharmacy,and cosmeticindustry Moreover, POS, as a prebiotic, has been reported that it increased the populations of beneficial bacteria
CA1 Page 24
December
Proceeding of Cosmetic & Beauty International Conference 2022 Future of the Next Beauty (CBIC 2022) 7th-9th
2022
in the human digestive tract. Likewise, the composition and structural of POS varies upon the plant source and the production process (Olano-Martin et al., 2003)
The present study investigates the individual efficiency of commercial pectinase, Viscozyme L in catalyzing the liberation of pectic oligosaccharides (POS) from polygalacturonic acid. So, the aim of this study is the investigation of pectin content from EID using distilled water at different temperatures in order to enzymatically produce POS Using XRD and FT-IR, the result suggests that EID extract contains pectin. To improve pectin biological function, we used Viscozyme to degrade pectin into pectin-oligosaccharides (POS) (Abari et al.,2021).
2. Materials and Methods
The pruned-early immature durian fruits (∼30 g of each, with the length of fruit 6-12 cm, Mon Thong cultivar) used in this study were collected in March 2020, from Sangpong durian orchard in Chanthaburi province, eastern Thailand. Commercial enzyme (Viscozyme®) was used (Merck KGaA, Darmstadt, Germany).Thin-layer chromatography (TLC) was performed on Silica Gel 60 F254 (Merck). Galacturonic acid (GalA) was purchased from TCI (Chemical Express Co., Ltd) and Digalacturonic acid (Di-GalA) was purchased from Megazyme (Bray, Ireland). All other chemicals and reagents were of analytical grade.
2.1 Extraction of pectin from early immature durian fruits (EID)
We performed an extraction from EID fruit using distilled water at different temperatures (25, 50, and 75 oC) for 1 h to investigate the pectin content. Briefly dried EID (20 mg) was added to distilled water and the solution was then centrifuged at 1400 rpm in a rotary shaker (Innova 4000 Incubator Shaker, New Brunswick Scientific, USA). After the extraction, the extract was centrifuged (5810, Eppendorf, Germany) at 4000 rpm, at room temperature for 10 min to collect the supernatant. The solution was then treated with 95% (v/v) ethanol for pectin precipitation. Finally, precipitated pectin was filtered through Whatman No.1 Filter paper (Whatman, Germany), dried in a lyophilizer, and ground into powder. Yields were calculated according to the formula (Almagro, et al., 2019):
Yield (%) = weight of dried recovered pectin(g) weight of initial powder(g) x 100
2.3 Characterization of pectin from EID extract
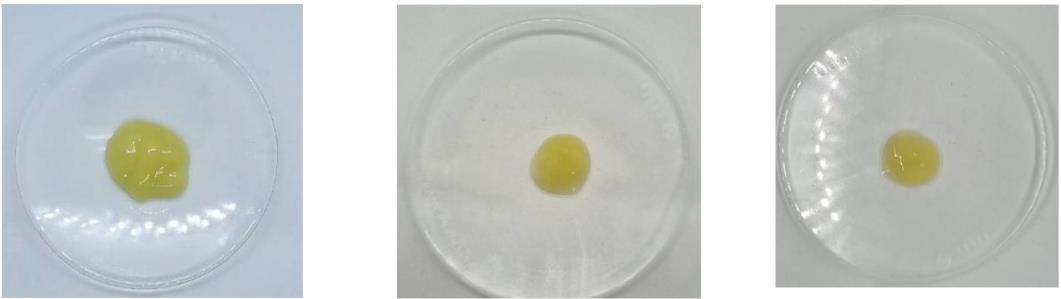
We successfully extracted pectin from early immature durian fruits to obtain EID powder with a fine powder, a brownish color, and odorless. XRD and FT-IR were used to characterize the EID powder.
2.3.1 The X-ray diffraction (XRD)
XRD patterns were acquired by an X-ray diffractometer (Bruker, Yokohama, Japan). Briefly, pectins were irradiated with filtered Cu–K (α) at a voltage of 40.0 kV and a current of 40.0 mA. The scanning level was 2° at a 2θ diffraction angle which ranged from 5° to 60° (Wathoni et al., 2019)
2.3.2 Fourier Transform Infrared Spectrometer (FT-IR)
PectinextractedfromearlyimmaturedurianfruitswascharacterizedbyFTIR.Thepowder wasscanned in the range of 400
4000 cm 1 modified from (Abang Zaidel et al., 2017)
2.4 Enzymatic pectic oligosaccharides (POS) production from the crude pectin extract from EID Hydrolysis of pectin obtained from early immature durian fruits (EID) with Viscozyme ®, a mixture of carbohydrates, to degrade pectin into pectin-oligosaccharides (POS). The hydrolysis was then conducted at 10% (v/v) of the diluted enzyme/pectin solution in sodium acetate buffer (0.1 M) pH 4.5. The hydrolysis was done for a period for 2 h at 45 ◦C and the enzymes were inactivated by thermal treatment at 95 ◦C for 5 min (Babbar et al., 2016) and further analyzed POS using TLC compared with standardgalacturonicacid.ThinLayerChromatography(TLC)wasperformedtwiceinn-butanol/acetic acid/water (2:1:2) as a mobile phase for visualization, the dried spots on silica gel were sprayed with orcinol/sulfuric acid reagent (8 mg orcinol in 10 mL of 70% sulfuric acid) (Hosseini-Abari et al., 2018).
Pitaksa et al CA1 Page 25
–
2.5 Antioxidant assay
2.5.1 DPPH assay
The antioxidative effects of obtained pectic oligosaccharides were assessed at various concentrations ranging from 1.25 to 80 mg/mL. A 0.5 mL of POS was added to 2 mL of 0.2 mM methanolic solution of 2,2-diphenyl-1-picrylhydrazyl (DPPH). A stock solution of DPPH was performed by dissolving 24 mg of DPPH (SigmaAldrich, Singapore) with 100 ml methanol and the workingsolution was prepared bymixing 10ml of thestock solution with 45ml methanol. The reaction tubes were placed for 30 min at 25 °C in darkness. Afterward, the absorbance of the samples was examined at 517 nm. All samples were analyzed in triplicate and inhibitory activity (%) was calculated using the following equation modified from (Abari et al., 2021).
DPPH radical scavenging activity (%) = (Asample – Ablank) x100
2.5.1 ABTS assay

To evaluate 2, 2′-azino-bis (3-ethylbenzothiazoline-6-sulfonic acid) (ABTS) radical scavenging activities of OP and POSs, the method of Xu, Shen, et al. (2018) was used with some modifications. Briefly, 7 mM of ABTS solution was allowed to react with 2.45 mM of potassium sulfate (1:1, v/v) in darkness for 12
16 h to generate ABTS radical cation. The solution was diluted with deionized water to obtain an absorbance of 0.700 ± 0.02 at 734 nm. After adding 0.8 mL ABTS solution to 0.2 mL sample (1
5 mg/mL), the mixture was incubated in darkness for 6 min. Absorbance of each sample was then read at 734 nm modified from (Jayesree et al., 2021). All samples were analyzed in triplicate and inhibitory activity (%) was calculated using the following equation
ABTS radical scavenging activity (%) = (Asample – Ablank) x100
3. Results and Discussion
3.1 Extraction of EID
The pectin extraction from EID are colorless, odorless and slightly viscous.When compared to the conventional extraction method of ponkan peel using water at 25oC for 2h, our pectin extraction method gives greater yield (12 and upward trend when the temperature increases (Figure 1). Consistent with the previous studies that investigated effects of extraction conditions of sweet potato, such as extraction temperatures and duration, the yield of pectin increases with increasing temperature (Hamidon et al., 2017). Our extraction method of EID also gives greater amount of pectin when compared to extracted from potato pulp (Yang, et al., 2018). These differences could be possibly due to the unique sources of pectin.
3.2 Characterization of pectin from EID extract
EID powder appeared as a fine powder, a brownish color and odorless. To characterization of pectin, XRD and FT IR were used.
Pitaksa et al CA1 Page 26
–
–
Figure 1. The EID yields at 25, 50 and 75oC, respectively. The bars indicate mean ± SD of three replicates.
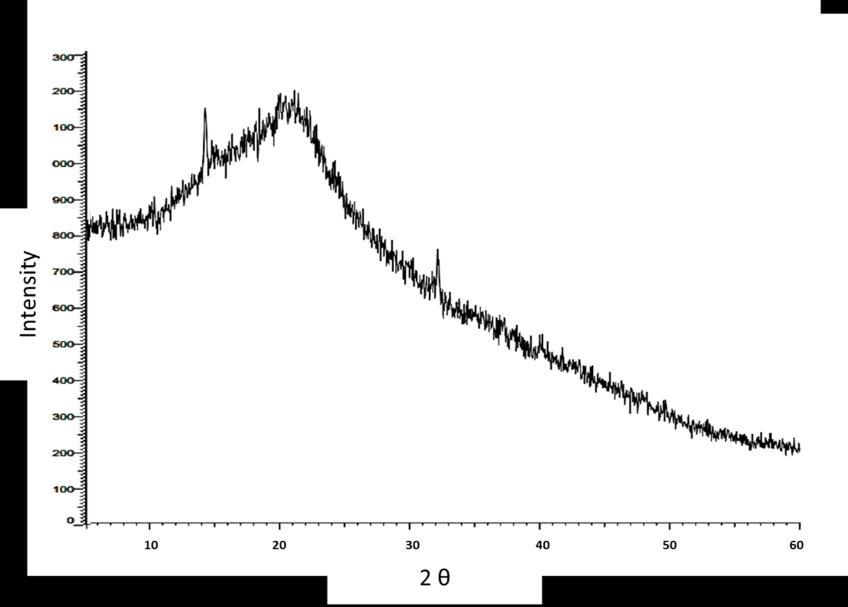
3.2.1 X-ray diffraction study
XRD analysis is performed to investigate the crystallinity of the pectin and shows that the X-ray diffraction patterns of standard and extracted pectin are amorphous, corresponding to the previous studies. The amorphous pattern of pectin depends on intermolecular electron binding in the compounds (Wathoni et al., 2019). The results show three intense peaks at 14.28°, 24.47°, and 40.21° 2θ, indicating that our product is close to pectin (Figure 2) (Mishra et al., 2008).
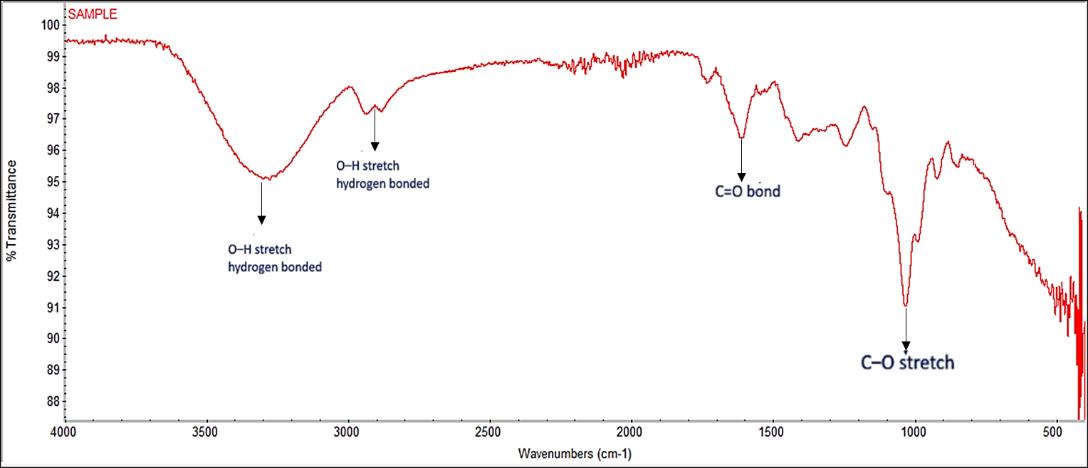
3.2.2 Fourier-transform infrared spectroscopy (FTIR) study
The peaks at 2947 cm 1 correspond to the C-H bond vibration. The peak at approximately 1700 cm 1 relates to theC=Obondvibrationandindicatestheacetyl (COCH3)groups in pectin. The characteristic peak at 1609 cm 1 is due to the –O– tensile vibration band. The peaks at 1409 cm 1 represent the C–O–H in the bending vibration. In addition, there is a very weak C–Otensilevibration at 1239cm 1.Thepeak at 1239 cm 1 is asymmetricC–O–C tensilevibration and indicates the abundance of –O–CH3 (methoxyl) groups (Figure 3). The intense peaks at 1031 cm 1 is the symmetric C–O–C tensile vibration (Figure 4.).We can concludethat the EID extract contains pectin as a constituent because the FT-IR spectra is similar to the previous studies, lemon peel pectin (Guolin et al., 2012).
Pitaksa et al CA1 Page 27
Figure 2. XRD of pectin extracted from early immature durian fruits
Figure 3. FT-IR spectrum of pectin from early immature durian fruits
3.3 Analysis of pectin oligosaccharide (POS) production
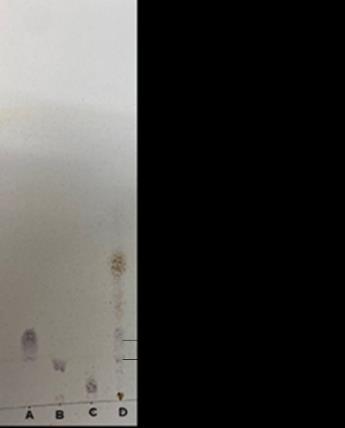
Thin-layer chromatography (TLC) was performed to verify the degradation of pectin. Frist spots indicate that mono, di, and tri galacturonic acid which are standards respectively. The results demonstrate Viscozyme® can successfully degrade pectin into POS. The EID extracts appeared as a dark spots mono, di and tri galacturonic acid (Figure 4).
3.4
Antioxidant activity of pectin and POS
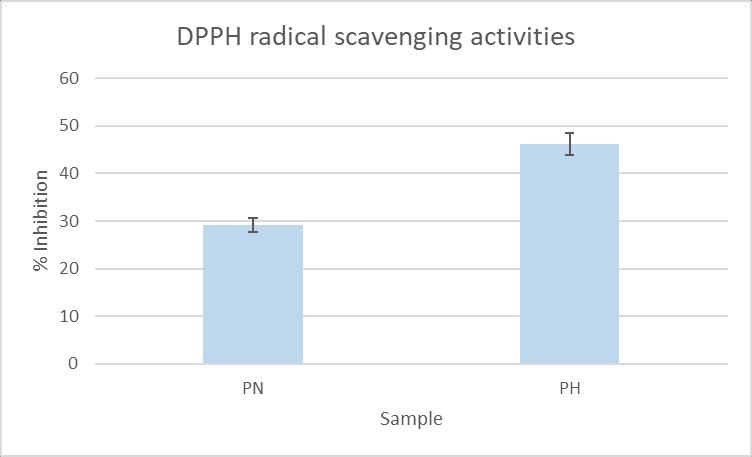
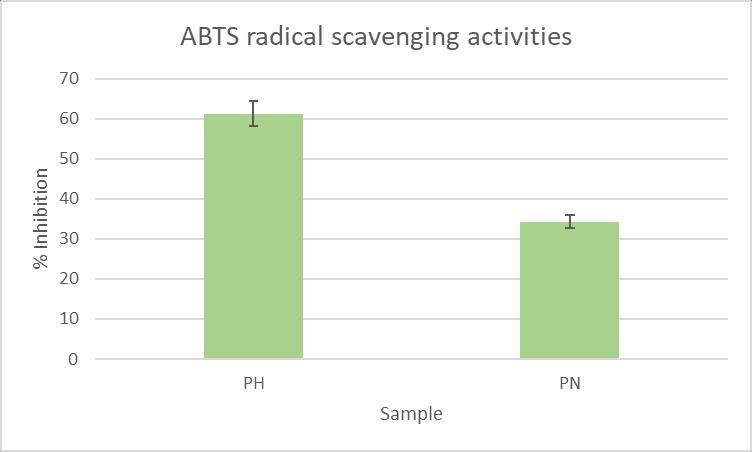
Antioxidant activity of POS and pectin at the same concentrations (20 mg/mL) were tested by DPPH and ABTS assay. The POS exhibited more than 50% DPPH radical scavenging activity compared to the non-hydrolyzed pectin (Figure 5). Antioxidant activity of pectin and POS have been reported in previous studies An antioxidant that is closely related to the presence revealed that electron-donating groups such as carboxyl, and hydroxyl can improve the antioxidant activity of phenolic compounds. The results also represented an increase in the antioxidant property of pectin after digestion by pectinase which had been confirmed in previous research (Yang et al., 2020). Although the radical scavenging activity of hydroxyl groups in polysaccharides was minor because of lacking phenolic structure, many other factors such as the presence of galacturonic acid The chemical components in polysaccharide play an important role in the antioxidant activities of POS.
4.Conclusion
Inthisstudy,weconcludethattheearlyimmaturedurianfruit(EID)containspectinasaconstituent fromtheinstrumentalanalysisofFourier-transforminfraredspectroscopy(FTIR)andX-raydiffraction.

Pitaksa et al CA1 Page 28
Figure 4. TLC profile of the obtained products. (A) Std. mono galacturonic acid, (B) Std. di galacturonic acid, (C) Std. tri galacturonic acid, (D) pectin oligosaccharide (POS) and (E) pectin nonhydrolyzed
A B
Figure 5. DPPH (A) and ABTS (B) radical scavenging activity of pectin and pectin oligo-saccharides (PN) nonhydrolyzed pectin and (PH) hydrolyzed pectin (mean ± SD of 3replicate)
Moreover, the pectin was extracted with water at different temperatures The EID extract is harmless and suitable to be used as an active ingredient for cosmetic industries. Therefore, we have successfully developed the pectin extraction and the hydrolysis process to improve the biological activity of the extract
5.Acknowledgements
I would like to express my sincere thanks to, Assoc. Prof. Jeerus Sucharitakul for advice. Furthermore, Iam most gratefulforthehelpofKaranWangpaiboon,Ph.D.,andCarbohydrateEngineeringandNovel Oligosaccharide Research Laboratory (CNR). Their suggestions on advanced instrument analysis were valuable. I greatly acknowledge Peradon Phonglamjiakngam. He is an amazing supporter that help me get through difficulties and obstacles in my life. I also thank all members of the Molecular Crop Research Unit for help and support. Finally, I would like to acknowledge Chulalongkorn university for scholarship granted to graduate students.
6.References
Babbar, N., Baldassarre, S., Maesen, M., Prandi, B., Dejonghe, W., Sforza, S., & Elst, K. (2016). Enzymatic Production of Pectic Oligosaccharides from Onion Skins. Carbohydrate Polymers, 146, 245-252.
Chen, J., Yang, J., Ma, L., Li, J., Shahzad, N., & Kim, C. K. (2020). Structure-antioxidant Activity Relationship of Methoxy, Phenolic Hydroxyl, and Carboxylic Acid Groups of Phenolic Acids. Scientific Reports, 10, 1-9.
Combo, A. M. M., Aguedo, M., Goffin, D., Wathelet, B., & Paquot, M. (2012). Enzymatic Production of Pectic Oligosaccharides from Polygalacturonic Acid with Commercial Pectinase Preparations. Food and Bioproducts Processing, 90, 588-596.
Guolin, H., Jeffrey, S., Kai, Z., & Xiaolan, H. (2012). Application of Ionic Liquids in the MicrowaveAssisted Extraction of Pectin from Lemon Peels. Journal of Analytical Methods in Chemistry, 2012
Hosseini‐Abari, A., Emtiazi, G., Jazini, M., Kim, J., & Kim, B. G. (2019). LC/MS Detection of Oligogalacturonic Acids Obtained from Tragacanth Degradation by Pectinase Producing Bacteria. Journal of Basic Microbiology, 59, 249-255.
Hosseini Abari, A., Amini Rourani, H., Ghasemi, S. M., Kim, H., & Kim, Y. G. (2021). Investigation of Antioxidant and Anticancer Activities of Unsaturated Oligo-galacturonic Acids Produced by Pectinase of Streptomyces hydrogenans YAM1. Scientific Reports, 11, 8491.
Kumar, A., & Chauhan, G. S. (2010). Extraction and Characterization of Pectin from Apple Pomace and Its Evaluation as Lipase (steapsin) Inhibitor. Carbohydrate Polymers, 82, 454-459.
Mao, G., Wu, D., Wei, C., Tao, W., Ye, X., Linhardt, R. J., & Chen, S. (2019). Reconsidering Conventional and Innovative Methods for Pectin Extraction from Fruit and Vegetable Waste: Targeting Rhamnogalacturonan I. Trends in Food Science & Technology, 94, 65-78.
Mishra,R. K., Datt,M.,Pal,K., & Banthia, A. K.(2008). Preparationand Characterization of Amidated Pectin Based Hydrogels for Drug Delivery System. Journal of Materials Science: Materials in Medicine, 19, 2275-2280.
Muñoz-Almagro, N., Valadez-Carmona, L., Mendiola, J. A., Ibáñez, E., & Villamiel, M. (2019). Structural Characterisation of Pectin Obtained from Cacao Pod Husk. Comparison of Conventional and Subcritical Water Extraction. Carbohydrate Polymers, 217, 69-78.
Nadar, C. G., Arora, A., & Shastri, Y. (2022). Sustainability Challenges and Opportunities in Pectin Extraction from Fruit Waste. ACS Engineering Au, 2, 61-74.
Pitaksa et al CA1 Page 29
Shalini, R., & Gupta, D. K. (2010). Utilization of Pomace from Apple Processing Industries: A Review. Journal of Food Science and Technology, 47, 365-371.
Wathoni, N., Shan, C. Y., Shan, W. Y., Rostinawati, T., Indradi, R. B., Pratiwi, R., & Muchtaridi, M. (2019). Characterization and Antioxidant Activity of Pectin from Indonesian Mangosteen (Garcinia mangostana L.) rind. Heliyon, 5, e02299.
Zaidel, D. N. A., Rashid, J. M., Hamidon, N. H., Salleh, L. M., & Kassim, A. M. (2017). Extraction and Characterisation of Pectin from Dragon Fruit (Hylocereus polyrhizus) Peels. Chemical Engineering Transactions, 56, 805-810.
Pitaksa et al CA1 Page 30
In vitro antioxidant activities and cytotoxicity of sunflower Helianthus annuus L. sprout extract against human skin cells
Nattaya Pattarapipatkul1, Varisa Pongrakhananon2, and Supaart Sirikantaramas1*
1Center of Excellence in Molecular Crop, Department of Biochemistry, Faculty of Science, Chulalongkorn University, Bangkok, 10330, Thailand
2Department of Pharmacology and Physiology, Faculty of Pharmaceutical Sciences, Chulalongkorn University, Bangkok, 10330, Thailand
*Corresponding author. E-mail: supaart.s@chula.ac.th
Abstract
Sunflower (Helianthus annuus L.) sprouts are enriched source of caffeoylquinic acids (CQAs), including chlorogenic acid (5-CQA) and 3,5-diCQA. These compounds possess a variety of pharmacological activities, including antioxidant, anti-neurodegenerative, and anti-glycative activities. However, the biological activities being studied on human skin cells have not been reported. Here, sunflower sprout extract (SSE) was prepared using ethanol-based extraction, followed by solvent evaporation. After that, the crude extract was freeze dried to determine the antioxidant activity using chemical-based assays, as well as its cytotoxicity on human skin cell culture. SSE displayed the potent antioxidant activity by inhibiting 1,1-diphenyl-2picrylhydrazyl (DPPH) and 2,2ʹ-azinothiobis (3-ethylbenzothiazoline-6-sulfonic acid) (ABTS) radicals with IC50 values of 0.332 ± 0.005 and 0.140 ± 0.002 mg/mL, respectively. To evaluate cytotoxicity of the extract, cell viability was performed by MTT assay. The results showed that SSE in all applied concentrations (0.1-1 mg/mL) had no cytotoxic effect on both immortalized human keratinocyte HaCaT and normal human BJ fibroblast cells. This study suggests that SSE exhibits a potent antioxidant with no skin toxicity, and may be considered as a pharmaceutical agent for health care products.
Keywords: Antioxidant; Caffeoylquinic acids; Fibroblast; Keratinocyte; Sunflower sprout
1. Introduction
Plants are good sources of natural products traditionally used for centuries for all personal care and cosmetic purposes (Fatima et al., 2013). Recently, bioactive extracts or phytochemicals from various plants are likely to be interesting and become more popular due to consumer concerns about synthetic ingredients or chemical substances. Therefore, it requires attention to investigate the biological properties of plant bioactive compounds (Aburjai and Natsheh, 2003).
Plant extracts are rich in phytochemicals, including phenolics, flavonoids, tannins, alkaloids, sterols, terpenoids, isoprenoids, and glycosides, with many health-promoting benefits including skin health maintenance (Mahesh, Fathima, and Veena, 2019). Among these compounds, phenolics are one of the most important groups, and caffeoylquinic acids (CQAs) comprise one of the most abundant polyphenols found in several plants, such as Coffea spp. (coffee; Lallemand et al., 2012), Cynara cardunculus L. var. scolymus (globe artichoke; Moglia et al., 2016), Helianthus annuus L. (sunflower; Sun et al.,2012), Camellia sinensis (tea) and Ilex paraguariensis (yerbamate; Ziemlewskaet al., 2021). Further studies have shown additional benefits of CQAs, such as the reduction of cellular oxidative damage, which involve in aging-related diseases (Liang et al., 2019), neuroprotective properties from hydrogen peroxide-induced cell death (Kim et al., 2005), and inhibition of viral replication and integration (McDougall et al., 1998). According to the antioxidant role of CQAs, they showed a
CA2 Page 31 Abstract of Cosmetic & Beauty International Conference 2022 Future of the Next Beauty (CBIC 2022) 7th-9th December 2022
protective effect against UVB-induced cellular oxidative stress in human HaCaT keratinocytes (Cha et al., 2014).
Sunflower (Helianthus annuus L.) sprout is abundant in phenolic compounds, trace elements, and vitamins, and thus exhibits various beneficial effects, including anti-inflammatory, antimicrobial, antioxidant, antihypertensive, and wound-healing properties (Guo et al., 2017). In a study by Cheevarungnapakul et al., (2019), Sunflower sprouts are a rich source of monoCQAs and diCQAs, particularly5-CQA and 3,5-diCQA. Moreover,the highest antiglycation and antioxidant activities were found in the sunflower sprout extract when compared to four edible sprouts due to their rich 5-CQA and 3,5-diCQA content (Sun et al., 2012). However, a literature survey has revealed no reports on the biological activities of sunflower sprout extract obtained using ethanol-based extraction on human skin cells. Therefore, our research aimed to give more new evidence that sunflower sprout is a popular crop as a functional food and a dietary and pharmaceutical application. In the present study, we evaluated the influence of ethanolic sunflower sprout extract (SSE) on antioxidant activity and cytotoxicity against human skin cell culture. The experiments were performed on two human skin cell lines: immortalized human keratinocyte HaCaT and normal human BJ fibroblast. These cell lines typically locate in human skin layers: epidermis and dermis, respectively.
2. Materials and Methods
2.1 Sunflower sprout extract (SSE) preparation
The fresh edible sunflower (Helianthus annuus L.) sprouts were purchased from a local retail vegetable market in Bangkok, Thailand. The fresh samples were freeze-dried. To make the powder, samples were finely pulverized using a milling machine. Four g of freeze-dried sunflower sprout powder was extracted with 200 mL of 80% ethanol. Extract was homogenized using shaker at 250 rpm for 1 h. Supernatants were filtered using Whatman nylon membrane filter paper to remove debris and then concentrated with an evaporator at 32-37 °C. Next, the concentrated solution of sunflower sprout was dried with a freeze-dryer. The resulting crude extracts were stored at −20 C until further use.
2.2 Determination of antioxidant activity
2.2.1 DPPH radical scavenging activity assay
Scavenging DPPH radical activity was determined by a previously described method (Herald, Gadgil and Tilley, 2012) with some modifications. First, the working DPPH solution was prepared by 10X dilution from 1.5 mM DPPH stock solution to 150 μM methanolic solution of DPPH radical. After adding 50 μl of samples to the radical solution, the mixture was then evenly combined and allowed to stand at room temperature in the dark for 30 min, then the absorbance was measured at a 517 nm. The control containing no extract was used as a base reference for the antioxidant activity. The capability of scavenging the DPPH radical was expressed as percentage inhibition using the following formula:
% Inhibition = [(Acontrol − Asample) / Acontrol] x 100
IC50 value was defined as concentration required for inhibiting 50% radical.
2.2.2 ABTS•+-scavenging activity assay
ABTS•+ radical scavenging activity was accomplished using the standard method (Kasote et al., 2019) with minor modifications. The ABTS reagent was prepared by mixing equal amounts of 7.4 mM ABTS and 2.6 mM ammonium persulfate solutions and allowed to react overnight in the dark. When used in ABTS•+ working solution, the reagent was diluted to 1:40 with distilled water to achieve an absorbance of 0.7 at 730 nm. In reactions, 250 μl of ABTS•+ working solution and 50 μl of sample solution in different concentrations were mixed and incubated at room temperature for 30 min, then the absorbance was recorded in the microplate reader at 730 nm. ABTS•+-scavenging activity was calculated by a formula
% Inhibition = [(Acontrol − Asample) / Acontrol] x 100
IC50 value was defined as concentration required for inhibiting 50% radical.
CA2 Page 32
2.3 Cell culture
Immortalized human keratinocytes (HaCaT) were purchased from ATCC. The cells were cultured in Dulbecco’s modified Eagle’s medium (DMEM), 2 mM L-glutamine and fetal bovine serum (FBS) were purchased from Gibco Invitrogen (Carlsbad, CA, USA) and then supplemented with 10% FBS, 100 mg/mL streptomycin and 100 U/mL penicillin. Human BJ fibroblast cells were purchased from ATCC 2522. The cells between passages 30 and 45 were cultured in minimum essential medium (MEM) with supplements as mentioned above. Both cultures are maintained in a humidified incubator with 5% CO2 atmosphere at 37 °C, and were sub-cultured every 2 days to maintain logarithmic growth.
2.4 Cell viability assay
Cell viability was determined by 3-(4,5-dimethylthiazol)-2,5-diphenyl tetrazolium bromide (MTT; Invitrogen) assay which described by Aburjai and Natsheh, (2003). HaCaT cells (25,000-30,000 cells, 100 µL per well) and Human BJ fibroblast (8,000 cells, 100 µL per well) were seeded into 96-well microplates. Different concentrations (0, 0.1, 0.2, 0.3, 0.4, 0.8 and 1 mg/mL) of extract were added to each well of plates. After incubating plates for 24 h, the old media containing extract were removed. The addition of 5 mg/mL of MTT in phosphate buffered saline was added to wells and incubated at 37 °C for 2 h, followed by the addition of dimethyl sulfoxide to solubilize purple formazan crystals in the cells. Absorbance at 540 nm was then measured using a microplate reader to calculate percentage of cell viability from this following equation:
% Cell viability = [Asample / Acontrol] x 100
2.5 Statistical Analysis
Dataareexpressedasmean±standarddeviation(SD)ofthreeindependent experiments.Theresults were statistically analyzed using software GraphPad Prism v6 for Windows (GraphPad Software Inc., La Jolla, CA). Allexperiments wereanalyzed byone-way analysisof variance(ANOVA) and at p<0.05 level. Dunnett’s test was then used to compare each experimental group with the control group.
3.Results and Discussion
3.1 Antioxidant activities of SSE
Phenolic compounds exhibit their antioxidant activity through their radical scavenging effects. Radical scavenging activity is critical due to the harmful effects of free radicals in biological systems and generally proceeds via hydrogen atom transfer or donation of electrons (Niki and Noguchi, 2000). To determine SSE's free radical scavenging activity, we used two types of radicals, DPPH and ABTS. In the present study, different concentrations of SSE were subjected to the DPPH and ABTS analyzes. As a result, the measurement of 50-percent inhibitory concentration or IC50 of the extract was conducted. All concentrations of extract exhibited an increasing trend of free radical scavenging ability (Figure1). SSEdisplayedpotent antioxidant activity byscavenging DPPH and ABTS radicals withIC50 values of 0.332 ± 0.005 and 0.140 ± 0.002 mg/mL, respectively. In addition, the highest capacity of SSE showed above 70% and 90% for inhibiting DPPH and ABTS radicals. This result showed different highest percent inhibition capacities of radicals since both assays differ in their response to antioxidants even though they are performed to estimate the free radical scavenging activity of a sample and based on the reduction of these radicals same (Oh et al., 2013). The antioxidant activity in sunflower sprout ethanol-based extract is influenced by CQAs, particularly 5-CQA and 3,5-diCQA. These compounds exhibited antioxidant activity (Sun et al., 2012). The previous study of Helianthus tuberosus L. (Jerusalem artichoke) extract by Yuan et al., (2012) showed its high CQAs accompanied by strong free radical scavenging abilities. Additionally, 5-CQA and 3,5-diCQA, found in the extracts from yerba mateshowedasimilar free-radical scavengingcapacityandantioxidantactivitytothe SSE(Ziemlewska et al., 2021).
3.2 Effect of SSE on the viability of HaCaT and human BJ fibroblasts
Cytotoxicity experiments are generally designed to determine the maximal non-toxic concentration or the highest concentration compatible with cell survival of compounds, including plant extracts (Tolosa, Donato, and Gómez-Lechón, 2015). To evaluate the potential cytotoxicity of SSE, an MTT
Pattarapipatkul et al CA2 Page 33
assay was used. This assay allows the assessment of cell viability and the determination of metabolic activity from working in NAD(P)H-dependent cellular, which involves mitochondrial respiratory (Chelliah and Oh, 2022). Moreover, Laksmitawati et al., (2017) described that cell cytotoxicity was indicated by the cell viability The cytotoxicity of SSE was evaluated on HaCaT and BJ fibroblast cell lines to identify non-cytotoxic concentrations. The non-cytotoxic concentrations of SSE showed more than 90 percent of cell viability with HaCaT and BJ fibroblast. After treatment for 24 h, the concentrations of SSE, ranging from 0.1 to 1mg/mL, did not show cytotoxic effectson these cells when compared to the non-treated control group (Figure 2). These concentrations of SSE were considered safe for the skin, which indicated their potential use in health care products. According to dominant CQAs, 5-CQA and 3,5-diCQA, which were present in SSE including several plants, previous studies from Ziemlewska et al., (2021) showed that yerba mate extract had a positive effect on cell viability of HaCaT and BJ fibroblasts cells. In addition, Panichakul et al. (2022) reported the cytotoxic potential of Ipomoea pes-caprae (beach morning glory) ethanolic extract, which had both dominant CQAs. In the range of its concentrations, 0.007to 1mg/mL were found to have nocytotoxic effect on CCD-986sk human fibroblast cells. Based on these findings, the biological effects of SSE such as protecting against oxidative stress and enhancing skin moisturization should be further analyzed for more potential sunflower sprouts to apply on the skin.

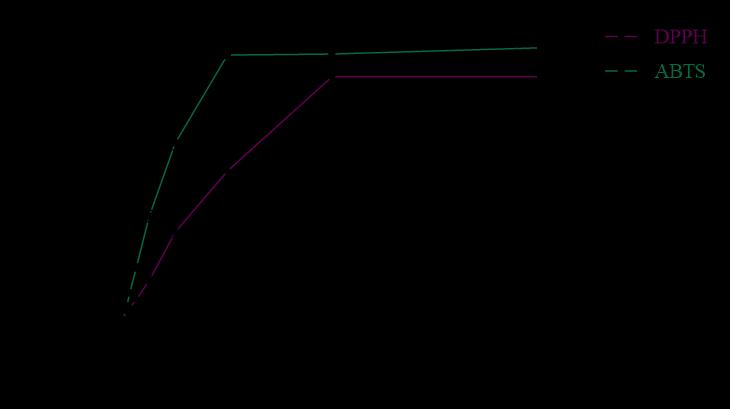
CA2 Page 34
Figure 1 Antioxidant activities of extract at different concentrations was evaluated by chemical-based assays, DPPH and ABTS Values are mean±SD of three replicate determinations (n=3).
(B) (A)
Figure 2 Cytotoxic effects of increasing in the concentrations of extract (0.1-1 mg/mL) on cell viability (MTT assay) incultured HaCaT (A) and BJ fibroblast (B) after 24 h ofexposure. Data arethemean±SD ofthreeindependent experiments,eachconsistingofthree replicates pertreatmentgroup. p<0.05 versus the untreated control (100%)
4.Conclusion
This study demonstrates that in vitro bioactivity of ethanolic SSE was associated with active substances. The antioxidant properties of SSE showed that the free-radical scavenging capacity was increasing dose-dependent, which may indicate a high antioxidant potential in the extract. Moreover, further investigations showed that SSE in all applied concentrations exhibited no cytotoxic effect on skin cells: HaCaT and BJ fibroblast. These results suggest that SSE is safe for the skin and can use as a pharmaceutical agent for healthcare products. However, the limitation of this study is only based on the 2D cell culture model, therefore clinical trials are needed to ensure that the biological roles of SSE correlate with in vitro studies.
5.Acknowledgements
This research was supported by H.M. the King Bhumibhol Adulyadej’s 72nd Birthday Anniversary Scholarship and the 90th Anniversary of Chulalongkorn University (Ratchadaphisek Somphot Endowment Fund).
6.References
Aburjai, T & Natsheh, F.M. (2003). Plants Used in Cosmetics. Phytotherapy Research, 17, 987-1000.
Cha, J.W., Piao, M.J., Kim, K.C., Yao, C.W., Zheng, J., Kim, S.M., Hyun, C.L., Ahn, Y.S. & Hyun, J.W. (2014). The Polyphenol Chlorogenic Acid Attenuates UVB-Mediated Oxidative Stress in Human Hacat Keratinocytes. Biomolecules & Therapeutics, 22, 136-142.
Cheevarungnapakul, K., Khaksar, G., Panpetch, P., Boonjing, P. & Sirikantaramas, S. (2019). Identification and Functional Characterization of Genes Involved in the Biosynthesis of CaffeoylquinicAcidsinSunflower(Helianthus Annuus L.). Frontiers in Plant Science,10,968. https://doi.org/10.3389/fpls.2019.00968
Chelliah, R. & Oh, D.-H. (2022). Screening for Anticancer Activity: 3-(4,5-Dimethylthiazol-2-Yl)2,5-Diphenyltetrazolium (Mtt) Assay. In D. Dharumadurai (Eds), Methods in Actinobacteriology (pp. 423-425). New York: Springer.
Fatima, A., Alok, D.S., Agarwal, P., Singh, P. & Verma, A. (2013). Benefits of Herbal Extracts in Cosmetics: A Review. International Journal of Pharmaceutical Sciences & Research, 4, 37463760.
Guo,S.,Ge,Y.&NaJom,K.(2017). AReviewofPhytochemistry,MetaboliteChanges,andMedicinal Uses of the Common Sunflower Seed and Sprouts (Helianthus Annuus L.). Chemistry Central Journal, 11, 95. https://doi.org/10.1186/s13065-017-0328-7
Herald, T., Gadgil P. & Tilley, M. (2012). High-Throughput Micro Plate Assays for Screening
Flavonoid Content and DPPH-Scavenging Activity in Sorghum Bran and Flour. Journal of the Science of Food & Agriculture, 92, 2326-2331.
Kasote, D.M., Jayaprakasha, G.K. & Patil, B.S. (2019). Leaf Disc Assays for Rapid Measurement of Antioxidant Activity. Scientific Reports, 9, 1884. https://doi.org/10.1038/s41598-018-38036-x
Kim, S.S., Park, R.Y., Jeon, H.J., Kwon Y.S. & Chun, W. (2005). Neuroprotective Effects of 3,5Dicaffeoylquinic Acid on Hydrogen Peroxide-Induced Cell Death in Sh-Sy5y Cells. Phytotherapy Research, 19, 243-245.
Laksmitawati, D., Widyastuti, A., Karami, N., Afifah, E., Rihibiha, D., Nufus H. & Widowati, W. (2017). Anti-Inflammatory Effects of Anredera Cordifolia and Piper Crocatum Extracts on Lipopolysaccharide-Stimulated Macrophage Cell Line. Bangladesh Journal of Pharmacology, 12, 35-40.
Lallemand, L.A., Zubieta, C., Lee, S.G., Wang, Y., Acajjaoui, S., Timmins, J., McSweeney, S., Jez, J.M., McCarthy, J.G. & McCarthy, A.A. (2012). A Structural Basis for the Biosynthesis of the Major Chlorogenic Acids Found in Coffee. Plant Physiology, 160, 249-260.
Pattarapipatkul et al CA2 Page 35
Liang, N., Dupuis, J.H., Yada R.Y. & Kitts, D.D. (2019). Chlorogenic Acid Isomers Directly Interact with Keap 1-Nrf2 Signaling in Caco-2 Cells. Molecular and Cellular Biochemistry, 457, 105118.
Mahesh, S.K., Fathima, J.& Veena, V.G. (2019). Cosmetic Potential of Natural Products: Industrial Applications. In Swamy, M. & M.S. Akhtar (Eds), Natural Bio-Active Compounds: Chemistry, Pharmacology & Health Care Practices (Vol.2), (pp. 215-250). Gateway East: Springer.
McDougall, B., King, P.J., Wu, B.W., Hostomsky, Z., Reinecke M.G. & Robinson, Jr. W.E. (1998). Dicaffeoylquinic and Dicaffeoyltartaric Acids Are Selective Inhibitors of Human Immunodeficiency Virus Type 1 Integrase. Antimicrobial Agents & Chemotherapy, 42, 140146.
Moglia, A., Acquadro, A., Eljounaidi, K., Milani, A.M., Cagliero, C., Rubiolo, P., Genre, A., Cankar, K., Beekwilder, J. & Comino, C. (2016). Genome-Wide Identification of Bahd Acyltransferases and in Vivo Characterization of Hqt-Like Enzymes Involved in Caffeoylquinic Acid Synthesis in Globe Artichoke. Frontiers in Plant Science, 7, 1424.
https://doi.org/10.3389/fpls.2016.01424
Niki, E & Noguchi, N. (2000). Evaluation of Antioxidant Capacity. What Capacity Is Being Measured by Which Method?. IUBMB Life, 50, 323-329.
Oh, J., Jo, H., Cho, A.R., Kim, S.-J. & Han, J. (2013). Antioxidant and Antimicrobial Activities of Various Leafy Herbal Teas. Food Control, 31, 403-409.
Panichakul, T., Ponnikorn, S., Tupchiangmai, W., Haritakun, W. and Srisanga, K. (2022). Skin AntiAging Potential of Ipomoea Pes-Caprae Ethanolic Extracts on Promoting Cell Proliferation and Collagen Production in Human Fibroblasts (Ccd-986sk Cells), Pharmaceuticals, 15, 969.
https://doi.org/10.3390/ph15080969
Sun, Z., Chen, J., Ma, J., Jiang, Y., Wang, M., Ren, G. & Chen, F. (2012). Cynarin-Rich Sunflower (Helianthus Annuus) Sprouts Possess Both Antiglycative and Antioxidant Activities. Journal of Agricultural & Food Chemistry, 60, 3260-3265.
Tolosa, L., Donato M.T. & Gómez-Lechón, M.J. (2015). General Cytotoxicity Assessment by Means of the MTT Assay. In Vinken, M. & V. Rogiers (Eds), Protocols in In Vitro Hepatocyte Research (pp. 333-348) New York: Springer.
Yuan, X., Gao, M., Xiao, H., Tan, C. & Du, Y. (2012). Free Radical Scavenging Activities and Bioactive Substances of Jerusalem Artichoke (Helianthus Tuberosus L.) Leaves. Food Chemistry, 133, 10-14.
Ziemlewska, A., Nizioł-Łukaszewska, Z., Bujak, T., Zagórska-Dziok, M., Wójciak, M. & Sowa, I. (2021). Effect of Fermentation Time on the Content of Bioactive Compounds with Cosmetic and Dermatological Properties in Kombucha Yerba Mate Extracts. Scientific Reports, 11, 18792. https://doi.org/10.1038/s41598-021-98191-6
CA2 Page 36
*********************
Effects of Extraction Techniques on Antioxidant and Tyrosinase inhibitory Activities from Physalis peruviana L. fruits for using in Cosmetic Application
Mayuramas Wilai1,2*
1School of Cosmetic Science, Mae Fah Luang University, Chiang Rai 57100, Thailand
2 Phytocosmetics and Cosmeceuticals Research Group, Mae Fah Luang University, Chiang Rai, Thailand *Corresponding author. E-mail: mayuramas@mfu.ac.th
Abstract
In this study, the crude ethanolic extracts of Physalis peruviana L. fruits from three different extraction techniques, i) Maceration technique (MPPF); ii) Soxhlet apparatus (SxPPF); iii) Sonicate apparatus (SoPPF), were evaluated for the antioxidant and tyrosinase inhibitory activities. The antioxidant capacity of each crude ethanolic extract were measured the ability by DPPH radical (2,2-diphenyl-1picrylhydrazyl) and ABTS radical (2,2’-azinobis-(3ethylbenzothiaziline-6-sulfonate) scavenging assays. The total phenolic content was determined using the Folin-Ciocalteu method and calculated as gallic acid equivalents (GAE). The study found that the highest percentage yield (35.32 %) and total phenolic contents (GAE 1.38 mg/g ofextract) werefoundfrom the SxPPFethanolicextract. Amongoftheextracts from three different methods, the remarkable activity against DPPH radical (IC50 = 2,437.16 μg/ml) compared to ascorbic acid (IC50 = 165.14 μg/ml), exhibited strong ABTS•+ free radical scavenging activity (IC50 = 153.57 μg/ml) compared to ascorbic acid (IC50 = 128.92 μg/ml), and actedas potent tyrosinaseinhibitor(IC50 =1985.38 μg/ml)comparedtothepositivecontrol kojic acid (IC50 = 349.36 μg/ml) were found from the SxPPF ethanolic extract. Therefore, the SxPPF ethanolic extract could be potentially used as an active ingredient in the cosmetic products according to the fast extraction method, low cost, and high potency on antioxidant activities and tyrosinase inhibitory activity.
Keywords: antioxidant activity; Physalis peruviana L.; tyrosinase inhibitor
1.Introduction
Nowadays, human beings are more conscious of health and beauty. Therefore, research studies related to the substances that promote health benefit is increasing interest, especially the research on antioxidant. The free radicals are responsible for causing a large number of diseases including cancer, autoimmune disorders, aging, cataract, rheumatoid arthritis, cardiovascular and neurodegenerative diseases (Pharm-Huy et al., 2008). The use of natural antioxidants is growing interest, especially in food science, complementary medicine, and cosmetics. Therefore, antioxidants are of a great benefit in improving the quality of life by preventing or postponing the onset of degenerative diseases due to oxidative stress (Mohammed et al., 2015).
Physalis peruviana L. (Goldenberry) is an exotic fruit that belongs to the family of Solanaceae and has been widely used as a traditional medicine since pre-Columbian times(Pigatto et al., 2014,MedinaMedrano et al., 2015), particularly in the treatment of cancer (Lan et al., 2009, Chang et al., 2008) The fruits are globose berries with smooth, waxy, orange-yellow skin and pulp that is sweet, but slightly acidic with numerous small seeds (Yildiz et al., 2012) The fruits have generally been regarded as food rich in vitamin C with antioxidant activities (Olivares-Tenorio et al., 2016) The phytochemical studies from P. peruviana L. fruit have indicated the presence of different chemical compounds, such as
CA3 Page 37
Proceeding of Cosmetic & Beauty International Conference 2022 Future of the Next Beauty (CBIC 2022) 7th-9th December 2022
saponins, withanolides, polyphenols, quercetin, myricetin and kaempferol which demonstrate antioxidant (Munoz et al., 2021, Sathyadevi et al., 2015).
The quantitative phytochemical analysis of ethanolic extract of P. peruviana L. fruit using the maceration technique contains a number of phenolic compounds (gallic acid, catechol, p-hydroxy benzoic acid, caffeine, vanillic acid, syringic acid, vanillin, benzoic acid, o-coumaric acid, p-coumaric acid,salicylicacid,chlorogenicacid,ferulicacid,trans-cinnamicacid,andcinnamicacid)andanumber of flavonoid compounds (naringenin, kaempferol, apigenin, luteolin, naringenin and quercetin (Munoz et al., 2021, El-Beltagi et al., 2019). The quantitative analysis of the phenolic compounds reported in ethanoic extract of Physalis peruviana L. fruit using the High Intensity Ultrasound-assisted extraction technique identified as chlorogenic acid, caffeic acid and rutin (Coodevilla et al., 2018). The preliminaryphytochemicalanalysisrevealedthepresenceofthealkaloids,flavonoids,andphenolsfrom the ethanolic extract of Physalis peruviana L. fruits using Soxhlet apparatus technique (Bharthi et al., 2016).
The extraction is the first step for obtaining bioactive compounds from plant materials, and conventional solvent extractions, such asmaceration, percolation, Soxhlet, and stirringmethods, arethe most widely used. The bioactive compounds present in the fruit of goldenberry, especially phenolic compounds, have important pharmacological properties, such as antioxidant, antibacterial, and antitumor (Codevilla et al., 2018).
Therefore, the aims of this study were to evaluate the antioxidant and tyrosinase inhibitory capacity of the ethanolic extract of Physalis peruviana L. fruit extracted from three different methods: i) Maceration technique, ii) Soxhlet apparatus and iii) Sonicate apparatus.
2.Materials and Methods
2.1 Materials
The plant of Physalis peruviana L. fruits (PPF) of the family Solanaceae was purchased from The Royal Project, Chiang Rai, Thailand. The fruits were cleaned, cut into small pieces, and dried under shade. The dried PPF was kept in under 4oC until use.
Ascorbic acid, gallic acid, kojic acid, Folin-Ciocaltues reagent, 2,2-diphenyl-l-picrylhydrazul (DPPH), and 2,2’-azino-bis(3-ethylbenzothiazoline-6-sulfonic acid (ABTS) were purchased from Sigma-Aldrich, USA The 125 U mL-1 of mushroom tyrosinase was purchased form Sigma-Aldrich, USA. The UV-Vis Spectrophotometer (Biochrom Libra S80, UK) is used for scanning the absorbance to detect the unique wavelength maxima of pigment molecules.
2.2 Extraction conditions
The extraction was performed using three different methods i) Maceration technique, ii) Soxhlet apparatus, and iii) Sonicate apparatus.
i)Maceration technique One hundred grams of sample was soaked with 95% ethanol (ratio between solid: solvent 1:2) at room temperature for 24 hours. The extract was filtered with filter paper (Whatman No. 1) while the residue was further extracted under the same condition twice. The filtrates collectedform threeseparate extractionswere combined andevaporatedtodrynessunder vacuum using rotary evaporator (Wu et al., 2005).
ii)Soxhlet apparatus technique One hundred grams of sample was extracted using 95% ethanol as a solvent (ratio between solid: solvent 1:2) for 6 hours using the Soxhlet apparatus. The extract was filtered through quantitative filter paper, evaporated to dryness under vacuum using rotary evaporator, and stored under 4oC until analysis (Bharthi et al., 2016).
iii) Sonicate apparatus technique One hundred grams of sample was extracted using 95% ethanol as a solvent (ratio between solid: solvent 1:2) for 30 minutes using Sonicate apparatus The extract was filtered through quantitative filter paper, evaporated to dryness under vacuum using rotary evaporator, and stored under 4oC until analysis (Codevilla et al., 2018).
The yield of the three extraction methods for Physalis peruviana L. fruit; i) Maceration technique (MPPF); ii) Soxhlet apparatus (SxPPF); iii) Sonicate apparatus (SoPPF), was calculated using the
Wilai et al CA3 Page 38
formula described by Falleh (2008) as the following equation.
Y (%) = 100 (Mext/Mdps)
Where Y is the yield of extraction in %, Mext is the mass of the extract (in mg) after the evaporation (using the rotary evaporator), and Mdps is the mass of the dried plant sample in mg.
2.3 Determination of Total Polyphenols
Total polyphenols weredetermined bytheFolin-Ciocalteu (FC)methodfollowingNarvaez-Cuenca et al. 2014 method with some modification. A 100 μL extract was mixed with 125 μL of 10% (v/v) Folin-Ciocalteu’s reagent.After 5 min, 25 μL of a 7% (w/v) Na2CO3 solution wereadded. After 30 min, the absorbance of the reaction mixture was measured at 725 nm. The results were expressed as gallic acid equivalents (mg GAE per 100 g of dry weight (DW) of fruit). Calibration curves for gallic acid were performed in concentrations ranging from 50-200 μg/mL (y = 0.0820x + 0.0245, R2 = 0.9983).
2.4 Free Radical Scavenging Activities
The DPPH and ABTS Assays. The DPPH and the ABTS assays were performed according to a modified method of Narvaez-Cuenca et al. 2014. The DPPH assay, the ethanolic stock solution of 50 mM DPPH was prepared to obtain a working DPPH solution with absorbance intensity of 1.10 at 515 nm. The 25 L of extract was mixed with 975 L of working DPPH solution. The mixture was shaken vigorously and left standing at room temperature for 30 minutes in the dark, and then the absorbance was measured at 515 nm. The ABTS assay, the mixture of 7.0 mM ABTS solution and 2.45 mM potassium persulphate (ratio 2:1.5) was prepared and stored in a dark condition for 12-16 hours at room temperature in the dark until a stable oxidative state. The resulting ABTS•+ solution was diluted with ethanol to reach an absorbance of 0.7 at 734 nm. The reaction mixture, 1000 L of ABTS•+ solution with100 Lofsamplesolutionwasplaced,andafteragitation,itwaslefttorestinadarkfor15minutes. Then, the absorbance was measured at 734 nm to assess the percentage of inhibition. The scavenging effect (in percentage) was calculated as the following equation.
The scavenging activity = [1-(A1-A0)]*100,
Where A0 was the absorbance of the control (without extract), A1 was the absorbance of the sample in the presence of the extract once the steady state plateau was reached. The amount of antioxidant activity is characterized by the value of IC50 which is concentration of extract required to inhibit 50% of DPPH and ABTS radicals. All samples were analyzed in three replications. In the DPPH and ABTS assays, standard curves were generated with ascorbic acid in concentrations ranging from 5 – 200 μg/mL (five data points R2 = 0.9959, y = 0.4229x + 8.4479) and 50 – 400 μg/mL (five data points, R2 = 0.9919, y = 0.2858x - 13.156), respectively.
2.5 Tyrosinase Inhibition Activity
The tyrosinase inhibition activity, using L-Dopa as the substrate, was performed according to the protocol described by Dej-adisai (2016) with some modifications. The red colour of dopachrome from the oxidation of L-Dopa can be detected by visible light at 492 nm. The anti-tyrosinase activity was performedin96well plate.Thesamplesweredissolvedwithethanoltotheconcentration rangebetween 100 - 40 mg/mL. The first 20 L of the sample’s solution were mixed with 140 L phosphate buffer (pH 6.8) and 20 L of mushroom tyrosinase solution (203.3 unit/mL) and incubated at 25C for 10 minutes. Then 20 L of L-Dopa (0.85 mM) was added. The mixture solution was incubated at 25C for 20 minutes. After incubation, the amount of dopachrome in the reaction was measured at 492 nm. The tyrosinase inhibition (in percentage) was calculated as the following equation.
The Tyrosinase inhibition activity
[(A-B)-(C-D)/(A-B)]*100
WhereAisthedifferenceofoptical densitybeforeandafterincubationofcontrol,Bisthedifference of optical density before and after incubation of blank control, C is the difference of optical density before and after incubation of test sample, and D is the difference of optical density before and after incubation of blank sample. All samples were analyzed in three replications. The absorbance of the microplate wells was read using a microplate spectrophotometer at 510 nm. The standard curves were generated with kojic acid in concentrations ranging from 150 – 500 μg/mL (six data points R2 = 0.9956,
Wilai et al CA3 Page 39
y
= 0.1399x + 0.1016).
2.6 Statistical analyses
All experimental measurements were carried out in triplicate and are expressed as average of three analyses ± Standard Deviation. The differences between means were ANOVA (analysis of variance). IC50 value of each sample was calculated.
3.Results and Discussion
3.1 The Extract Yield and Total Phenolic Contents
Asaresult,thepercentageyieldoftheethanolicextract of Physalis peruviana L.from threedifferent methods i) Maceration technique, ii) Soxhlet apparatus, and iii) Sonicate apparatus) have been shown in the Table 1. The highest extraction yield was registered in SxPPF (35.32%), followed by the extracts of MPPF and SoPPF was 26.15% and 17.99%, respectively. The total phenolic content of these extracts from P. peruviana L. were determined using the Folin-Ciocalteu assay by consideration a standard curve with gallic acid (GA) taking into consideration the relationship between absorbance and concentration.
Using the equation obtained from calibration curve, the SxPPF showed the highest phenolic content (1.38 ± 0.022 mg GAE/g of extract) followed by the MPPF (1.23 ± 0.025 mg GAE/g of extract) and the SoPPF (0.98 ± 0.011 mg GAE/g of extract) showed the lowest content (Table 1). The result suggests that the Soxhlet apparatus is the best technique used for the extraction of the phenolic compounds from Physalis peruviana L. fruit. Using ANOVA, the F value of 0.92522 and Fcrit of 3.4668. The F cit value
F value, so it can conclude that there were no significant differences toward total phenolic content of extracts each method. From this study, it may suggest that the total phenolic content contains in all extracts may consist of polyphenols, flavonoids, and alkaloids compounds (Munoz et al., 2021, ElBeltagi et al., 2019, Coodevilla et al., 2018, Bharthi et al., 2016).
*MPPF = Maceration extraction technique of Physalis peruviana L fruits
**SoPPF = Sonication extraction technique of Physalis peruviana L. fruits
***SxPPF = Soxhlet apparatus extraction technique of Physalis peruviana L. fruits Values are given as mean ± S.D. from triplicate.
Wilai et al CA3 Page 40
Samples % Yield Total phenolic contents (mg GAE/g of extract) MPPF* 26.15 1.23 ± 0.025 SoPPF** 17.99 0.98 ± 0.011 SxPPF*** 35.32 1.38 ± 0.022
Table 1 The extract yield and total phenolic contents from Physalis peruviana L. fruits.
Figure 1 Gallic acid standard calibration curve for the quantification of total phenolic content.
y = 0.0802x + 0.0245
0 0.2 0.4 0.6 0.8 1 0 2 4 6 8 10 12 Absorbance at 765 nm Concentration of gallic acid (μg/mL)
R² = 0.9983
3.2 Antioxidant Capacity
The antioxidant capacity of Physalis peruviana L. fruit extracted from three different extraction techniques(MPPF,SoPPF,and SxPPF) was determinedbytwomethods, usingthefreeradicalsDPPH* (2,2-Diphenyl-l-picrylhydrazul) and ABTS•+ (2,2’-azino-bis(3-ethylbenzthiazoline-6-sulfonic acid)). The results were based on the inhibition concentration at 50% (IC50), compared with standard antioxidant (ascorbic acid). The calculated IC50 value on DPPH and ABTS free radical scavenging activities of all extracts has been shown in the Table 2. The IC50 value of ascorbic acid (standard) on DPPH and ABTS radical scavenging capacity was 165.14 μg/mL and 128.92 μg/mL, respectively. Among the extracts, the IC50 value of different extraction techniques was in the following order: SxPPF >MPPF > SoPPF (for DPPH assay) and SxPPF > SoPPF > MPPF (for ABTS assay). From the results, the Physalis peruviana L. fruit extract from Soxhlet apparatus technique (SxPPF) showed stronger ABTS scavenging (IC50 153.57 μg/mL) than DPPH scavenging (IC50 2437.16 μg/mL).
Using ANOVA, the F values of DPPH and ABTS are 0.0252 and 0.3612, respectively. The Fcrit of both DPPH and ABTS is 3.5545. The Fcrit value F value, so the results indicated that there were no significant differential effects on both DPPH and ABTS free radical scavenging of extracts from each method.
Table 2 The antioxidant activity of Physalis peruviana L. fruits extracts from different methods and standard by DPPH and ABTS assays [IC50 (μg/mL).
*MPPF = Maceration extraction technique of Physalis peruviana L. fruit
**SoPPF = Sonication extraction technique of Physalis peruviana L. fruit
***SxPPF = Soxhlet apparatus extraction technique of Physalis peruviana L. fruit
IC50 = Inhibitory activity at 50%, Values are given as mean ± S.D. from triplicate.
The 2,2-Diphenyl-l-picrylhydrazul (DPPH*) assay is commonly used for determination of free radical scavenging activity of antioxidant based on the capture of the DPPH radical by the oxidants (Guine et al., 2020). The reveal reported by Liang and Kitts (2014) indicated that the antioxidants react with DPPH* radicals based on both hydrogen atom transfer (HAT) or single electron transfer (SET) reactions. The 2,2’-azino-bis(3-ethylbenzothiazoline-6-sulfonic acid) (ABTS•+) radical cation-based assays are among the most abundant antioxidant capacity assays. The antioxidant such as phenolic nature,canformcouplingadductswithABTS•+,whereasotherscanundergooxidationwithout coupling (Ilyasov et al., 2019). The antioxidant provides an electron to the free radical (ABTS•+) and itself then become a radical cation via the SET mechanism (Liang and Kitts, 2014). In this study, the result of the free radical scavenging activity of Physalis peruviana L. fruit extracted from three different techniques may possess based on both HAT and SET reactions.
3.3 Tyrosinase inhibitory Activity
In this study, tyrosinase inhibitory effects of Physalis peruviana L. fruit on diphenolase activity of mushroom tyrosinase were evaluated. As with increasing the concentration of all extracts (All total extracts of plants inhibited tyrosinase weaker than kojic acid (IC50 = 356.67 μg/mL). IC50 values of ethanolic extract of Physalis peruviana L. fruit extracted from three different techniques (MPPF, SoPPF, and SxPPF) were calculated 8139.7, 8169.91, 1985.38 μg/mL, respectively (Table 3). Using ANOVA, the F values of tyrosinase inhibitory effect is 0.1145 and the Fcrit is 4.2564. The Fcrit value F value, so the result indicated that there were no significant differential effects on tyrosinase inhibitory effect of extracts from each method. Among of the extracts, SxPPF showed the most tyrosinase inhibitory effects, indicating its potent tyrosinase inhibitors or high content of active compounds with tyrosinase inhibitory effects.
Wilai et al CA3 Page 41
Samples DPPH IC50 (μg/mL) ABTS IC50 (μg/mL) MPPF* 2540.8 329.4 SoPPF** 2677.85 296.08 SxPPF*** 2437.16 153.57 Ascorbic acid 165.14 128.92
As reported by Chang (2009), the standard tyrosinase inhibitors classified into five major classes, including polyphenols, benzaldehyde and benzoate derivatives, long-chain lipids and steroids based on either the chemical structures or the inhibitory mechanism. Polyphenols and flavonoids isolated from plants which were identified as tyrosinase inhibitors such as kojic acid, caffeic acid, p-coumaric acid, kaempferol, anthocyanins, luteolin, quercetin and apigenin (Namjoyan et al., 2015). In this study, the tyrosinase inhibitory effects of Physalis peruviana L. fruit on diphenolase activity of mushroom tyrosinase may results from the total phenolic contents contains in the extracts (Munoz et al., 2021, ElBeltagi et al., 2019, Coodevilla et al., 2018, Bharthi et al., 2016).
Table 3 The tyrosinase inhibitory activity of Physalis peruviana L. fruit extracts from different methods and standard by Dopachrome assay [IC50 (μg/mL).
*MPPF = Maceration extraction technique of Physalis peruviana L. fruit
**SoPPF = Sonication extraction technique of Physalis peruviana L. fruit
***SxPPF = Soxhlet apparatus extraction technique of Physalis peruviana L. fruit Values are given as mean ± S.D. from triplicate.
4.Conclusion
According to the experiment, the Soxhlet apparatus is the best technique to obtain the highest percentage while the lowest is from the sonicate apparatus. The optimum condition for the Soxhlet apparatus technique assisted extraction of Physalis peruviana L. fruit is 6 hours for extraction time, solid to solvent ratio is 1:2 with the maximum yield percentage of 35.32%. The crude ethanolic extract from the Soxhlet apparatus technique shows the highest total phenolic content and best antioxidant activities on the DPPH and ABTS assays, including anti-tyrosinase activity. Therefore, the SxPPF ethanolic extract could be potentially used as an active ingredient in the cosmetic products according to the fast extraction method, low cost, and high potency on antioxidant activities and tyrosinase inhibitory activity.
5.Acknowledgements
The author is grateful to Mae Fah Luang University for financial support.
6.References
Bharthi, V., Reddy, P., Shantha, T.R., and Venkateshwarlu, G. (2016). Phytochemical evaluation and powder microscopy of medicinal and nutritional fruits of Physalis peruviana L. International Journal of Herbal Medicine, 4(1): 43-46.
Chang, J.C., Lin, C.C., Lin, D.L., Wang, S.S., Miaw, C.L., Ng, L.T. (2008). Antioxidative and Hepatoprotective Effects of Physalis peruviana Extract against Acetaminophen-Induced Liver Injury in Rats. Pharmaceutical Biology 46, 724-731
Chang, T. (2009). An Updated Review of Tyrosinase Inhibitors. International of Molecular Sciences, 10, 2440-2475, https//doi.org, 10.3390/ijms10062440
Codevilla, C.F., Tischer, B., Gindri, A.L., … , and Menezes, C.R. (2018). Cytotoxicity and Antioxidant Activity of Goldenberry Extracts Obtained with High Intensity Ultrasound. Ciência Rural, 48(02), e20170362, http://dx.doi.org/10.1590/0103-8478cr20170362
Wilai et al CA3 Page 42
Samples Total phenolic contents (mg GAE/g of extract) L-DOPA IC50 (μg/mL) MPPF* 1.23 ± 0.025 8139.7 SoPPF** 0.98 ± 0.011 8169.91 SxPPF*** 1.38 ± 0.022 1985.38 Kojic acid 356.67
El-Beltagi, H., Nohamed, H.I., Safwat, G., Gamal, M., and Megahed, B.M.H. (2019). Chemical Composition and Biological Activity of Physalis peruviana L. Gesunde Pflanzen, https://doi.org/10.1007/s10343-019-00456-8
Guine, R.P.F., Gonclves, F.J.A., Oliveira, S.F., and Correia, P.M.R. (2020). Evaluation of Phenolic Compounds, Antioxidant Activity and Bioaccessibility in Physalis Peruviana L., International of Journal of Fruit Science. 20(2), S470-S490. https://doi:10.1080/15538362.2020.1741056
Ilyasov, I.R., Beloborodov, V.L., Selivanova, I.A., and Terekhov, R.P., (2020). ABTS/PP Decolorization Assay of Antioxidant Capacity Reaction Pathways. International Journal of Molecular Sciences. 21, 131. https://doi:10.3390/ijms21031131
Lan, Y. H., Chang, F. R., Pan, M. J., Wu, C. C., Wu, S. J., Chen, S. L., Wang, S. S., Wu, M. J., Wu, Y. C. (2009). New cytotoxic withanolides from Physalis peruviana. Food Chemistry, 116, 462469
Liang, N. and Kitts, D.D. (2014). Antioxidant Property of Coffee Components: Assessment of Methods that Define Mechanisms of Action, Molecules, 19, 19180-19208; http://doi:10.3390/molecules191119180
Medina-Medrano, J R , Almaraz-Abarca, N , González-Elizondo, M S , Uribe-Soto, J N , González-Valdez, L. S., Herrera-Arrieta, Y. (2015). Phenolic constituents and antioxidant properties of five wild species of Physalis (Solanaceae). Bot Stud , 56, 24.
Mohammed Z., and Ibraheem, R.M. (2015). Antioxidant Activity of Methanol Extracts of Arum maculatum L. and Physalis peruviana L. Plants. Ibn Al-Haitham Journal for Pure and Applied Sciences, 28(2), 1-6.
Munoz,P.,Parra,F.,Simirgiotis,M.J.,Chavera,GFS.,andParra,C.(2021).Chemical Characterization, Nutritional and Bioactive Properties of Physalis peruviana Fruit from High Areas of the Atacama Desert. Foods, 10, 2699. https://doi.org/10.3390/foods10112699
Namjoyan, F., Jahangiri, A., Azemi M.E>, Arkian, E. and Mousavi, H., (2015). Inhibitory Effects of Physalis alkekengi L., Alcea rosea L., Bunium persicum B. Fedtsch. and Marrubium vulgare L.on Mushroom Tyrosinase. Jundishapur Journal of Natural Pharmaceutical Products, 10(1),e233356, https//doi:10.17795/jjnpp-23356
Narvaez-Cuenca, C.E., Mateus, A., Restrepo-Sanchez, L.P. (2014). Antioxidant capacity and total phenolic content of air-dried cape gooseberry (Physalis peruviana L.) at different ripeness stages. Agronomia Colombiana.
Olivares-Tenorio M., Dekker M., Verkerk R., and Boekel M A.J.S. (2016). Health-Promoting compounds in cape gooseberry (Physalis peruviana L.): Review from a supply chain perspective. Trends in food Science&Technology, 57, 83-92.
Pham-Huy, L.A., He, Hua., Pham-Huy, C. (2008). Free Radicals, Antioxidants in Disease and Health. International Journal of Biomedical Science, 4(2), 89-96.
Pigatto,A.G.S.,Mentz,L.A.,Soares,G.L.G.(2014).Chemotaxonomiccharacterizationandchemical similarity of tribes/genera of the Solanoideae subfamily (Solanaceae) based on occurrence of withanolides. Biochem Syst Ecol 54, 40-47.
Ramadan, M.F. and Moersel, J.T. (2009). Oil extractability from enzymatically treated goldenberry (Physalis peruviana L.) pomace: range of operational variables. International Journal of Food Science andTechnology, 44, 435-444.
Sathyadevi, M and Subramanian, S (2015). Exraction, isolation and characterization of bioactive flavonoids from the fruits of Physalis peruviana Linn extract. Asian JPharm Clin Res. 8(1), 152-157
Wilai et al CA3 Page 43
Sofi,S.H.andNaqishbandi,A.M.(2017), In vitro BioactivePhytochemicalStudyof Physalis peruviana Indigenous to Kurdistan, The First Scientific Conference for The College of Pharmacy/Hawler Medical University, Kurdistan Medical Control Agency (KMCA), Syndicate of Kurdistan Pharmacists. (6th – 7th of December 2017, Divan Hotel - Erbil, Kurdistan).
Yildiz G., Izli N., Unal H., and Uylaser V. (2012). Physical and chemical characteristics of goldenberry fruit (Physalis peruviana L.). Food Sci Technol, 52(4), 2320-2327.
Wilai et al CA3 Page 44
Effects of surfactants on the physicochemical properties of asiatic acidloaded solid lipid microparticles
Jatuporn Witarat1,2, Lai Wah Chan3, Romchat Chutoprapat1,2*
1 Cosmetic Science Program, Faculty of Pharmaceutical Sciences, Chulalongkorn University, Bangkok 10330, Thailand
2 Department of Pharmaceutics and Industrial Pharmacy, Faculty of Pharmaceutical Sciences, Chulalongkorn University, Bangkok 10300, Thailand
3 Department of Pharmacy, National University of Singapore, Singapore Corresponding author: romchat.c@pharm.chula.ac.th
Abstract
The objective of this study was to evaluate the effects of three surfactants, namely tween 80, soybean lecithin, and poloxamer 188 on the characteristics of solid lipid microparticles containing asiatic acid (AASLM). The AASLM were prepared from or 15% of beeswax together with 3% of surfactant (formulas B1-B6) by melt dispersion cum freeze-drying technique to obtain a solid dosage form. The physicochemical characteristics of the AASLM powders, including appearance, surface morphology, particle size, %labelled amount of asiatic acid (AA) and %entrapment efficiency (EE) were evaluated. The results revealed that AASLM prepared from or 15% beeswax with 3% soybean lecithin (B2 and B5) could not yield a dry powder form, whereas those with tween 80 (B1 and B4) or poloxamer 188 (B3 and B6) appeared as white to slightly yellowish coarse powders with mean particle sizes ranging from 14.15±0.11 to 38.86±0.34 microns. The surface morphology of AASLM powders, examined by scanning electron microscope, showed a non-spherical shape. The morphology of AASLM dispersions before freeze-drying and after redispersion of the freeze-dried powder were also investigated using the optical microscope. In all the dispersions, the AASLM prepared from 10% or 15% beeswax with 3% poloxamer 188 (B3 and B6) had spherical particle shape, whereas those prepared from 10% or 15% beeswax with 3% tween 80 (B1 and B4) seemed to have irregular particle shape. The %labelled amount of AA in B1, B3, B4 and B6 were 94.23±0.04, 90.43±0.02, 95.26±0.02 and 90.69±0.02, respectively, which were considered acceptable. The %EE of B1, B3, B4 and B6 were 53.75±0.01, 100.00±0.00, 51.56±0.03 and 100.00±0.00, respectively. It could be concluded that the AASLM prepared with poloxamer 188 has the greatest potential among the test formulations as a topical carrier for AA. Further studies will be conducted to explore its utilization in cosmetics.
Keywords: Asiatic acid, Solid lipid microparticles, Tween 80, Soybean lecithin, Poloxamer 188
1. Introduction
Asiatic acid (AA) is an aglycon triterpenoidsor pentacyclictriterpenoidfound in Centella asiatica which is a poorly water-soluble substance. Its water solubility is approximately 10 µg/mL (Borhan et al., 2013; Chen et al., 2020; Lv et al., 2018; Puttarak& Panichayupakaranant,2012; Rafat et al., 2008) AA has many beneficial effects such as wound healing (Thakor et al., 2017; Yun et al., 2008), antiinflammation, anti-oxidation (Huang et al., 2011; Lv et al., 2017; Yun et al., 2008) and anti-microbial activity(Djoukeng et al., 2005; Liu et al., 2015; Pojanaukij & Kajorncheappunngam,2010), hence AA is one of the promising active ingredients used in cosmetic and pharmaceutical products.
CA4 Page 45
Proceeding of Cosmetic & Beauty International Conference 2022 Future of the Next Beauty (CBIC 2022) 7th-9th December 2022
Solid lipid nanoparticles (SLNs) and solid lipid microparticles (SLMs) are drug delivery systems which demonstrated many benefits comparing to other drug carriers. They can deliver and encapsulate active substance by solid lipid which are safe, biocompatible and biodegradable, and they can control a release of active substance to target site. It was reported that SLN loaded with AA can successfully transfer the drug (AA) to nasal route for Alzheimer's prevention and treatment. The obtaining formulas showed good physicochemical characteristics including appearance, pH, particle size, size distribution and drug loading. They were stable with no sign of precipitation under different storage conditions (4 oC, room temperature and 45 oC) for 6 months (Khunathum, 2011). Solid lipid microparticles (SLMs) are similar to SLNs in term of a composition. However, the size of SLMs (1-1000 µm) is bigger than that of SLNs (50-500 nm) (Jaspart et al., 2005; Pardeike et al., 2009; Sznitowska et al., 2017) which are safe for topical application. The incorporation of AA in SLMs has not been reported to date, thus SLMs can be a newly developed carrier systems for the delivery of AA for dermal application. SLMs are lipid-basedsystemscomposedof a hydrophobiccoremadefrom solidlipid.SLMs havesatisfactory loading capacity of lipophilic compounds and a good affinity for the stratum corneum (Long et al., 2006). They also exhibited several advantages including controlled release, biocompatibility, biodegradability,lowtoxicity,avoidanceoforganicsolventsinproduction,thepossibilityoflarge-scale production and protection of active substances from the surrounding environment (Chen et al., 2020; Jaspart et al., 2005) SLMs are potentially useful for the local delivery.
Many research studies have shown that the type of lipids, surfactants,and additivesused can affect the physicochemical characteristics of the resultant SLMs (Kheradmandnia et al., 2010; Pietkiewicz & Sznitowska, 2004; Sznitowska et al., 2017; Wolska & Sznitowska, 2013). Beeswax is one of the lipids commonly used in SLM preparation. It consists mainly of esters of long chain fatty acids and alcohols (C24-C36)and smallquantitiesof hydrocarbons,acidsand othersubstances(Bogdanov,2004;Tulloch, 1980;Tulloch& Hoffman,1972).SLMmadeofbeeswaxwassuccessfullydevelopedastopicalcarriers for octyl methoxy cinnamate (OMC) (Yener et al., 2003), vitamin E (Souza et al., 2020) There are several types of surfactants used as stabilizers in SLM preparation, such as polysorbate 80 (tween 80), poloxamer 188 and lecithin (Jaspart et al., 2005). In 2017, Sznitowska et al. suggested that the type of surfactants used had an effect on the particle size and viscosity of the resultant SLM dispersions (Sznitowska et al., 2017) Therefore, the aim of this study is to examine the effects of different types of surfactants (tween 80, poloxamer 188, soybean lecithin) on the physicochemical characteristics of asiatic acid loaded in SLMs (AASLMs) prepared from beeswax.
2. Materials and Methods
2.1 Materials
Asiatic acid (95%) was obtained from SEPPIC, France. Beeswax was obtained from Kahl, (Germany), tween 80 (polysorbate 80) was purchased from Panreac applichem (Darmstadt, Germany), soybean lecithin from Merck (Germany), poloxamer 188 from BASF (Germany). All other chemicals used were of an analytical reagent grade.
2.2 Preparation of AA-SLMs
Briefly, AA was dissolved in ethanol, in ratio 0.01 g: 1.5 ml, and the solution was then added to the melted lipid phase (the melting temperature depending on the lipid used). The hot lipid mixture was then emulsified into an aqueous surfactant solution that was heated above the lipid melting point to produce the O/W emulsion. The emulsion, which is obtained by mixing with a high shear device (UltraTurrax® [IKA]) at 8000 rpm for 5 min, is finally allowed to cool in an ice bath (Wolska & Sznitowska, 2013) Then, the AASLMs is placed into a freeze-dryer (Labconco Lyophilizer, USA) (Zhang et al., 2008) to make a dry powder. The formulations of asiatic acid loaded SLMs are shown in Table 1. Freeze-drying was equipped with the condenser operating at -50 °C and a chamber with cooled shelves. The freeze-drying was conducted at a pressure of 5.0 Pa and the process lasted for 24 hours to allow a complete solidification. Dextrose anhydrous (5% w/w) was used as the cryoprotectant for the freeze-
Witarat et al CA4 Page 46
drying process of AASLMs (Zhang et al., 2008)
2.3 Morphological analysis
The shapes of AASLMs before freeze-drying and after re-dispersion were inspected by using the optical microscope (Nikon Coolpix 5400, Nikon Corporation, Japan). The surface morphology of AASLMs was examined by scanning electron microscope (SEM). The samples were prepared by using cotton swabs to scoop and distribute the AASLMs powder onto the specimen stub fixed with doublesided tape. A rubber ball was used to blow away dust or non-stick particles The specimen was then photographed under the SEM (JEOL JSM-6610LV, Tokyo, Japan) (Rahimpour et al., 2016)
2.4 Particle size analysis
The particle size was measured by static automated imaging technique (Morphologi 4, Malvern Panalytical, Germany). The AASLMs powder was put in a dispersed chamber and then placed inside the instrument operated at a pressure of 4 bar to disperse a sample on a quartz glass slide. All measurements were done in triplicate and data were expressed as means ± SD. The size was expressed by the circle equivalent (CE) diameter.
2.5 Entrapment efficiency and active loading
Briefly, 8ml ofthe AASLM dispersion obtained at the end ofthe preparation method (before freezedrying) was ultracentrifuged (Hitachi CP100NX ultracentrifugation, Japan) at 65,000 rpm for 1.5 hours at 4 °C. Then, 1 ml of supernatant (free active) was collected and filtered through 0.45 µm syringe filter and assayed by HPLC at 210 nm. In addition, the sediment was extracted by using methanol and adjusted the final volume to 5 ml 1 ml of obtaining mixture was then filtered through 0.45 µm syringe filter and subjected to HPLC analysis. The percentage of entrapment efficiency and active loading were calculated by the following equations:
% Entrapment efficiency (EE) = (W total active – W free active) x 100 (1) W total active
% Active loading (Al) = (W total active – W free active) x 100 (2) W lipid
where W total active is total amount of AA added to the system, W free active is the analyzed amount of free active and W lipid is the weight of the lipid phase. The values were averaged on three determinations (Rahimpour et al., 2016)
%Labeled amount of AA in SLMs was calculated by equations below:
%Labeled amount = (Amount of AA in the sediment + Amount of free AA in the supernatant) x 100 (3) (Total amount of AA used)
Note: acceptable standard range of %labeledamount is85-115% for topical drugs (USP27,2004:2396).
2.6 Statistical analysis
All experiments were performed in triplicates (n = 3) for validity of statistical analysis. Results were expressed as mean ± SD. The statistical variance was calculated by One-way ANOVA, comparison of each group by Tukey HSD test and the differences were considered significant for p value ≤ 0.05.
3.Results and Discussion
3.1 Preparation of AASLMs powder
AASLMs were fabricated by the melt dispersion technique (Chalella Mazzocato et al., 2019; Sznitowska et al., 2017; Wolska & Sznitowska, 2013; Yadav et al., 2009; Zhang et al., 2008) in conjunction with freeze-drying, in order to obtain water-free solid particles. Beeswax, at concentrations of 10 and 15%, was chosen as lipid component and three different surfactants, namely tween 80, soybean lecithin, and poloxamer 188 were used as stabilizers According to the results shown in Table 1 and Figure 1, the AASLM prepared from 10% or 15% beeswax with 3% soybean lecithin (B2 and B5) could not yield a dry powder form, whereas those with tween 80 or poloxamer 188 (B1, B3, B4, and B6) appeared as white to slightly yellowish coarse powders The color of AASLMs was not
Witarat et al CA4 Page 47
significantly affected by the type of surfactant The physical appearances of the obtaining powders could be attributed to the unique characteristics of beeswax (Bogdanov, 2004) In addition, the pH values of all formulations ranged from 5.0 to 5.5 which were compatible with human skin (pH 4-6) (Klee et al., 2009; Lambers et al., 2006) The formulas B1, B3, B4 and B6 were selected for further study.
L


3.2 Morphological analysis
The morphology of AASLM dispersions before freeze-drying and after redispersion of the freezedried powder observed under the optical microscope with a magnification of 100x was shown in Figure 2.In all the dispersions, the AASLM prepared from 10% or 15% beeswax with 3% poloxamer 188 (B3 and B6) had spherical particle shape (Figure 2(f) and (h)), whereas those prepared from 10% or 15% beeswax with 3% tween 80 (B1 and B4) seemed to have irregular particle shape (Figure 2(e) and (g)) This may be because P188 can effectively reduce the surface tension between the lipid phase and the aqueous phase during emulsification, resulting in a spherical particle shape Moreover, the steric effect of P188 could prevent a droplet agglomeration (Hariyadi et al., 2022; Rosita et al., 2019) hence the AASLMs stabilized by P188 (B3 and B6) showed comparable particle shape before and after freezedrying On the contrary, tween 80 (Tw80) may not be able to effectively reduce the surface tension between the aqueous phase and the lipid phase during emulsification, resulting in irregular particle shape of AASLMs stabilized by Tw80 The results demonstrated that the type of surfactants used could affect the particle shape of the AASLMs.
The SEM images of formulas B3 and B6 powders were then subsequently characterized. It was found that the surface morphology of B3 and B6 powders was not spherical in shape (Figure 3). This finding was in agreement with previous studies which reported that the SLM powder produced by freeze-drying process had non-spherical and agglomerated morphology (Alihosseini et al., 2015; Mudrić et al., 2021; Owuor et al., 2017). The particle agglomeration has a positive effect on flow characteristic of particles and decreasing dust formation (Barbosa-Cánovas et al., 2005; Paucar et al., 2016).
Witarat et al CA4 Page 48
Formula Lipids (g) Surfactants (g) pH Appearance Beeswax Tw80 L P188 before freeze-drying after freeze-drying B1 10 3 - - 5 Liquid/ Crystallization White to light yellow coarse powder B2 10 - 3 - 5 Liquid/ Crystallization Light yellow, sticky lump B3 10 - - 3 5.5 Liquid/ Crystallization White to light yellow coarse powder B4 15 3 - - 5 Liquid/ Crystallization White to light yellow coarse powder B5 15 - 3 - 5 Liquid/ Crystallization Light yellow, sticky lump B6 15 - - 3 5.5 Liquid/ Crystallization White to light yellow coarse powder
Table 1 The physicochemical characteristics of asiatic acid loaded in SLMs formulations.
= Lecithin,
Poloxamer188,
P188 =
Tw80 = Tween80
Figure 1 The AASLMs prepared from 10% Beeswax: Tw80 (B1), 10% Beeswax: P188 (B3), 15% Beeswax: Tw80 (B4) and 15% Beeswax: P188 (B6)
B1 B3 B4 B6
(B6) and after freeze-drying; (e) 10% Beeswax: Tw80 (B1), (f) 10% Beeswax: P188 (B3), (g) 15% Beeswax: Tw80 (B4), (h) 15% Beeswax: P188 (B6)
(B6).


3.3 Particle size analysis
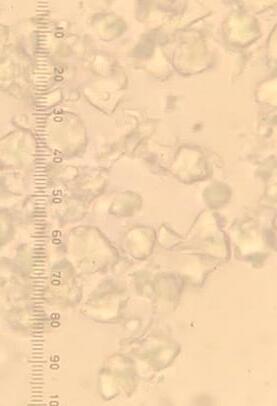
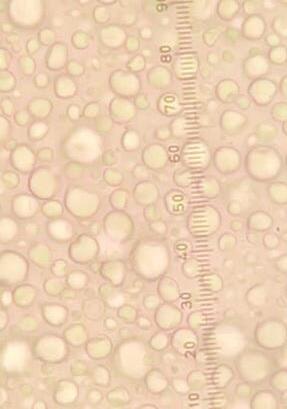
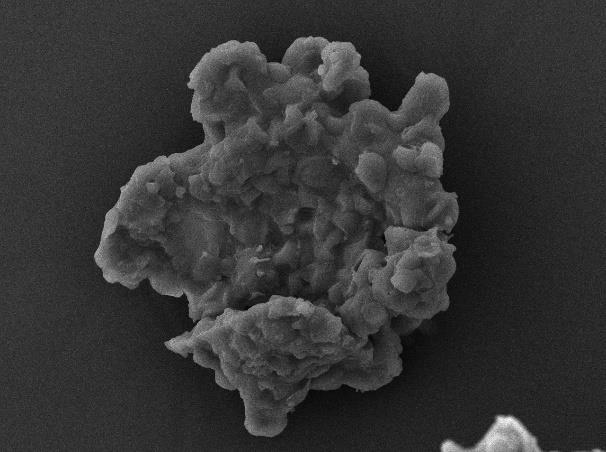
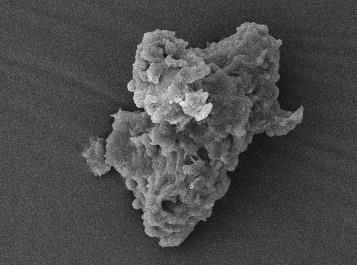
As shown in Table 2, the particle size of the AASLMs powder stabilized by Tw80 (B1, B4) was significantly larger than those stabilized by P188 (B3, B6). The stearic barrier provided by poloxamer may prevent an aggregation of SLM particles leading to a smaller particle size. The results suggested that the type of surfactants used had an effect on the particle size of the resultant AASLMs powder. In addition,there was no straight correlationbetween the size of SLMs and the amount of solid lipid used. The particlesize of all formulationswas in acceptable range (micronsize) for topical application (Üner & Karaman, 2013)
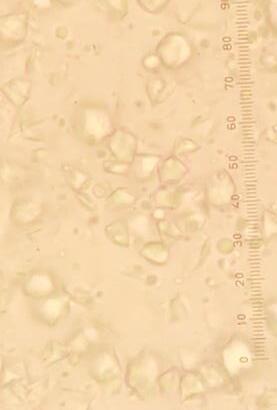
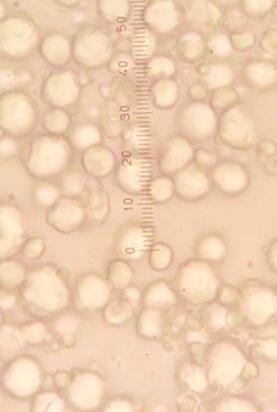
Witarat et al CA4 Page 49
Figure 2 The optical microscope images of AASLMs formulations, before freeze-drying; (a) 10% Beeswax: Tw80 (B1), (b) 10% Beeswax: P188 (B3), (c) 15% Beeswax: Tw80 (B4), (d) 15% Beeswax: P188
Figure 3 Scanning electron microscope images of AASLMs formulations; 10% Beeswax: P188 (B3) and 15% Beeswax: P188
B6 10µm 10µm B3 b g h e f a c d
Table 2 Particle size (µm) of obtaining AASLM powders
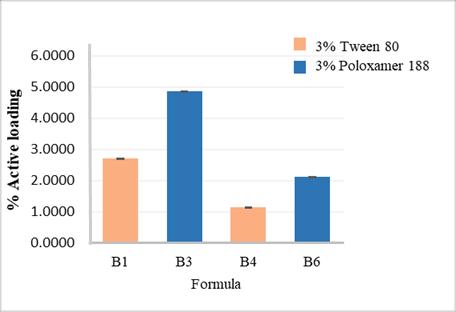
The * symbol represents significant difference (p < 0.05), N/A is not applicable.
3.4 Entrapment efficiency and active loading
The entrapment efficiency (EE) and active loading (AL) of resultant AASLM powders were shown in Figure 4 and 5, respectively AASLMs stabilized by P188 (B3 and B6) gave higher %entrapment efficiency (%EE) and %active loading (%AL) than those stabilized by Tw80 (B1 and B4) (p < 0.05) This may be because P188 could immobilize the solid lipid system and improve solubility of poorly water soluble drug resulting in lower drug expulsion (Shah & Serajuddin, 2012). Previous study had also demonstrated that the solid lipid microparticle stabilized by poloxamer 188 had high entrapment efficiency of poorly water soluble substance (Hariyadi et al., 2022). The %labeled amount of all AASLMs formulations were in the range of 90.43±0.02 to 90.69±0.02%, which was considered acceptable for topical products (convention, 2004).
Furthermore, the higher concentration of solid lipid (15%) used in B3 and B6 compared to those of B1 and B4 (10%) could have attributed to greater %EE and %AL. The results indicated that the amount of lipid used had an impact on the entrapment efficiency and active loading of AASLMs.
4.Conclusion
This study indicated that the type of surfactant used in AASLMs preparation could significantly affect the physicochemical properties including morphology, particle size, %EE and %AL of the resultant AASLMs, whereas the amount of solid lipid used could influence the entrapment efficiency and active loading of the AASLMs. In addition, it was identified that the AASLM prepared with poloxamer 188 has the greatest potential among the test formulations as a topical carrier for AA due to its high %EE and %AL. Further studies should be conducted to explore its utilization in cosmetics.
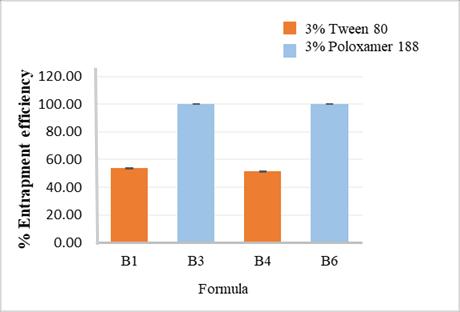
5.Acknowledgements
This research was funded by the Temasek Foundation National University of Singapore STEM for University Educators Programme in ASEAN. The authors are grateful to the Department of Pharmacy, National University of Singapore and Department of Pharmaceutics and Industrial Pharmacy, Faculty
Witarat et al CA4 Page 50
Formula Particle size (µm) B1 38.86 ± 0.34* B2 N/A B3 14.15 ± 0.11* B4 30.67 ± 0.27* B5 N/A
16.87
B6
± 0.15*
Figure 5 %Active loading of asiatic acid solid lipid microparticles.
Figure 4 %Entrapment efficiency of asiatic acid solid lipid microparticles
of Pharmaceutical Sciences, Chulalongkorn University for their support.
6.References
Alihosseini, F., Ghaffari, S., Dabirsiaghi, A., & Haghighat, S. (2015, 12/01). Freeze-drying of ampicillin solid lipid nanoparticles using mannitol as cryoprotectant. Brazilian Journal of Pharmaceutical Sciences, 51, 797-802. https://doi.org/10.1590/S1984-82502015000400005
Barbosa-Cánovas, G., Ortega-Rivas, E., Juliano, P., & Yan, H. (2005). Food Powders: Physical Properties, Processing, and Functionality https://doi.org/10.1007/0-387-27613-0
Bogdanov, S. (2004, 2004/01/01). Beeswax: quality issues today. Bee World, 85(3), 46-50. https://doi.org/10.1080/0005772X.2004.11099623
Borhan, M. Z., Ahmad, R., Rusop, M., & Abdullah, S. (2013, 09/02). Green Extraction: Enhanced Extraction Yield of Asiatic Acid from Centella asiatica (L.) Nanopowders. Journal of Applied Chemistry, 2013, 1-7. https://doi.org/10.1155/2013/460168
Chalella Mazzocato, M., Thomazini, M., & Favaro-Trindade, C. S. (2019, 2019/12/01/). Improving stability of vitamin B12 (Cyanocobalamin) using microencapsulation by spray chilling technique. Food Research International, 126, 108663.
https://doi.org/https://doi.org/10.1016/j.foodres.2019.108663
Chen, X., Zhang, Y., Zhao,P., Chen, Y., Zhou, Y.,Wang, S.,& Yin,L. (2020,2020/01/02).Preparation and evaluation of PEGylated asiatic acid nanostructured lipid carriers on anti-fibrosis effects. Drug Development and Industrial Pharmacy, 46(1), 57-69.
https://doi.org/10.1080/03639045.2019.1701002
convention, U. S. p. (2004). USP 27: The United States Pharmacopeia, 27. Revision ; NF 22 : the National Formulary, 22. Ed. Supplement. USPC.
https://books.google.co.th/books?id=J10_swEACAAJ
Djoukeng, J. D., Abou-Mansour, E., Tabacchi, R., Tapondjou, A. L., Bouda, H., & Lontsi, D. (2005, 2005/10/03/). Antibacterial triterpenes from Syzygium guineense (Myrtaceae). Journal of Ethnopharmacology, 101(1), 283-286.
https://doi.org/https://doi.org/10.1016/j.jep.2005.05.008
Hariyadi, D., Prestisya, I., Suhariyono, G., Miatmoko, A., Rosita, N., & Rahmadi, M. (2022, 03/10). Characterization of dry powder inhaler quercetin solid lipid microparticle (SLM) as lung delivery system: Effect of polymer concentration. Egyptian Journal of Chemistry.
https://doi.org/10.21608/ejchem.2022.120170.5393
Huang, S.-H., Chiu, C.-S., Chen, H.-J., Hou, W.-C., Sheu, M.-J., Lin, Y.-C., Shie, P.-H., & Huang, G. J.(2011, 04/20). Antinociceptive Activities and the Mechanisms of Anti-Inflammation of Asiatic Acid in Mice. Evidence-based complementary and alternative medicine : eCAM, 2011, 895857.
https://doi.org/10.1155/2011/895857
Jaspart, S., Piel, G., Delattre, L., & Evrard, B. (2005, 2005/01/01). Solid lipid microparticles: formulation, preparation, characterisation, drug release and applications. Expert opinion on drug delivery, 2(1), 75-87.
https://doi.org/10.1517/17425247.2.1.75
Kheradmandnia, S., Vasheghani-Farahani, E., Nosrati, M., & Atyabi, F. (2010, 2010/12/01/).
Preparation and characterization of ketoprofen-loaded solid lipid nanoparticles made from beeswax and carnauba wax. Nanomedicine: Nanotechnology, Biology and Medicine, 6(6), 753759. https://doi.org/https://doi.org/10.1016/j.nano.2010.06.003
Khunathum, P. (2011). Development of Asiatic acid solid lipid nanoparticle for nasal delivery Chulalongkorn university.
Klee, S. K., Farwick, M., & Lersch, P. (2009, 2009/04/15/). Triggered release of sensitive active ingredients upon response to the skin's natural pH. Colloids and Surfaces A: Physicochemical
Witarat et al CA4 Page 51
and Engineering Aspects, 338(1), 162-166. https://doi.org/https://doi.org/10.1016/j.colsurfa.2008.11.035
Lambers, H., Piessens, S., Bloem, A., Pronk, H., & Finkel, P. (2006, Oct). Natural skin surface pH is on average below 5, which is beneficial for its resident flora. International journal of cosmetic science, 28(5), 359-370. https://doi.org/10.1111/j.1467-2494.2006.00344.x
Liu, W. H., Liu, T. C., & Mong, M. C. (2015, Sep). Antibacterial effects and action modes of asiatic acid [Article]. Biomedicine-Taiwan, 5(3), 22-29. https://doi.org/10.7603/s40681-015-0016-7
Long, C., Zhang, L., & Qian, Y. (2006). Preparation and crystal modification of ibuprofen-loaded solid lipid microparticles [Article]. Chinese Journal of Chemical Engineering, 14(4), 518-525. https://doi.org/10.1016/S1004-9541(06)60107-9
Lv, H., Qi, Z., Wang, S., Feng, H., Deng, X., & Ci, X. (2017, 2017-July-07). Asiatic Acid Exhibits Anti-inflammatory and Antioxidant Activities against Lipopolysaccharide and dGalactosamine-Induced Fulminant Hepatic Failure [Original Research]. Frontiers in Immunology, 8(785). https://doi.org/10.3389/fimmu.2017.00785
Lv, J. W., Sharma, A., Zhang, T., Wu, Y. C., & Ding, X. T. (2018, Apr). Pharmacological Review on Asiatic Acid and Its Derivatives: A Potential Compound [Review]. Slas Technology, 23(2), 111-127.
https://doi.org/10.1177/2472630317751840
Mudrić, J., Šavikin, K., Đekić, L., Pavlović, S., Kurćubić, I., Ibrić, S., & Đuriš, J. (2021). Development of Lipid-Based Gastroretentive Delivery System for Gentian Extract by Double Emulsion–Melt Dispersion Technique. Pharmaceutics, 13(12), 2095.
https://www.mdpi.com/1999-4923/13/12/2095
Owuor, J. J., Oloo, F. A., Ouma, D., Omwoyo, W., & Gathirwa, J. (2017). Optimization and characterization of primaquine–loaded solid lipid nanoparticles (SLN) for liver schinonticide targeting by freeze drying.
Pardeike,J.,Hommoss,A.,&Muller,R.H.(2009,Jan21).Lipidnanoparticles(SLN,NLC)incosmetic and pharmaceutical dermal products. International Journal of Pharmaceutics, 366(1-2), 170184. https://doi.org/10.1016/j.ijpharm.2008.10.003
Paucar, O. C., Tulini, F. L., Thomazini, M., Balieiro, J. C. C., Pallone, E. M. J. A., & Favaro-Trindade, C.S. (2016, 2016/10/01/). Production by spray chilling and characterization of solid lipid microparticles loaded with vitamin D3. Food and Bioproducts Processing, 100, 344-350. https://doi.org/https://doi.org/10.1016/j.fbp.2016.08.006
Pietkiewicz, J., & Sznitowska, M. (2004, Apr). The choice of lipids and surfactants for injectable extravenous microspheres. Pharmazie, 59(4), 325-326.
Pojanaukij, N., & Kajorncheappunngam, S. (2010). Comparison of antimicrobial activity of Mangosteen crude, Turmeric and Gotu Kola extract. Naresuan University Journal, 18(1), 1-9.
Puttarak, P., & Panichayupakaranant, P. (2012, Dec). Factors affecting the content of pentacyclic triterpenes in Centella asiatica raw materials. Pharmaceutical Biology, 50(12), 1508-1512.
https://doi.org/10.3109/13880209.2012.685946
Rafat, M., Fong, K. W., Goldsipe, A., Stephenson, B. C., Coradetti, S. T., Sambandan, T. G., Sinskey, A.J., & Rha, C. (2008, 2008/09/15/). Association (micellization) and partitioning of aglycon triterpenoids. Journal of Colloid and Interface Science, 325(2), 324-330.
https://doi.org/https://doi.org/10.1016/j.jcis.2008.05.046
Rahimpour, Y., Javadzadeh, Y., & Hamishehkar, H. (2016, 2016/09/01/). Solid lipid microparticles for enhanced dermal delivery of tetracycline HCl. Colloids and Surfaces B: Biointerfaces, 145, 1420.
https://doi.org/https://doi.org/10.1016/j.colsurfb.2016.04.034
Witarat et al CA4 Page 52
Rosita, N., A'Yunin, Q., & Hendradi, E. (2019, 01/01). Characters of Solid Lipid Nano Particle (SLN)
Ubiquinone (Q10) with Different Types of Cosurfactants: Poloxamer 188, Lecithin, Propylene Glycol. 6, 17.
Shah, A., & Serajuddin, A. (2012, 02/28). Development of Solid Self-Emulsifying Drug Delivery System (SEDDS) I: Use of Poloxamer 188 as Both Solidifying and Emulsifying Agent for Lipids. Pharmaceutical Research, 29, 2817-2832. https://doi.org/10.1007/s11095-012-0704-x
Souza, I., Saez, V., Campos, V., Nascimento, M., & Mansur, C. (2020, 01/01). Multiple Response Optimization of Beeswax-Based Nanostructured Lipid Carriers for the Controlled Release of Vitamin E. Journal of nanoscience and nanotechnology, 20, 31-41.
https://doi.org/10.1166/jnn.2020.16875
Sznitowska, M., Wolska, E., Baranska, H., Cal, K., & Pietkiewicz, J. (2017, Jan). The effect of a lipid composition and a surfactant on the characteristics of the solid lipid microspheres and nanospheres (SLM and SLN) [Article]. European Journal of Pharmaceutics and Biopharmaceutics, 110, 24-30.
https://doi.org/10.1016/j.ejpb.2016.10.023
Thakor, F. K., Wan, K.-W., Welsby, P. J., & Welsby, G. (2017, 2017/06/01). Pharmacological effects of asiatic acid in glioblastoma cells under hypoxia. Molecular and Cellular Biochemistry, 430(1), 179-190. https://doi.org/10.1007/s11010-017-2965-5
Tulloch, A. P. (1980, 1980/01/01). Beeswax Composition and Analysis. Bee World, 61(2), 47-62.
https://doi.org/10.1080/0005772X.1980.11097776
Tulloch, A. P., & Hoffman, L. L. (1972, 1972/12/01). Canadian beeswax: Analytical values and composition of hydrocarbons, free acids and long chain esters. Journal of the American Oil Chemists Society, 49(12), 696-699. https://doi.org/10.1007/BF02609202
Üner, M., & Karaman, E. F. (2013, 06/26). Preliminary Studies on Solid Lipid Microparticles of Loratadine for the Treatment of Allergic Reactions via the Nasal Route. Tropical Journal of Pharmaceutical Research, 12 https://doi.org/10.4314/tjpr.v12i3.2
Wolska, E., & Sznitowska, M. (2013, 2013/01/30/). Technology of stable, prolonged-release eye-drops containing Cyclosporine A, distributed between lipid matrix and surface of the solid lipid microspheres (SLM). International Journal of Pharmaceutics, 441(1), 449-457.
https://doi.org/https://doi.org/10.1016/j.ijpharm.2012.11.009
Yadav, V. R., Suresh, S., Devi, K., & Yadav, S. (2009, Mar). Novel formulation of solid lipid microparticles of curcumin for anti-angiogenic and anti-inflammatory activity for optimization of therapy of inflammatory bowel disease. Journal Pharm Pharmacol, 61(3), 311-321.
https://doi.org/10.1211/jpp/61.03.0005
Yener, G.,Incegul, T.,& Yener,N. (2003,Jun). Importanceofusing solidlipidmicrospheres as carriers for UV filters on the example octyl methoxy cinnamate [Article]. International Journal of Pharmaceutics, 258(1-2), 203-207. https://doi.org/10.1016/s0378-5173(03)00203-5
Yun, K.-J., Kim, J.-Y., Kim, J.-B., Lee, K.-W., Jeong, S.-Y., Park, H.-J., Jung, H.-J., Cho, Y.-W., Yun, K., & Lee, K.-T. (2008, 2008/03/01/). Inhibition of LPS-induced NO and PGE2 production by asiatic acid via NF-κB inactivation in RAW 264.7 macrophages: Possible involvement of the IKK and MAPK pathways. International Immunopharmacology, 8(3), 431-441.
https://doi.org/https://doi.org/10.1016/j.intimp.2007.11.003
Zhang, L., Liu, L., Qian, Y., & Chen, Y. (2008, 2008/06/01/). The effects of cryoprotectants on the freeze-drying of ibuprofen-loaded solid lipid microparticles (SLM). European Journal of Pharmaceutics and Biopharmaceutics, 69(2), 750-759.
https://doi.org/https://doi.org/10.1016/j.ejpb.2007.12.003
Witarat et al CA4 Page 53
–
Witarat et al CA4 Page 54
Bioactive chemical constituents from the rhizome of black galingale
Penpicha Poomjuntuek1, Chanikarn Sonklin1, Siriporn Pranee2 and Samitthichai Seeyangnok1*
1 Department of Industrial Chemistry, Faculty of Applied Science, King Mongkut's University of Technology North Bangkok 10800, Thailand
2 Department of Veterinary Technology, Faculty of Veterinary Technology, Kasetsart University, Thailand
*Corresponding author. Email: samitthichai.s@sci.kmutnb.ac.th
Abstract
Krachai-Dam (KD), also known as black galingale (Kaempferia parviflora), is an herbaceous plant. The rhizomes of black galingale are the source of bioactive compounds with pharmacological effects, including anti-inflammatory and antivirus properties. The black galingale possesses intriguing cosmetic qualities, including antibacterial and anti-aging antioxidant capabilities. The solvent system was optimized using column chromatography to separate compounds AandB from theblack galingalecrude extract. Thefundamental chemical components of the isolated substances from this study were identified utilizing FT-IR, GC-MS, 1H-NMR and 13C-NMR Spectroscopy methods. Antioxidant activity was present in all sample series. The FT-IR spectral data of the identified compound A showed a unique vibration band at 3470 cm-1, 3068 cm-1, and 1608 cm-1 corresponding to an OH stretching, CH stretching of an alkene (C=C-H), and C=C stretching. The GC-MS chromatogram showed m/z at 298 matching the molecular formula of C17H14O5. The FT-IR spectral data of compound B was similar to that of compound A, and the m/z ion peak at 327 was indicated to be C18H16O6 Moreover, the antioxidation properties of compounds A and B were examined by the ABTS assay at a concentration of 1 g/mL. The ABTS radical cation scavenging activity of both compounds were reported to be at 98.36% and 96.88% of the antioxidant activity of compound A and compound B, respectively Compared to Trolox, where 238.11±2.58 mM Trolox Equivalent (TE)/g sample and 233.5 ± 32.87 mM. The stable black galingale extract nanoemulsion was prepared using 10%w tween 80 as a surfactant. The particle size of the nanoemulsion was 27.63±0.86 nm
Keywords: Kaempferia parviflora, Flavonoids, Zingiberaceae, Column Chromatography
1. Introduction
Black galingale (pronunciation) is a medicinal plant. Its scientific name is kaempferria parviflora Wall. Ex Baker, and it is a member of this plant family. Zingiberaceae is native to Thailand, Laos, Myanmar, India, and South Asia of China, and includes ginger, galangal, turmeric, sapphire, and white ginseng. It is common in Thailand's forests and at the foot of mountains. It is found primarily in Loei, Phitsanulok, Phetchabun Nan, and Kanchanaburi. Tak, Chiang Mai, and Chiang Rai are all popular touristdestinations.Ban KhekNoi,Khao Kho District,PhetchabunProvinceishometothewell-known Krachai Dam. Thailand's black ginger is of high quality and has many beneficial medicinal properties. According to Thai textbooks, black ginger is a type of herbal medicine that improves sexual function, helps to drive away wind, stimulates appetite, relieves heartburn, and relieves flatulence. It can also help to prevent skin aging caused by UV rays[1] As a result, it is known as Thai ginseng. Currently,
CA5 Page 55
Proceeding of Cosmetic & Beauty International Conference 2022 Future of the Next Beauty (CBIC 2022) 7th-9th December 2022
black ginseng is processed into a variety of products. Dry black ginger, powdered black ginger, tea, black ginger wine, energy drinks, and so on[2]
Black galingale anatomy
KD is a plant that belongs to the same species as yellow galingale, which is a plant that is utilized in culinary applications. The useful part is the root or tuber that is underground in the soil. The height of the stem comes in at roughly 90 centimetres a solid core that is wrapped in a leaf sheath and located in the middle of the stem. The fragrance of the leaves is very enticing. The petiole emerges from the ground near the head, the leaves are seven to nine centimetres long, and the flowers are thirty to thirtyfive centimetres in length. Rhizomes are characterizedby their spherical shape and linear arrangement. Rhizome skin can range in color from very light brown to extremely dark brown. Black galingale rhizomes have an interior color that ranges from mild to dark purple. The many hues of the rhizome were used by growers and purchasers to classify the commodity and set pricing.
Phytochemical composition of Black galingale rhizome
Phytochemicals of black galingale extract were studied. Natural products including anthocyanins and flavonoids were reported [3]. In addition, phenolic compounds [4] with antimicrobial activity such as Borneol and Sylvestrene were present. Active ingredients belonging to flavonoids include 5,7dimethoxyflavone (DMF), 5,7,4'-trimethoxyflavone (TMF), and 4'-pentamethoxyflavone (PMF) [5].
Black galingale in cosmetic
Polymethoxyflavones isolated from Black galingale rhizomes have potential anti-aging activities by promoting collagen, fibrillin, and hyaluronic acid synthesis under the skin and inhibiting reactive oxygen species (ROS) release and cellular senescence. Additionally, the flavonoid and terpene compounds from the rhizomes have antioxidant activity and showed inhibitionof tartrate-resistant acid phosphatases (TRAP) with 16.97±1.02 to 64.67±2.76% and exhibited peroxyl radical scavenging capacitywith8.47±0.52μM [2].Also, K. parviflora hasanti-inflammatoryactivity.The ethanolextract of K. parviflora inhibited PGE2 release with an IC50 value of 9.2 μg/ml [6].
2. Materials and Methods
2.1 Materials
2,2-azino-bis-3-ethylbenzothiazoline-6-sulfonic acid (ABTS), 2,2'-diphenyl-1-picrylhydrazyl (DPPH), and Trolox were purchased from Sigma Chemical Co. Ethyl acetate All other chemicalsused, including solvents, were of analytical grade. Black Galingale Rhizome was purchased from the Siang Adisorn market at Lom sak Distric, Phetchabun Province.
2.1 Preparation of samples
The air-dried black galingale rhizomes were collected from Phetchabun province. Cut into small pieces or grind finely. The ethyl acetate extract [7] was filtered and concentrated Under reduced pressure using a rotary evaporator.
2.2 Column Chromatography
Based on TLC analysis, the filtrated ethyl acetate extract (133.65 g) was chromatographed on a silica gel column (9.0 x 120 cm, silica gel, 100-200 mesh, 1500 g) and progressively rinsed with hexane/ethyl acetate (100:0, 98:2, 95:5, 90:10, 80:20, 70:30, 60:40, 50:50
2.3 Spectroscopic analysis
Extracts of KD were subjected to thin layer chromatography (TLC) using solvent systems Hexane: Ethyl acetate (80:20) UV-Vis spectrophotometry (range 200-600 nm) was used to check the presence of flavonoids. Fine powder extract was mixed with Potassium bromide (FT-IR grade) in a ratio of 1 mg:10 mg The powdered sample was loaded in Fourier Transform Infrared Spectrometer (FT-IR) (Shimadzu, IR affinity 1S) to detect the characteristic peaks and functional groups in the range of 4004000 cm-1. GC-MS with helium carrier gas at 36 cm/s, were used in the GC/MS experiments. experiments were carried out. At 50 cm/s, GC with hydrogen carrier. All injections were carried out in the split modewith a 20split ratio Thetemperatureofthe injector The detector or interface temperature
Poomjuntuk et al CA5 Page 56
was 310°C, while the ambient temperature was 280°C. At 310°C, retention measurements were taken isothermally. Standard hydrocarbons range from C20 to C40-[8] 1H NMR and 13C NMR spectra were recordedinMeOH-d4 at 25°C on a Bruker AMX 300 spectrometer (Karlsruhe, Germany; 1 H 400 MHz; 13C 400 MHz)- were performed on a Bruker Ascend 400 spectrometer. Chemical shifts (��) are reported in ppm relative to the residual solvent signals
2.4 Black galingale rhizome extract nanoemulsion preparation
Black galingate rhizome extract was dissolved in DMDiol (80% Methylpropanediol 20% Decane1,2-diol) as oil phase. Tween 80 (T80) as surfactant was mixed in aqueous phase with various ratios (2.5 – 10 %w). Aqueous phase was poured into oil phase using homogenizer at 8000 rpm for 30 min. Black galingale rhizome nanoemulsion was keep in room temperature.
2.5 Antioxidant activity
2.5.1 2,2-diphenyl-1-picryhydrazyl (DPPH) radical scavenging activity
The extracts’ DPPH free radical scavenging activity was tested following our earlier findings [9]. In brief,a DPPH (0.1mM) solutioninmethanolwasproduced,and1 mL wasappliedtovariedamounts of extract sample (1.0 mL). The mixture was rapidly mixed and incubated in the dark for 30 minutes. At 517 nm, the absorbance was measured by UV-Vis In the control, methanol was used in place of the sample. The inhibitory ratio (%) was obtained using the equation:
Inhibition percentage (I%) = Abscontrol Abssample
Abscontrol ×100
All determinations were made in triplicate and were determined to be repeatable within the range
2.5.2
2,2’-azino-bis(3-ethylbenzthiazoline-6-sulphonicacid)(ABTS) radical cationdecolorization assay
The ABTS test was conducted based on prior conclusions [10]. In ultrapure water, an ABTS solution (7 mM) was combined with potassium persulfate(2.45 mM). The combinationwas kept in the dark for 12 hours before application. The addition of 500 L extract samples of various strengths to appropriately diluted ABTS solutions was completed by a 6-minute measurement of the absorbance at 734 nm. Methanol was utilized as the control in place of the sample. Following is how the inhibition percentage (I%) was calculated:
Inhibition percentage (I%) = Abscontrol Abssample Abscontrol ×100
The experiments were repeated three times with comparable results.
3. Results and discussion
3.1 Physical characteristics and spectral data
The chemical structures of two isolated flavones were determined using UV-Vis, FT-IR, GC, and 1H-NMR, 13C-NMR spectroscopy. The flavone structures were known compounds previously isolated. In this study, their antioxidant properties were determined.
3-Hydroxy-5,7-dimethoxyflavone (A): Yellow amorphous powder, mp. 166-169 °C, GCMS m/z 298, RT (min) 38.11; UV (EAC, ��max): 274, 298, 350 nm; IR (KBr, ��) 3072, 2843, 2360, 1605, 1155, 830, 766 cm-1: 1H-NMR (CDCl3, 400 MHz, ��H ppm) and 13C-NMR (CDCl3, 400 MHz, ��C ppm) see Table 1.
5-Hydroxy-3,7,4’-trimethoxyflavone (B): Yellow amorphous powder mp. 145-147 °C, GC-MS 329 m/z, RT (min) 40.47; UV (EAC, ��max): 269, 319, 348 nm; IR (KBr, ��) 3434, 3072, 2843, 1623, 1148, 833 cm-1:1H-NMR (CDCl3, 400 MHz, ��H ppm) and 13C-NMR (CDCl3, 400 MHz, ��C ppm) see Table 1.
3.2 Antioxidant activity
The antioxidant activity of natural compounds was evaluated using DPPH (2,2-diphenhydramine-
Poomjuntuk et al CA5 Page 57
Compound Characterizations
1H NMR(CDCl3): �� 3.87(6H, S, OCH3) 3.92(3H, S, OCH3), 6.36(1H, d ), 6.45(1H, d),7.51 (3H, m), 8.07(2H, m) 12.59 (1H, S, OH);
13C-NMR(CDCl3): �� 55.96, 60.53, 92.34, 98.09, 106.33, 128.53, 128.75, 130.61, 131.08, 139.82, 156.05, 157.04, 162.17, 165.71,175.92 179.09
3-Hydroxy-5,7-dimethoxyflavone
5-Hydroxy-3,7,4’-trimethoxyflavone
1H NMR(CDCl3): �� 3.86 (6H,S, OCH3) 3.87(3H, S, OCH3), 6.35(1H, d), 6.44(1H, d),7.03(2H, d), 8.09(2H, d) 12.73(1H, S, OH);
13C-NMR(CDCl3): ��
1-picrylhydrazy) and ABTS (2,2,-azino-bis (3-ethylbenzhiazoline-6-sulphonic acid)) assays. DPPH scavenging assays are simple assays for evaluating the antioxidant capacity of the compound [11]. The antioxidant activity of the ethyl acetate extract of KD was determined by its antioxidants' ability to inhibit oxidation. All fractions were evaluated for their antioxidant activities at the concentrations of 0.0001 µg/mL and 2.0 µg/mL. The ethyl acetate extract and a fraction showed antioxidant activities. The antioxidant activity of the ethyl acetate extract of KD extracts is reported in Tables 2 and 3.
3.3 Black galingale rhizome extract nanoemulsion
Tween 80 as a surfactant formulated black galingale rhizome nanoemulsion at 2.5, 5.0, 7.5 and 10 % by weight, respectively. The particle size, zeta-potential and PDI were evaluated by Zetasizer. The results show that 10.0%w of Tween 80, can provide appropriate black galingale rhizome extract nanoemulsion without phase separation. The particle size was at 27.63±0.86 nm and zeta-potential was at -46.2±0.26 mV, which indicates good stability. The droplet polydispersity index (PDI) of black galingale extract nanoemulsion was found to be at 0.22±0.035, which is below the 0.3 mark, indicating a narrow size distribution.
4. Conclusions
The ethyl acetate crude extract of KD from Phetchabun was corrected and isolated by column chromatography by which it yielded two known flavonoid compounds. These are 3-hydroxy-5,7-dimethoxyflavone (A) and 5-hydroxy-3,7,4’-trimethoxyflavone (B), respectively.
Poomjuntuk et al CA5 Page 58
Table 1 1H NMR and 13C-NMR data of isolated compound
55.62, 55.84, 60.21, 92.13, 97.84, 105.44, 114.52, 125.64, 130.29, 138.75, 155.81, 156.11, 161.20, 161.92, 166.40, 178.7
Table 2 DPPH assays were used to evaluate antioxidant activity by comparing the standard concentration of Trolox.
Compound Concentration of the extract (mM) %DPPH free radical inhibition Standard concentration of Trolox TEAC (mg Trolox/g Extract) A 1.0 65.43 0.23 237.86±2.10 2.0 72.69 0.26 131.49±1.21 B 1.0 29.49 0.11 115.32±1.50 2.0 48.43 0.18 90.03±1.28
Compounds A and B when tested for antioxidant activity by ABTS method showed better antioxidant activity than the DPPH method. Furthermore, when compared with the Trolox, %DPPH, %ABTS of Compound A and B, the results show antioxidant tendency with higher free radicals. When increasing concentrationsof compoundsAandB,TEAChaveatendencytodecrease. Theblackgalingalerhizome extract nanoemulsion was prepared utlising the Tween 80 as a surfactant. It was found that at 10% tween, the surfactant was enough to stabilize the oil phase and provide good stability as -46.2±0.26 mV of zeta-potential value.
Table 3 ABTS assays were used to evaluate antioxidant activity by comparing the standard concentration of Trolox
Table 4 Particle size, Zeta potential (ZP) and polydispersity index (PDI) of black galingale rhizome extract nanoemulsion
5. Acknowledgement
This study will be included in the researcher's overall thesis project.The authors also acknowledge Dr. Chanikarn Sonklin and Dr. Samitthichai Seeyangnok
6. References
[1] Sawasdee, P., Sabphon, C., Sitthiwongwanit, D., & Kokpol, U. (2009). Anticholinesterase activity of 7‐methoxyflavones isolated from Kaempferia parviflora Phytotherapy Research, 23(12), 1792-1794.
[2] Bag, B. B. (2018). Ginger processing in India (Zingiber officinale): A review. Int J Curr Microbiol App Sci, 7(4), 1639-1651.
[3] Faraz, R., Gokhale, M., & Gothalwal, R. (2020). Callus extracts of Oroxylum indicum (L.) vent containing baicalein have in vitro antioxidant and antibacterial activities. Biotecnología Vegetal, 20(1), 51-62.
[4] Wongsrikaew, N., Woo, H. C., Vichitphan, K., & Han, J. (2011). Supercritical CO2 for efficient extractionof polymethoxyflavonesin Kaempferia parviflora. Journal of the Korean Societyfor Applied Biological Chemistry, 54(6), 1008-1011.
[5] Yenjai, C., Prasanphen, K., Daodee, S., Wongpanich, V., & Kittakoop, P. (2004). Bioactive flavonoids from Kaempferia parviflora. Fitoterapia, 75(1), 89-92.
[6] Sae-wong, C., Tansakul, P., & Tewtrakul, S. (2009). Anti-inflammatorymechanismof Kaempferia parviflora in murine macrophage cells (RAW 264.7) and in experimental animals. Journal of ethnopharmacology, 124(3), 576-580.
Poomjuntuk et al CA5 Page 59
Concentration of
extract (mM) %ABTS free radical inhibition Standard concentration of Trolox TEAC (mg Trolox/g Extract) A 1.0 98.36 0.23 238.11±2.23 2.0 98.97 0.24 119.05±1.19 B 1.0 96.88 0.23 233.53±2.87 2.0 98.65 0.24 116.74±2.23
Compound
the
Formulation T80 (%w) Appearance Size (nm) ZP (mV) PDI F1 2.5 MiscibleF2 5.0 MiscibleF3 7.5 MiscibleF4 10.0 Immiscible 27.63±0.86 -46.2±0.26 0.22±0.035
[7] Han, Y., Li, L. C., Hao, W. B., Tang, M., & Wan, S. Q. (2013).Larvicidalactivityof lansiumamide B from the seeds of Clausena lansium against Aedes albopictus (Diptera: Culicidae). Parasitology research, 112(2), 511-516.
[8] Stremple, P. (1998). GC/MS analysis of polymethoxyflavones in citrus oils. Journal of High Resolution Chromatography, 21(11), 587-591.
[9] Wang, X., Cao, J., Wu, Y., Wang, Q., & Xiao, J. (2016). Flavonoids, antioxidant potential, and acetylcholinesterase inhibition activity of the extracts from the gametophyte and archegoniophore of Marchantia polymorpha L. Molecules, 21(3), 360.
[10] Wang, X., Wang, M., Cao, J., Wu, Y., Xiao, J., & Wang, Q. (2017). Analysis of flavonoids and antioxidants in extracts of ferns from Tianmu Mountain in Zhejiang Province (China). Industrial Crops and Products, 97, 137-145.
[11] Marquina, S., García, Y., Alvarez, L., & Tortoriello, J. (2008). 3-acetoxy-7-methoxyflavone, a novel flavonoid from the anxiolytic extract of Salvia elegans (Lamiaceae). Natural Product Communications, 3(2), 1934578X0800300215.
Poomjuntuk et al CA5 Page 60
Identification of phytochemicals and antioxidants in ethanolic extracts of Dialium cochinchinense using LC-ESI-MS coupled with DPPH assay
Taksanantorn Choochua1, Phattharawan Chuaoen1 and Tinnakorn Theansungnoen1,2*
1School of Cosmetic Science, Mae Fah Luang University, Chiang Rai 57100, Thailand
2Green Cosmetic Technology Research Group, School of Cosmetic Science, Mae Fah Luang University, Chiang Rai 57100, Thailand
*Corresponding author. E-mail: tinnakorn.the@mfu.ac.th
Abstract
Dialium cochinchinense is a plant in family Fabaceae and the genus Dialium. It is an edible fruit containing vitamins, minerals, and antioxidants. The fruit is composed of three main parts including the mesocarp (pulp), exocarp (skin or peel), and seed. This study was aimed to evaluate antioxidant activity of D. cochinchinense fruit extracts by 2,2-diphenylpicrylhydrazyl (DPPH) assay and identify phytochemicals by liquid chromatographyelectrospray ionization-mass spectrometry (LC-ESI-MS). The exocarp extract (EEE), mesocarp extract (MEE), seed extract (SEE), and whole fruit extract (WFE) were macerated in 95% (v/v) ethanol by shaking at room temperature for 48 h. The highest extraction yield of crude extracts was observed in WFE followed by MEE, EEE, and SEE at 32.6±0.6% (w/w), 22.4±1.5% (w/w), 13.0±0.4% (w/w), and 7.8±0.0% (w/w), respectively. The IC50 values of the extracts were 0.024 mg/mL in SEE, 0.544mg/mL in EEE, 0.569 mg/mL in WFE, and more than 50 mg/mL in MEE. Due to the strongest antioxidant activity, SEE (1000 ppm) was taken for further phytochemical analysis by LC-ESI-MS. Based on its mass spectra and MS/MS fragment masses, a group of vitamin D derivatives, Lippioside II, and Solanocapsine were expected to provide antioxidant activity. The results can be concluded that the ethanolic seed extract of D. cochinchinense could provide potential benefits in nutraceutical, cosmeceutical, and beauty applications.
Keywords: Antioxidant; Dialium cochinchinense; DPPH; LC-MS/MS; Phytochemicals
1. Introduction
Oxidative stress can be caused by endogenous factors such as reactive oxygen species (ROS) and exogenous factors such as UV radiation, smoking, pollution, organic solvents, pesticides Free radicals produced among the oxidative stress can damage nucleic acids, proteins, enzymes, and other small moleculescausinglossofstructureandfunction(González-Palma et al ,2016) Topreventthedamages, the humanbody has a naturally antioxidant enzyme system as well as receives the diet withantioxidants for reducing free radicals Antioxidants can neutralize free radicals by donating one electron to an unstable oxygen atom of free radicals. The antioxidants have been widely used for cosmetic and beauty application. Many antioxidants are beneficial for improving the quality of some skin appearance, particularly aged skin, because they can prevent the breakdown of skin cells and wrinkles caused by free radicals. As a previous study, the results showed that a direct application of antioxidant cream to the skin might slow down the aging process (Ahmed et al., 2015).
Natural antioxidant substances have been increasing for many applications because they are expected to be safer than synthetic antioxidants (Pokorný, 2007). Plant or botanical source is one of the natural sources that have been studied for discovering new antioxidants Dialium cochinchinense is a fruit-bearing tree belonging to the Fabaceae family. The plant is native to Sabah, Sarawak and found
CA6 Page 61
Proceeding of Cosmetic & Beauty International Conference 2022 Future of the Next Beauty (CBIC 2022) 7th-9th December 2022
widely in Cambodia, Laos, Malaysia, Myanmar, Vietnam, and Thailand (Schmidt and Nguyen, 2005) Fruits of D. cochinchinense are usually produced between the months of March and May but may be earlier and sometimes persist longer (Lasekan and See, 2015). The fruits are enclosed in a brittle shell. The seed is embedded in a dry brownish sweet slightly sour edible pulp. The bioactivity of D. cochinchinese has been rarely. However, there was much research in D. guineense, another species of the Dialium genus. The dichloromethane fraction of D. guineense fruit coat exerted wound-healing and antimicrobial properties (Okeke et al , 2016). Moreover, the phenolic extract of D. guineense pulp enhanced reactive oxygen species detoxification in aflatoxin hepatocarcinogenesis (Adeleye et al., 2014). Moreover, the bark extract of D. guineense exhibited antibacterial activity while the leaf extracts had antioxidantandantimicrobial activities (Gideon et al.,2013). Accordingtothebiological properties of D. guineense, it is believed that D. cochinchinese may be possess many properties, especially antioxidant activity.
Therefore, the objectives of this study were to determine the antioxidant activities of Dialium cochinchinense fruit (exocarp, mesocarp and seed) and investigate phytochemical compounds by liquid chromatography–mass spectrometry (LC-MS/MS) technique.
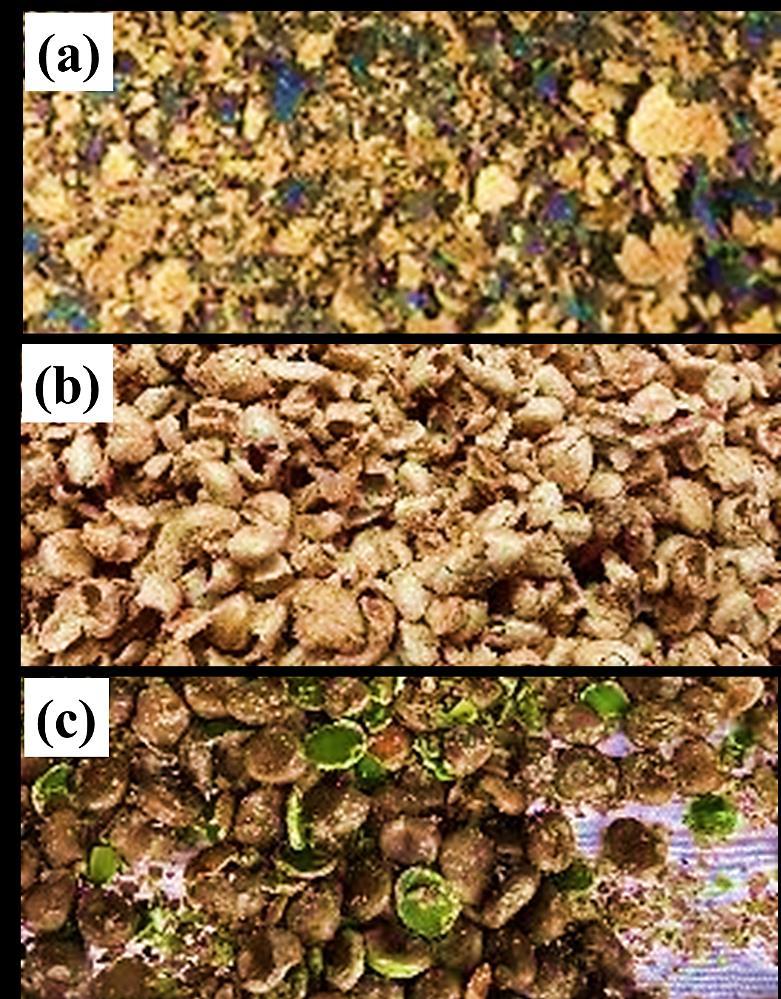
2. Materials and Methods
2.1 Plant preparation
Dialium cochinchinense fruits were purchased from a local farm in Yarang, Pattani, Thailand. Healthy and uninfected fruits of D. cochinchinense were carefully selected. The exocarp (peel), mesocarp (pulp), and seed of the fruits were separated manually (Figure 1). The fruit parts were dried in the drying oven at 45 C° for 48 h. The dried parts were ground into a fine powder and kept in plastic containers at room temperature until use.
CA6 Page 62
Choochua et al.
Figure 1 Parts used of D. cochinchinese fruits including exocarp (a), mesocarp (b), and seed (c).
2.2 Extraction of the original Dialium cochinchinense fruit parts
Dried powder (25 g) of each fruit parts were macerated in absolute ethanol (250 mL) at room temperature for 48 h. The extraction procedure was repeated three times. The supernatants were collected and filtered by Whatman No.1 filter paper. The remaining ethanol in filtered extracts was removed by a rotary evaporator. The extracts were yielded via the percentage yield and then stored in20 °C for the further test (Olajubu et al., 2012).
2.3 DPPH radical scavenging assay
The antioxidant activity of D. cochinchinense extracts was performed by DPPH radical scavenging assay (Thitilertdecha et al., 2008). The extracts with various concentration were prepared by propylene glycol, and 0.1 mM DPPH solution in absolute methanol was used for the evaluation. Afterward, to various concentration of test samples (10 μL) 0.1 mM DPPH methanol solution (100 μL) was added. After 30 min of incubation in the dark at room temperature, the absorbance was measured at the wavelength of 515 nm using a micro-plate reader. The IC50 values of sample tests were calculated. Ascorbic acid was used as a standard for comparison.
2.4 Liquid chromatography–electrospray-ionization mass spectrometry (LC-MS/MS)
Seed extract (1 mg) was dissolved in 1 mL of absolute methanol. The extract sample was filtered through 0.2 microns syringe to small vials Phytochemicals in the seed extract were investigated by LCESI-MS. The liquid chromatography was performed on UHPLC Binary pump, Agilent 1290 Infinity ii LC system by Mr. Poramet Nachalam, who is an expert technician at Advanced Analytical Equipment Service at the Central Laboratory for Research, Mae Fah Luang University. The extract samples were separated on XBridge C18, 2.5 um, 2.1*100 mm column at 35 °C. The mobile phase A was 0.1 % formic acid in water and mobile phase B was 0.1 % formic acid in acetonitrile. The flow rate was 0.2 ml/min. The information of 6545B QTOF/MS system Interface: Dual agilent jetstream ESI (Dual AJS ESI). MS/MS was performed in both positive (121.0508,922.0097m/z), and negative (112.9855,1033.9881) modes and scanned at the mass range of m/z 50-1100 amu scan rate: spectra/second. Control and data handling of the instrument was achieved by the same software as analytical HPLC. Data analysis software was performed by Mass hunter LC/MS Data Acquisition for 6200 series TOF/6500 Series Q-TOF Version B.08.00 Build 8.00.8058.0 and Masshunter Qualitative analysis Version B.08.00.
3.Results and Discussion
3.1 Yields of extracts
The extraction yields of exocarp extract (EEE), mesocarp extract (MEE), seed extract (SEE), and whole fruit extract (WFE) were shown in Table 1. AEE resulted in the highest extraction yields were showed at 32.6%, followed by EEE showed at 13%, MEE showed at 22.4% and seed extract showed at 7.8% Among the separated fruit parts, the percentage of extraction yield mesocarp was the highest, which is expected to contain phenolic, δ-tocopherol, d-glucoseand sucrose (Osman et al., 2018)
Table 1 Extraction yields of D. cochinchinese parts obtained by ethanol extraction.
Triplication of each extract was used to calculate % extraction yield.
3.2. Antioxidant activity of D. cochinchinese extracts
When a solution of DPPH is mixed with a substance that can donate a hydrogen atom, the violet color will change (Thitilertdecha et al., 2008). Antioxidant activity results according to analyses of DPPH assay for D cochinchinense extracts was presented in Table 2
Choochua et al. CA6 Page 63
Extracts %Extraction yield ± SD Exocarp extract (EEE) 13.0±0.4 Mesocarp extract (MEE) 22.4±1.5 Seed extract (SEE) 7.8±0.0 Whole fruit extract (WFE) 32.6±0.6
*Tests were accomplished in triple and explicit mean; IC50 explicit in mg/ml
The IC50 value indicates the amount of antioxidant activity. The ethanol extracts showed remarkable antioxidant activities. The IC50 values of MEE, EEE, SEE and WFE were more than 50 mg/ml, 0.544 mg/ml, 0.024 mg/ml, and 0.569 mg/ml, respectively. As a result, SEE had the highest antioxidant activity when compared with other extracts. In the same way, previous studies on the antioxidant activity of D. cochinchinense fruit had been conducted. The seed methanol fraction showed the strongest antioxidant activity including total antioxidant capacity and DPPH radical scavenging activity than the other fractions. In addition, the exocarp dichloromethane fraction was the discriminating fractionby havinglinoleicacidperoxidationinhibition.A total ofthirty-eight metaboliteswere detected in derivatized exocarp dichloromethane and seed methanol fractions with distinctive classes of phenolics and amino acids, respectively. Bioautography-guided fractionation of exocarp dichloromethane fraction afforded five antioxidant-enriched subfractions with four others detected phenolics. The results showed the antioxidant properties of D. cochinchinense fruit (Osman et al., 2018)
3 3 Liquid chromatography
–
electrospray-ionization mass spectrometry (LC-MS/MS) assay
The results of LC-MS/MS analysis of SEE were shown in (Table 3) The compounds in SEE were analyzed by LC-MS/MS. As shown in Table 3, the major fifteen compounds were identified A group of vitamin D derivatives, Lippioside II, and Solanocapsine in SEE were found and expected to provide antioxidant activities From the literature review, the antioxidant capacity of some vitamins were known, such as vitamin C and vitamin E, and even vitamin D (Tagliaferri et al., 2019). The 25Hydroxyvitamin D3 was a vitamin D derivative and could promote antioxidant capacity in vivo model (Zhou et al., 2022). Lippioside II was found as a minor compound in the extract of Lippia citriodora leaves evaluated by HPLC-ESI-TOF-MS. L. citriodora has been demonstrated to possess many phytochemicals which provide benefits to human health acting as antioxidants or anti-obesogenics (Leyva-Jiménez et al., 2020). Solanocapsine was found in plants belonging to the Solanaceae family including Solanum incanum L., S. schimperianum Hochst, S. nigrum L., Physalis lagascae Roem. & Schult. and Withania somnifera (L) Dunal. The methanolic leaf extracts and steroidal glycoalkaloids fractions (SGAFs) of these plant species were taken for antibacterial, antiproliferative and antioxidant activities.Theresultoftheantioxidant investigation wasshownthat solanopubamineandsolanocapsine were suggested to provide antioxidant activity (Fadl Almoulah et al., 2017).
4.Conclusion
In conclusion, D. cochinchinense extracts provided antioxidant activity against DPPH radicals. Among these extracts, SEE showed the highest antioxidant activity. Based on its mass spectra and MS/MS fragment masses, a group of vitamin D derivatives, Lippioside II, and Solanocapsine in SEE were expected to provide the antioxidant activity. The results can be concluded that the ethanolic seed extract of D. cochinchinense could provide potential benefits in nutraceutical, cosmeceutical, and beauty applications.
5.Acknowledgements
The authors are grateful and express our sincere regards to Mr. Poramet Nachalaem for helping in liquid chromatography–electrospray-ionization mass spectrometry (LC
ESI-MS) and the Scientific & Technological InstrumentsCenter, Mae Fah Luang Universityfor providing afriendly environment and research facilities. We would like to thank the Program of Beauty Technology, School of Cosmetic Science.
Choochua et al. CA6 Page 64
Extract IC50(mg/ml) Mesocarp extract (MEE) >50 Exocarp extract (EEE) 0.544 Seed extract (SEE) 0.024 Whole fruit extract (WFE) 0.569 ascorbic acid 0.003
Table 2 Antioxidant activity of D. cochinchinese extracts evaluated by DPPH method.
–
Proceeding of Cosmetic & Beauty International Conference 2022
Future ofthe Next Beauty (CBIC 2022)
7th-9th December 2022
(diaminomethylidene)-L-ornithylL.-
CA6 Page 65
No m/z RT Ionization mode Ion Species MS/MS fragment masses Molecular Formula Mass putative compound 1 104.108 19.932 positive (M+H)+ 70.0651 57.0703 C16H35NO2 273.2686 Hexadecasphinganine,C16 Sphinganine 2 123.093 26.577 positive (M+H)+ 67.0418 C7 H10 N2 122.0854 4-Amino-N-methylaniline,N-Methylpyridine-4methylamine,Trimethylpyrazine 3 130.159 20.042 positive (M+H)+ 513.3402 514.3433 C30 H50O3S 490.3523 26,27-diethyl-1?,25-dihydroxy-22- thia-20-epivitamin D3 / 26,27- diethyl-1?,25-dihydroxy-22-thia20epicholecalciferol,26,27-diethyl-1?,25-dihydroxy-22thiavitamin D3 / 26,27-diethyl 1?,25-dihydroxy-22thiacholecalciferol 4 274.274 20.354 positive (M+H)+ 57.0701 70.0650 C16 H35 NO2 273.2681 Hexadecasphinganine,C16 Sphinganine 5 274.275 0.656 negative (M-H)- 89.0245 C24 H44O22 684.2327 Lippioside II 6 274.276 19.920 positive (M+NH4)+ 601.3926 C24 H45N11O6 583.3596
(diaminomethylidene)-L-ornithine 7 311.169 20.062 positive (M+NH4)+ 171.1382 57.0703 C30 H50O3S 490.3515 26,27-diethyl-1?,25-dihydroxy-22- thia-20-epivitamin D3 / 26,27- diethyl-1?,25-dihydroxy-22-thia20-epicholecalc 8 434.172 20.440 positive (M+H)+ 211.1228 C24 H23N3O5 433.1650 JZL 195 9 453.344 0.672 positive (M+H)+ 203.0529 C5H13NO 103.1003 2-Propoxyethylamine,N,N-Dimethyl-2methoxyethylamine,N-(2-Methoxyethyl)ethylamine 10 469.314 20.766 positive (M+H)+ 58.0655 C16 H35 NO2 273.2670 Hexadecasphinganine,C16 Sphinganine 11 508.385 26.287 negative (M-H)- 183.012 C17 H28 O3S 312.1760 Marshmine,Romucosine C,Promucosine 12 513.342 20.141 positive (M+H)+ 469.3192 C27 H42 F2O4 468.3070 (6RS)-6,19-epidioxy-24,24- difluoro-25-hydroxy-6,19-
(6RS)-6,19-
hydroxy-6,19-
13 601.393 9.757 positive (M+Na)+ 100.1122 C27 H46 N2O2 430.3545 Solanocapsine 14 683.226 27.015 positive (M+NH4)+ 62.9293 C8 H16 112.1253 1-Hexene, 5,5-dimethyl-,1-Butyl-2-methylcyclopropane,3Hexene, 2,2-dimethyl15 980.766 20.981 negative (M-H)- 61.9888 C32HCl3N2O29 981.7731 Ala Phe Ala Arg
et al.
Table 3 The compounds in SEE were analyzed by LC-MS/MS.
L-Valylglycyl-N~5~-
prolyl-N~5~-
dihydrovitamin D3 /
epidioxy-24,24-difluoro25-
dihydrocholecalciferol
Choochua
6.References
Adeleye, A. O., Ajiboye, T. O., Iliasu, G. A., Abdussalam, F. A., Balogun, A., Ojewuyi, O. B., &. Yakubu, M. T. (2014). Phenolic Extract of Dialium guineense Pulp Enhances Reactive Oxygen Species Detoxification in Aflatoxin B1 Hepatocarcinogenesis. Journal of Medicinal Food, 17(8), 875–885.
Ahmed, S., Ahmad, M. S., Yousaf, M., Mothana, R. A., & AI-Rehaily, A.J. (2015) Evaluation of acute toxicity and anti-inflammatory effects of Baccharoides schimperi (DC.) in experimental animals. African Journal of Traditional, Complementary and Alternative Medicine. 12(1), 99103.
Fadl Almoulah, N., Voynikov, Y., Gevrenova, R., Schohn, H., Tzanova, T., Yagi, S., Thomas, J., Mignard, B., Ahmed, A.A.A., El Siddig, M.A., Spina, R., Laurain-Mattar, D. (2017). Antibacterial, antiproliferative and antioxidant activity of leaf extracts of selected Solanaceae species. South African Journal of Botany, 112, 368-374.
Gideon,I.O.,Joachim,E.,& Ehinobu,J.M.(2013).Antioxidantandantimicrobial activitiesof Dialium guineense (Willd) leaf extract. Pharmacy and Pharmacology Research, 1(1), 1-7.
González-Palma, I., Escalona-Buendía, H. B., Ponce-Alquicira, E., Téllez-Téllez, M., Gupta, V. K., Díaz-Godínez, G., & Soriano-Santos, J. (2016). Evaluation of the Antioxidant Activity of Aqueous and Methanol Extracts of Pleurotus ostreatus in Different Growth Stages. Frontiers in microbiology, 7, 1099.
Lasekan, O., & See, N. S. (2015). Key volatile aroma compounds of three black velvet tamarind (Dialium) fruit species. Food Chemistry, 168, 561–565.
Leyva-Jiménez, F.J.; Lozano-Sánchez, J.; Cádiz-Gurrea, M.d.l.L.; Fernández-Ochoa, Á.; ArráezRomán, D.; Segura-Carretero, A. (2020). Spray-Drying Microencapsulation of Bioactive Compounds from Lemon Verbena Green Extract. Foods, 9, 1547.
Okeke, N. C., Udeani, T. K., & Onyebuchi, U. L. (2016). Wound-healing and antimicrobial properties ofdichloromethanefractionof Dialium guineense (Wild)fruitcoat.ResearchinPharmaceutical Sciences. 11(3), 219-26.
Olajubu, F., Ojo, D., Akpan, I., & Oluwalana, S. (2012). Antimicrobial potential of Dialium guineense (Wild.) stem bark on some clinical isolates in Nigeria. International Journal of Applied and Basic Medical Research, 2(1), 58.
Osman, M., Mohd Hassan, N., Khatib, A. & Tolos, S. (2018). Antioxidant Activities of Dialium indum L.Fruit and Gas Chromatography-Mass Spectrometry (GC-MS) of the Active Fractions. Antioxidants, 7(11), 154.
Pokorný, J. (2007). Are natural antioxidants better – and safer – than synthetic antioxidants? 8European Journal of Lipid Science and Technology, 109, 883-883.
Schmidt, L., & Nguyen, V. A. (2005). Dialium cochichinense Pierre. Seed Leaflet, 91, 1-2.
Tagliaferri, S., Porri, D., De Giuseppe, R., Manuelli, M., Alessio, F., & Cena, H. (2019). The controversial role of vitamin D as an antioxidant: results from randomised controlled trials. Nutrition research reviews, 32(1), 99–105.
Thitilertdecha, N., Teerawutgulrag, A., & Rakariyatham, N. (2008). Antioxidant and antibacterial activities of Nephelium lappaceum L. extracts. LWT - Food Science and Technology, 41(10), 2029
2035.
Zhou, X., Zou, Y., Xu, Y., Zhang, Z., Wu, Y., Cao, J., Qiu, B., Qin, X., Han, D., Piao, X., et al. (2022). Dietary Supplementation of 25-Hydroxyvitamin D3 Improves Growth Performance, Antioxidant Capacity and Immune Function in Weaned Piglets. Antioxidants, 11, 1750.
Choochua et al. CA6 Page 66
–
*********************
Bioactive compounds and antioxidant activities of Zingiber officinale extracts for cosmetic applications
Amitawan Banjusuwan1 and Natthawut Thitipramote1,2*
2
Abstract
The research’s purpose was to investigate the bioactive compounds and antioxidant activities of Zingiber officinale extract for cosmetic applications. The whole fresh ginger rhizome without the peel was used to extract using a sonication technique in a sonication bath at 25℃ for 60 minutes with 70% (v/v) and 95% (v/v) ethanol solvent (EtOH). The extracts were taken for evaluation of the bioactive compounds by total phenolic (TPC), flavonoid (TFC), and proanthocyanidin (TPAC) contents and antioxidant activities assayed by DPPH- and ABTSradical scavenging activities and ferric-reducing antioxidant power (FRAP). The results showed that 70% EtOH extraction provided a maximum yield of 3.95±0.23%, whereas the extraction with 95% EtOH yielded 1.80±0.20%. For bioactive determination results, the TPC of 95% EtOH extract (408.83±1.54 mg GAE/g extract) was higher than that of 70% EtOH extract 260.15±2.45 mg GAE/g extract. The TFC and TPAC of 70% EtOH were 44 59±0.10 mg QE/g extract and 353.94±35.76 mg CE/g extract, while those of 95% EtOH extract were 40.76±0.26 mg QE/g extract and 329.88±3.30 mg CE/g extract, respectively. The trend of the antioxidant activity of the ginger extract with DPPH and FRAPS methods were similar to results of TPC. The 95% EtOH extract showed the highest antioxidant activities against DPPH and FRAP radicals at 902.04±0.70 and 1893 13±5.49 mg TEAC/g extract, while those of the 70% EtOH extract were 844.36±1.11 and 1388.11±65.51 mg TEAC/g extract, respectively. The antioxidant activity of 70% EtOH extract against the ABTS radical (650.14±1.86) was greater than that of 95% EtOH extract (616.55±10.02 mg TEAC/ g extract). The results suggested that the ethanolic extracts of Zingiber officinale can be used as an alternative source of natural antioxidants for cosmetic applications.
Keywords: Antioxidant Activity; Flavonoid; Phenolic; Sonication; Zingiber officinale
1. Introduction
Zingiber officinale, commonly known as ginger, belongs to the Zingerberaceae family, which has been widely used in the fields of cooking and medicine since ancient times. (Barceloux, 2008). Small molecules and a significant amount of essential oils were found in the ginger, as well as gingerols and shogols, due to its ability to stimulate blood circulation and have a warming effect; these are major components of the phenolics, which have antioxidant properties (Liu et al., 2019), so that Z. officinale is an important source for active ingredients in antiaging cosmetics.
Many studies have been done to find the best way to increase its performance and yield. So that benefits can be gained from the extraction method, the selection of natural plant extracts depends on the types of compounds and other conditions like the temperature, the solvents, the timing, etc. Some research reported that mixing extraction techniques provided the highest phenolic content and antioxidants (Gunathilake and Rupasinghe, 2014); however, the long thermal treatment had an impact
Proceeding of Cosmetic & Beauty International Conference 2022 Future of the Next Beauty (CBIC 2022) 7th-9th December 2022
1School of Cosmetic Science, Mae Fah Luang University, Chiang Rai 57000, Thailand
Green Cosmetic Technology Research Group, School of Cosmetic Science, Mae Fah Luang University, Chiang Rai 57000, Thailand *Corresponding author. E-mail: natthawut.thi@mfu.ac.th
CA7 Page 67
on the results, the price, and the performance components. Therefore, ultrasonic-assisted extraction is asubstitutetechniquethatenhancescompounds,boostsyield,takestheshortest time,andisinexpensive (Vinatoru, 2001).
Furthermore, several studies have shown that the extraction method can alter the antioxidant activity and total phenolic content in the extracts (Chan, Lim, & Omar, 2007; Ding et al., 2012; Sikora, Cieslik, Leszcznska, Filipiak-Florkiewicz, & Pisulewski, 2008). Hsiang-yu (2014) reported that the results of bioactive components and antioxidant properties were comparable in two different plant species by using different extraction solvents between aqueous and ethanolic extracts; currently, the information on using different solvent concentrations between ethanolic extracts at 70% and 95% is unknown. Therefore, the objective of this study was to compare their total bioactive compounds and antioxidant properties in Z. officinale extracts using two different extraction concentrate solvents in a sonication bath to promote the utilization of botanical plants by turning academic research into commercial products for researchers, entrepreneurs, and people who are interested in natural plants.
2. Materials and Methods
2.1 Chemicals and reagents
All the reagents and solvents used were of analytical grade: Folin-Ciocalteu, Quercetin, Potassium Acetate, Catechin, Vanillin, DPPH (1,1-diphenyl-2-picrylhydrazyl), Trolox, Tptz, Sodium Phosphate Monobasic, Potassium Persulphate (k2S2O2), and ABTS (2,2-azinobis 3-ethyl-benzothiazoline-6-sulf) were purchased from Sigma Aldrich Chemistry Co.,Ltd. DMSO was purchased from CARLO ERBA Reagents, France. Ferric chloride, Gallic acid, Sodium carbonate (Na2Co3) were purchased from Merck. Aluminum Chloride (ALCL3) and Methanol were purchased from QREC, New Zealand. Sodium acetate was purchased from Loba Chemie Pvt. Ltd., India. Na2HPO4 was purchased from RCI Labscan Limited, Thailand.
2.2 Material Preparation
The fresh ginger rhizomes (Zingiber officinale) were obtained at the local market in Bangkok, Thailand, in January 2021. The samples were rinsed, and their peels were removed. The rhizomes were cut into small pieces (2.0 to 5.0 mm). All samples were dried in a hot air oven (Memmert, UF110, Germany) at 50 °C until their weight was constant. Thedried samples were milled into powder and kept at room temperature.
2.3 Sonication extraction of bioactive compounds
The extraction used a sonication technique. Two different solvents were used to extract Zingiber officinale at a ratio of 1:10 (w/v): 70% and 95% ethanol. The mixture was sonicated in a sonication bath at 25 °C for 60 minutes at 45 kHz (Crest Ultrasonics, 690 DAE, Malaysia). The extracts were filtered through Whatman No. 1 filter papers. Solvents were removed using the rotary evaporator at 50 °C (Heidolph, Germany). Crude extracts were stored at 4 °C.
2.4
Total phenolic content (TPC)
TPC wasmeasuredaccordingtoThitipramote et al.(2016;2022)withaslightmodification.Briefly, 20 μL of Z. officinale extract was reacted with 100 μL of 0.2 M Folin-Ciocalteu reagent and 80 μL of 7.5% Na2CO3. The mixture was incubated for 30 minutes at room temperature. The absorbance was measured at 765 nm using a microplate reader (Biotek, Epoch, USA). Gallic acid was used as a reference standard. The results were expressed as mg gallic acid equivalents (GAE)/g extract.
2.5 Total Flavonoid content (TFC)
TFC was measured according to Thitipramote et al. (2016) with a slight modification. Briefly, 25 μL of Z. officinale extract was mixed with 75 μL of ethanol, 5 μL of 10% (w/v) AlCl3, 5 μL of 1 M CH3 COOK, and 140 μL of DI water, respectively. The mixture was incubated for 30 minutes at room temperature. The absorbance was measured at 415 nm. Quercetin was used as a reference standard. The results were expressed as mg gallic acid equivalents (QE)/g extract.
Banjusuwan et al
CA7 Page 68
2.6 Total proanthocyanidin content (TPAC)
TPAC was determined according to Thitipramote et al. (2016). Catechin (standard) (20 μL) was added to 50 μL of 1% vanillin (v/v) and 50 μL of 25% H2SO4 in methanol. The mixture was incubated in the dark for 30 minutes at room temperature. The absorbance was measured at 500 nm. The results were expressed as mg catechin equivalents (CE)/g extract.
2.7 DPPH radical scavenging activity (DPPH)
DPPH radical scavenging activity was performed as previously described (Thitipramote et al., 2016). Briefly, 10 μL of the sample was added to 190 μL of DPPH reagent. The reaction mixture performed satisfactorily in the dark for 30 minutes at room temperature. The absorbance was measured at 515 nm. As a reference standard, the Trolox solution was used. The percentage (%) of inhibition was calculated using the following formula:
% inhibition = (�������������������� ��������������������)
The results were expressed as mg Trolox equivalent antioxidant capacity (TEAC)/g extract.
2.8 ABTS radical scavenging activity (ABTS)
ABTS radical scavenging activity was performed as previously described (Thitipramote et al., 2016). The ABTS solution was freshly prepared by mixing 7.0 mM ABTS with 2.45 mM K2S2O8 (v/v). Then, the ABTS solution was diluted with 50 mM phosphate buffer (pH 7) at a ratio of 1:20 (v/v). For analysis, 10 μL of the sample was added to 190 μL of the diluted ABTS solution. The reaction was performed in the dark for 15 minutes at room temperature. The absorbance was measured at 734 nm. The Trolox solution was used as a reference standard. The percentage (%) of inhibition was calculated as mentioned above. The results were reported as Trolox equivalent antioxidant capacity (TEAC)/g extract.
2.9 Ferric reducing antioxidant power (FRAP)
FRAP was measured as previously described (Thitipramote et al., 2016). Firstly, FRAP solution was freshly preparedbymixing 1mL of TPTZ solution(in40mM HCI), 1mL of 20 mMferricchloride solution, and 10 mL of 0.3 M acetate buffer (pH 3.6). For analysis, 10 μL of the samples were mixed with 190 μL of FRAP solution. The mixture was incubated in the dark for 15 minutes at room temperature. The absorbance was measured at 593 nm using a microplate reader. Trolox was used as a reference standard. The results were expressed as Trolox equivalent antioxidant capacity as mg (TEAC)/g extract.
2.10 Statistical analysis
All data were reported as mean ± standard deviation. The difference between each parameter was statistically analyzed by the Independent-samples t-test (IBM SPSS version 21.0). The level of significant was considered at p < 0.05.
3.Results and Discussion
3.1 Extraction yield and solubility of crude extract
The extraction yield by 70% ethanol solvent was 3.95%, demonstrating that the differences in solvents (70% and 95% EtOH) were statistically significant (p < 0.05), as shown in Table 1.
As previously examined by Hsiang-yu (2014), comparing the increasing the yields in varying extraction (stirring and reflux) in ethanol and aquas, the results showed that these extraction methods produced low yields when compared to a sonication extraction as mentioned by this author (Romee et al , 2022), using sonicated extraction in an aqueous medium (50% ethanol, 70% ethanol, 75% ethanol, water 100%) exhibited the highest yields.
3.2 Bioactive compounds
According to the result, TPC extraction using 95% ethanol provided the highest yield (408.83%).
CA7 Page 69
Banjusuwan et al
��������������������
��100
TheTFCandTPACwereslightlylowinthe95%ethanol.TheTPCandTFCcontents weresignificantly different among the 95% ethanolic extract (p < 0.05), whereas TPAC was not vary significantly (p > 0.05)
According to Hsiang-yu (2014), the TPC in the ethanolic extract of Z. officinale was more effective than an aquas extraction due to the difference in solvents and extraction methods (stirring and reflux). Furthermore, Dai et al , (2010) verified that ethanolic extracts were another suitable solvent for polyphenol extraction that gave the best results. According to Romee et al , (2022), a sonication extraction with 95% ethanol was the most effective solvent for TPC extraction, whereas 70% ethanol was the most effective solvent for TFC extraction (Hu et al., 2011; Kumar et al., 2013). The results reported that a sonication extraction had the highest in TFC contents (Eberle et al., 2018).
Table 1 Extractable yield and bioactive compounds (Total phenolic - TPC, flavonoid - TFC, and proanthocyanidin - TPAC contents from Z. officinale extracts.
superscript letters (a,b) in the same column indicate significant differences values (The Independent-sample t-test, p
3.3
Antioxidant activities
The 95% EtOH extract exhibited the greatest antioxidant activity against the DPPH and FRAP radicals, whereas the 70% ethanol extracts reported the highest antioxidant activity according to ABTS. All the activities significantly different among the different solvents. (p < 0.05).
According to Hsiang-yu (2014), a literature review found that ethanolic extracts were more efficient than aqueous extracts in terms of bioactive components and antioxidant effects due to differences in techniques (stirring and reflux) and solvents. Eberle et al. (2018) reported the optimization of extraction methods by using different techniques (sonication, maceration, and soxhlet) and solvents to determine the effectiveness of bioactivecompounds. This literaturereview reported that ethanol extraction by sonication was the most effective due to the shortest time and being the least expensive.
Table 2 Antioxidant activity (DPPH, FRAP and ABTS assays) from Z. officinale extracts.
superscript letters (a,b) in the same column indicate significant differences values (The Independent-sample t-test, p < 0.05).
4. Conclusion
Zingiber officinale can be extracted by sonication method with ethanolic solvents. It exhibited high bioactive compound and antioxidant activity especially 95% ethanolic extract. Results confirmed that zinger is one of important source for active ingredient for antioxidant or antiaging cosmetic.
5.Acknowledgements
The author is grateful to School of Cosmetic Science, and the Center of Excellence in Natural Products Innovation (CENPi), Mae Fah Luang University for funding and facility support.
6.References
Barceloux, D.G. (2008). Ginger (Zingiber officinale Roscoe). In Medical Toxicology of Natural Substances, D.G. Barceloux (Ed.). doi.org/10.1002/9780470330319.ch68
Banjusuwan et al
Z.officinale Extracts % Yield TPC (mg GAE/g extract) TFC (mg QE/g extract) TPAC (mg CE/g extract) 70% Ethanol 3.95±0.23% a 260.15±2.45 b 44.59±0.10 a 353.94±35.76 a 95% Ethanol 1.80±0.20% b 408.83±1.54 a 40.76±0.26 b 329.88±3.30 a Mean ± S.D. (n = 3) Different
< 0.05).
Z.officinale Extracts DPPH (mg TEAC/g extract) FRAP (mg TEAC/g extract) ABTS (mg TEAC/g extract) 70% Ethanol 844.36±1.11 b 1388.11±65.51 b 650.14±1.86 a 95% Ethanol 902.04±0.70 a 1893.13±5.49 a 616.55±10.02 b Mean
S.D.
Different
±
(n = 3).
CA7 Page 70
Chan, E. W. C., Lim, Y. Y., & Omar, M. (2007). Antioxidant and antibacterial activity of leaves of Etlingera species (Zingiberaceae) in Peninsular Malaysia. Food chemistry, 104(4), 1586-1593. doi.org/10.1016/j.foodchem.2007.03.023
Connell, D.W., & McLachlan, R., (1972). Natural pungent compounds: examination of gingerols, shogaols, paradols and related compounds by thin-layer and gas chromatography, Journal of Chromatography, 67, 29-35. doi.org/10.1016/S0021-9673(01)97144-4.
Dai, J., & Mumper, R. J. (2010). Plant Phenolics: Extraction, Analysis and Their Antioxidant and Anticancer Properties. Molecules, 15(10), 7313–7352. doi.org/10.3390/molecules15107313
Ding, S. H., An, K. J., Zhao, C. P., Li, Y., Guo, Y. H., & Wang, Z. F. (2012). Effect of drying methods on volatiles of Chinese ginger (Zingiber officinale Roscoe). Food and Bioproducts Processing, 90, 515-524. doi oi.org/10.1016/j.fbp.2011.10.003.
Dugasani, S., Pichika, M. R., Nadarajah, V. D., Balijepalli, M. K., Tandra, S., & Korlakunta, J. N. (2010). Comparative antioxidant and anti-inflammatory effects of [6]-gingerol, [8]-gingerol, [10]-gingerol and [6]-shogaol. Journal of ethnopharmacology, 127(2), 515–520. doi.org/10.1016/j.jep.2009.10.004
Eberle, L., Kobernik, A., Aleksandrova, A., & Kravchenko, I. (2018). Optimization of extraction methods for total polyphenolic compounds obtained from rhizomes of Zingiber officinale. Trends in Phytochemical Research, 2(1), 37-42.
Gunathilake, K. D. P. P., & Rupasinghe, H. V. (2014). Optimization of water based-extraction methods for the preparation of bioactive-rich ginger extract using response surface methodology. European Journal of Medicinal Plants, 4(8), 893.
Hamman J. H. (2008). Composition and applications of Aloe vera leaf gel. Molecules (Basel, Switzerland), 13(8), 1599–1616. doi.org/10.3390/molecules13081599
Liu, Y., Liu,J., & Zhang, Y. (2019). Research Progress on Chemical Constituentsof Zingiber officinale Roscoe. BioMed Research International, 1(21)
Panda, S. K., Kumari, K. L., Adhikari, L., Sahu, P. K., & Pal, A. (2019). A review on clinical efficacy of traditional plants on osteoarthritis. International Journal of Pharmaceutical Sciences and Research, 10, 4040-4053.
Rahman, H., Prambudi, S. N., & Endranaka, W. (2022). Application of Ultrasonic Assisted Extraction Method for Extraction of 6-Gingerol in Zingiber officinale Var. Rubrum. Current Overview on Science and Technology Research Vol. 6, 71-82.
Ravindran, P. N., Sasikumar, B., GEORGE, K. J., Ratnambal, M. J., Nirmal Babu, K., ZACHARIAH, T.J., & Nair, R. R. (1994). Genetic resources of ginger (Zingiber officinale Rose.) and it conservation in India.
Romee Jan, Adil Gani, Mohd Masarat Dar, Naseer Ahmad Bhat (2022), Bioactive characterization of ultrasonicated ginger (Zingiber officinale) and licorice (Glycyrrhiza Glabra) freeze dried extracts, Ultrasonics Sonochemistry, 88, 1350-4177. doi.org/10.1016/j.ultsonch.2022.106048.
Sikora, E., Cieslik, E., Leszczyńska, T., Filipiak-Florkiewicz, A., & Pisulewski, P. (2008). The antioxidant activity of selected cruciferous vegetables subjected to aquathermal processing. Food chemistry, 107, 55-59. doi: 10.1016/j.foodchem.2007.07.023
Thitipramote,N., Imsonpang, S., Sukphopetch, P., Pradmeeteekul,P., Nimkamnerd, J., Nantitanon, W., & Chaiyana, W. (2022). Health Benefits and Safety of Red Pigmented Rice (Oryza sativa L.): In Vitro, Cellular, and In Vivo Activities for Hair Growth Promoting Treatment. Cosmetics, 9(6), 111. doi.org/10.3390/cosmetics9060111.
Thitipramote, N., Pradmeeteekul, P., Nimkamnerd, J., Chaiwut, P., Pintathong, P., & Thitilerdecha, N. (2016). Bioactive compounds and antioxidant activities of red (Brown Red Jasmine) and black (Kam Leum Pua) native pigmented rice. International Food Research Journal, 23(1), 410-414.
Banjusuwan et al
CA7 Page 71
Vinatoru, M. An overview of the ultrasonically assisted extraction of bioactive principles from herbs. Ultrason. Sonochem. 2001, 8, 303–313
Kishk, Y. F. M., & El Sheshetawy, H. E. (2010). Optimization of ginger (Zingiber officinale) phenolics extraction conditions and its antioxidant and radical scavenging activities using response surface methodology. World J. Dairy and Food Sci, 5, 188-196.
Banjusuwan et al
********************* CA7 Page 72
Proceeding of Cosmetic & Beauty International Conference 2022 Future of the Next Beauty (CBIC 2022)
7th -9th December 2022
Utilization of Corn (Zea mays) Agro-residues as Natural Active for Cosmetic Application
Natthawut Thitipramote1,2* , Prinyaporn Pradmeeteekul1 Junniphaphorn
Nimkamnerd1, Pornchanit Vongnititorn1 and Wittayapan Nantitanon2
1Center of Excellence in Natural Products Innovation (CENPi), Mae Fah Luang University, Chiang Rai, 57100, Thailand
2Green Cosmetic Technology Research Group, School of Cosmetic Science, Mae Fah Luang University, Chiang Rai, 57100, Thailand
*Corresponding author E-mail: natthawut thi@mfu ac th
Abstract
Smog crisis and tiny particle matters (e g , PM 2 5) from burning of agro-residues (e g , corn) are recurring health problem every year in Northern Thailand. Corn (Zea mays) agro-residues are consisted of its stalk, (~ 48% of the total dry mass), leaves (28%), tassel (~1%), husks (8%) and cob (15%). This study aimed to utilize corn agro-residues (stalk, leaves, and tassel) (CARs) as natural active ingredient for cosmetic application. CARs were separated, cleaned, and extracted byfivesolvents [deionized (DI) water, 80%methanol, 80%ethanol,ethyl acetate and hexanes] with shaking method at 200 rpm for 24 h. Total phenolic (TPC) and flavonoid contents (TFC), and antioxidant activities (DPPH, ABTS and FRAP assays) as well as antityrosinase activity for cosmetic application were determined. The results showed that the ethanol extract of corn leaves had the highest yield (14.6% dry basis). The highest TPC was statistically found in both ethanol and methanol extracts of tassel (791 9 ± 6 3 and 773 7 ± 17.2 mg GAE/g extract, p<0.05, respectively). While the highest TFC was statistically occurred in the hexanes extract of corn leaves (1,736 2 ± 166 3 mg QE/g extract, p<0 05). For antioxidantactivitybyDPPHandFRAP assays,themethanol extract oftasselhadsignificantly highest antioxidant activities (756.8 ± 21.7 and 723.8 ± 7.7 mg TEAC/g extract, p<0.05, respectively). For ABTS assay, the highest antioxidant activity was significantly found in the ethanol extract of tassel (4,077.3 ± 28.1 mg TEAC/g extract, p <0.05). Moreover, the ethyl acetate of leaves extract showed the highest anti-tyrosinase (52% inhibition at 4 mg/ml, p<0 05). From these results suggested that corn agro-residues (especially its tassel and leaves) can be used as alternative source for natural active ingredient of cosmetic applications.
Keywords: Antioxidant activities; Anti-tyrosinase activity; Bioactive compound; Corn agroresidues; Utilization
1. Introduction
In Northern Thailand, smog crisis and tiny particle matters (e g , PM 2 5) are recurring on February to Aprilevery year that affect to health problem suchasrespiratory disease, cardiovascular disease, skin disease, eye disease One of the main causes is burning agricultural residues especially corn field In 2010, corn cultivated area has totally 4.88 million rai with productivity of 4.6 million tons per year and crop residues of 6 8 million tons per year (Tengkaew and Wiwattanadate, 2014) Mostly, crop residues are eliminated by burning approximately 60% of total their residues Besides, agro-residues can be reduced by produce as animal feed, fertilizer, or fuel briquette (Sinpiboon and Chaichana, 2021). Corn (Zea mays) known as a good source of phytochemicals such as phenolic acids, flavonoids, carotenoids, phytosterols and other phytochemicals providing pharmacological properties including hypoglycemic,
CA8 Page 73
anti-inflammatory, antioxidant, and diuretic properties (Milind & Isha, 2013, Siyuan et al , 2018). Corn agro-residues (CARs) are consisted of its stalk, (~ 48% of the total dry mass), leaves (28%), tassel (~1%), husks (8%) and cob (15%). Their corn residues might have some biological activities and can be developed as natural active in natural products such as cosmetic or related products to increased value and utilization
Natural antioxidants are active ingredient that widely used in health care and cosmetic products due to their several beauty benefits such as anti-ageing, anti-wrinkle and skin lightening properties Natural antioxidants can be found in phenolic compounds, flavonoid, carotenoid and vitamins in many plants including corn-residues Previous study demonstrated that phenolic, lignan and flavonoid compounds were isolated from the methanol extract of cornstalk had anti-inflammatory, neuroprotective or hepatoprotective activity (Jung et al , 2014, 2015). An ethanol extract of corn leaves showed higher antioxidant than corn cob and corn husk extracts using DPPH assay (fidrianny et al , 2016) Corn tassel, a male floral organ, also found that its ethanol extract had antioxidant activities using ABTS and DPPH assay and had antibacterial and anticholinergic properties (Al-khayri et al., 2022). However, comparison on bioactive and antioxidant activity between each CARs with different solvents extraction have little been investigated. Therefore, the aim of study was to evaluate corn agro-residues (stalk, leaves, and tassel) bioactive compounds including phenolic and flavonoid contents and cosmetic biological activity such as antioxidant and anti-tyrosinase activities from different corn agro-residues (stalks, leaves, and tassel). These CARs may be used as natural active ingredient in cosmetic application
2. Materials and Methods
2.1 Chemicals and reagents
All chemicals and solvents were analytical grade. ABTS (2,2’ -azino-bis(3-ethylbenzthiazoline-6sulfonic acid)), aluminum chloride (AlCl3), catechin, dibasic phosphate, dimethylsulfoxide (DMSO), 2,2-diphenyl-1-picrylhydrazyl (DPPH), 95% ethanol, ethyl acetate, ferric chloride, folin-ciocalteu, gallic acid, hexane, hydrochloric acid (37%), methanol, monobasic phosphate, potassium acetate (CH3COOK), potassium persulphate (K2S2O8), quercetin, sodium carbonate (Na2CO3), sulfuric acid, vanillin, 2,4,6-tris(2-pyridyl)-1,3,5-triazin (TPTZ), trolox, sodium metabisulfite.
2.2 Plant preparation
Corn (Zea mays) agro-residues (CARs) were procured from local farmer on July in Chiangrai province, Thailand The samples were separated into stalks, leaves, and tassel of corn Then these samples were cleaned and dried by hot air oven at 45°C until constant samples weight Dried sample was milled as powder and kept in desiccator until used
2.3 Extraction
CARs were extracted by five various solvents including deionized (DI) water, 80% methanol, 80% ethanol, ethyl acetate and hexanes with a ratio of sample: solvent (1:10 w/v) All extracts were shaken by using incubator shaker at 200 rpm for 24 hours The mixtures were filtrated by Whatman filter paper No 1 Organicsolvents (ethylacetate andhexanes)wereremovedbyrotaryevaporatorat 50°C Extracts were freeze- dried and kept at -20°C.
2.4 Total phenolic content (TPC)
TPC was measured according to Thitipramote et al. (2016; 2022) with slightly modification.
Briefly, 20 μL of CARs extracts was reacted with 100 μL of 0.2 M Folin-Ciocalteu reagent and 80 μL of 7.5% Na2CO3. The mixture was left to stand in the dark for 30 minutes at room temperature. The absorbance was measured at 765 nm using a microplate reader (Biotek, Epoch, USA). Gallic acid was used as a reference standard The results were expressed as mg gallic acid equivalents (GAE)/ g extract
2.5 Total flavonoid content (TFC)
TFC was measured according to Thitipramote et al (2016) with slightly modification Briefly, 25 µL of CARs extracts was mixed with 75 µL of ethanol, 140 µL of DI water, 5 µL of 10% (w/v) AlCl3 and 5 μL of 1M CH3 COOK, respectively The mixture was incubated in the dark for 30 minutes at
Thitipramote et al CA8 Page 74
.
roomtemperature Theabsorbancewasmeasuredat 415nm Quercetinwasusedasareferencestandard and the results were expressed as mg quercetin equivalents (QE)/g extract
2.6 DPPH radical scavenging activity (DPPH)
The DPPH radical scavenging activity was performed as previously described (Thitipramote et al , 2016). Briefly, 10 µL of CARs extracts was mixed with 190 µL of DPPH reagent. The reaction mixture was left to stand in the dark for 30 min at RT. The absorbance was measured at 515 nm. Trolox solution was used as reference standard. The percentage (%) of inhibition was calculated by following formula % inhibition = (������control ������extract) ������control × 100
The results were expressed as mg Trolox equivalent antioxidant capacity (TEAC)/ g extract).
2.7 ABTS radical scavenging activity (ABTS)
The ABTS radical scavenging activity was performed as previously described (Thitipramote et al , 2016) ABTS solution was freshly prepared by mixing 7 mM ABTS with 2 45 mM K2S2O8 (v/v) Then, theABTSsolutionwasdilutedwith50mMPhosphatebuffer (pH7)inaratioof1:20(v/v) Foranalysis, 10 µL of CARs extracts was added into 190 µL of the diluted ABTS solution The reaction was performed in the dark at room temperature for 15 minutes The absorbance was measured at 734 nm Trolox solution was used as reference standard The percentage (%) of inhibition was calculated as mentioned above The results were expressed as mg Trolox equivalent antioxidant capacity (TEAC)/ g extract.
2.8 Ferric reducing antioxidant power (FRAP)
Reducing power was measured as previously described (Thitipramote et al., 2016). Briefly, FRAP solution was freshly prepared by mixing 10 mL of TPTZ solution in 40 mM hydrochloric acid with 10 mL of 20 mM ferric chloride and 100 mL of 0.3 M acetate buffer (pH3.6). For analysis, 30 μL of CARs extracts were mixed with 570 mL of FRAP solution. The mixture was kept in the dark for 15 minutes at room temperature and then the absorbance was measured at 593 nm using microplate reader. Trolox was used as a reference standard, and the results were expressed as mg Trolox equivalent antioxidant capacity (TEAC)/ g extract
2.9 Anti-tyrosinase activity
Tyrosinase inhibition assays was performed as previously described (Wang et al., 2020). Briefly, LDOPA were performed as substrate The reaction mixture (1000 μL) contained 685 μL of phosphate buffer (0 05 M, pH 6 5), 15 μL of mushroom tyrosinase (2500 U/ mL), 200 μL of CARs extracts and 100 μL of 5 mM L-DOPA After the addition of L-DOPA, the reaction was measured at 492 nm using microplate reader Kojic acid was used as a positive control
2.10 Statistical analysis
All data measurements were expressed as mean ± standard deviation. Data were compared and analyzed by one-way analysis of variance (ANOVA) test with Duncan’smultiple range test (IBM SPSS version 21.0). A significant difference is considered at the level of p < 0.05.
3. Results and Discussion
3.1 Percentage yield of the CARs extract
Yield of extract were calculated as dry basis (%yield). The extraction yields of each part of corn with different solvents were shown in Table 1 Comparing solvent extraction from corn leaves and corn tassel,theethanolextractswereexhibitedhigherextractionyield(14.62and10.25% yield,respectively) than other solvents at same sample. However, in corn stalks, the methanol extract showed higher yield (6.98 %yield) than those of other solvents.
3.2 Determination of total phenolic contents
Total phenolic contents (TPC) showed a significant difference between CARs extracts from five different solvents (p<0.05) as shown in Table 1. Phenolic compounds, a second metabolite of plants
Thitipramote et al CA8 Page 75
including lignans, tannins, phenolics acids, stilbenes, and flavonoids, are mostly found in many plants
Phenolic compounds are responsible for the bitterness or account for the differences in the flavor and color ofmanyfruits The results showed that the methanol and ethanolextracts of CARs extract showed higher TPC than other solvents when comparing in the same part of CARs The statistically highest TPC was found in both the methanol and ethanol of corn tassel extracts (791 9±6 3 and 773 7±17 2 mg GAE/g extract, p<0 05). Organic solvents extract more phenolic compounds than aqueous extract (Tok et al 2017). Likewise, previous study showed that the ethanol was the best solvent for extracting phenolic compounds (0 1575% TPC) followed by methanol extract of corn tassel (Mohsen & Ammar, 2009).
3.3 Determination of total flavonoid contents
Total flavonoid content (TFC) of CARs extracts showed a significant different between CARs from five different solvents (p<0.05) as shown in Table 1. Low polarity of solvent exhibited higher TFC than high polarity of solvent at same sample. The statistically highest TFC was found in the hexane extract of corn leaves (1,736.2±166.3 mg QE/g extract, p<0.05). However, the lowest TFC was occurred in all DIextractsofthesecornstalks, leaves,andtassel.Consistency,previousstudyshowedthattheDIwater extract of cornhusk, corncob, and corn silk had the lowest TFC (Dong et al , 2014).
Table 1Extractable yieldand bioactive compounds (total phenolic: TPC) andflavonoid: TFC contents) of CARs extracts including stalks, leaves, and tassel with five different solvent extractions
3.3 Antioxidant activity of the CARs extract
Antioxidant activities were performed by using DPPH, ABTS and FRAP assays. DPPH assay was based on the ability of a compound that can donate a hydrogen atom from 2,2’ -diphenyl-1picrylhydrazyl converted into 2,2’ -diphenyl-1-picrylhydrazine. (Pyrzynska and Pękal, 2013). DPPH radical scavenging activity of CARs extracts were a significant different between CARs extracts as shown in Figure 1A Comparing between solvents, both methanol and ethanol extracts showed higher antioxidant activity than other solvents. The methanol extract of corn tassel exhibited the statistically highest DPPH radical scavenging activity (756 8±21 7 mg TEAC/g extract, p<0 05) ABTS assay is tested on the capability of hydrogen donor of antioxidant, from free radical (2,2’Azino-bis (3-ethylbenzothiazoline-6-sulfonic acid) ammonium salt radical cation or ABTS•+) to ABTS (Sharopov et al ,2015).ThetendencyofABTSactivitywassimilartoDPPHradicalscavengingactivity as shown in Figure 1B Both methanol and ethanol showed higher antioxidant activity than other
Thitipramote et al CA8 Page 76
CARs Solvents Yield of extracts (% dry basis) Bioactive compound TPC* (mg GAE/g extract) TFC* (mg QE/g extract) Stalks DI water 1.74 422.2 ± 27.8f 15.7 ± 5.2j 80% Methanol 6 98 588 9 ± 9 6c 335 3 ± 6 6h 80% Ethanol 4 44 602 4 ± 9 5c 479 0 ± 4 3f,g Ethyl Acetate 0.40 454.8 ± 10.4e 655.0 ± 1.4c Hexanes 0 62 467 5 ± 14 3e 915 8 ± 3 8b Leave DI water 7.43 550.0 ± 26.1d 15.1 ± 0.0j 80% Methanol 13 25 736 5 ± 25 8b 423 3 ± 31 7g 80% Ethanol 14 62 551 6 ± 5 5d 455 3 ± 11 5f,g Ethyl Acetate 3 84 267 5 ± 33 3h 520 4 ± 11 5e,f Hexanes 5 89 575 2 ± 20 8c,d 1,736 2 ± 166 3a Tassel DI water 6.55 734.4 ± 19.5b 54.0 ± 5.0j 80% Methanol 7 63 791 9 ± 6 3a 249 2 ± 2 9i 80% Ethanol 10 25 773 7 ± 17 2a 570 83 ± 3 8d,e Ethyl Acetate 4 60 401 4 ± 8 6f,g 876 3 ± 2 5b Hexanes 6 56 387 9 ± 7 7 g 600 8 ± 11 8c,d *Values are given as mean ± S D (n=3) *Different letters in the same column indicate significant differences values (p<0 05) (ANOVA, Duncan’s test)
The error bars represent the standard deviation of mean The different letters indicate significant difference values (p< 0 05).
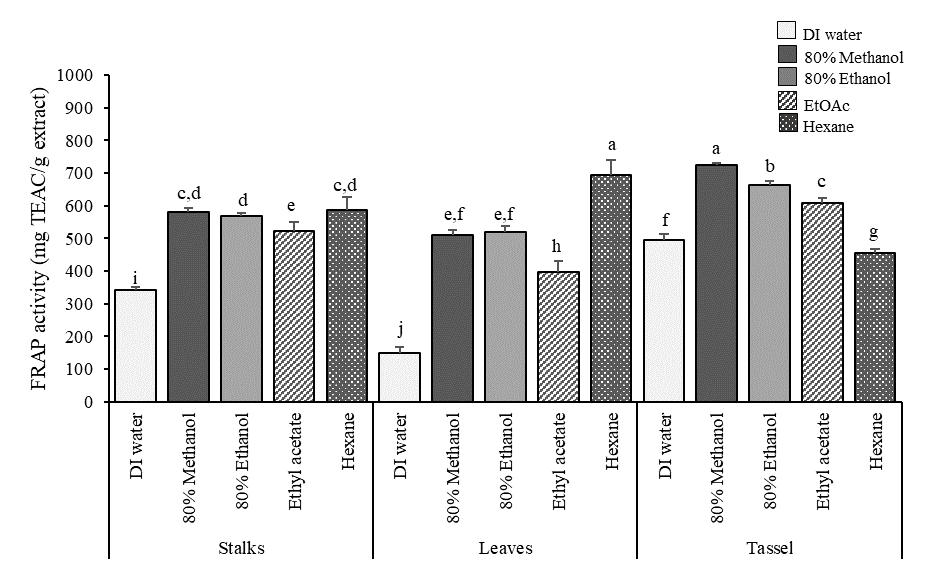
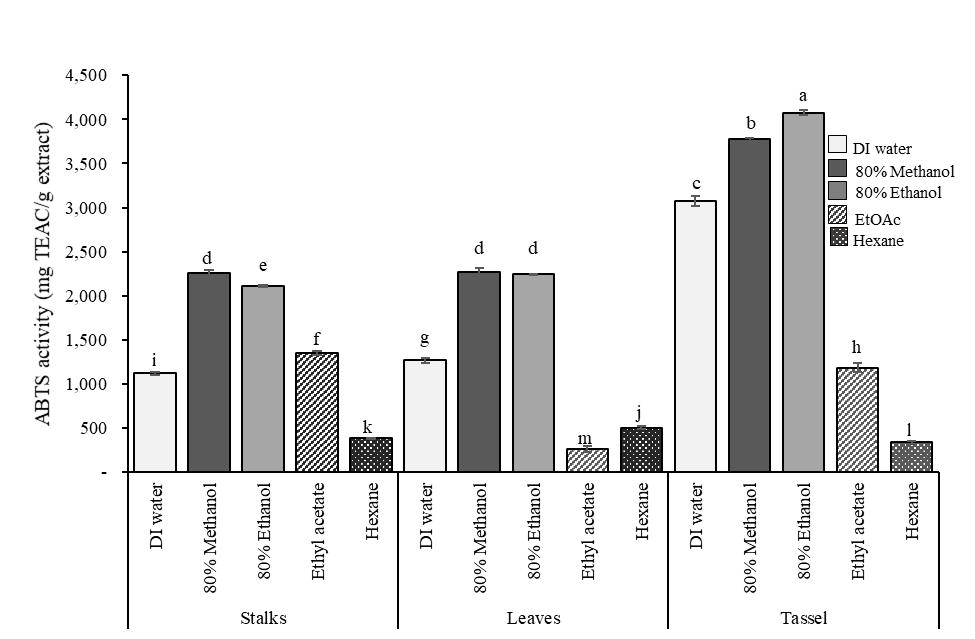
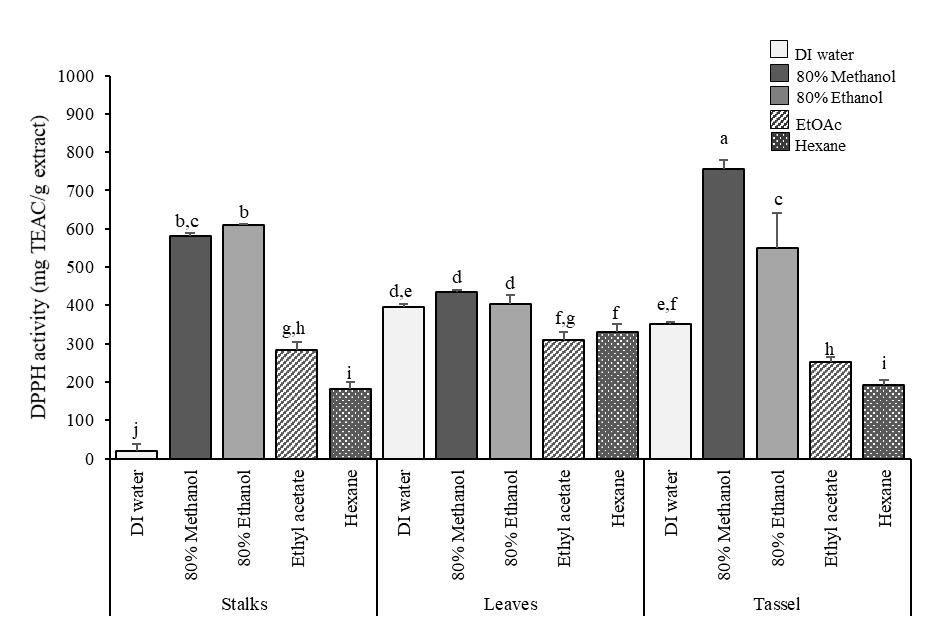
Thitipramote et al CA8 Page 77 (A) (B) (C)
DPPH activity ( mg TEAC / g extract activity ( mg TEAC / g extract FRAP activity ( mg TEAC / g extract
Figure 1 Antioxidant activities by using (A) DPPH radical scavenging activity (B) ABTS radical scavenging activity and (C) Ferric reducing antioxidant power (FRAP) of CARs including corn stalks, leaves, and tassel with five various solvents (DI water, 80% methanol, 80% ethanol, ethyl acetate and hexanes
solvents The greater ABTS antioxidant activity was found in the ethanol extract of corn tassel (4077 31±28 12 mg TEAC/ g extract, p<0 05) followed by the methanol and DI water extract of corn tassel (p<0 05; Figure 1B)
FRAP assay is different from DPPH and ABTS assay due to it does not involve with free radicals This methodis usedto examinethe antioxidant competencyby the redoxreaction offerric ion (Fe3+)to ferrous (Fe2+) (Sharopov et al , 2015). FRAP activity results were shown in Figure 1C The results wereindicated that the methanol extract of corn tassel and the hexane extract of corn leaves had significant the highest antioxidant activity (723 8±7 7 and 694 0±45 6 mg TEAC/g extract, p<0 05). Comparing each CARs extractinsamesolventextraction,theresultsshowedthat corntassel hadhigher antioxidant activityusing FRAP assay than other CARs including corn stalks and corn leaves, respectively (Table 1C)
Similar to previous study, the methanol extract of corn tassel had antioxidant capacity using DPPH and ABTS assay (Al-khayri et al , 2022). Other part of CARs, the 80% ethanol and the 80% methanol were also efficient in extracting antioxidant constituents in cornhusk, corncob, and cornsilk (Dong et al., 2014).
3.4 Anti-tyrosinase activity of the CARs extract
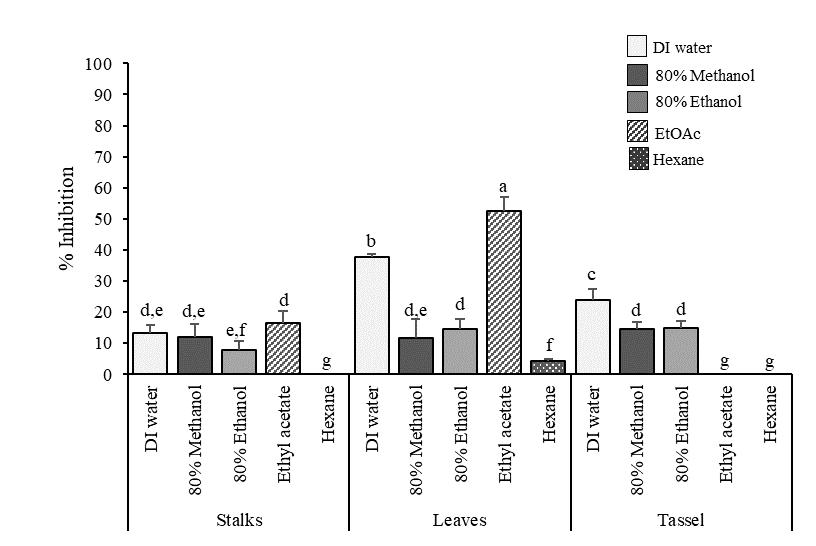
Tyrosinase as the rate-limiting enzyme for biosynthesis of melanin, catalyzes the oxidation the substances that transformed to melanin Therefore, tyrosinase inhibitors gained a lot of use in cosmeceutical for use as whitening agents The results of anti-tyrosinase activity from CARs extracts were shown in Figure 2. In each CARs, either ethyl acetate or DI water extractions tended to be higher inhibition of tyrosinase activity than other solvents at same sample The ethyl acetate extract of corn leaves had greatest significant inhibitory tyrosinase activity at concentration 4 mg/ml (52 6±5 4 %inhibition, p<0 05) and ranging in the order: DI water extract of corn leaves > DI water extract of corn tassel as indicated in Figure 2 However, the inhibitory activity was undetectable in the hexane extracts of corn stalks and tassel and the ethyl acetate extract of corn tassel Previous study showed that waxy corn silk had anti-tyrosinase activity with an IC50 value at 3082 28±347 98 μg/ml (Hongsuwan & Satthanat, 2018). Wang et al , (2020) demonstrated that ethyl acetate soluble fraction from stream exploded of corn stalks had anti-tyrosinase activity with an IC50 of 0 29 mg/ml
4. Conclusion
Corn agro-residues including their stalks, leaves, and tassel composed of bioactive compounds (phenolic and flavonoid contents) and had bioactivities for cosmetic (antioxidant and anti-tyrosinase activities). Total phenolic content and antioxidant capacities tended to be greater in CARs tassel extract
five various solvents (DI water, 80% methanol, 80% ethanol, ethyl acetate and hexane The error bars represent the standard deviation of mean The different letters indicate significant difference values (p< 0 05).
concentration 4 mg/ml
Thitipramote et al CA8 Page 78
Tyrosinase inhibition activity (% Inhibition )
Figure 2 Anti-tyrosinase inhibitory activity (%) of CARs including corn stalks, leaves, and tassel at
with
(especially methanolic and ethanolic extraction). Furthermore, the tendency of total flavonoid content and tyrosinase inhibitory activity was high in these CARs leaves extracts (especially lower polarity solvents ethyl acetate and hexanes extractions). Therefore, corn agro-residues (especially its tassel and leaves)canbevalue-addedandutilizationforalternativesourcefornaturalactiveingredient incosmetic and related applications.
5. Acknowledgements
The authors are grateful to the Center of Excellence in Natural Products Innovation (CENPi) and School of Cosmetic Science, Mae Fah Luang University for financial and facilities support
6. References
Al-Khayri, J.M., Yüksel, A.K., Yüksel, M., Işık, M. & Dikici, E. (2022). Phenolic profile and antioxidant, anticholinergic, and antibacterial properties of corn tassel. Plants (Basel), 11(15),1899.
Dong, J., Cai, L., Zhu, X., Huang, X., Yin., T., Fang, H., & Ding, Z. (2014). Antioxidant activities and phenolic compounds of cornhusk, corncob and stigma maydis. Journal of the Brazilian Chemical Society 25(11), 1956-1964
Fidrianny, I , Wulandari, E , & Hartati, R. (2016). In Vitro antioxidant activity of different organs extracts of corn grown in Cimahi-West Java-Indonesia International Journal of Pharmacognosy and Phytochemical Research, 8(6), 1025-1032
Hingsuwan, N , & Satthanut, K. (2018). Comparison of chemical compositions, nutritional values, antioxidantand tyrosinaseinhibitionactivitiesin corn silk of three differentcorn varieties Journal of Thai Traditional & Alternative Medicine, 16(3), 362-371
Jung, Y.J., Park, J.H., Seo, K.H., Shrestha, S., Kim, J. & Baek, N.I. (2014). Phenolic compounds from the stems of Zea mays and their pharmacological activity. Journal of the Korean Society for Applied Biological Chemistry, 57, 379–385.
Jung, Y.J., Park, J.H., Cho, J.G., Seo, K.H., Lee, D.S., Kim, Y.C., Kang, H.C., Song, M.C. & Baek, N.I. (2015). Lignan and flavonoids from the stems of Zea mays and their anti-inflammatory and neuroprotective activities Archives of Pharmacol Research, 38(2),178-185
Milind,P. & Isha, D. (2013). Zea maize: a modern craze. International Research Journal of Pharmacy, 4(6), 39-43
Mohsen,S M , & Ammar,A S M. (2009)Total phenoliccontentsand antioxidantactivityof corn tassel extracts Food Chemistry, 112, 595-598
Pyrzynska, K , and Pękal, A 2013 Application of free radical diphenylpicrylhydrazyl (DPPH) to estimate the antioxidant capacity of food samples Analytical Methods, 5, 4288-4295
Sharopov, F.S., Wink, M., & Setzer, W.N. (2015). Radical scavenging and antioxidant activities of essential oil components an experimental and computational investigation Natural product communications, 10(1), 153–156.
Sinpiboon, C & Chaichana, T. (2021). Zero waste management and reducing greenhouse gasemissions from electrical production by using maize residue briquette fuel. ( Master’ s thesis) . Maejo University. http://ir.mju.ac.th/dspace/handle/123456789/846
Siyuan, S., Li, T. & Rui, L. (2018). Corn Phytochemicals and Their Health Benefits. Food Science and Human Wellness, 7(3), 185-195
Tengkaew, S & Wiwattanadate D. (2014). Study of Source and Potential of Biomass from Field Corn in Thailand Princess of Naradhiwas Journal, 6(3), 102-111
Thitipramote, N , Imsonpang, S , Sukphopetch, P , Pradmeeteekul, P , Nimkamnerd, J , Nantitanon, W , & Chaiyana, W. (2022). Health Benefits and Safety of Red Pigmented Rice (Oryza sativa L.): In Vitro, Cellular, and In Vivo Activities for Hair Growth Promoting Treatment Cosmetics,
Thitipramote et al CA8 Page 79
9(6), 111 http://dx doi org/10 3390/
cosmetics9060111
Thitipramote, N , Pradmeeteekul, P , Nimkamnerd, J , Chaiwut, P , Pintathong, P & Thitilerdecha, N (2016). Bioactive compounds and antioxidant activities of red (Brown Red Jasmine) and black (Kam Leum Pua) native pigmented rice. International Food Research Journal. 23(1), 410-414.
Tok, N.C., Jain, K.K., Sahu, N.P., Varghese, T. & Daniel N. (2017). Evaluation of antioxidative and biological activity of Houttuynia cordata extracts. International Journal of Scientific and Research Publications, 7(4).
Wang, R., Wang, G., Sui, W., Zhou, C., Li, S., Ji, Y., & Chuanling, S. (2020). Tyrosinase inhibitory performance of hydrolysate from post-washing liquor of steam exploded corn stalk and its fractionation enhancement Industrial Crops and Products 154, 112652
Thitipramote et al
Page 80
CA8
*********************
Development of oral rinse containing Terminalia chebula Retz fruit extract as an antibacterial agent against Streptococcus mutans
Piyanuch Prompamorn1,3 and Natthawut Thitipramote1,2*
1School of Cosmetic Science, Mae Fah Luang University, Chiang Rai 57000, Thailand
2Green Cosmetic Technology Research Group, School of Cosmetic Science, Mae Fah Luang University, Chiang Rai 57000, Thailand
3Cosmetic Science Program, Faculty of Science and Technology, Suan Dusit University, Bangkok, 10700, Thailand
*Corresponding author. E-mail: natthawut.thi@mfu.ac.th
Abstract
Oral rinse is an antiseptic solution used for enhancing oral hygiene that could be a part of the preventive dentistry regimen at the present time. Streptococcus mutans is considered to be a major pathogen of dental caries due to its ability to adhere to the tooth surface by producing extracellular polysaccharide. This can lead to biofilm formation and the ability to produce organic acid which attacking onthetoothenamel. Theobjective ofthisresearch was todevelop an oral rinsecontaining Terminalia chebula Retz fruit extract with antibacterial activityagainst S.mutans. The T. chebula fruit extract was prepared by maceration using 70% (v/v) ethanol solution. The extracts were filtered and the solvent was removed by rotary evaporator. Antibacterial activity against S. mutans was performed by agar well diffusion assay. The minimal inhibitoryconcentration and theminimal bactericidal concentration of anextract were investigated by broth dilution assay. The results revealed that the T. chbula fruit extract possessed high antibacterial activity against S mutans. The minimal inhibitory concentration and the minimal bactericidal concentration of an extract were 1.56 mg/ml and 6.25 mg/ml, respectively. The oral rinse formulation containing T. chebula fruit extract was developed. The organoleptic and physicochemical stabilities of the formulation were investigated under accelerated conditions. The results showed that the developed oral rinse had good organoleptic and physicochemical stabilities. In conclusion, the formulation of an oral rinse containing T. chebula Retz fruit was stable at the end of the accelerated testing. Therefore, it can be used as a natural antibacterial active in oral rinse formulation that could be further studied in clinical trials.
Keywords: Antibacterial; Dental caries; Oral rinse; Streptococcus mutans; Terminalia chebula Retz
1. Introduction
Dental caries is a common chronic disease which affects both oral health and the quality of life. Streptococcusmutans isconsideredtobea majorpathogenassociatedwiththeinitiationofdentalcaries due to its ability to adhere to the tooth surface by producing extracellular polysaccharide which can leads to biofilm formation. Furthermore, this bacteria is highly acidogenic which can cause an acidic environment that attacking on the tooth enamel (Abranches et al., 2018; Forssten et al., 2010; Tanzer et al., 2001) Practicing a good oral hygiene routine is the best way to prevent dental caries and periodontal disease. Oral rinses are an antiseptic solution used to rinse the mouth in order to enhance oral hygiene and are considered as one of the most effective and safe delivery system to decrease oral microbes (Sadeghi et al., 2011; Hambire et al., 2015). Chlorhexidine is the most effective chemical
CA9 Page 81
Proceeding of Cosmetic & Beauty International Conference 2022 Future of the Next Beauty (CBIC 2022) 7th-9th December 2022
antiplaque agent that has been widely used in antiseptic oral rinse, however, it may cause side effects in long usage including tooth staining, sore mouth and/or throat, tongue irritation and wheezing/shortness of breath (Brookes et al., 2020; Sharma et al., 2014). Therefore, herbal oral rinse containing natural substances such as plant extracts which have minimum side effects and effective have been attracting much attention as an alternative substance in oral caring (Dabholkar et al., 2016; Rekha et al., 2014)
Terminalia chebula exhibited a number of medicinal activities has been extensively used as a folk medicine from ancient times (Bag et al., 2013) T. chebula fruit has high contents of phenolic compoundsincludingphenolic,tannin and flavonoid(Nigam et al., 2020). Several studiesreportedthat T.chebula fruit extract possessed antimicrobial activity against S. mutans and can be considered as a anti-cariogenic agent (Aneja & Joshi, 2009; Jagadish et al., 2009; Nayak et al., 2014). However, the development of oral product containing T. chebula for antibacterial has little been studies. Therefore, the objective of this research was to develop an oral rinse containing Terminalia chebula fruit extract with antibacterial activity against S. mutans.
2. Materials and Methods
2.1 Plant extraction
T chebula fruit were collected in November 2018 from Loei Province, Thailand. The plant extraction was prepared according to Beg et al. (2012). Briefly, 25 g of the dried pericarp powder of T. chebula was macerated with 150 ml of 70% ethanol with shaking at 150 rpm for 24 hours at room temperature. After that the extract solution was filtered through a Whatman No.1 filter paper and organic solvent was removed using a vacuum rotary evaporator. The crude extract was then stored in a tight container until further use. The yield of extract was calculated using the following equation.
Yield (%) = (Weight of T. chebula crude extract)/ Weight of T. chebula pericarp powder) x 100
2.2 Chemical composition analysis
Thechemicalcompositionof T. chebula crudeextractwasdeterminedusinghighperformanceliquid chromatography (HPLC). Gallic acid (GA) and ellagic acid (EA) were used as a reference standard. The separation was done in a VerticepTM GES C8 column (4.6 x 250 mm, 5µ particle size), mobile phases consisted of (A) 0.05% trifluoroacetic acid in water, and (B) 0.05% trifluoroacetic acid in acetonitrile using a gradient elution and the flow rate was set at 1.0 mL/min with the controlled temperature at 40º C. Photo diode array 190-400 nm detector was set at the wavelength of 259 nm and injection volume was 10 µL.
2.3 Antibacterial activity of T. chebula extract
Antibacterialactivityof T. chebula extractagainst S. mutans wasdeterminedbyagarwelldiffusion method according to Ahmed & Beg (2001) The broth culture of a mid log phase of S. mutans ATCC 25175 (107 cfu/ml) was prepared using a brain heart infusion broth (BHI) supplemented with 2 % glucose at 37 °C with shaking at 200 rpm. Then, the bacteria suspension was inoculated on BHI agar plate using sterile cotton swab. After that, a hole with a diameter of 6 mm was punched with a sterile cork borer and a 40 µl of a different concentration of T. chebula extract solution was introduced into the well. The agar plate was then incubated at 37 °C for 18 hours. 0.5% chlorhexidine and BHI broth were used as a positive control and negative control, respectively. Antimicrobial activity was determined by measuring inhibition zone diameters. The experiment was performed in triplicate.
2.4 MIC and MBC of T. chebula extract
Minimal inhibitory concentration (MIC) of T. chebula extract against S. mutans was measured by broth macrodilution method. In brief, the extract solution was diluted two-fold serially with brain heart infusion broth (BHI) ranging from 0.78-25 mg/ml. and then 1 mL of each concentration of extract solution were given in each test tube containing 9 mL of BHI broth. Later, 1 mL of working inoculum suspension (5x10⁵ CFU/mL) was added to each tube. The negative control consisted of BHI broth and inoculum, and the blank control consisted only the BHI broth. The sample was then incubated for 24h at 37ºC. The MIC was defined as the lowest concentration showing 80% growth inhibition compared
Prompamorn et al CA9 Page 82
to the growth control tube. The minimal bactericidal concentration (MBC) of an extract was performed by placing each sample dilution on BHA. The experiments were performed in triplicate.
2.5 Oral rinse formulation
Oral rinse formulation containing T. chebula extract was prepared by adding 0.5% w/w in formula of T. chebula extract according to cytotoxicity concentration of T. chebula extract in fibroblast cell reported (Prompamorn et al., 2022). The formulation of oral rinse shown in Table 1
Table 1 Formulation of oral rinse containing T. chebula extract.
2.6 Organoleptic testing
The physical appearance of prepared oral rinse formulation was evaluated including color, pH, viscosity and homogeneity. The color of oral rinse formulation was determined by Chroma meter CR400.The Viscosity of the formulation was determined by Brookfield viscometer DV-I Prime at 60 rpm, using spindle no 62. The pH of the formulation was measured by pH meter and the homogeneity of the formulation was determined by visual appearance.
2.7 Accelerated stability testing
Stability test was conducted under heating cooling condition. In brief, the oral rinse formulation was kept at 4.0±0.1°C in refrigerator for 48 hours and 45±0.1°C with 75% relative humidity for 48 hours. This process continued for 24 days. The physicochemical properties of the formulation including color, pHand the amount of gallic acid and ellagic acid were monitored at the beginning and the end of the stability tested.
3.Results and Discussion
3.1 Plant extraction
The prepared T. chebula fruit crude extract has dark-brown color (Figure.1) The yield of an extract was 53 75% (wet basis) which was higher than previously study conducted by Nayak et al. (2014) (48%)
3.2 Chemical composition analysis
The HPLC analysis showed that T. chebula extract possessed the contents of gallic acid and ellagic acid and ellagic acid was the major constituent of an extract. From the chromatogram, the content of ellagic acid and gallic acid in the extract was 36.671 mg/g crude extract and 14.542 mg/g crude extract, respectively. The chromatograms of gallic acid standard compound, ellagic acid standard compound and T. chebula extract were shown in Figure 2. The result of an experiment was in agreement with Lee et al., 2017b; Saha & Verma (2018) and Pfundstein et al. (2010). However, the content of ellagic acid in an extract was higher than previously study conducted by Pfundstein et al. (2010) due to the different extraction method.
Prompamorn et al CA9 Page 83
Ingredients Function %w/w in formula DI water Diluent qs to 100 Propylene glycol Solubilizer 10 glycerin Humectant 5 Polysorbate 20 Surfactant 2 T.chebula extract Active ingredient 0.5 Sodium chloride Flavoring agent 0.2 Sodium saccharin Sweetener 0.1 Sodium benzoate Preservative 0.1 Triethanolamine pH adjust 0.15 Menthol Cooling agent 0.05
3.3 Antibacterial activity of T. chebula extract
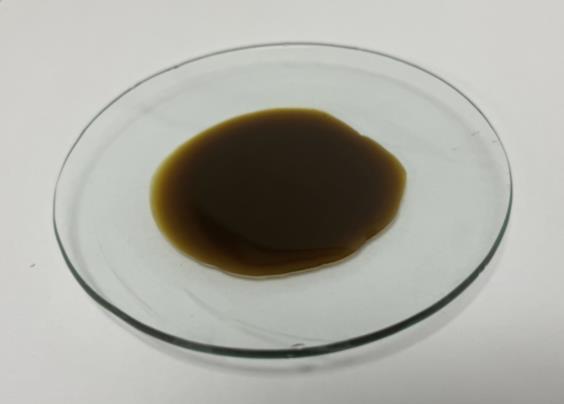
The antibacterial activity of T. chebula extract according to agar well diffusion assay showed that the extract possessed strong inhibitory activity against S. mutans bacteria and the degree of inhibition increased with the concentration of the extract. The antibacterial activity of the extracts was shown in Table 2. The MIC and MBC of an extract against S. mutans performed by broth macrodilution were


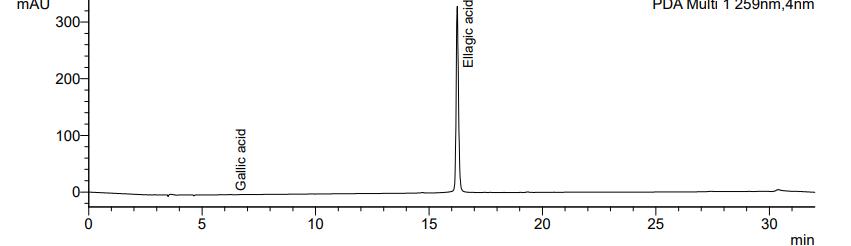
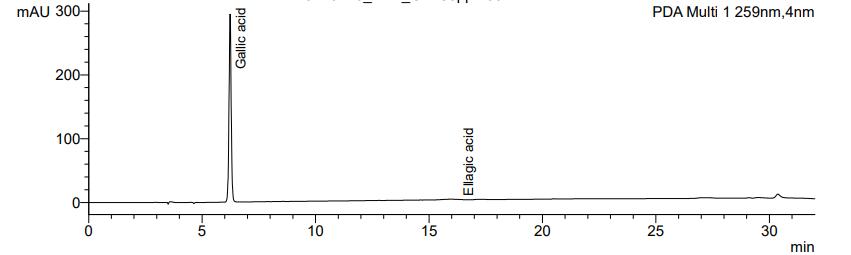
Prompamorn et al CA9 Page 84
Figure 1 T. chebula extract
Figure 2 HPLC chromatogram of (a) gallic acid standard, (b) ellagic acid standard and (c) T. chebula extract
aa ba ca
1.56 mg/ml and 6.25 mg/ml, respectively. The results were in agreement with previous studies (Lee et al., 2017; Rekha et al., 2014) which revealed that T. chebula extract exhibit anticaries activity. The antibacterial activity of the extract probably due to the ellagic acid and gallic acid which found in the extract. The gallic acid effected the membrane properties of bacteria (charge, intra and extracellular permeability, and physicochemical properties) which leads topore formation in the cell membrane (Borges et al., 2013) while ellagic inactivated microbial adhesins, enzymes, cell envelope transport proteins, and complex with polysaccharide (Loo et al., 2010).


3.4 Organoleptic testing
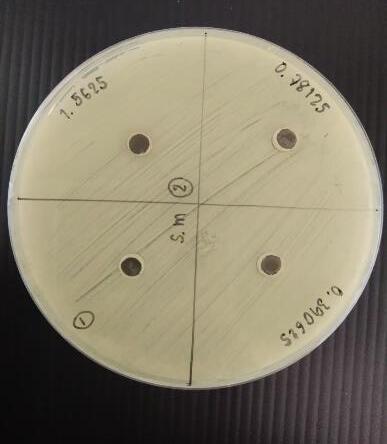
Thephysicalappearanceofpreparedoralrinseformulationwas showedinFigure4.Theformulation was homogeneity. The color of oral rinse formulation was dark brown. The color values that obtained from thecolorimeterin term of L*, a*, and b* were 14.10±0.61,0.66±0.02and1.21±0.15,respectively. The pH was 6.31which fulfilled the acceptance value of Thai community product standard of herbal breath freshener. The viscosity was 3.5 cp. at 60 rpm at room temperature.
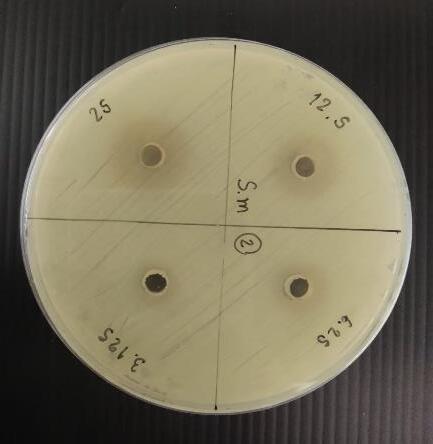
Remark: Values are given as mean ± S.D. from triplicate, The different superscript letter (a, b, c, d) in the same column represents significant difference when compared with each concentration in variables at p<0.05 (one way ANOVA with Tukey test). ND = not determined.
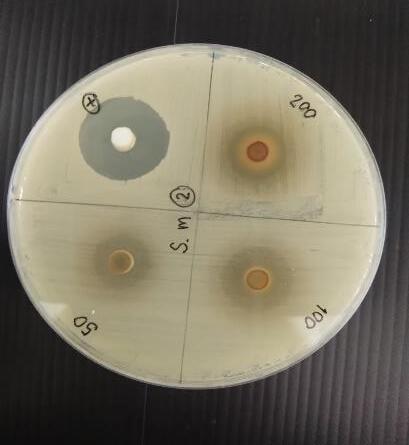
Prompamorn et al CA9 Page 85
of 200 mg/mL,
100 mg/mL, (d) 50 mg/mL, (e) 25 mg/mL, (f) 12.5 mg/mL, (g) 6.25 mg/mL,(h) 3 125mg/mL,(i)1.5625 mg/mL,(j)0.78125mg/mL,(k) 0.390625 and(l)negativecontrol.
Figure 3 Zone of inhibition of S. mutans tested with (a) negative control, (b) T. chebula extract at a concentration
(c)
T.chebula extract (mg/mL) Zone of inhibition (mm) 200 13.53±0.3a 100 12.46±0.1b 50 7.33±0.2c 12.5 ND 6.25 ND 3.125 ND 1.5625 ND 0.78125 ND 0.390625 ND 0.5% Chlorhexidine (Control) 16.36±0.2d
Table 2 Antibacterial activity of T. chebula extract at various concentration (0.3-200 mg/mL) against S.mutans by agar well diffusion assay.
a b c e f g i j h d k l
3.5 Accelerated stability testing
The resultof physicochemical properties of the oral rinse composed of T. chebula extract showed thattheformulationincludingcolor,pHandtheamountofgallicacidandellagicacid ofinitialcondition and after the stability tested are shown in Table 3.
According to the accelerated stability testing of the oral rinse formulation, the result showed that the formulation of an oral rinse containing T. chebula Retz fruit was stable at the end of the accelerated testing. Interestingly, the content of gallic acid in the oral rinse formulation was higher than ellagic acid while ellagic acid was the major constituent of T. chebula extract. This result are in agreement with Panichayupakaranant et al. (2010) which suggested that the hydrolysis reaction of the ellagic acid was occurred in the aqueous solution and the instability of this compound in the aqueous solution should be considered. The remaining percentage of gallic acid and ellagic acid in the oral rinse formulation after 24 days of accelerated test were higher than 90% (gallic acid 93.02%, ellagic acid 99.19%) Based on the extract’s stability, T. chebula extract could be recommended to be used as an active ingredient in oral rinse product.
4.Conclusion
In this study, the chemical composition of T. chebula extract and the antibacterial activity against S.mutans were analyzed as well as the organoleptic and accelerated stability test of the formulation of oral rinse containing T. chebula extract. The result from the experiment suggested that T. chebula extract possessed strong antibacterial activity against S. mutans The oral rinse formulation containing T.chebula extract was stable at the end of the accelerated test and the percentage of gallic acid and ellagic acid, the major constituent of an extract in the oral rinse formulation after accelerated test were higher than 90% Therefore, T. chebula extract can be used as a natural antibacterial active in oral rinse formulation. However, the clinical trials of the antibacterial activity of the oral rinse formulation needs further study and evaluation.
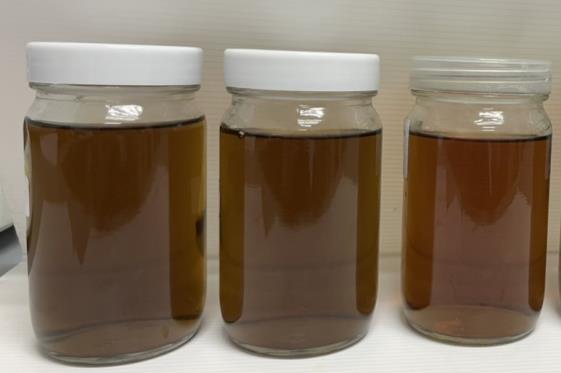
Prompamorn et al CA9 Page 86
Figure 4 The physical appearance of oral rinse composed of T. chebula
Parameter Initial condition After stability test Color L* 14.10±0.61 L* 13.47±0.36 a* 0.66±0.02 a* 0.41±0.03 b*1.21±0.15 b*1.04±0.12 pH 6.31 5.89 viscosity 3.5 cp. 15 cp. Gallic acid 65.182 mg/L 60.635 mg/L Ellagic acid 39.528 mg/L 39.208 mg/L
Table 3 Physicochemical properties of the oral rinse compose of T. chebula extract during initial and after stability test.
Figure 4 The amount of gallic acid and ellagic acid in the oral rinse compose of T. chebula extract at (a) initial condition and (b) after the stability tested
5.Acknowledgements
Authors would like to extend our appreciation to the School of Cosmetic Science, Mae Fah Luang University and the Chemical Technology program, Faculty of Science and Technology, Suan dusit University for funding and facilities support.
6.References
Abranches,J., Zeng,L., Kajfasz,J.K., Plamer,S.R., Chakraborty,B., Wen,Z.T., Richards,V.P., Brady, L.J. & Lemos, J.A. (2018). Biology of Oral Streptococci. Microbiology Spectrum, 6, 12.
Ahmad, I., & Beg, A.Z. (2001). Antimicrobial and Phytochemical Studies on 45 Indian Medicinal Plants against Multi-Drug and Resistant Human Pathogens. Journal of Ethnopharmacology, 74, 113-123.
Aneja, K.R., & Joshi, R. (2009). Evaluation of antimicrobial properties of fruit extracts of Terminalia chebula against dental caries pathogens. Jundishapur Journal of Microbiology, 2, 105–114.
Bag, A., Bhattacharyya,S.K. & Chattopadhyay,R.R. (2013). The developmentof Terminalia chebula Retz. (Combretaceae) in clinical research. Asian Pacific Journal of Tropical Biomedicine, 3, 244
252.
Borges, A., Ferreira, C., Saavedra, M.J. & Simões, M. (2013). Antibacterial activity and mode of action of ferulic and gallic acids against pathogenic bacteria. Microbial Drug Resistance, 19, 256-65.
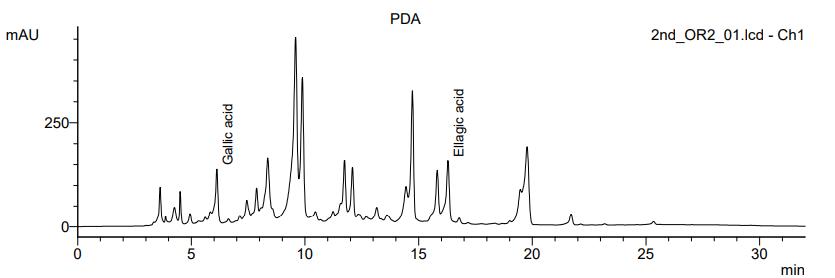
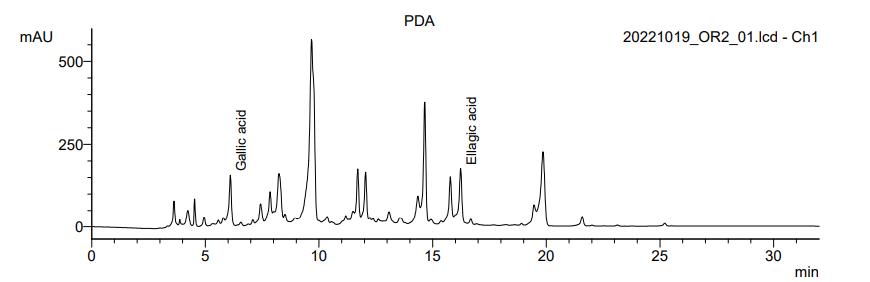
Brookes, Z., Bescos, R., Belfield, L.A., Ali, K., & Roberts, A. (2020). Current uses of chlorhexidine for management of oral disease: a narrative review. Journal of Dentistry, 103, 103497.
Dabholkar, C.S., Shah, M., Kathariya, R., Bajaj, M. & Doshi, Y. (2016). Comparative evaluation of antimicrobial activity of pomegranate-containing mouthwash against oral-biofilm forming organisms:Aninvitromicrobialstudy. Journal of Clinical and DiagnosticResearch.10,ZC659.
Forssten, S.D., Björklund, M. & Ouwehand, A.C. (2010). Streptococcus mutans, Caries and Simulation Models. Nutrients, 2(3), 290
298.

Hambire, C.U., Jawade, R., Patil, A., Wani, V.R., Kulkarni, A.A. & Nehete, P.B. (2015). Comparing the antiplaque efficacy of 0.5% Camellia sinensis extract, 0.05% sodium fluoride, and 0.2%
Prompamorn et al CA9 Page 87
–
–
a a b a
chlorhexidinegluconate mouthwash in children. Journal of International Society of Preventive and Community Dentistry. 5, 218-26.
Lee, D.Y., Kim, H.W., Yang, H., & Sung, S.H. (2017b). Hydrolyzable tannins from the fruits of Terminalia chebula Retz. and their α-glucosidase inhibitory activities. Phytochemistry, 137, 109–116.
Lee, J., Nho, Y.H., Yun, S.K., & Hwang, Y.S. (2017). Use of ethanol extracts of Terminalia chebula to prevent periodontal disease induced by dental plaque bacteria. BMC Complementary and Alternative Medicine, 17, 113.
Loo, W., Jin, L.J., Cheung, M., & Chow, L. (2010). Evaluation of ellagic acid on the activities of oral bacteria with the use of adenosine triphosphate (ATP) bioluminescence assay. African Journal of Biotechnology, 9, 3938-3943.
Nayak, S.S., Ankola, A.V., Metgud, S.C., & Bolmal, U.K. (2014). An in vitro study to determine the effect of Terminalia chebula extract and its formulation on Streptococcus mutans The Journal of Contemporary Dental Practice, 15, 278-282
Panichayupakaranant, P., Itsuriya, A. & Sirikatitham, A. (2010). Preparation method and stability of ellagic acid-rich pomegranate fruit peel extract. Pharmaceutical Biology, 48, 201-205.
Pfundstein, B., Desouky, S., Hull, W.E., Haubner, R., Erben, G., & Owen, R. (2010). Polyphenolic compoundsinthefruitsofEgyptianmedicinalplants(Terminaliabellerica, Terminaliachebula and Terminalia horrida): Characterization, quantitation and determination of antioxidant capacities. Phytochemistry, 71, 1132-1148.
Prompamorn, P., Itsarasook, K., Chantree, K., Modsuwan, J., & Panichkul, T. (2022). Evaluation of Terminalia chebula Retz. extract as a natural preservative for cosmetic products. Burapha Science Journal, 27, 542-561.
Rekha, V., Vijayalakshmi, D., Kumar, N., & Manipal, S. (2014). Anti cariogenic effect of Terminalia chebula. Journal of Clinical and Diagnostic Research, 8, 51-54.
Sadeghi, M., Bahramabadi, R. & Assar, S. (2011). Antibacterial effects of Persica and Matrica Herbal mouthwashes on common oral microorganisms: An in vitro study. Journal of Mashhad Dental School, 35, 107-14.
Saha, S., & Verma, R.J. (2018). Antioxidant activity of polyphenolic extract of Terminalia chebula Retzius fruits. Journal of Taibah University for Science, 10, 805-812.
Sharma, R., Hebbal,M., Ankola, A.V.,Murugaboopathy, V. & Shetty, S.J. (2014).Effect of two herbal mouthwashes on gingival health of school children. Journal of Traditional and Complementary Medicine. 4, 272-278.
Tanzer, J.M., Livingston, J. & Thompson, A.M. (2001). The microbiology of primary dental caries in humans. Journal of Dental Education, 65, 1028-1037.
Prompamorn et al CA9 Page 88
*********************
Skin lightening effect of star grass (Hypoxis aurea Lour.) extract
Kris Jangjarat1* , Nont Thitilertdecha1,2, and Nisakorn Saewan1,3
1School of Cosmetic Science, Mae Fah Luang University, Chiang Rai 57100, Thailand
2Green Cosmetic Technology Research Group, School of Cosmetic Science, Mae Fah Luang University, Chiang Rai 57100, Thailand
3Cosmetic and Beauty Innovations for Sustainable Development (CBIS) Research Group, Mae Fah Luang University, 333, Moo.1, Thasud, Muang, Chiang Rai 57100, Thailand *Corresponding author. E-mail: 6151701255@lamduan.mfu.ac.th
Abstract
Consumer interest in cosmetic skin care products made with natural ingredients has increased recently.Particularly, lighteningitemsthathelp lessenmelanin synthesisandprevent abnormal skin pigments, freckles, melasma, and dark spots were the most well-liked. The purpose of this study was to investigate the extraction solvent for star grass rhizomes and determine its ability to lighten skin. In this study, deionized water, 50% (w/v) and 95% (w/v) ethanol were utilized as the extraction solvents. The highest total phenolic content (0.20±0.02 mg GAE/mL) was found in water extract, while DPPH radical scavenging (IC50 of 0.58±0.00 mg/mL), FRAP (0.18±0.01 mg AAE/mL) and tyrosinase inhibition (IC50 of 0.68±0.01 mg/mL) was found in 50% ethanolic extract. This 50% ethanolic extract was then evaluated for cytotoxicity and the extract (26 mg/mL) showed no toxicity with 109.39±4.6% of cell viability. The base emulsion cream was produced, and 3% extract was added. On 32 participants, the product's potential for irritating skin was examined and the results revealed no irritation. Then, 28 volunteers participate in the further clinical test to determine the changing of melanin content after using the cream for 8 weeks. After using the product for 6 and 8 weeks, the amount of melanin decreased by 6 68±0.30% and 6.87±0.28%, respectively. The findings showed that the amount of melanin changed after 6 and 8 weeks was significantly lower than baseline (p<0.05). However, there was no discernible reduction in the cream base. Additionally, the products increased skin hydration from the baseline consistently by 6.68±0.35% and 32.70±0.26% throughout the course of 6 and 8 weeks. They demonstrated a significant difference after 6 to 8 weeks of application (p<0.05), respectively. According to the findings, star grass extract can be employed as an active component in cosmetic products to decrease melanin content and promote skin moisture.
Keywords: Star Grass, Melanin, Brightening, Redness, Moisturizing
1. Introduction
The major source of skin color in humans is melanin (pigment-producing cells) produced in highly specialized cells known as melanocytes, located in the outermost layer of the epidermis. Melanocytes are dendritic cells in close contact with neighboring keratinocytes. Together, they form the epidermal melaninunit,whichcreatesanddistributesmelaninin theskin,hair,and eyecolors.Therearetwotypes of melanin composed of eumelanin (black or brown) and pheomelanin (red or yellow) that exhibit distinct physical and biological properties (Busca & Ballotti, 2000; Yoon et al., 2003; Lin & Fisher, 2007; Chang, 2012)
Tyrosinase, a copper-containing enzyme, is a key enzyme for melanin biosynthesis in plants, microorganisms,andmammaliancells.Inaddition,tyrosinaseenzymeinhibitorshavebeeninvestigated in cosmetics and pharmaceuticals to prevent the overproduction of melanin in basal epidermal layers,
CA18 Page 89
Proceeding of Cosmetic & Beauty International Conference 2022 Future of the Next Beauty (CBIC 2022) 7th-9th December 2022
termed melanogenesis, which is widely used as a depigmentation agent (Sánchez-Ferrer et al., 1995; Parvez et al., 2007). In recent years, a consumer interested in cosmetic skin care products made with naturalingredients.Mainly,brighteningitemsthat reducemelaninsynthesiswhicharethemost popular because they could prevent abnormal skin pigmentation, freckles, melasma, and dark spots.
Melanin plays an important role in protecting human skin from the harmful effectsof UV radiation from sunlight because humans naturally create melanin pigments for photo-protection. On the other hand, when skinexposureto UV radiationfor a long time,melanogenesisis enhanced viathe activation of tyrosinase, resulting in excessive production of melanin and occur adverse effects such as DNAdamaged epidermal hyperplasia, collagen breakdown, and inflammation (Gillbro & Olsson, 2011; d'Ischia et al.,2013).Therefore,skin-brighteningingredientswithhypo-pigmentationabilitieslikeantimelanogenesis activity or refer to anti-melanogenesis agents are essential
Star grass (Hypoxis aurea Lour ), Thai name: WanTan-Diao, is a plant from the genus Hypoxidaceae. It can be found in China, Japan, and Southeast Asia countries, including Thailand. The previous literature investigation reported the isolation of phenolic glycosides such as aureaside A and aureasideB were only chlorinatedaromaticglycoside which isolatedfrom genus Hypoxis until present. Other isolation compounds were flavonoids and steroids. Furthermore, other compounds by ethanolic extract of star grass composed of quercetin-3-O-β-D-glucoside, kaemferol-3-O-β-D-glucoside, apigenin-5-O-β-D-glucopyranoside, α-spinasterol, 2,6-dimethoxy-benzoic acid, 1H-indole-3carboxylic acid, (2S, 3R, 4E, 8E)-1-(β-D-ghicopyranosyloxy)-3-hydroxy-2 [((R)-2'hydroxyeicosanoly)amino]-9-methy-4,8-octadeeadiene, n-dotriacontanol, 14,15-eicosenicacid, lignoceric acid, β-sitosterol, and daucosterol (Cheng et al., 2009; Zhong-Quan et al., 2011). In traditional Thai medicine, tubers of star grass have been used for maintaining blood circulation and werelaterexternallyusedfor cosmeticandcosmeceuticalpurposes. Additionally,thestargrassextracts from leave and tuber showed antioxidant activity, anti-tyrosinase, anti-melanogenesis, and collagen biosynthesis stimulating ability (Boonpisuttinant et al., 2013; Boonpisuttinant et al., 2014). However, there have been no reports of a clinical trial to assess the skin brightening efficacy of star grass extract. Thus, this research aims to investigate the phenolic content, antioxidant activities, cytotoxicity, skin irritation, and clinical study evaluation of star grass extract
2. Materials and Methods
2.1 Materials
Ascorbic acid, dimethyl sulfoxide (DMSO), ferric chloride, Folin-ciocalteu reagent, gallic acid, kojic acid, MTT formazan, sodium bicarbonate, sodium hydroxide, trichloro acetic acid, tyrosinase from mushroom, 1,1-diphenyl 1-2-picrylhydrazyl, and 3,4-dihydroxy-L-phenylalanine were purchased from Sigma-Aldrich Co., St. Louis, MO, USA. Ethanol was purchased from Merck, Darmstadt, Germany. Ferric chloride and potassium ferricyanidewere purchased from Fisher Scientific, Waltham, MA, USA. Dimethyl sulfoxide (DMSO) was purchased from Bio Basic Inc., Canada. Dulbecco’s Modified Eagle’s Medium was purchased from Caisson Labs, Utah, USA. Fetal bovine serum, penicillin streptomycin solution, phosphate buffered saline (PBS), and typsin/EDTA solution were purchased from Gibco, Grand Island, NY, USA. Butylene glycol, cetearyl alcohol, glycerin, glyceryl stearate, lexemul 561, Novemer EC-1 polymer, phenoxyethanol, and sodium lauryl sulfate were purchased from Namsiang, Bangkok, Thailand. B16F10 Melanoma cell (melanocyte cells) was received from The NIC company, Chiang Rai, Thailand.
2.2 Extraction
Rhizomes of star grass were harvested from Nam Kian, Phu Phiang, Nan, Thailand during November to December in 2020. The fresh rhizomes were cleaned and dried in an oven (model ED-S 56, Binder, Tuttlingen, Germany), which maintained temperature of at 45ºC for 120 hours Then, the dry rhizomes were blended with a blender (HR2115/02, Philips, Bangkok, Thailand) to obtain small pieces. Dried rhizomes were extracted with three different solvents (deionized water, 50% and 95% alcohol) with a ratio 1:5 (w/v) and sonicatedin a sonicationbath (ElmasonicS 10 H, Gottlieb-Daimler, Germany)for20minutesatroomtemperature.AllextractswerefilteredusingaBuchnerfunnelthrough filter paper (Whatman® no.1) to remove residue, then dried by using rotary evaporator (Buchi R-114 Rotary Vap System, BUCHI Corporation, New Castle, DE, USA) at 40°C and kept in a freezer until
Jangjarat et al CA4 Page 90
analysis.
2.3 Determination of Total Phenolic Content
The total phenolic content (TPC) of extractswas determinedusing Folin-Ciocalteuassay (Vichit & Saewan, 2016). The extract (12.5 µL) was mixed with 50 µL of deionized water, 20 µL of FolinCiocalteu reagent and 125 µL of 7% sodium bicarbonate. The mixture was incubated for 90 minutes at room temperature. Then, the absorbance was read using a microplate reader (BMG LABTECH/SPECTRO star Nano, Ortenberg, Germany) at 750 nm. TPC was expressed as gallic acid equivalent (mg GAE/mL extract).
2.4 DPPH Radical Scavenging Activity
DPPH radicalsscavengingactivityof extractswas evaluatedby the followedprotocol of Vichit and Saewan (2015). 5 µL of extract and 0.1 mM of DPPH solution (195 µL) were mixed and left to react at room temperature for 30 minutes under dark conditions. The absorbance of the mixture was measured at 515 nm using a microplate reader. The antioxidant activity was calculated as follows:
DPPH scavenging activity (%) = [(Acontrol − Asample)/Acontrol] x 100 (1)
Where Acontrol is the absorbance of the control (without extract) and Asample is the absorbance in the presence of the test sample. Then, the DPPH radical scavenging activity of the extract was expressed as 50% inhibition concentration (IC50) and ascorbic acid was used as the positive standard.
2.5 Ferric Reducing Power Activity
The ferric reducing power (FRAP) assay was performed according to the method of Vichit and Saewan (2016). The extracts (25 µL) were mixed with 50 µL of 1% potassium ferricyanide and incubated for 60minutes at room temperature. Then, 25µL of Trichloro aceticacidand deionized water (75 µL) were added and the absorbance was measured at 700 nm using a microplate reader as absorbance 1 (A1). Next, 0.1% ferric chloride (25 µL) was added to the solution, and the mixture absorbance was again measured at 700 nm as absorbance 2 (A2). The optical density of sample was calculated using the following equation:
Optical density = (A2 − A1)sample − (A2 − A1)control (2)
Where Acontrol is the absorbance of the control (without extract) and Asample is the absorbance in the presence of the test sample. The reducing power activity results were expressed as ascorbic acid equivalents (mg AAE/mL extract).
2.6 Anti-Tyrosinase Activity
A tyrosinase inhibitory activity assay by the dopachrome method, in which L-DOPA was used as the substrate, which modified protocol from Nurrochmad (Nurrochmad et al., 2018). The extract (20 µL) was added to 100 µL of 0.1 M phosphate buffer (pH 6.8) and mixed with 40 µL of 1 mM L-DOPA in 0.1 M phosphate buffer (pH 6.8). The mixture was incubated at 37ºC for 10 minutes. Then, 40 µL of 200 unit/mL tyrosinase in 0.1 M phosphate buffer (pH 6.5) was added and incubated at 37ºC for 15 minutes. The absorbance was measured at 475 nm. Anti-tyrosinase activity was calculated as follow:
Tyrosinase inhibition (%) = [(Acontrol − Asample)/Acontrol] x 100 (3)
Where Acontrol is the absorbance of the control (without extract) and Asample is the absorbance in the presence of the test sample. Then, tyrosinase inhibition of extract was expressed as 50% inhibition concentration (IC50) and kojic acid was used as the positive standard.
2.7 Cytotoxicity
The cytotoxicityassessmentwas performedby MTT assay (Im et al., 2003) B16F10 melanomacells (melanocyte cells) were cultured in DMEM and supplemented with 10% fetal bovine serum and 1% penicillin-streptomycinsolution. Cells were maintainedin 5% CO2 at 37ºC in the incubator (Model CB 60 CO2 incubators, Binder, Tuttlingen, Germany). The test was performed by seeding the cells in a 96well plateat a densityof 1x10⁴ cells/mLand treatedwith variousextractconcentrations(13-65 mg/mL) in mediafor24 hours. Afterwards,thecell culturemediumwas removedand5 mg/mLof MTTsolution
Jangjarat et al CA4 Page 91
(25 µL) was added and mixed with medium without supplement (175 µL) to each well. After being incubated for 4 hours, DMSO (150 µL) was added to all wells and incubated for 30 minutes at room temperature. The absorbance of each sample was measured at 570 nm using a microplate reader. The percentage of the viable cell was calculated by the following formula
Viable cell (%) = (Atreated group/Auntreated group) x 100 (4)
Where, Auntreated group is the absorbance of the control (without extract) and Atreated group is the absorbance in the presence of the test sample. The cytotoxicity activity of the extract was expressed as the 50% cytotoxic concentration (IC50).
2.8 Formulation
The rhizome star grass extract cream was prepared according to the O/W emulsion as displayed in Table 1. The O/W emulsion formula is based on the research of Pueknang and Saewan (2022). In part A and B, all ingredients were separately weighed and heated to 70ºC, then part A was added into part B and mixedwell by usinga homogenizer (T25digitalultraturrax,IKA, Staufen,Germany)for15min. Afterwards,the mixturewas cooleddown to 40ºC,and partC wasaddedintopartAB and homogenized for 5 minutes which obtained a cream base. Rhizome star grass extract at concentration of 3% was incorporated to prepared cream base, obtaining RSG cream. Both creams appeared no phase separation after centrifuged at 9,000 rpm for 30 minutes. The products were measured for a pH value by using pH meter (HI2211 HANNA Basic pH/ORP Benchtop Meter, Hanna Instrument, Bangkok, Thailand). Lastly, all products were evaluated for characteristics such as appearance, color, texture, and spreadability by visual observation and applying on the skin.
Table 1 Base and active creams formulation
2.9 Clinical Study
The skin irritation study was performed using patch testing (Queille-Roussel et al., 2001; Schnuch et al., 2008). The protocol was approved by the Ethics Committee of Mae Fah Luang University under protocol number EC-21062-17. All volunteers signed written informed consent before participating in the clinicaltrial.The inclusioncriteriaincludemenand womenwith normal skin, Fitzpatrickskintypes II-IV (Fitzpatrick, 1988), and aged between 20-60 years and while the exclusion criteria were subjects whohaveachronicskincondition,sensitiveoreasilyirritatedskin,pregnant,regularlysmokedordrank alcohol, as well as those who had taken part in the same experiment within the previous month. Moreover, each participant was acknowledged about the type of study, the procedures to be followed, the general nature of materials being tested and any known or anticipated adverse reaction that might result from participation.
Thirty-two volunteers, 3 males and 29 females, were subjected to occlusive patch test by patch testing method. The four samples were included a positive control (0.2% sodium lauryl sulfate), negative control (deionized water), base cream, and active cream with 3% rhizome star grass extract. The positiveand negativecontrols(0.015 mL)were soaked in a circularfilterpaper, and then contained in the Finn Chamber®. While both creams (0.1 mg) were filled in each chamber. The patch test was performed by attaching on the upper arm for 24 hours. After that, the grade scores of skin irritation (erythema and edema) were investigated using score criteria for dermal reactions after removing the
Jangjarat et al CA4 Page 92
Part Ingredients %(w/w) A Deionized water q.s. to 100 Butylene glycol 2.0 Glycerin 5.0 B Glyceryl stearate 1.2 Lexemul 561® 1.5 Cetearyl alcohol 1.5 Novemer EC-1 polymer® 1.5 C Phenoxyethanol 0.8 Rhizome star grass extract 3.0
patch for 30 minutes and 24 hours. The result was reported as cumulative irritation index (C.I.I) for each subject to the following formula:
C.I.I = ∑ of the grade (erythema + oedema) / number of readings (5)
This index is then divided by the number of volunteers to obtain the mean cumulative irritation index (M.C.I.I) by the following formula:
M.C.I.I = C.I.I / number of volunteers (6)
The M.C.I.Ivalueoftestedsamplesshouldbe lessthan0.25 whichconsideredasnon-irritant,while scores greater than 0.26 regarded as irritation.
The participants who passed the occlusive single patch test without experiencing any irritation (M.C.I.I score <0.25) was able to take part in clinical study. To prevent bias, a number rather than a name was given to each volunteer. Two treatment groups were assigned randomly to volunteers. The firstgroup(placebogroup)receivedbase cream(B cream),whilethe secondgroup receivedcreamwith 3% rhizome star grass extract (RSG cream). All volunteers were instructed to apply the test product on the facial every day, which was used 2 times a day (in the morning and before night) for 8 weeks. Besides, the specific instructions for this experiment were not to use any other skincare products and should be avoided the sunlight in the relevant areas.
Before the assessment, each volunteer's face was cleansed with a mild facial cleanser. Then, they acclimated to the temperature-controlled room (22ºC) and relative humidity (45-60%). The skin melaninand erythemacontentsand skin hydrationwere measuredin triplicateat baseline(week 0), and week2,4,6,and8afterapplication,byusingasingle-blindmethod.Themelaninanderythemacontents of the skin were measured using Mexameter® (MX18, Courage Khazaka electronic, Cologne, Germany). The skin hydration was measured by using Corneometer® (CM 825, Courage Khazaka electronic, Cologne, Germany). All measured values were processed with Multi Skin Test Center® MC 1000 & Software and calculated as percent of change by the following equation:
Where X0 is the initial value measured before application (week 0) and Xt is the value measured during application (Fox et al., 2014).
2.10 Statistical Analysis
Statistical analysis was performed by using IBM SPSS Statistic Program (SPSS Inc, Chicago, IL, USA). Continuous variables were expressed as mean±standard deviation (SD) representing data as triplicate values. The experiment of TPC, DPPH, FRAP, and anti-tyrosinase activity was carried out using One way analysisvariance(ANOVA), while clinicaltrial valueswere performedusing the paired t-test. The significant difference was considered when the p-value was below 0.05.
3.Results and Discussion
3.1 Extraction
Fresh rhizomes of star grass were long in shape, with dark brown bark, and internal white wood (Figure 1A), and when they dried, appeared slightly darker (Figure 1B). After blending, the purple powder was obtained(Figure1C) witha percentageyieldof 47.6±2.0%.Thestar grassrhizomeextracts with various solvents of water, 50% and 95% ethanol by ultrasonic extraction were shown in Figure 2. The extraction with the higher polarity solvent was obtained as a darker brown solution due to the rhizomes of star grass containing pigments that aqueous solvent could dissolve pigment greater than ethanol solvent. All extracts were evaporated to remove the solvent and kept at 4ºC before analysis.
3.2 Total Phenolic Content
The phenolic compounds have been widely reported and proved to be gainful to humans who have a potent for antioxidant, antimicrobial, and anti-inflammation. The antioxidant can prevent skin ageing anddamage,includingwoundandburn.Furthermore,phenoliccompoundsalsopreventtheprogression of certainskin disorderslike acne (Yao et al., 2004; CevallosCasals& Cisneros-Zevallos,2010; Dzialo et al., 2016). The phytochemicals contents in the star grass extracts were consisted of alkaloids,
Jangjarat et al CA4 Page 93
% Change = [(Xt – X0)/X0] x 100 (7)
saponins, flavonoids, anthocyanins, glycosides, and tannins, according to literature of Manosroi (Manosroi et al., 2012).
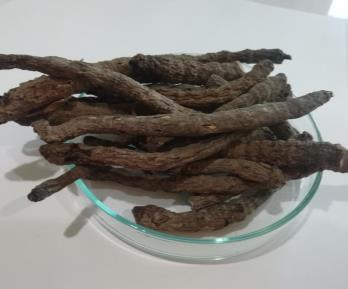
The aqueous extract (0.43±0.01 mg GAE/mL) showed significantly higher total phenolic content (TPC) than 50% and 95% ethanolic extract (0.20±0.02 and 0.05±0.01mg GAE/mL, respectively) as shown in Table 2. The results indicated that different polarity solvents had a significant effect on polyphenol contents in star grass extracts. Additionally, the result corresponded to the study of Boonpisuttinant, who reported that aqueous extract of star grass from tuberous provided the highest TPC contents compared to ethanol extracts (Boonpisuttinant et al., 2013).
3.3 Antioxidant Activities
The antioxidant activities of the samples were investigated with two different methods, DPPH and FRAP activities, which shown in Table 2. According to literature of Clarke et al. (2013), the screening of plant activityby analyzedseveral methodsand combiningthe data could provide a better description of antioxidant activities than data obtained from a single assay. DPPH radical scavenging is one of the most common assays for evaluating samples’ ability to scavenger free radicals. This assay determines the electron donor ability of samples, resulting in the reduction of a purple DPPH radical that can stabilisethe molecule.WhereasFRAP assay was based on the reductionof ferricyanidecomplex(Fe3+) to the ferrous form (Fe2+) (Huang et al., 2005; Alam et al., 2013).
The50%ethanolicextractshowedthelowestof50%inhibitoryconcentrationofextract(IC50)value of 0.58±0.00 mg/mL. However, it was no significant difference when compared with aqueous extract (IC50 of 0.59±0.02 mg/mL) and 95% ethanol extract (IC50 of 0.61±0.01 mg/mL). All extracts exhibited about 5 times higher IC50 value than standard ascorbic acid (IC50 of 0.11±0.25 mg/mL).
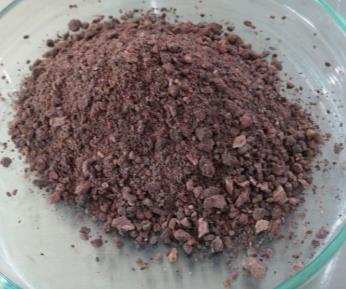
As well as the FRAP results, all solvents demonstrated a similar value of FRAP activities without significant differences. The rhizome star grass extract in 50% ethanol gave the highest FRAP value (0.18±0.01 mg AAE/mL). The water extract presented as the second good activity (0.16±0.03 mg AAE/mL) and followed by 95% ethanol extract (0.14±0.02 mg/mL). The results obtained were in the same direction as previous literature, which apprised that star grass tuberous in aqueous extract offered higher antioxidant activity than ethanolic extract (Boonpisuttinan et al., 2013). Interestingly, it was found that the combination of two solvents in the appropriate ratio, like 50% alcohol, provided higher antioxidant activities than using a single solvent.
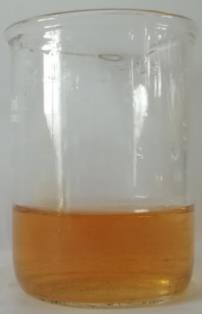

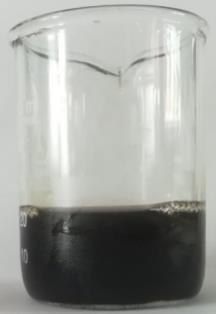
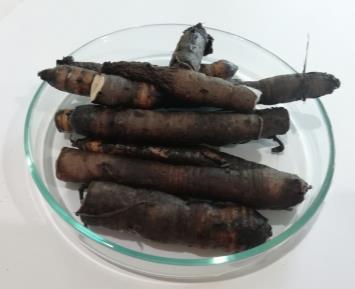
Jangjarat et al CA4 Page 94
A B C
A B C
Figure 1 Appearance of fresh (A), dried (B), and powder (C) star grass rhizomes
Figure 2 The extracts of star grass rhizome by water (A), 50% ethanol (B), and 95% ethanol (C)
3.4 Anti-Tyrosinase Activity
Reactive oxygen species (ROS) are play an important role in the regulation of the melanogenesis that contributes to stimulate signs of aging include dark spots, melasma, freckles, and even hyperpigmentation syndromes, whereas antioxidants can interact with the stabilize free radicals and prevent melanogenesiswhich associated to inhibitionof tyrosinase (Briganti et al., 2003; Choi & Shin. 2016).
The 50% ethanolic extract of star grass rhizome indicated a significantly highest inhibition of tyrosinase activity than water and 95% ethanol extract (p<0.05), data was shown in Table 2. Although this extract was less efficient than kojic acid (IC50 of 0.13±0.46 mg/mL). The result suggested that 50% ethanol wasthebest solventwhich respondedtoanti-tyrosinaseactivityandalsoinlinewithantioxidant activities. This resultant was corresponding to previous literatures (Cheng et al., 2009; Boonpisuttinant et al., 2014) which explained that main phytochemical contents in star grass like tannin, glycoside, aureasideA,andaureasideBexhibitedantioxidantandinhibitionoftyrosinaseactivitiesandhadsimilar efficacy when comparison to vitamin C. However, according to Park (Park et al., 2003) reported that kojic acid exhibited a high tyrosinase inhibition efficiency which is equivalent to hydroquinone, while vitamin C presented a lower inhibitory. Consequently, in this research, kojic acid was selected as standard for determination. Moreover, the semi-polar solvents were substantiated as the most suitable for extracting tannin and quercetin which are the major compounds found in star grass (Zhong-Quan et al., 2011; Neelapong et al., 2018). Thus, star grass rhizome extract in 50% ethanol was selected for further study.
rhizome extracts.
3.5 Cytotoxicity
The 50% of star grass rhizome extract at concentrations 13, 26, 39, 52, and 65 mg/mL were investigated for cytotoxicity to B16F10 melanoma cells by MTT assay (Figure 3). The extract at low concentrations of 13 and 26 mg/mL showed the higher viable cell with 130.73±3.42% and 109.39±4.6%. Whereas the higher concentration at 39, 52, and 65 mg/mL of the extract showed lower cellviabilityof75.38±3.06%,21.16±1.60%,and17.05±1.29%,respectively.Theconcentrationcausing 50% viable cell (IC50) of the extract was 47.54 mg/mL. When considering the cell viability more than 80%,itwasfoundthatthemaximumconcentrationnotexceededat26mg/mLcouldbeusedincosmetic formulation.However, human skin is differentfrom the cells.The skin acts as several barrier functions, such as durable diffusion of chemicals when directly in contact to the skin, against UV radiation and microbes that are termed as skin barriers, unlike the cells extremely subtle (Lodén, 2016). Hence, the star grass rhizome extract could be used in higher doses.
3.6 Formulation
The topical basecream andactivecream, whichincorporated3% of star grassrhizomeextract,were developed to give a good texture, easy to spreadability and absorb, and non-sticky. The appearance of both creams is displayed in Figure 4. The prepared base cream (B cream) appeared white texture, while rhizome star grass cream (RSG cream) obtained light brown texture. The finished products had a pH range of 5.70 to 5.90.
Jangjarat et al CA4 Page 95
Extracts TPC (mg GAE/ml) DPPH activity (IC50 mg/mL) FRAP activity (mg AAE/mL) Anti-tyrosinase (IC50 mg/mL) Water 0.43±0.01b 0.59±0.02b 0.16±0.03b 1.92±0.02c 50% ethanol 0.20±0.02c 0.58±0.00b 0.18±0.01b 0.68±0.01b 95% ethanol 0.05±0.01d 0.61±0.01b 0.14±0.02b 4.84±0.23d Gallic acid 3.79±0.20a - -Ascorbic acid - 0.11±0.25a 3.82±0.12aKojic acid - - - 0.13±0.46a
(p<0.05).
Table 2 TPC, antioxidant activities, and anti-tyrosinase activity of the star grass
Values are presented as means±SD from triplicate. Data with different letters (a, b, c, and d) in the same column indicate significant differences
Values are presented as means±SD from triplicate. Data with different letters (a, b, c, and d) indicated significant differences (p<0.05) when compared to control and various concentration of extracts.
3.7 Clinical Study
The skin irritation test was investigated by using an occlusive single patch test. The volunteers were assessed for the erythema and edema on the upper arm after 30 minutes and 24 hours patch removal. The grade of skin irritation was recorded as C.I.I value for each volunteer. Then, the results were calculated and concluded as the M.C.I.I value. Sodium lauryl sulfate showed M.C.I.I values of 0.81 and 0.62 after 30minutes and 24 hours removingpatch which classified as slightly irritation, while the M.C.I.I. values of deionized water and B cream were 0.00 which assessed as non-irritation. The RSG cream exhibited M.C.I.I values of 0.09 and 0.03 after 30 minutes and 24 hours patch removal which classified as no irritation. Besides, all test samples showed no signs of edema (M.C.I.I value of 0.00) in all periods of time after remove the patches
The clinical study of brighten, redness, and hydration effects of RSG cream were evaluated on facial skin on 28 volunteers, 2 males and 26 females, compared with B cream (placebo) for 8 weeks. The evaluation of skin brightening by measured the melanin content using Mexameter®. The melanin content value can distinguish between skin darker and lighter. The results showed that B cream was not any change. In contrast, the RSG cream slightly decreased of melanin contents after 2 weeks and 4 weeks of application and significantly demonstrated reduction during 6 and 8 weeks (p<0.05). After 6 and 8 weeks, could lower the melanin level by 6.68±0.30% and 6.87±0.28% compared to the initial value (Figure 5A). These results corresponded to anti-tyrosinase activity of 50% ethanolic star grass rhizome extract and to the anti-melanogenesis of tubers and leave star grass in water and alcohol extracts, according to Boonpisuttinant et al., (2014).
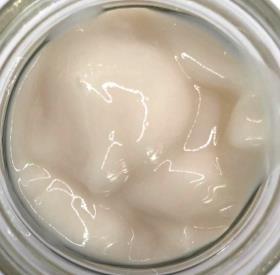
The RSG cream also provided redness reduction ability, which was performed by measurement of erythemacontent usingMexameter® Redness onthefaceisoneofthemost easilyrecognizableclinical signs which causes by many factors such as skin inflammation, allergies, and photodamage. A red face may be due to transient erythema (flushing) or persistent erythema. Flushing may be precipitated by
Jangjarat et al CA4 Page 96
Figure 3 The percentage of cell viability on B16F10 melanoma cells of star grass rhizome extracts
A B
Figure 4 The appearance of B cream (A) and RSG cream (B)
b a b c d d 0 20 40 60 80 100 120 140 Control 13 26 39 52 65 % Cell viability Concentration (mg/mL)
sunlight, a hot and humid atmosphere etc. In recent years, many topical formulations with rich antioxidants have been used for reducing redness in human skin (Logan, 2013; Dessinioti & Antoniou, 2017; Siu et al., 2017). At weeks 6 and 8, the erythema contents had dramatically decreased from the beginning with 6.90±0.40% and 6.97±0.38%, respectively (p<0.05). Whereas B cream was not any change values (Figure 5B).
Skin hydration is related to water content in the stratum corneum, the outermost layer of the epidermis. It plays several important roles in skin function, including cell proliferation, moisture, skin barrier, and anti-inflammation. Additionally, the products that can enhance skin hydration will prevent dryness and even premature aging (Verdier‐Sévrain & Bonté et al., 2007; Spada et al., 2018).
Jangjarat et al CA4 Page 97
* * -5 0 5 10 15 0 2 4 6 8 % Change Weeks B cream RSG cream (A) * * -10 -5 0 5 0 2 4 6 8 % Change Weeks B cream RSG cream (B) * * 0 10 20 30 40 50 0 2 4 6 8 % Change Weeks B cream RSG cream (C)
Figure 5 Percentageof change in skin brightening (A), redness (B), and hydration (C) of all volunteers after applied products. Data with * indicate significant differences (p<0.05) of each product after application compared to baseline.
According to Figure 5C, the percentage change of skin hydration of subjects who applied RSG creams was significantly increased by 28.40±0.35 for week 6 and continuously enhanced to 32.70±0.26%at week8(p<0.05).Theplacebogroup,whichusedBcream,alsofoundthat thehydration was increased, however, till week end, base cream could promote hydration of 8.62±0.91% without significant difference. The reason of B cream demonstrated the improved skin hydration due to glycerin and butylene glycol that incorporated in the formulation, which had humectant abilities and might fulfil moisture during application.
Overall, the star grass rhizome extract was suggested to be an effective active ingredient for use as skin brightening, reduction of skin redness due to anti-inflammation, and skin hydration which application in cosmetics and cosmeceuticals.
4.Conclusion
The aqueous extract of dried star grass rhizome showed the highest TPC (p<0.05). The DPPH and FRAP activities of water, 50% and 95% ethanol extract exhibited no significant differences. The antityrosinase activity of 95% ethanolic extract significantly demonstrated the highest activity (p<0.05). It was found that semi-polar solvent appropriate for extracting rhizome star grass. The extractof50%ethanolat a concentrationof26 mg/mLprovedto promotecellviabilityup to100%. Afterwards,3% ofthe extractwas incorporatedintothepreparedbasecreamand obtaineda lightbrown texture.The occlusivesingle patch test of rhizomestar grass cream (RSG cream)showed M.C.I.I value of 0.09 and 0.03, which are classified as no skin irritation products. The clinical results showed that topical application of RSG cream suggests skin lightening, reduced redness, and enhanced hydration benefits. Statistical improvements were indicated in its ability to reduce the melanin and erythema contents and increase of skin moisture against the baseline. Thus, star grass rhizome extract is an effective ingredient for a skin brightening, anti-inflammation, and moisturizing agents.
5.Acknowledgements
The authors would like to acknowledge to Mae Fah Luang University for providing funding, scientific equipment, and facilities for this work.
6.References
Alam, M.N., Bristi, N.J., & Rafiquzzaman, M. (2013). Review on in vivo and in vitro methods evaluation of antioxidant activity Saudi Pharmaceutical Journal, 21(2), 143-152.
Boonpisuttinant, K., Winitchai, S., Keawklin, S., Yuenying, J., Srisanga, P., Meepradit, K., . . . Sodamook, U. (2013). Free radical scavenging and tyrosinase inhibition activities of Hypoxis aurea Lour. tuberous extracts. Journal of Applied Sciences Research, 9(12), 6039-6045.
Boonpisuttinant, K., Ruksiriwanich, W., & Winitchai, S. (2014). In vitro anti-melanogenesis and collagen biosynthesis stimulating activities of Star Grass (Hypoxis aurea Lour.) extracts Asian Journal of Applied Sciences, 2(4), 405-413.
Briganti, S., Camera, E., & Picardo, M. (2003). Chemical and instrumental approaches to treat hyperpigmentation. Pigment Cell Research, 16(2), 101-110.
Busca, R., & Ballotti, R. (2000). Cyclic AMP a key messenger in the regulation of skin pigmentation. Pigment Cell Research, 13(2), 60-69.
Cevallos-Casals, B.A., & Cisneros-Zevallos, L. (2010). Impact of germination on phenolic content and antioxidant activity of 13 edible seed species. Food Chemistry, 119(4), 1485-1490.
Cheng, Z.Q., Yang, D., Liu, Y.Q., Hu, J.M., Jiang, H.Z., Wang, P.C., ... & Zhao, Y.X. (2009). Two new phenolicglycosidesfrom Hypoxis aurea Lour. Bulletinof the Korean Chemical Society,30(10), 2446-2448.
Choi, M.H., & Shin, H.J. (2016). Anti-melanogenesis effect of quercetin. Cosmetics, 3(2), 18.
Clarke, G., Ting, K.N., Wiart, C., & Fry, J. (2013). High correlation of 2, 2-diphenyl-1-picrylhydrazyl (DPPH) radical scavenging, ferric reducing activity potential and total phenolics content indicates redundancy in use of all three assays to screen for antioxidant activity of extracts of
Jangjarat et al CA4 Page 98
plants from the Malaysian rainforest. Antioxidants, 2(1), 1-10.
Dessinioti, C., & Antoniou, C. (2017). The “red face”: Not always rosacea. Clinics in Dermatology, 35(2), 201-206.
Działo, M., Mierziak,J., Korzun, U.,Preisner,M., Szopa, J.,& Kulma, A.(2016). The potential of plant phenolics in prevention and therapy of skin disorders. International Journal of Molecular Sciences, 17(2), 160.
Fitzpatrick, T.B. (1988). The validity and practicality of sun-reactive skin types I through VI. Archives of Dermatology, 124(6), 869-871.
Fox, L.T., Du Plessis, J., Gerber, M., Van Zyl, S., Boneschans, B., & Hamman, J.H. (2014). In vivo skin hydration and anti-erythema effects of Aloe vera, Aloe ferox and Aloe marlothii gel materials after single and multiple applications. Pharmacognosy Magazine, 10(2), 392.
Huang, D., Ou, B., & Prior, R.L. (2005). The chemistry behind antioxidant capacity assays. Journal of Agricultural and Food Chemistry, 53(6), 1841-1856.
Lodén, M. (2016). Treatments improving skin barrier function. Skin Barrier Function, 49, 112-122.
Logan, R.A. (2013). Dermatological causes of a red face. Medicine, 41(6), 347-351.
Manosroi, J., Boonpisuttinant, K., Manosroi, W., & Manosroi, A. (2012). Anti-proliferative activities onHeLacancercell lineofThaimedicinalplantrecipesselectedfromMANOSROIIIdatabase. Journal of Ethnopharmacology, 142(2), 422-431.
Neelapong, W., Phonyotin, B., & Sittikijyothin, W. (2018). Extraction of active compounds from Thai herbs: Steam distillation and solvent extraction. The Journal of KMUTBN, 28(4).
Parvez, S., Kang, M., Chung, H.S., & Bae, H. (2007). Naturally occurring tyrosinase inhibitors: mechanism and applications in skin health, cosmetics and agriculture industries. Phytotherapy Research: An International Journal Devoted to Pharmacological and Toxicological Evaluation of Natural Product Derivatives, 21(9), 805-816.
Park,Y.,Lee,J.,Park,J.,&Park,D.(2003).Effectsofkojicacid,arbutinandvitaminConcell viability and melanin synthesis in B16BL6 cells. Journal of the Society of Cosmetic Scientists of Korea, 29(1), 151-167.
Pueknang, J., & Saewan, N. (2022). Stability and Anti-Aging of Encapsulated Ferulic Acid in Phosphorylated Rice Starch. Molecules, 27(11), 3463.
Queille-Roussel, C., Poncet, M., Mesaros, S., Clucas, A., Baker, M., & Soloff, A.M. (2001). Comparison of the cumulative irritation potential of adapalene gel and cream with that of erythromycin/tretinoin solution and gel and erythromycin/isotretinoin gel. Clinical Therapeutics, 23(2), 205-212.
Sánchez-Ferrer, Á., Rodríguez-López, J.N., García-Cánovas, F., & García-Carmona, F. (1995). Tyrosinase: a comprehensive review of its mechanism. Biochimica et Biophysica Acta (BBA)Protein Structure and Molecular Enzymology, 1247(1), 1-11.
Schnuch,A.,Aberer,W.,Agathos,M.,Becker,D.,Brasch,J.,Elsner,P.,. GermanContactDermatitis Research Group (DKG). (2008). Patch testing with contact allergens. JDDG: Journal der Deutschen Dermatologischen Gesellschaft, 6(9), 770-775.
Siu, S.Y., Ferzli, G.M., & Brody, N. (2017). Reduction of Facial Redness with Resveratrol Added to Topical Product Containing Green Tea Polyphenols and Caffeine. SKIN The Journal of Cutaneous Medicine, 1, s87-s87.
Spada, F., Barnes, T.M., & Greive, K.A. (2018). Skin hydration is significantly increased by a cream formulated to mimic the skin’s own natural moisturizing systems. Clinical, Cosmetic and Investigational Dermatology, 11, 491.
Vichit, W., & Saewan, N. (2015). Antioxidant activities and cytotoxicity of Thai pigmented rice.
Jangjarat et al CA4 Page 99
International Journal of Pharmacy and Pharmaceutical Sciences, 7(7), 329-334.
Vichit, W., & Saewan, N. (2016). Effect of germination on antioxidant, anti-inflammatory and keratinocyte proliferation of rice. International Food Research Journal, 23(5), 2006-2015.
Verdier‐Sévrain,S.,&Bonté,F.(2007).Skinhydration:areviewonitsmolecularmechanisms. Journal of Cosmetic Dermatology, 6(2), 75-82.
Yao,L.H.,Jiang,Y.M.,Shi,J.,Tomas-Barberan,F.A.,Datta,N.,Singanusong,R.,&Chen,S.S.(2004). Flavonoids in food and their health benefits. Plant Foods for Human Nutrition, 59(3), 113-122.
Yoon, T.J., Lei, T.C., Yamaguchi, Y., Batzer, J., Wolber, R., & Hearing, V.J. (2003). Reconstituted 3dimensional human skin of various ethnic origins as an in vitro model for studies of pigmentation. Analytical Biochemistry, 318(2), 260-269.
Zhong-Quan, C., Dan, Y., Qing-Yun, M., Yu-Qing, L., Jun, Z., & You-Xing, Z. (2011). Chemical Constituents from Hypoxis aurea Lour. Natural Product Research & Development, 23(6).
Jangjarat et al CA4 Page 100
*********************
Effect of the types and concentrations of film-formers and concentrations of plasticizer on peel-off mask formulations
Saruda Yokputtaraksa1*, Jutarat Kitsongsermthon1
Department of Pharmaceutics and Industrial Pharmacy, Faculty of Pharmaceutical Sciences, Chulalongkorn University Bangkok, 10330, Thailand
*Corresponding author. E-mail: 6470043233@student.chula.ac.th
Abstract
Peel-off masks are one type of cosmetic products commonly applied on the skin by leaving over time. They can form a thin plasticized film that can be peeled off. The main ingredients of peel-off mask formulation include polymers as film-formers, plasticizers, and moisturizers. In this study, the effect of film-formers, namely polyvinyl alcohol (PVA) and polyvinylpyrrolidone (PVP), at 5 or 10 %w/w, and plasticizer, namely butylene glycol, at 5 or 10 %w/w were determined in the gel bases. Appearance, pH, viscosity of gel, drying time, and swellingofthefilmswereusedascriteriaforselectingsuitableformulations.Theresultshowed that the peel-off mask gels were clear, soft, smooth, and easy to apply. The pH of the gels decreased in the presence of film-former, compared to the control, and pH was significantly affected by the film-former concentration (p<0.001). All formulations had pseudoplastic (nonNewtonian) flow behavior which was suitable for topical application. The viscosity was affected by concentrations of film formers. It increased when the concentration of film former was increased. Both PVP and PVA transformed gels into films after drying, but PVA offered more stretchable and continuous films. In terms of drying time, PVA gel dried and formed films faster than PVP gel. The concentrations of film-former significantly reduced the drying time (p<0.001). The swelling of the polymeric films was evaluated by measuring the weight increase after adding water on the dried films. The swelling ratio was decreased when the filmformer was included, and the higher the concentration, the lower the swelling ratio. The types of film-formers did not affect the swelling ratio significantly (p=0.995). On the other hand, butylene glycol had minor influences on gel and film characteristics. In conclusion, PVA and PVP in peel-off mask formulations affected the gel and film characteristics differently. The concentrations of film-formers had significant effects on pH, gel viscosity, drying time, and swelling of the films, while the concentration of butylene glycol slightly affected the gel and film properties.
Keywords: Polyvinyl alcohol; Polyvinylpyrrolidone; Butylene glycol
1. Introduction
Cosmeticfacial masks come invariousforms,such as sheet masks, rinse-off masks, peel-off masks, and hydrogel masks and they are formulated as gel, emulsion, paste or sheet (Nilforoushzadeh et al., 2018) The peel-off mask gels, one of the most popular forms, can form a film on the skin within 15-30 minutes after application and the film can be removed without leaving any residue. Peel-off mask gels are beneficial for deep pore cleansing, moisturizing, enhancing the occlusive effect, improving blood circulation, removing dead skin cells, and softening the skin (Rahmasari et al., 2019)
Mainly, the peel-off mask gels are composed of film-former, plasticizer, and moisturizer. However, most research studied only one type of film-former and a single concentration of plasticizers. There is noinformationaboutacomparisonoftypesoffilm-formerorconcentrationsofplasticizerstodetermine
CF19 Page 101
Proceeding of Cosmetic & Beauty International Conference 2022 Future of the Next Beauty (CBIC 2022) 7th-9th December 2022
whether film-formers or plasticizers are appropriate for product development, as in the previous research (Rahmasari et al., 2019).
Polyvinyl alcohol (PVA) is a water-soluble synthetic polymer, and functions as a binder, film former, and viscosity-increasing agent-aqueous in cosmetic products. The PVA gels are dried easily, form a strong transparent film and adhere well to the skin (Hariyadi et al., 2021; Nair et al., 1998)
Polyvinylpyrrolidone (PVP) is a typical hydrophilic and synthetic polymer, pH-stable, nontoxic, and biocompatible with excellent film-forming ability. PVP has been used in medicine, pharmaceuticals, cosmetics, and foods (Nešić & Ružić, 2017). Butylene glycol (BG) is non-toxic, colorless, and is used as a humectant and plasticizer for polymers (Lieber, 1985). Thus, these ingredients would be used in our study.
The purposes of this study were to compare the type and the concentration of film formers (PVA or PVP), and the concentration of plasticizer (BG). Organoleptic tests including pH, viscosity, film drying time and film swelling were evaluated.
2. Materials and Methods
2.1 Material
Polyvinylpyrrolidone K90 (PVP-K90, molecule weight 90,000 Daltons) was purchased from Chanjao Longevity Co., Ltd. (Bangkok, Thailand), Polyvinyl alcohol (PVA, Mowiol® 18-88, molecule weight 130,000 Daltons) was purchased from Sigma Aldrich (Missouri, USA). Butylene glycol was purchased from Chanjao Longevity Co., Ltd. (Bangkok, Thailand). Other chemicals in gel formulations were cosmetic grade.
2.2 Preparation
The gel base contained some basic ingredients. Two gelling agents were dispersed in butylene glycol. The stabilizer, chelating agent, whitening agent, and preservative were dissolved in purified water before the mixture of gelling agents was added, homogeneously. Moisturizer and PVP-K90 or PVA were added to the gel at the final step. The concentrations of PVP-K90, PVA, and BG in the formulations were 5 or 10 %w/w.
2.3 Method
2.3.1 Physical appearance and pH
The physical appearance was seen as its color and consistency visually. The pH value was determined by using a digital pH meter. (S220, Mettler Toledo, USA). The results were expressed as the mean ± SEM of three measurements.
2.3.2 Viscosity
Rheology measurement was made using a Rheometer (HAAKE MARS 40/60, Thermo Scientific, USA). Data analysis was made using Haake Rheo-Win. The spindle specification was a parallel plate (C60 1◦/Ti-02180278). The temperature of the gels were set constant at 25 ± 0.20 °C (KASSAB et al., 2017). The shear rate ranged from 0.1 to 100 s-1. The graphs were then presented as shear stress (τ) to the function of shear rate (γ ). The results were expressed as the mean ± SEM of three measurements.
2.3.3 Film formation and drying time
Film drying time was evaluated by a hot air oven and on the skin. Approximately 0.2 g of each formulation was spread over a glass plate of 2x2 square centimeters forming with a thickness of approximately 2.0 millimeters. The glass plate was heated in the hot air oven (37.0 °C) to simulate skin temperature (Vieira et al., 2009). For the evaluation on the human skin, 0.2 g of each formulation was applied over the researcher’s skin (n=1) of 2x2 square centimeters, forming a uniform mask layer with a thickness of approximately 2.0 millimeters. The researcher stayed at room temperature (25.0 °C, 65% RH) to simulate virtual reality. The end point of drying time was when non-sticky film surface was observed by touching. The results were expressed as the mode of three measurements.
2.3.4 Swelling of the film
The swelling of the polymeric films was evaluated by measuring the weight increase after adding
Yokputtaraksa et al CF19 Page 102
water on the dry film. Approximately 0.2 g of each formulation was distributed on a 2x2 cm2 glass sheet. The glass plate was placed to heat in the hot air oven (40.0 °C). Samples of each film were weighed. The film was then placed on a glass slide, the water was dropped on the film, the excess water was wiped with blotting paper, and the swollen film was weighed (Peh and Wong, 1999). The results were expressed as the mean ± SEM of three measurements. The degree of fluid uptake was calculated as a swelling index using the following equation: swelling index = (final weight - initial weight)/ initial weight) ×100
2.3.5 Statistical analysis
All results were analyzed with the IBM SPSS statistics program (version 28). Data and statistical analysis were done by using the one-way analysis of variance (one-way ANOVA) Post Hoc Tests, Tukey HSD. A value of p < 0.05 was considered statistically significant.
3. Results and Discussion
3.1 Physical appearance and pH
The physical appearance included the color, and consistency of the preparation. The appearance of the formulation is demonstrated in Figure 1. All peel-off mask gels had no color and semi-solid consistency. The texture of the gels weas stretchy, soft, smooth, and easy to apply.
The pH of the formulation is shown in Table 2. The pH value should be in the broad range of skin pH (from 4.0 to 7.0) to avoid any irritation to the skin and the pH of our peel-off mask gel preparations was approximately 5 (Ali and Yosipovitch, 2013). Therefore, the pH of peel-off mask gel preparations was within the optimal pH range of the skin. Different concentrations of film-former and butylene glycol contributed to significantly different pH (p<0.01). When the film-former concentrations were increased,thepH waslower than thecontrol becausethe pH of thefilm-former wasaround 5.0, whereas the gel base had a pH of 5.0-6.0.
3.2 Viscosity
All the gel formulations demonstrated the non-Newtonian shear-thinning pseudoplastic type of flow. A typical example of the flow curve of the gel formulations is shown in Figure 2 The viscosity of all gels decreased concerning the applied shear rate, which caused better skin spreadability.
The viscosity of each formulation was measured using a Thermo Scientific Rheometer at shear rates of 1 and 10 s-1, where 1 s-1 was a representative of self-leveling and 10 s-1 was a representative of spreading force on the skin The viscosity of the formulation was shown in Figure 3. Different types of film-formers produced not significantly different results (p=0.658 to 1), but formulations compared to the control had significantly different results (p <0.01). This means that adding a film-former to the formulationhadaneffect on viscosity because PVAand PVP were viscosity-enhancing (NairB., 1998) PVA10/BG5 and PVA10/BG10 have the highest viscosity. As a result, increasing the concentration of film-formerproducedsignificantlydifferentresults(p<0.01)similartootherstudies(SatoandKohnosu, 1994; Yuliani, 2010).
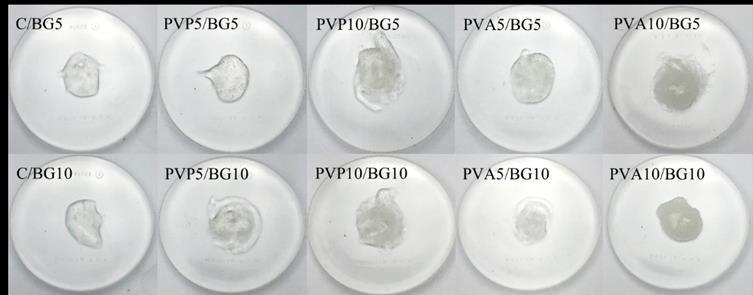
Yokputtaraksa et al CF19 Page 103
Figure 1 Gel appearance on transparent glass (C – Control group: gel base without film former)
*Results are presented as (mean ± SD)
The drying time of peel-off mask gels was one of the key criteria to identify the application time. The evaluation was performed on the researcher's skin in order to imitate the real application and to establish the setting for the hot air oven. The film formation characteristics from the researcher’s skin of all formulations were shown in Figure 4. Both types of film-formers (PVP, PVA) could form film well but had different film characteristics. PVP provided a moist, flaky film, whereas PVA gave a dry, continuous film. In contrast, films from a gel base (control) created a wet, non-continuous film. As a result, the types of film-former influenced film characteristics.
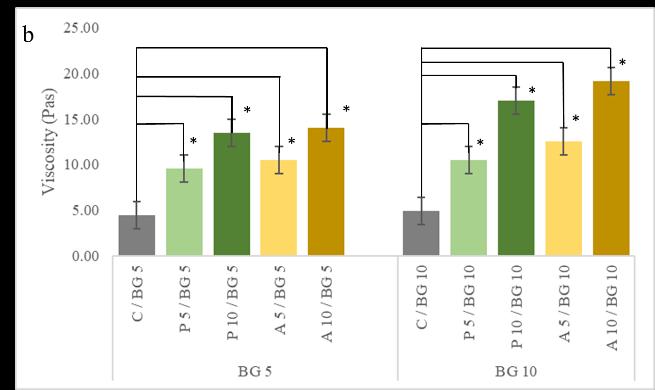
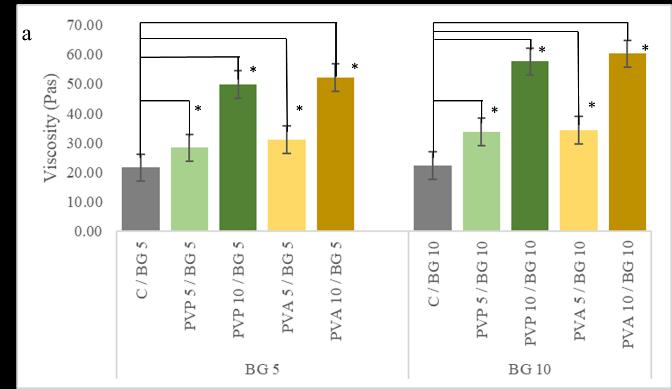
Film drying time was evaluated by two methods: in the hot air oven and on the researcher’s skin.
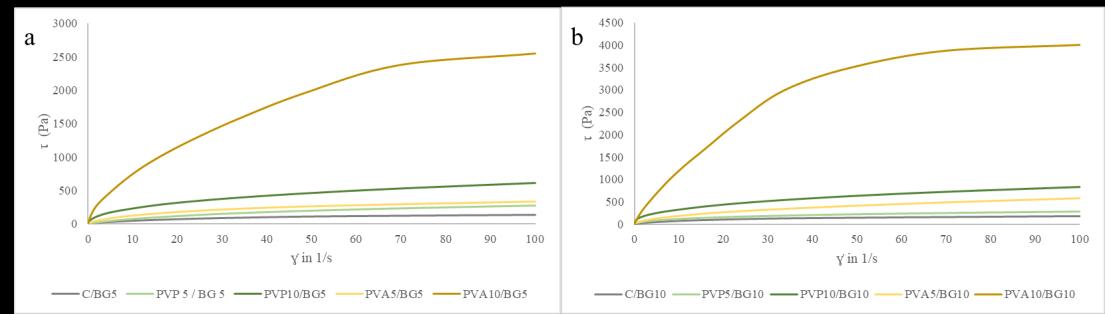
Yokputtaraksa et al CF19 Page 104
Formulation pH (mean ± SD) C/BG5 5.54±0.02 PVP5/BG5 5.43±0.01 PVP10/BG5 5.08±0.02 PVA5/BG5 5.44±0.03 PVA10/BG5 5.24±0.03 C/BG10 5.51±0.01 PVP5/BG10 5.22±0.01 PVP10/BG10 5.15±0.01 PVA5/BG10 5.27±0.01 PVA10/BG10 5.47±0.01
Table 2 pH of peel-off mask gels
Figure 2 Shear rate vs shear stress plot of all formulations with (a) BG 5 or (b) BG 10
Figure 3 The viscosity of the formulation at (a) shear rate 1s-1 and (b) shear rate 10 s-1 *indicates a significant difference (p<0.05).
3.3 Film formation and drying time
The evaluation from both methods was in the same direction. The drying time was shown in Figure 5. Ideally, the peel-off mask gels should dry between 15
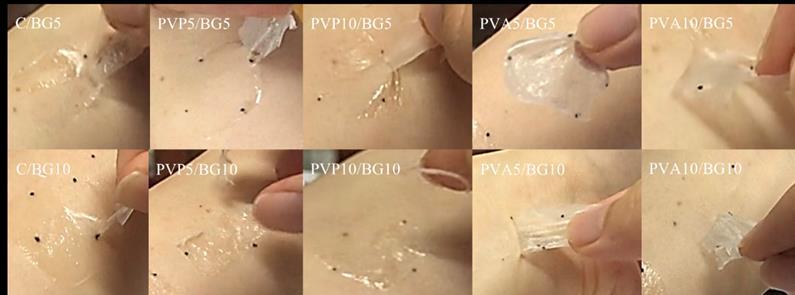
30 minutes (Vieira et al., 2009). However, the formulation in this study took longer than 30 minutes to dry, possibly because it did not use alcohol such as ethanol, as in other studies (Teng et al.,2010; André O’Reilly et al.,2013; Intan et al., 2018). When the concentrations of PVP were increased, the drying time was increased, because PVP was known as a hygroscopic compound, which caused the increase of the water content in the peel-off mask gels, and as a result, the dry time of the preparation was longer (Teng et al., 2010). On the other hand, When the concentration of PVA was increased, the drying time was decreased. The ability of PVA to attach to existing water molecules causes the attraction among water molecules and an increase in cohesiveness, then the dry time of the preparation was faster (Syamsuri and Isriany, 2021). Fast drying ability of PVA formulations was found in another study (Rahmasari et al., 2019). The drying time of all formulations was a significant difference from the gel base without film former (p<0.01), but the different concentrations of BG did not cause any significant results (p=0.608 to 1).
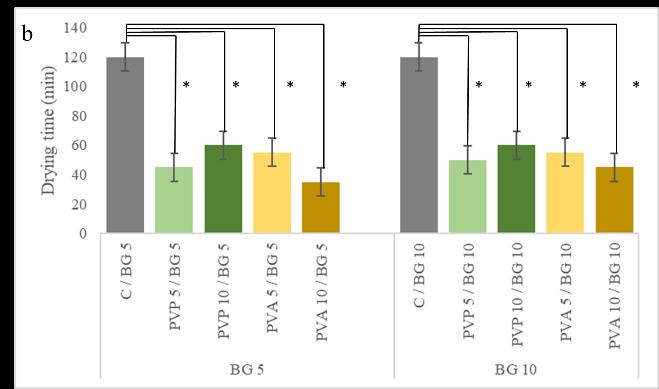
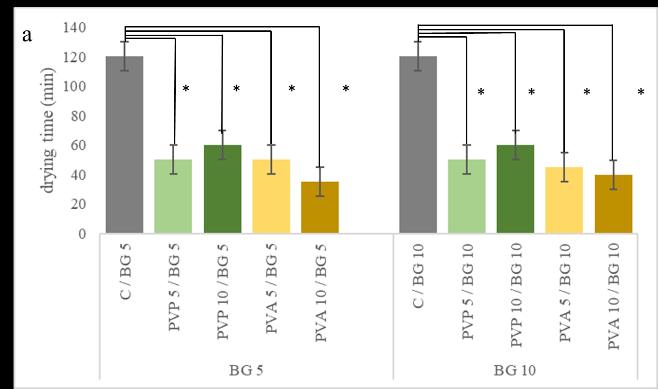
3.4 Swelling of the film
The swell test was one of the numerous polymer capabilities that may be employed for various purposes, such as liquid absorption. The swelling index was calculated and shown in Figure 6. It can be seen that all formulations were capable of swelling because all formulations, including the control, consistedofgellingagentswithexcellentswellingcapability.Thecontrolexhibitedthehighestswelling index due to the swelling ability of gelling agents in the gel base. However, when the film-former was added to the formula, the swelling index was significantly reduced (p<0.01). The film’s swelling depended on polymer network’s porosity and crosslinking density. When the polymer network increases, as the concentration of film-former increases, gel porosity and the ability to swell decrease (Gupta et al., 2011; Gupta et al., 2019). However, both the types of film-former and BG concentration produced insignificantly different results (p=0.06 to 0.995 and 0.924 to 1, respectively).
Yokputtaraksa et al CF19 Page 105
–
Figure 4 Film formation characteristics from the researcher’s skin of all formulations.
Figure 5 Film drying time of the formulation from (a) a hot air oven or (b) researcher’sskin *indicates a significant difference (p<0.05).
4.Conclusion
All formulations could form film for peeling masks. Adding PVA or PVP as a film former in the formulations provided different texture and film characteristics, and PVA demonstrated the continuous films which were suitable for our application. Different concentrations of film formers had a substantial influence on pH, gel viscosity, drying time, and swelling of the films In contrast, butylene glycol concentration had little effect on gel and film characteristics.
5.Acknowledgements
The authors would like to thank K Agro-Innovate, Thailand for funding this research for support a grant.
6.References
Ali, S. M. & Yosipovitch, G. (2013) ‘Skin pH: From basic science to basic skin care’, Acta DermatoVenereologica, 93(3), 261–267.
André O’Reilly, B. & Julia Macedo, R. (2013). Green Clay and Aloe Vera Peel-Off Facial Masks: Response Surface Methodology Applied to the Formulation Design. American Association of Pharmaceutical Scientists, 14(1), 445–455. DOI: 10.1208/s12249-013-9930-8
Gupta, S., Pramanik, A. K. & Kailath, A. (2009). Composition dependent structural modulations in transparentpoly (vinyl alcohol)hydrogels. Colloids and Surfaces B: Biointerfaces,74, 186–190.
Gupta, S., Webster, T. J. & Sinha, A. (2011). Evolution of PVA gels prepared without crosslinking agentsas a cell adhesive surface. Journal of Materials Science: Materials in Medicine, 22(7), 1763-72.
Hariyadi, D. M. & Isnaeni, I. (2021). Formulation of Peel-Off Mask Containing Natural Antibacterial: Study on Poly Vinyl Alcohol (PVA) and Virgin Coconut Oil (VCO) Contents. Tropical Journal of Natural Product Research, 5(3), 514-518.
Intan, L., Uce, L., & Diah Riski, G. (2018). Antioxidant activity and irritation test of peel off gel mask of ethanol extract of pedada fruit (Sonneratia caseolaris). International Conference On Pharmaceutical Research And Practice. ISBN:978-979-98417-5-9.
Jimtaisong, A. & Saeakonsri, T. (2019). Chitosan intercalatedbentonite as natural adsorbent matrix for water-soluble sappan wood dye. International Journal of Biological Macromolecules, 129, 737-743.
KASSAB, H. J., Thoma,s L. M. & Jabir, S. A. (2017). Development and Physical Characterizations of a Periodontal Bioadhesive Gel of Gatifloxacin. International Journal of Applied Pharmaceutics, 9(3), 31-6.
Lieber, M. A. (1985). Final Report on the Safety Assessment of Butylene Glycol, Hexylene Glycol, Ethoxydiglycol, and Dipropylene Glycol. JOURNAL OF THE AMERICAN COLLEGE OF
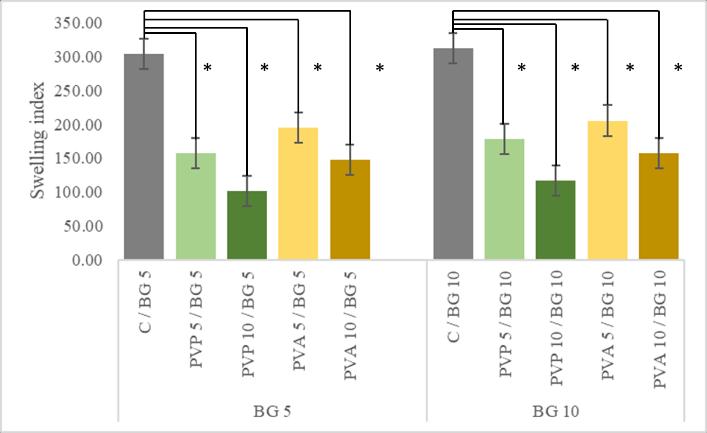
Yokputtaraksa et al CF19 Page 106
Figure 6 Swelling index of the formulations. *indicates a significant difference (p<0.05).
TOXICOLOGY, 4.
Nair, B. (1998). Final Report On the Safety Assessment of Polyvinylpyrrolidone (PVP). International Jornal of toxicology, 17, 4. https://doi.org/10.1177/109158189801700408
Nair, B. (1998). Final Report on the Safety Assessment of Polyvinyl Alcohol. International Jornal of toxicology, 17(5), 67-92.
Nešić, A. & Ružić, J. (2017). Pectin-polyvinylpyrrolidone films: A sustainable approach to the development of biobased packaging materials. Composites Part B: Engineering, 110, 56-61.
Nilforoushzadeh, M. A., Amirkhani, M. A. & Zarrintaj, P. (2018). Skin care and rejuvenation by cosmeceutical facial mask. Journal of Cosmetic Dermatology, 1–10. DOI: 10.1111/jocd.12730
Peh, K.K. & Wong, C.F. (1999). Polymericfilmsas a vehicle for buccal delivery:swelling,mechanical and bioadhesive properties. Journal of Pharmaceutical Sciences, 2, 53-61.
Rahmasari, D., Ermawati, D. & Nugraheni, R. W (2019). Design and Development of Peel-off Mask Gel Formulation of Citronella Oil for Acne Vulgaris. The Health Science International Conference. DOI: 10.5220/0009126101570163
Sato, T. & Kohnosu, S. (1994). Effect of polyvinylpyrrolidone on the physical titanium dioxide suspensions. Colloids and Surfaces ELSEVIER A: Physicochemical and Engineering Aspects, 88, 197-205.
Syamsuri, S., Isriany, I. (2021). Characterization and Anti-aging Tests of Peel-Off Gel Masks Made from Ethanolic Extract of Yarrow (Achillea millefolium). Open Access Macedonian Journal of Medical Sciences, 27, 9, 1156-1161.
Teng, J., Bates, S. & Engers, D. A. (2010). Effect of water vapor sorption on local structure of poly(vinylpyrrolidone), Journal Of Pharmaceutical Sciences, 99, 3815–3825. DOI: 10.1002/jps.22204
Vieira, R. P. (2009) ‘Physical and physicochemical stability evaluation of cosmetic formulations containing soybean extract fermented by Bifidobacterium animalis’, Brazilian Journal of Pharmaceutical Sciences, 45(3), 515
525.
Yuliani, S. H. (2010) ‘Optimasi Kombinasi Campuran Sorbitol, Propilenglikol dalam Gel Sunscreen Ekstrak Etanol Curcuma mangga’, Majalah Farmasi Indonesia, 21(2), 83
89.
Yokputtaraksa et al CF19 Page 107
–
–
*********************
Proceeding of Cosmetic & Beauty International Conference 2022 Future of the Next Beauty (CBIC 2022)
7th-9th December 2022
Formulation and stability testing of hydrating water containing protein hydrolysate from Pleurotus ostreatus (FR.) Guel.
Pariya Atawong 1 , Natthamon Sriprom 1 , Suphapit Sitti 1 , Jongrak Attarat 2 , Worasak Kaewkong 2 and Worawut Kriangkrai 1*
1Faculty of Pharmaceutical Sciences, Naresuan University, Phitsanulok 65000, Thailand
2Faculty of Medical Science, Naresuan University, Phitsanulok 65000, Thailand
*Corresponding author. E-mail: wg kriangkrai@gmail.com
Abstract
Protein hydrolysate has been used in cosmetic products for more than 50 years. It has moisturizing properties and improved skin barrier. This research aimed to develop a hydrating water containing protein hydrolysate from Pleurotus ostreatus (FR.) Guel. The physicochemical properties and stability testing of the hydrating water were investigated. The hydrating water containing 0.05% and 0.20% protein hydrolysate was successfully developed as a clear yellow liquid, with a viscosity in the range of 1.30-1.40 cP. The moisture and rate of water loss of the skin were measured by Corneometer and Tewameter to compare these properties to the formulation without protein hydrolysate. Protein hydrolysate (0.20%) tended to increase skin moisture and reduce the rate of water loss from the skin after being applied for 60 min. A satisfaction survey of the formulation was tested with 30 healthy volunteers and the hydrating water containing 0.05% protein hydrolysate received the highest score. The physicochemical properties of this formulation were similar to the commercial product. The hydrating water containing protein hydrolysate was stable under 45±2°C, 75±5% RH for 1 month.
Keywords: Protein hydrolysate; Pleurotus ostreatus (FR.) Guel ; Hydrating water; Stability; Moisturizer; Satisfaction survey.
1. Introduction
Thailand is a country that has a favorable environment for the cultivation of mushrooms which are common fungi and are commonly consumed in Thailand. There are 13 types of economic mushrooms grown in Thailand, namely Pleurotus pulmonarius, Pleurotus cystidiosus, Pleurotus ostreatus (FR.) Guel, Auricularia auricula-judae, Lentinus polychrous Berk, Lentinus squarrosulus, Lentinus edodes (Berk.) Sing, Coprinus fimetarrius, Cyclocybe aegerita, Calocybe indica (P & C), Schizophyllum commune, Ganoderma lucidum, and Cordyceps sinensis. Mushroom production in Thailand has increased in Thailand over recent years. The Mushroom Researchers and Cultivation Association of Thailand found that in 2017, the amount of mushroom production was 41,322 tons, worth 2,291 million baht and in 2020, about 150,000 tons of fresh mushrooms were produced, worth 9,000 million baht (Buraso, 2017). However, there is an oversupply of mushrooms such as the shiitake mushrooms and the white log mushroom which are local mushrooms that are cultivated and have a high yield. This oversupply results in a substantial quantity of the harvest rotting, reducing the incomes of the growers
Therefore, other uses of both types of mushrooms are needed to add value to growers, to get the most benefit from mushroom growing (Heldreth, 2012; Scibisz et al., 2008; Wu et al., 2016) The cosmetic market is this other outlet
Apart from their tastiness as a culinary ingredient, mushrooms contain valuable cosmetic bioactive ingredients, particularly protein which is one of the main components of the mushroom
Proteins and their hydrolysates from natural sources are commonly used as ingredients in hair and skin
CF20 Page 108
care products (Aguirre-Cruz et al., 2020; Daithankar et al., 2005; McCarthy et al., 2013; Schrieber & Gareis,2007) Proteinshydrolysatesslowed down the deteriorationof the skin because it increasingthe moisture content of the epidermis and stratum corneum (Chang & Miles, 2004) It could reduce inflammation by reducing the TNF-α level (Manzi & Pizzoferrato, 2000). Moreover, the protein hydrolysates increase the strength of the skin by providing viscoelasticity and protecting skin aging (Sujarit et al., 2021) Hence, one method that can increase the value of mushrooms is by processing them into protein hydrolysate by extracting and undergoing hydrolysis at the peptide bond region containing short-chain peptides and free amino acids. Processed protein hydrolysate has high bioavailability in cosmetics such as the long chain protein converting to a smaller peptide and amino acidwhichhave a smallermolecularweight,highersolubility,and higherabsorptioncapability (Scibisz et al., 2008) Protein hydrolysates are soluble in water, non-toxic and dermatologically safe, providing good biological and moisturizing properties for the skin.
The objectives of the present research were to develop a hydrating water containing protein hydrolysate from Pleurotus ostreatus to serve as a moisturizer and to test its stability. A cohort of 30 volunteers participated in the program and responded to a satisfaction survey carried out using a questionnaire.
2. Materials and Methods
2.1 Materials
Protein hydrolysate from Pleurotus ostreatus (PHP) extracted with proteolytic enzymes to produce peptides below 3 kDa, was obtained from the Thai Mushrooms Hydrolysate laboratory of the Faculty of Medical Science, Naresuan University, Thailand. This laboratory researches skincare product development in association with 5 Phitsanulok mushroom farms Butylene glycol, polyethylene glycol 400 and glycerin were obtained from Chanjao Longevity Co., Ltd, Bangkok, Thailand. phenoxyethanol was obtained from Sharon Laboratories Ltd., Ashdod, Israel and potassium sorbate was obtained from BASF (Thai) Ltd., Bangkok, Thailand.
2.2 Preparation of hydrating water formulations
Hydrating water formulations were prepared by solubilizing and mixing hydrophilic ingredients in a DI water The mixer was firstly prepared by solubilizing potassium sorbate in water, and butylene glycol, polyethylene glycol 400, glycerin PHP and phenoxyethanol were added and the solution was then homogenized. All 3 formulae had different %w/w of ingredients (Table 1) Hydrating water without PHP was prepared as a placebo Commercial product containing protein hydrolysate from mushrooms (Formulation D) were purchased from a hypermarket.
2.3 Characteristics of hydrating water
The pH value, clarity and sedimentation of the hydrating water were observed by visual observation The viscosity of the hydrating water was measured (CP-40, 50-200 rpm) by a viscometer (Brookfield Engineering Laboratories, Middleboro, MA).
Table 1. Ingredients and functions of substances in the hydrating water
Atawong et al CF20 Page 109
Formulation (%w/w) Ingredients F1 F2 F3 Function DI water Butylene glycol Polyethylene glycol 400 Glycerin Phenoxyethanol Potassium sorbate PHP 94.35 2.00 2.00 1.00 0.50 0.10 0.05 90.45 4.00 4.00 1.00 0.50 0.10 0.05 90.45 4.00 4.00 1.00 0.50 0.00 0.05 Solvent Humectant Humectant Moisturizer Preservative Preservative Moisturizer
2.4 Stability Study of hydrating water
The stability of the hydrating water was studied by the accelerated method. The sample products were stored at 45 ± 2°C in 75 ± 5% relative humidity for 1 month. The physicochemical properties of the hydrating water products, such as pH value, clarity, and viscosity, were observed before and after testing, and the protein hydrolysate content of hydrating water was determined.
The Lowry assay (Bollag & Edelstein, 1991) was used for measuring the protein levels of the hydrating water in 96-well plates. After the preparation of Solution A (100 mL of distilled water with 5 g of CuSO4 · 5H2O) and Solution B (1 L of distilled water with 21.2 g of Na2CO3, 4 g of NaOH), Solution C (1 mL of Solution A and 50 mL of Solution B) was prepared, followed by Solution D (10 mL of Folin-Ciocalteu phenol reagent and 10 mL of DI water). A 20 μL sample of mushroom protein hydrolysate was added to 200 μL of solution C and the solution was left at room temperature for 15 min. Then 20 μL of Solution D was added to the solution which was left for a further 30 min at room temperature. The absorbance of the sample was measured at 750 nm, using a microplate reader, and the protein concentration was estimated using a BSA standard curve from the same plate.
2.5 Study on skin moisturizing efficacy and transepidermal water loss (TEWL)
A 50 µL amount of each hydrating water formulationwas dropped onto the forearm in a test area of 2×2 cm2. At a predetermined time, skinmoisture was determinedusing a Corneometer (Model CM 825, Courage+Khazaka electronic GmbH, Germany), and water loss from the skin was measured using a Tewameter (Model TM 300, Courage+Khazaka electronic GmbH, Germany) Each formulation was measured 8 times.
2.6 Satisfaction questionnaire study
In this study, a satisfaction questionnaire, which was approved by the Ethics Committee of Naresuan University Institutional Review Board, Naresuan University, Thailand (IRB No. P1-0081/2565), was given to each participant. The inclusion criteria for the study were that participants were healthy Thai females aged between 20 and 35 years. Thirty volunteers participated and their demographic information was recorded. Information on their cosmetic use was also ascertained. The information gathered from the satisfaction questionnaire was about formulation factors, including appearance, color, clarity, and attractiveness, as well as viscosity, of the product For each question in the questionnaire, the answer choices were: excellent, moderate, poor, and bad. These choices were given a score of 4, 3, 2, and 1 respectively. The scores were averaged, and analyzed, to identify the shortcomings of the formulations to be resolved.
3.Results and Discussion
3.1 Development and characterization of hydrating water
To study the solubility of the PHP in the hydrating water formulations with different ratios of components were prepared. As can be seen in Figure 1, formulation F1 exhibited turbidity and agglomeration of proteins. Formulation F2 that contained a higher amount of co-solvent exhibited a higher level of protein agglomeration and turbidity than Formulation F1 Formulation F3, however, which was hydrating water without salt of organic acid preservatives, exhibited a clear yellow liquid with no agglomeration of proteins These results suggested that potassium sorbate causes the salting outof PHP (Alvarez-Riveraet al.,2018) Hence,F3 wasusedasthestartingformulainthe development of hydrating watercontaining PHP, as illustrated in Table 2 where Formulation B contains 0.05% PHP and Formulation C contains 0.20% PHP. Formulation A, the control, contained no PHP.
Increasing the amount of PHP in the hydrating water caused a dark yellow color resulting from the yellow color of the PHP. However, no change in pH and no sedimentation were observed. Increasing the PHP concentration did not affect the viscosity of hydrating water because PHP contains short-chain peptides. All formulations exhibited Newtonian fluid flow meaning that the viscosity is constant and independent of the shear rate (Rehman et al., 2022).
3.2 Stability of hydrating water
A stability test was performed at accelerated conditions at 45 ± 2°C and 75 ± 5% RH for 1 month (Table 2) It was found that all three developed formulations did not change in terms of pH, color, clarity, and viscosity According to a Lowry assay, the PHP content in B was 0.52 µg/µL and 1.38
Atawong et al CF20 Page 110
µg/µL in C. After accelerated conditions, The PHP content did not change which suggests that PHP was stable in the developed hydrating water
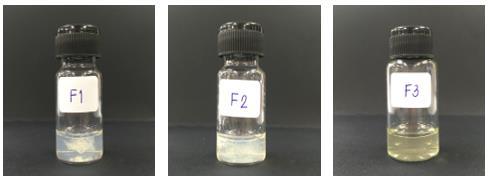
3.3 Study on skin moisturizing efficacy and transepidermal water loss (TEWL)

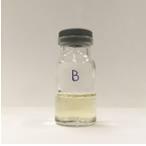
The efficacy of skin moisturizing of all formulations was measured using a corneometer and transepidermal water loss was measured using a Tewameter (Figures 2 and 3) The concentration of PHP was effective in increasing skin moisture and decreasing transepidermal water loss. This demonstrated that B and C are active moisturizers, similar to commercial products containing protein hydrolysate from mushrooms (D)
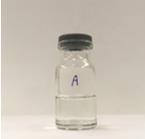
Atawong et al CF20 Page 111
Figure 1 Solubility of PHP in the hydrating water with different ratio of components
Formulation A (without
B (
C (0.20%
Fresh preparation Appearance pH 7 7 7 Color/clarity Clear Clear yellow Dark yellow Sedimentation no sediment no sediment no sediment Viscosity (cP) 1.35±0.04 1.46±0.01 1.38±0.03 Protein content (ug/ μl) - 0.52±0.01 1.38±0.03 45 °C for 1 month Appearance pH 7 7 7 Color/clarity Clear Clear yellow Dark yellow Sedimentation no sediment no sediment no sediment Viscosity (cP) 1.36±0.05 1.49±0.02 1.29±0.01 Protein content (ug/ μl) - 0.58±0.01 1.40±0.01
Table 2 Characteristics of hydrating water and stability testing after 45 °C for 1 month
PHP)
0.05% PHP)
PHP)
3.4 Volunteer satisfaction questionnaire of hydrating water
More than 70% of the volunteers (21 female volunteers) were 20-25 years old. They used the hydrating water daily. The product satisfaction data was a single-blind experiment in A, B, C, and D (Figure 4). Responses from the satisfaction questionnaire about the hydrating water products regarding the characteristics of the products indicated that the volunteers were more satisfied with the clear,
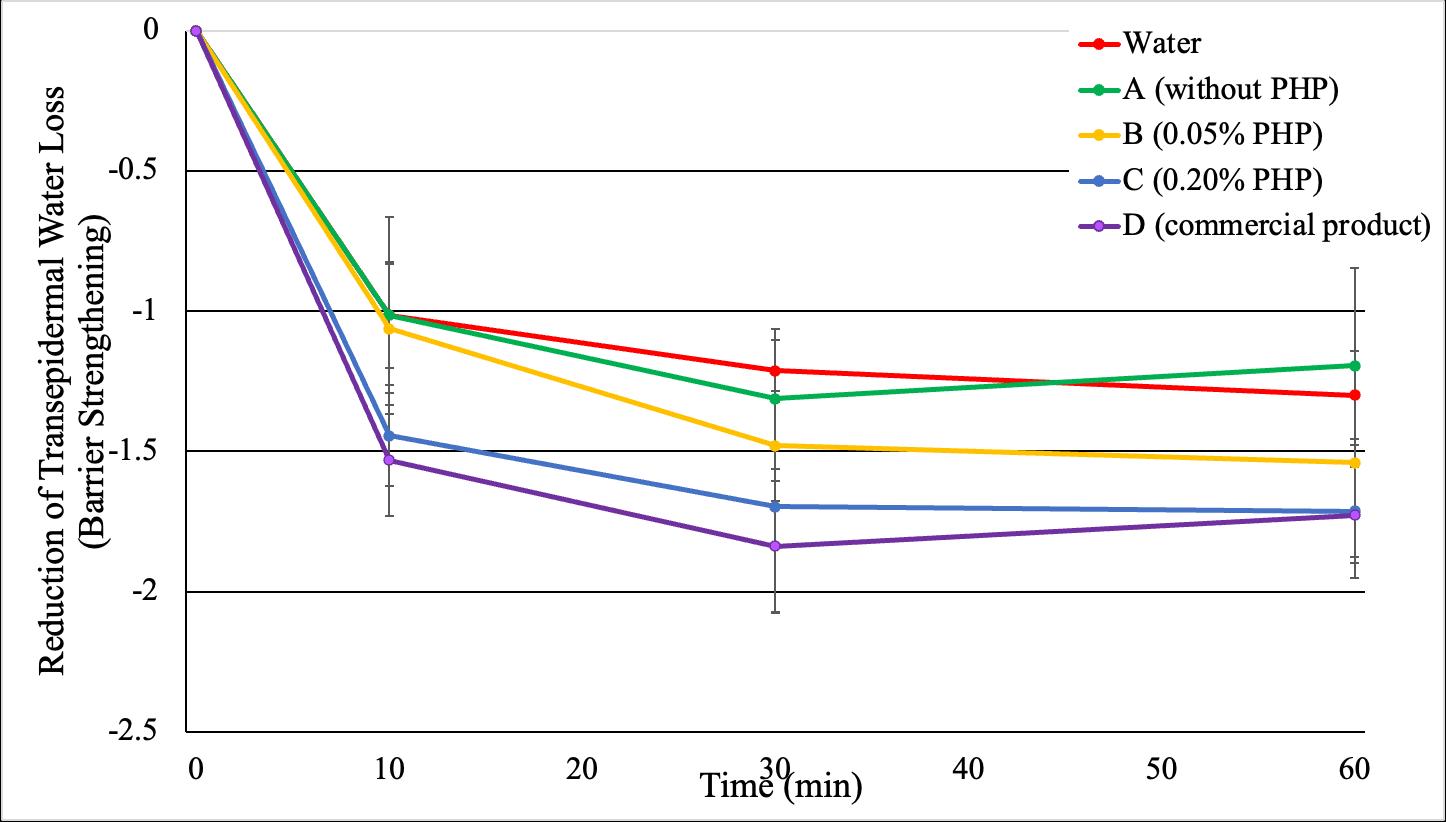
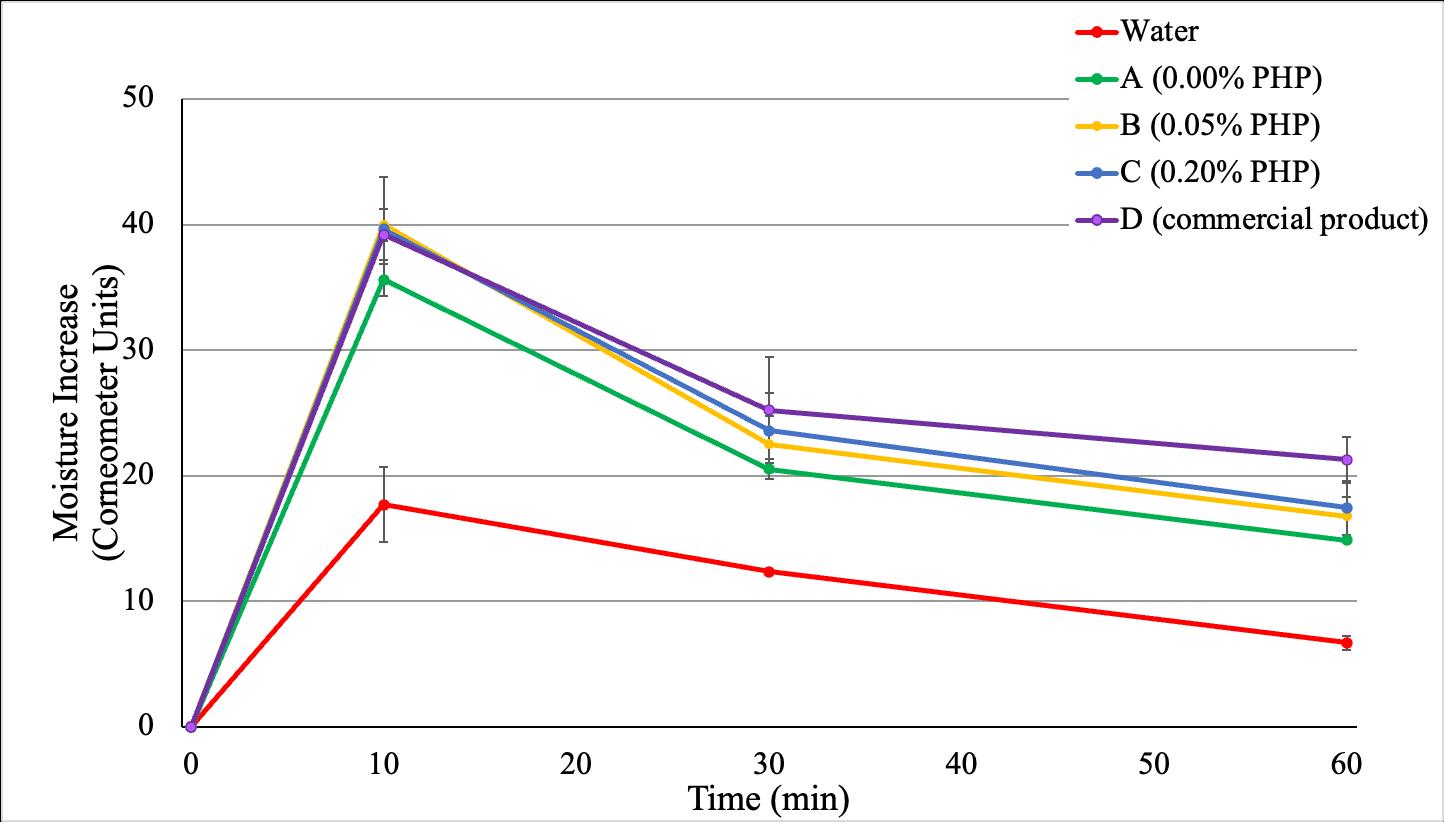
Atawong et al CF20 Page 112
Figure 2 Effect of the formulation containing PHP on skin moisture following the application of the product at various intervals.
Figure 3 Effect of the formulation containing PHP on transepidermal water loss following application of the product at various intervals.
colorless hydrating water than with the clear formula that was slightly yellow. The volunteers had the highestsatisfactionwiththeviscosityof Daheadof AthenBandC.Becausethevolunteerswerepeople who had already used hydrating water products in their daily lives, they were more familiar with commercial products than with the 3 developed recipes. The volunteers indicated that they were interested in B because it is clear, light yellow, not very dark, had low viscosity, was highly absorbed through the skin and not greasy These characteristics made B more preferable than A, D and C.
4. Conclusion
PHP can be used as an effective ingredient and has promising potential in moisturizing effect and water loss prevention. The results confirmed that incorporating mushroom protein hydrolysate in the hydrating water enhanced skin moisture and decreased skin water loss. Satisfaction of volunteers on hydrating water results gave similar results that confirmed the effectiveness of cosmeceutical formulations containing PHP. Thus, we concluded that PHP is a valuable ingredient in cosmeceuticals, and we can use containing PHP to develop cosmeceutical products in various ways that are stable, pleasant in appearance, and provide great benefits to the dry skin
5.Acknowledgements
This research was made possible in part with generous grants from Naresuan University, Thailand (Basic research fund: 2022, grant no. R2565B022) and from the Center of Excellence for Innovation in Chemistry (PERCH-CIC), Thailand. We also thank Mr Roy I. Morien of the Naresuan University Graduate School for his editing of the grammar, syntax, and general English expression in this document.
6.References
Aguirre-Cruz, G., León-López, A., Cruz-Gómez, V., Jiménez-Alvarado, R., & Aguirre-Álvarez, G. (2020). Collagen hydrolysates for skin protection: Oral administration and topical formulation. Antioxidants, 9(2), 181.
Alvarez-Rivera, G., Llompart, M., Lores, M., & Garcia–Jares, C. (2018). Preservatives in cosmetics: Regulatory aspects and analytical methods. In Analysis of cosmetic products (pp. 175-224).
Bollag, D., & Edelstein, S. (1991). Protein method Wiley-Liss publication.
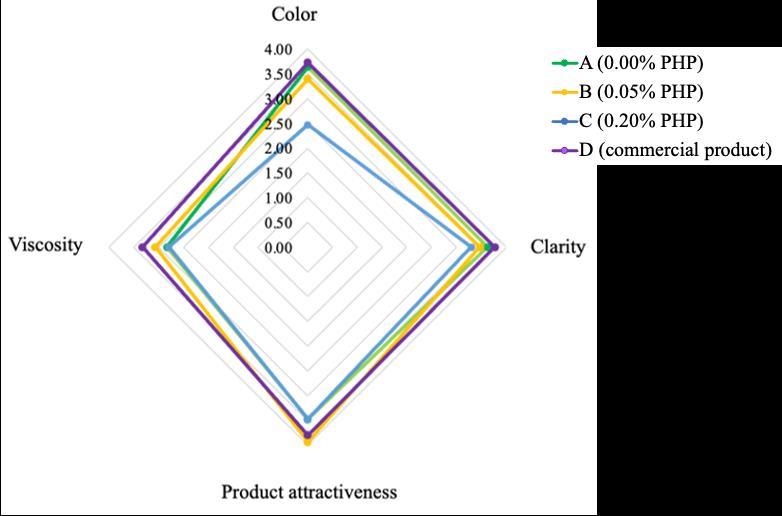
Atawong et al
Page 113
CF20
Figure 4 Product satisfaction assessment by single-blind experiment
Buraso, C. (2017). Collection of information on production andmarketing of economic mushrooms and edible wild mushrooms in the country. NSTDA. https://waa.inter.nstda.or.th/stks/pub/2021/20210817-economic-mushroom-market.pdf
Chang, S.-T., & Miles, P. G. (2004). Mushrooms: cultivation, nutritional value, medicinal effect, and environmental impact. CRC press.
Daithankar, A., Padamwar, M., Pisal, S., Paradkar, A., & Mahadik, K. (2005). Moisturizing efficiency of silk protein hydrolysate: Silk fibroin.
Heldreth, B. (2012). Hydrolyzed Source Proteins as Used in Cosmetics. In Cosmetic ingredient review. Washington DC.
Manzi, P., & Pizzoferrato, L. (2000). Beta-glucans in edible mushrooms. Food chemistry, 68(3), 315318.
McCarthy, A. L., O’Callaghan, Y. C., & O’Brien, N. M. (2013). Protein hydrolysates from agricultural crops bioactivity and potential for functional food development. Agriculture, 3(1), 112-130.
Rehman, S., Nasr, A., Eldin, S. M., & Malik, M. Y. (2022). Entropy Minimization for Generalized Newtonian Fluid Flow between Converging and Diverging Channels. Micromachines, 13(10), 1755.
Schrieber, R., & Gareis, H. (2007). Gelatine handbook: theory and industrial practice. John Wiley & Sons.
Scibisz, M., Arct, J., & Pytkowska, K. (2008). Hydrolysed proteins in cosmetic production, part II. SOFW J. Polish Ed, 1, 12-16.
Sujarit, K., Suwannarach, N., Kumla, J., & Lomthong, T. (2021). Mushrooms: Splendid gifts for the cosmetic industry. Chiang Mai J. Sci, 48, 699-725.
Wu, Y., Choi, M.-H., Li, J., Yang, H., & Shin, H.-J. (2016). Mushroom cosmetics: the present and future. Cosmetics, 3(3), 22.
Atawong et al CF20 Page 114
*********************
Screening evaluation of microbial contamination in expired and nonexpired cosmetics used by female university students
Jaksama Prasittiwet1, Chulaluk Polpong1 and Tinnakorn Theansungnoen1,2*
2
*Corresponding author. E-mail: tinnakorn.the@mfu.ac.th
Abstract
Cosmetics have a great effect on female university students to make the appearance of attractiveness and confidence. Microbial contamination in some cosmetics with low-quality productioncan befound.Thepurposeofthisstudywastoevaluatethemicrobial contamination in cosmetic products that are popular to use in female university students. This study included one hundred participants who are female university students at Mae Fah Luang University, Thailand. The participants were asked for providing general information, marking factors, and types of cosmetics that have usually been bought. Based on the cosmetics of the most favorite buying, four types of cosmetics with expired and non-expired dates including mascara, brushon, lipstick, and foundation were chosen for the evaluation of microbial contamination. The serial dilution technique and swab test were used to prepare cosmetic samples and measure microbial colonies in the samples, respectively. The results showed that most expired and nonexpired cosmetics were contaminated. The microbial contamination in the expired foundation and mascara was more than 1,000 cfu/g while that in the expired lipstick was less than 1,000 cfu/g. The expired brush-on did not have any microbial contamination. The microbial contamination in the non-expired foundation, mascara, and brush-on was found, but less than 1,000 cfu/g while that in the non-expired lipstick did not. The cell characteristics of microorganisms were observed by a light microscope. Most characteristics of microbial cells were expected to be bacilli and cocci. The results could be concluded that microbial contamination in the cosmetic products was likely to be found before and after expiration, but the expired products had a high risk to be contaminated extremely by microbes.
Keywords: Cosmetics; Expired products; Female teenager; Microbial contamination; Nonexpired products
1.Introduction
Cosmetics means products prepared for use on the skin or any part of the body by using, rubbing, massaging, spraying, or sprinkling with the purpose of cleaning or making it beautiful or changing the appearance of that person (Mitsui, 1997). Cosmetics also have the effect of increasing the confidence or self-esteem of the user (Gillen & Dunaev, 2017). In addition, at present, cosmetics are popular with both men and women due to changes in lifestyle and values (Kumar et al., 2014)
However, females still have a higher proportion of consumption of cosmetics than males, for example working women, the elderly, or teenagers, especially female students in university (Brown et al., 1986). Due to these reasons, there are many types of cosmetics in the market that can be categorized follow by the FDA into 13 groups, including baby products, bath preparations products, eye makeup preparations products, fragrance preparations products, hair preparations products (non-coloring), hair coloring preparations product, make-up preparations product (Base make-up), manicuring preparations
CF23 Page 115 Proceeding of Cosmetic & Beauty International Conference 2022 Future of the Next Beauty (CBIC 2022) 7th-9th December 2022
1School of Cosmetic Science, Mae Fah Luang University, Chiang Rai 57100, Thailand
Green Cosmetic Technology Research Group, School of Cosmetic Science, Mae Fah Luang University, Chiang Rai 57100, Thailand
product, oral hygiene product, personal cleanliness product, shaving preparations product, skincare preparations product (creams, lotions, powders, and sprays) and suntan preparations product (US FDA, 2022) Moreover, the quality and safety of cosmetics are very important and considered by consumers as the first priority of product production. Although there are a lot of cosmetics available for sale, sometimes some products, such as unsafe cosmetics or insufficient standard cosmetics, have been found.Microbial contaminationis crucial one of the causativefactors which usuallyresult in the quality degradationofcosmeticproducts. Microbesthatcontaminatecosmeticsmaybeopportunisticpathogens including non-pathogenic strains, e.g., Staphylococcus aureas this bacterium can produce filaggrin protein which can bind to the keratin fibers on the epidermis, helps to adjust fat levels, and maintain moisture (Reisch, 2017). The growth of microbes in cosmetics can cause many changes in the chemical characteristics and physical characteristics of the products resulting in feature changes in cosmetics suchasstickiness,odor,color,andevenphaseseparationandsedimentation.Inaddition,theregulations of Thailand in The Cosmetics Act B.E. 2558 state that cosmetics that have been opened and not opened must not detect pathogens are bacteria, fungi, and yeast, which are harmful to cosmetic users. For example,cosmeticproductswerecontaminatedwithsomepathogenssuchas Pseudomonas aeruginosa, which led to serious blindness (Wilson & Ahearn, 1977).
Nowadays, cosmetics have a great influence on teenagers because most teenagers choose to use cosmetics to decorate various parts of the body or to improve their appearance which cosmetics (Schiffman & Kanuk, 1994; Kim et al., 2005). The good or bad effects of cosmetics on teenagers may be from choosing to buy cosmetics that are not quality or the use of cosmetics that have expired for a long time, etc.
Therefore, the aim of this study was to measure the microbial contamination, of non-expired and expired cosmetics products among the popular uses in female students via the evaluation of microbial contamination. The questionnaire for cosmetic product types and uses was made to survey female students. The expired and non-expired cosmetics were used to evaluate microbial contamination.
2. Materials and Methods
2.1 Questionnaire for cosmetic product types and uses
This study was carried out at Mae Fah Luang University. The participants were 100 female students with bachelor’s degrees students. The online questionnaire was used as a tool to study an interesting type of cosmetics or uses of cosmetic products by participants. The online questionnaire was divided into 3 parts.
Part 1: General information
Part 2: Marketing factors
Part 3: Factor of products
2.2 Preparation and microbial contamination of cosmetic products
As shown in Figure 1, four popular make-up products without opening to use were foundation (expired and non-expired), brush-on (expired and non-expired), mascara (expired and non-expired), lipstick (expired and non-expired) The criteria to select expired products included the expired products for 1 year. The microbial contamination was determined by cotton swab test (Ismaïl et al., 2013) Products(0.3-0.6 g)were takenindividuallyintoa sterileglass bottle. Freshsterile nutrient broth (a) (b) (c) (d)

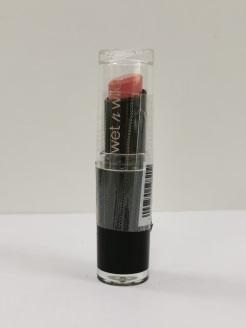
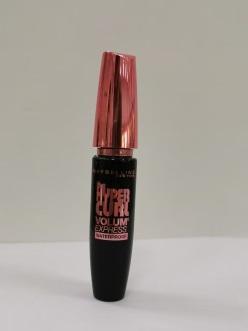
Prasittiwet et al CF23 Page 116
Figure 1 Types of cosmetic products used in the study. (a) Foundation, (b) Mascara, (c) Lipstick, and (d)Brush-on.
(10 ml) was added to each glass bottle and mixed well. Each sample mixture was prepared with a serial of two-fold dilution with the same volume (10 ml) to three concentrations (Table 2). Sterile cotton swabs were soaked into each sample concentration and then spread on plates that have nutrient agars. The experiment in each sample concentration was done in duplicate. All agar plates were incubated at 37 °C for 24 or 48 h. The microbial contamination of each product was measured by the colony count technique (Figure 2).
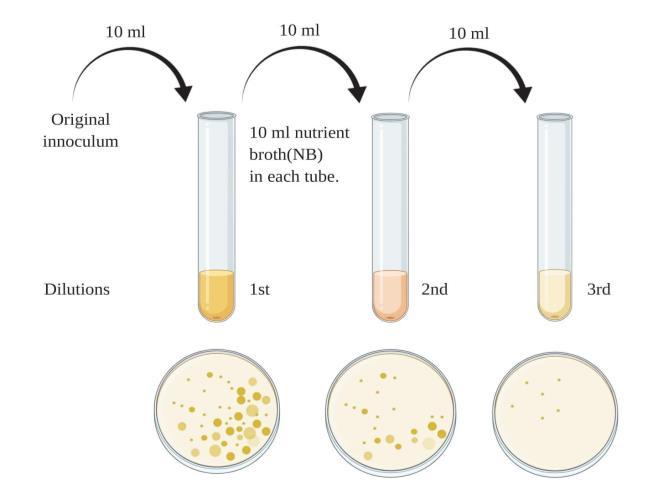
Table 2 Product concentration prepares by a two-fold dilution technique.
2.3 Gram staining test
The morphology of microbial cells was determined by the Gram-staining test (Sizemore et al., 1990). Briefly, a single colony in agar plate tests was inoculated on a drop of water on the slide and then smeared to be a thin film. The thin film was dried by passing through a flame fire, three times. Drops of crystal violet solution were covered all over a smeared film for 1 minute and then removed with tap water. The iodine solution was dropped on the same film for 1 minute, removed by tap water, and continuously de-stained by 95% ethyl alcohol for 15 seconds. After water washing, the smeared film was stained further by drops of safranin solution for 15 seconds and washed out. The cell morphology of microbes was observed by the microscopic examination technique.
3.Results and Discussion
3.1 Cosmetic product behavior
The questionnaire was created for the study of the types and uses of cosmetic products in female university students. The results are shown in (Table 1) that most of the participants were almost range aged 20-21 years there is an income above 10,000 baht/month. Most of them buy the products online and in beauty stores and are interested in the products of drug store brands from beauty blogger advertising by spending oncosmetic products 1,000-2,500 baht/month. Therefore,these results indicate
Prasittiwet et al
Page 117
CF23
Cosmetic Product concentrations (mg/ml) 1st dilution 2nd dilution 3rd dilution Expired products Foundation 12.50 6.25 3.12 Mascara 3.50 1.75 0.87 Lipstick 13.50 6.62 3.31 Brush-on 14.00 7.00 3.50 Non-expired products Foundation 14.25 7.12 3.56 Mascara 10.00 5.00 2.50 Lipstick 16.00 8.00 4.00 Brush-on 12.75 6.37 3.19
Figure 2 Microbial colony measured by colony count technique.
those female university students had the frequency to spend on cosmetic products 1,000-2,500 baht/month and their popular types of cosmetic products were make-up.
Table 1 General information, marketing factors, and product factors obtained by an online questionnaire.
Prasittiwet et al
CF23 Page 118
Characteristics Sample (n=100) Frequencies (rate) Age (years) 18-19 12 0.12 20-21 43 0.43 22-23 42 0.42 24-25 3 0.03 26 or above 0 0 Income (baht/month) Below 2,000 4 0.04 2,001-4,000 3 0.03 4,001-6,000 13 0.13 6,001-8,000 18 0.18 8,001-10,000 21 0.21 Above 10,000 41 0.41 How often buying cosmetic products (time/month) Never 0 0 1 34 0.34 2 31 0.31 3 13 0.13 More than 3 22 0.22 Place that to buy the products Beauty store 43 0.43 Convenience store 7 0.07 Drug store 7 0.07 Online 43 0.43 Brands that buy the most Counter brand 47 0.47 Drug store 49 0.49 Luxury brand 4 0.04 Advertising media that prefer to decide to buy a product Beauty blogger 66 0.66 Beauty magazine 1 0.01 Billboard 0 0.00 Blog 16 0.16 Social media 4 0.04 TV 0 0.00 Website 13 0.13 How much that spend on cosmetic products (baht/month) Less than 1,000 37 0.37 1,000-2,500 40 0.40
3.2 Microbial contamination in cosmetic products
Microbial contamination of popular cosmetic products was determined in both expired and nonexpired products. The results were shown in (Table 3). The microbial contamination of expired foundation was found at 0-800,000 CFU/g at the first dilution, mascara was found at 1,428.57-2,857.14 CFU/g at the first dilution, 1,142.86-2,285.71 CFU/g at second dilution, 0-1,142.86 CFU/g at third dilution. And lipstick was found 0-339.6 CFU/g at the first dilution. While that of expired brush-on was not found. The microbial contamination of non-expired foundation, mascara, and brush-on was found at 0-210.53 CFU/g, 0-400 CFU/g, and 0-78.43 CFU/g at the first dilution, while that of lipstick was not found. According to the acceptance criteria of the FDA, microbial contamination in cosmetic products must not be over 1,000 CFU/g for the general requirement of product quality and safety (SCCS, 2012; US FDA, 2001). Even though most non-expired products had been contaminated by microbial, the contaminations were less than 1,000 CFU/g. The results indicate that the non-expired products still had quality and safety for use. Most of the expired products, such as foundation, mascara, and lipstick, had beenfoundthemicrobial contaminationsandtheir contaminationlevelswereoverextremelythan1,000 CFU/g. Therefore, the results indicate that the expired products could not be safe for the consumer. The expected possible factors including low quality of raw materials, ingredients, production process, and storage temperature before use could lead to the microbial contamination of cosmetic products, as well as the severity of the contamination.
3.3 Morphology of microbial cells
The results are shown in (Figure 3). Microbial cells in expired cosmetic products, such as foundation, and lipstick were found to be bacilli shape and mascara was found to be bacilli and cocci Table 3 Microbial contamination in foundation, mascara, lipstick, and brush-on dilution.
Prasittiwet et al CF23 Page 119 2,501-4,000 17 0.17 4,001-5,500 2 0.02 5,5001-7,000 1 0.01 7,001-8,500 0 0.00 8,501-10,000 1 0.01 More than 10,000 2 0.02
of cosmetic products that almost buy* Cleanser 66 0.66 Day cream 54 0.54 Facial mask 48 0.48 Make up 82 0.82 Night cream 45 0.45 Serum 69 0.69 Sunscreen 69 0.69 Toner 47 0.47
Type
* Participants can select more than one choice.
Cosmetic Product concentrations (cfu/g) 1st dilution 2nd dilution 3rd dilution Expired products Foundation 0-800,000 0 0 Mascara 1,429-2,857 1,143-2,286 0-1,143 Lipstick 0-340 0 0 Brush-on 0 0 0 Non-expired products Foundation 0-211 0 0 Mascara 0-400 0 0 Lipstick 0 0 0 Brush-on 0-79 0 0
shape. Microbial cells in the non-expired cosmetic products, such as foundation, and mascara were found to be bacilli shape, while those of non-expired brush-on were found cocci shape. The different microbial types found in different products were contaminated by the different causative factors of the production, such as low quality of ingredients, production process, and employer, etc. According to the cosmetic law under the cosmetics act B.E. 2558 (2015) regarding the characterization of cosmetics whichprohibitsthemanufacture,import,orsale.Article1cosmeticswiththemicrobiologicalproperties as specified below cosmetic which prohibits production, import, or sale. Cosmetics that detect microorganisms that cause disease are as follows. Pseudomonas aeruginosa is Gram-negative, rodshaped (Wu et al., 2015). Staphylococcus aureus is Gram-positive and has a round shape arranged in groups like a bunch of grapes may be a single cell, a pair, or a short string (Abdelbary et al., 2017). Candida albicans is a yeast that reproduces by budding (Wiles& Mackenzie, 1987). Regarding the acceptance level, the results of our study suggest that the microbial cells in the cosmetic products may be Staphylococcus aureus (Gram-positive cocci), and Pseudomonas aeruginosa (Gram-negative bacilli). Due to from the study under the microscope, it was found that the morphology and Gram of the cells found were similar to those of Staphylococcus
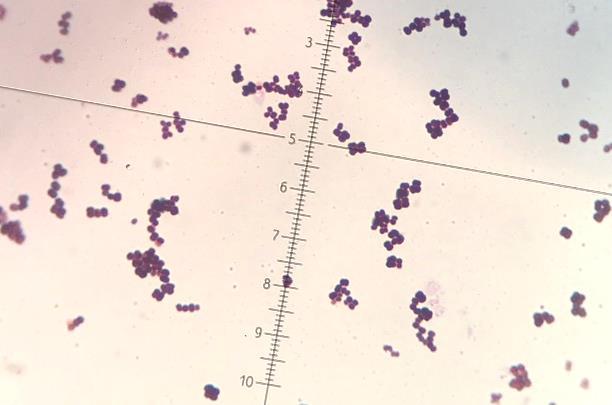
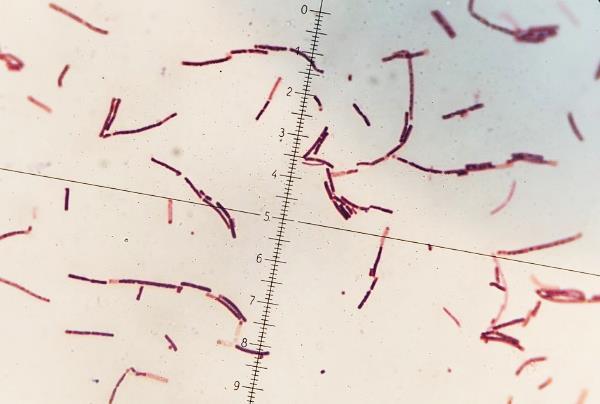
4.Conclusion
Our results revealed that make-up products were the most popular cosmetic products among female universitystudents.Expiredand non-expiredmake-up productsincludingfoundation, mascara,lipstick, and brush-on wereusedtotest formicrobial contamination. Microbial contamination wasfoundinmost products. Regarding FDA requirements, the microbial contamination must be less than 1,000 CFU/g. Thus, non-expired cosmetic products that were used could be safe for the customer because the microbial contamination was still lower than the FDA standard. However, the microbial contamination of expired cosmetic products was at a severe level, high risk, and unsafe, and could not recommend using because they were extremely contaminated by microbes and over FDA standards
For further studies, we suggest that the evaluation of microbial contamination should be performed several times and for longer periods. Additionally, that is opened and long-lasting tests for cosmetic products should be investigated and should be further identified for microbial strains.
5.Acknowledgements
We would like to thank the participants who answered the questionnaire in this study. In addition, we would like to thank all lecturers and staff in the School of Cosmetic Science, Mae Fah Luang University for giving knowledge and suggestions.
6.References
Abdelbary, M. M. H., Basset, P., Blanc, D. S., & Feil, E. J. (2017). The Evolution and Dynamics of Methicillin-Resistant Staphylococcus aureus. In Genetics and Evolution of Infectious Diseases (2nd Ed.) (pp. 553-572). Elsevier.
Prasittiwet et al
Page 120
CF23
aureus and Pseudomonas aeruginosa.
Figure 3 Microbial characteristics in cosmetic products observed under microscope technique. (a) bacilli and (b) cocci at the magnification (1000x).
(a) (b)
Brown, T. A., Cash, T. F., & Noles, S. W. (1986). Perceptions of physical attractiveness among college students: Selected determinants and methodological matters. The Journal of Social Psychology, 126(3), 305-316.
Gillen, M. M., & Dunaev, J. (2017). Body appreciation, interest in cosmetic enhancements, and need for uniqueness among US college students. Body image, 22, 136-143.
Ismaïl, R., Aviat, F., Michel, V., Le Bayon, I., Gay-Perret, P., Kutnik, M., & Fédérighi, M. (2013). Methods for recovering microorganisms from solid surfaces used in the food industry: a review of the literature. International journal of environmental research and public health, 10(11), 6169-6183.
Kumar, A. H., John, S. F., & Senith, S. (2014). A study on factors influencing consumer buying behavior in cosmetic products. International Journal of Scientific and Research Publications, 4(9), 1-6.
Kim, E. K. (2005). The relationship between appearance satisfaction, physical satisfaction, and selfesteem, school maladjustment of children. Unpublished master's thesis, Chuncheon National University of Education, Chuncheon
Mitsui, T. (Ed.). (1997). New cosmetic science. Elsevier.
Reisch, M. S. (2017). Cosmetics: The next microbiome frontier. Mitsui Chemicals Catalysis Science Award, 95(19), 30-34.
SCCS, E. (2012). The SCCS’s Notes of Guidance for the Testing of Cosmetic Ingredients and Their Safety Evaluation 8th Revision.
Schiffman, L.G., & Kanuk, L.L. (1994). Consumer behavior (5th ed.). New Jersey: Prentice – Hall.
Sizemore, R. K., Caldwell, J. J., & Kendrick, A. S. (1990). Alternate gram staining technique using a fluorescent lectin. Applied and environmental microbiology, 56(7), 2245-2247.
US FDA. (2001). BAM: Microbiological methods for cosmetics - Chapter 23 (available at, https://www.fda.gov/food/foodscienceresearch/laboratorymethods/ucm565586.htm).
US FDA. (2022). CosmeticProduct Category Codes. Cited from https://www.fda.gov/cosmetics/paperregistration-voluntary-cosmetic-registration-program-vcrp/cosmetic-product-category-codes
Wiles, C. M., & Mackenzie, D. W. R. (1987). Fungal diseases of the central nervous system. In Infections of the nervous system (pp. 93-117). Butterworth-Heinemann.
Wilson, L. A., & Ahearn, D. G. (1977). Pseudomonas-induced corneal ulcers associated with contaminated eye mascaras. American journal of ophthalmology, 84(1), 112–119.
Wu, W., Jin, Y., Bai, F., & Jin, S. (2015). Pseudomonas aeruginosa. In Molecular Medical Microbiology (pp. 753-767). Academic Press.
Prasittiwet et al CF23 Page 121
*********************
The development of cleansing balm containing natural oils
Nont Thitilertdecha1,2*,Jitsupa Lingee1, and Kanyanat Rotmuea1
1School of Cosmetic Science, Mae Fah Luang University, Chiang Rai 57100, Thailand
2Green Cosmetic Technology Research Group, School of Cosmetic Science, Mae Fah Luang University, Chiang Rai 57100, Thailand
*Corresponding author. E-mail: nont.thi@mfu.ac.th
Abstract
Cleansing balm is oil-based formulation to cleanse any oily dirt. Many facial cleansers contain mineral oil and synthetic surfactants which might cause skin allergy and problems. This study was aimed to develop cleansing balms containing natural oil. Fractionated coconut oil, olive oil, castor oil, sweet almond oil and palm kernel seed oil, as well as cleansers were screened for their cleansing abilityagainst foundation and lipstick.The developed cleansing balm formulations to which the selected natural oils, emollients and emulsifiers used in formulations were then evaluated for cleansing ability, against lipstick and foundation, and satisfactions. The fractionated coconut oil showed the highest ability to remove lipstick and foundation among natural oils. Varying bodying agents for the formulation with suitable texture, spreadability, oiliness and greasiness, for which was further developed the formulations with better cleansing ability. The formulation was adjusted by varying the content of natural oils, and cleansers. All formulations were able to remove foundation, however, incompletely removed for lipstick compared with the benchmark commercial product. The overall satisfaction of the formulation was 3.95±0.62 inferior than commercial product. This study demonstrates the feasibility of natural oils as ingredients in cleansing balm. To improve cleansing ability, lowering amount of natural oil (< 40 %) is recommended for further development.
Keywords:Cleansing ability; Cleansing balm; Makeup remover; Natural oil
1.Introduction
Nowadays, facial makeup products are widely used to promote self-esteem and contributed to physical wellbeing and positive social relationships (Parnsamut et al., 2017;Anchieta et al., 2021). Most women wear makeup in daily lifefor the attractiveness and impressment (Tagai et al., 2016). Lipstick and foundation are products that are one of most commonly used for makeup applications. Generally, makeup products are waterproof and contain high levels of oil, minerals like titanium dioxide, zinc oxide, iron oxide and kaolin clay, etc. Proper cleaning procedures could cleanse any dirt and make-up product to prevent clogged skin pore and skin problems such as acne which will leave unpreferable signs like dark spots, red spots, acne scars or convex scars. Therefore, makeup removal is important to remove makeup products (Sadeq et al., 2019;Li, 2020).
Facial cleanser providing cleanliness with no dryness and removing natural moisturizing factors is preferable. Cleansers are produced to be suitable forvarious skin types and there are various forms of cleansing products including bar soaps, foams, gels, oil, micellar water, balms, etc. Cleansing balms, generally, are oil-based formulations, thickthat appearsoft texturelike petroleum jelly at room temperature which will be melted into milky form to remove waterproof makeup, sebum and other impurities. They also prevent skin dehydration and improve skin condition (Draelos et al., 2018; Hidayah et al., 2020). In addition,cleansing balms are not only compatible with the skin to remove emollients but also be easily rinsed off according to emulsifiers in the formulation. In addition, cleansing
FC24 Page 1
December2022
Proceedingof Cosmetic & Beauty International Conference 2022 Future of the Next Beauty (CBIC 2022) 7th-9th
products have been used inmany services of beauty business, such as clinics and spas. Make-up product removal and facial cleansing are the first priority for the facial treatment, therefore, cleansing balm is alternative in shortening time for this process.
Cleansing balm products are made up from mineral oil that could clog skin poreresulting in skin problems such as irritation, rash, allergic rash and acne inflammation.Besides, synthetic surfactants in the cleansing balm product could also penetrate into the deep layers of the skincausingprotein disorder, denaturation, and skin irritation (Novick, 2000; Jurek et al., 2019).These concerns also include synthetic emollients which may cause irritation dermatitis, allergic contact dermatitis or allergy (Nola et al., 2003; Agner et al., 2019).To deal with this problem, natural oilsare now focused according to their less toxic and many benefits includingmoisturizer,antioxidants, antibacterial from various constituents such as essential fatty acids, vitamin A, vitamin C, vitamin B and vitaminE.Natural oils such as coconut oil, olive oil and castor oil have cleansing propertiesfrom their compatibility with skin Kim et al. (2019), Ngân et al. (2021) and Pakkang et al. (2018). Therefore, development of cleansing balm containing natural oils is an alternative to reduce the usage of synthetic ingredients. The purpose of this study was to develop cleansing balm formulations containing natural oil as main ingredient and compare their efficiency to remove lipstick and foundation with commercial product.
2.Materials and Methods
2.1Materials
Caprylyl glycol, ethylhexyl palmitate, fractionated coconut oil, isopropyl palmitate, PEG
20 glyceryl triisostearate and polyethylenewere obtained from Chanjao Longevity Co., Ltd., Thailand. Castor oil, olive oil and shea butter were obtained from Nam Sian Co., Ltd., Thailand. Beeswax was obtained from Chemipan Corporation Co., Ltd.,Thailand. Cetyl alcohol was obtained from Godrej Industries,Ltd. Polawax was obtained from SinthaiChemicals & Trading Ltd., Thailand. PEG-7 glyceryl cocoate was obtained from The Real Three (Thailand) Co., Ltd., Thailand. Polysorbate 20 was obtained from NOF Corporation, Japanese.Sorbitan Oleate (Span®80) was obtained from Guangdong Runhua Chemistry Co., Ltd., China. Tocopheryl acetate was obtained from Zhejiang Nhu Company Ltd., China.
2.2Cleansing ability of natural oils, synthetic emollients and emulsifiers
Natural oils, synthetic emollient and emulsifiers used in this study were tested for their cleansing ability against lipsticks and foundations. Lipstick or foundation (0.02g) was coated on skin with an area of 2.5×2.5 cm. Each sample (0.5 ml) was used to test cleansing ability by rubbing forward and backward (counted as 1 round) for 5 and 10 rounds. The remaining lipstick or foundation removed by different samples were then compared. The suitable natural oils will be then used to develop cleansing balm.
2.3Development of cleansing balm formulations
The suitable natural oils, synthetic emollients and emulsifiers were selected and being used to formulate cleansing balm by the ratio of fractionated coconut oil and olive oil of 4:1 was selected. The masterformulation (F1), adapted from Goggin et al. (2018), containedcommon selected natural oils as ingredients as shown in Table 1. In brief, ingredients were added in a glass beaker and heated to 7080℃. The formulation was cooled down to 45-50℃ and tocopherol acetate and caprylyl glycol were then added. The master formulation was then adjusted for its texture by varying the ratio of bodying agent and emulsifiers (F1.1-F1.5). Cleansing ability was then developed (F2.1-F2.4)for the comparison with commercial product.
2.4Cleansing ability
To determine the cleansing ability of cleansing balm, the red lip or foundation (0.02 g) was applied on the arm for a length of 5.5 cm. Then, each cleansing balm (0.5 g) including the commercial product was applied and then rubbed forward and absorbed by tissue paper (counted as 1 round). The process was repeated with no cleansing balm added until the skin was clear. All formulations were compared with commercial product.
Thitilertdecha et al. FC24 Page
–
2.4Preference test


The cleansing balm formulation and benchmark commercial product have been then assessed by double blind testfor the preference. 19 participants who have ever used cleansing balm were recruited to the preference test. Lipstick or foundation (0.02 g) was coated on a mirror with an area of 2.5×2.5 cm.Each sample (0.5 g) was tested for their cleansing ability by rubbing forward and backward for 5 cm.The process was repeated with no cleansing balm added until the mirror was clear. After that,they were asked to evaluate their preference including cleansing qualities, texture, spreadability, and oiliness/greasiness. Criteria for the satisfaction level were divided to 5 levels as follows: excellent, good, moderate, low and poor.

Thitilertdecha et al. FC24 Page
Table 1
formulation. IngredientsFunction Cleansing balm (% w/w) F1 F1.1 F1.2 F1.3 F1.4 F1.5 F2.1 F2.2 F2.3 F2.4 Fractionated coconut oil Cleansing 32 32 32 32 32 32 32 37 32 30 Olive oil Cleansing 8 8 8 8 8 8 8 8 8 5 Isopropyl palmitate Cleansing 5 5 5 5 5 5 5 5 5 5 Ethylhexyl palmitate Cleansing 5 5 5 5 5 5 5 5 10 10 Polyethylene Bodying 10 7.5 5 5 5 5 5 5 5 5 Cetyl alcohol Bodying 10 7.5 5 4 3 2 2 2 2 2 Beeswax Bodying 10 7.5 5 4 3 2 2 2 2 2 Shea butter Bodying 10 7.5 5 5 5 5 5 5 5 5 PEG-7glyceryl cocoate Cleansing 7 13 19 21 23 2520 20 25 PEG-20glyceryl triisostearate Cleansing--25-Polysorbate 20 Cleansing 1 3 5 5 5 5 5 5 5 5 Sorbitan Oleate Cleansing 1 3 5 5 5 5 5 5 5 5 Caprylyl Glycol Preservative 0.5 0.5 0.5 0.5 0.5 0.5 0.5 0.5 0.5 0.5 Tocopherol Acetate Antioxidant 0.5 0.5 0.5 0.5 0.5 0.5 0.5 0.5 0.5 0.5
Ingredient list of clean sing balm
2.5Statistical analysis
The data were compared and analyzed with a independent sample t testusing IBM SPSS Program version26.0(SPSS Inc., Chicago, IL, USA). The preference test values were expressed as the mean ± SD (standard deviation). P<0.05 was regarded as statistical difference.
3.Results and Discussion
3.1Cleansing performance tests of natural oils, synthetic emollients and emulsifiers
Natural oils, synthetic emollients and emulsifiers were tested for their cleansing ability. The cleansing abilities of fractionated coconut oil was more potential than olive oil, almond oil, palm oil and castor oil, respectively, as less intensity of lipstick or foundation observed in the 5th and 10th rounds (Table 2). In the comparison with synthetic emollients (isopropyl palmitate and ethylhexyl palmitate), fractionated coconut oil was similar with slightly different. It was clear that the remaining makeup was similar to synthetic emollients. Fractionated coconut oil used in this study is processed from regular coconut oil by fractionation to obtain high content medium-chain fatty acids (MCFAs) which are caprylic acid (C8) and capric acid (C10)that are more liquid and lighter than regular coconut oil containing lauric acid (C12) as major composition. This fractionated coconut oil, therefore, become light texture and was be easily absorbed into the skin. Olive oil and palm kernel seed oil were similar in lipstick removal, however, olive oil had higher potency in foundation removal. In addition, olive oil is rich in vitamins and antioxidants which could promote skin moisturization and reduce aging effects, especially from sun exposure (Kalogeropoulos et al.,2014;Cui et al., 2015). Therefore, olive oil was also selected for being used in the formulation by that the ratio of fractionated coconut oil and olive oil was 1:4 according to their potential in removing lipstick and foundation. Synthetic emollients were more potential than emulsifiers. However, all emulsifiers in this study were used for compatibility between water and mixture of synthetic emollient and make-ups.
3.2Development of cleansing balm
Natural oils, synthetic emollients and emulsifiers wereused to develop in the cleansing balm formulation. The master formulation (F1)appeared as a hard-solid characteristic with poor spreadability, therefore, all of the bodying agents (polyethylene, cetyl alcohol, beeswax and shea butter) were reduced. The texture of the adjusted formulations had a trend to be more softened as a dosedependent decrement of bodying agents. The color of all formulations wasmilky color and their texture were more easily melted and spread as shown in Table 3. All formulations showed no any sedimentation and phase separation. The F1.5 was the highest spreadability among other formulations according to its lowest spread round. From the results, the F1.5 was then selected to further develop for improving cleansing ability.
3.3Cleansing ability of cleansing balms
To develop cleansing balm for improving cleansing ability, the F1.5 was selected to formulate the F2.1-F2.4 as can be seen in Table 3. Cleansing ability of the cleansing balm formulations were developed by changing emulsifiers (F2.1), increasing fractionated coconut oil (F2.2),increasing synthesis emollient while decreasing emulsifiers (F2.3) or decreasing fractionated coconut oil (F2.4). All formulations with no any sedimentation and phase separation. From the results, the texture of the formulation F2.4 was lower spreadability than the formulation F2.3, F2.2 and F2.1, respectively. The F2.1 was the best spreadability among the developed formulation due to the decreased bodying agents. The developed cleansing balm formulations (F2.1-F2.4) were tested for their cleansing ability compared with commercial product against lipstick and foundation. Lipstick cleansing ability of F2.1-F2.4 were similar efficiency, however, lower than commercial product as remaining stains observed. Foundation cleansing ability of the F2.1 and F2.3 formulations were more potential than the formulationF2.2 and F2.4. From the results, it could be concluded that the F2.1 formulation was selected for the preference test compared with the commercial product. The commercial product used in this study was milky white color,and hadsoft texture and easy spreadability, with high efficiency to cleanse lipstick and foundation. The cleansing ability of the F2.1 was inferior than commercial product. This might be due to the high content of natural oil was lesscompatible with makeup products than synthetic emollients. The reduction of natural oils and increasing other emollients might improve cleansing ability.
Thitilertdecha et al. FC24 Page 1
Table 2 Cleansing performance tests of natural oils, synthetic oil-based ingredients and emulsifiers on lipstick or foundation.
Lipstick Foundation


Test samples
Almond oil
Before 5 rounds 10 rounds Before 5 rounds 10 rounds
Olive oil
Castor oil
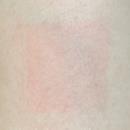
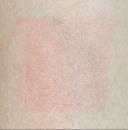
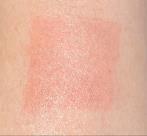
Fractionated coconut oil
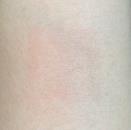
Palm kernel seed oil
Isopropyl palmitate
Ethylhexyl palmitate
PEG-7 Glyceryl cocoate

PEG-20
glyceryl triisostearate
Thitilertdecha et al. FC24 Page 1
Test samples
Polysorbate 20
Lipstick Foundation
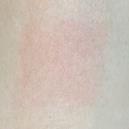
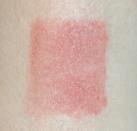
Before 5 rounds 10 rounds
Before 5 rounds 10 rounds
Sorbitan
Oleate 80
Cleansing
Thitilertdecha et al. FC24 Page 1
Table 2 (Continued)
Table 3 Characteristics of cleansing balm.
balm Characteristics Texture adjustment Color Texture Spreadability (rounds) Appearance F1 Milky white Hard-solid >50 F1.1 Milky white Soft-semi solid 29 F1.2 Milky white Soft-semi solid 16 F1.3 Milky white Soft-semi solid 13 F1.4 Milky white Soft-semi solid 16 F1.5 Milky white Soft-semi solid 9
3.4Preference test
For the preference test, 19 participants were blinded from the tested samples. After using the cleansing balm, the results showed that the texture of the developed formulation and the commercial product was similar in terms of softness and easy to spreadability, there was no statistically significant difference. However, the commercial product was more superior in terms of cleaning ability, spreadability and oiliness/greasiness than the developed formulation (P<0.05). In an overall rating, commercial product was more preferable as shown in Table 5 (P<0.05). The statistical results were consistent with the cleansing ability test in Table 4 that the commercial product was more effective than the formulation F2.1.
4.Conclusion
The present study developed cleansing balm containing natural oils. Different natural oils were screened for their cleansing ability and then selected for cleansing balm formulation development.The fractionated coconut oil was the highest potency among natural oils with similar comparedto synthetic
Thitilertdecha et al. FC24 Page 1 Table 3 (Continued) Cleansing balm Characteristics Texture adjustment Color Texture Spreadability (rounds) Appearance F1 Milky white Hard-solid >50 F1.1 Milky white Soft-semi solid 29 F1.2 Milky white Soft-semi solid 16 F1.3 Milky white Soft-semi solid 13 F1.4 Milky white Soft-semi solid 16 F1.5 Milky white Soft-semi solid 9
emollient followed by olive oil.The texture of cleansing balmwas developed by reducing the bodying agents. The formulations of cleansing balm to improve cleansing ability were developed and the texture was not different compared with commercial product. However, cleansing ability of the developed was inferior than commercial product. This study demonstrated fractionated coconut oil and olive oil could be used.


5.Acknowledgements


This study was partially financially supported and research facilities by Mae Fah Luang University. In addition, the authors also acknowledged the School of Cosmetic science and staffs from the Cosmetic Science laboratory for any scientific equipment and facilities support.


Thitilertdecha et al. FC24 Page 1
Cleansing balm Texture Cleansing adjustment Spreada bility (rounds) Appearance Rounds LipstickFoundation L F Before 3rd rounds After Before 3rd rounds After *F2.1 8 >10 7 F2.2 10 >10 8 F2.3 11 >10 7 F2.4 12 >10 8 C 7 >10 7
Table 4 Physical characteristic and cleansing ability of cleansing balm formulations.
Cleansing balm Cleansing ability Texture Spreadability Oiliness and greasiness Overall F2.1 4.00± 0.67b 3.74±0.87a 4.05±0.85b 3.95± 0.78b 3.95± 0.62b Commercial product 4.84± 0.37a 4.26± 0.73a 4.74± 0.45a 4.74 ± 0.45a 4.58 ± 0.61a
Table 5 Preference test of cleansing balm.
6.References
Agner, T., & Jungersted, J.M. (2019). Emollients: Effects, Evidence, and Side Effects. Kanerva’s Occupational Dermatology, 97, 1451-1459.
Anchieta, N.M., Mafra, A.L., Hokama, R.T., Varella, M.A.C., Melo, J.D.A., Silva, L.O.D., Silva, C.S.A.D., & Valentova, J.V. (2021) Makeup and its application simulation affect women’s self‐perceptions. Archives of Sexual Behavior, 50, 3777–3784.
Cui, Z., Xin, M., Yin, H., Zhang, J., & Han, F. (2015). Topical use of olive oil preparation to prevent radiodermatitis: results of a prospective study in nasopharyngeal carcinoma patients. International Journal of Clinical and Experimental Medicine ,8(7),11000-11006.
Draelos, Z.D. (2018). The science behind skin care: Cleansers. Journal of Cosmetic Dermatology, 17(1), 8-14.
Dreno, B., & Poli, F. (2003). Epidemiology of Acne. Journal of Dermatology, 206(1), 7–10.
Goggin, J., & Righton, A., (2018). Handmade Spa: Natural Treatments to Revive and Restore. London, United Kingdom: Jacqui Small.
Hidayah, S.N., Aryani, R., & Darusman, F. (2020). Studi Literatur Mengenal Kosmetik Pembersih Wajah Cleansing Balm dan Perkembangannya. Journal of Pharmacy Proceedings, 6(2), 215220.
Jurek, I., Góral, I., Mierzyńska, Z., Moniuszko-Szajwaj, B., & Wojciechowski, K. (2019). Effect of synthetic surfactants and soapwort (Saponaria officinalis L.) extract on skin-mimetic model lipid monolayers. Biochimica Et Biophysica Acta(BBA) -Biomembranes, 1861(3), 556
564.
Kalogeropoulos, N., & Tsimidou, M. Z. (2014). Antioxidants in Greek virgin olive oils. Antioxidants, 3(2), 387-413.
Kim, J., & Lee, J. (2019). The effects of cleansing oil on skin by preferred vegetable base oil. The Korea Academia-Industrial Cooperation Society, 20, 264-274.
Li, Z.Y. (2020) Modern Mild Skin Cleansing. Journal of Cosmetics, Dermatological Sciences and Applications, 10, 85-98.
Pakkang, N., Uraki, Y., Koda, K., Nithitanakul, M., & Charoensaeng, A. (2018). Preparation of waterin-oil microemulsion from the mixtures of castor oil and sunflower oil as makeup remover. Journal of Surfactants and Detergents , 21(6), 1-8.
Parnsamut, N., Kanlayavattanakul, M., &Lourith, N. (2017). Development and efficacy assessments of tea seed oil makeup remover. Annales Pharmaceutiques Françaises, 75(3), 189–195.
Ngân, T.T., Hien, T.T., Nhan, L.T., & Le, X.T. (2021). Formulation of face-wash from coconut (Cocos nucifera (L.)) oil in Ben Tre province, Vietnam. Key EngineeringMaterials, 882, 183-190.
Nola, I., Kostović, K., Kotrulja, L., & Lugović, L. (2003). The use of emollients as sophisticated therapy in dermatology. Acta Dermatovenerologica Croatica: ADC, 11(2), 80-87.
Novick, N. (2000). Skin care for teens. New York,United States: iUniverse.
Raknam, P. Pinsuwan, S &Amnuaikit, T. (2020). Rubber seed cleansing oil formulation and its efficacy of makeup remover. Journal of Pharmaceutical Science & Research, 11(1), 146-155.
Sadeq, T.W. & Omer, S.Q. (2019). Development and evaluation of natural cosmeceutical ingredients as makeup remover to prevent hyperpigmentation. Journal of International Pharmaceutical Research, 46(6), 145-151.
Tagai, K., Ohtaka, H., & Nittono, H. (2016). Faces with light makeup are better recognized than faces with heavy makeup. Frontiers in Psychology, 7(226), 1-8.
Thitilertdecha et al. FC24 Page 0
–
*********************
Proceeding of Cosmetic & Beauty International Conference 2022 Future of the Next Beauty (CBIC 2022) 7th-9th December 2022
Stability enhancement of ascorbic acid in oil-in-water emulsion
Nutthachai Pimthanakarn1 and Ampa Jimtaisong1,2*
1School of Cosmetic Science, Mae Fah Luang University, Chiang Rai, 57100, Thailand
2Cosmetic and Beauty Innovations for Sustainable Development (CBIS) Research Group, Mae Fah Luang University, Chiang Rai, 57100, Thailand *Corresponding author. E-mail: ampa@mfu.ac.th
Abstract
Ascorbic acid is useful in the cosmetic industry because it has antioxidant properties for the skin and as pigment reducing properties. However, ascorbic acid is unstable. It is being destroyed by light, oxygen, high temperatures and alkalinity. The purpose of this study is to determine the stability of ascorbic acid in emulsion formulations. Glycerin, propylene glycol, butylene glycol, and polyethylene glycol-400 were studied as polyols solution added to the formulation, and tocopheryl acetate, olive oil, and ferulic acid were studied as antioxidants of the formulation. The persistence of ascorbic acid at days 7, 14, 21 and 50 was determined by the titration method. It was found that the persistence of ascorbic acid depends on the amount and type of polyols in the formulation. The 50-day ascorbic acid level for glycerin was 91.08 0.66%, followed by propylene glycol (87.462.05%), polyethylene glycol-400 (87.041.17%), and butylene glycol (85.961.18%). The effect of antioxidant added to the formula showed that the persistence of ascorbic acid in the formula depended on the type of antioxidant. At 1%w/w antioxidants, tocopheryl acetate gave the highest 50-day residual content of ascorbic acid at 91.861.13%, followed by ferulic acid at 90.011.33%, and the lowest is olive oil at 83.571.28%. In conclusion, it is recommended that adding glycerin and tocopheryl acetate to the system is best to slow down ascorbic acid breakdown in emulsion preparation.
Keywords: Antioxidant; Ascorbic acid; Emulsion; Polyols; Stability
1. Introduction
Ascorbicacidor vitaminCisawater-solublemoleculeconsistingofsixcarbonatoms(Sunil Kumar et al., 2017). It is one of the naturally occurring antioxidants (Talakoub et al., 2009) and in most plants and some animals, ascorbic acid can be synthesized from glucose in the body. However, humans and some vertebrates lack of enzyme namely L-glucono‑gamma lactone oxidase, which is required for ascorbic acid synthesis in the body, therefore, it is necessary to consume from the outside sources only (Farris, 2009). Ascorbic acid is very useful in the cosmetic industry because it has been discovered to have antioxidant properties for the skin, which results in slower skin degeneration (Telang, 2013). It helps reduce sun-induced skin aging or photoaging (Rhie et al., 2001) and helps to stimulate collagen production of the skin (Nusgens et al., 2001). Ascorbic acid also acts as a pigment reducing agent (depigmenting agent) to inhibit the skin's melanin production as a result of skin whitening effect (Pinnell et al., 2001, Farris, 2005, Telang, 2013). L-ascorbic acid has the physical and chemical properties of a weak organic acid that is soluble in water and unstable, easily oxidized or destroyed by light and oxygen, high temperatures and alkaline conditions (Pielesz et al., 2017). The stability of ascorbic acid has been studied by comparing the amount of ascorbic acid in different solution mediums and studying the effect of pH and solution viscosity on decomposition. The decompose rate of ascorbic
CF25 Page 131
acid was found to be unaffected by viscosity but glycerin and propylene glycol solutions were able to help stabilizing ascorbic acid. Moreover, an alkaline condition was found to accelerate the decomposition of ascorbic acid (Bandelin and Tuschhoff, 1955). Furthermore, studies on the addition of antioxidants, stabilizers, and vitamins to increase the stability of ascorbic acid show that alphatocopherol (vitamin E) and stabilizers such as citric acid, tartaric acid and boronic acid has the property to slow down the degradation of ascorbic acid. The mechanism of these agents results from antioxidant properties resulting in slowing down the oxidation process of ascorbic acid (Sheraz et al., 2015). Based on the review information, this work aims to investigate the effects of polyols, i.e., glycerin, propylene glycol, butylene glycol, and polyethylene glycol-400, which are widely used in cosmetic preparations, on the stability of ascorbic acid in the emulsion. The combination of antioxidants (tocopheryl acetate, olive oil, and ferulic acid) with the selected polyol on the stability of ascorbic acid emulsion was also reported.
2. Materials and Methods
2.1 Materials
Ascorbic acid was of Fluka, Germany. Iodine and potassium iodide were purchased from Merck, Germany. Glycerin, propylene glycol, butylene glycol, polyethylene glycol-400, olive oil, ferulic acid, tocopheryl acetate, corn starch, mineral oil, phenoxyethanol and polyacrylamide (and) C13-14 isoparaffin (and) laureth-7 (Sepigel 305) are of cosmetic grade.
2.2 Preparation of ascorbic acid emulsion
Dissolution test of ascorbic acid in various solutions, consisting of glycerin, propylene glycol, butylene glycol and polyethylene glycol-400 was studied. The concentration of ascorbic acid was fixed at 10% w/w and the ratio between solvent and water was adjusted. The mixture was mixed in a test tube and a vortex machine was used to help mixing. The highest ratio of solvent that can dissolve ascorbic acid completely was recorded.
The emulsion of 10% w/w ascorbic acid was prepared by cold process method. The proportions of water and each polyol were adjusted according to the dissolution test, and then mixed by overhead mixer. Sepigel-305 was used as and emulsifier and mineral oil was an oil phase. Stability against phase separation of the emulsion was tested by centrifuge method at 6,000 rpm for 20 minutes.
2.3 Determination of ascorbic acid in emulsion
The ascorbic acid emulsions were filled into a glass jar and wrap with aluminum foil to protect from light. They were stored in a cabinet away from light at ambient temperatures. The ascorbic acid content was analyzed after storage for 7, 14, 21 and 50 days by using the titration method (Satpathy et al, 2021).
3.Results and Discussion
3.1 Preparation of ascorbic acid emulsion
The selected polyols, i.e., glycerin, propylene glycol, butylene glycol and polyethylene glycol-400 (PEG-400) are normally used in various cosmetic preparations to act as humectant. They are considered safe to use and affect the sensory finish of the products and help stabilizing the emulsion preparation. The solubility of ascorbic acid in these polyol solvents was first studied. The concentration of ascorbic acid was fixed at 10 %w/w and the optimum ratio between polyols and water was determined to obtain a completely soluble vitamin C in the system. The results were tabulated in Table 1. The obtained information was then used as a guideline to further preparation of ascorbic acid emulsion in Table 2.
All emulsions appear as creamy white cream with soft texture when apply on the skin. The viscosity of emulsions was in the range of 4000-5000 cPs (spindle#6, 120 rpm, Brookfield viscometer). The emulsion was centrifuged at 6000 rpm for 20 minutes and there was no phase separation observed. The ascorbic acid content in each emulsion was determined by titration method. It showed that ascorbic acid decomposed with the experimental period at 7, 14, 21 and 50 days (Figure 1). After 50 days, the amount of ascorbic acid in base formula, which contains no polyol, was 73.12 1.32%. Formulas with polyols
Pimthanakarn et al CF25 Page 132
Table 1 The optimum quantity of polyols and water that completely dissolve 10 %w/w ascorbic acid
Table 2 Formulas of ascorbic acid emulsion with different polyols
Note: G=glycerin, P= propylene glycol, B=butylene glycol, PE= PEG-400 showed higher amount of ascorbic acid remain in the emulsion. In the formula containing 40% w/w glycerin(G1), the residual amount of ascorbic acid was the highest at 91.080.66%, followed by 40% w/w propylene glycol (P1) at 87.46 2.05%, 40% w/w PEG -400 (PE1) 87.041.17 % and 40% w/w butylene glycol (B1) 85.96 1.18%. The remaining ascorbic acid contents in the formulas; G1, P1, B1 and PE1 at 50 days are statistically different (p 0.05). Glycerin had the greatest effect on slowing down the degradation rate of ascorbic acid, followed by propylene glycol, polyethylene glycol-400 and butylene glycol. Glycerin isexpectedto form the strongest hydrogen bond with ascorbic acid,therefore, the oxidation rate is lower (Zhang, 2007). However, it is not yet known exactly which properties of polyol compounds affect degradation rate of ascorbic acid. The polarity of the polyols is one of the properties expected to be related to the slowing of decomposition. A higher polarity solution is very likely to have more oxidation reaction (Mansoor et al., 2012). However, the polarity properties of each substance, by comparing the dielectric constants at 25 °C, was found to be 42.5, 32.0, 22.0 and 13.6 for glycerin, propylene glycol, butylene glycol and PEG-400, respectively (Wyman, 1933). It showed that glycerin is the most polar solvent but from this experiment, it was found that glycerin was the best to slow down the degradation rate of ascorbic acid. So, the polarity may not be the main factor that affects the ability to slow the degradation of ascorbic acid. However, other studies suggested that this may be becausehydrogenbondingbetweenthesolventandascorbicacidthatslowsdowntheoxidationreaction of ascorbic acid (Zhang, 2007; Parr et al., 2002).
3.2 Effect of antioxidant on degradation of ascorbic acid
The formula using glycerin which possessed highest persistence of ascorbic acid was selected to study the effect of different antioxidants, i.e., olive oil, ferulic acid, and tocopheryl acetate Each antioxidant was studied at 0.5 and 1.0 %w/w in the formula and it was found that at higher amount resulting in higher amount of ascorbic acid in the formula over time, Figure 2. At 1% antioxidant, tocopheryl acetate showed highest persistence of ascorbic acid after 50 days (91.86 1.13%) and followed by ferulic acid at 90.011.33% and the least is olive oil at 83.571.28%. According to Placzek et al. (2005), antioxidants can slow down the degradation of ascorbic acid by binding to free radicals that occur in the system, this can reduce the rate of oxidation of ascorbic acid. In addition, antioxidants can react with ascorbyl radical which being formed by the oxidative degradation of ascorbic acid and then converted back to ascorbate through redox reactions (Sheraz et al., 2015). The stability of ascorbic acid has been investigated by adding riboflavin, nicotinamide and tocopheryl acerate to the emulsion formulation. It was found that tocopheryl acetate can best slow down the decomposition of ascorbic acid (Ahmad et al., 2012).
Pimthanakarn et al CF25 Page 133
Polyol Quantity (% w/w) Polyol Water Glycerin 45 45 Propylene glycol 50 40 Butylene glycol 50 40 PEG-400 45 45
Ingredient %w/w Base G1 G2 G3 P1 P2 P3 B1 B2 B3 PE1 PE2 PE3 DI water 77.7 37.5 42.5 47.5 37.5 42.5 47.5 37.5 42.5 47.5 37.5 42.5 47.5 Ascorbic acid 10 10 10 10 10 10 10 10 10 10 10 10 10 Polyols - 40 35 30 40 35 30 40 35 30 40 35 30 Sepicgel-305 2 2 2 2 2 2 2 2 2 2 2 2 2 Mineral oil 10 10 10 10 10 10 10 10 10 10 10 10 10 Phenoxyethanol 0.5 0.5 0.5 0.5 0.5 0.5 0.5 0.5 0.5 0.5 0.5 0.5 0.5 Total 100 100 100 100 100 100 100 100 100 100 100 100 100
4.Conclusion
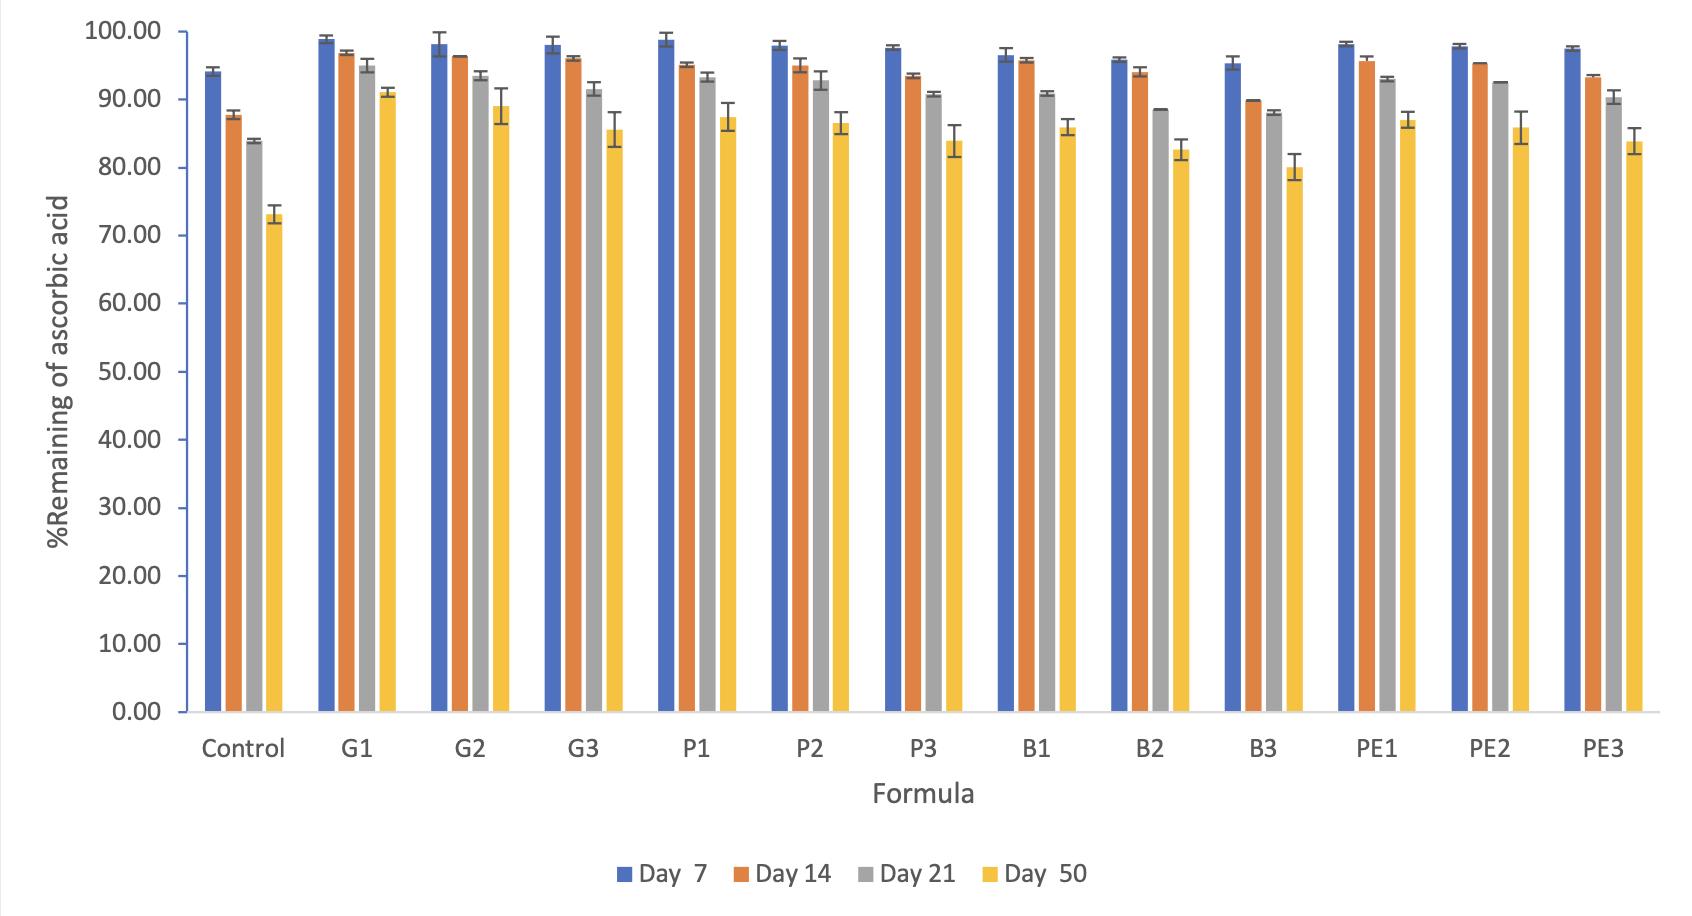
Glycerin, propylene glycol, polyethylene glycol-400 and butylene glycol were used as cosolubilizing agent for ascorbic acid in emulsion preparation. Different amount and type of polyols can slow down ascorbic acid breakdown and glycerin is best to slow down the breakdown followed by propylene glycol, polyethylene glycol-400 and butylene glycol. Use of tocopheryl acetate, ferulic acid olive oil canalso slow down ascorbicacid breakdowndue to their antioxidant activity.Thecombination of glycerin and tocopheryl acetate into emulsion was found to slow down the degradation of ascorbic acid about 18.7% compared with the control system after 50 days at ambient temperature and dark condition. The obtained results are useful for development of a more stable ascorbic acid in emulsion preparation.
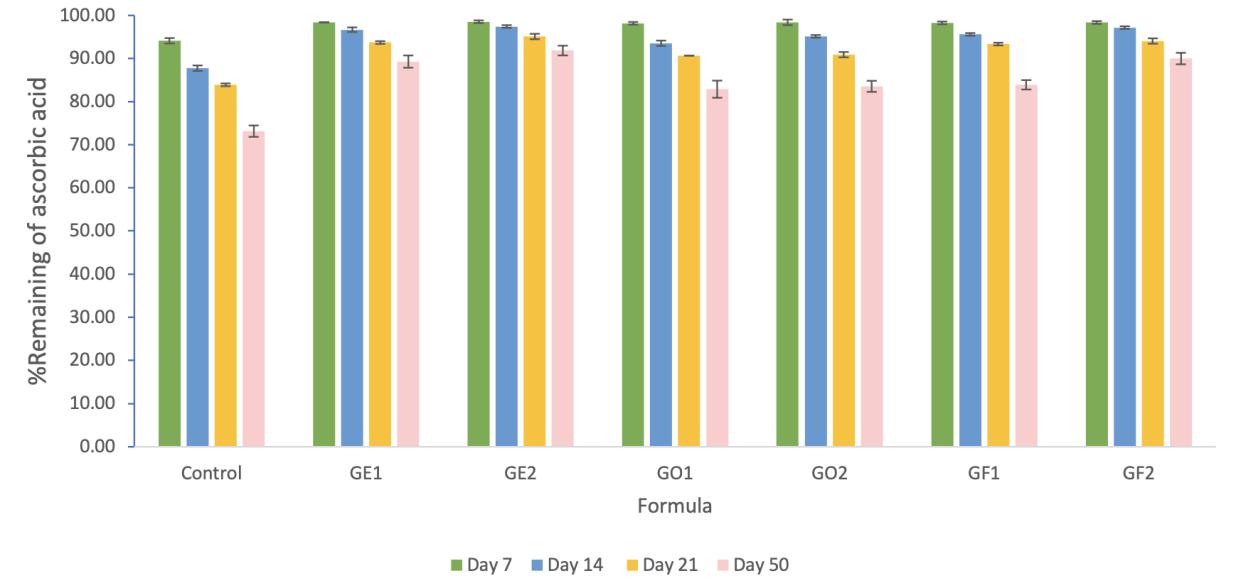
Pimthanakarn et al CF25 Page 134
Figure 1 The amount of ascorbic acid in various formulas with polyol solution at 7, 14, 21 and 50 days
Figure 2 The amount of ascorbic acid in formulas with antioxidant at 7, 14, 21 and 50 days, where GE1 = formula with 0.5% tocopheryl acetate, GE2= formula with 1% tocopheryl acetate, GO1= formula with 0.5% olive oil, GO2= formula with 1% olive oil, GF1= formula with 0.5% ferulic acid, GF2= formula with 1% ferulic acid
5.Acknowledgements
The authors wouldlike to thank Schoolof Cosmetic Science,Mae Fah LuangUniversityfor kindly providing space to conduct this research.
6.References
Ahmad, I., Sheraz, M. A., Ahmed, S., Bano, R., & Vaid, F. H. M. (2012). Photochemical interaction of ascorbic acid with riboflavin, nicotinamide and alpha‐tocopherol in cream formulations. International Journal of Cosmetic Science, 34(2), 123-131.
Bandelin,F.J.,& Tuschhoff,J.V.(1955).Thestabilityofascorbicacidinvariousliquidmedia. Journal of the American Pharmaceutical Association, 44(4), 241-244.
Farris PK (2009). Cosmetical vitamins: vitamin C. In: Draelos ZD, Dover JS, Alam M, (Eds), Cosmetic Dermatology: Products and Procedures (2nd Ed.) (pp. 51-56) New York: Elsevier.
Farris, P. K. (2005). Topical vitamin C: a useful agent for treating photoaging and other dermatologic conditions. Dermatologic surgery, 31, 814-818.
Nusgens, B. V., Humbert, P., Rougier, A., Colige, A. C., Haftek, M., Lambert, C. A., Richard, A., Creidi, P. & Lapière, C. M (2001). Topically applied vitamin C enhances the mRNA level of collagens I and III, their processing enzymes and tissue inhibitor of matrix metalloproteinase 1 in the human dermis. Journal of Investigative Dermatology, 116(6), 853-859.
Parr, J., Z. Sun, Y.H. Chang, U.U. Ho and D. George. (2002). Stabilized ascorbic acid composition U.S. Patent Application No. 6,103,267.
Pielesz, A., Binias, D., Bobinski, R., Sarna, E., Paluch, J., & Waksmanska, W. (2017). The role of topically applied l-ascorbic acid in ex-vivo examination of burn-injured human skin. Spectrochimica Acta. Part A, Molecular and Biomolecular Spectroscopy, 185, 279–285.
Pinnell, S. R., Yang, H., Omar, M., Monteiro-Riviere, N., Debuys, H. V., Walker, L. C., Wang, Y. & Levine, M. (2001). Topical L-ascorbic acid: percutaneous absorption studies. Dermatologic Surgery, 27(2), 137-142.
Placzek, M., Gaube, S., Kerkmann, U., Gilbertz, K. P., Herzinger, T., Haen, E., & Przybilla, B. (2005). Ultraviolet B-induced DNA damage in human epidermis is modified by the antioxidants ascorbic acid and D-α-tocopherol. Journal of Investigative Dermatology, 124(2), 304-307.
Rhie, G., Shin, M. H., Seo, J. Y., Choi, W. W., Cho, K. H., Kim, K. H., Park, K.C., Eun, H.C.& Chung, J. H. (2001). Aging-and photoaging-dependent changes of enzymic and nonenzymic antioxidants in the epidermis and dermis of human skin in vivo. Journal of Investigative Dermatology, 117(5), 1212-1217.
Satpathy, L. Pradhan, N. Dash, D., Baral, P.P. & Siba Prasad Parida, S.P. (2021). Quantitative determination of vitamin C concentration of common edible food sources by redox titration using iodine solution. Letters in Applied NanoBioScience. 10(3), 2361-2369.
Sheraz, M.A., Khan M.F., Ahmad, S., Kazi, S. H.&Ahmad I. (2015). Stability and Stabilization of Ascorbic Acid. Household & Personal Care Today. 10. 20-25.
Sunil Kumar, B. V., Singh, S., & Verma, R. (2017). Anticancer potential of dietary vitamin D and ascorbic acid: A review. Critical Reviews in Food Science and Nutrition, 57(12), 2623-263.
Talakoub, L., Neuhaus, I. M., & Siegrid, S. Y. (2009). Cosmeceuticals. In Cosmetic dermatology, 7-34.
Telang, P. S. (2013). Vitamin C in dermatology. Indian Dermatology Online Journal, 4(2), 143.
Wyman Jr, J. (1933). Dielectric constants: ethanol-diethyl ether and urea-water solutions between 0 and 50. Journal of the American Chemical Society, 55(10), 4116-4121.
Zhang, J. (2007). Compositions and method for enhancing the solubility of ascorbic acid using solubilization enhancers. U.S. Patent Application No 11/242,306.
Pimthanakarn et al CF25 Page 135
Proceeding of Cosmetic & Beauty International Conference 2022 Future of the Next Beauty (CBIC 2022)
7th-9th December 2022
In-vitro antioxidant activity and preliminary encapsulation of carrots (Daucus caroto), red cotton tree pollen (Bombax ceiba), and roselle calyxes (Hibiscus sabdariffa) extracts
Apisada Chaikhampa1, Nattakan Masuk1 , Pimonwan Sookkerd1, Awassanan Hunsart1 and Tinnakorn Theansungnoen1,2*
1School of Cosmetic Science, Mae Fah Luang University, Chiang Rai 57100, Thailand
2Green Cosmetic Technology Research Group, School of Cosmetic Science, Mae Fah Luang University, Chiang Rai 57100, Thailand
*Corresponding author. E-mail: tinnakorn.the@mfu.ac.th
Abstract
This study aimed to evaluate the antioxidant activity and niosome encapsulation of ethanolic and methanolic extracts of purple carrot (PCE and PCM), orange carrot (OCE and OCM), roselle calyxes (RCE and RCM), and red cotton tree pollen (RTE and RTM), respectively. Four selected plants were taken for ethanol and methanol extraction. The antioxidant activity of the extracts was evaluated by DPPH radical scavenging assay. The extract-encapsulated niosomes were prepared by a thin film hydration technique and their particle characterization was performed by scanning electron microscopy (SEM). The yield of crude ethanolic extracts was observed as OCE followed by RCE, PCE, and RTE at 31.39±0.81%, 11.65±0.37%, 11.30±0.47%, and 9.86±0.46%, respectively. The yield of crude methanolic extracts was observed as RCM, OCM, PCM, and RTM at 32.51±0.97%, 31.39±0.81%, 23.11±0.90%, and 10.53±0.24%, respectively. IC50 values of the ethanolic extracts were 0.14±0.01 mg/mL in RCE, 0.15±0.01 mg/mL in RTE, and 0.60±0.03 mg/mL in PCE, while those of the methanolic extracts were 0.12±0.01 mg/mL in RCM, 0.15±0.01 mg/mL in RTM, and 0.61±0.06 mg/mL in PCM. OCE and OCM did not show antioxidant activity at even the highest concentration used. The extracts with antioxidant activity were taken further for niosome encapsulation. By SEMobservation, theparticlecharacteristics oftheextract-encapsulated niosomeswereroundlike shapes with smooth or rough surfaces and found in a variety of particle sizes observed from nanoscale to microscale. Therefore, all of the studied plants were considered as potential antioxidant sources and, with the preliminary results of niosome development, could be beneficial for the cosmetic industry and beauty technology application.
Keywords: Antioxidant; Carrot; Niosome; Red cotton tree; Roselle
1. Introduction
Oxidative stress is caused by an imbalance between the amount of free radicals in cells and tissues, andtheabilityofabiological systemtoeliminatethesereactiveproducts.Thesefreeradicalsarecreated naturally as a by-product of regular cellular oxygen metabolism. Exogenous causes, such as UV light, stress, and smoking, can also cause them (Katerji et al., 2019). Damage to DNA and macromolecules caused by oxidative stress is related to the initiation and progression of a variety of disorders, including cardiovascular disease, cancer, and aging (Deavall et al., 2012).
Antioxidants are substances that protect cells from oxidative damage and are generated in the human body or obtained from natural sources. Plants are the major sources of natural antioxidants such as herbs, spices, fruits and vegetables. Carrots are a root vegetable and used to produce beverages. Orange carrot (Daucus carota L.) contains carotenoids, flavonoids, polyacetylene, vitamins and
ND30 Page 136
minerals Thesephytochemicalscan helptoreduce theriskofmanyhealthproblems,suchas highblood pressure, diabetes, cholesterol, cardiovascular disease, and liver disease (Silva et.al., 2014). Purple carrot (Daucus carota S.) has a bluish-purple color associated with the presence of large amounts of anthocyanins.Italsocontainslargeamountsofcarbohydrates,vitamins, andminerals.Therefore,purple carrots are a highly nutritious vegetable (Rasheed et al., 2022). Red cotton tree (Bombax ceiba L.) is a natural wild tropical tree which is extensively dispersed in Southeast Asian countries The plant is commonly used in indigenous medicine to treat diabetes and other diseases (Bhargava & Shah, 2020). Anti-inflammatory, anti-oxidant, anti-obesity, hepatoprotective, hypoglycemic, and hypotensive properties have been reported for the plant (Chauhan et al., 2018). From a previous study, the ethanol extract from Bombax ceiba L. flowers contained a lot of polyphenols and showed a lot of antioxidant activity (Diab et al., 2022). The main phytochemicals, such as phenolics, flavonoids, sesquiterpenoids, steroids, naphthoquinones, and neolignans, are found in the plant (Xu et al., 2017). Roselle (Hibiscus sabdariffa L.) could be used in cuisine and herbal medicine. Bioactive substances from roselle are effective in the treatment of obesity, reducing body weight and suppressing adipogenesis (Ojulari et al., 2019). Extracts of H. sabdariffa aerial parts emonstrated antioxidant and antibacterial properties (Jabeura et al., 2017). According to a previous study, roselle calyxes have been found to contain strong antioxidants in several in vitro and in vivo tests. Phenolic acid, flavonoids, and anthocyanins, all of which can be found in roselle, have been shown to be powerful antioxidants in studies (Singh et al., 2017).
Niosomes are non-ionic surfactant vesicles that can encapsulate both hydrophilic and hydrophobic substancesduetotheiruniquestructure. Thestructureofniosomesproducedwhennon-ionicsurfactants from the alkyl or dialkyl polyglycerol ether group are combined with cholesterol. They are stable, less harmful, inexpensive, and also do not require particular storage conditions (Khan et al., 2020). Other advantages of niosomes are the better skin penetration, tolerability, enhanced surface adhesion, and sustained release qualities. Due to the advantages, niosomes have been widely studied as a carrier system for active substances (Chen et al., 2019). From previous studies, D-limonene is a monocyclic monoterpene with anti-inflammatory and antioxidant properties and has been studied as a cancerprevention and therapy component. D-limonene-encapsulated niosomes compared to free D-limonene observed. At a concentration of 20 μM, the niosome formulation demonstrated considerably increased cytotoxic activity against cancercell lines (Hajizadeh et al., 2019). Rice bran chemical compoundssuch as oryzanol, ferulic acid, and others have medicinal properties and are used in cosmetic goods. To prevent a rapid degradation, rice bran extracts were encapsulated into niosomes before gel or cream production. The niosomal formulations were experimented in vitro, ex vivo and in vivo and found to be more effective in producing good antioxidant activity and high skin hydration ability (Poorani et al., 2020).
Although the active compounds and antioxidant activity of the edible plants including carrots, red cotton tree, and roselle extracts have been reported, studies of antioxidant activities and development ofnanoparticlesbyniosomeencapsulationtomaintaintheirpropertieshavenotbeenstudied.Therefore, the objective of this study was to evaluate the antioxidant activity of ethanolic and methanolic extracts of carrots, red cotton tree pollen and roselle calyx, as well as their niosome development.
2. Materials and Methods
2.1 Materials
All chemicals such as methanol, ethanol, L-ascorbic acid, 2,2-diphenyl-1-picrylhydrazyl or DPPH, chloroform, Span 60 and cholesterol were obtained from the instrumentation laboratory at the instrumentation laboratory at the School of Cosmetic Science, Mae Fah Luang University. The plant materials consisted of purple carrot, orange carrot, red cotton tree pollens and roselle calyxes. Purple and orange carrots were purchased from Phichit, Thailand. Red cotton tree pollen was bought from Sukhothai, Thailand. Roselle calyxes were bought from Sisaket, Thailand.
2.2 Sample preparation
Purple and orange carrots were washed, peeled and cut into thin slices. The slices were dried by tray-dryer at 55 °C for 24 hours. The red cotton tree pollens were washed and cleaned before being sundried for 4-5 days. The roselle calyxes were harvestedfrom fresh flowers and broke the seeds and petals
Chaikhampa et al ND30 Page 137
off the calyxes. Then, the calyxes were washed and sun-dried for 3-5 days, or until completely dry. The dried samples were ground using a blender machine and were sieved using a very fine colander.
2.3 Extraction of purple carrot, orange carrot, red cotton tree pollen, and roselle calyx
For the extraction, 20 gof each powdered sample was mixed with 200 mL of80% ethanol (ethanol: water, 80:20 v/v) and 80% methanol (methanol: water, 80:20 v/v) by modifying the method from Sultana et al. (2009). After that, the mixtures of samples and solvents were stored in the dark for 48-72 hours at room temperature before being filtered through Whatman No.1 filter paper. This procedure was repeated four times. The average of the four repeated samples was used to obtain the final readings, and the standard deviation was calculated for each attempt. To remove the unwanted solvent, the extracted samples for both solvent extractions were evaporated using a rotary evaporator. The extracts were stored and refrigerated until they were analyzed.
2.4 DPPH scavenging activity
DPPH scavenging activity was assessed by modifying the method of Fidrianny et al. (2017) Briefly,0.1mMmethanolicDPPH solution was prepared. Theextract samples werepreparedin various concentrations. In a 96-well plate, 50 μL of the sample solutions and 200 μL of the DPPH solution were added. After 30 minutes of being left in the dark at room temperature, a microplate reader was used to detect the absorbance at a 517 nm. The standard was ascorbic acid, while the control was DPPH. The antioxidant activityassessment wasreportedbycalculatingtheaverageofthreedeterminationsanalyses of the IC50 value and comparing with the ascorbic acid standard.
2.5 Niosome Encapsulation
2.5.1 Preparation of extracts-niosome (extracts encapsulated into niosome).
Niosome encapsulation was prepared by a thin-film hydration technique slightly modified by Theansungnoen et al. (2020). In a 50 mL round-bottom flask, a mixture of surfactants (Span 60 148 mg and cholesterol 132 mg) were combined and dissolved in 6 mL of a solvent mixture of ethanol and chloroform (4:2 v/v). The organic solvent was then evaporated, and the thin film was formed using a rotary evaporator under vacuum pressure at 70 °C for 1 hour, followed by 30 minutes of air drying. The resulting film was hydrated with 5 mL of sample extract solutions (5 mg of sample and 5 mL of propylene glycol) by swirling for 15 minutes at 50°C, and the extract-niosomes (red cotton tree and roselle) were gradually produced. For further experiments, the niosome suspension was kept at 4 °C.
2.5.2 Characterization of the morphological surface of niosomes.
The noisome encapsulation was performed by a thin film hydration. Span60 (148 mg) and cholesterol (132 mg) were dissolved to ethanol (4 ml) and chloroform (2 ml). The mixture was added into a round bottom flask. The thin film in the flask was produced using a rotary evaporator at 70°C and air-dried in the fume hood. Later, samples were measured in the amount of 5 mg and add 5 ml of propylene glycol, then stir until dissolved and poured into an evaporated round bottom flask and swirl in a hot water bath at 50-52 °C until the substance in the flask turns opaque. The niosome sample was distributedon a glass slide by a drop of 10 µL of water onto the glassslides.The niosomesampleswere thendrippedonto glass slides,thenair-dried The sizesand morphologicalsurfacesof niosomesof each sample were evaluated by a scanning electron microscope (SEM) (Theansungnoen et al., 2020)
3.Results and Discussion
3.1 The percentage yield of extracts
The extraction yields of ethanolic and methanolic extracts are shown in Table 1. The yield of crude ethanolic extracts was observed as orange carrot ethanolic extract (OCE) followed by roselle calyxes ethanolic extract (RCE), purple carrot ethanolic extract (PCE), and red cotton tree pollen ethanolic extract (RTE) at 31.39±0.81%, 11.65±0.37%, 11.30±0.47%, and 9.86±0.46%, respectively. The yield of crude methanolic extracts was observed as roselle calyxes methanolic extract (RCM), orange carrot methanolic extract (OCM), purple carrot methanolic extract (PCM), and red cotton tree pollen methanolic extract (RTM) at 32.51±0.97%, 31.39±0.81%, 23.11±0.90%, and 10.53±0.24%, respectively. The differentiation in extract yields from the studied plant materials is related to the
Chaikhampa et al ND30 Page 138
different accessibility of extractable components as an effect of diverse phytochemical compositions (Sultana et al., 2009). The polarity of the solvent selected affects the extract yield. Furthermore, the yield may be influenced by the compound's solubility and the solvent used. For instance, methanol and ethanol are major polar solvents used to extract some polyphenols, flavonols, alkaloids, and saponin (Jadid et al., 2017).
3.2 Antioxidant activities of the selected plant extracts
The antioxidant activity can be assessed by the DPPH scavenging assay. According to antioxidants' ability to transfer electron or hydrogen, the stable free radicals from DPPH react with the antioxidants intheextracts,resultinginavisuallyobservablediscolorationfromviolet toyellow.Alower IC50 shows a higher antioxidant activity (Do et al., 2014). Table 2 shows the IC50 values of both ethanolic and methanolic extracts of the selected plants obtained by the DPPH scavenging activity assay The IC50 values of the ethanolic extracts were 0.14±0.01 mg/mL in RCE, 0.15±0.01 mg/mL in RTE, and 0.60±0.03 mg/mL in PCE, while those of the methanolic extracts were 0.12±0.01 mg/mL in RCM, 0.15±0.01 mg/mL in RTM, and 0.61±0.06 mg/mL in PCM. OCE and OCM did not show antioxidant activity at even the highest concentration used. The quantity of antioxidant components that can be extracted varies depending on the sample. Furthermore, the ability of the extraction solvent to dissolve bioactive compounds might also be critical (Sultana et al., 2009).
3.3 The particle characteristics of the extract-encapsulated niosomes
By SEM observation (Figure 1), the particle characteristics of the extract-encapsulated niosomes were round-like shapes with smooth (Figure 1b, 1f and 1g) or rough (Figure 1a, 1c, 1d and 1e) Niosomes are small spherical sacs that can hold various substances within. The structure of the vesicle wall is a double wall which is from the self-arrangement of surfactant molecules containing polar and Table 2 IC50 values of ethanol and methanol extracts of selected plants.
Chaikhampa et al ND30 Page 139
Samples % Yield ± SD Purple carrot ethanolic extract (PCE) 11.65±0.37 Orange carrot ethanolic extract (OCE) 9.86 ± 0.46 Red cotton tree pollen ethanolic extract (RTE) 11.30±0.47 Roselle calyxes ethanolic extract (RCE) 25.75±0.91 Purple carrot methanolic extract (PCM) 23.11±0.90 Orange carrot methanolic extract (OCM) 31.39±0.81 Red cotton tree pollen methanolic extract (RTM) 10.53±0.24 Roselle calyxes methanolic extract (RCM) 32.51±0.97
Table 1 Extraction yield of ethanolic and methanolic extracts of the selected plants.
Sample IC50 ± SD (mg/ml) PCE 0.60 ± 0.03 PCM 0.61 ± 0.06 RTE 0.15 ± 0.01 RTM 0.15 ± 0.01 RCE 0.14 ± 0.01 RCM 0.12 ± 0.01 OCE Nd. OCM Nd. L-Ascorbic acid 0.0014 ± 0.00 Nd. means Not detected.
properties that exist in the same molecules. They cause arrangement by bringing together parts with the same properties and are stacked as a wall. Therefore, niosomes may be arranged in a single layer or may be produced in more than one class (Thanaketpaisarn et al., 2012).
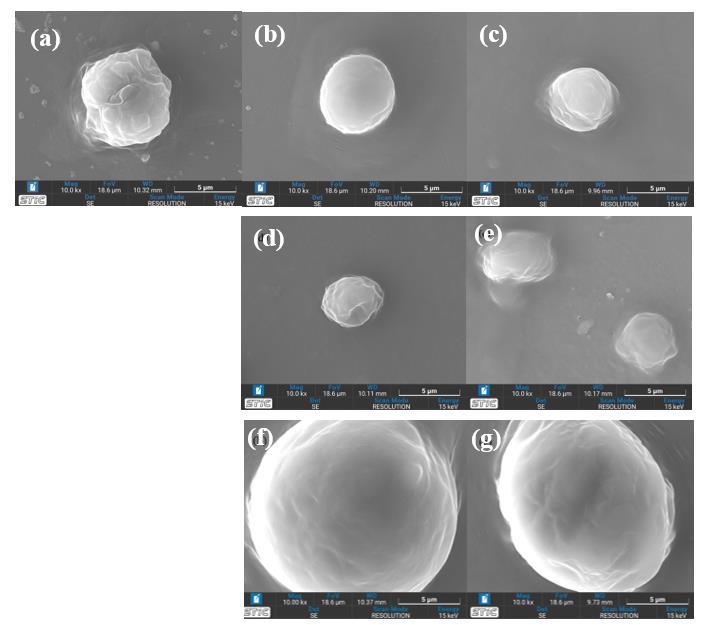
The diameters of single niosomal vesicle are shown in Table 3. It was found that each niosomal vesicle showed a different diameter mean (4-16 µm). The diameter means of niosome with RTE (14.79 µm) and niosome with RTM (16.42 µm) were wider than the niosome without extract or the control (7.43 µm). Contrastingly, the niosome with PCE had a diameter mean of 6.36 µm, followed by niosome with PCM (5.25 µm), niosome with RCE (4.61 µm), and niosome with RCM (4.06 µm) which were smaller than the control. The physicochemical properties of the encapsulated material can impact the final characteristics of the vesicles (Un et al., 2015). Therefore, the results can be assumed that the reduction in the size of both roselle and purple carrot niosomes might be indicative of the interaction between extract and surfactant tending to increase niosomal cohesiveness, resulting in a reduction in size.
4. Conclusion
The ethanolic and methanolic extracts of the selected plants including purple carrot, red cotton tree, and roselle extracts have antioxidant activity as assessed by the DPPH assay. The roselle calyxes extracts (RCE and RCM) and red cotton tree pollen extracts (RTE and RTM) have a greater antioxidant
Chaikhampa et al ND30 Page 140
Figure 1 The sizes and morphological surfaces of niosomes with the selected plant extracts. (a) a niosome without extract (Control), (b) a niosome with PCE, (c) a niosome with PCM, (d) a niosome with RTE, (e) a niosome with RTM, (f) a noisome with RCE, and (g) a niosome with RCM. non-polar
A noisome with PCE
A noisome with PCM
A niosome with RTE
A niosome with RTM A noisome with RCE
activity than purple carrot extracts (PCE and PCM) in this study. Niosome encapsulation with the selected plant extracts were successfully performed by a thin-film hydration technique. The niosome morphology has been characterized as spherical shapes with various smooth or rough surfaces, as well as a variety of particle sizes observed from nanoscale to microscale. Therefore, all of the studied plants wereconsideredasantioxidant sourcesand,withthepreliminaryresultsofniosomedevelopment,could be beneficial for the cosmetic industry and beauty technology application.
5.Acknowledgements
The authors are grateful to Mr. Tinnakorn Bang-ngoen for scanning electron microscope analysis (SEM). Additionally, we would like to thank the Program of Beauty Technology, School of Cosmetic Science and the Scientific & Technological Instruments Center, Mae Fah Luang University, for supporting and providing all the research facilities for this study.
6.References
Bhargava, S. Shah, M. B. (2020). Evaluation of efficacy of Bombax ceiba extract and its major constituent, mangiferin in streptozotocin (STZ)-induced diabetic rats. Journal of Complementary and Integrative Medicine, 18(2), 311-318.
Chauhan,S., Sharma,A., Upadhyay, N. K.,Singh, G.,Lal, U.R. Goyal, R.(2018). In-vitroosteoblast proliferation and in-vivo anti-osteoporotic activity of Bombax ceiba with quantification of lupeol, gallic acid and β-sitosterol by HPTLC and HPLC. BMC Complementary and Alternative Medicine, 18(1), 1-12.
Chen, S., Hanning, S., Falconer, J., Locke, M. Wen, J. (2019). Recent advances in non-ionic surfactant vesicles (niosomes): fabrication, characterization, pharmaceutical and cosmetic applications. European Journal of Pharmaceutics and Biopharmaceutics, (144), 18-39.
Deavall, D. G., Martin, E. A., Horner, J. M., Roberts, R. (2012). Drug-induced oxidative stress and toxicity. Journal of Toxicology, 2012, 1–13.
Diab, K. A., El-Shenawy, R., Helmy, N. M., El-Toumy, S. A. (2022). Polyphenol content, antioxidant,cytotoxic, and genotoxic activities of Bombax ceiba flowers in liver cancer cells huh7. Asian Pacific Journal of Cancer Prevention, 2022, 23(4), 1345-1350.
Do, Q. D., Angkawijaya, A. E., Tran-Nguyen, P. L., Huynh, L. N., Soetaredjo, F. E., Ismadji, S., Ju,H. Y. (2014). Effect of extraction solvent on total phenol content, total flavonoid content, and antioxidant activity of Limnophila aromatica. Journal of Food and Drug Analysis, 22(3), 296–302.
Fidrianny, I., Virna,V. Insanu,M. (2018).Antioxidant potential ofdifferent parts ofBogor Pineapple (Ananas Comosus [L.] Merr. Var. Queen) cultivated in west java-indonesia. Asian Journal of Pharmaceutical and Clinical Research, 11(1), 129.
Chaikhampa et al ND30 Page 141
Samples Diameter (µm)
Table 3 Diameter of the extract-encapsulated niosomes
A niosome without extract (Control)
niosome
7.43 6.36 5.25 14.79 16.42 4.61 4.06
A
with RCM
Hajizadeh,M.R.,Maleki,H.,Barani,M.,Fahmidehkar,M.A.,Mahmoodi,M. Mahani,M.T.(2019). In vitro cytotoxicity assay of d-limonene niosomes: an efficient nano-carrier for enhancing solubility of plant-extracted agents. Research in Pharmaceutical Sciences, 14(5), 448-458.
Jabeura, I., Pereiraa, E., Barrosa, L., Calhelhaa, R. C., Sokovićc, Oliveirab, M. B. P. P. Ferreiraa, I. C.F. R. (2017). Hibiscus sabdariffa L. as a source of nutrients, bioactive compounds and colouring agents. Food Research International, 1-32.
Jadid, N., Hidayati, D., Hartanti, S. R., Arraniry, B. A., Rachman, R. Y., Wikanta, W. (2017). Antioxidant activities of different solvent extracts of piper retrofractum vahl. using DPPH Assay. AIP Conference Proceedings, 1854(10), 020019-1–020019-6.
Katerji,M.,Filippova,M. Hughes,P.D.(2019).Approachesandmethodstomeasureoxidative stress in clinical samples: research applications in the cancer field. Oxidative Medicine and Cellular Longevity, 1-29.
Khan, S., Akhtar, M. U., Khan, S., Javed, F. Khan, A. A. (2020). Nanoniosome‐encapsulated levoflaxicin as an antibacterial agent against brucella. Journal of Basic Microbiology, 60(3), 281-290
Ojulari, O. V., Lee, S. G. & Nam, J. O. (2019). Beneficial effects of natural bioactive compounds from Hibiscus sabdariffa L. on obesity. Molecules, 24(1), 210.
Poorani, V., Selvakumar, K. & Venkat, K. G. (2020). Improving bioavailability of phytochemicals through niosomes. Journal of Drug Delivery and Therapeutics, 10(6), 119-121.
Rasheed, H., Shehzad, M., Rabail, R., Kowalczewski, P. L., Kido, M., Jezowski, P., Ranjha, M. M. A. N., Rakha, A., Din, A. & Aadil, R. M. (2022). Delvinginto the Nutraceutical Benefits of Purple Carrot against Metabolic Syndrome and Cancer: A Review. Applied Sciences, 12(6), 3170.
Silva,D.(2014).Nutritional andHealthBenefitsofCarrotsandTheirSeedExtracts.FoodandNutrition Sciences, 05(22), 2147-2156.
Singh, P., Khan, M. & Hailemariam, H. (2017). Nutritional and health importance of Hibiscus sabdariffa: a review and indication for research needs. Journal of Nutritional Health & Food Engineering, 6(5), 123-128.
Sultana, B., Anwar, F. & Ashraf, M. (2009). Effect of extraction solvent/technique on the antioxidant activity of selected medicinal plant extracts. Molecules, 14(6), 2167–2180.
Thanaketpaisarn, O , Waiwut, P , Sakurai, H. & Saiki, I. (2011). Artesunate enhances TRAIL-induced apoptosisinhumancervicalcarcinomacellsthroughinhibitionoftheNF-kappaBandPI3K/Akt signaling pathways. International Journal of Oncology, 39(1), 279
285.
Theansungnoen, T., Daduang, J., Priprem, A., Boonsiri, P., Daduang, S. & Klaynongsruang, S. (2020). Formulation and evaluation of niosome encapsulated with KT2 and RT2: antimicrobial and anticancer peptides derived from crocodile leukocyte extract. International Journal of Pharmaceutical Sciences and Research, 11(2), 623-630.
Un, R. N., Barlas, F. B., Yavuz, M., Seleci, D. A., Seleci, M., Gumus, Z. P., Guler, E., Demir, B., Can, M., Coskunol, H. & Timur, S. (2015). Phyto-niosomes: in vitro assessment of the novel nanovesicles containing marigold extract. International Journal of Polymeric Materials and Polymeric Biomaterials, 64(17), 927-937.
Xu, G. K., Qin, Z. Y., Wang, G. K., Xie, G. Y., Li, X. S., Sun, C. Y., Liu, B L. & Qin, M. J. (2017). Antihyperglycemic, antihyperlipidemic and antioxidant effects of standard ethanol extract of Bombax ceiba leaves in high-fat-diet- and streptozotocin-induced Type 2 diabetic rats. Chinese Journal of Natural Medicines, 15(3), 168-177.
Chaikhampa et al ND30 Page 142
–
*********************
Mucoadhesive properties of Stingless bee’s propolis extract loaded Poloxamer blend sodium carboxymethylcellulose gel
Natthan Charernsriwilaiwat1*and Rattanan Thaitrong2
1Research Unit of Pharmaceutical Innovations of Natural Products (PhInNat), Faculty of Pharmaceutical Sciences Burapha University, Chonburi 20131, Thailand
2 Faculty of Pharmaceutical Sciences Burapha University, Chonburi 20131, Thailand
*Corresponding author. E-mail: natthan@go.buu.ac.th
Abstract
The major compound of stingless bee propolis (SBP) obtained from a mangosteen garden in Chantaburi, Thailand is -mangostin. It also has antibacterial and antioxidant properties. People in Thailand used SBP to treat mouth ulcers by applying it directly to the ulcer, which does not last long. Controlled and sustained buccal administration has recently become the standard in modern pharmaceutical design in order to improve bioavailability, promotepatient compliance,and reduce adverse effects. Insitugel-forming polymericdelivery methods, such as Poloxamer 407 (P407), which has outstanding thermo-sensitive gelling characteristics and biocompatibility, have sparked this interest. However, this gel lacks mucoadhesive characteristics. It will not be able to stay on the buccal long enough for the extracts to be released. Hence the aim of a recent study was to develop a thermosensitive gel by using P407 and sodium carboxymethylcellulose (SCMC) with 0.2% w/w ethanoic SBP extract for buccal cavity. SCMC is mucoadhesive polymers prolong the residence time of the dosage form in the buccal cavity and suitable as matrix material for controlled release. The insitu gel formulation had produced to assess thermoresponsive behaviour (TSol-Gel), physical properties, control release, mucoadhesive and antioxidant properties using 2,2-diphenyl-1picrylhydrazyl (DPPH) method. Most formulations display suitable to use for oral application composed of 0.2% w/w SBP in 15% w/w P407/0.05% w/w SCMC. TSol-Gel of the formulation was 34.20 ± 0.2C. The formulation showed a pH value of 5.33 ± 0.02 and the release profile fit to Higuchi model. For the antioxidant property, IC50 of the formulation was 79.27 ± 1.69 mg/ml. Furthermore, 0.2% w/w SBP in 15% w/w P407/0.05% w/w SCMC gel showed mucoadhesiveproperties betterthan0.2%w/wSBP in 15%w/wP407gel without SCMC.This mucoadhesive thermo-sensitive gels with 0.2% w/w SBP extract may have the potential to apply in buccal delivery.
Keywords: Stingless bee’s propolis; Poloxamer P407; sodium carboxymethylcellulose; in situ gel
1. Introduction
Five diverse genera of eusocial insects make up the group of stingless bees (Choudhari, Punekar, Ranade, & Paknikar, 2012). These genera are all capable of producing propolis. Tetragonula pagdeni Schwarz, Lepidotrigona ventralis Smith, and Lepidotrigona terminata Smith (Apidae) are commercially grown in Thailand in fruit orchards with manufactured beehives (Umthong, Phuwapraisirisan, Puthong, & Chanchao, 2011). Stingless bees can generate propolis, which is a combinationofstinglessbeewax,plantexudates,andpollensassealinggluefortheirbeehives(S.Jones etal.,2009).Apriorstudyreportedonthecontentandactivityofstinglessbees'propolis(SBP)obtained
ND32 Page 143
December
Proceeding of Cosmetic & Beauty International Conference 2022 Future of the Next Beauty (CBIC 2022) 7th-9th
2022
in the same location of a mangosteen orchard in Chantaburi, Thailand. The primary chemical in the SBP was discoveredto be -mangostin.It also had antioxidantproperties,antimicrobialproperties,and an alpha glucosidase inhibitory effect (Vongsak, Kongkiatpaiboon, Jaisamut, Machana, & Pattarapanich, 2015) SBP was used to cure mouth ulcers in Thailand by putting it straight to the ulcer, which did not persist long. To enhance bioavailability, promote patient compliance, and minimize adverse effects, controlled and sustained buccal delivery has increasingly become the trend in modern pharmaceutical design. This interest has been triggered by in situ gel-forming polymeric delivery methods such as Poloxamer 407 (P407), which has remarkable thermo-sensitive gelling properties and biocompatibility. However, this gel lacks mucoadhesive properties which is low ability to stay on the buccal long enough to release the extracts. The addition of mucoadhesive polymer is a very effective approachforincreasingthebioavailabilityofgelformulations.Many mucoadhesivepolymersincluding sodium carboxymethylcellulose (SCMC), chitosan, and carbopol were examined and SCMC showed extending of the residence period of the dosage form in the buccal cavity. It can be used as a matrix material for controlled release (Priprem et al., 2013; Wu, Chen, & Jin, 2016).
The purpose of this study was to develop a thermosensitive gel containing P407 and SCMC with0.2%w/wethanoicSBPextractforthebuccalcavity.Thephysical appearance,TSol-Gel temperature, pH, viscosity, and percentage content of SBP extract gel were all investigated. The antioxidant activity of gel was determined in vitro using the (2,2-diphenyl-1-picrylhydrazyl (DPPH) technique. In artificial saliva, the release profile of SBP extract from gel was examined. The viscosity approach was used to investigate the mucoadhesive property.
2. Materials and Methods
2.1 Materials
Stingless bee’s propolis was obtained from a farmer at Patthawi, Makham, Chanthaburi, Thailand. Poloxamer 407 (P407), sodium carboxymethylcellulose (SCMC), and mucin from porcine stomach type II were purchased from Sigma Aldrich. All reagents were analytical grade.
2.2 Extraction of SBP
The SBP (4g) was cleaned and split into little pieces individually. The SBP was dried overnight at 50 C before being macerated in a sonicator bath with ethanol (40 ml) for 60 min at 40 C. The suspension was centrifuged at 500 g for 20 minutes at 20 C The supernatants were collected and evaporated using a rotary evaporator. Then, 400ml of hexane was used to dewax each extract (Vongsak et al., 2015)
2.2.1 Determination of α-mangostin
Theamount ofα-mangostininSBPextractswasanalyzedbyHPLC.AVertiSep® AQSC18column (250 mm × 4.6 mm, 5 μm particle size) with a C18 guard column was used. The HPLC analysis was performed according to the method of Pothitirat et al., 2009 with a slightly modification (Pothitirat, Chomnawang, Supabphol, & Gritsanapan, 2009). The elution was performed using gradient solvent systems that consisted of acetonitrile (mobile A) and 0.1% v/v ortho phosphoric acid (mobile B) with a flow rate of 1 mL/min at ambient temperature. The gradient program was as follows: 70% A for 0
15 min, 70% A to 75% A in 3 min, 75% A to 80% A in 1 min, constant at 80% A for 6 min, and 80% A to 70% A in 1 min.?? The wavelength of the UV–visible detector was set at 320 nm.
2.2.2 Determination of anti-oxidant activity
The DPPH technique was used to assess the antioxidant properties of SBP extracts. A 100 L aliquot of 200 M DPPH in ethanol was added to 100 L of extract. The SBP extracts were dissolved in ethanol and then diluted with ethanol to the appropriate concentration. For 30 minutes, the mixture was kept at 37 C. A microplate analyzer was used to measure the absorbance at 520 nm. The results of the assay were expressed as IC50, which represents the concentration of the extract (μg/mL) required to inhibit 50% of the free radical scavenging activity. The free radical scavenging activity was assessed using equation 1:
% Inhibition = [(Acontrol 520 nm – Asample 520 nm)/Acontrol 520 nm] x 100 ……………(1) where Asample 520 nm is the absorbance in the presence of the extracts and Acontrol 520 nm is the absorbance of the control. The IC50 values were calculated by linear regression of the plots where the
Charernsriwilaiwat et al. ND32 Page 144
–
x-axis represented the various concentrations (μg/mL) of the extracts and the y-axis represented the % inhibition
2.3 Formulation and Characterization of SBP extract gels
The P407 was gently added to the water at 5 C with mild agitation, and the SCMC was added at various concentrations (0.025, 0.05, and 0.1% w/w). The propolis extract from stingless bees was loadedintothegelat0.2%w/w.TheformulationofinsitugelwithandwithoutSBPextractisillustrated in Table 1. Gel (10 g) in a vial containing a magnetic bar was put in a water bath at 15 C with a thermosensor immersed in the gel and heated with continuous stirring to measure the sol-gel transition temperatures (Tsol-gel). Tsol-gel was determined as the temperature measured by the thermistor when the magnetic bar stopped moving leading to gelation.
The visual approach was used to describe the appearance of the SBP extract gels. The pH of the gels was determined using a pH meter (Horiba PH-33, Japan). Rheometer was employed to assess the viscosity of gels (Kinexus Pro, Marvern, model KNX2100, England).
The HPLC technique was used to determine the percentage label quantity of SBP in gel composition. To calculate, the quantity of -mangostin was taken as a marker. The % label amount of gel was calculated using equation 2:
Label amount (%) = (La/Lt) 100 (2)
where La is the amount of the SBP extracts that are calculate after formulate and Lt is the initial amount of SBP extracts that are incorporate into formulation.
The In vitro antioxidant activity of SBP extract gels were evaluated using DPPH method. The SBP extract gels were dissolved in ethanol and determined following describe in 2.2.
2.4 Release profile of SBP extract gels
The release profile of SBP extract from the gel was investigated in artificial saliva (Na2HPO4 2.38 g, KH2PO4 0.19 g and, NaCl 8 g in distilled water 1 L pH 6.8). 10 g of SBP extract gels were immersed in 100 ml of artificial saliva and incubated at 37 C with 100 rpm shaking. An aliquot of the release medium solution was analyzed by HPLC at a specific time.
2.5 Evaluation of Mucoadhesive Properties SBP extract gels
The in-situ gel's in vitro mucoadhesive strength was determined using the viscosity technique (cylindrical probe 25 ml) (S.Jones et al., 2009). Mucin (6% w/w) was dissolved in artificial saliva. 3 g of mucin solution was combined with 3 g of gels for 15 minutes to prepare the sample. Each formulation's samples were already packed inside the shallow cylindrical probe. Each sample was utilized at 5 g and temperatures of 25 C, 37 C, and shear rates of 1, 5, 10, 15, 25, and 25 s-1 These equations were used to examine triplicates of each formulation.
ηadhesion = ηtotal - ηm - ηgel ………….(3) σ = kγn ………………………(4)
F = ηadhesionσ (5) where ηadhesion = viscocity of adhesion, ηtotal = viscosity of total (formulation), ηm = viscosity of mucin, ηgel = viscosity of gel, γ = shear stress (Pa), σ = shear rate (s-1), k =consistency index, n = dimensionless number and F = mucoadhesive force (N)
3.Results and Discussion
3.1 SBP extraction
Afterwards extraction, the crude extract was collected with the yield of 11.45 1.06 %. The αmangostin concentration in the SBP extracts was 5.98 0.37 % w/w. SBP extract has an in vitro antioxidant activity (IC50) of 66.96 2.93 g/ml. Vongsak et al. (2015) found that the IC50 of ethanoic SBPextract withoutwaxremoval was122.7 g/mlinapriorinvestigation (Vongsaket al.,2015).These
Charernsriwilaiwat et al. ND32 Page 145
findings suggested that the wax removal SBP extract provided higher antioxidant activity
3.2 Formulation and characterization
Table 1 shows the formulation of based and SBP gels. The amount of SBP extract used was set at 0.2% w/w, which offeredantioxidant capabilities (Vongsaket al., 2015). The appearanceof gel based revealed clear colorless and when SBP extract was added, the gel became yellow.
Table 1 Formulation of SBP extract gels
Table 2 displays the Tsol-gel, pH value, antioxidant activity (IC50), and content (%) of SBP gels. The sol-gel transition temperatures of all formulations were obtained visually. These findings indicated that the SBP formulation's sol-gel transition temperature reductions may be due to the SBP extract binding to the polyethylene oxide chain in P407. This may enhance polymer dehydration, resulting in neighboring molecule and intermolecular forces that lead to gelling at lower temperatures (S.Jones et al., 2009)
Table 2 Physical and Chemical properties including Tsol-gel Temperature, pH, IC50(mg/ml) and content (%) of of SBP extract gels
The pH of gel-based formulations ranged from 5.19 to 5.23. When loaded with SBP extract, the pH of the formulation increased to 5.33-5.39. These findings suggested that the SBP extract in gel formulation had a slight influence on the formulation's pH value. The DPPH radical scavenging activity (IC50) of 0.2 SBP in P407 and P407/ SCMC gel was 81.1 ± 2.43 and 79.27 ± 1.69 mg/ml, respectively. The antioxidant activity of the P407 and P407/SCMC gels was not detected. The remaining percentage of SBP extract in the gel was between 99.37 and 98.42%. This result showed that the SBP extract in the gel formulation did not degrade during the formulation process.
Figure 1 displays the viscosity profile of P407, P407/SCMC, 0.2 SBP in P407, and 0.2 SBP in P407/SCMC gels which had viscosities of 105.71, 104.22, 131.65 and 116.61 mPas, respectively, at 25 ºC The viscosity remained unchanged as the shear rate increase from 1 to 25 S-1 The gel had a Newtonian flow rheology profile at a temperature of 25 C Due to a characteristic of poloxamer, the viscosity of the gel significantly increased at 37 ºC The viscosity of P407, P407/SCMC, 0.2 SBP in P407 and 0.2 SBP in P407/ SCMC gels were 14,766.92, 15,863.41, 14784.61 and 14,798.16 respectively. The viscosity decreased as the shear rate increased from 1 to 25 S-1. At 37 °C, the gel's rheology profile exhibited pseudoplastic flow (Ferreira, Moço, Borghi-Pangoni, Junqueira, &
Charernsriwilaiwat et al.
Page 146
ND32
Formulation P407 0.2 SBP in P407 P407/SCMC 0.2 SBP in P407/ SCMC SBP (g) - 0.2 - 0.2 P407 (g) 15 15 15 15 SCMC (g) - - 0.05 0.05 Tween 80 (g) 0.75 0.75 0.75 0.75 Sodium Saccharin (g) 0.1 0.1 0.1 0.1 Peppermint oil (g) 0.2 0.2 0.2 0.2 Purified water (g) q.s. 100 q.s. 100 q.s. 100 q.s. 100
Formulation Tsol-gel (ºC) pH IC50(mg/ml) content (%) P407 39.17 ± 0.62 5.19 ± 0.02 N/A N/A 0.2 SBP in P407 34.83 ± 0.29 5.39 ± 0.01 81.1 ± 2.43 99.37 ±1.08 P407/SCMC 39.33 ± 1.25 5.23 ± 0.09 N/A N/A 0.2 SBP in P407/ SCMC 34.20 ± 0.20 5.33 ± 0.02 79.27 ± 1.69 98.42 ± 2.03 N/A = not available
LucianoBruschi, 2016) These findings suggested that the P407/SCMC containing SBP extract gel had in situ gel properties.
3.3
Figure 2 displays the release profile of SBP from gels, determined by HPLC method at 37 C. The release profile of the 0.2 SBP in P407 and 0.2 SBP in P407/ SCMC gels was not different. The both gels shows slow released (approximately 20 – 30% of extracts release in 12 h). These gels were able to give prolonged action and maintain the therapeutic action for longer periods of time.

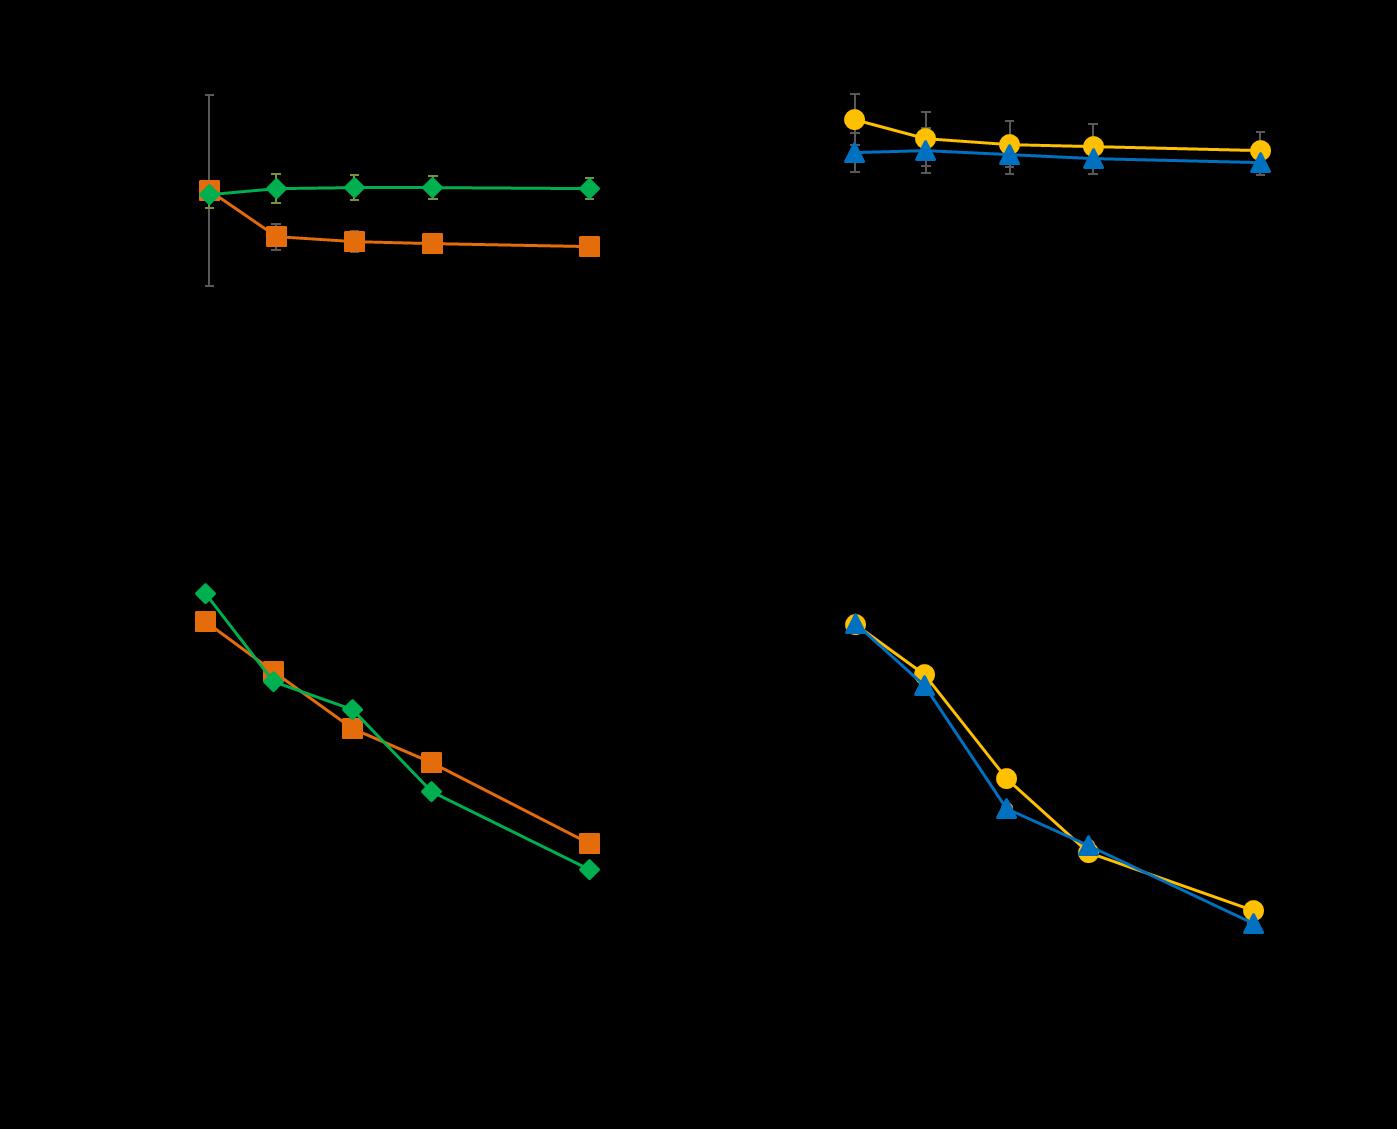
Charernsriwilaiwat et al. ND32 Page 147
Figure 1 Viscosity profile of P407 gels (), P407/SCMC gels (), 0.2 SBP in P407 gels () and 0.2 SBP in P407/ SCMC gels () at 25 C (A and B) and 37 C (C and D).
Release profile of SBP gels
Figure 2 Release character of 0.2 SBP in P407 gels () and 0.2 SBP in P407/ SCMC gels ().
Table 3 displays the kinetic release of SBP gels The best fit for each of the models taken into consideration was determined using the regression coefficient (R2). R2 values made it obvious that the Higuchi equation plot, which depicts the SBP extract release from the gel as a square root of a timedependent process based on Fickian diffusion, had the best linearity. Depending on the concentration of SBP extract, diffusion is the process by which SBP extract is moved from the gel matrix into the surrounding in-vitro media. The SBP extract is released and the distance for diffusion grows as the gradient changes. This may explain why the SBP extract diffuses more slowly as the diffusion distance increases (Bansal et al., 2009; Priprem et al., 2013) These results indicated that the Higuchi model described the kinetic release of the 0.2 SBP in P407 and 0.2 SBP in P407/SCMC gels.
Table 3 Kinetic release of SBP extract gels
Formulation
3.4 Mucoadhesive Properties of SBP extract gels
Curve fitting constant (R2)

Figure 3 displays mucoadhesive properties of the 0.2 SBP in P407 and P407/ SCMC gels. The mucoadhesive forces of 0.2 SBP in P407 and P407/SCMC gels, respectively, were 17.96 and 33.50 at 37 C. In comparison to 0.2 SBP in P407 gels, the 0.2 SBP in P407/ SCMC gels demonstrated good mucoadhesive properties. Even though the effect of increasing shear rate on viscosity becomes less obvious, the 0.2% w/w SBP in a P407/SCMC formulation remained better viscosity. Mucoadhesion starts when the mucoadhesive material comes direct contact with the tissue. Since high-molecularweight polymers readily swell in water and expose a large adhesive surface for maximum contact with mucin, the glycoprotein that predominates in the mucous layer, the P407/SCMC formulation exhibits excellent adhesion according to their chemical nature and offers excellent mucoadhesiveness. These resultsindicatedthat SCMC could enhancethe gel's mucoadhesivepropertieswhen added to in situgel.
4.Conclusion
FormulatingtheP407/SCMCin-situgel withSBPextract wasaccomplished.Whenloadedwith SBP extract, the transparent gels turned yellow. When SBP extract was added, the Tsol-gel temperature and pH values remained constant. The SBP extract in P407 and P407/SCMC gels has antioxidant activity. At temperatures of 25 and 37 C, the rheology profile of gel was Newtonian flow and
Charernsriwilaiwat et al.
Page 148
ND32
Zero order First order Higuchi Korsmeyer-peppas 0.2 SBP in P407 0.9458 0.7394 0.9804 0.9332 0.2 SBP in P407/ SCMC 0.9298 0.6932 0.9599 0.8911
Figure 3 Mucoadhesive properties of 0.2 SBP in P407 gels () and 0.2 SBP in P407/ SCMC gels () at 25 C (A) and 37 C (B).
pseudoplastic flow, respectively. The kinetic release of 0.2 SBP in P407 and 0.2 SBP in P407/SCMC gelswascompatiblewiththe Higuchimodel.Themucoadhesivepropertyofinsitugelmaybeenhanced by the addition of SCMC. In conclusion, buccal delivery might be a possibility for these mucoadhesive thermo-sensitive gels containing 0.2% w/w SBP extract.
5.Acknowledgements
This work was financially supported by the Research and Development Fund Burapha University (Grant no.11/2565)
6.References
Bansal, K., Rawat, M. K., Jain, A., Rajput, A., Chaturvedi, T. P., & Singh, S. (2009). Development of satranidazole mucoadhesive gel for the treatment of periodontitis. AAPS PharmSciTech, 10(3), 716-723. doi:10.1208/s12249-009-9260-z
Choudhari, M. K., Punekar, S. A., Ranade, R. V., & Paknikar, K. M. (2012, May 7) Antimicrobial activity of stingless bee (Trigona sp.) propolis used in the folk medicine of Western Maharashtra, India. J Ethnopharmacol (Vol 1).
Ferreira, S. B. D. S., Moço, T. D., Borghi-Pangoni, F. B., Junqueira, M. V., & LucianoBruschi, M. (2016). Rheological, mucoadhesive and textural properties of thermoresponsive polymer blends for biomedical applications. Journal of the Mechanical Behavior of Biomedical Materials, 55, 164-178.
Pothitirat,W.,Chomnawang,M.T.,Supabphol,R.,&Gritsanapan,W.(2009).Comparisonofbioactive compounds content, free radical scavenging and anti-acne inducing bacteria activities of extracts from the mangosteen fruit rind at two stages of maturity. Fitoterapia, 80, 442-447.
Priprem, A., Nukulkit, C., Johns, N. P., Damrongrungruang, T., Wongsangta, N., & Benjavongkulchai, E. O. (2013). Effect of Polymeric Combinations on Mucoadhesive and Swelling Properties of Orabase Gel Formulations. Advanced Materials Research, 853, 3-8. doi:10.4028/www.scientific.net/AMR.853.3
S.Jones, D., Bruschi, M. L., Freitas, O., Gremião, M. P. D., Lara, E. H. G., & P.Andrews, G. (2009). Rheological, mechanical and mucoadhesive properties of thermoresponsive, bioadhesive binary mixtures composed of poloxamer 407 and carbopol 974P designed as platforms for implantable drug delivery systems for use in the oral cavity. International Journal of Pharmaceutics, 372(1-2), 49-58.
Umthong, S., Phuwapraisirisan, P., Puthong, S., & Chanchao, C. (2011). In vitro antiproliferative activity of partially purified Trigona laeviceps propolis from Thailand on human cancer cell lines. BMC Complement Altern Med, 11, 37. doi:10.1186/1472-6882-11-37
Vongsak,B., Kongkiatpaiboon, S.,Jaisamut, S.,Machana, S.,& Pattarapanich, C.(2015).In vitro alpha glucosidase inhibition and free-radical scavenging activity of propolis from Thai stingless bees in mangosteen orchard. Revista Brasileira de Farmacognosia, 25(5), 445-450. doi:10.1016/j.bjp.2015.07.004
Wu, W., Chen, W., & Jin, Q. (2016). Oral Mucoadhesive Buccal Film of Ciprofloxacin for Periodontitis: Preparation and Characterization. Tropical Journal of Pharmaceutical Research, 15(3). doi:10.4314/tjpr.v15i3.3
Charernsriwilaiwat et al. ND32 Page 149
*********************
Efficacy and safety of the new formulation of herbal coffee on weight control
Nuttinee Teerakulkittipong*, Warunee Ketwattha, and Rungrawee Klakasikron
Department of Biopharmaceutical Science, Faculty of Pharmaceutical Sciences, Burapha University, 169 Saensuk Subdistrict, Muang District, Chonburi, 20131, Thailand
*Corresponding author. E-mail: nuttinee@go.buu.ac.th
Abstract
Overweight and obesity are the majorly underlying factors in public health leading to clinical complications.Anewcoffee formulawithnatural extractswas developedtoincrease metabolic rate and would possibly be used as an alternative for weight control. This study aimed to formulate and study the efficacy, safety, and satisfaction of the twelve herbal coffee formula containing mixture of five herbal extracts, (Guarana (Paullinia cupana), Lotus leaves (Nelumbo nucifera), Turmeric (Curcuma loga), Ginger (Zingiber officinale) and Black ginger (Kaempferia parviflora). 24 overweight participants were included and randomized into 2 groups, 12 participants for each in which one group received coffee only while another one received the herbal coffee. Once daily consumption for 30 days was assigned in both groups as well as the body composition that was examined on day 0, 14, and 30. The results indicated that the formulation number 5 showed the promising result in stability test and taste preferences. Study results showed the group receiving herbal coffee were statistically different in body fat percentage (0.073 at 90% CI) and serum LDL-cholesterol (0.036 at 95% CI) decreased compared withinthegrouponday30.Thecoffee was foundtobesafeinbothgroups ofparticipants. Thesatisfactorylevel was moderate. In summary,thisnewherbal coffee tended to be safe with the promising results for weight control in a short-term study. For statistically significant differences of outcomes, further experiment on efficacy and safety in a longer period should be developed.
Keywords: Black ginger; Ginger; Guarana; Herbal coffee; Lotus; Obesity; Overweight; Turmeric
1. Introduction
Overweight and obesity are the excessive or abnormal accumulation of fat or adipose tissue in the body that affects health via its association to the risk of development of cardiovascular disease, cerebrovascular disease, hypertension,and hyperlipidemia. Nowadays, it is a public healthproblem that is increasing every year (Jitnarin et al., 2011; Panuganti et al., 2021). The losing weight that negatively affects the body is the use of weight loss drugs, including discourses of degradation, danger and inefficacy (Throsby, 2009).
Natural dietary supplements derived from herbs are another alternative to diet and exercise for weight loss. Researches result on herbal extracts that can reduce weight gain was garcinia (Garcinia atroviridis) mixed with caffeine and ginger (Zingiber officinale) (Hasani-Ranjbar et al., 2009), ginger (Nazish et al., 2016), guarana (Paullinia cupana) (Boozer et al., 2001; Lima et al., 2017), lotus (Nelumbo nucifera) (Mukherjee et al., 2009; Ahn et al., 2013; Islam et al., 2017), black ginger (Kaempferia parviflora) (Yoshino et al., 2014; Toda et al., 2016), turmeric (Curcuma loga) (Sengupta et al.,2012;Kim et al.,2016;Yadav&Chaudhary,2016)andcoffee(Dellalibera et al.,2006;Onakpoya et al., 2010; Gavrieli et al., 2013; Choi et al., 2016). There are herbal extracts which have been used in
EC36 Page 150
Proceeding of Cosmetic & Beauty International Conference 2022 Future of the Next Beauty (CBIC 2022) 7th-9th December 2022
weight control research in humans such as moringa leaves (Moringa oleifera), curry leaves (Muraya koenigii) and turmeric rhizomes, it was found that the volunteers had a significant reduction in their overall weight and BMI (Sengupta et al., 2012). IQP-GC-101 extract containing garcinia (Garcinia cambogia), green tea (Camellia sinensis), fresh coffee beans (unroasted Coffea arabica) and bananas (Lagerstroemia speciosa) can reduce fat percentage, waist circumference and waist to hip ratio (Chong et al., 2014)
Ready-mixed coffee products will be a way to reach coffee consumers who want to take care of their health and weight control. There have been few studies to prove the efficacy of herbal coffee in clinical weight control before. Therefore, the researcher interested in studying the effect of weight control with coffee mixed with five herbal extracts (guarana, lotus leaves, turmeric, ginger and black ginger) to study the efficacy of herbal coffee by analyzing body composition, health data and exercise behavior In addition, safety studies by assessing hematological biochemical parameters and adverse reactions during research, as well as to assess the satisfaction of consuming products of volunteers.
2. Materials and Methods
2.1 Population and sample
This research is a Quasi-Experimental design (Cook, 2015) which are considered inclusion and exclusion criteria (Table 1). The study was approved by Faculty of Pharmaceutical sciences, Burapha university human ethical committee on June 2018, EC number 21/2018. An overview of the clinical study is provided in Figure 1. Briefly, sample size of this study from Jacob Cohen's tables (Cohen, 1988), the power was 0.8 and the effect size was 0.50 then the sample size was 12 people per group. TheparticipantswererandomlydistributedusingMicrosoftExcel.Group1whodrankonecupofcoffee a day (5 g in 100 ml of hot water - placebo) and group 2 who drank one cup of coffee mixed with herbs a day (6.5 g in 100 ml of hot water - treatment).
Table 1 Inclusion and exclusion criteria
Criteria
Inclusion
Adults age 20-45 years.
BMI 22-39.9 kg/m2 (Girdhar et al., 2016)
Behavior of drinking 1-2 cups of coffee per day
Details
Weight remained stable for the past 3 months before participating in the study
Smoking not more than or equal to 50 pack-year
No family history that no cardiovascular disease
No history of allergy to products from coffee, guarana, ginger, turmeric, black ginger, lotus and the sweetener (Acesulfame potassium)
Did not donate blood within 3 months before the study
Not pregnant or breastfeeding or taking birth control pills
No history of disease or received medication to treat non-communicable diseases including cardiovascular disease, diabetes, hypertension, hyperlipidemia, thyroid disease, Cushing's disease or other contagious disease.
Not take the weight loss drugs or dietary supplements that affect appetite and body metabolism within 3 months before the study.
Willingness to volunteer to participate in the trial and sign the informed consent form
Exclusion
Refusing to participate in the study.
Withdrawing from the study.
The side effects were estimated that if continued it could be harmful to the participants
Teerakulkittipong et al EC36 Page 151
2.2 Data collection
All participants filled a questionnaire, providing details of energy intake and expenditure at the baselineevaluationandduringfollowupevaluationseveryweeks.Atthebaselineandevaluationduring follow up at 14 and 30 days, all participants were measured body composition parameters such as body mass index (BMI), percent body fat (PBF), fat free mass (FFM), muscle mass, total body water (TBW), waist circumference (WC), hip circumference (HC), waist-hip-ratio (WHR), arm circumference (AC), right arm fat mass (RAFM) and left arm fat mass (LAFM) using Bioimpedance Analysis (ACCUNIQ, model BC360).
For an assessment of safety, the volunteers had to abstain from food and water for 8 hours and blood samples (8-10 ml) were collected at the baseline and after 30 days to study parameters including cholesterol, HDL cholesterol (HDL-C), LDL cholesterol (LDL-C), triglyceride, glucose, blood urea nitrogen (BUN), serum creatinine, aspartate aminotransferase (AST)/serum glutamic-oxaloacetic transaminase (SGOT), alanine transaminase (ALT)/serum glutamic pyruvic transaminase (SGPT), alkaline phosphatase (ALP). Both groups were required to continue coffee intake daily for 30 days. Follow up for side effects weekly, if during the experiment, participants have anaphylaxis such as rash, hives, swelling of the face, shortness of breath, difficulty breathing and whistling, stop eating immediately and go to the hospital. If symptoms such as fever, cold, diarrhea are present, refer the investigator to assess the risk and record the herbal coffee used in the side effect and adverse drug reaction log book during the trial. The satisfaction of herbal coffee was assessed after 30 days by using questionnaire i.e., color, smell, taste, packaging and overall satisfaction with a satisfaction rating of 15, which the score 1 = very dissatisfied, 2 = dissatisfied, 3 = satisfied nor dissatisfied, 4 = satisfied and 5 = very satisfied.
Figure 1 Flow chart of study design. Evaluations of body composition were done at baseline (day 0) and on 14 and 30 days. Assessment of hematology was done at baseline and 30 days. Assessment of satisfaction was done only at after 30 days
2.3 Data analysis
A statistical software package was used to analyze the data and set the confidence interval (CI) at 95% (p < 0.05) and 90% (p < 0.1) are considered statistically significant and at 90% confidence interval is using to study trends in comparison of each variance). Statistics used to analyze data include Paired t-test, Analysis of covariance (ANCOVA) and Repeated measures ANCOVA. Paired t-test used to compare the efficiency of weight control and safety effects before and after intake coffee in the same group. ANCOVA used to compare the efficiency of weight control between the two groups at 14 and 30 days. Repeated measures ANCOVA used to compare the efficiency of weight control overall between the two groups and used to draw a graph comparing the weight control efficiency. Both ANCOVA and Repeated measures ANCOVA have eating, exercise and before drinking coffee is a covariate factor.

Teerakulkittipong et al EC36 Page 152
3.Results and Discussion
3.1 Population
The baseline characteristics of 24 participants from Chonburi province were provided in Table 2 that was similar with respect to gender, age and BMI as well as energy intake and expenditure of participants found that the average total energy intake from food (kcal) per day and total energy expenditure from exercise (kcal) per day was not different (Table 3).
Table 2 Baseline characteristics of participants in both study groups (Numbers and percentages)
Table3Energyintakeandexpenditureofparticipantsinbothstudygroupsduringthetrial(Meanvalues and standard deviations)
3.2 The efficacy of new formulation of herbal coffee on weight control
The present study evaluated the efficacy of herbal coffee (group 2, G2) on weight loss in comparison with control (group 1, G1) that shows the all parameters of body composition were not significantly different at p<0.05 and p<0.1 (Table 4) The selection of samples in both groups with similar body composition was a good representation of participant when comparing the baseline differences of each group on 14 and 30 days, there was no statistically significant difference at p<0.05 and p<0.1 either.
When comparing the mean BMI before and after consuming coffee within the same group, it was found that both group 1 and group 2 had no statistically significant difference at p<0.05 and p<0.1 in mean BMI within the same group, both at 95% CI and 90% CI (p = 0.102 and 0.383, respectively). As
Teerakulkittipong et al EC36
Baseline variables Group 1 (n = 12) Group 2 (n = 12) n % n % Gender Men 7 58 4 33 Women 5 42 8 67 Age (y) ≥ 20-29 10 84 11 92 ≥ 30-39 1 8 1 8 ≥ 40-45 1 8 0 0 BMI (kg/m2 ) ≥22-22.9 (Normal range) 1 8 0 0 ≥23-24.9 (Overweight) 4 33 4 33 ≥25-29.9 (Obese I) 5 42 6 50 ≥30-39.9 (Obese II) 2 17 2 17
Energy intake and expenditure Group 1 (Mean ± SD) Group 2 (Mean ± SD) Energy intake from food (kcal) 0 week 1,458.20 ± 456.20 1,317.25 ± 416.96 1 week 1,200.53 ± 417.19 1,206.44 ± 511.06 2 weeks 1,164.86 ± 380.01 1,054.55 ± 406.83 3 weeks 1,120.00 ± 352.87 1,044.85 ± 318.30 4 weeks 1,104.59 ± 310.61 1,124.25 ± 426.61 Total average (kcal/day) 1,209.64 ± 56.31 1,149.47 ± 68.52 Energy expended from exercise (kcal) 0 week 174.69 ± 404.95 34.05 ± 48.41 1 week 149.68 ± 301.26 33.60 ± 45.54 2 weeks 84.76 ± 213.03 71.19 ± 109.84 3 weeks 104.77 ± 257.83 73.33 ± 121.09 4 weeks 94.10 ± 244.53 45.34 ± 78.47 Total average (kcal/day) 121.60 ± 284.32 51.50 ± 34.51
Page 153
Table 4
Body composition before and after 14 and 30 days in both study groups (Mean values and standard deviations; mean differences (MD))
well as comparing the mean BMI between the two groups on days 14 and 30 of coffee intake (p = 0.686 and 0.156, respectively). After 30 days of consuming coffee, the mean BMI of both groups was not significantly different at 95% CI and 90% CI (p = 0.698) but the graph shows that group 2 tended to decrease mean BMI while group 1 tended to increase (Figure 2).
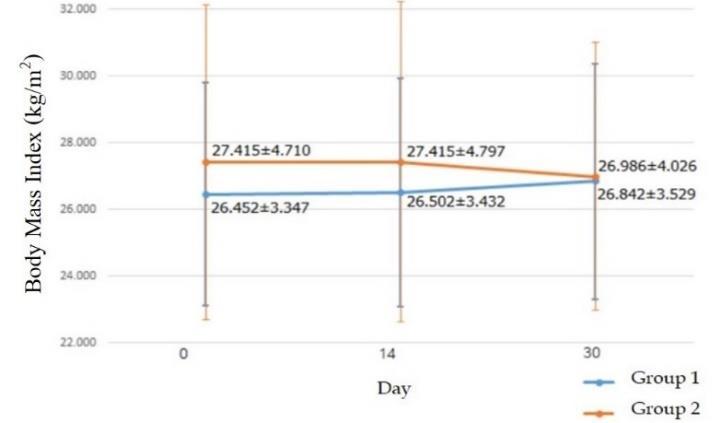
When comparing the mean PBF before and after consuming coffee within the same group, group 1 had no statistically significant difference in mean PBF within the same group despite the 95% CI and 90% CI (p = 0.524) while the second group had a statistically significant decrease in mean body fat percentage within the same group at 90% CI but not statistically significant at 95% CI (p = 0.073). A comparison of mean PBF between the two groups comparing the 14 days, 30 days of coffee intake and after 30 days, found that neither group had a statistically significant difference in mean PBF at 95% CI and 90% CI (p = 0.402, 0.490 and 0.247, respectively). But from the graph, it was found that the second group tended to decrease the average PBF (Figure 3). According to research on the effectiveness of weight control, it was found that the PBF was more likely to decrease when compared within the herbal coffee group, consistent with a 12-week human study with black ginger extract (Yoshino et al., 2014) and a study with guarana extract in volunteers for 8 weeks (Boozer et al., 2001), found a statistically significant reduction in PBF.
A review of the literature describes a possible mechanism for weight control of five herbal coffees (Figure 4). Coffee reduces appetite (Onakpoya et al., 2010; Gavrieli et al., 2013). Guarana seed extract prevents pre-adipose tissue from developing into adipose tissue by increasing anti-adipogenic upregulation. The genes Wnt10b, Wnt3a, Wnt1, Gata3 and Dlk1 increase the down-regulation of the proadipogenic genes Cebpα, Pparγ and Creb1, as well as stimulate the β-catenin nuclear translocation, resulting in decreased adipogenesis (Lima et al., 2017). Black ginger Root Extract stimulates up
Teerakulkittipong et al EC36 Page 154
Body composition Baseline (Mean ± SD) p 14 days (MD) p 30 days (MD) p G1 G2 G1 G2 G1 G2 BMI (kg/m2 ) 26.43 ± 3.35 27.44 ± 4.71 0.548 0.008 0.042 0.873 0.350 -0.417 0.142 PBF (%) 28.63 ± 6.53 32.12 ± 3.74 0.122 -0.017 -0.483 0.215 -0.233 -0.600 0.440 FFM (kg) 53.25 ± 9.26 49.80 ± 9.99 0.390 -0.150 0.408 0.399 0.317 0.542 0.689 Fat mass (kg) 21.71 ± 7.46 23.95 ± 7.19 0.462 -0.017 -0.317 0.229 -0.117 -0.367 0.542 Muscle mass (kg) 29.33 ± 5.16 27.36 ± 5.45 0.373 -0.067 0.308 0.341 0.200 0.217 0.960 TBW (L) 38.33 ± 6.67 35.91 ± 7.15 0.401 -0.092 0.158 0.593 0.242 0.350 0.790 WC (cm.) 89.21 ± 10.11 89.07 ± 13.44 0.976 -0.033 -0.392 0.284 -0.150 -1.508 0.234 HC (cm.) 106.73 ± 7.48 105.05 ± 9.06 0.624 0.229 -1.496 0.177 0.104 -0.714 0.338 WHR 0.83 ± 0.04 0.84 ± 0.06 0.613 -0.002 0.003 0.444 -0.002 0.000 0.836 AC (cm.) 31.63 ± 3.21 30.84 ± 3.70 0.584 -0.317 -0.708 0.594 -0.633 -0.633 0.660 RAFM (kg) 1.35 ± 0.49 1.46± 0.44 0.574 0.011 -0.002 0.528 0.015 -0.007 0.491 LAFM (kg) 1.36 ± 0.48 1.48 ± 0.43 0.520 0.006 -0.024 0.107 0.005 -0.019 0.407
Figure 2 The mean body mass index compared within and between groups (Group 1 is coffee and group 2 is herbal coffee).
regulation of UCP1 protein in brown adipose tissue to burn more energy resulting in non-shivering thermogenesis, thus increasing the breakdown of fat (Yoshino et al., 2014). Lotus leaf extract inhibits pancreatic lipase and adipocyte differentiation (Ahn et al., 2013; Sharma et al., 2016). Turmeric rhizome extract reduced white adipose tissue by suppressing adipocyte differentiation and lipogenesis (Sengupta et al., 2012). Turmeric extract increases the level of adiponectin fat oxidation fat metabolism (Yamauchi et al., 2002). In research by Dellaliberaet et al., (2006) found a statistically significant mean weight loss after 60 days of coffee bean extract intake due to the fact that coffee is a rich source of chlorogenic acids, chlorogenic acids have both antioxidant, decrease oxidative stress caused by oxidation of lipoproteins in the body, inhibits the activity of Na+ electrochemical thereby reducing the influx of glucose into cellsand inhibit the work of glucose-6-phosphate at the pancreas to balance water use more sugar in the body. The mechanism by which coffee competes with adenosine in binding to receptors that are commonly found in all organs. It was found that coffee stimulates the breakdown of fat more during exercise. When higher doses of coffee, the rate of energy metabolism in the body increases as well (Stern et al., 2013). In addition, Roshan et al., (2018) studied the effect of using fresh coffee bean extract capsules at a dosage of 400 mg twice daily with a main meal for 64 days in combination with a diet. It was found that weight, waist circumference and BMI had a downward trend (p = 0.057, 0.009 and 0.055, respectively) compared to the control group. When comparing the duration of the reference studies with this study, the duration of the study was considered too short and should be increased to 60 days to see a difference in weight control with 5 types of herbal coffee that is clearer.
Figure 4 Possible mechanisms of the new herbal coffee on weight control
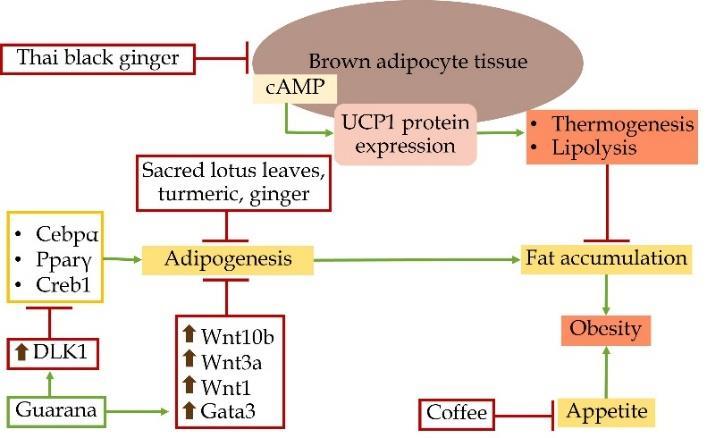
3.3 The results of safety of new formulation of herbal coffee on weight control
Adverse reactions were found in 2 people of the second group has diarrhea during the first week and 1 person had nausea, representing 17% and 8%, respectively. A daily dose of 1,200 mg of ginger extract significantly reduced gastric emptying time and simulated gastrointestinal peristalsis in healthy volunteers (Wu et al., 2008). Coffee was also found to increase colon motility and bowel movements (Sloots et al., 2005). This may explain the cause of diarrhea in the herbal coffee group.
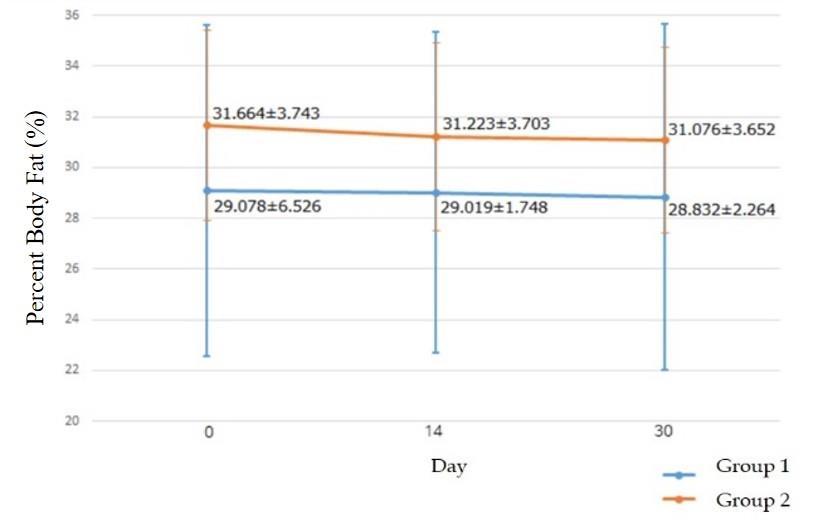
Teerakulkittipong et al EC36 Page 155
Figure 3 The mean PBF compared within and between groups (Group 1 is coffee and group 2 is herbal coffee)
*Significantly different at p<0.1 (90% CI)
**Significantly different at p<0.05 (95% CI)
Laboratory tests on safety found that a total of 12 people in group 1 had all of the normal clinical chemistry blood test values both before and after coffee ingestion. Group 2 of 12 people showed statistically significant increases in HDL-C and AST between before and after coffee intake at 90% but not statistically at 95% (p = 0.065 and 0.082, respectively). In addition, there was a statistically significant decrease in LDL-C between before and after herbal coffee intake, both at 95% and 90% CI (p = 0.036). A statistically significant decrease in alkaline phosphatase was found between before and after coffee consumption at 90% CI but not statistically at 95% CI (p = 0.078) in Table 5.
In terms of safety, it was found that the significantly increased HDL and decreased LDL in the herbal coffee group may be related to the activity of lotus leaf extract which is consistent with the research of Islam et al., (2017) found that lotus leaf extract increased HDL levels and decreased LDLcholesterol levels statistically significant in rat Long-Evans. A study by Yoshino et al., (2018) found that black ginger extract increased the fat burning process in the body, resulting in an increase in volunteers' HDL content. Hepatoprotective effects have been reported of low doses of caffeine (5 and 10 mg/kg) in rats treated with carbon tetrachloride and there was a statistically significant decrease in liver enzyme values including alkaline phosphatase (Sloots et al., 2005). This may be the source of a statisticallysignificantdecreaseinthealkalinephosphataseofthevolunteersinbothgroups.Inaddition, the herbal coffee group received turmeric extract containing curcumin which has been reported to significantly reduce liver injury (Hasani-Ranjbar et al., 2009). The increased AST value in the herbal coffee group may be attributed to black ginger that has been reported to significantly alter liver enzyme levels (Sudwan et al., 2006).
3.4 The results of a satisfaction study of new formulation of herbal coffee on weight control
The satisfaction containing color, smell, taste, packaging and overall satisfaction of the herbal coffee are shown in satisfied nor dissatisfied scores (Table 6).
4.Conclusion
The herbal coffee showed the tendency to increase HLD-C and reduce LDL-C and body fat percentage which would be applied to control weight when continuously used and longer duration as well as the safety reported the blood biochemistry profiles were in normal range. Further improving the satisfaction in terms of taste and scent are important to be commercialized.
Teerakulkittipong et al EC36 Page 156
Parameters Study period Group 1 Group 2 Mean ± SD MD P Mean ± SD MD P Cholesterol (0 -200 mg/dL) Baseline 211.50 ± 42.86 1.652 0.716 181.00 ± 22.80 6.515 0.212 After 30 days 213.15 ± 42.08 174.49 ± 19.71 HDL-C (30 -70 mg/dL) Baseline 46.33 ± 12.11 1.489 0.429 48.42 ± 7.93 3.488 0.065* After 30 days 47.82 ± 10.23 51.91 ± 10.34 LDL-C (25 -160 mg/dL) Baseline 142.00 ± 40.230 0.364 0.942 115.25 ± 18.27 8.886 0.036** After 30 days 142.36 ± 38.76 106.36 ± 15.82 Triglyceride (0 -150 mg/dL) Baseline 115.83 ± 71.50 0.727 0.951 87.33 ± 34.60 5.894 0.381 After 30 days 115.11 ± 57.07 81.44 ± 34.87 Glucose (74 -100 mg/dL) Baseline 90.75 ± 4.58 0.867 0.619 87.42 ± 6.30 1.784 0.186 After 30 days 91.62 ± 5.80 89.20 ± 5.33 BUN (7.900 -20.200 mg/dL) Baseline 11.83 ± 4.35 0.059 0.965 10.48 ± 2.38 0.333 0.630 After 30 days 11.77 ± 2.09 10.81 ± 1.52 Serum creatinine (0.840 -1.240 mg/dL) Baseline 0.82 ± 0.10 0.039 0.055* 0.75 ± 0.17 0.005 0.743 After 30 days 0.86 ± 0.08 0.75 ± 0.15 AST/SGOT (0 -35 U/L) Baseline 20.00 ± 4.59 1.947 0.160 19.50 ± 9.04 1.720 0.082* After 30 days 18.05 ± 3.33 21.22 ± 10.01 ALT/SGPT (0 -45 U/L) Baseline 26.17 ± 12.55 4.936 0.033** 27.08 ± 17.98 3.231 0.201 After 30 days 21.23 ± 9.27 30.31 ± 23.03 ALP (30 -120 U/L) Baseline 61.412± 14.68 3.633 0.027** 72.17 ± 20.92 5.133 0.078* After 30 days 57.78 ± 12.14 67.03 ± 14.58
Table 5 The herbal coffee hematological biochemical profiles.
Table 6 The satisfaction of herbal coffee.
(The satisfaction of herbal coffee was assessed after 30 days by using questionnaire i.e., color, smell, taste, packaging and overall satisfaction with a satisfaction rating of 1-5, which the score 1 = very dissatisfied, 2 = dissatisfied, 3 = satisfied nor dissatisfied, 4 = satisfied and 5 = very satisfied.)
5.Acknowledgements
The authors would like to thank the Faculty of Pharmaceutical Sciences, Burapha University and Burapha University Hospital that have facilitation, cooperation and support in data collection for this research.
6. References
Ahn, J.H., Kim, E.S., Lee, C., Kim, S., Cho, S.H., Hwang, B.Y., & Lee, M.K. (2013). Chemical constituents from Nelumbo nucifera leaves and their anti-obesity effects. Bioorganic & medicinal chemistry letters, 23(12), 3604-3608.
Boozer, C.N., Nasser, J.A., Heymsfield, S.B., Wang, V., Chen, G., & Solomon, J.L. (2001). An herbal supplement containing Ma Huang-Guarana for weight loss: a randomized, double-blind trial. International Journal of Obesity, 25(3), 316-324.
Chong, P.W., Beah, Z.M., Grube, B., & Riede, L. (2014). IQP‐GC‐101 reduces body weight and body fat mass: a randomized, double‐blind, placebo‐controlled study. Phytotherapy Research, 28(10), 1520-1526.
Choi, B.K., Park, S.B., Lee, D.R., Lee, H.J., Jin, Y.Y., Yang, S.H., & Suh, J.W. (2016). Green coffee bean extract improves obesity by decreasing body fat in high-fat diet-induced obese mice. Asian Pacific journal of tropical medicine, 9(7), 635-643.
Cohen, J. (1988). Statistical power analysis for the behavioral sciences. Routledge. p384.
Cook, T.D. (2015). Quasi‐experimental design. Wiley encyclopedia of management, 1-2.
Dellalibera, O., Lemaire, B., & Lafay, S. (2006). Svetol, green coffee extract, induces weight loss and increases the lean to fat mass ratio in volunteers with overweight problem. Phytotherapie, 4(4), 194-197.
Dubey, L., Maskey, A., & Regmi, S. (2009). Bradycardia and severe hypotension caused by wild honey poisoning. Hellenic J Cardiol, 50(5), 426-428.
Gavrieli, A., Karfopoulou, E., Kardatou, E., Spyreli, E., Fragopoulou, E., Mantzoros, C.S., & Yannakoulia, M. (2013). Effect of different amounts of coffee on dietary intake and appetite of normal‐weight and overweight/obese individuals. Obesity, 21(6), 1127-1132.
Girdhar, S., Sharma, S., Chaudhary, A., Bansal, P., & Satija, M. (2016). An epidemiological study of overweight and obesity among women in an urban area of North India. Indian journal of community medicine: official publication of Indian Association of Preventive & Social Medicine, 41(2), 154.
Hasani-Ranjbar, S., Nayebi, N., Larijani, B., & Abdollahi, M. (2009). A systematic review of the efficacy and safety of herbal medicines used in the treatment of obesity. World journal of gastroenterology: WJG, 15(25), 3073.
Islam, D., Huque, A., Mohanta, L.C., Lipy, E.P., Rahman, M.N., Sultana, A., & Prodhan, U. K. (2017). Studies on the hypoglycemic and hypolipidemic effects of Nelumbo nucifera leaf in long-evans rats. Journal of Diabetes Mellitus, 7(3), 55-70.
Teerakulkittipong et al EC36 Page 157
Satisfaction Score (Mean ± SD) Mean Color 3.00 ± 1.00 Satisfied nor dissatisfied Smell 3.00 ± 0.87 Satisfied nor dissatisfied Taste 3.00 ± 1.04 Satisfied nor dissatisfied Packaging 3.00 ± 1.03 Satisfied nor dissatisfied Overall satisfaction 3.00 ± 0.95 Satisfied nor dissatisfied
Jitnarin, N., Kosulwat, V., Rojroongwasinkul, N., Boonpraderm, A., Haddock, C.K., & Poston, W.S.C. (2011). Prevalence of overweight and obesityin Thai population: results of the National Thai Food Consumption Survey. Eating and Weight Disorders, 16(4), e242-e249.
Lima, N.D.S., Numata, E.D.P., Mesquita, L.M.D.S., Dias, P.H., Vilegas, W., Gambero, A., & Ribeiro, M.L. (2017). Modulatory effects of guarana (Paullinia cupana) on adipogenesis. Nutrients, 9(6), 635.
Kim, J.H., Kim, O.K., Yoon, H.G., Park, J., You, Y., Kim, K., ... & Jun, W. (2016). Anti-obesity effect of extract from fermented Curcuma longa L. through regulation of adipogenesis and lipolysis pathway in high-fat diet-induced obese rats. Food & nutrition research, 60(1), 30428.
Mukherjee,P.K.,Mukherjee,D.,Maji,A.K.,Rai,S.,& Heinrich,M.(2009).Thesacredlotus(Nelumbo nucifera)–phytochemical and therapeutic profile. Journal of Pharmacy and Pharmacology, 61(4), 407-422.
Nazish, I., Ansari, S.H., Arora, P., & Ahmad, A. (2016). Antiobesity activity of Zingiber officinale Pharmacognosy Journal, 8(5).
Onakpoya,I., Terry, R.,&Ernst, E.(2010). The use ofgreencoffee extract as a weight loss supplement: a systematic review and meta-analysis of randomised clinical trials. Gastroenterology research and practice, 2011
Panuganti, K.K., Nguyen, M., Kshirsagar, R K., & Doerr, C. (2021). Obesity (Nursing). In StatPearls [Internet]. StatPearls Publishing.
Roshan, H., Nikpayam, O., Sedaghat, M., & Sohrab, G. (2018). Effects of green coffee extract supplementation on anthropometric indices, glycaemic control, blood pressure, lipid profile, insulin resistance and appetite in patients with the metabolic syndrome: a randomised clinical trial. British Journal of Nutrition, 119(3), 250-258.
Sengupta, K., Mishra, A.T., Rao, M.K., Sarma, K.V., Krishnaraju, A.V., & Trimurtulu, G. (2012). Efficacy and tolerability of a novel herbal formulation for weight management in obese subjects: a randomized double blind placebo controlled clinical study. Lipids in Health and Disease, 11(1), 1-10.
Sharma, B.R., Kim, M.S., & Rhyu, D.Y. (2016). Nelumbo Nucifera leaf extract attenuated pancreatic ß-cells toxicity induced by interleukin-1ß and interferon-γ, and increased insulin secrection of pancreaticß-cellsinstreptozotocin-induceddiabeticrats. Journal of Traditional Chinese Medicine, 36(1), 71-77.
Sloots, C.E., Felt-Bersma, R.J., West, R.L., & Kuipers, E.J. (2005). Stimulation of defecation: effects of coffee use and nicotine on rectal tone and visceral sensitivity. Scandinavian journal of gastroenterology, 40(7), 808-813.
Stern, J.S., Peerson, J., Mishra, A.T., Mathukumalli, V.S.R., & Konda, P.R. (2013). Efficacy and tolerability of an herbal formulation for weight management. Journal of Medicinal Food, 16(6), 529-537.
Sudwan, P., Saenphet, K., Saenphet, S., & Suwansirikul, S. (2006). Effect of Kaempferia parviflora Wall. ex. Baker on sexual activity of male rats and its toxicity. Southeast Asian journal of tropical medicine and public health, 37, 210.
Tanaka, K., Nishizono, S., Tamaru, S., Kondo, M., Shimoda, H., Tanaka, J., & Okada, T. (2009). Antiobesity and hypotriglyceridemic properties of coffee bean extract in SD rats. Food science and technology research, 15(2), 147-152.
Throsby, K. (2009). The war on obesity as a moral project: Weight loss drugs, obesity surgery and negotiating failure. Science as Culture, 18(2), 201-216.
Toda, K., Takeda, S., Hitoe, S., Nakamura, S., Matsuda, H., & Shimoda, H. (2016). Enhancement of energyproductionbyblackgingerextractcontainingpolymethoxyflavonoidsinmyocytesthrough improving glucose, lactic acid and lipid metabolism. Journal of natural medicines,70(2), 163-172.
Teerakulkittipong et al EC36 Page 158
Wu, K.L., Rayner, C.K., Chuah, S.K., Changchien, C.S., Lu, S.N., Chiu, Y.C., ... & Lee, C.M. (2008). Effects of ginger on gastric emptying and motility in healthy humans. European journal of gastroenterology & hepatology, 20(5), 436-440.
Yadav,K.D.,&Chaudhary,A.K.(2016).Anti-obesitymechanismof Curcuma longa L.:AnOverview. Indian Journal of Natural Products and Resources (IJNPR)[Formerly Natural Product Radiance (NPR)], 7(2), 99-106.
Yamauchi, T., Kamon, J., Minokoshi, Y. A., Ito, Y., Waki, H., Uchida, S., ... & Kadowaki, T. (2002). Adiponectin stimulates glucose utilization and fatty-acid oxidation by activating AMP-activated protein kinase. Nature medicine, 8(11), 1288-1295.
Yoshino, S., Awa, R., Miyake, Y., Fukuhara, I., Sato, H., Ashino, T., ... & Kuwahara, H. (2018). Daily intake of Kaempferia parviflora extract decreases abdominal fat in overweight and preobese subjects: a randomized, double-blind, placebo-controlled clinical study. Diabetes, Metabolic Syndrome and Obesity: Targets and Therapy, 11, 447.
Yoshino, S., Kim, M., Awa, R., Kuwahara, H., Kano, Y., & Kawada, T. (2014). Kaempferia parviflora extract increases energy consumption through activation of BAT in mice. Food science & nutrition, 2(6), 634-637.
Teerakulkittipong et al EC36 Page 159
Preparation of Tamarind Ready to Drink Powder by Spray Dried Technique
Benjabhorn Sethabouppha1, Sitanan Boonnak2, Thitaya Duangsuda2 , Kusuma Jitsaeng1, Thanapat Wisapol1, Sudarat Homhual1, Suttasinee Suwannakul1 , Thitidaj Leutrakul1, Wipawee Saohin1 and Oranuch Thanaketpaisarn1*
1Faculty of Pharmaceutical Sciences, Ubon Ratchathani University, Warinchamrab District, Ubon Ratchathani, 34190, Thailand
2 Pharmacy student, Faculty of Pharmaceutical Sciences, Ubon Ratchathani University, Warinchamrab District, Ubon Ratchathani, 34190, Thailand
*Corresponding author. E-mail: oranuch.t@ubu.ac.th
Abstract
Tamarind (Tamarindus indica L.) is a popular Thai fruit enriched with vitamin C. This study aimedtoproduceinstant powderoftamarindfor“readytodrink”product,suitablewithmodern life style. Maltodextrin (food grade, DE 10-12) was selected to use as a spray dried carrier in this study. Ripe tamarind mass was boiled and mixed with 3 different concentrations of maltodextrin (10, 20 and 30%W/V). Liquid mixtures were taken into spray dried process. Powder products from spray dried process were tested for the physicochemical, chemical and biological properties. The result revealed that all three products have yellowish color. The moisture content percentage of the products obtained from 3 maltodextrin concentrations range from 3.40 to 5.41. Total phenolic contents were determined by Follin ciocalteu method with gallic acid (GA) as a standard. The total phenolic contents of the products were between 0 421.08 mg GAE/g powder. The antioxidant activity was evaluated by ABTS method using vitamin C and Trolox as standards. The antioxidant capacity of the products expressed in VitaminCequivalentantioxidantcapacity(VCEAC)rangesfrom415.10to 670.75µgVCEAC /g powder. The antioxidant capacity expressed in Trolox equivalence antioxidant capacity (TEAC) ranged from 462.60 to 753.15 µg TEAC /g powder. Result from reconstitution time test shows that the three powder products are completely dissolved within 30-99 sec giving good taste solutions. It could be concluded that these three-prototype spray dried tamarind powders have good physicochemical characteristic, good taste and fast dissolved. The three products show antioxidant activity proved by detectable phenolic compound which are beneficial for our health.
Keywords: Powder for instant drink; Tamarind; Spray dried powder; Tamarindus indica L., Antioxidant
1. Introduction
Cost of nutritional supplement drink in Thailand market is now continuously growing. In 2021 the total market value was 9,654 million baht. In 2022, it is expected to grow by 5-7% to reach 10 billion baht as mention in Thairath money economy report (Techasiriprapa N.2022). People in 2020s pay more attention on their health. Hectic life style may result in high consumption of fast food and lack of nutrient in long term. “Ready to drink powder” for instant drink is one of product type that suitable for this need. Tamarind (Tamarindus indica L.) is a popular Thai fruit. Hundred grams of tamarind give 240 kcal. Apart from carbohydrates fats and proteins, tamarind contains vitaminA,B1,B2, B3,B5,B6, B9,choline, vitamin C,vitamin
IH37 Page 160
Proceeding of Cosmetic & Beauty International Conference 2022 Future of the Next Beauty (CBIC 2022) 7th-9th December 2022
E, vitamin K and several minerals such as calcium, copper, iron, magnesium, phosphorus, potassium, selenium, sodium and zinc (https://en.wikipedia.org/wiki/Tamarind). Tamarind is being used in many Thai dishes and also popular as freshly prepared refreshment drink. Thus, this study aimed to prepare tamarind spray dried powder for instant drink. The ratio of carrier used in spray dry process was studied. The physicochemical properties, chemicals content and bioactivity of final products were evaluated.
2. Materials and Methods
2.1 Materials
Fresh and fully ripened tamarind pods were procured from the local market (Thailand) and stored in refrigerator until needed for the experiment. Maltodextrin (food grade, DE 10-12) was used as a carrier agent. Folin ciocalteu (FC) and Gallic acid (Sigma) as reagent and standard for determine total phenolic contents and ABTS+ (2,2'-azino-bis (3-ethylbenzthiazoline-6-sulphonic acid)) and Ascorbic acid (vitamin C) as reagent and standard for radical scavenging assay were used in the experiment.
2.2 Sample Preparation and Spray Drying
After the outer hard shell and seeds of tamarind fruits were removed manually, tamarind fruits were soaked and boiled in water. The mixture was blended in a laboratory type blender and filtered to separate fiber and other residues. Tamarind and maltodextrin were mixed in the ratio 1:10, 1:20, 1:30 and spray dried at inlet air temperatures of 190 C. After drying, powders were recovered from the cyclone and cylindrical parts of dryer chamber and thenweighed to determine powder recovery, packed in polyethylene bags and stored in desiccator containing silica gel till further analysis. The powders were analyzed for color, particle size analysis, moisture content, flow ability, bulk and tapped density, dissolution time, pH, amount of total phenolic content and antioxidative activity.
2.3 Particle Morphology and Particle Size Analysis.
Particle morphology and particles size analysis was carried out by using light microscope with image analysis program. The particle size of powders was expressed as the average of particle diameter (n=200).
2.4 Moisture Content
The moisture content oftamarind pulp powderswas determined accordingto loss on drying(LOD) method in United States Pharmacopeia (USP). Tamarind spray dried powder was weighed before and after drying in hot air oven at 105 C for 2 h. The samples were analyzed and expressed as %Loss on drying in triplicate and the mean was recorded
2.5 Flowability
Flowability of tamarind pulp powders was measured by fixed funnel method. After tamarind spray dried powder 40 g passing funnel, the radius and height were measured and calculated as angle of repose. Flow ability was characterized using angle of repose data following powder flow USP. The samples were analyzed in triplicate and the mean was recorded
2.6 Bulk and Tapped Density
The bulk density was measured according to the method followed by USP. Accurately weighed 40 g of the powder was freely poured into a 100 mL graduated glass cylinder. The samples were then tapped by lifting and dropping the cylinder using digital tapped density apparatus 300 rpm for 2 min. The bulk and tapped density were calculated as ratio of mass of the powder to the volume occupied in the cylinder. The measurements were carried out in triplicate for all the powder samples. In addition, Hausner index was calculated and determined flow ability following <1174> powder flow USP. The samples were analyzed in triplicate and the mean was recorded.
2.7 Dissolution Test
One gram of the sample was weighed and placed in 50 mL of distilled water, followed by mixing using magnetic stirrer with temperature control at 8, 30 and 80 C. The time taken by powder sample
Sethabouppha et al. IH37 Page 161
to fully dissolved was recorded using an electronic timer. The samples were analyzed in triplicate and the mean was recorded
2.8 pH of reconstituted solution of tamarind spray dried powder
Tamarind spray dried powder 1 g in 50 mL of distilled water was mixed and determined pH using pH meter. The samples were analyzed in triplicate and the mean was recorded.
2.9 Determination of total phenolic contents (TPC)
Total phenolic contents (TPCs) of the spray dried products were determined by Folin ciocalteu (FC)’s method using gallic acid as a standard (Rahman N.F.A. et al , 2018). The gallic acid was dissolved in methanol and diluted to the concentrations ranged from 0.05 to 0.15 mg/ml. The folin ciocalteu (FC)’s reagent was diluted with distilled water to a 1/10 concentration. To 200 l of gallic acid solution,1500 l of the dilutedFC reagent was added. The mixturewas mixed by using vortexand let stand at room temperature for 5 minutes before adding 1500 l of 6% Sodium carbonate (Na2CO3) The reaction was mixed well and let stand at room temperature for 90 min. The absorbance was read against blank at 725 nm. The standard calibration curve of gallic acid was created (y=6.552x+0.0364, R2 = 0.9950).
The tamarind spray dried products were dissolved in distilled water to a concentrationof 0.1 g/ml. The TPCs of the sample solutions was determined as described in the standard gallic acid’s procedure. The experiments were performed in three replicates. The averaged TPC value were expressed in milligram gallic acid equivalent per g powder of the products (mgGAE/g powder).
2.10 ABTS+ - radical scavenging assay
Total antioxidant capacity of the tamarind spray dried products was investigated by ABTS+ (2,2'azino-bis (3-ethylbenzthiazoline-6-sulphonic acid)) radical scavenging assay using vitamin C and Trolox as a standardas previouslydescribedin ShahinuzzamanM. et al., 2020. The ABTS+ radicalwas prepared by mixing equal volumes of 7 mM ABTS with 2.45 mM potassium persulfate (K2S2O8) solution. The mixture was placed in the darkness at room temperature for 16 h. The ABTS+ radical solution was later diluted with distilled water and adjusted to the 0.7 0.02 absorbance at 734 nm. The standard vitamin C was dissolved in distilled water and diluted to the concentrations ranged from 60 to 160 µg/ml. The standard Trolox was dissolved in methanol and diluted to the concentrations ranged from 50 to175 µg/ml.The standardsolutionof0.1 ml was mixedwith3.9 mlof ABTS+ radicalsolution and kept in the darkness for 30 min. The absorbance was read at 734 nm against blank. The percentage of inhibition was calculated using the following equation.
%Inhibition = (Acontrol Asample)
Acontrol ×100
Where Acontrol = absorbance of ABTS+ radical solution
Asample = absorbance of the tested solution
The calibration curve was created from %Inhibition (Y) and concentrations (X) with linear correlation formula y = 0.5658x +1.7747, R2 = 0.9973.
The tamarind spraydried product was dissolvedin distilledwater to 0.2 g/ml concentrationand testedforantioxidantactivityfollowtheprocedureas describedinstandard vitaminC. The % inhibition of the spray dried product was calculated.The antioxidantcapacityof the productswas expressedin g vitamin C equivalent antioxidant capacity per g products (g VCEAC/ g) and g Trolox equivalence antioxidant capacity (TEAC) per g products (g TEAC/ g).
3. Results and discussion
3.1 Powder Recovery and particle size
Powder recovery of tamarind pulp powders produced from spray drying with different ratio of tamarind and maltodextrin is shown in Table 1 The maximum of powder recovery was shown in ratio 1:30 (19.845% powder yield). Powder recovery was increase in high content of maltodextrin. The
Sethabouppha et al. IH37 Page 162
obtained spray dried tamarind powder is irregular shape particle with light yellowish color and its particle size was around 35.89-75.97 m. It was also found that particle size and the more lightness of yellow color of spray dried powder was increased by the higher content of maltodextrin.
Table 1 Powder Recovery and particle size of spray dried tamarind powder
3.2 Powder characterization and Physicochemical Properties of spray dried powder
Spray dried tamarind pulp powders are characterized and presented in moisture content, bulk and tapped density and flow ability as shown in Table 2 It was found that the highest value of moisture content is 5.46% intheratio1:10 Themoisture content of thepowders is well below the maximal range of 5%, for spray dried products However, the moisture content of spray dried powder in the ratio 1:20 and 1:30 show 4.35% and 3.29% respectively. The obtained spray dried powder shows lower moisture content when using the higher content of maltodextrin. It was possible that the higher content of maltodextrin could deceasewater adsorption from the atmosphere. It has been reported about the ability of maltodextrin to forming a moisture-protective barrier after water absorption on the surface of hygroscopic particle. This function could improve the quality of dehydrate product (Phanindrakumar et al., 2005, Gabas et al., 2007, Tong et al., 2008).
The particle properties (density and flowability) are important for processing, packaging, storage, and shipping. Bulk and tapped density of the obtained spray dried powder are around 0.5-0.6 and 0.70.8 g/mL respectively. The large amounts of high density of the powder could be easier packed into smaller container. High temperature drying processes are achieved implying a lower shrinkage of the droplets, and so a lower density of the powder (Chegini G.R., Ghobadian B., 2005). It has been reported that increase in inlet air temperature also showed a significant negative effect on the powder bulk density (Khalid M., Pradyuman K., 2016). Maltodextrin may cause an increase in the volume of air trapped in the particles, corresponding to a decrease in the apparent density of the particles (Athanasia M.G., Konstantinos G.A., 2008). From the results of angle of repose and Hausner index, flow ability of spray dried tamarind powder is very poor following the scale of flow ability in USP. However, the flow ability of spray dried powder is greater in the ratio 1:30. The flow ability is better in the higher content of maltodextrin and lower moisture content.
3.3 Dissolution time and pH of reconstituted spray dried tamarind solution
The dissolution test of powder measures its reconstitution speed in water. The results (Table 3) showed that powder produced from the ratio 1:30 takes only 20-38 sec to fully reconstitute in water. All samples (the ratio 1:10, 1:20 and 1:30) showed the short period time to fully reconstituted in water at room temperature (30 C) around 30-99 sec. The higher temperature could decrease the dissolution timeofspraydriedtamarindpowder.Theshortendissolutionperiodtimemayberelatedtothemoisture content of the powders or solubility of spray dried powder produced from natural tamarind substance and maltodextrin. Quek et al. (2007) also reported a positive correlation between moisture content and dissolution for spray dried watermelon powders. After reconstitution of tamarind powder in distilled water, the pH value was determined. The lowest of pH solution was shown in the 1:10. It was possible that the higher content of tamarind extract affected to decrease pH and corresponding to greater sour
Sethabouppha et al. IH37 Page 163
Ratio Particle size (m) Powder Recovery (%Yield) 1:10 35.87 13.428 1:20 46.77 15.456 1:30 75.97 19.845
Ratio Angle of repose () Bulk density (g/mL) Tapped density (g/mL) Hausner ratio %LOD 1:10 97 0.50 0.73 1.45 5.46 1:20 63 0.57 0.81 1.39 4.35 1:30 60 0.57 0.79 1.37 3.29
Table 2 Powder characterization of spray dried tamarind powder
taste (Da Conceicao Neta E.R. et al., 2007) by organoleptic test of the reconstituted solution when comparing to 1:20 and 1:30 respectively.
Table 3 Dissolution time and pH of spray dried tamarind powder
3.4 Total phenolic content, antioxidative activity against ABTS+ radicals of spray dried tamarind powder
The total phenoliccontentsof the spray driedtamarindproductsranged from 0.42-1.08 mg GAE/g powder (Table 4). It was found that the products with lower percentage of carrier contained higher TPCs. The TPCs of the productswith 10, 20 and 30% w/v of maltodextrinwere 1.08, 0.78 and 0.42 mg GAE/g powder respectively. All the products exhibited antioxidant activity against ABTS+ radicals (compared with Trolox and Vitamin C) with the total antioxidant activity from 462.60 to 753.15 µg TEAC/g powder and 415.10 to 670.75 µg VCEAC /g powder. The product with lower percentage of carrier exhibited higher antioxidant capacity. The total antioxidant capacity of the products with 10, 20 and 30% w/v of maltodextrinwere 753.15, 633.11 and 462.60 µg VCEAC/g powder respectivelywhen compared with Trolox. The total antioxidant capacity of the products with 10, 20 and 30% w/v of maltodextrin were 670.75, 564.40 and 415.10 µg VCEAC/g powder respectively when compared with vitamin C. The antioxidant activity is highly correlated to the total phenolic contents of the products (R2 =0.9977-0.9980). The antioxidant activity of tamarind pulp has previously reported. The aqueous and alcohol extracts of ripe tamarind pulps showed DPPH radical scavenging activity and suppressing thiobarbituric acid reactive substances (TBARS) formation (Ugwuona F.U. and Onweluzo J.C., 2013). Aungkuldee W. et al., 2017 has reportedthe antioxidant activityof tamarindwater preparedin the ratio of 1:1to1:5 (w:w).Thelessdilutedtamarind-water at1:1showedthe highestABTS radicalscavenging activitywith highesttotal phenoliccontents(0.59 mg GAE/100 g of tamarind-water). Bhusari S.N. and Kumar P. (2014) described the antioxidantactivity of tamarind pulp spray dried powder using different carrier agents including maltodextrin (40, 50, 60%), gum Arabic (40, 50, 60%) and whey protein concentrate (10, 20, 30%). The TPCs of the products were ranged from 59.45-131.33 mg of GAE / 100g, which are lower than in our study. This could be resultedfrom dilutionfactorof the carrieragent.
Table 4 Total phenolic content, antioxidative activity against ABTS+ radicals of spray dried tamarind powder Ratio
(Vitamin C equivalent antioxidant capacity , µg VCEAC
4. Conclusion
It could be concluded that these three-prototype spray dried tamarind powders that we prepared have good physicochemical characteristic, good taste and fast dissolved. The three products show antioxidative activity proved by detectable phenolic compound which are beneficial for our health. The amount of maltodextrin used in preparation affect to moisture content, total phenolic compound and antioxidative property of products.
Sethabouppha et al. IH37 Page 164
Ratio pH Dissolution time (min:sec) 8°C 30°C 80°C 1:10 4.02 1:14 1:39 0:59 1:20 4.12 1:03 0:59 0:55 1:30 4.18 0:38 0:30 0:20
Total Phenolic content Antioxidative activity
ABTS
GAE/g
against
+ radicals mg
powder (Trolox equivalent antioxidant capacity, µg TEAC/g powder)
1:10 1.08 753.15 670.75 1:20 0.78 633.11 564.40 1:30 0.42 462.60 415.10
/g powder)
5. Acknowledgement
The authors would like to thank Faculty of Pharmaceutical sciences, Ubon Ratchathani University Thailand for providing research facilities and grant.
6. References
Athanasia, M.G., Konstantinos, G.A. (2008). Effect of Maltodextrin Addition during Spray DryingofTomatoPulpinDehumidifiedAir:II. PowderProperties. Drying Technology, 26, 726–737.
Aungkuldee, W., Riebroy Kim, S., Manochai, B., Komkhuntod, R and Oanya, A. (2017). Physicochemical and Antioxidant Properties of Different Tamarind-water Ratios and Its Application in Mousse. The 56th Kasetsart University Annual Conference. Bangkok, Thailand 6th-9th, February 2017.
Bhusari, S.N. and Kumar, P. (2014). Antioxidant Activities of Spray Dried Tamarind Pulp Powder as Affected by Carrier Type and their Addition Rate. International Conference on Food, Biological and Medical Sciences (FBMS-2014) Jan. 28-29, 2014 Bangkok (Thailand)
Chegini, G.R., Ghobadian, B. (2005). Effect of spray-drying conditions on physical properties of orange juice powder Drying Technology. 23(3), 657
668
Da Conceicao Neta E.R., Johanningsmeier S.D., Drake M.A., McFeeters R.F. (2007). A Chemical Basis for Sour Taste Perception of Acid Solutions and Fresh-Pack Dill Pickles. Journal of Food Science, 72(6), S352-9.
Gabas, A., Telis,V.,Sobral, P., Telis-Romero,J. (2007).Effect of maltodextrin and arabic gum in water vapor sorption thermodynamic properties of vacuum dried pineapple pulp powder. J. Food Eng., 82(2), 246-252.
Khalid, M., Pradyuman, K. (2016). Spray Drying of Tamarind Pulp: Effect of Process Parameters Using Protein as Carrier Agent. Journal of Food Processing and Preservation https://doi.org/10.1111/jfpp.12781
Mukherjee, S., Pawar, N., Kulkarni, O. et al. (2011). Evaluation of free-radical quenching properties of standard Ayurvedic formulation Vayasthapana Rasayana BMC Complement Altern Med 11, 38. https://doi.org/10.1186/1472-6882-11-38
Phanindrakumar, H., Radhakrishna, K., Mahesh, S., Jagannath, J., Bawa, A. (2005). Effect of pretreatments and additives on the thermal behavior and hygroscopicity of freeze-dried pineapple juice powder. J. Food Process. Preserv., 29(5–6), 307-318.
Quek, S Y , Chok, N K and Swedlund, P (2007) The physicochemical properties of spray dried watermelon powder. Chem. Eng. Process. 46, 386–392.
Rahman, N.F.A., et al. (2018). "Effects of drying methods on total phenolic contents and antioxidantcapacity ofthepomelo(Citrusgrandis (L.)Osbeck) peels." Innovative Food Science & Emerging Technologies 50: 217-225.
Shahinuzzaman, M., Yaakob, Z., Anuar, F.H. et al. (2020). In vitro antioxidant activity of Ficus carica L. latex from 18 different cultivars. Sci Rep 10, 10852
https://doi.org/10.1038/s41598-020-67765-1
Techasiriprapa N., Money Business Economy Thairath online 19 July 2022. https://plus.thairath.co.th/topic/money/101822
Sethabouppha et al. IH37 Page 165
–
Tong, H.H., Wong, S., Law, M.W., Chu, K.K., Chow, A.H. (2008). Anti-hygroscopic effect of dextrans in herbal formulations. Int. J. Pharm., 363(1), 99-105.
Ugwuona, F.U. and Onweluzo J.C. (2013). Assessment of Antioxidant Properties of Tamarind Fruit PulpanditsEffect onStorageStabilityofAfrican BreadFruit Seeddhaland Flour. Nigerian Food Journal, 31(2), 41-47.
Sethabouppha et al. IH37 Page 166
Possibility of wellness business after Covid-19 pandemic
Narunan Wuttisin*, Thanuttha Kumpolwatchara, YunJie Qiao and Panadda Watthana
School of Cosmetic Science, Mae Fah Luang University, Chiang Rai 57100, Thailand
*Corresponding author. E-mail: wnarunan@mfu.ac.th
Abstract
The objectives of this study were to survey the wellness services experience of Thai people and the marketing mix factors affecting respondents’ decisions on wellness services after the Covid-19 pandemic. The results obtained from this research might be used to develop the business model of wellness and is a guideline for entrepreneurs and interested people in the business of wellness after the outbreak of Covid-19 has ended. The questionnaire was created by using Google forms and distributed online from July 2021 to August 2021. There were 1,816 respondents who completed the questionnaire. Most respondents were women aged between 18-25 years. Most of the places to receive wellness services were beauty salons, beauty clinics, gym fitness, and spas. The purposes of receiving wellness services were to look more beautiful, handsome, attractive, and exemplary figures or lose weight. After the Covid19 pandemic, most respondents want to receive wellness services again, and the place certified by the Amazing Thailand Safety & Health Administration (SHA) is the first important factor that they were concerned about. The business should be provided with high-quality, professional performance, cleanliness, and hygiene. Moreover, the convenience of transportation and technology to support service is needed to be considered when setting up wellness services after Covid-19.
Keywords: Covid-19; Wellness; Wellness business; Wellness services experience; Wellness tourism
1. Introduction
Wellness is focusing on holistic and natural approaches, self-healing, and preventive care. The Global Wellness Institute defined wellness as “the active pursuit of activities, choices, and lifestyles that lead to a state of holistic health”. They further defined wellness tourism as “travel associated with the goal of maintaining or enhancing one’s personal well-being and includes the pursuit of physical, mental, spiritual or environmental ‘wellness’ while traveling for either leisure or business (Global Wellness Institute, 2018). Wellness tourism is included in illness prevention tourism, which is categorized into health services and fitness services. Wellness tourism has become a trend in the world community to achieve health and health prevention and gain self-satisfaction furthermore, respondents of wellnesstourism arenot limitedtoforeigntouristsbut havebecomealifestyle,especiallya consumer community urban in the country (Kaufmann, 2007). Wellness Tourism includes (1) Natural healing assets, (2) Indigenous healing traditions, (3) Medical services, (4) Nature, and (5) Spiritual traditions. Whereas those included in use existing assets are (1) Leisure and recreation spas, (2) Medical/ therapeutic hotel/ clinic spas, (3) Medical/ surgical clinics or hospitals, (4) Medical wellness centers or spas, (5) Holistic retreats, and (6) hotel and resort spas. At the global and regional levels wellness tourism is spread almost evenly in several regions such as Europe, America, and Asia (Widarini et al., 2020).
IH38 Page 167
of Cosmetic & Beauty International Conference 2022 Future of the Next Beauty (CBIC 2022) 7th-9th December 2022
Proceeding
Thailand’s main wellness tourism offers are based on spa resorts with the Tourism Authority of Thailand (TAT) promoting 41 spa and wellness resorts in the country. These resorts are especially known for offering traditional Thai massage, which is influenced by traditional medicine and is promoted by TAT for relieving physical and mental tension, as well as reducing migraines, sprains, bruises, anxiety, and improving flexibility (Wayne & Russell, 2020).
Covid-19 is a new pandemic that first erupted in December 2019 in China and spreading rapidly across the world through human-to-human transmission. Most countries all over the world are instituting short-term travel restrictions to stop the spread of infection which increases the concern caused by the Covid-19 pandemic onthetourism industry worldwide(Mertens et al., 2020). The United Nations reports that the recent circumstance of the tourism sector is very worse due to the pandemic. This crisis expanded in the world and the Covid-19 pandemic easily immobilized international tourists’ emotional stability (World Tourism Organization., 2020) The impact on the wellness tourism sector was not yet known, but since flights throughout the region have been severely curtailed, this sector and every other tourism sector have been negatively impacted. One can only hope that the virus will soon stop spreading; that a vaccine is discovered and distributed rapidly; and that the tourism industry, including wellness tourism, can resume its growth trajectory.
The objectives of this study were to survey the wellness services experience of respondents and the marketing mix factors affecting respondents’ decisions on wellness services after Covid-19. The results obtained from this research might be used to develop the business model of wellness and is a guideline for entrepreneurs and interested people in the business of wellness after the outbreak of Covid-19 has ended.
2. Materials and Methods
2.1 Respondents
The study population was composed of 1,816 respondents who lived in Thailand. The respondents were aged range between 18 to more than 65 years. The inclusion criteria consisted of respondents who agree to join this study by signing the consent questionnaire on Google forms, they use the internet, and can read Thai. The exclusion criteria consisted of people who did not agree to answer the questionnaire. This study was approved by Ethics in Human Research Committee of MFU (No. EC 21099-17).
2.2 Survey design
The questionnaire was created by Google forms (https://forms.gle/fBc4pguZnqsZWTYe9) and distributed the link online via many channels such as Facebook, Instagram, Twitter and e-mail from July 2021 to August 2021. The questionnaire was divided into 3 parts consisting of
Part 1: Personal information such as gender, age, marital status, education, career, and monthly income.
Part 2: Wellness service experiences such as the place to receive wellness services, frequency of receiving wellness services, wellness programs that respondents have been receiving, purposes of choosing wellness services, prices for wellness programs per time, and period of time the respondents receive the wellness service. The confidence level of respondents to receive wellness services; before Covid-19, during Covid-19, and after Covid-19 such as the desire to receive wellness services, feeling safe about receiving the services, and the burden of receiving services.
TheconfidencelevelofrespondentstoreceivewellnessserviceswascalculatedusingtheFivePoint Likert scale. Criteria for interpretation of the importance level were divided into 5 levels as follows: 4.21-5.00 (Very High), 3.41-4.20 (High), 2.61-3.40 (Medium), 1.81-2.60 (Low), and 1.00-1.80 (Very Low).
Part 3: The marketing mix factors affecting respondents’ decision on wellness services after Covid19 including the 7Ps marketing mix consisting of product, price, place, promotion, people, process, and physical evidence.
Themarketingmixfactorsaffectingrespondents’decisiononwellnessservicesafterCovid-19were calculated using the Five Point Likert scale. Criteria for interpretation of the importance level were divided into 5 levels as follows: 4.21-5.00 (Very High), 3.41-4.20 (High), 2.61-3.40 (Medium), 1.812.60 (Low), and 1.00-1.80 (Very Low).
Wuttisin et al. IH38 Page 168
2.3 Data analysis
Descriptive statistics were used to describe demographic characteristics and wellness services experience. The results were presented as a frequency, percentage, and Mean ± S.D.
3.Results and Discussion
3.1 Demographic characteristics
The demographic characteristics of the respondents were presented in Table 1. There were 1816 respondents who responded to the online questionnaire. About half of them were women (54.79%). Most respondents aged between 18 to 25 years (57.60%). Most occupations of the respondents were students (55.62%) and most of them are Bachelor's degrees (76.60%). The rate income of respondents was less than 18,000 Baht (40.14%).
3.2 Wellness services experience
The experience of the respondents in receiving wellness services was collected. The result is shown in Table 2. The vast majority of respondents had received health services (95.81%) and just the least of the respondents have never been receiving the service (4.19%). Beauty salons (79.25%), beauty clinics (69.77%),gym/fitness(67.59%),andspas(58.85%)werethemost popularlocationstoreceivewellness
Wuttisin et al. IH38 Page 169
Characteristics Frequency Percentage (%) Gender Female 995 54.79 Male 741 40.80 Other 80 4.41 Age (years old) 18-25 1046 57.60 26-33 310 17.07 34-41 279 15.36 42-49 77 4.24 50-57 46 2.53 58-65 39 2.15 More than 65 19 1.05 Marital status Married 417 22 96 Divorced/separated/widowed 234 12.89 Single / never married 1165 64.15 Education Below high school 77 4.24 High school 18 0.99 Bachelor's degree 1391 76.60 Higher than bachelor's degree 330 18.17 Occupation Student 1010 55.62 Private company employees 338 18.61 Civil servant/state enterprise employee 219 12.06 Business owner/personal business 162 8.92 Others 87 4.79 Income (monthly) <18,000 baht 729 40.14 18,001-25,000 baht 603 33.21 25,001-32,000 baht 73 4.02 32,001-39,000 baht 133 7.32 >39,000 baht 278 15.31
Table 1 The general information of respondents (N=1816)
services. More than half of them visited their wellness services between one and two times a month (71.95%). The most popular programs were beauty services in clinics (74.14%), and beauty services in salons (72.82%). More thanhalf of them wanted toimprove their appearance(79.37%), and lose weight (70.80%).Becausepeopletendtomakefavorablecomparisonstotheirownpastselves(Wilson& Ross, 2000), thus they want to be better than before.
Wuttisin et al. IH38 Page 170
Respondent behavior Frequency Percentage (%) Wellness services experience Ever 1740 95.81 Never 76 4.19 A place to receivewellnessservice (>1 answer) Beauty salon 1379 79.25 Beauty clinic 1214 69.77 Gym/Fitness 1176 67.59 Spa 1024 58.85 Wellness center 627 36.03 Hotel/resorts 416 23.91 Hospital 338 19.43 Frequency of receiving wellness services 1 - 2 times per month 1252 71.95 3 - 6 times per month 422 24.25 More than 6 months at a time 66 3.80 Wellness programs that respondents have been serving (>1 answer) Beauty services in clinic 1290 74.14 Beauty services in salon 1267 72.82 Massage in spa 820 47.13 Facial treatment 738 42.41 Body treatment 683 39.25 Exercise and diet 682 39.20 Aromatherapy 574 32.99 Weight loss or weight control 194 11.15 Herbal healing 178 10.23 Acupuncture 175 10.06 Yoga 97 5.57 Ayurveda 64 3.68 Music therapy 59 3.39 Art therapy 46 2.64 Meditation retreat 34 1.95 Other 2 0.11 The purpose of choosing a wellness program (>1 answer) Improve appearance 1381 79.37 Lose weight 1232 70.80 Healthy 667 38.33 Improve self-confidence 660 37.93 Relaxation 596 34.25 Anti-aging 385 22.13 Prevent disease 198 11.38 Balanced body 194 11.15 Elimination of toxins 176 10.11 Try something new 81 4.66
Table 2 Wellness services experience
Table 2 Wellness services experience (Cont.)
3.3 The confidence level of respondents in receiving wellness service
The confidence level of respondents in receiving wellness service is presented in Table 3. The survey found that during the Covid-19 pandemic, the respondents felt safe about receiving the service at a very low score level (1.28±0.58) and also desire to receive wellness service at a very low score level (1.54±0.73) while theburden of receiving service was at a very high score level (4.27±1.04). After the pandemic ended, the respondents' desire to receive wellness services at a high level (3.45±0.90) same as before the Covid-19 pandemic (3.87±0.96). The pandemic of Covid-19 had an effect on decision-making in wellness services at a very high level. In comparison, most respondents have a very low confidence level in the safety of going out to do activities during Covid-19. Respondents are concerned about the impact of coronavirus on health services and socio-economic infrastructures, personal safety, and the likelihood of voluntary self-isolation. Personal safety concerns were highest in those with negative illness attitudes and higher fight-flight freeze system (FFFS, reflecting fear/avoidance) scores (Bacon & Corr, 2020). Before Covid-19 and after Covid-19 pandemic, the respondents desired to receive wellness services at a high level. The wellness program is important in promoting people's concern about their health status, the possibility of sickness, and tailored treatment fortheirhealth(Abdullaha& Lee,2012).So,beforeandafter theCovid-19pandemic,most respondents still want to receive wellness services.
Table 3 The confidence level of respondents in receiving wellness service
3.4 The marketing mix factors affecting respondents’ decision on wellness services after the Covid-19 pandemic
The result of factors affecting respondents’ decision on wellness services after Covid-19 pandemic was shown in Table 4. The wellness business which is certified by the Amazing Thailand Safety & Health Administration (SHA) certificate is the first important factor that they were concerned about (4.39±0.92). The business should be provided with high-quality (4.29±0.89), high-technology (4.22±0.92), and professional practitioners (4.26±0.92). The place should be clean (4.23±0.99), equipped with hygiene tools (4.22±0.96), and convenient for public transport (4.22±0.94). SHA certificate is the most factor that customers choose. SHA is a certificate that represents tourism industry entrepreneurs' readiness in improving their products, services, and sanitation measures which is the crucial factor in preventing the spread of Covid-19 by complying with the sanitation measures, which in turn can build trust and confidence in customers and service recipients of such products and service
Wuttisin et al. IH38 Page 171
Respondent behavior Frequency Percentage (%) Price of wellness service <1,000 Baht 255 14.66 1,001 - 2,000 Baht 513 29.48 2,001 - 3,000 Baht 420 24.14 3,001 - 4,000 Baht 197 11.32 4,001 - 5,000 Baht 160 9.20 >5,000 Baht 195 11.21 Frequency of receiving wellness service 08.00 - 16.00 871 50.06 16.01 - 22.00 869 49.94
Decision factors Before Covid-19 During Covid-19 After Covid-19 Mean ± S.D. Importan ce levels Mean ± S.D. Importanc e levels Mean ± S.D. Importan ce levels Desire to receive wellness service 3.87±0.96 High 1.54±0.73 Very low 3.45±0.90 High Feeling safe about receiving the service 3.06±0.71 Medium 1.28±0.58 Very low 2.91±0.55 Medium Burden of receiving service 2.51±1.08 Low 4.27±1.04 Very high 3.48±0.70 High
(Tourism Authority of Thailand, 2020). High quality is also at a very high level. Product quality is the main important factor when purchasing a product that matches the consumer's intention. For example, in the Malaysianmarket, they intendto buy a product whichrecognizes as a high-brandname with good quality (Fernandopulle, 2020).The two factors with very high-level performance were professional and provided good advice. The professional showed interest in the service, the professional was polite, the service was adequate, and the professional, devoted full attention during the performance of the service.
It can then be expected thatthe customer's trust in the professional and excellent service with dedication and respect are the requirements for customer loyalty in the establishment (Guedes & Silva, 2019). Most respondents emphasized the cleanliness and hygiene of the place and tools at a very high level. The hygienic conditions of the service environment and tools are also the top priority. Frequent and correct hand hygiene is one of the most important measures to prevent infection with Covid-19. Convenience to transportation takes the highest beta value in relation to customer satisfaction (Getachew, 2019). So, convenience factors were very important influential factors in the decision to serve. Moreover, most respondents are also interested in technology to support services. Technology became essential during the Covid-19 pandemic. During a time of isolation and social distancing, the world relied on technology to learn, live, and stay connected. Technology is best used to leverage and maintain social, physical, emotional, intellectual, and spiritual well-being (Goldschmidt, 2020).
Table 4 The marketing mix factors affecting respondents’ decision on wellness services after the COVID-19 pandemic.
Wuttisin et al. IH38 Page 172
Factors Mean ± S.D. Importance levels Products and service High quality 4.29±0.89 Very High Technology to support service 4.22±0.92 Very High Use famous products (Brand) 3.66±0.94 High Famous places 3.63±0.95 High Continuous improvement of service 3.57±0.89 High Wide range of services 3.39±0.90 Medium Price Cheaper more than other places 3.93±0.99 High Suitable to service 3.78±0.97 High Place Convenient for public transport 4.22±0.94 Very High Shuttle service for customers 3.53±0.97 High Promotion Giving a discount on special days 3.71±0.87 High Communication channel (Application) 3.63±0.93 High Marketing activities 3.43±0.87 High People Professional 4.26±0.92 Very High Provide good advice 4.24±0.90 Very High Specialist services 4.14±1.04 High Polite 3.72±0.87 High Physical environment (Physical evidence) Cleanliness and hygiene 4.23±0.99 Very High Hygiene tools 4.22±0.96 Very High Safety 3.50±0.92 High Adequacy of facilities 3.50±0.84 High Process SHA certificate 4.39±0.92 Very High The service process is clean and safe 4.23±0.98 Very High Develop the service process 3.60±0.84 High Easily to contacted 3.59±0.92 High The service process is timely 3.59±0.89 High Notify every step of the service 3.53±0.93 High
4.Conclusion
Most people receive wellness services for improving their appearance and lose weight. After the Covid-19 pandemic,most ofthem want toreceivewellnessservicesagain. The wellness business which is certified by the Amazing Thailand Safety & Health Administration (SHA) certificate is the first important factor that they were concerned about. The business should be provided with high-quality, high-technology, and professional practitioners. The place should be clean, equipped with hygiene tools, and convenient for public transport.
5.Acknowledgements
The authors would like to thank all respondents who attended this study and answered the questionnaire.
6.References
Abdullaha, D. N., & Lee, O. Y. (2012). Effects of wellness programs on job satisfaction, Stress and absenteeism betweentwo groups of employees(Attended and Not Attended). Procedia - Social and Behavioral Sciences, 65, 479 – 484.
Bacon, A. M., & Corr, P. J. (2020). Coronavirus (Covid-19) in the United Kingdom: A personalitybased perspective on concerns and intention to self-isolate. British Journal of Health Psychology, 25, 839–848.
Fernandopulle, S. (2020). The impact of the covid-19 pandemic on the European cosmetics industry and how its influence with environmental protection problems which effects to brand loyalty. (Thesis, University of Bedfordshire).
Getachew, G. (2019). The impact of transportation service quality on customer satisfaction: Evidence from Amhara Region, Ethiopia. International Journal of Health Economics and Policy, 4(2), 49-57.
Global Wellness Institute. (2018). Global Wellness Economy Monitor Global Wellness Institute, Florida.
Goldschmidt, K. (2020). The Covid-19 Pandemic: Technology use to support the wellbeing. Journal of Pediatric Nursing, 53, 88-90.
Guedes, K. C., & Silva, D. G. (2019). How to evaluate the services of a small beauty salon in Manaus? International Journal for Innovation Education and Research, 7(11), 1535-1553.
Mertens, G., Gerritsen, L., Duijndam, S., Salemink, E., & Engelhard, I. M. (2020). Fear of the coronavirus (COVID-19): Predictors in an online study conducted in March 2020. Journal of Anxiety Disorders, 74.
Kaufmann, M. (2007). Wellness Tourism: Market analysis of a special health tourism segment and implications for the hotel industry. Research Institute for Leisure and Tourism, University of Berne, Engehaldenstrasse 4, CH-3012 Bern, Switzerland
Saglik, E., Gulluce, A. C., Kaya, U., & Ozhan, Ç. K. (2014). Service quality and customer satisfaction relationship: A Research in Erzurum Ataturk University Refectory. American International Journal of Contemporary Research, 4(1), 101-114.
Thongpan, N., & Yu, F. C. (2015). Asia leads the world in spas and other services aimed at helping people lead more relaxing and enjoyable lives, 1-2. Retrieved August 3, 2015, from https://www.bangkokpost.com/business/641800/world-of-wellness.
Wayne, S., & Russell, E. (2020). Asian development outlook 2020 update: Wellness in worrying time. Analysis of the Global and Asian Wellness Tourism Sector, 43.
Widarini, P.S.I., Wijaya, M. & Naini, A.M.I. (2020). Wellness tourism opportunities amid Covid-19 pandemic: Literature study. 4th International Conference of Social Science and Education (ICSSED) 2020, 402-412.
https://doi.org/10.2478/9788366675186-051
Wuttisin et al. IH38 Page 173
Wilson, A. E., & Ross, M. (2000). The frequency of temporal-self and social comparisons in people's personal appraisals. Journal of Personality and Social Psychology, 78(5), 928-942.
World Tourism Organization. (2020). Tourism and coronavirus disease (COVID-19). World Tourism Organization, Madrid.
Wuttisin et al. IH38 Page 174
*********************
Analysis of influencing factors on the decision of Thai customers to use beauty clinics
Khanittha Chamnikhetkan1, Naiyana Suksakunnee1 and Tinnakorn Theansungnoen1,2*
*Corresponding author. E-mail: tinnakorn.the@mfu.ac.th
Abstract
Beauty and good looks are known as one of the most praised values among beauty customers. Beauty clinics are likely to promote the success of attractive looks. At the present, customer habits have changed especially the habits of Thai customers. This research aimed to investigate influencing factors that affect the consumer selection to use beauty clinics. The questionnaire was involved with demographic factors of customers including gender, age, occupation, and relationship. The customer behaviors in using the beauty clinic and the seven different marketing factors including product, price, place, promotion, people, process, and physical evidence were also included in the survey for investigation of influencing factors on the customer decision. The questionnaire was delivered via an online survey to Thai customers who have ever used the beauty clinic services (n=402) during February-May 2020. Data from the online survey were analyzed by different statistical programs. The demographic data showed that the percentage of female and male customers responded to the questionnaire were 78.9% and 21.1% while that of the customers’ ages of 25-29 and 20-24 years old were 45.5% and 39.6%, respectively. Among the services in the beauty clinic, the special care of acne, scar, and freckles (41%) as well as common skin treatment (26%) were high required by the customers. The influencing factors of the customer decision to use the skincare beauty clinic were investigated. The results showed that the influencing factors ranking from high to low were personnel or staff, product, and procedures (P<0.05). The decision of customers to use the skincare beauty clinic did not differentiate between age and occupation factors. As different gender was a significant factor, female customers had a higher rate of the decision to use beauty clinic services than male customers (P<0.05).
Keywords: Beauty clinics; Customer decision; Customer decision; Marketing factors
1.Introduction
Beauties and good looks are known as one of the most praised values amongst consumers in current Thai society and will be continuing to increase their impact in the upcoming future. In the past, people who were interested in beauty and good looks were often middle-aged women. The women had high purchasing power because they had to use their appearances for their occupations (Thongplean et al., 2012). Nowadays, the trend of beauty and good looks has increased among young adults, university students, and even men. Social business interactions require individuals to have presentable-looking faces and skin and to increase confidence and solid personality through their appearances. Moreover, Thai society is widely open to new innovations from foreign countries, especially Korean cultures which made them aware through popular artists who used the image of the beauty of their looks and skin as the selling point.
BT40 Page 175 Proceeding of Cosmetic & Beauty International Conference 2022 Future of the Next Beauty (CBIC 2022) 7th-9th December 2022
1School of Cosmetic Science, Mae Fah Luang University, Chiang Rai 57100, Thailand
2Green Cosmetic Technology Research Group, School of Cosmetic Science, Mae Fah Luang University, Chiang Rai 57100, Thailand
Consumer habits have changed at present, especially the habits of young consumers. These customers who have ages between fifteen years and over have increasingly used the services of beauty clinics (Fugate et al., 2008) The facial treatment of young customers includes acne treatment while in adults the treatments were for wrinkles, blemishes, and black spots. Thus, having a clear, smooth face is in high demand among today's consumers.
Recently, many beauty clinics have provided many services in Bangkok and other provinces in order to spread to various levels of consumer groups widely. Consumers also have a high chance to receive beauty services easily and get more choices that they prefer. Thus, in order to succeed in beauty clinic services, businesses must have various competitive strategies whether it is developing their productsor services.Thereasonleadstotheadvancement ofmodernmedical technologyincludingnew innovations in skin care and helping to solve various skin problems such as wrinkles, scars, acne, and freckles. The technology combines with the experience and expertise of qualified medical personnel. Expandingthefranchisetomakethe services moreconvenient and alsodifferent inmarketing strategies to attract the interest of consumers such as advertising (Lovelock & Wright, 2002). These concepts result in the business being able to retain sustainable growth.
Therefore, the study aimed to study the different factors that affect customers’ decisions to use beauty clinics. The questionnaire including the demographic characteristics and marketing mix factors was used to evaluate the customers’ decisions via the online survey. This approach comes with the hope that the information will be useful to be applied as a guideline to improve the services of the beauty clinics in order to be able to respond to the customers' needs appropriately and efficiently.
2.Materials and Methods
2.1 Sample population
The sample population of this research were consumers who ever used the skincare beauty clinic services throughout the country by using Google Docs Form via social networks.
2.2
Determination of sample size
Since the researchers could be not aware of the exact population that uses the skincare beauty clinic services throughout the whole country. The researchers decided to use the formula calculating the sample size used to estimate the proportion of the population by specifying the highest variance level which is p = 0.5 and q = 0.5 by accepting the margin error of 5% at a 95% confidence level and the Cochran formula to estimate the sample (Cochran, 1963) therefore:
n =
by
n = sample size
z = confidence level
p = the likelihood of an event or the proportion of the population of the characteristics of interest in the sample (p)
q = chance of an event not happening equal to 1 - p in the case of the sample
e = sampling tolerances
Substitute
n = = 384.16
According to the above sample size calculation the population equaled to 385 people. Nonetheless, researchers specified the sample size in this research increase by 4% from the total sample size which was calculated at 400 people increase from 385 in order to prevent mistakes from incorrectly answered questionnaires by using purposive sampling which is the group of people who use beauty clinics.
2.3 Factors used in the research
2.3.1 Marketing mix factors (7P’s)
The marketing mix factors (7P’s) included (1) Product, (2) Price, (3) Place, (4) Promotion, (5) People or Employee, (6) Process and (7) Physical Evidence (Leelavorapong et al., 2019).
Chamnikhetkan et al. BT40 Page 176
Z2pq E2 (1.96)2(0.5)(1-0.5) (0.5)2
2.3.2 Demographic factors
The demographic factors in this work were (1) Gender, (2) Age, and (3) Occupation.
2.3.3 Following variables
This was the decision to use the skincare beauty clinic.
2.4 Research procedure
This research was quantitative research that uses a questionnaire as a tool to collect data. The questionnaire was divided into three parts which are:
Part 1: Preliminary screening questions of the respondents. The questions were about their general behavior in using skincare beauty clinic services.
Part 2: Questions regarding marketing mix and the level of the consumers' decision on using skincarebeautyclinics.Intheevaluation,theRatingScaletool whichhasthecriteria for determining the weight of the assessment into 5 levels according to the Likert Scale method as follows:
For the interpretation criteria for rating the average score, the researchers applied the concept of the average interpretation using the formula for finding the width of the inter-spacing is as follows
4.21-5.00 means most consumers agree/use the service.
3.41-4.20 means that consumers agree with it / may use the service.
2.61-3.40 means that consumers agree moderate/uncertain.
1.81-2.60 means that consumers agree little / may not use the service.
1.00-1.80 means that consumers agree the least / definitely do not use the service.
Part 3: Demographic information of the respondents. This comes questionnaire form of a checklist.
Therefore, the validity and reliability of the questionnaire were corrected by checking the legitimacy of the statements and complete coverage.
2.4.1 Data collection
Data in the research were collected by using questionnaires from 400 people. In this case, the questionnaires were handled through the survey by Google Docs Form via Social Network.
2.4.2 Data analysis
After collecting all the survey answers, the data were analyzed through statistical methods as the following programs.
1) Descriptive statistics
The statistics were used for explaining the data and the nature of the data collected from the sample or population by presenting in the form of a frequency distribution table regarding percentage, ratio, average, standard deviation, and various charts.
Chamnikhetkan et al. BT40 Page 177
Level Rating Level
High 5
Comments
Very
points High 4 points Moderate 3 points Low 2 points Very Low 1 point
������ℎ������������������ ������������������������ ���������������������������� = 5 1 5 =0.80
2) Inferential statistics
The data were analyzed by using the program for statistical prefabrication to perform hypothesis testing in order to refer to all the data by using the following results analysis tools.
3) Factor analysis
The variables in each factor were evaluated in groups. These included product factors, price factors, distribution channel factors, marketing promotion factors, personnel or staff factors, process factors, and physical environmental factors.
4) Regression
This was used to study the relationship between the results from the factors being analyzed and the decision to use the beauty clinic services of the sample group
5)
Chi-square
This was used to test if the demographic factor such as differences in gender, age and occupation had any effects on the decision to use the beauty clinic services of the samples, whether if it was differentiating or not.
3.Result and Discussion
3.1 Demographic characteristics
The demographic data of respondents (n=402) were collected and shown in Table 1. The result in Table 1 gender of respondents showed that 317 females (78.9%) responded to the questionnaire while males took the questionnaire 85 (21.1%). The age of respondents showed that the large groups of customers to use beauty clinic services had the ages 25-29 years old (45.5%) and 20-24 years old (39.6%). Occupation of respondents showed that the student (49.5%) and company employees (28.1%) were the most occupations to use beauty clinic services. Therefore, the result of the survey, female customers usually used the beauty clinic services more than males, and the target group that used the most services was 25-29 years old.
3.2 General behavioral data in using the skincare beauty clinic service of a sample group
The general behavioral data were collected and shown in Table 2. Information about general behaviors in usingbeauty clinics ofthesamples in this research consists of beauty clinicsthat were used most often, frequency of the uses of the beauty clinic services, frequency of the expenses every time
Table 1 Demographic characteristics of participants (n=402)
Chamnikhetkan et al. BT40 Page 178
Characteristics Frequency (N) Percent (%) Gender Male 85 21.1 Female 317 78.9 Age of respondents 15-19 29 7.2 20-24 159 39.6 25-29 183 45.5 30-39 21 5.2 40 up 10 2.5 Occupation of respondents Government / State Enterprises 31 7.7 Company employee 113 28.1 Employee 13 3.2 Self-Employed 46 11.4 Student 199 49.5
they use the beauty clinic services, and individuals who had the most influence on the decision to use the skincare clinic services, could be seen as follows.
The top three clinics that were most used by the respondents consisted of Wuttisakcosmeticswith 32%, followed by Nitipon clinic with 18 percent, and Ratchathewi clinic with 18%. Most of the respondents chose to take care of acne, scars, and freckles which was 41%, followed by skincare treatment at 26%, and skin laser which was 14% Most of the respondents used the skincare beauty clinic 1-2 times per month 42%, followed by less than 1 time per month which was 34%, and 3-4 times per month which was 19%. The expense frequencies of the respondents when they used the skincare clinicservicesof the top three respondentswas 500-1000 baht which was 35%, followedby 1001-2000 baht which was 34%, and 2001-3000 baht which was 16% Individuals who had the most influence on the respondents’ decision to use the skincare clinic services top 3 were themselves which was 43%, followed by their friends which was 30%, and their family which was 16% From the previous study, Kuphadist & Yenyuak, 2020 studied about consumer behavior marketing mix factors affecting and the needs of consumers using beauty clinic services in Bangkok. The results of the study were found that among beauty program services, the most popular program was the injection program and the most frequently used clinic was Nitipon Clinic (Kuphadist & Yenyuak, 2020).
Table 2 General behavior in using the skincare beauty clinic (n=402).
Chamnikhetkan et al. BT40 Page 179
General behavior Frequency (N) Percent (%) Skincare clinic Wuttisak cosmetics 128 32 Nitipon clinic 73 18 Ratchathewi clinic 73 18 Pan clinic 49 12 Medicare clinic 34 8 Romrawin clinic 24 6 Etc. 21 6 Skincare service Take care of acne, scar, and freckles 165 41 Skin treatment 106 26 Skin laser 57 14 Remove birthmark 39 10 Botox 34 8 Vitamin 1 1 Frequencies of using skincare beauty clinics 1-2 time per month 169 42 Less than 1 time per month 175 34 3-4 time per month 15 19 5-6 time per month 78 4 More than 6 times per month 5 1 Expenses value 500-1000 Bath 140 35 1001-2000 Bath 136 34 2001-3000 Bath 63 16 3001-4000 Bath 26 7 Less than 500 Bath 25 6 More than 4001 Bath 12 3 Influencer Themselves 180 43 Friends 117 30 Family 63 16 Famous People 33 8 Doctor 10 3
The average score, opinion level per measure of independent variable which has influenced the decision to use the beauty clinic of the sample and variable based on data obtained from complete questionnaires that influence the decision to use the beauty clinic service is shown in Table 3.
From Table 3, it was found that the top five individuals factors that the respondents agreed on the most ranged from highest to lowest results in the equipment and tools used were safe and hit the standards (Avg 4.43), the technology used for services was up to date (Avg 4.41), the products and
Table 3 Average score and standard deviation on different factors (N=402).
Chamnikhetkan et al. BT40 Page 180
Factors Average SD Yield Product factors This clinic is famous and reliable 4.34 .74 Very high Variety of services 4.21 .78 High Equipment and tools used is safe and hit the standards 4.43 .65 Very high The technology used for services is up to date 4.41 .64 Very high Products and services have good quality 4.37 .65 Very high Price factors The price is aligning with quality of the service provided 4.30 .64 Very high Prices are similar to clinics at the same level 4.21 .68 High Able to pay the installments service fees appropriately Distribution channels 4.08 .72 High Convenient traveling to use the services 4.21 .73 High The number of branches of the clinic that is available 4.06 .82 High Location that is easy to find 4.09 .78 High Parking area Marketing factors 4.05 .76 High There are promotions, discounts, giveaway packages, and interesting marketing promotions such as giving a trial use. 4.04 .74 High Membership system/membership service 3.93 .78 High Have presenters that are famous and interesting. 3.75 .89 High Thorough advertisements such as TV, Internet, Booths, Public relations, etc. 3.79 .86 High Good suggestions and relations from employees in the clinic. 3.96 .79 High Notifying information such as new innovations letting customers aware always. 4.00 .72 High Personnel or Employee factors The staffs are courteous 4.37 .67 Very high Staffs are attentive 4.33 .68 High The number of employees is sufficient to provide the service. 4.30 .70 Very high Process factors Speed and accuracy of service 4.30 .66 Very high Ongoing service monitoring 4.23 .63 High The ability to provide services that suit customer need 4.21 .68 High Specify the price clearly 4.20 .73 High Physical environmental factors There are signs indicating various services, clear and easy to understand 3.96 .74 High There are enough seats while waiting for service. 3.94 .71 High There are various media to entertain while waiting for service. 3.85 .83 High
services had good quality (Avg 4.37), the staffs were courteous (Avg 4.37), and this clinic was famous and reliable (Avg 4.34).
Apart from this, when considering each of the main factors, the study results could be summarized as follows.
The product factors that the respondents agreed on the most were the equipment and tools used were safe and hit the standards (Avg 4.43) followed by the technology used for services being up to date (Avg 4.41).
The price factors that the respondents agreed on the most were the price aligning with the quality of the service provided (Avg 4.30: Totally agree) followed by prices similar to clinics at the same level (Avg 4.21).
The distribution channel factors that the respondents agreed on the most were convenient traveling to use the services (Avg 4.21) followed by the location that is easy to find (Avg 4.09).
The marketing factors that the respondents agreed on the most were promotions, discounts, giveawaypackages,andinterestingmarketingpromotionssuchasgivingatrialuse(Avg4.04)followed by notifying information such as new innovations and letting customers aware always (Avg 4.00).
The personnel or employee factors that the respondents agreed on the most was the staffs are courteous (Avg 4.37) followed by staff are attentive (Avg 4.33).
The process factors that the respondents agreed on the most were speed and accuracy of service (Avg 4.30) followed by ongoing service monitoring (Avg 4.23).
The physical environmental factors that the respondents agreed with the most were the property beingcleanandtidy (Avg 4.19)followedby theatmosphereandbeautiful placedecorations (Avg 4.14).
All kinds of factors were revealed to influence the consumer's choice in choosing a beauty clinic. Therefore, the effects of respondent gender on different factors were further evaluated. The results of the gender evaluation were shown in Table 4. The results of the chi-square test showed that all factors betweenmalesandfemaleswerestatisticallysignificant(p<0.05).Moreover,thesamefactorsincluding price, distribution channel, marketing, and process were dominated absolutely by females. From the previousstudy,behaviorsofteenagers(19-22yearsold) inMueangChiangMai Districtinusingservice of beauty clinic were investigated. The result was found that most of respondents were female or 70% and the remaining 30% was male (Suriyaprom, 2009)
Table 5 Showed the summary of the relationship between age and factors that influence the consumer's choice in choosing a beauty clinic. The results of the chi-square test showed that all groups were statistically significant (P<0.05). Factors as follows: the clinic is famous and reliable, and the price is aligned with the quality of the service provided, convenient traveling to use the services, the number of branches of the clinic that is available, the location that is easy to find, parking area, there are promotions, discounts, giveaway packages, and interesting marketing promotions such as giving a trial use, membership system/membership service, staffs are attentive, the ability to provide services that suit customer need, specify the price clearly, there are signs indicating various services, clear and easy to understand and there are various media to entertain while waiting for service.
Table 6 showed that the factors that influence the consumer's choice in choosing a beauty clinic included the clinic is famous and reliable, variety of services, the price is aligning with quality of the service provided, the number of branches of the clinic that is available, there are promotions, discounts, giveaway packages, and interesting marketing promotions such as giving a trial use, membership system/membership service, have presenters that are famous and interesting, thorough advertisement such as TV, internet, booths, public relations etc., good suggestions and relations from employees in the clinic, notifying information such as new innovations letting customers aware always, the staffs are courteous, the number of employees is sufficient to provide the service, speed and accuracy of service, ongoing service monitoring, specify the price clearly, there are signs indicating various services, clear andeasytounderstandandThereareenoughseatswhile waitingforservice.Thefactorshadsignificant differences among the occupation (P < 0.05).
Chamnikhetkan et al. BT40 Page 181
Factors
Chamnikhetkan et al. BT40 Page 182
Gender P-value Male (N=85) Female (N=317) Product factors This Clinic is famous and Reliable 4.18±0.74 4.27±0.74 .012* Variety of services 4.40±0.78 4.18±0.78 .079 Equipment and tools used is safe and hit the standards 4.34±0.65 4.46±0.65 .073 The technology used for services is up to date 4.34±0.64 4.43±0.64 .030* Products and services have good quality 4.41±0.65 4.38±0.65 .091 Price factors The price is aligning with the quality of the service provided 4.01±0.64 4.40±0.64 .000* Prices are similar to clinics at the same level 4.09±0.68 4.27±0.68 .001* Convenient traveling to use the services 4.06±0.72 4.12±0.72 .000* Distribution channels Parking area 3.42±0.73 4.44±0.73 .000* Convenient traveling to use the services 3.54±0.82 4.22±0.82 .000* The number of branches of the clinic that is available 3.43±0.78 4.30±0.78 .000* Location that is easy to find 3.53±0.76 4.22±0.76 .000* Marketing factors
are promotions, discounts,
promotions
giving a trial use 3.59±0.74 4.19±0.74 .000* Membership system/membership service 3.61±0.78 4.03±0.78 .000* Have presenters that are famous and interesting. 3.63±0.89 3.81±0.89 .000* Thorough advertisement such as TV, Internet, Booths, Public relations, etc. 3.67±0.86 3.84±0.86 .000* Good suggestions and relations from employees in the clinic. 3.61±0.79 4.07±0.79 .000* Notifying information such as new innovations letting customers aware always. 3.67±0.72 4.11±0.72 .000* Personnel or Employee factors The staffs are courteous 4.26±0.67 4.42±0.67 .000* Process factors Speed and accuracy of service 3.89±0.66 4.44±0.66 .000* Ongoing service monitoring 4.00±0.63 4.31±0.63 .000* The ability to provide services that suit customer needs 3.94±0.68 4.31±0.68 .000* Specify the price clearly 4.18±0.73 4.26±0.73 .000*
environmental factors There are signs indicating various services, clear and easy to understand 3.41±0.74 4.42±0.74 .000* There are enough seats while waiting for service. 3.52±0.71 4.34±0.71 .000* There are various media to entertain while waiting for service 4.43±0.83 3.99±0.83 .000*
Table 4 Gender evaluation on different factors in using skincare beauty clinic (N=402).
There
giveaway packages, and interesting marketing
such as
Physical
Marketing factors
There are promotions, discounts, giveaway packages, and interesting marketing promotions such as giving a trial use.
Chamnikhetkan et al. BT40 Page 183
Factors Age P-value 15-19 (N=29) 20-24 (N=159) 25-29 (N=183) 30-39 (N=21) 40+ (N=10) Product factors This clinic is famous and reliable 4.24±0.74 4.25±0.74 4.45±0.74 4.05±0.74 4.60±0.74 .000* Variety of services 3.80±0.78 4.16±0.78 4.26±0.78 4.33±0.78 4.70±0.78 .162 Equipment and tools used is safe and hit the standards 4.24±0.65 4.30±0.65 4.56±0.65 4.52±0.65 4.60±0.65 .135 The technology used for services is up to date 4.24±0.64 4.34±0.64 4.48±0.64 4.43±0.64 4.60±0.64 .729 Products and services have good quality 4.17±0.65 4.28±0.65 4.45±0.65 4.38±0.65 4.60±0.65 .248 Price factors The price is aligning with quality of the service provided 4.03±0.64 4.22±0.64 4.43±0.64 4.00±0.64 4.40±0.64 .005* Prices are similar to clinics at the same level 4.00±0.68 4.16±0.68 4.28±0.68 4.14±0.64 4.50±0.64 .070 Convenient traveling to use the services 4.62±0.72 4.23±0.72 4.22±0.72 3.95±0.64 4.40±0.64 .000* Distribution channels Convenient traveling to use the services 3.89±0.73 4.11±0.73 4.37±0.73 4.09±0.73 3.80±0.73 .001* The number of branches of the clinic that is available 3.65±0.82 3.46±0.82 4.12±0.82 4.05±0.82 4.10±0.82 .004* Location that is easy to find 3.65±0.78 4.03±0.78 3.39±0.78 4.05±0.78 3.90±0.78 .031* Parking area 3.52±0.76 4.02±0.76 4.16±0.76 4.19±0.76 3.90±0.76 .000*
Table 5 Age evaluation on different factors in using skincare beauty clinic (N=402).
3.83±0.74 4.05±0.74 4.12±0.74 3.66±0.74 3.90±0.74 .002* Membership system / membership service 3.58±0.78 3.93±0.78 4.00±0.78 3.71±0.78 3.80±0.78 .003*
Physical environmental factors
indicating various services, clear and easy to understand
Chamnikhetkan et al. BT40 Page 184 Have presenters that are famous and interesting. 3.62±0.89 3.75±0.89 3.82±0.89 3.43±0.89 3.60±0.89 .134 Thorough advertisement such as TV, Internet, Booths, Public relations, etc. 3.48±0.86 3.82±0.86 3.82±0.86 3.62±0.86 3.90±0.86 .074 Good suggestions and relations from employees in the clinic. 3.69±0.79 3.94±0.79 4.66±0.79 3.62±0.79 3.90±0.79 .098 Notifying information
customers
3.69±0.72 4.02±0.72 4.05±0.72 3.76±0.72 3.90±0.72 .064
such as new innovations letting
aware always.
The staffs are courteous 4.52±0.67 3.90±0.67 4.39±0.67 4.14±0.67 4.20±0.67 .053 Staffs are attentive 4.34±0.68 4.28±0.68 4.37±0.68 4.47±0.68 3.90±0.68 .019* The number of employees is sufficient to provide the service. 4.24±0.70 4.29±0.70 4.34±0.70 4.20±0.70 4.00±0.70 .085 Process factors Speed and accuracy of service 4.38±0.66 4.26±0.66 4.36±0.66 4.19±0.66 3.50±0.66 .072 Ongoing service monitoring 4.17±0.63 4.27±0.63 4.25±0.63 4.19±0.63 3.30±0.63 .235 The ability to provide services that suit customer needs 4.07±0.68 4.23±0.68 4.28±0.68 4.05±0.68 3.40±0.68 .030* Specify the price clearly 4.14±0.73 4.24±0.73 4.20±0.73 4.24±0.73 3.60±0.73 .000*
Personnel or Employee factors
There are signs
3.93±0.74 4.18±0.74 4.29±0.74 3.95±0.74 3.80±0.74 .000* There are enough seats
for service. 3.83±0.71 4.15±0.71 4.21±0.71 4.19±0.71 3.70±0.71 .201 There are various media to entertain while
for service. 3.62±0.83 3.95±0.83 4.01±0.83 4.05±0.83 3.80±0.83 .000*
while waiting
waiting
Marketing factors
promotions, discounts, giveaway packages, and interesting marketing promotions such
are famous and interesting.
Chamnikhetkan et al. BT40 Page 185
Factors Occupation P-value Government (N=31) Company employee (N=113) Employee (N=163) Selfemployed (N=16) Student (N=199) Product factors This Clinic is famous and Reliable 4.32±0.74 4.41±0.74 3.92±0.74 4.13±0.74 4.38±0.74 .000* Variety of services 4.16±0.78 4.21±0.78 3.59±0.78 4.06±0.78 4.25±0.78 .043* Equipment and tools used are safe and hit the standards 4.55±0.65 4.36±0.65 4.46±0.65 4.22±0.65 4.39±0.65 .093 The technology used for services is up to date 4.55±0.64 4.49±0.64 3.54±0.64 4.19±0.64 4.40±0.64 .126 Products and services have good quality 4.42±0.65 4.42±0.65 4.31±0.65 4.17±0.65 4.37±0.65 .443 Price factors The price is aligning with quality of the service provided 4.29±0.64 4.43±0.64 4.07±0.64 4.06±0.64 4.28±0.64 .036* Prices are similar to clinics at the same level 4.03±0.68 4.23±0.68 4.31±0.68 4.22±0.64 4.22±0.64 .253 Convenient traveling to use the services 3.87±0.72 4.12±0.72 3.84±0.72 4.15±0.64 4.09±0.64 .000* Distribution channels Parking area 4.39±0.73 4.24±0.73 3.92±0.73 4.04±0.73 4.22±0.73 .128 Convenient traveling to use the services 3.65±0.82 3.80±0.82 3.92±0.82 4.06±0.82 4.10±0.82 .281 The number of branches of the clinic that is available 3.93±0.78 4.06±0.78 3.85±0.78 4.13±0.78 4.07±0.78 .043* Location that is easy to find 4.22±0.76 3.80±0.76 3.92±0.76 4.06±0.76 4.10±0.76 .087
Table 6 Occupation evaluation on different factors in using skincare beauty clinic (N=402).
There
4.09±0.74 4.05±0.74 3.77±0.74 4.06±0.74 4.06±0.74 .027* Membership system/membership service 3.96±0.78 4.02±0.78 3.96±0.78 3.80±0.78 4.14±0.78 .009* Have
that
3.74±0.89 3.89±0.89 4.07±0.89 3.83±0.89 4.00±0.89 .000* Thorough advertisement such as TV, Internet, 3.42±0.86 3.69±0.86 3.92±0.86 3.69±0.86 3.84±0.86 .017*
are
as giving a trial use.
presenters
Booths, Public relations, etc. Good suggestions and relations from employees in the clinic.
information such as new innovations letting customers aware always.
From the previous study, consumer behavior marketing mix factors affecting and the needs of consumers (18-50 years old) using beauty clinic services in Bangkok were investigated. The overall marketing mix factor affecting decision making for using beauty clinic service was at the highest level. The product was a key factor. Moreover, the overall decision making for using beauty clinic service was at the highest level. The received complete information from beauty clinics and offered discounts and promotions, and satisfaction when using beauty clinic service were influencing factors on the customers’ decision (Kuphadist & Yenyuak, 2020).
Chamnikhetkan et al. BT40 Page 186
3.39±0.79 3.76±0.79 4.00±0.79 3.61±0.79 3.89±0.79 .026*
3.80±0.72 3.96±0.72 3.77±0.72 3.76±0.72 4.01±0.72 .003*
The staffs are courteous 3.81±0.67 3.98±0.67 3.92±0.67 3.80±0.67 4.08±0.67 .003* Staffs are attentive 4.42±0.68 4.36±0.68 4.23±0.68 4.00±0.68 4.45±0.68 .087 The number of
service. 4.32±0.70 4.30±0.70 4.30±0.70 4.17±0.70 4.38±0.70 .020*
Speed and accuracy of service 4.29±0.66 4.32±0.66 4.07±0.66 4.04±0.66 4.36±0.66 .000* Ongoing service monitoring 4.09±0.63 4.17±0.63 4.23±0.63 4.08±0.63 4.31±0.63 .005* The ability to provide services that suit customer needs 4.06±0.68 4.30±0.68 4.07±0.68 3.93±0.68 4.25±0.68 .080 Specify the price clearly 3.84±0.73 4.16±0.73 4.31±0.73 4.04±0.73 4.30±0.73 .013* Physical environmental factors There are signs indicating various services, clear and easy to understand 4.22±0.74 4.23±0.74 3.77±0.74 4.04±0.71 4.23±0.74 .003* There are enough seats while waiting for service. 4.09±0.71 4.14±0.71 4.23±0.71 4.06±0.71 4.16±0.71 .002* There are various media to entertain while waiting for service. 3.87±0.83 3.88±0.83 3.85±0.83 3.96±0.83 4.02±0.83 .053
Notifying
Personnel or Employee factors
employees is sufficient to provide the
Process factors
4. Conclusions
In this study, the customers’ decision to use the skincare beauty clinic services were investigated via the online questionnaire. As a result of the survey, female customers usually used the beauty clinic services more than males, and the target group that used the most services was 25-29 years old. Importantly, the factors that influence the decision of customers to use the skincare beauty clinic arranged from highest to lowest were the product, personnel or employee, and procedure or process. Moreover, among the services of skincare beauty clinics, customers preferred to treat acne, scars, and freckles followed by skin treatment and skin lasers.
The relationship of different factors with the Chi-square method by considering the level of significance 0.05, in terms of gender, age, and occupation, in using the skin beauty clinic. The consumers' decision to use the beauty clinic services, in general, had a relationship with the factors in the decision to use the beauty clinic. While the gendersare different, there are differences in consumers' decisions to use beauty clinic services. Females have an average buying decision than males, because women may be more concerned about skin beauty care than men, so they are more interested in choosing a beauty clinic for skin care. Furthermore, the age and occupation of consumers are related to decision-making factors choose to use beauty clinics.
However, we have suggested for further study that the additional various factors of the consumers, suchasconsumerincomefactorsculturalfactors,andsocialfactorsshouldbeevaluated.Othermethods, such as in-depth interviews, should be used in the collection of information in order to obtain more specific information.
5.Acknowledgements
We would like to thank participants who answered the questionnaire and are willing to participate in this study. In addition, we would like to thank all lecturers and staff in the School of Cosmetic Science, Mae Fah Luang University for giving knowledge and suggestions.
6.References
Fugate, D. L. (2008). Marketing services more effectively with neuromarketing research: a look into the future. Journal of Services Marketing
Kuphadist, J., Yenyuak, C. (2020). Consumer Behavior and Service Marketing Mix Factors Affecting DecisionMakingfor UsingBeautyClinic Servicein Bangkok. Rajapark Journal,14(34),111124.
Leelavorapong, P., Jirayus, P., Sirivaneepagorn, C. (2019). Marketing mix factors (7Ps) affecting customer decision making toward using hotel’s fitness in Bangkok. VRU Research and Development Journal Humanities and Social Science, 14(1), 218-225.
Lovelock, C. H. & Wright, L. K. (2004). Principles of services marketing and management. Upper Saddle River, NJ: Prentice Hall.
Suriyaprom, S. (2009). Behavior and factors affecting the decision to use beauty clinicand Skin care of students at Chiang Mai University.Independent Study, Department of Economics.Chiang Mai University.
Thongplean, P. (2012). Service Marketing Mix Factors Affecting Customers'. Decisions on Choosing a Beauty Salon. Master's Project, M.A (Business English for International Communication). Bangkok: Graduate School, Srinakharinwirot University.
Chamnikhetkan et al. BT40 Page 187
*********************
Effects of music therapy and hand massage on stress, anxiety, and relaxation levels of university students
Rayanan Nirantasuk1, Tikampon Suttidee1 and Tinnakorn Theansungnoen1,2*
*Corresponding author. E-mail: tinnakorn.the@mfu.ac.th
Abstract
Stress and anxiety among university students can be caused by many factors including academic workload,timeconstraints,interpersonal difficultieswithfacultyandpeers,financial problems, and even covid-19 pandemic. Among treatments to reduce stress and anxiety as well as increase relaxation, alternative methods including music therapy and hand massage have been focused on. The purpose of this study was to investigate the effects of music therapy and hand massage on the stress, anxiety, and relaxation levels of university students. In this study, thirty participants who met the inclusion criteria: getting 14-26 PSS score and not use with any stress treatment were fifteen male and fifteen female students in Mae Fah Luang University, Chiang Rai, Thailand. The participants were randomized into the following three groups: hand massage group (N=10), musicgroup (N=10) receiving same musicat 60-80 bpm without lyrics at moderate volume via headphone, and music-combined-hand massage group (N=10) receiving same music at 60-80 bpm combine with a hand massage. The interventions were conducted in participants for 20 minutes per day and performed three sections with alternative days for a week. The Visual analog scale for stress (VAS-S), State-Trait Anxiety Inventory Scale (STAI-S), and Visual analog scale for relaxation (VAS-R) were used for data collection, and the SPSS version 21 was used for data analyses. As a result of the data analysis, the interventions of the three groups were shown statistically, significantly decreased stress and anxiety, and increased relaxation (P<0.05). There was no significant difference among the three groups. The results indicated that music, hand massage, and music-plus-hand massage interventions were similarly effective to decrease moderate stress and anxiety and increase relaxation for university students.
Keywords: Anxiety; Hand massage; Music therapy; Relaxation; Stress
1.Introduction
The main personal stressors among adults and Generation Z (Gen Z) who are 18-21 years old were money and work, according to the American survey in 2018. Moreover, Gen Z was reported poorest mental health among other generations. Some of them have experienced symptoms of stress (The American Psychological Association, 2018). The effects of stress were headaches that can be triggered from episodic headache to chronic headache (D'amico et al., 2000). Furthermore, people who have a severe level of stress may risk to suicide (Feskanich et al., 2002). The Department of Mental Health, Thailand (2018) had revealed that Thai people tend to be more stressed since stress problem was the most consulted in mental health service hotline in 2017 (Sauhem & Banchonhattaki, 2020). Moreover, it had been reported that the number of 11-25 age group have been increased to call for consulting mental health issues which were stress or anxiety, psychiatric, love, depression, family problems, and had thoughts or attempted to suicide (Chupradit & Chupradit, 2022). Furthermore, stress among
BT41 Page 188
2022) 7th
th December 2022
Proceeding of Cosmetic & Beauty International Conference 2022 Future of the Next Beauty (CBIC
-9
1School of Cosmetic Science, Mae Fah Luang University, Chiang Rai 57100, Thailand
2Green Cosmetic Technology Research Group, School of Cosmetic Science, Mae Fah Luang University, Chiang Rai 57100, Thailand
university students had been found and caused by many factors including academic workload, time constraints, interpersonal difficulties with faculty and peers, financial problems (Nonis et al., 1998), and even covid-19 pandemic
Typically, stress could be removed by many methods including pharmaceutical treatments and alternativetherapies. Theadministration of benzodiazepineisone of pharmaceutical treatmentsthat can alleviate stress in the short-term by action as the sedative However, the drug administration has undesirable effects such as memory impairment (World Health Organization, 1996). Taking antidepressant medications (e.g. duloxetine) also have undesirable effects such as nausea and dizziness (Harmer et al., 2008). Among alternative therapies, cognitive behavior therapy (CBT) have been reported to prevent the risk of chronic posttraumatic stress disorder in acute stress disorder patients (Bryant et al , 1999). Moreover, a mindfulness meditation could reduce depression, anxiety and stress (Song & Lindquist, 2015). Thus, the evidence indicated that the alternative therapies have the potential to eliminate stress.
Massage and music therapies are alternative methods to improve relaxation. Massage and other forms of complementary and alternative medicine (CAM) modalities gained popularity. The American Massage Therapy Association defines massage as “manual soft tissue manipulation, including holding, causing movement, and/or applying pressure to the body”. Massage is one of CAM which has been used for centuries around the world as a therapy to promote and improve relaxation, reduces stress and anxiety (Vickers & Zollman, 1999). Hand massage is easy, fast and convenient and can be performed to various kinds of people by any caregiver without putting on or off clothing, thus making it very costeffective. Using 10-minute slow stroke hand massage showed statistically significant improvements on psychological indicators of relaxation (Harris & Richards, 2010). Similarly, hand massage in a 10minute time frame led to effective stress reduction (Brand et al., 2013).
Another alternative method to improve relaxation, which can be commonly used is music. Baste and Gadkari (2014) revealed that music is a simple, inexpensive and effective therapy for stress from study of stress, self-esteem and depression. Music affects the central nervous system and causes distraction from the pain, leading to a state of relaxation (Nilsson, 2009). The previous studies used several types of music to reduce stress. Using easy-listening music during colonoscopic examination for the measurement of salivary cortisol level had shown to successfully reduce stress and anxiety (Uedo et al., 2004). Besides, music with 60–80 beats per minute in interventions could provide the most relaxing (Ortiz, 1997). Moradipanah et al. (2009) examined 20 minutes listening tape that includes 3 pieces of music with 70–80 beats in patients undergoing coronary angiography. The music listening could decrease in stress, anxiety and depression levels in the group that received music.
Although massage and music therapies have revealed the effectiveness to reduce stress and increase relaxation, the intervention by these therapies to reduce stress for university students have been rarely reported. Therefore, in this study the aim was to evaluate the effects of hand massage and music on stress reduction for university students.
2.Materials and Methods
2.1 Participants
This study was carried out in Mae Fah Luang University, Chiang Rai, Thailand. The study protocol was approved by Mae Fah Luang University Ethics Committee (Protocol No: EC19360-17). The participants were 30 university students (male 15 and female 15) aged 18-25 years. Participants who met thefollowinginclusioncriteriawere: inPSSscorerangingfrom14-26,notintheprocess oftreating stress from doctors, able to participate in scheduled, and able to voluntarily sign to participate in the study.Participantswereexcludediftheyhad: PSSscorelessthan14,openwoundsandinfectedwounds on the hand, taken stress relieving drugs, taken sleeping pills, taken sedative pills, and been a volunteer for another study related to stress reduction. The participants (N=30) were randomized to participate in this study by the sex ratio of each group was 1:1. They were randomized into 3 equal groups consist of music group (N=10), hand massage group (N=10), and music-combined-hand massage group (N=10) as shown in Figure 1.
Nirantasuk et al. BT41 Page 189
2.2 Protocol Conditions of experiment
The experiment environment was shut off from the comings and goings of people and the outside sound. The temperature was 25 C.
General procedure
The participants signed the consent forms and completed the preVAS-S, STAI-S, and VAS-R questionnaire. Subsequently, they were asked to lie on the bed, close their eyes with a blindfold, cover body witha blanket at chest level andknow thetreatment starting. After treatment,the participants were asked to complete post VAS-S, STAI-S, and VAS-R questionnaire. Moreover, the study was conducted in participants 3 sections with alternative days for 1 week. The satisfied questionnaire was completed in the last day after treatment.
2.2.1 Music group
The participants listened to 60-80 Bpm music without lyrics that was selected by the researchers at moderate volume in YouTube application by wearing headphones (with blocking ambient noise) for 20 minutes, while the participants were asked to close their eyes. During three days the same music was played. A researcher was in the room with the participants to control the intervention process.
2.2.2 Hand massage group
The participants were asked to lie on the bed in supine position. Hand massage procedure adapted from Essentially Holistic, 2012. Hand massage with mineral oil was performed on participants for 20 minutes (each side was conducted for 10 minutes). The procedure consists of;
1. Apply enoughmineral oil on hand and forearms. Then rub the oil upwards in longmotions with effleurage stroke along inside and outside of the hand and upto the elbow Repeat each side 4 times.
2. Using both thumbs massage with circular motions on the centre line of the inner and outer arm from wrist to elbow crease. Repeat each side 4 times.
3. Using both thumbs massage with circular motions around the wrist. Repeat 4 times.
4. Using one hand to support the wrist of participant. Then use the other hand gently rotate the wrist in a clockwise and anti-clockwise direction. Repeat each rotation 4 times.
5. Using one hand to support the wrist of participant. Then use the other hand slowly push hand up and down. Repeat 4 times.
6. Using both hands to hold the hand of participants. Then use the thumbs with circular motions on the groove area between the hand bones by starting massage from the base of the finger to the wrist. Repeat each groove 4 times and massage all the groove.
7. Using one hand to support the hand and wrist of the participant. Massage each finger with circular motions and gentle pull to finish. Repeat 4 times on each finger until completely all 5 fingers.
8. Usingonehandtosupportwrist of participant.Then use the other handgentlyrotate eachfinger in a clockwise and anti-clockwise direction. Repeat 4 times on each finger.
9. Alternating thumbs with circle motions on the palm.
10. Bend the hand up, participant rest on elbow. Scissor like frictions performed by both thumbs. Repeat 4 times.
11. Squeezing the hand of participant
12. Effleurage along the back of the arm upto the elbow and then perform the same on the inside hand and arm. Repeat each side 4 times. Then slide off to finish.
Nirantasuk et al. BT41 Page 190
13. Repeat to the other hand.
2.2.3 Music-combined-hand massage group
Hand massage for participants was performed in the same procedure of the hand massage group along with listening to 60-80 Bpm music without lyrics at moderate volume by wearing headphones (with blocking ambient noise) for 20 minutes.
2.3 Outcome measurement
Questionnaire was used as a tool to study psychological effects of participants before and after treatment. The questionnaire was divided into 6 parts.
Part 1: General information of participants.
Part 2: Perceived Stress Scale (PSS). It is a classic stress assessment instrument. The questions in this scale ask about feelings and thoughts during the last month (Cohen et al., 1983). It composes of 10 questions with score range from 0 to 40 with higher scores indicating higher perceived stress. The stress was classified as 3 levels: low stress (scores ranging from 0-13), moderate stress (scores ranging from 14-26) and highstress (scores ranging from 27-40).
Part 3: Stress assessment of participants before and after treatment by using visual analog scale for stress (VAS-S). VAS-S is at least as discriminating as a questionnaire when it comes to highlighting differences in stress levels between two groups (Lesage, 2012). In this study, the scales were as 0-10 with the descriptive words both ends. Indicating that the 0-3 for low stress, 4-7 for moderate stress and 8-10 for highstress.
Part 4: Anxietyassessmentofparticipantsbeforeandaftertreatment byusingthestatecomponent of the State-Trait Anxiety Inventory Scale (STAI-S) from Spielberger (1983). STAI-S scale canbe used to determine the actual levels of anxiety intensity induced by stressful procedures. It composes of 20 questions which each question is rated on a 4-point scale (not at all, somewhat, moderately so, very much so). STAI scores are commonly classified as “no or low anxiety” (20-37), “moderate anxiety” (38-44), and “high anxiety” (45-80)
Part 5: Relaxation assessment of participants before and after treatment by using visual analog scale for relaxation (VAS-R). VAS-R is a standard measure psychological test that describes the feelings of people. The factors are answered on a 5 points that person feels at the moment with “0 = not at all” to “4 = so much”.
Part 6: Satisfaction of participants after treatment and suggestion. The calculation of satisfaction score range
2.4 Data analysis
The demographic characteristics of the participants were compared by using ANOVA test and Chi-square test. The psychological data of participants before and after intervention within
Nirantasuk et al. BT41 Page 191
From the class interval calculation, it can interpret satisfaction score into 4 levels following: Mean value Level of satisfaction 4.00 - 5.00 Very high 3.00 - 3.99 High 2.00 - 2.99 Moderate 1.00 - 1.99 Low
Class interval = Maximum score – Minimum score Number of class Class interval = 5 - 1 4 = 1
group were compared using Paired-sample T-test. The data between 3 groups were compared using ANOVA.
3.Results and Discussion
3.1 Perceived Stress Scale (PSS) of participants
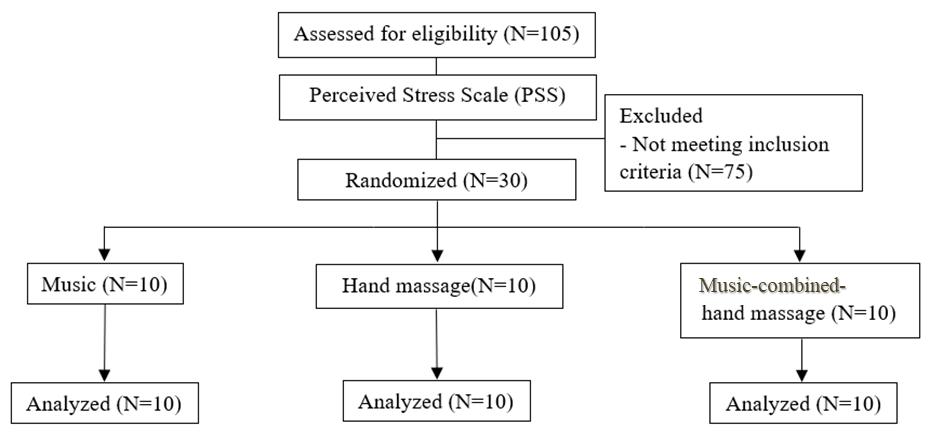
The PSS score of 105 participants were shown in Table 1. There were 6 participants (5.8%) who had lowstress level, 86 participants (83.5%) whohadmoderatestress level, and11participants(10.7%) who had high stress level. The result shown that most students in Mae Fah Luang University may have moderate stress level.
3.2 Demographic characteristics of participants (N=30)
The demographic characteristics of participants among 3 groups are shown in Table 2. The data were no statistically significant differences in age, sex, years of study, grade, income, family status, PSSscore,orSTAI-Sscore(P>0.05).Theresultsamong3groupsshownthatthesefactorsweresimilar Furthermore, PSS and STAI-S scores were moderate stress level in all groups.
3.3 The decreasing of stress level after intervention
The stress levels were measured by using Visual analog scale for stress (VAS-S). The results are shown in Table 3. The result was found that on day 1 the music-combined-hand massage group was the most decreased stress levels (-2.60±0.97) as compared to the music group (-1.60±1.84) and hand massage group (-1.60±1.65). On day 2 the hand massage group was the most decreased stress levels (2.50±1.96) as compared to the music group (-1.40±1.84) and music-combined-hand massage group (1.70±1.34). On day 3 the hand massage group was the most decreased stress levels (-1.80±1.99) as compared to the music group (-1.80±1.32) and music-combined-hand massage group (-1.60±1.08).
Nirantasuk et al. BT41 Page 192
Figure 1 Flow diagram of the study
Questionnaire Low Moderate High PSS 6 (5.8%) 86 (83.5%) 11 (10.7%) The data were presented as N (%)
Table 1 Perceived Stress Scale (PSS) score of participants
On theother hand,theresults of paired t-test showedthat stresslevelsinall groupswerestatistically significantly reducedafter intervention(P<0.05). Theprevious study found that the stressin 60females who are 20
30 years old was reduced by 10 minutes relaxation music when analyzed with the VAS (Thoma et al., 2013). Furthermore, the previous study found that perceived stress in 17 women diagnosed with primary breast cancer were significantly reduce after received 30 minutes of massage (Listing et al., 2010). However, our study found that the data of a one-way ANOVA test had no statistically significant difference in delta change and stress levels before and after intervention among 3 groups.
Nirantasuk et al. BT41 Page 193
Characteristics Music Hand massage Music-combinedhand massage P-value Age 21.0 ± 1.16 20.8 ± 0.79 20.4 ± 0.97 0.392a Sex Male Female Years of study 1 2 3 4 Grade 0.00 - 1.99 2.00 - 2.99 3.00 - 4.00 Income <10,000 10,000 - 19,999 20,000 - 29,999 Family status Live together Separated or divorced Father or mother died 5 5 1 2 5 2 0 6 4 8 2 0 6 3 1 5 5 0 4 4 2 0 6 4 6 3 1 5 3 2 5 5 2 3 2 3 1 5 4 7 3 0 7 3 0 1.000b 0.646b 0.714b 0.638b 0.675b PSS 18.5 ± 4.50 19.9 ± 3.78 20.5 ± 3.34 0.510a STAI-S 38.00 ± 10.53 42.20 ± 9.78 44.20 ± 6.97 0.324a
Table 2 Demographic characteristics of participants
The data were presented as N except of age, PSS and STAI-S were presented as mean ± SD.
a
mean analyzed by ANOVA test.
b
mean analyzed by Chi-square test.
–
Group Day1 Mean±SD Day2 Mean±SD Day3 Mean±SD Music (N=10) Before 3.20±2.20 3.00±1.89 3.60±2.27 After 1.60±1.51 1.60±1.27 1.80±1.55 Change score -1.60±1.84 -1.40±1.84 -1.80±1.32 P-value 0.022 0.039 0.002 Hand Massage (N=10) Before 3.80±3.36 4.30±2.36 4.20±1.93 After 2.20±2.57 1.80±2.44 2.40±2.32 Change score -1.60±1.65 -2.50±1.96 -1.80±1.99 P-value 0.013 0.003 0.019 Music-combined-hand massage (N=10) Before 5.90±2.18 4.70±1.49 2.90±1.45 After 3.30±1.95 3.00±1.16 1.30±1.16 Change score -2.60±0.97 -1.70±1.34 -1.60±1.08 P-value 0.000 0.003 0.001 Comparing groups before intervention, ANOVA test 0.073 0.144 0.330 Comparing groups after intervention, ANOVA test Comparing delta change, ANOVA test 0.191 0.258 0.164 0.355 0.382 0.943
Table 3 Comparison of means score of stress levels within group and between group in each day
The data were presented as mean±SD.
3.4 The decreasing of anxiety level after intervention
The anxiety levels were measured by using the State-Trait Anxiety Inventory Scale (STAI-S). The results are shown in Table 4. The result found that on day 1 the music-combined-hand massage group was the most decreased anxiety levels (-12.10±4.98) as compared to the hand massage group (9.30±7.26) and music group (-7.50±6.02). On day 2 the music-combined-hand massage group was the most decreased anxiety levels (-10.20±6.71) as compared to the music group (-6.40±8.51) and hand massage group (-9.70±7.38). On day 3 the hand massage group was the most decreased anxiety levels (-11.80±8.89) as compared to the music group (-8.90±8.95) and music-combined-hand massage group (-10.30±7.39).
Table 4 Comparison of mean scores of anxiety levels within and between group in each day
On the other hand, the results of paired t-test showed that anxiety levels in all groups were statistically significantly reduced after intervention (P<0.05). Similar to previous study that used the 60-80 bpm music to reduce state anxiety by using STAI-S as an indicator. The results of the previous study found statistically significantly reduced anxiety in 180 patients who existed during the preoperative period (Uğraş et al., 2018). In addition, the previous study found that STAI score after performing 10-minute hand massage was shown statistically significantly lower than the control group (Çavdar et al., 2020). However, in our study result of a one-way ANOVA test found no statistically significant difference in delta change and anxiety levels before and after intervention among 3 groups.
3.5 The increasing of relaxation level after intervention
The relaxationwasmeasured byusing Visual analogscaleforrelaxation (VAS-R).The results were shown in Table 5. The result found that on day 1 the music-combined-hand massage group was the most increased relaxation levels (1.10±0.88) as compared to the music group (0.60±0.70) and hand massage group (0.90±0.74). On day 2 the music-combined-hand massage group was the most increased relaxation levels (1.60±0.84) as compared to the music group (0.50±0.85) and hand massage group (1.00±0.67). On day 3 the hand massage group was the most increased relaxation levels (1.40±1.08) as compared to music group (1.10±0.88) and music-combined-hand massage group (0.70±0.82).
On the other hand, the results of paired t-test showed that relaxation in all groups were statistically significantly increased after intervention (P<0.05). Similar to the previous study, music intervention was performed for 20 minutes per day, 3 consecutive days in 240 burn patients. The music intervention could statistically significantly increase relaxation (Ghezeljeh et al., 2017). In addition, the previous study was performed by hand massage in 14 healthy women students age range 18-20 for 20 minutes. The results shown that anxiety levels were significantly decreased after hand massage (Kunikata et al.,
Nirantasuk et al. BT41 Page 194
Group Day1 Mean±SD Day2 Mean±SD Day3 Mean±SD Music (N=10) Before 38.00±10.53 37.80±10.68 41.60±12.66 After 30.50±8.30 31.40±7.91 32.70±7.92 Change score -7.50±6.02 -6.40±8.51 -8.90±8.95 P-value 0.003 0.041 0.012 Hand Massage (N=10) Before 42.20±9.78 41.40±9.02 43.00±8.92 After 32.90±8.98 31.70±5.60 31.20±5.57 Change score -9.30±7.26 -9.70±7.38 -11.80±8.89 P-value 0.003 0.002 0.002 Music-combined-hand massage (N=10) Before 44.20+6.97 43.10+7.17 39.40+7.55 After 32.10±4.31 32.90±5.28 29.10±5.34 Change score -12.10±4.98 -10.20±6.71 -10.30±7.39 P-value 0.000 0.001 0.002 Comparing groups before intervention, ANOVA test 0.324 0.422 0.720 Comparing groups after intervention, ANOVA test Comparing delta change, ANOVA test 0.768 0.260 0.857 0.485 0.459 0.747 The data were presented as mean±SD.
Table 5 Comparison of mean scores of relaxation levels within and between group in each day
2012). However, in our intervention result of a one-way ANOVA test found no statistically significant difference in delta change and relaxation before and after intervention among 3 groups.
Furthermore, the changing of stress, anxiety and relaxation in each group have similar mechanisms to affect the participant feeling. The 60-80 bpm music can gradually modify the participant's moods state. Then it induces the brain wave change to alpha wave and induce heart rate to match tempo and trigger specific neural processes (Will & Berg, 2007). Moreover, music can decrease cortisol, increase endorphin (Jiang et al., 2013), serotonin, dopamine (Ferreri et al., 2019) and oxytocin (Nilsson et al., 2009) that create good moods. The hand massage can stimulate parasympathetic nervous systems and decrease cortisol, increase endorphin, serotonin, dopamine, and oxytocin (Andrade, 2014) that also create good moods. Therefore, these mechanisms effect to reduce stress and anxiety and increase relaxation of participants in this study.
3.6 The satisfaction after interventions
The results of satisfaction after intervention were shown in Table 6. The satisfaction including reduced stress, reduced anxiety, more relax, stable mood and suit time showed no statistically significant difference among 3 groups. In addition, the average mean score of all groups were classified in very high level.
Table 6 Satisfaction after treatment between groups
4.Conclusions
Our results revealed that the effects of music, hand massage and music-plus-hand massage could statistically significantly decrease moderate stress and anxiety and increase relaxation for students in Mae Fah Luang University. Furthermore, there were no statistically significant differences among 3 groups of interventions, suggesting that the interventions have similar effectiveness. Therefore, these
Nirantasuk et al. BT41 Page 195
Group Day1 Mean±SD Day2 Mean±SD Day3 Mean±SD Music (N=10) Before 3.00±0.94 2.70+0.95 2.20+1.23 After 3.60±0.70 3.50+0.53 3.30+0.68 Change score 0.60±0.70 0.50±0.85 1.10±0.88 P-value 0.024 0.037 0.003 Hand Massage (N=10) Before 2.80+0.63 2.70+0.48 2.40+0.84 After 3.70+0.48 3.70+0.48 3.80+0.42 Change score 0.90±0.74 1.00±0.67 1.40±1.08 P-value 0.003 0.001 0.003 Music-combined-hand massage (N=10) Before 2.80±1.03 2.10±0.74 3.00±0.67 After 3.90±0.32 3.70±0.48 3.70±0.68 Change score 1.10±0.88 1.60±0.84 0.70±0.82 P-value 0.003 0.000 0.025 Comparing groups before intervention, ANOVA test 0.845 0.137 0.167 Comparing groups after intervention, ANOVA test Comparing delta change, ANOVA test 0.442 0.362 0.590 0.116 0.165 0.258
Satisfaction Music Hand Massage Music-combinedhand massage P-value Reduced stress 3.70±0.823 4.50±0.527 4.00±0.943 0.088 Reduced anxiety 4.10±1.101 4.40±0.516 3.80±0.789 0.293 More relax 4.40±0.966 4.60±0.516 4.70±0.675 0.659 Stable mood 4.00±1.333 3.70±0.675 3.70±0.823 0.737 Suit time 4.10±1.101 4.60±0.516 4.10±0.876 0.343 Average mean 4.06±1.058 4.36±0.631 4.06±0.867 The data were presented as mean±SD.
interventions are suggested to be effective methods to relieve stress and anxiety due to their safety and low cost.
In further studies, we suggest setting up an experimental room like a spa treatment room for more comfort and the treatment time should be increased. In addition, future studies need to create a control group that does not provide any treatment and employ larger sample size for more reliable information. Furthermore, the study needs to evaluate physiological responses including pulse rate, blood pressure and cortisol levels for more accuracy of the results.
5.Acknowledgements
We would like to thank participants who answered the questionnaire and are willing to participate in this study. In addition, we would like to thank all lecturers and staff in the School of Cosmetic Science, Mae Fah Luang University for giving knowledge and suggestions.
6. References
Andrade, K. A. (2014). Outcome-based massage-third edition. LWW;China.
Baste, V. S., & Gadkari, J. V. (2014). Study of stress, self-esteem and depression in medical students and effect of music on perceived stress. Indian journal of physiology and pharmacology, 58(3), 298
301.
Brand, L. R., Munroe, D. J., & Gavin, J. (2013). The effect of hand massage on preoperative anxiety in ambulatory surgery patients. AORN journal, 97(6), 708–717.
Bryant, R. A., Sackville, T., Dang, S. T., Moulds, M., & Guthrie, R. (1999). Treating acute stress disorder: an evaluation of cognitive behavior therapy and supportive counseling techniques. The American journal of psychiatry, 156(11), 1780–1786.
Çavdar, A. U., Yılmaz, E., & Baydur, H. (2020). The Effect of Hand Massage Before Cataract Surgery on Patient Anxiety and Comfort: A Randomized Controlled Study. Journal of perianesthesia nursing: official journal of the American Society of PeriAnesthesia Nurses, 35(1), 54–59.
Cohen, S., Kamarck, T., & Mermelstein, R. (1983). A global measure of perceived stress. Journal of Health and Social Behavior, 24, 386-396.
D'amico, D., Libro, G., Prudenzano, M.P., Peccarisi, C., Guazzelli, M., Relja, G., Puca, F., Genco, S., Maggioni, F., Nappi, G., Verri, A. P., Cerbo, R., & Bussone, G. (2000). Stress and chronic headache. The journal of headache and pain, 1(1), S49–S52.
Chupradit, P.W. & Chupradit, S. (2022). The influences of social media addiction on mental health status among university students in Thailand. Suthiparithat journal, 36(3), 188-207.
Ferreri, L., Mas-Herrero, E., Zatorre, R. J., Ripollés, P., Gomez-Andres, A., Alicart, H., & Riba, J. (2019). Dopamine modulates the reward experiences elicited by music. Proceedings of the National Academy of Sciences, 116(9), 3793-3798.
Feskanich,D.,Hastrup,J.L.,Marshall,J.R.,Colditz,G.A.,Stampfer,M.J.,Willett,W.C.,&Kawachi, I.(2002).StressandsuicideintheNurses'HealthStudy. Journal of epidemiology and community health, 56(2), 95–98.
Ghezeljeh, T. N., Ardebili, F. M., & Rafii, F. (2017). The effects of massage and music on pain, anxiety and relaxation in burn patients: Randomized controlled clinical trial. Burns, 43(5), 1034-1043.
Harmer, C. J., Heinzen, J., O’Sullivan, U., Ayres, R. A., & Cowen, P. J. (2008). Dissociable effects of acute antidepressant drug administration on subjective and emotional processing measures in healthy volunteers. Psychopharmacology, 199(4), 495-502.
Harris, M., & Richards, K. C. (2010). The physiological and psychological effects of slow-stroke back massage and hand massage on relaxation in older people. Journal of Clinical Nursing, 19(78), 917-26.
Jiang, J., Zhou, L., Rickson, D., & Jiang, C. (2013). The effects of sedative and stimulative music on
Nirantasuk et al. BT41 Page 196
–
stress reduction depend on music preference. Arts Psychother. 40(2), 201–205.
Kunikata, H., Watanabe, K., Miyoshi, M., & Tanioka, T. (2012). The effects measurement of hand massage by the autonomic activity and psychological indicators. The journal of medical investigation: JMI, 59(1-2), 206–212.
Lesage, F. X., Berjot, S., & Deschamps, F. (2012). Clinical stress assessment using a visual analogue scale. Occupational medicine (Oxford, England), 62(8), 600–605.
Listing, M., Krohn, M., Liezmann, C., Kim, I., Reisshauer, A., Peters, E., Klapp, B. F., & Rauchfuss, M.(2010). The efficacy of classical massage on stress perception and cortisol following primary treatment of breast cancer. Archives of women's mental health, 13(2), 165–173.
Moradipanah, F., Mohammadi, E., & Mohammadil, A. Z. (2009). Effect of music on anxiety, stress, and depression levels in patients undergoing coronary angiography. EMHJ - Eastern Mediterranean Health Journal, 15(3), 639-647.
Nilsson, U. (2009). Soothing music can increase oxytocin levels during bed rest after open‐heart surgery: a randomised control trial. Journal of clinical nursing, 18(15), 2153-2161.
Nonis, S., Hudson, G., Logan, L., & Ford, C. (1998). Influence of Perceived Control over Time on College Students' Stress and Stress-Related Outcomes. Research in Higher Education, 39(5), 587-605.
Ortiz, J. M. (1997). The Tao of music: sound psychology. Weiser Books.
Sauhem, W. & Banchonhattaki, P. (2020). Effects of Mental Health Literacy Promotion Program with Positive Psychology Concepts for Promoting Stress Management Behavior among Village Health Volunteers. KKU Journal for Public Health Research, 13(3), 44-55.
Song, Y., & Lindquist, R. (2015). Effects of mindfulness-based stress reduction on depression, anxiety, stress and mindfulness in Korean nursing students. Nurse education today, 35(1), 86-90.
Spielberger, C.D. (1983). State-trait anxiety inventory for adults. Sampler set; manual test, scoring key. PaloAlto, California: Consulting Psychologist Press.
The American Psychological Association (2018). Stress in america™ generation z Stress in America™ Survey.
Thoma, M. V., La Marca, R., Brönnimann, R., Finkel, L., Ehlert, U., & Nater, U. M. (2013). The effect of music on the human stress response. PloS one, 8(8).
Uedo, N., Ishikawa, H., Morimoto, K., Ishihara, R., Narahara, H., Akedo, I., Ioka, T., & Kaji, I. (2004). Reduction in salivary cortisol level by music therapy during colonoscopic examination. Hepatogastroenterology, 51, 463-465.
Uğraş, G. A., Yıldırım, G., Yüksel, S., Öztürkçü, Y., Kuzdere, M., & Öztekin, S. D. (2018). The effect of different types of music on patients' preoperative anxiety: A randomized controlled trial. Complementary therapies in clinical practice, 31, 158-163.
Vickers, A. & Zollman, C. (1999) ABC of complementary medicine: Acupuncture. BMJ, 319, 973-976.
Will, U., & Berg, E. (2007). Brain wave synchronization and entrainment to periodic acoustic stimuli. Neuroscience letters, 424(1), 55-60.
World Health Organization (1996). Rational use of benzodiazepines. Programme on Substance Abuse.
Nirantasuk et al. BT41 Page 197
*********************
Make-up products purchasing forecast after COVID-19 pandemic as new normal
Nont Thitilertdecha* , Onjira Pujapon, Tanyarat Phoseetong
1School of Cosmetic Science, Mae Fah Luang University, Chiang Rai 57100, Thailand
2Green Cosmetic Technology Research Group, School of Cosmetic Science, Mae Fah Luang University, Chiang Rai 57100, Thailand *Corresponding author. E-mail: nont.thi@mfu.ac.th
Abstract
This study was aimed to investigate Thai consumer’s behavior and interest of make-up products as new normal after COVID-19 pandemic. The questionnaire was used for the surveillance of 624 respondents during December 2021 to March 2022. The survey found that most of the respondents were women with age ranged between 21-25 years (52.20%), students (81.90%) with income less than 15,000 baht (74.80%). Most of respondents had expense for make-up products (89.42%) and expenses per month was less than 500 baht (34.13%). The highest interested make-up was decoration on facial skin (44.98%), followed by decoration on lip (41.94%), eyebrow (9.32%) and eyelids (3.76%), respectively. Preferred channels on purchasing make-ups were both online shop and cosmetic shop (54.48%). Most of women and LGBTQ interested decorations on lip while men interested decoration on facial skin. Gender, age and occupation had an influence on purchasing’s behaviors make-up. The results from this research might be used to set marketing strategic plan for make-up’s products.
Keywords: Covid-19 pandemic; Facial make-up; Product demand; Purchasing behavior
1. Introduction
Thailand is one of economic area the market size of beauty and cosmetic segments have continually grown. In 2019, The revenues in beauty and personal care product in Thailand was 6.65 billion dollars and compound annual growth rate had been forecasted to growth with the rate of 5.5 percent by 2027 The largest product segment is skincare (42%), hair products (15%), soap and hygiene (14%), oral and dental care (12%), and makeup (12%) (https://www.statista.com/statistics/872695/thailand-personalcare-beauty-market-size/) Makeup products have significant effects on perceptions of facial attractiveness, competence, and socio-sexuality for both women and men place when compared with the other cosmetic segment (Aguinaldo et al., 2021). Covid-19 pandemic during 2020-2022 have influenced on most sectors of economy both local and global worldwide. Lockdown policy of control pandemic affects people’s lifestyle that have to work from home, especially, business with contactless. Global economic recession including beauty industry caused the reduction of make-up products purchasing circulation (Gerstell et al., 2020). Makeup product is the most segment in cosmetics have been affected due to the pandemic causes change in consumer’s behavior during quarantine at home and most of women tend not to wear make-up when stay at home. It has been revealed that circulation of make-up under mask are decreased which in contrast with make-up in unmask areas (Choi et al., 2022).
Online-based commerce is now popular due to the fact that the consumers’ behavior has changed according to there are high competition among online platforms to recruit are large number of shops providing various alternative choices for consumer. In addition, logistic systems have now been developed to be more effective from lower cost according to management system. These factors have causedanincreasinginpurchasingdecisionusingonlinechannel includingcosmeticsaswellasmakeup
BT42 Page 198
of Cosmetic & Beauty International Conference 2022 Future of the Next Beauty (CBIC 2022) 7th-9th December 2022
Proceeding
products. In 2019, consumer’s purchasing behavior on the most favorite make-up products via online platform is lipsticks (Phaomanacharoen, 2019). At the present, working life style during Covid-19 pandemic become new normal that both work from home through online meeting along with work at office. Even though wearing mask still be normal policy, return to on-site working place or other activities which have to participate with many people. Makeup products would turn to become important for self-confidence. As life style as well as image perception accompanying with purchasing power might be changed, consumer information about purchasing behavior and demand on makeup products is necessity for entrepreneur to set up marketing strategy. The present study was aimed at investigating demands of make-up products in terms of type, brand’s level, purchasing channel and influencing factors among Thai consumers using online survey based on Google form.
2. Materials and Methods
2.1 Participants
The study populations were Thai people. The inclusion criteria consisted of people who use social media and agree to participate this study and sign the consent form. This study was approved by the Ethics in Human Research Committee of MFU (No. EC 20244-17), and there were 624 respondents who feedback in this study.
2.2 Survey design
The questionnaire was created by using Google form (https://forms.gle/Vmgbr8mFXXAUWc5U7) which was then distributed through online via G-mail, Facebook, Line and Instagram during December 2021 to March 2022. The questionnaire was divided into 2 parts consisting of general information including gender, age, status, occupation, income and expense during Covid-19 pandemic. The second part includes purchasing frequency, expense per time, purchasing demands, demands on type and expected expense for respondents who have expense for make-up. In addition, interest about make-up types, brand’s level, purchasing channels and influencing factors on purchasing make-up were also surveyed.
2.3 Statistical analysis
The descriptive statistics analysis was used to describe general information. The results were expressed as frequency, percentage, mean and standard deviation. The relationships of demographic to interest on purchasing products make-up were analyzed by using Kruskal-Wallis test and ��<0.05 was regarded as statistical difference.
3.Results and Discussion
3.1 Demographic characteristics
The demographic characteristics of the respondents are presented in Table 1. There were 624 respondents who completed the online questionnaire. Most of respondents were women (75.30%) followed by men (13.18 %) and LGBT (10.90 %). Respondents had age ranged between 21 to 25 years (52.20%), were single (96.50 %), and were students (81.90%). Most of them had income lower than 15,000 baht (74.80%).
3.2 Respondents’ purchasing behavior and interest on make-up products
Most of respondents who had expense (N=558) for make-up products purchased make-up product 1-2 times/month (83.51%). The expense per time of respondents usually was not over 1,000 baht (85.70%). Most of them (80.80%) tend to increase their makeup purchasing, especially facial skin make-up (76.10%) followed by lip and eyelid makeups (Table 2) by that the expense rate will be in the range of 500-1,000 baht (47.20%) and up to 20% of the respondents who are going to increase makeup purchase tend to purchase makeup per time ranged 1,001-1,500 baht.
When the respondents (N = 66) who had no expense for makeup were surveyed their tendency to use makeup products, more than half interest on purchasing makeup products (53.03 %) (Table 3). The most demand on makeup product of respondents was asked for both respondents who had makeup
Thitilertdecha et al BT42 Page 199
Table 1 Demographic characteristics.
Thitilertdecha et al BT42 Page 200
Characteristics Frequency (N=624) Percentage (%) Gender Men 86 13.78 Women 470 75.32 LGBTQ 68 10.90 Age (years) Less than 15 3 0.48 15-20 216 34.62 21-25 326 52.24 26-30 54 8.65 31-35 16 2.56 36-40 7 1.12 41-50 2 0.32 Status Single 602 96.47 Married 10 1.60 Divorced -Others 12 1.92 Occupation Students 511 81.89 Company employee 74 11.86 Self-employed 20 3.20 Government officer 8 1.28 Homemaker 1 0.16 Others 10 1.60 Income/month (baht) Lower than 15,000 467 74.84 15,000-20,000 63 10.10 20,001-25,000 23 3.68 25,001-30,000 23 3.68 30,001-40,000 20 3.20 40,001-50,000 10 1.60 50,001-60,000 6 0.96 Higher than 60,000 12 1.92 Expense/month (exclude make-up products) (baht) Lower than 5,000 399 63.94 5,000-10,000 162 25.96 10,001-15,000 28 4.49 15,001-20,000 22 3.53
expense who had makeup expense(R1 respondents) and had no makeup expense (R2 respondents). The most demanded makeup products were makeup product for decoration on facial skin which was 44.98 and 57.14 % for R1 respondents and R2 respondents, respectively. Foundation was the most interesting makeup among all respondents (R1 respondents, 58.96 %; R2 respondents, 65.00 %) followed by press powder (R1 respondents, 58.96 %; R2 respondents, 46.22 %) and concealer (R1 respondents, 37.85 %; R2 respondents, 45.00 %). The other makeup product respondents demanded to purchase was lip product (R1 respondents, 41.94 %; R2 respondents, 37.14 %) especially lipstick (R1 respondents, 75.21 %; R2 respondents, 53.85 %) followed by lip tint (R1 respondents, 52.99 %; R2 respondents, 46.15 %). The R1 and R2 respondents preferred mass product which were 65.23% and 62.86%, respectively. All respondents used both online plate form and onsite cosmetic shop to purchase makeup products (estimated for 54 %). The Shopee platform was the most popular to purchase make-up for R1 respondents (74.15%) while R2 respondents used both Shopee and Watson online platforms (42.86 % and 45.71 %, respectively). Department store (R1 respondents, 87.65 %; R2 respondents, 93.10 %) as well as cosmetic shop (R1 respondents, 52.49 %; R2 respondents, 60.00 %) were major channel for makeup purchasing onsite. The most factor influencing on R1 respondents was beauty bloggers and influencers (70.60%) while R2 respondents were influenced by many factors which depend on respondents including influencers (48.57 %), the necessity in daily life (45.71 %), discount (51.43 %), etc
3.3 Influence of respondents’ demographic characteristics on purchasing behavior and interest of make-up products
The Influence of respondents’ demographic characteristics of the respondents who had makeup expense(R1respondents) includinggender,age,status,occupationandincomeonpurchaseandinterest of facial make-up product were determined by Kruskal-Wallis test as shown in Table 4. As can be seen in the results, gender influenced on interest in purchasing make-up, as well as makeup’s brand level and purchasing channels. In the other hand, gender, age, status, occupation, and income influence on many factors on the respondents’ interested in makeup as well as their behaviors in purchasing makeup by that the gender was the most factors followed by age, occupation, income, and status. As the gender was themost influencingfactor onmakeuppurchasingdecision, thisfactor was then analyzed for which gender should be focused their purchasing’s behavior, especially the R1 respondents. All possible influencingonmakeuprevenueincluding interestinmake-upproduct type,expense/time,brand’slevel, purchasing channel, future’s demand as well as expected increase in makeup expenses were analyzed to obtain necessary data for the planning of marketing strategic as the results are shown in Table 5.
Thitilertdecha et al BT42 Page 201
Characteristics Frequency (N=624) Percentage (%) 20,001-30,000 6 0.96 30,001-40,000 2 0.32 40,001-50,000 2 0.32 Higher than 50,000 3 0.48 Expense/month (make-up products) (baht) No expense 66 10.58 Less than 500 213 34.13 500-1,000 209 33.50 1,001-1,500 70 11.22 1,501-2,000 32 5.13 2,001-3,000 14 2.24 3,001-3,500 5 0.80 More than 3,500 15 2.40
Table 1 (Continued)
Expected expense is increased for
Even though age also influence on make-up interest, most of respondents were students which are similar to focus group, therefore, age could not be classified difference in this study.
The women and LGBT respondents were interested in facial skin makeup and lipstick while men were mainly interested in facial skin makeup. Lipsticks are important component for women in their daily grooming ritual and is considered by many as necessary addition to their face in order to feel presentable, comfortable and more confident. Considering the wide acceptance by society of lipstick as
Thitilertdecha et al BT42 Page 202
purchasing behavior
who had make-up expenses Frequency (N) Frequency (N) Purchasing frequency 1-2 times/month 466 83.51 3-4 times/month 70 12.55 > 4 times/month 22 3.94 Make-up expense/time (baht) < 500 241 43.19 500-1,000 237 42.47 1,001-1,500 50 8.96 1,501-2,000 17 3.05 > 2,000 13 2.33 Make-up expense/time (baht) < 500 241 43.19 500-1,000 237 42.47 1,001-1,500 50 8.96 1,501-2,000 17 3.05 > 2,000 13 2.33
Table 2 Respondents’ purchasing behavior on make-up products of respondents who had make-up expenses (N=558).
Respondents’
Respondents
Increase 451 80.82 No increase 107 19.18 Demand on make-up type in future* Decoration on facial skin 343 76.05 Decoration on lip 205 45.45 Decoration on eyelid 190 42.13 Decoration on eyebrows 117 25.94
Predication demand on purchasing make-up in future
make-up (baht) < 500 77 17.17 500-1,000 213 47.23 1,001-1,500 84 18.62 1,501-2,000 33 7.32 > 2,000 44 9.76
purchasing
Table 3
Respondents’ interest on make-up products.
Respondents’ interest in makeup products
Thitilertdecha et al BT42 Page 203
Respondents who had make-up expenses
Frequency (N) Percentage (%) Frequency (N) Percentage (%) No interest make-up - - 31 46.97 Interest make-up 558 100.00 35 53.03 Decoration on facial skin * 251 44.98 20 57.14 Foundation 148 58.96 13 65.00 Press powder 116 46.22 11 55.00 Concealer 95 37.85 9 45.00 Blusher 94 37.45 6 30.00 Make-up base 60 23.90 10 50.00 Others 25 9.96 2 10.00 Contour 21 8.37 4 20.00 Highlight 19 7.57 4 20.00 Shading 15 5.98 4 20.00 Bronzer 7 2.79 3 15.00 Decoration on eyebrows * 52 9.32 1 2.86 Eyebrow pencil 40 76.92 1 100.00 Eyebrow powder 21 40.38 -Eyebrow mascara 9 17.31 -Eyebrow gel 7 13.46 -Others 1 1.92 -Decoration on eyelid * 21 3.76 1 2.86 Eye shadow 18 85.71 1 100.00 Mascara 12 57.14 -Eyeliner 12 57.14 -Shimmer 5 23.81 -Inner eyeliner 4 19.05 -Glitter 3 14.28 -Others 2 9.52 -Decoration on lip * 234 41.94 13 37.14 Lipstick 176 75.21 7 53.85 Lip tint 124 52.99 6 46.15 Lip gloss 67 28.63 6 46.15 Others 20 8.55 4 30.77 Lip liner 1 0.43 - -
Respondents who had no make-up expenses
Table 3 (Continued)
Respondents’
Respondents
Thitilertdecha et al BT42 Page 204
interest in makeup products
who had make-up expenses
Frequency (N) Percentage (%) Frequency (N) Percentage (%) Brand’s level of product which are purchasing make-up Mass product 364 65.23 22 62.86 Masstige product 171 30.65 12 34.28 Prestige product 23 4.12 1 2.86 Channels for purchasing make-up Both online shop and cosmetic shop 304 54.48 19 54.29 Online shop 137 24.55 6 17.14 Cosmetic shop 117 20.97 10 28.57 Online platform for purchasing makeup* Shopee 327 74.15 15 42.86 Watsons 293 66.44 16 45.71 Lazada 142 32.20 9 25.71 Konvy 117 26.53 10 28.57 Others 47 10.66 1 2.86 Cosmetic shop for purchasing make-up* Department store 369 87.65 27 77.14 Cosmetic shop 221 52.49 21 60.00 Convenient store 118 28.03 6 17.14 Others 5 1.19 -Factors for purchasing make-up* Review from beauty blogger, influencer 394 70.61 17 48.57 Necessity 281 50.36 16 45.71 Discount 276 49.46 18 51.43 Promotion 232 41.58 13 37.14 Shipping free 180 32.26 12 34.28 New arrivals 62 11.11 2 5.71 Preference on presenter 33 5.91 3 8.57 Tester size of product 33 5.91 2 5.71 Cash on delivery 22 3.94 4 11.43 Limited edition 18 3.22 2 5.71 Others 6 1.08 1 2.86
Respondents who had no make-up expenses
*more than one answer can be chosen.
R1 respondents: respondents who had makeup expense; R2 respondents: respondents who had no makeup expense. part of the daily image, women’s perception of make-up is lipsticks (Ogilvie and Kristensen-Bach, 2001). In contrast, LGBTQ and men mostly preferred to purchase foundation that have been introduced into the men’s grooming category. For men, Thai teenagers and young adults are now promoted for grooming trends to be appear as age. Even though all genders usually purchased makeup with the frequency around 1-2 times per month, women and LGBT tended to have higher frequency in purchasing makeup products than men. However, it seemed like men was higher makeup expense per time than women and LQBT. These results were in accordance with makeup’s brand level that women and LQBT normally purchased mass level makeup products (68.64% and 61.91%, respectively) while men preferred both mass and masstige product (41.82% and 50.91%, respectively). Consumers of fast fashion as primarily women and fast fashion have business model relies on recurrent, trend-driven, impulsebuyingoflow-cost,mass-producedsuchasNivea,Sivanna,etc(Alexa et al.,2021).Incontrast, men purchase masstige product which mean the mass consumption of luxury goods product such as MAC, NARS, etc (Wang et al., 2022). Women and men buy luxury products for different reasons that men showed to be motivated by materialistic value, status value and conspicuous value, responding more positively to luxury brands loyalty programs than women (Vitoria et al., 2019). However, there are limited for men’s makeup products and brands in Thailand (Vechviboonsom, 2018)
Thitilertdecha et al BT42 Page 205
Purchasing behavior
Gender Age Status Occupation Income/month R2 respondents Interest in makeup type Chi-Square Asymp. Sig. 70.452 0.000* 2.850 0.827 2.802 0.246 5.618 0.345 6.463 0.487 Interest in makeup’s brand level Chi-Square Asymp. Sig. 10.561 0.005* 5.164 0.523 0.722 0.697 3.337 0.648 5.934 0.548 Purchasing channels Chi-Square Asymp. Sig. 9.899 0.007* 5.253 0.512 0.688 0.709 3.444 0.632 5.704 0.575 R1 respondents Interest in makeup type Chi-Square Asymp. Sig. 65.560 0.000* 25.506 0.000* 0.162 0.162 19.071 0.002* 15.081 0.350 Purchasing frequency Chi-Square Asymp. Sig. 42.476 0.000* 2.409 0.879 2.155 0.340 5.129 0.400 6.111 0.527 Make-up expense/time Chi-Square Asymp. Sig. 14.877 0.001* 25.301 0.000* 3.970 0.137 26.816 0.000* 50.051 0.000* Interest in makeup’s brand level Chi-Square Asymp. Sig. 6.033 0.049* 27.845 0.000* 7.666 0.022* 28.915 0.000* 48.427 0.000* Purchasing channels Chi-Square Asymp. Sig. 56.567 0.000* 27.845 0.033* 3.934 0.140 5.97 0.309 5.721 0.573 Prediction of demand on makeups Chi-Square Asymp. Sig. 106.785 0.000* 24.952 0.000* 6.050 0.049* 11.587 0.041* 17.399 0.015* Expected expense is increased for purchasing makeup Chi-Square Asymp. Sig. 70.119 0.000* 15.566 0.016* 3.166 0.205 6.375 0.271 12.065 0.098
Table 4 Relationship of respondents’ demographic characteristics and interest on make-up products.
and interest
Table 5 Relationship respondents’ demographic characteristics (gender) who were most interested in facial make-ups. Followed by *Significantly difference, **Chi-Square (�� < 0.05).
Respondents who had make-up expenses
For purchasing channel, both online platform and cosmetic shop still be important channel for selling makeup products. From the results, women and LGBT planned to purchase more makeup products per
Thitilertdecha et al BT42 Page 206
Respondents’ interest in makeup products Chi-square Asymp. Sig.
Men % Women (%) LGBTQ % Interest in make-up type 65.560 0.000* Facial skin product 76.36 40.23 50.79 eyebrows product 3.64 11.36 0 eyelid product 3.64 4.09 1.59 Lips product 16.36 44.32 47.62 Purchasing frequency 42.476 0.000* 1-2 times/month 89.09 82.95 82.54 3-4 times/month 9.09 12.96 12.70 > 4 times/month 1.82 4.09 4.76 Make-up expense/time (baht) 14.877 0.001* < 500 38.18 42.72 42.86 500-1,000 40.00 43.41 41.27 1,001-1,500 12.73 9.09 9.52 1,501-2,000 3.64 2.73 4.76 > 2,000 5.45 2.05 1.59 Interest in make-up’s brand level 6.033 0.049* Mass product 41.82 68.64 61.91 Masstige product 50.91 27.72 33.33 Prestige product 7.27 3.64 4.76 Purchasing channels 56.567 0.000* Online shop 30.91 23.41 26.99 Cosmetic shop 45.45 18.64 15.87 Both online shop and cosmetic shop 23.64 57.95 57.14 Predication demand on purchasing make-up in future 106.785 0.000* No increase 56.36 15.00 14.29 Increase 43.64 85.00 85.71 Expected expense is increased for purchasing make-up (baht) 70.119 0.000* < 500 29.17 16.31 16.67 500-1,000 41.67 47.59 48.15 1,001-1,500 8.33 19.52 16.67 1,501-2,000 12.50 7.22 5.55 >2,000 8.33 9.36 12.96
time from less than 500 baht to the range of 500-1,000 baht and possibly increase up to 1,500 baht. Online shopping is convenient approach for purchasing in comparison to traditional shopping (Vasic et al., 2019), however, in this survey many respondents still prefer both online and on-site purchasing channels. This might be due to the fact that product trial is necessary factor for purchasing decision. From previous survey from Garbarino and Strahilevitz (2004), most women are more displayed for shopping over the internet than men that purchase make-up via cosmetic shop. Women and LGBTQ have tendency to increase expense concern about facial attractiveness more than men which is one of the predictors of overall physical attractiveness and represent one of the primary factors influencing self-esteem, sociable, assertive, and extroverted (Korich et al., 2008; Korich et al., 2011).
4.Conclusion
The respondents purchasing behavior and their interest on make-up products were surveyed. Young adult women and LGBTQ are important key for the increment of revenue from lip products (lipstick) and skin facial product (foundation) which are mass products and suitable price range should be 500-1,000 bath. Both online shops, especially on shopee platform, and cosmetic shop (department store) were necessary selling channels. Contents from beauty bloggers also be an important influence on purchasing decision. Men cosmetics became interesting target for facial makeup as a new trend for cosmetic market in Thailand. This study demonstrates that lipsticks as well as foundation are popular until now and provides surveyed information of demands on make-up products to set marketing strategic plan for make-up products. However, it is needed more surveillance widely distributed in demographyintermsofoccupationandincometoobtainmoreinformationforstrategicmarketingplan.
5.Acknowledgements
We would like to thank the respondents who answered the questionnaire in this study.
6.References
Aguinaldo, R.E., & Peissig, J.J. (2021). Who’s behind the makeup? The effects of varying levels of cosmetics application on perceptions of facial attractiveness, competence, and sociosexuality. Frontiers in Psychology, 12, 661006. https://doi.org/10.3389/fpsyg.2021.661006.
Alexa,L.,Apetrei,A.,& Pîslaru,M.(2021).Fast fashion-Anindustryat intersectionofgreenmarketing with greenwashing. International Symposium “Technical Textiles – Present and Future”, 263268.
Choi, Y., Kim, S.E. & Lee, K. (2022). Changes in consumers’ awareness and interest in cosmetic products during the pandemic. Fashion and Textiles, 9(1), 1-19.
Garbarino, E., & Strahilevitz, M. (2004). Gender differences in the perceived risk of buying online and the effects of receiving a site recommendation. Journal of Business Research, 57(7), 768-775.
Gerstell, G., Marchessou, S., Schmidt, J., & Spagnuolo, E. (2020). How COVID-19 is changing the world of beauty, McKinsey&Company, 1-8.
Korich, R., Pelle-de-Queral, D., Gazano, G.& Aubert,A. (2008).Why women usemakeup: implication of psychological traits in makeup functions. Journal of Cosmetic Science, 59(2):127-37.
Korich, R., Pelle-de-Queral, D., Gazano, G. & Aubert, A. (2011). Relation between facial morphology, personality and the functions of facial make-up in women. International Journal of Cosmetic Science, 33(4):338-45.
Ogilvie, M. & Kristensen-Bach, P. (2001). Why Women Wear Lipsticks: Preliminary Findings. Edith Cowan University, 1-9.
Phaomanacharoen, C. (2019). Social Media Purchasing Behavior for Cosmetic of Consumers in Wattana Distric, Bangkok, วารสารวิชาการนวัตกรรมสื่อสารสังคม, 2(14), 17-31.
Scales, C.P., Benson L.P., Oesterle S., Hill G.K., Hawkins D. & Pashak, J.T. (2015). The dimensions of successful young adult development: A conceptual and measurement framework. Applied Developmental Science, 20(3), 150-174.
Thitilertdecha et al BT42 Page 207
Vechviboonsom,K.(2018). An Investigation of factors influencing the Adoption of makeup among male millennials in Bangkok master's thesis, Thammasat University.
http://ethesisarchive.library.tu.ac.th/thesis/2018/TU_2018_6002040233_10359_10000.pdf
Vasić, N., Kilibarda, M. & Kaurin, T. (2019). The Influence of Online Shopping Determinants on Customer Satisfaction in the Serbian Market. Journal of Theoretical and Applied Electronic Commerce Research, 14(2), 70-89.
Vitoria, M. (2019). How gender affect the buying-decision process among consumer of luxury goods. Global Fashion Management Conference at Paris.
Wang,Z., Yuan, R.,Luo,J.,& Liu,J.M.(2022).Redefining“masstige”luxuryconsumptioninthepostCOVID era. Journal of Business Research, 143, 239-254.
Thitilertdecha et al BT42 Page 208
*********************
Website design for facial skin type analysis
Narunan Wuttisin*, Rujiluksorn Phetwong and Amornpun Sarahong
School of Cosmetic Science, Mae Fah Luang University, Chiang Rai57100,Thailand
*Corresponding author. E-mail: wnarunan@mfu.ac.th
Abstract
Facial skin can be divided into 4 types: dry skin, oily skin, normal skin, and combination skin. It was classified by the characteristic of the skin. The objective of this study was to create a website for the classification of facial skin types and provided suggestions for taking care of each skin type. The website name “Skin analysis” was created and distributed (https://6031703038.wixsite.com/website) in January 2021. The volunteers lived in Chiang Rai ages ranging between 18-40 years. They were asked to evaluate their skin types by using a website and divided by the result of the website into 4 groups: the normal skin group (n=30), the oily skin group (n=30), the dry skin group (n=30), and the combination skin group (n=30). APM-100 was used for skin types measurement and the data was compared with skin website analysis. There were 19 volunteers (63.33%) classified in normal skin type, 29 volunteers (96.67%) classified in oily skin type, 25 volunteers (83.33%) classified in dry skin type, and 26 volunteers (86.67%) classified in combination skin type which were compatible with the website. The website was evaluated for website satisfaction. There were 515 evaluators ages ranging between 18-55 years assessed on the website. The satisfaction on the website such as convenience and ease to use, ease and understanding of questions, the benefit of website information, matching between test results and skin type, satisfaction, and the recommendation of the website were at an excellent level. In conclusion, the skin analysis website was useful for the classification of skin types and provided skin analysis that was compatible with the skin measurement device at 82.50%.
Keywords:APM-100; Skin analysis; Skin type; Website
1.Introduction
Facial skin can be divided into 4 types: dry skin, oily skin, normal skin, and combination skin (Piccioni et al.,2017). Dry skin has less sebum than normal skin. It is unable to retain moisture leading to flaky, harsh, crake, dry, and possibly to irritation (Moniaga et al., 2019). People with dry skin will experience a tightening skin sensation with dull skin and a lackof suppleness.Oily skin is a common problem that occurs when oversized sebaceous glands produce excessive amounts of sebum giving the appearance of shiny and greasy skin (Sakuma& Maibach, 2012). People with oily skin have large, visible pores, and their skin is more prone to acne and other forms of acne. Normal skin has good oil and water balance. The area of the forehead, nose, and chin (known as the T-zone) may be a bit oily, but overall sebum and moisture are balanced and the skin is neither too oily nor too dry. Normal skin has smooth, small pores, no skin issues, and the skin isnot sensitive. Combination skin is a combined more than one skin type, such as dry skin and oily skin (Indriyani & Sudarma, 2005). The facial sebum secretion was higher onT-zone than on both cheeks (Youn et al., 2005).
Nowadays, using facial care products is a daily routine for most people. Both different skin types including the skin condition can vary greatly during different periods of life. Many external and internal factors determine the condition of the skin. The external factors including weather, pollution, and medications, and the internal factor, such as stress and genetic factors, affect the level of oiliness sweat,
BT43 Page 209
Proceedingof Cosmetic & Beauty International Conference 2022 Future of the Next Beauty (CBIC 2022) 7th-9th December2022
and skin's natural moisture factor. Most people were not able to classify their facial skin types which lead to the problem of selecting the rightskin care products. The improper use of skin care products might be the reason for skin problems. Therefore, people should understand their facial skin types to avoid and solve the problems of their facial skin.

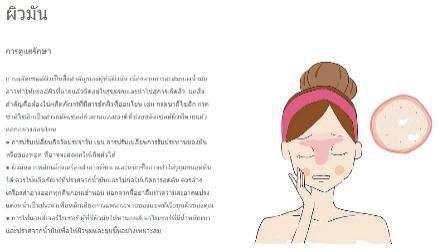
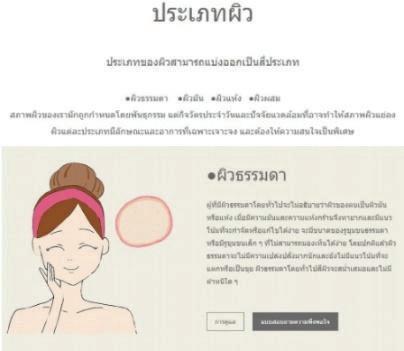
The APM-100 is a portable skin-measuring instrument that is based on microscope imaging methods equipped with a 30× magnification lens. The instrument looks like a phone connected with a 5-megapixelcamera, Bluetooth, and WI-FI as presented in Figure 1. APM-100 is able to assess moisture, elasticity, sebum, pore, dark spot, acne, wrinkle, and skin thickness.
(A)(B)
Figure 1 APM-100 measuring instrument (A) and sebum indicator patch (B)
The objective of this study was to create a website for facial skin analysis. This website was used for the classification of facial skin type and provided suggestions for taking care of each skin type. APM-100 skin measurement device was used for skin type measurement and the data was compared with skin website analysis. Skin website analysis may be helpful for those who want to know their facial skin type and skincare routine regimen.
2.Materials and Methods
2.1Website design

The skin characteristics and various facial skin problems were used as criteria for creating a skin analysis website as shownin Table 1. The website name “Skin analysis” (https://6031703038.wixsite.com/website) was created by Wix.com and distributed online in January 2021. The website was composed of 6 windows which were; a) ahome page, b) askin analysis test, c) askin type information, d) how to take of skin type, e) a satisfaction questionnaire, andf)acontact as shown in Figure 2.

Wuttisin et al. BT43 Page 210
(F)
(A)(B)(C) (D)(E)
Figure 2 Six windows in the skin analysis website
Table 1 Characteristic of each skin type
Appearance of the skin
Facial skin appearance during the day
Dry or irritate
T-zone is more oily than U-zone
Oily
Dry and tight
No skin issues
Pores around cheeks
Small Large
Pores around nose
Small
Large
Appearance of facial skin when touched
Rough
Smooth
The skin in the U-zone area is dry and peeling when exposed to cold temperature
Facial skin in the T-zone area is more oily than other areas after wake up
The skin is dry and tight after facial wash Yes No
The skin still dry and tight after moisturizer application Yes No
The skin is easily irritated by the weather change
Infrequent
Never felt
Makeup is easy to fall off during the day Yes No
Pores on the cheeks are smaller than the nose area
Smaller
Equally Large
After applying skin care products, the T-zone area turns oily faster than other areas Yes No
T-zone area tend to oily than other areas Yes No
Skin type
Normal Oily Dry Combination
Wuttisin et al. BT43 Page 211
Yes No
Yes No
2.2Study design
2.2.1 Comparison between skin analysis website and skin measurement device
2.2.1.1 Volunteer
One hundred and twenty healthy volunteers in Chiang Rai (aged 18-40 years) participated in this study. The volunteers were asked to evaluate their skin types by using website skin analysis followed by skin measurement with APM-100 from January to April 2021. Volunteers were divided by the result of a skin analysis website into four groups; the normal skin group (n=30), the oily skin group (n=30), the dry skin group (n=30), and the combination skin group (n=30). This study was approved by the Ethics in Human Research Committee of Mae Fah Lung University (No. EC 21012-17). All volunteers received information about the study and signed an informed consent sheet.
2.2.1.2 Facial skin preparation
Facial cleansing techniques were performed before skin measurement as following step;
Step 1. The volunteers lay on the bed in a comfortable position and covered with blankets up to chest level.
Step 2. The volunteers received facial cleansing by cleansing water, cleansing milk, and toner.
Step 3. The volunteers were rested in a room at a constant temperature of 25 °C for 20 min prior to skin monitoring.
2.2.1.3 Skin measurements
The APM-100 was used for skin sebum measurement at the forehead (mid-glabella), and cheek (the most prominent area of zygoma) (Youn et al., 2002). The measurement area was 0.9×1.2 rectangle centimeters according to the size of the sebum indicator patch.
2.2.2 Website evaluation
Everyone who used the skin analysis website was asked to evaluate the website's satisfaction. There were 515 respondents aged 18-55 years who evaluated the website. They were asked to answer the questionnaire which consists of assessment evaluations such as convenient and easy to use, easy and understandable questions, the usefulnessof website information,matching between test results and skin type, satisfaction, and recommendation of the website. The class intervals between the score were calculated as described by Okapanom & Wuttisin, (2016). Criteria for interpretation of the satisfaction level were divided into 5 levels as follows: excellent (4.21-5.00), good (3.41-4.20), moderate (2.613.40), fair (1.81-2.60), and poor (1.00-1.80).
2.3Data analysis
Descriptive statistical analyses to demonstrate the result as a percentage, arithmetic mean, and standard deviation were used for the comparisons of the result between the skin analysis website and the APM-100 measuring instrument.
3.Results and Discussion
3.1Sebum level on sebum indicator patch
The amount of sebum collected on the sebum indicator patch at the forehead and cheek was used to classify the skin type by using APM-100. An example of skin measurement was presented in Figure 3 andTable 2.The normal skin secretes sebum in small amounts which balanced, not excessive,or lacking (Indriyani & Sudarma, 2005). Oily skin secretes a high amount of sebum level leading to shiny, greasy looks accompanied by large pores (Sakuma& Maibach, 2012). Dry skin is characterized by a scaly, rough, cracked, and fissured surface caused by a reduction in water-holding capacity (Tominaga et al., 2007). Combination skin has differences in sebum secretion. High sebum-secreting normally presentedin T-zone (forehead, nose, and chin) while low sebum-secreting was at U-zone (both cheeks) (Youn et al., 2005). However, a sebum level of combination skin type on the U-zone may range from moderate, low tovery low level.
Wuttisin et al. BT43 Page 212
3.2Comparison of skin type between skin analysis website and APM-100 measurement
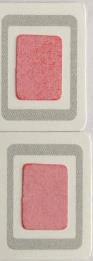
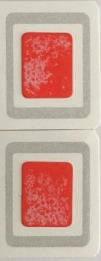
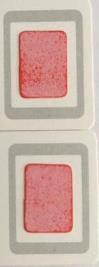
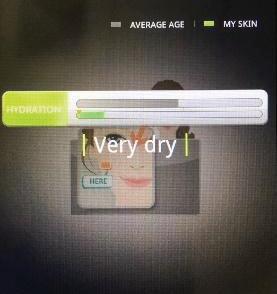
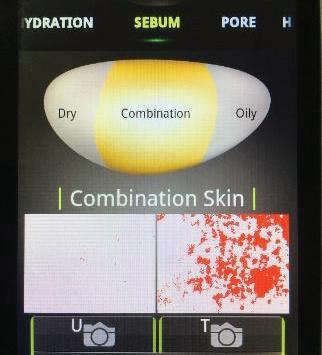
The result derived from skin analysis website and APM-100 were compared to find the compatible result between website analysis and skin measurement device. From APM-100 measurement, there were 19 volunteers (63.33%) classified in normal skin type, 29 volunteers (96.67%) classified in oily skin type, 25 volunteers (83.33%) classified in dry skin type, and 26 volunteers (86.67%)classified in combination skin type which were compatible with the website as shown in Figure 4.Asall of the 120 volunteers, there were 99 volunteers (82.50%) compatible with the website while 21 volunteers (17.50%) were not compatible with the website. Among 21 volunteers, 11 volunteers were classified by the website into the normal skin group but indicated into oily skin (4 volunteers), combination skin (4 volunteers), and dry skin (2 volunteers) by the APM-100 measurements. There was 1 volunteer
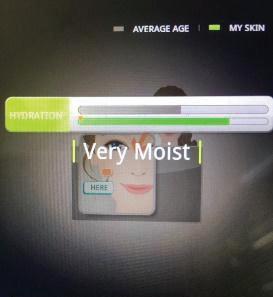
Wuttisin et al. BT43 Page 213 (A)(B)(C)
Figure 3 Example of skin type (A), sebum level at T-zone (B) and U-zone (C) indicated by APM-100
Skin types Sebum indicator patch Sebum level Normal skin typeForehead Cheek Low to moderate Low to moderate Oily skin type Forehead Cheek High High Dry skin type Forehead Cheek Very low Very low Combination skin type Forehead Cheek Moderate to high Low to moderate
Table 2 Example of skin type measurement by APM-100
classified by the website into the oily skin group but indicated into dry skin by the APM-100 measurement. There were 5 volunteers classified by the website into the dry skin group but indicated into normal skin (4 volunteers) and combination skin (1 volunteer) by the APM-100 measurement. In addition, 4 volunteers were classified by a website into combination skin groups but indicated into oily skin by the APM-100 measurement. From the comparison of skin type between the skin analysis website and APM-100 measurement, the normal skin was the most incompatible with the website the reasons might be due to normal skin has various characteristics that might be the same as other skin types and the classification contents used in the website might not comprehensive enough.However, this result is basedsolely on APM-100 measurements. In addition to the APM-100, there are other instruments used for skin measurement by different techniques. For example, Sebumeter ® is used for the classification of skin type as dry, normal, and oily based on sebum measurement (Pande & Misri, 2005). Corneometer® is used for subcutaneous moisture content measurement (Imhof & Xiao, 1998). And Tewameter® is used for the transepidermal water loss (TEWL) measurement to assess water flux out of the skin (Imhof & Xiao, 1998). Theseinstruments were recommended for use to compare the skin type with our website.
3.3 Result of skin type determine from skin analysis website
There were 515 respondents who used the skin analysis website the result was presented in Table 3.From the website, 118 people (22.91%) classified as normal skin type, 114 people (22.14%) classified as oily skin type, 104 people (20.19%) classified as dryskin type, and 179 people (34.76%) classified as combination skin type.
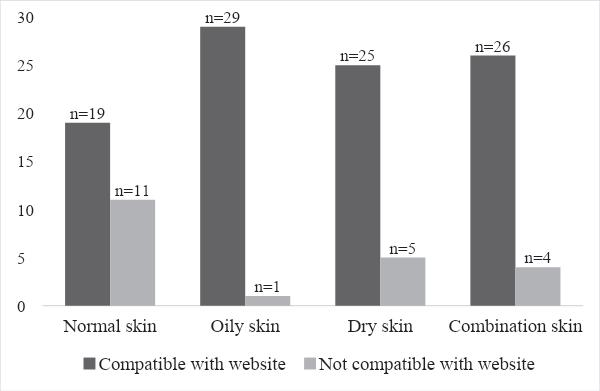
Table 3 Skin type determine from skin analysis website
3.4 Satisfaction test
The satisfaction of the volunteers on using the skin analysis website was presented in Table 4. The volunteers felt that the website was convenient and easy to use, the questions were easy to understand,
Wuttisin et al. BT43 Page 214
Figure 4 Comparison of skin type between skin analysis website and APM-100 measurement
Skin type Number of user Percent Normal skin 118 22.91% Oily skin 114 22.14% Dry skin 104 20.19% Combination skin 179 34.76%
the information on the website wasuseful, and the results of the test wereconsistent with their skin type. Overall satisfaction with the skin analysis website was at an excellent level.
Table 4 Satisfaction of using skin analysis website
4.Conclusion
Skin analysis website was useful for the classification of skin types. The website provided skin analysis which is compatible with the skin measurement device at 82.50%. The website was easy to use and also provided benefits information and suggestion for taking care of each skin type properly.
5.Acknowledgements
This study was supported by the School of Cosmetic Science, Mae Fah Luang University. The authors also are grateful to thank volunteers for cooperating in this study.
6.References
Imhof, R.E. & Xiao, P. (1998).Optothermal measurement of water distribution within the stratum corneum. Current Problems in Dermatology, 26, 48-60.
Indriyani, I. & Sudrama, M., (2005). Classification of facial skin type using discrete wavelet transform, contrast, local binary pattern and support vector machine. Journal ofTheoretical and Applied Information Technology, 98(5), 768-779.
Moniaga, C.S., Tominaga, M. & Takamori, K. (2019). Mechanisms and management of itch in dry skin. Acta Dermato-Venereologica, 2020, 9-20.
Okapanom, W. & Wuttisin, N. (2016). Efficacy of eye gel containing strawberry extract (special project, Mae Fah Luang University).
Pande, S.Y. & Misri, R. (2005). Sebumeter . Indian Journal of Dermatology, Venereology and Leprology,71, 444-446.
Piccioni, A., García-Rodrigo1, C.G., Pellegrini, C., Mazzocchetti, G. & Fargnoli, M.C. (2017). Improving skin aging, skin hydration and sensitive skin with four specific skin care products: results from a single-centre, observational, prospective study. Journal of Cosmetics, Dermatological Sciences and Applications ,7, 48-56.
Sakuma, T.H. & Maibach, H.I. (2012). Oily skin: an overview. Skin Pharmacology and Physiology, 25, 227
235.
Tominaga, M., Ozawa, S., Tengara, S., Ogawa, H. & Takamori, K. (2007). Intraepidermal nerve fibers increase in dry skin of acetone-treated mice. Journal of Dermatological Science , 48. 103–111.
Youn, S.W., Kim, S.J., Hwang, I.A. & Park, K.C. (2002). Evaluation of facial skin type by sebum secretion: discrepancies between subjective descriptions and sebum secretion. Skin Research and Technology, 8,168-172.
Youn, S.W., Na, J.I., Choi, S.Y., Huh, C.H. & Park, K.C. (2005). Regional and seasonal variations in facial sebum secretions: a proposal for the definition of combination skin type. Skin Research and Technology, 11, 189-195.
Wuttisin et al. BT43 Page 215
Satisfaction Used of skin analysis website Mean±SD Level Convenient and easy to use 4.43±0.78 Excellent Easy and understandable of questions 4.61±0.64 Excellent Usefulnessof website information 4.67±0.59 Excellent Matching between test results and skin type 4.62±0.71 Excellent Satisfaction and the recommendation of the website 4.70±0.59 Excellent Values are expressed in Mean±SD
–
Set up a website for cosmetic products consultant and products selection
Narunan Wuttisin* , Nway Yu Hnin, Aratchporn Indharatanee and Natchaya Wicheanchay
School of Cosmetic Science, Mae Fah Luang University, Chiang Rai 57100, Thailand *Corresponding author. E-mail: wnarunan@mfu.ac.th
Abstract
The objective of this study was to create a website for providing cosmetic products consultants that help consumers to choose the products. The purchasing behavior of cosmetic products was surveyed from March to April 2021. The questionnaire was constructed via Google forms and then distributed online. There were 401 respondents who completed an online questionnaire. Most people were interested in facial care products (75.06%). Then, the website for facial care products consultant and products recommendation was created byusing Vue.js andthe website name “V project” was distributed online (https://cosmeticprojectmfu.web.app/) for trial and asked about website satisfaction from March to April 2022. In the trial, there were 1,113 participants who responded to the questionnaire. Most of them were women (69.36%) and more than half of them were 21 to 24 years old (67.30%). The comparison of the results of each individual's skin type before and after using the website found that the results from the website are compatible with participants' thoughts (72.78%). The website was evaluated for website satisfaction. The result found that the website was convenient and easy to use with understandable questions, and the information was useful. The website was useful for the classification of skin types and provided product recommendations that are suitable for their skin type. The participants rated the website overall at an excellent level. In conclusion, the website was helping participants for choosing facial care products (97.93%) and the recommendations are suitable for their skin type (97.39%).
Keywords: Consultant; Facial care product; Online; Skin type; Website
1. Introduction
At the beginning of 2020, with the epidemic of COVID-19, most of the beauty industry was forced to shut down and sales of the beauty industry dropped dramatically. But on the other hand, the response to the COVID-19 situation in the beauty industry is positive. Because various brands changed their own manufacturing line in response to the COVID-19 situation or the production of products to prevent germs such as hand sanitizer, hand gel, and various cleaning agents. There are also promotions to increase the sales of the products as well.
The cosmetic industry is becoming very popular in the current market even though the situation of COVID-19 has not been resolved. The researcher showed that the growth of the cosmetic market will continually grow from this year until 2022 with an expected to grow of 4%, and it will grow by 5% in 2023. The cosmetic market will gradually return to growth because the behaviors of consumers see makeup as a fashion (Narla et al., 2021). According to Euromonitor data, it was found that the skin care group still holds the number one market share with 42%, followed by hair products (15%), body cleansing products (14%), cosmetics (12%), oral care products (12%) and deodorant (5%). When focusingontheskincareproduct group.It isdividedintofacialcareproducts(81%),bodycareproducts (12%), sun protection products (6%), and lip products (1%) (Angus & Westbrook, 2019).
BT44 Page 216 Proceeding of Cosmetic & Beauty International Conference 2022 Future of the Next Beauty (CBIC 2022) 7th-9th December 2022
Before the COVID-19 pandemic, 70% of beauty purchases involved a visit to an offline store. During the COVID-19 pandemic, people are not comfortable going out. The purchase of products and access to services were more difficult. Many department stores were temporarily closed and people were changing their behavior to online shopping. The use of technology to facilitate the purchase of various products during the pandemic of the disease is another option (Gu et al., 2021).
Therefore, this research aims to survey the purchasing behavior of cosmetic products by using online questionnaires. The questionnaire asked about the types of cosmetic products that consumers are most interested in. Then, a website about the types of cosmetic products that consumers are most interested in was created. After that, the websites are distributed online for trial. The satisfaction after using the website was surveyed for website evaluation and improvement.
2. Materials and Methods
This study was divided into 3 parts; Part 1: a survey on purchasing behavior of cosmetic products in order to know the needs of consumers, Part 2: create a website for providing cosmetic products consultants to recommend the use of the product, and Part 3: a survey of consumer satisfaction from using the website.
This study was approvedby the Ethicsin Human ResearchCommitteeof MaeFah Lung University (No. EC 22050- 17). All volunteers received information about the study and signed in a questionnaire for providing truthful information.
2.1 Survey on purchasing behavior of cosmetic products
The questionnaire was created by using google forms and distributed the link (https://forms.gle/L6SxUiyctkFMxP2y9) online from March 2022 to April 2022.The population of this study was Thai people who were using the internet. The questionnaire is composed of 3 parts;
Part 1: The general information of participants such as sex, age, occupation, and salary.
Part 2: The type of cosmetic product that participants are most interested in such as hair care products, facial care products, body care products, oral care products, and deodorant products.
Part 3: The behavior of participants such as channels for purchasing cosmetic products, frequency of purchasing cosmetic products, factors affecting the purchase of cosmetic products, what channels participants receive news about cosmetic products, the price of cosmetic products, which channel participants received advice on cosmetic products and the interest in a website that helps participants buy cosmetic products.
2.2 Website design
The results from the survey on the purchasing behavior of cosmetic products showed that most people are interested in facial care products. So, we created the website by using Vue.js. Our website is named V project and distributed via the link (https://cosmeticprojectmfu.web.app/).
An example of our website was presented in Figure 1. The website is composed of 4 parts:
Part 1: General information of participants such as name, age, and sex as shown in Figure 1(A).
Part 2: The questions to determine the skin type. The participants’ skin type was determined by using a series of questions such as what do you think your skin looks like? Is your face’s T zone oily? After washing your face with facial cleanser, what does your skin feel like? If you don't apply a moisturizer on your face, do you feel that your skin is dry and tight? When the air is dry, how does your skin feel when you do not apply a moisturizer? After applying a moisturizer for 2-3 hours, what does the skin on your cheeks look like? After applying a foundation without powder on your face for 2 hours, what does the skin look like? Do you have blackheads or whiteheads? The examples of questions were shown in Figure 1(B). Each question had a score. The total score was calculated and used to classify the skin type. The criteria for interpretation of the skin type were presented in Table 1.
Part 3: The results of skin type from the website. Our website divided the skin into 8 types such as dryskin,dryskinandtendencytoirritate,normalskin,normalskinandtendencytoirritate,combination skin,combinationskinandtendencytoirritate,oilyskin,oilyskin,andtendencytoirritate.Theexample of the result presented to participants was shown in Figure 1(C).
Part4: Therecommendedproduct.Theguidelineforrecommendationsofsuitableproductsforeach
Wuttisin et al. BT44 Page 217
skin type was presented. An example of the recommended product was showed in Figure 1(D) and Figure 1(E)
2.3 A survey of user's satisfaction of websites
The satisfaction after using the website was surveyed for website evaluation and improvement. The onlinequestionnaire(https://forms.gle/ageWQn2FjL41fha98)wasusedtosurveytheuser’ssatisfaction with the website.
The questionnaire is composed of 4 parts:
Part 1: General information about participants such as name, age, and sex

Part 2: The questions about participants' skin type, results of the skin from the website, the information about the recommended products, and the usefulness of the website.
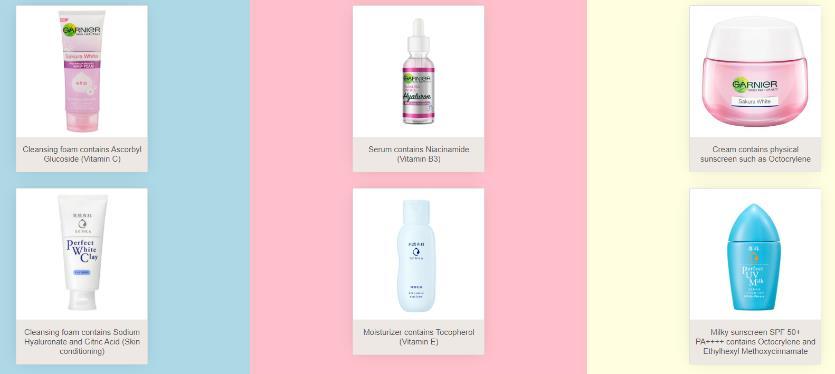
Part 3: The satisfaction of the website. Everyone who used the website was asked to evaluate the website's satisfaction. They were asked to answer the questionnaire which consists of assessment evaluations such as easy to use, understandable, usefulness of website information, matching between test results and skin type, satisfaction, and recommendationof the website. The class intervalsbetween the scores were calculated as described by Okapanom & Wuttisin, (2016). Criteria for interpretation of the satisfaction level were divided into 5 levels as follows: excellent (4.21-5.00), good (3.41-4.20), moderate (2.61- 3.40), fair (1.81-2.60), and poor (1.00-1.80).

Wuttisin et al. BT44 Page 218
Item Score Dry skin 8-13 Normal skin 14-23 Combination skin 24-29 Oily skin Over 29 Non irritated 13-31 Irritated Over 31
Table 1 The criteria for interpretation of the skin type
(A) (B) (C)
(D)
(E)
Figure 1 Home page (A), a question about the skin type (B), the result of the skin type (C), skin appearance (D), product recommend (E)
Part 4: The product recommendation section after using the website such as the recommended products are suitable for their skin type, and the recommended products helped with choosing the cosmetic product.
2.4 Data analysis
Descriptive statistical analyses were used to demonstrate the result as a percentage, arithmetic mean, and standard deviation.
3.Results and Discussion
3.1 A survey on purchasing behavior of cosmetic products in order to know the needs of consumers
The general information of the participants in the survey is shown in Table 2. There were 401 participants who responded to the survey. More than half of them were women (81.30%). Most of the participants were in the agerange of 21to 30 years old (50.12%). Most of the participants were students (86.03%) who had a salary range of fewer than 18,000 baht (85.04%).
Table 2 The general information of participants (N=401)
Type of cosmetic product that participants are most interested in are shown in Table 3. It was found that most of them were interested in facial skin care products (75.06%). Anti-pollution and anti-acne products were the most interesting for participants (34.88%) and nowadays, younger consumers or Gen Zciteacneastheirnumberoneskinconcern(Herich,2019).Thebehaviorsofparticipantsinpurchasing cosmetic products are shown in Table 4. It was found that participants were most likely to purchase cosmetic products from online shops (44.14%) which was the same result as the research about online shopping during the COVID-19 pandemic (Erjavec & Manfreda, 2022). They were purchased 2 to 3 times per month (36.66%). The quality of the product was the main factor in purchasing products (85.79%). Most of the participants received news about cosmetic products from Instagram (64.84%). The price that the participants were satisfied to purchase was 201 to 300 baht (33.67%). Most of the participants received advice about the cosmetic product from recommendations or product reviews (59.10%). Most of the participants were interested in media that could help them in their future purchases of cosmetic products (92.27%).
Wuttisin et al. BT44 Page 219
Item Count Percentage (%) Gender Female 326 81.30 Male 41 10.22 LGBTQI+ 34 8.48 Age (years old) Less than 20 164 40.90 21-30 201 50.12 31-40 25 6.23 41-50 11 2.74 Occupation Student 345 86.03 Office worker 43 10.72 Government officer 8 2.00 Personal business 5 1.25 Salary <18,000 baht 341 85.04 18,001-25,000 baht 25 6.23 25,001-32,000 baht 13 3.24 32,001-45,000 baht 8 2.00 >45,000 baht 14 3.49
Wuttisin et al. BT44 Page 220
Item Count Percentage (%) Type of cosmetic product Facial 301 75.06 Body 39 9.73 Hair 38 9.48 Deodorant 16 3.99 Oral 7 1.75 Type of hair care Anti-hair loss 15 39.47 Conditioner/Treatment 10 26.32 Anti-hair damage 7 18.42 Shampoo 5 13.16 Hair dye 1 2.63 Type of facial care Anti-pollution/Anti-acne 105 34.88 Moisturizer 60 19.93 Whitening 51 16.94 Cleansing/Toner 34 11.30 Sunscreen 34 11.30 Anti-aging 17 5.65 Type of Skin care Lotion/serum 19 48.72 Whitening 8 20.51 Soap/Shower cream 8 20.51 Scrub/Mask 4 10.26 Type of oral care Toothpaste 3 42.86 Mouth deodorant 3 42.86 Mouthwash 1 14.29 Type of deodorant Roll-on 9 56.25 Perfume 7 43.75
Table 3 Cosmetic products that participants are interested
Item Count Percentage (%) Channel to purchase Online shop 177 44.14 Department store 175 43.64 Convenience store 35 8.73 Retail store 14 3.49 Frequency of purchase 2-3 times/month 147 36.66 1 time/month 146 36.41 1 time/2 months 60 14.96 More than 3 months/time 48 11.97 Factor to purchase* Quality 344 85.79 Price 273 68.08 Promotion Recommendation from others Convenient to purchase Packaging 225 223 106 81 56.11 55.61 26.43 20.20
Table 4 The behavior of participants
*The participants were answered more than one
3.2 A survey of user's satisfaction of website
The satisfaction questionnaire was provided by Google Forms. The general information of the participants who used the website is shown in Table 5. There were 1,113 participants who used the website and responded to the questionnaire. Most of the participants were women (69.36%) and more than half of the participants are 21 to 24 years old (67.30%).
The results of the website user’s satisfaction rating are shown in Table 6. The participants rated overall the website as excellent level which is easy to use (4.96±0.20), the questions are easy and understandable (4.93±0.27), the usefulness of website information (4.94±0.28), matching between results and skin type (4.81±0.45), and satisfaction of the website (4.93±0.31). Participants answered that the recommended products on the website are suitable for their skin type (97.39%) and the recommended products helped for choosing the cosmetic product in the future (97.93%) (Table 7)
Wuttisin et al. BT44 Page 221
Item Count Percentage (%) Channel to receive news* Instagram 260 64.84 YouTube 238 59.35 Twitter 193 48.13 Facebook 168 41.90 Word of mouth 166 41.40 Advertisement 65 16.21 Product expo 36 8.98 Price to purchase <100 baht 22 5.49 101-200 baht 81 20.20 201-300 baht 135 33.67 301-400 baht 60 14.96 401-500 baht 41 10.22 >500 baht 62 15.46 Channel to received advice Review 237 59.10 Product label 81 20.20 Doctor 33 8.23 Seller 30 7.48 Advertisement 20 4.99 Media helps to buy cosmetic products Interested 370 92.27 Not interested 31 7.73
Table 4 The behavior of participants (Cont.)
Item Count Percentage (%) Gender Female 772 69.36 Male 258 23.18 LGBTQI+ 83 7.46 Age (years old) 20 or below 306 27.49 21-24 749 67.30 25-28 54 4.85 30 or above 4 0.36
Table 5 General information of participants who used the website (N=1,113)
Table 6 Satisfaction of using the website
3.3 Compared the result
Skin types form the website of facial products consultant was used to compare to find the compatible result between before and after using the website. From the result before using the website, there were 312 participants (28.03%) thought that their skin classified as normal skin type, 270 participants (24.26%) classified in combination skin type, 187 participants (16.80%) classified in oily skin type, 178 participants (15.99%) classified in dry skin type, 67 participants (6.02%) classified in normal and irritated skin type, 57 participants (5.12%) classified in combination and irritated skin type, 29 participants (2.61%) classified in oily and irritated skin type, and 13 participants (1.17%) classified in dry and irritated skin type as shown in Figure 2. From the result after using the website, there were 285 participants (25.61%) classified in normal skin type, 235 participants (21.11%) classified in combination skin type, 154 participants (13.84%) classified in dry skin type, 129 participants (11.59%) classified in normal and irritated skin type, 113 participants (10.15%) classified in combination and irritated skintype, 96participants(8.63%) classifiedinoilyskintype,56 participants(5.03%)classified in oily and irritated skin type, and 45 participants (4.04%) classified in dry and irritated skin type as shown in Figure 2. From the overall results, it was indicated that the results from the website are compatible with the participants’ thoughts (72.78%) and not compatible (27.22%).
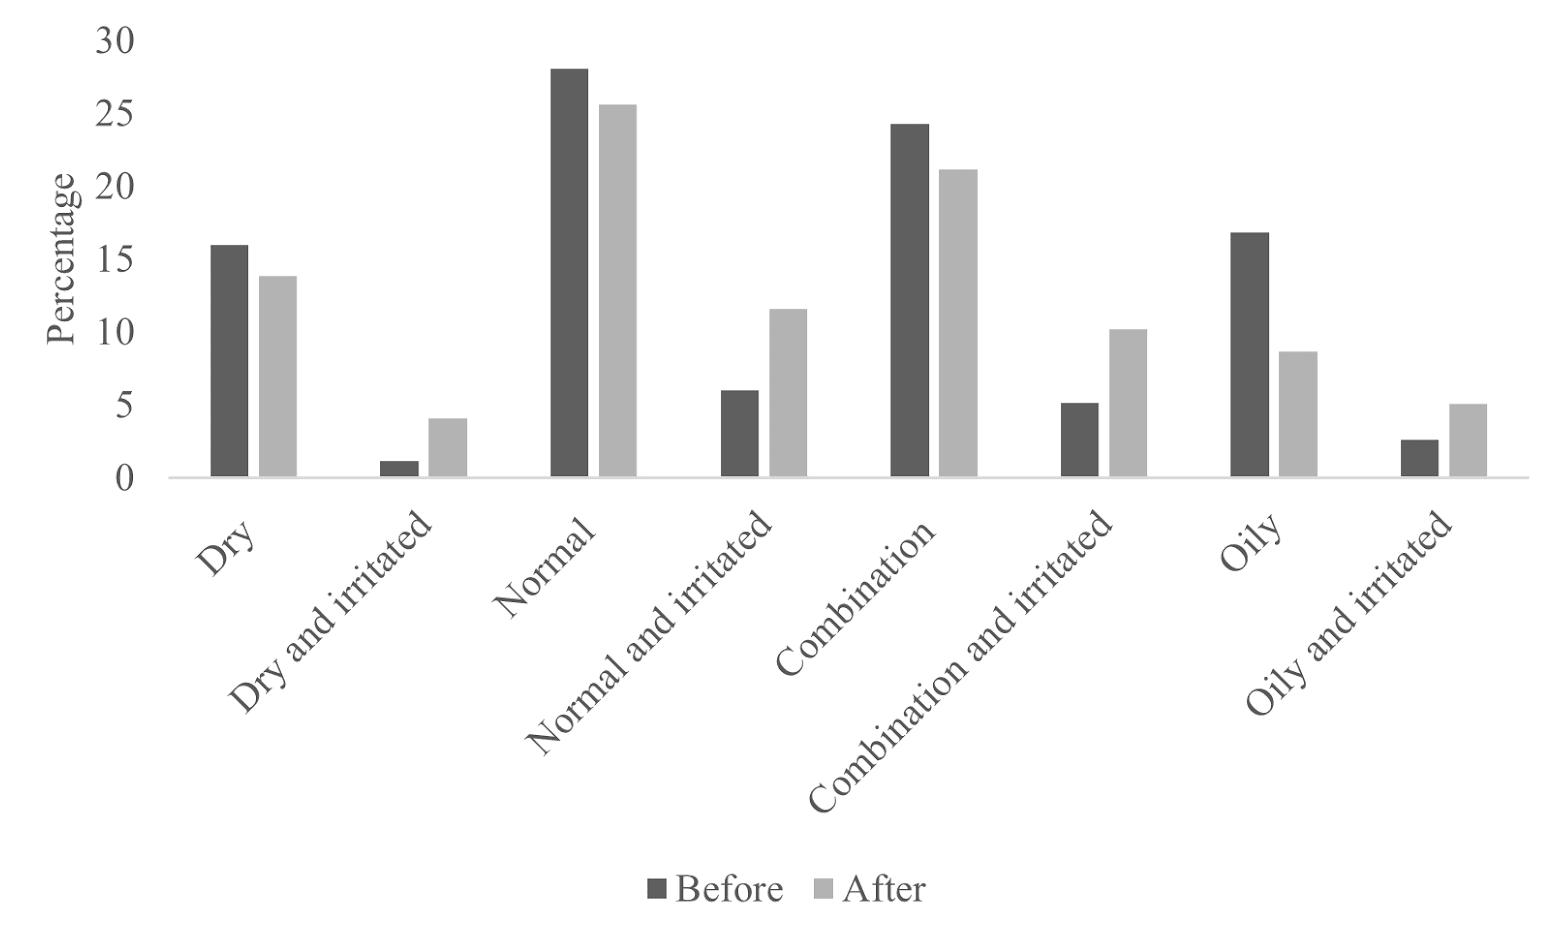
Wuttisin et al. BT44 Page 222
Factor Used of skin analysis website Mean±SD Satisfaction level Easy to use 4.96±0.20 Excellent Usefulness 4.94±0.28 Excellent Understandable of questions 4.93±0.27 Excellent Satisfaction of the website 4.93±0.31 Excellent Matching between results and skin type 4.81±0.45 Excellent
Item Yes No I’m not sure Suitable for skin type 97.39 0.27 2.34 Help for choosing the cosmetic product 97.93 0.18 1.89
Table 7 Percentage of participants who rate the benefit of the website
Figure 2 Comparison of the percentage of each individual's skin type before and after using the website
The website for facial care products consultants and products recommendation was created to help people by suggesting how to select suitable facial skin care products. Different skin care products need to be used based on different skin types. In order to determine the skin type, people need to have knowledge about the combination ofskinconditions. Thus, this can cause difficulty for common people to analyze their skin type if they have limited skin knowledge (Noor et al., 2018) The skin type can be determined based on several factors such as gender, age, sleeping time, and skin conditions (Kim et al., 2017). As for a solution, the website was created by using a series of knowledge-based questions to determine skin type. The user answered the questions and the score was processed by the website to determine the skin type. After the skin type determination process is finished, the website provided knowledge about skin type and product recommendations with suitable chemical ingredients. However, the website still need to test for the reliability and consistency for further improvement.
4.Conclusion
Most people are interested in facial care products. Then, the website about facial care products was set up to help consumers for choosing the products that are suitable for each skin type. The participants rated the website overall at an excellent level. The website was easy to use, provided benefits information and it was helping the participants to purchase cosmetic products in the future.
5.Acknowledgements
The authors are grateful to the Program of Beauty Technology, School of Cosmetic Science, Mae Fah Luang University for supporting all facilities for this work.
6.References
Angus, A., & Westbrook, G. (2019). Top 10 global consumer trends. Euromonitor International: London, UK
Erjavec, J. & Manfreda, A. (2022). Online shopping adoption during COVID-19 and social isolation: Extendingthe UTAUT model with herd behavior. Journal of Retailing and Consumer Services, 10.1016/j.jretconser.2021.102867
Kim, M. H., Kim, E. J., Kang, B. Y., & Lee, H. K. (2017). The effects of sleep deprivation on the biophysical properties of facial skin Journal of Cosmetics, Dermatological Sciences and Applications, 7, 34-47.
Gu, S., Ślusarczyk, B., Hajizada, S., Kovalyova, I., & Sakhbieva, A. (2021). Impact of the COVID-19 pandemic on online consumer purchasing behavior. Journal of Theoretical and Applied Electronic Commerce Research, 16(6), 2263-2281.
Herich, D. (2019). What consumers want from skincare. Retrieved June, 2022, from https://www.gcimagazine.com/brands-products/skin-care/article/21848792/what-consumerswant-from-skin-care.
Narla, S., Watchmaker, J., Ozog, D. M., & Rohrer, T. E. (2021). Cosmetic practices in the COVID-19 ERA. Advances in Cosmetic Surgery, 4(1), 109-121.
Noor, N. M., Muhamad, N. J., Sahabudin, N. A., & Mustafa, Z. (2018). Development of skin care routine support system. Journal of Computational and Theoretical Nanoscience, 24(10), 78307833
Okapanom,W.&Wuttisin,N.(2016).Efficacyofeyegelcontainingstrawberryextract(specialproject, Mae Fah Luang University).
Wuttisin et al. BT44 Page 223
*********************
ExhibitionSponsorship
SponsorsList
Workshopsponsorship


AdvertisementintheOfficialConferenceProgramBook
InsertsinConferenceBags