FULL PAPER FULL PAPER
Abstract of Cosmetic and Beauty International Conference (CBIC) 2025 & International Conference on Integrative Medicine (ICIM) 2025 16th-17th January 2025
Development of color shade for beauty salon service
Nachanok Saesong, Rattikan Saelee, Panitita Watthanawech* and Tinnakorn Theansungnoen
School of Cosmetic Science, Mae Fah Luang University, Chiang Rai 57100, Thailand *Corresponding author. E-mail: Panitita.wat@mfu.ac.th
ABSTRACT
Introduction: The hair appearance of an individual is an important indicator of hair quality and style that is usually used to express their personality and beauty. Hair salons have gained more interest from clients to increase their hair appearance especially hair coloring. Although hair coloring products have many different shades in cosmetic markets, the current trends of the color shades of the products have been investigated.
Method: For this research, there was designed a questionnaire survey to obtain general information and the hair color preferences. The online survey conducted through various social media platforms. Next, the hair dyes were created according to the most favorite shades and test colors on bunches of human hair after bleaching. The dyed hairs were observed the morphological appearances by scanning electron microscopy (SEM). At last, study the relationship between ages and genders that effect to satisfaction of dyed formulation was performed and calculate with Linkert scale.
Result: Out of 155 participants, 104 (67.1%) were female, 32 (20.6%) male, and 19 (12.3%) identified as LGBTQ. The main reason for coloring hair among most participants indicate to trydye color with their hair (92 students (59.4%). There is a total of 7 new shade were designed according to the color popularity from the participants. In the LGBTQ group, satisfaction with F2 was the highest compared to other colors. Satisfaction with colors F1-F7 showed no significant difference within any age group.
Conclusion: This study aims to study and develop new shades for hair coloring services in beauty salons to increase the shade for increase the satisfaction in fashionable of customers. Besides, research focus on only young people because the adolescent aim to get hair coloring for their emotional self -esteem, fashion and attractiveness. Moreover, the relationship between gender and formulated hair colors were considered, LGBTQ individuals showed the highest satisfaction with shade F2, suggesting that this shade has potential for further development in beauty salon services.
Keywords: Beauty salon services; Color trends; Hair coloring; Satisfaction survey
1. Introduction
Thehairappearanceofanindividual isanimportantindicatorofhairqualityandstylethat isusually used to express their personality and beauty. Hair salons have gained more interest from clients to increase their hair appearance because consumers who choose salon hair color over home hair color realize the salon does a much better job and doing it at home is too much of a hassle. For clients aged 18 to 34, it is recognized as the most important factor in choosing a salon. The cost of coloring services is highly important to this group. The research suggests that people see color as really important, like an essential add-on to their style. They frequently change colors can be improve their self-esteem issue
(Lindsey Metrus, 2022). Clients of hair coloring in salon are men (21%) and women (79%). 33% of women started coloring their hair by the age of 18. Approximately 87% of women change their hair color at least once a year. This statistic shows the growing trend of men experimenting with hair color and highlightsthe importance of salons offeringhair coloringservices to both men and women (Gitnux, 2023).
Based on gender, the hair salon services market is categorized into male and female segments. The female segment held a market share of over 68% in 2022. The influence of social media and beauty influencers is a major factor driving the female segment in the market. Beauty influencers showcase trendy hairstyles, colors, and treatments on platforms, such as Instagram & TikTok, inspiring women to try these looks at salons (Global Market Insights, 2023).
Hair color is determined by melanin, a pigment produced by melanocytes in the skin's upper layer. Melanin comes in two forms: eumelanin (dark) and pheomelanin (light), blending to create various hair shades. It's a prominent feature of human appearance, often influencing perceptions of attractiveness and personality. However, hair color also changed from other factors such as hormone, age including climate, pollution and toxin and chemical senses. (Yrprincess, 2015). The various shades of coloring products have been developed based on the needs of different groups of customers. The previous study reported on the coloring product preferences of customers of different ages. For teenager (19-29), the majority ought blondes (47%) in considered to the attractiveness. For adults (30-39), the majority preferred brunette hair. they prefer to brunette hair but still considering in hair colors are the safest. For the middle aged (40-49), the majority thought blonde hair (55%) because they are trying to reduce their age or show off their golden years. Thus, the blonde is back on top for this group because the color makes them comfortable in their own skin. For the almost-seniors (50-59) and the old (60 years and older), the majority preferred brunette hair because this color never goes out of style. Most of the participant make hair color as the principal reason to look younger and normally using a synthetic hair dye (Gupta, 2018).
Although the preference in hair coloring products depend on the range of age. Moreover, there are many different shades in cosmetic markets However, this study aims to study and develop new shades for hair coloring services in beauty salons to increase the shade for increase the satisfaction in fashionable of customers Besides, we focus on only young people because the adolescent aim to get hair coloring for their emotional self -esteem, fashion and attractiveness.
2. Materials and Methods
2.1 Study design
A questionnaire survey to obtain general information and the hair color preferences of participants was conducted. New hair color formulations were created according to the most favorite shades and dyed on bunches of human hair. The dyed hairs were captured and their morphological appearances were observed by scanning electron microscopy (SEM). Moreover, there were considered to the relationship between age and genders that effect to satisfaction survey was performed. This research was carried out between March and April 2024. The questionnaires in this study were approved by the Research Ethics Committee of Mae Fah Luang University EC 24031-17.
2.2 Participants
Male andfemalestudents who are studyingat the bachelor’s degree level at a universityin Thailand were targeted to measure the popularityof color shadesin hair dyesas atotal of 155people participated Besides, a questionnaire survey measuring satisfaction with the color shades had 164 participants. The online survey conducted through various social media platforms such as Line, Facebook, Instagram, and distributing questionnaires at different locations like the D1 and E2 cafeterias at Mae Fah Luang University.
2.3 Methodology
2.3.1 Collection of general information and the hair color preferences of participants
The questionnaire was composed of 15 questions and a list of 21 colors of hair coloring was presented in a questionnaire. The questionnaire asked for general information including gender, age, year of study, university, faculty, income, frequency of hair coloring, reasons for coloring hair, and hair color preferences.
2.3.2 Hair color formulation and hair dyeing step
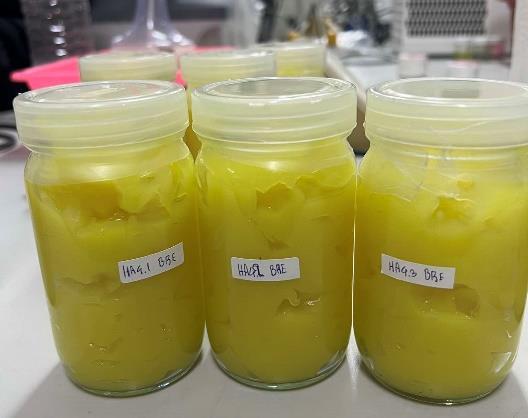
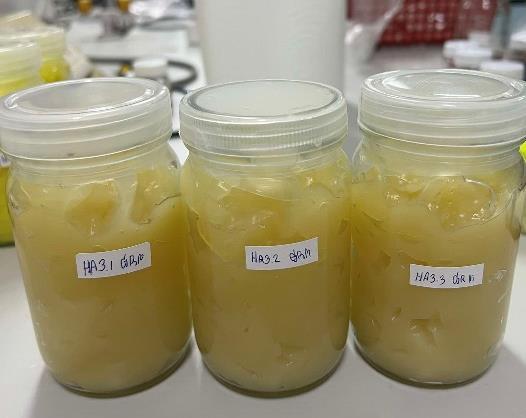
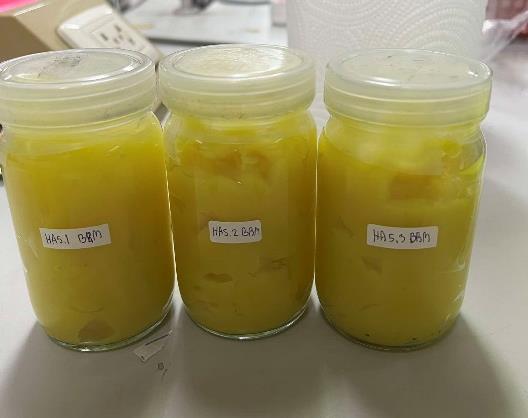
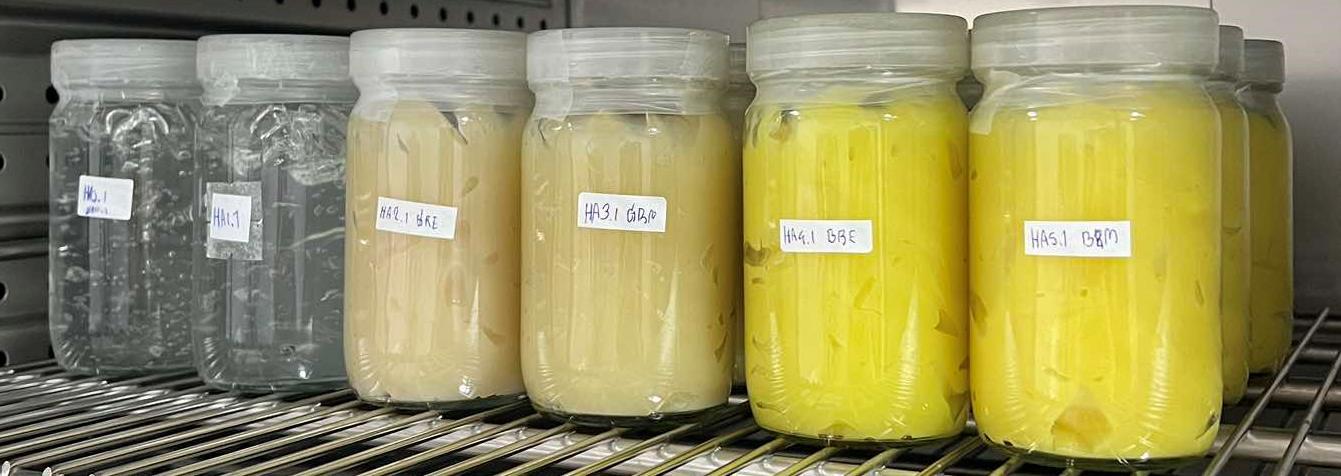
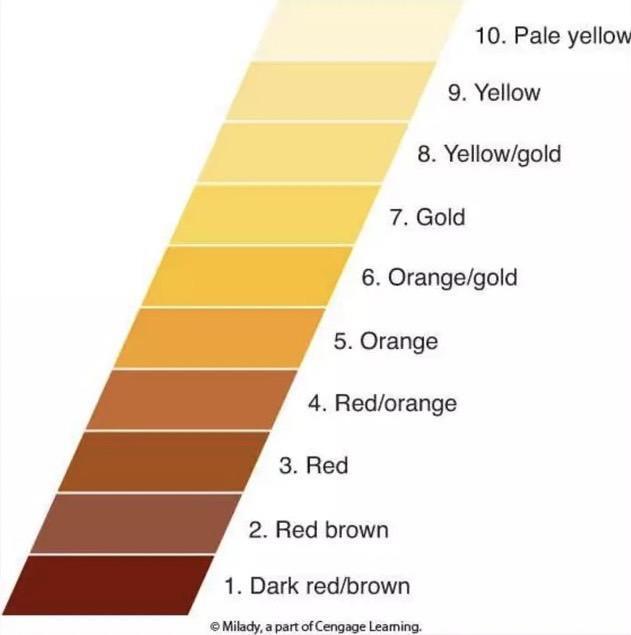
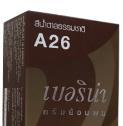
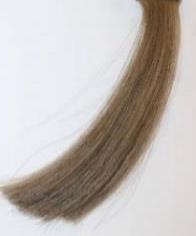
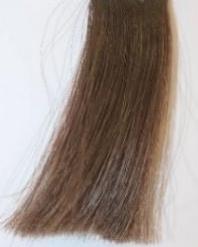
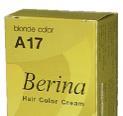
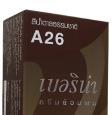
New shades of hair coloring were created according to the most favorite shades that were obtained from the first survey. Hair color products (Berina brand) with the color number A16, A17, A23, A24, A31, and A41 and human hair in this study were purchased from a beauty salon in Mueang District, Chiang Rai Province. The bunches of human hair were prepared for bleaching. First, mix 12% of bleaching solution with hair bleaching powder. Then apply it to the hair section and leave it for 45 minutes. Rinse the hair with water. Bleach the hair again if there are not yet in hair decolonization level 8-10 (figure 1) and leave it for another 30 minutes. Then, rinse the hair with water. Next, dye the hair according as the formula in Table 3 and leave it for 20 minutes. Rinse the hair with water. Finally, the steps are as follows: blow dry the hair and take a photo of the hair section that was experimented.
2.3.3 Scanning electron microscopic analysis
The morphological surfaces of dyed hairs were examined by scanning electron microscopy (SEM). Hair samples including original hair, bleached hairs, and dyed hairs were taken onto SEM specimen stubs. The hair samples were dried, coated with gold-palladium, and observed with a Field Emission Scanning Electron microscope (TESCAN MIRA4, Brno, Czech Republic).
2.3.4 Satisfaction Survey
The satisfaction of participants on new hair color shades was performed by a questionnaire. University students with the same inclusion criteria were asked to evaluate their satisfaction with the new shades of hair colors that were developed in this study. The new color shades were photographed for the participants' consideration and put into the questionnaire.
2.3.5 Statistical analysis
The demographic data are expressed as mean ± standard deviation, quantitative data expressed as percentages. Analyses were performed using SPSS version 21 (SPSS Inc., Chicago, IL, USA), and pvalues of <0.05 were considered significant.
Figure 1 Ten degrees of natural hair decolonization (Milady Standard Cosmetology, 2011)
3. Results and Discussion
3.1 Survey of popular shades in hair coloring for undergraduate students.
The demographics of participants are shown in Table 1. Out of 155 participants, 104 (67.1%) were female, 32 (20.6%) male, and 19 (12.3%) identified as LGBTQ. Most were students aged 22 (56 participants, 36.1%). Furthermore, 66 participants (42.6%) were in their 4th year of college. The majority of participants (61 students, 39.4%) had incomes ranging from 3,000 to 5,000 baht per month. The main reason for coloring hair among most participants was’ I want to try dyeing my hair’ (92 students (59.4%); Want to change your look” (83 students 53.5%) and’ increase self-confidence” (58 students 37.4%). Among these participants (68 students 43.9%), the study also examined the popularity of different color shades among the students (n=646) in Table 2. The most favored color shadesincludedBrownat 51 (7.9%),Ashblondeat 49(7.6%), Buttercreamat 47(7.3%), Redburgundy at 46 (7.1%), and Dull pinkat43(6.7%).Conversely,lesspopularcolorshadeswereStrawberrypinkandBlue green,eachat9(1.4%)
Table 1 The demographic data of university students.
The demographic data of university students n=155 %
Table 2 The popularity of color shades in university student.
3.2 Newly developed color formula and shades available
The new color mixtures andtheir resultingshadesare presentedinTable 3.The bleachingproducts reacts with the melanin in the hair, removing the color through an irreversible chemical reaction. A hydrogen peroxide developer is an oxidizing agent that, when mixed with an oxidation hair color, supplies the necessary oxygen gas to develop the color molecules and create a change in natural hair color. Developers as oxidizing agents or catalysts, have a pH between 2.5 and 4.5. Although there are
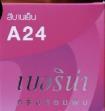
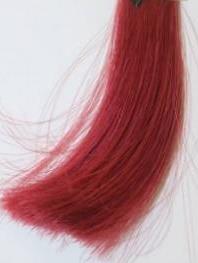
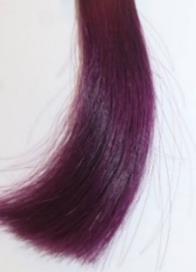
a number of developers on the market, hydrogen peroxide (H2O2) is the one most commonly used in hair color (Milady Standard Cosmetology, 2011). In the experiment, a natural brown color (A26) was mixed with a light color (A17) to get a color similar to the brown obtained in the survey. Then, it was mixed with blonde (A17), red (A23), and pink (A24), which are the next most popular colors, and also with three popular colors: brown (A26), blonde (A17), and red(A23). To get a variety of colors, blonde (A17) and red (A23) were mixed together, and blonde (A17) was mixed with blue (A41) and green (A31).There are a total of 7new shade formulas accordingto the color popularityfromthe participants: F1 Brown (A26) and blonde (A17) mixed in a 1:1 ratio (20 g). F2 Brown (A26) and light (A17) mixed in a 1:1 ratio (20 g). F3 Green (A31), blue (A41), and blonde (A17) mixed in a 9:3:1 ratio (22 g). F4 Brown (A26) and red (A23) mixed in a 2:1 ratio (21 g). F5 Brown (A26) and pink (A24) mixed in a 2:1 ratio (21 g). F6 Blonde (A17) and red (A23) mixed in an 11:1 ratio (24 g). F7 Brown (A26), blonde (A17), and red (A23) mixed in a 3:6:1 ratio (20 g).
Table 3 The new color mixture and final result of color shades.
F1 Brown - Ash blond
F2 Brown - Light 1:1
F3 Blue green - Ash blond 9:3:1
F4 Brown - Red burgundy
F5 Brown - Dull pink
3.3 Scanning electron microscopic analysis


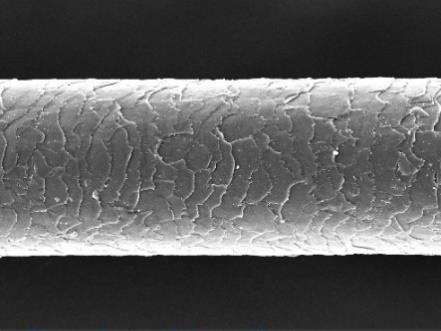
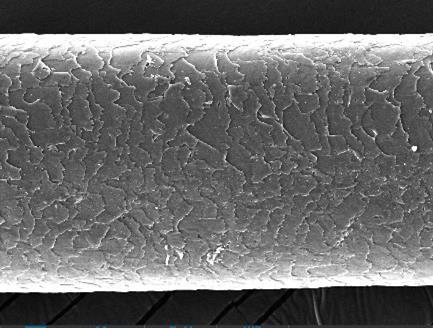
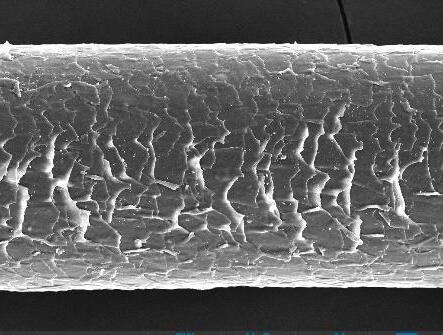
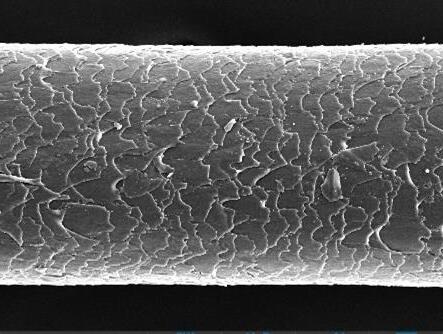
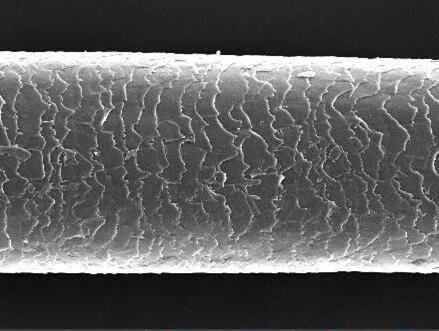
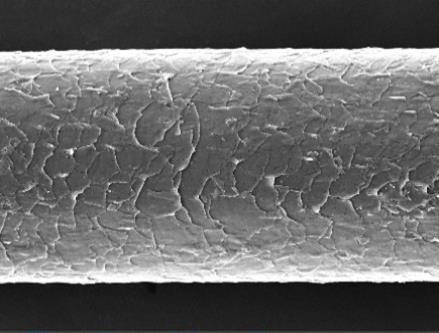
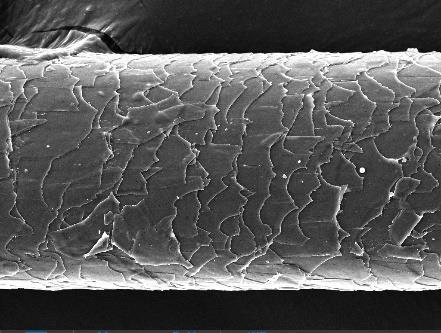
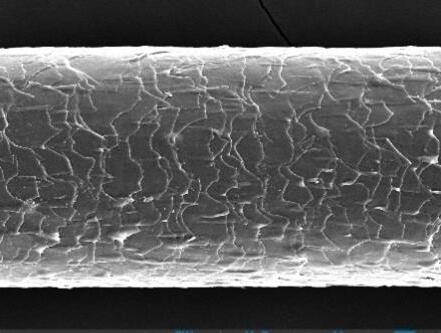
From Figure 2, the condition of the hair shaft after bleaching and coloring according to the ratios of F1-F7 shows that the hair cuticles were open and slightly damaged. The bleaching agents entered the hair cortex and oxidized the melanin molecules, rendering them colorless, and the cuticles had no cracks. However, in the hair shaft treated with F1-F2, the hair cuticles were open and showed cracks. This indicates that the dye product can open the cuticle, potentially causing slight damage to the hair shafts during the coloring process. Peroxide ingress is likely facilitated by the considerable structural degradation caused to the cuticle layers of hair fibers. The consequences of the peroxide action within the cuticle and cortex are oxidation of the proteins, and subsequent protein loss from the fiber that correlates to bleaching severity (Grosvenor et al., 2018). The color of the hair changed due to the penetration of hair dye molecule. Conclusively, hair dye was proven to modifythe structure of outer layer of the hair. Grading of damage under SEM: The damage to hair shaft under SEM was graded into five grades (based on the grading system developed by Kim et al.) (Kim YD, 2010).
1. Grade 0: Virgin intact hair with regular overlay of the cuticle
2. Grade 1: Irregular overlay of the cuticle without cracks or holes
3. Grade 2: Severe lift up of the cuticle with cracks or holes but without exposure of the cortex
4. Grade 3: Partial exposure of cortex
5. Grade 4: Complete disappearance of cortex
The observations revealed that hair shafts showed open and slightly damaged cuticles after bleaching and coloring. This indicates that the dye products can penetrate the hair cortex, causing some damage. Factors contributing to cuticle damage during the experiment could include the washing process and blow-drying, which can be harsh on hair.
F7 Brown - Ash blond - Red burgundy 3:6:1
Figure 2 The Scanning Electron Microscopic (SEM) images of a hair stand dyed with or without new color formulations.
3.4 Survey of satisfaction with hair color shades for Bachelor Students
The hair color shades were evaluated based on student popularity. A total of 164 students participated in the study: 33 (20.1%) were male, 118 (72%) were female, and 13 (7.9%) were LGBTQ. Satisfaction with the color shades was assessed using a questionnaire and analysis the satisfaction level by using the Linkert scale. The relationship between gender for color shades F1, F2, F3, F4, F5, F6, and F7 was tested using ANOVA and Friedman tests. The results are presented in Table 4. No significant differences were found for F1, F2, F3, F4, F5, and F7 (p > 0.05), but there was a significant difference for F6 (p < 0.05) between genders. This indicates that within the gender group, there is at least one group with different satisfaction values, suggesting the need for a wider range of shades to cater to beauty salon services. The research found no significant difference in satisfaction with different colors among males and females. However, among the LGBTQ group, there was a significant difference in satisfaction with F1-F7 colors. In the LGBTQ group, satisfaction with F2 was the highest compared to other colors, indicating that this shade can be further developed for beauty salon services. Males and females desire different products and have distinct preferences and ways of acquiring them. Gender plays asignificantroleinconsumer behavior,as differencesinexpectations, wants,needs,andlifestyles between men and women influence their consumption patterns. Therefore, we are interested in studying the relationship between gender and our dye formula (Ward, 2012).
Table 4 Relationship between gender and color shades obtained after the experiment. Name
F3
F7 3.56±0.98 3.24±3.19
P-value 0.891 0.078 0.002*
Satisfaction level: 1= Very dissatisfied, 2 = Dissatisfied, 3 = Neutral, 4 = Satisfied, 5 = Very satisfied
Values are given as mean ± S.D. from triplicate.
* Different letters are the name of formulation compared between genders indicate significant differences (P<0.05).
Table 5 shows the relationship between age and color shade. The ages of the participants were 18 years old (n=6), 19 years old (n=36), 20 years old (n=28), 21 years old (n=21), 22 years old (n=39) and 23 years old (n=34). There were no significant differences in satisfaction for color shades F1, F2, F3, F4, F5, F6,and F7across different ages(p >0.05).Satisfactionwith colors F1-F7 showed no significant difference withinanyage group,including18-, 19-, 20-, 21-, and 22-year-olds. Foryounger participants (aged 18–25), a low price was considered a sufficient reason to buy the item of clothing. For older participants (35-50), suitability was a more important factor, while for the eldest people, durability was the most important. the youngparticipants gave more weight to the pricethanto the other factors (Soma & Takahashi, 2009). Therefore, we examined the relationship between age and our hair dye formula. However, the results showed no significant difference, as the participants' ages were similar.
Table 5 Relationship between age and color shades obtained after the experiment.
Satisfaction level: 1= Very dissatisfied, 2 = Dissatisfied, 3 = Neutral, 4 = Satisfied, 5 = Very satisfied Values are given as mean ± S.D. from triplicate.
*Different letters are the name of formulation compared between genders indicate significant differences (P<0.05).
4. Conclusion
In this study, we developed seven new hair color shades mixed among the surveyed popular hair color such as brown, blonde, red, pink, and blue-green. We conducted a survey to assess students' satisfaction with these new colors. Among the participants, LGBTQ individuals showed the highest satisfaction with shade F2, suggesting that this shade has potential for further development in beauty salon services. Our observations revealed that hair shafts showed open and slightly damaged cuticles after bleaching and coloring. This indicates that the dye products can penetrate the hair cortex, causing some damage. Factors contributing to cuticle damage during the experiment could include the washing process and blow-drying, which can be harsh on hair.
5. Suggestion
In this study, a scanning electron microscope was used to examine the condition of the hair cuticle on the hair shaft after bleaching and coloring. However, future studies should be comparing the condition of the hair cuticle before and after coloring to observe the differences. It may also be beneficial to include steps such as washing with shampoo and conditioner and blow-drying the hair with cool air.
6. Acknowledgements
This study was supported by the School of Cosmetic Science, Mae Fah Luang University. We would like to thanks the Thai students who completed the questionnaires for this study.
7. References
Gitnux. (2023). Hair color statistics Retrieved April 11, 2024, from https://gitnux.org/hair-colorstatistics/
Global Market Insights. (2023). Hair Salon Services Market Size by Regional Outlook, Application Potential, Price Trend, Competitive Market Share & Forecast, Retrieved April 11, 2024, from https://www.gminsights.com/industry-analysis/hair-salon-services-market.
Gupta, M. (2018). Knowledge, Attitude, and Practices Regarding Hair Dye Use Among Patients Attending a Tertiary Care Hospital: A Cross-sectional Study. Our Dermatology Online, 9(1), 1-4.
Grosvenor, A. J., Deb-Choudhury, S., Middlewood, P. G., Thomas, A., Lee, E., Vernon, J. A., Woods, J. L., Taylor, C., Bell, F. I., & Clerens, S. (2018). The physical and chemical disruption of human hair after bleaching: Studies by transmission electron microscopy and redox proteomics. International Journal of Cosmetic Science, 40(6), 536-548. https://doi.org/10.1111/ics.12495
Lindsey Metrus. (2022). This is why you can’t stop dyeing your hair. In Byrdie confidence, community and joy Online. Retrieved April 11, 2024, from https://www.byrdie.com/haircolor-addiction
Milady Standard Cosmetology. (2011). Chapter 21: Haircoloring. Part3: Haircare. Milady 's Cosmetology. Cengage Learning. pp 616 - 684.
Modern Salon. (2024). Haircolor Research: Understanding Your Color Clients & Your Color Business. In Modern Salon Online. Retrieved April 11, 2024, from https://www.modernsalon.com/371211/haircolor-research-understanding-your-color-clientsyour-color-business
Soma, Y., & Takahashi, T. (2009). Suppression of hair damage and pungent smell of bleach using an aqueous solution of 2-amino-2-methyl-1,3-propanediol as an alkaline agent. International Journal of Cosmetic Science, 31(1), 57-61.
Ward, M. (2012). Color as a Reductive and Additive Influence on Consumers' Expectations and Perceptions of Brand Personality, 29(10), 775-788. Retrieved June 13 2024, from https://doi.org/10.1002/cb.146
Yrprincess. (2015). Basic chemical information about melanocytes and hair color. Retrieved June 14 2024, from https://www.scimath.org/article-chemistry/item/4431-2015-01-06-02-36-31
Proceeding of Cosmetic and Beauty International Conference (CBIC) 2025 & International Conference on Integrative Medicine (ICIM) 2025 16th-17th January 2025
Utilization of mangosteen peel extract for dental effervescent tablet
Natthawut Thitipramote1,2,3* , Nantanat Phakninrat1 , Parima Thingpaktham1 and Prinyaporn Pradmeeteekul3
1 School of Cosmetic Science, Mae Fah Luang University, Chiang Rai 57100, Thailand
2 Green Cosmetic Technology Research Group, School of Science, Mae Fah Luang University, Chiang Rai 57100, Thailand
3Center of Excellence in Natural Products Innovation (CENPi), Mae Fah Luang University, Chiang Rai, 57100, Thailand
*Corresponding author: E-mail: natthawut.thi@mfu.ac.th
ABSTRACT
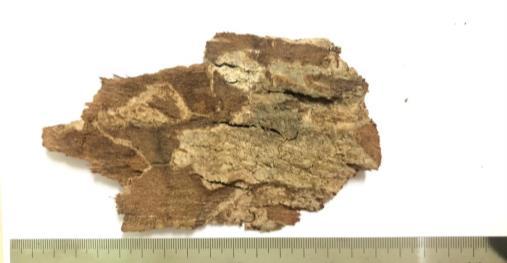
Introduction: Mangosteen (Garcinia mangostana Linn) peels (MP) that are 65% of total mass of whole fruit, remain as the waste from human consumption or food industry. Previous study showed that MP extract especially xanthone had many bioactivities and antioxidant and antimicrobial activities. In oral treatment, the retainer (from orthodontic treatment) and dentures need the oral cleaning product that can cleaning and easy to use. Therefore, this study aimed to utilize MP extract from agricultural waste as natural active ingredient for dental effervescent tablet.
Methods: MP were extracted with four different solvents (DI water-DI, 95% ethanol-ET, acetate-AC, and ethyl acetate-EA), and their phenolic compounds (total phenolic-TPC and total xanthone-TXC contents) and antioxidant activity (DPPH, ABTS, and FRAP) of these extracts were determined. The dental effervescent tablet containing these MP extracts was also developed.
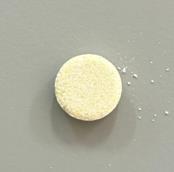
Results: MP-DI and MP-ET extracts had the significantly highest TPC (274.61±16.97 and 271.19±14.37 mgGAE/g extract, respectively; p<0.05). However, the significantly greatest TXC was presented in MP-AE and MP-AC extracts (4.08±0.05 and 4.07±0.10 mg/mL sample, respectively; p<0.05). For antioxidant, the greatest DPPH was found in MP-AC (182.78±10.13 mgTEAC/g extract). MP-DI exhibited the highest ABTS activity (651.49±24.30 mgTEAC/g extract). Moreover, aqueous MP-DI extract showed the highest FRAP activity (216.22±8.59 mgTEAC/g extract; p<0.05). MP-DI, MP-AC and MP-EA extracts that exhibited high xanthone and antioxidant, were chosen as an active ingredient in dental effervescent tablet. 0.1% of these each three MP extracts (F4A-F4C) and 0.1% of mixture (MP-AC and MP-EA) extracts(F4D)wereused ThesefourformulaeofMPtabletprovidedeasytoeffervesce,quicky dissolved, strong hardness and ability to cleaning. Therefore, dental effervescent tablet with 0.1%MP-EAextract that hadthehighest xanthone, was stratifiedin term of good characteristic and good effervesce and cleaning.
Conclusion: MP extract has a potential to be used as natural active for dental effervescent tablet.
Keywords: Dental; Effervescent tablet; Mangosteen peel; Xanthone; Utilization
1. Introduction
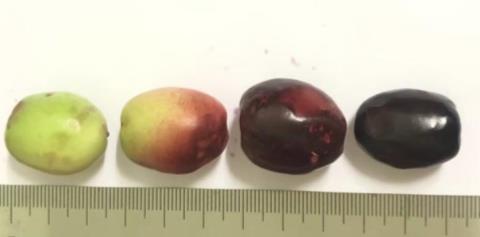
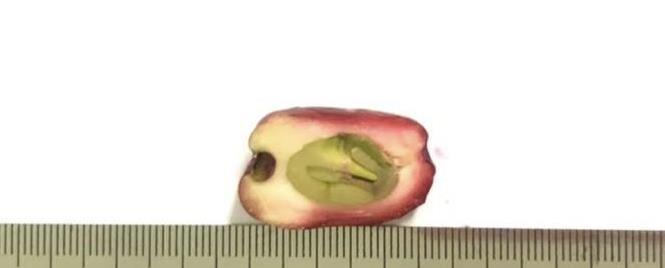
Mangosteen (Garcinia mangostana Linn.) is one of the most common tropical fruits that was mainly cultivated in Southeast Asia including Thailand (Rizaldy et al., 2022). The mangosteen peel (MP) is dark purple or reddish in color, while the edible aril inside is milky white. In 2022, Thailand had a total mangosteen cultivation area of 435,000 rai and a harvested area of 420,000 rai, where 1 rai
is equivalent to 1,600 square meters. It achieved a significant production milestone with nearly 252,000 tons of mangosteen. Out of this total yield, approximately 206,000 tons were allocated for export, while the remaining 46,000 tons were consumed domestically (Office of Agricultural Economics, Bangkok, Thailand, 2022). Mangosteen peels (MP) that are 65% of total mass of whole fruit, remain as the potential waste from human consumption or food industry (Kusmayadi et al., 2018) A good waste management strategy would be to improve the value of mangosteen peel. MP is an important source of natural phenolic antioxidants. It contains various bioactive substances (e.g. phenolic, flavonoid and xanthones) which possess biological and medicinal properties such as antioxidant, antimicrobial and anti-inflammatory activities (Suttirak and Manurakchinakorn, 2014; Kusmayadi et al., 2018; Rizaldy et al., 2022). Moreover, the previous studies showed the MP extract had the inhibitory effects on Streptococcus mutants and Porphyromonas gingivalis bacteria in biofilm formation in oral or teeth (Rizaldy et al., 2022). It suggested that MP extract can be used for dental material or oral care application.
There are over 700 bacterial species in the oral cavity. Each individual has a unique microbiome that includes both healthy and variable bacteria, which can consist of either healthy or pathogenic bacteria (Deo et al., 2019). Tooth decay is a significant oral health issue (Treesuwan et al., 2022). Previous studies by Aas et al., (2005) have demonstrated that individuals receiving orthodontic treatment have an increased risk of developing dental cavities and gingival irritation. After orthodontic treatment, plaque buildup on the teeth or at the gingival border, microgrooves in the retainer, worn or abraded portions of the retainer, and other characteristics of the mouth and retainer can all lead to bacterial formation on the inner surface of retainers, which is one cause of tooth decay (Velliyagounder et al., 2022). Also, Dentures are one of the oral health issues that can cause fungal and bacterial infections if improperly maintained. They require careful fitting, upkeep, and routine dental care (Alabbas et al., 2023). Cleaning retainers and dentures is a very cumbersome task. They need to be soaked in warm water and brushed gently to remove dirt, but it is never certain whether any bacteria remain. Therefore, dental effervescent tablets are one of the solutions to prevent oral health issues and easy to use.
Therefore, this study aimed to extract the bioactive compounds [including total phenolic content (TPC) and total xanthone content (TXC)], from mangosteen peel (waste from consumer) using four different solvents: DIwater,ethanol, acetone, andethyl acetate. Additionally, the antioxidant properties of these MP extracts were determined using three different methods (DPPH, ABTS, and FRAP assays), and a dental effervescent tablet containing MP extract was developed.
2. Materials and Methods
2.1 Materials
Mangosteen fruits were obtained from a local mangosteen plantation in Nakhon Si Thammarat, Thailand.Allchemicalsandsolventswereanalyticalgrades.Cosmeticingredientswerecosmeticgrade. 95% ethanol, ethyl acetate, and acetone were purchased from Northern Chemical Co. Ltd., Thailand. Ethanol absolute, acetic acid, dimethyl sulphoxide, sodium carbonate, and methanol were purchased from Labscan Limited, Thailand. Folin-ciocalteu reagent and sodium acetate were purchased from Loba, Indai. 2,2-Diphenyl 1-picrylhydrazyl, gallic acid, ferric chloride, 2,2’-azino-bis 3ethylbenthizaline 6 sulfonic acid, and 2,4,6-tripyridyl-s-triazine were purchased from Sigma-Aldric, USA. Trolox was purchased from HiMedia, USA. Disodium phosphate, monosodium phosphate, and potassium persulphate were purchased from Univar, U.S. Hydrochloric acid was purchased from Qrec, New Zealand.
2.2 Sample preparation
Mangosteen peel was separated and washed with tap water. MP was cut into small pieces (1.5 x 1 cm) and dried at 50 OC Sample was milled as powder by using the hammer mill and kept in -4 OC until used.
2.3 Extraction
MP powder was extracted using four different solvents: DI water, 95% ethanol, acetone, and ethyl
acetate, at a ratio of 1:10 (w/v sample:solvent) in incubated shaker at 200 rpm for 24 hours. Vacuum filtration was used to filter the extracts using Whatman paper No 1. Organic solvents were removed by rotary evaporator at 50 °C. These MP extracts were freeze-dried and stored at -20 °C The extraction yield was calculated as follows: Extraction yield (%)= (weight of extract / weight of dry sample) x 100.
2.4 Bioactive compounds
2.4.1 Total phenolic content (TPC)
TPC was determined by the method modified from Thitipramote et al., (2022). Galic acid was used as a reference standard. Absorbance was measured at 765 nm using microplate reader (Biotek, Epoch, USA). The results were expressed as mg gallic acid equivalents (GAE)/ g extract.
2.4.2 Total xanthone content (TXC)
TXC was determined by the method modified from Kusmayadi et al., (2018). 25 mg of each MP extracts was added into the volumetric flask (25mL), added with methanol to reach 25 mL level mark to obtain 1 mg/mL concentration (1000 μg/mL). Then the sample was filtered using Whatman filter paper No.1. 1 mL of the concentrate was put in the volumetric flask (25 mL) and added with methanol with methanol uptothelevel markto obtaina 10μg/mL concentration.Theabsorbabilitywas measured using UV spectrometry at the maximum absorbability wavelength 243 nm. Total xanthone content was calculated using the formula as follows:
C = A / (�� x b) ; A = Absorbability; b = Cuvette width (mm); �� = Emissivity of α-mangostin (3.16 × 10³ L/mol), and
Total xanthone content (mg/mL sample) = (c x BM x 10 x FP)/ ml sample ; C = Extract concentration (mg/L); BM = Relative mass molecule α-mangostin (410.47 g/mol); FP = Solvent fraction. The results were expressed as mg xanthone/mL sample.
2.5 Antioxidant activity test
2.5.1 DPPH radical scavenging assay
The DPPH radical scavenging activity was performed as previously described (Thitipramote et.al., 2022). The absorbance was measured at 515 nm. Trolox solution was used as a reference standard. The results were expressed as mg Trolox equivalent antioxidant capacity (TEAC)/ g extract).
2.5.2 ABTS scavenging assay
The ABTS radical scavenging activity was performed as previously described (Thitipramote et.al., 2022). The absorbance was measured at 734 nm. Trolox solution was used as a reference standard. The percentage (%) of inhibition was calculated. The results were expressed as mg Trolox equivalent antioxidant capacity (TEAC)/g extract.
2.5.3 Ferric reducing antioxidant power assay
FRAP was measured as previously described (Thitipramote et.al., 2022). The absorbance was measured at 593 nm using a microplate reader. Trolox was used as a reference standard, and the results were expressed as mg Trolox equivalent antioxidant capacity (TEAC)/g extract.
2.6 Development Base Formula for dental effervescent tablet
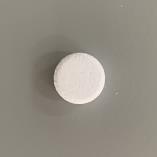
Dental effervescent tablets were developed with a target base formula that was characterized by easy to effervesce, quicky dissolved, strong hardness and abilityto cleaning. The base formula of dental effervescent tablets was developed (Table 1). The tablet was punched by a single-punch tablet machine. The dental effervescent tablet of each base formula was observed for characteristics, diameter (cm) and thickness (cm) using vernier caliper. Color was observed by the eyes. Each tablet formula was weighed by balance (3 digits). The disintegration and effervescent time of each tablet formula were determined that tablet was placed in beakers with water in ratio 1:200 (w/v tablet: water) and the effervescent time was measured by a stopwatch. Effervescence completion was defined as the moment when the solution became completely transparent. Then, the characteristic and pH of solution were also determined.
2.7 Development dental effervescent tablet containing mangosteen peel extract
MP extract that had the highest bioactive compounds (TPC and TXC) and/or antioxidant activities (DPPH, ABTS and FRAP) was chosen as an active ingredient in dental effervescent tablets. Then, the characteristics of dental effervescent products were examined by using same methods in base formula.
2.8 Statistical analysis
All of sample data from each test was expressed as mean ± standard deviation, Bioactive compounds andantioxidants of extracts were analyzed through analysisof variance(ANOVA),Tukey's HSD test for post-hoc analysis using IBM SPSS 26 for iOS. The comparison was considered at the significance level of p < 0.05.
Table 1 Base formula of dental effervescent tablet (%w/w)
Sodium bicarbonate
Cellulose gum Binding agent
Polyvinylpyrrolidone (PVP-K90)
Sodium benzoate
Note: q.s. stands for quantity sufficient
3. Results and Discussion
3.1 Extraction yield and bioactive compounds of mangosteen peel extract
The extraction yield of crude MP extracts was shown in Table 2. The highest yield was found in Ethanol MP extracts (8.67%), while ethyl acetate MP extract exhibited the lowest yield (3.66%). The characteristics of these MP extracts were brown powder with different shades. Extraction yield and antioxidant activity of the extract are strongly dependent on the solvent, due to the different antioxidant potential of compounds with different polarity (Suttirak and Manurakchinakorn, 2014).
Bioactive compounds (TPC and TXC) of MP extracts were shown in Table 2 Comparing between four different solvents, the aqueous (MP-DI) and ethanolic (MP-ET) extracts had the significantly highest TPC than other extracts (274.61±16.97 and 271.19±14.37 mg GAE/g sample, respectively; p < 0.05). The lowest TPC was found in ethyl acetate extract (ME-EA) (171.74±6.47 mg GAE/g sample; p < 0.05). However, the results of TXC showed that the significantly greatest TXC was presented in ethyl acetate and acetone extracts as lower polarity solvent (4.08±0.05 and 4.07±0.10 mg/mL sample, respectively; p < 0.05). MP-DI extract had the lowest TXC (0.98±0.01 mg/mL sample,; p < 0.05). Previous study suggested that mangosteen peel contain 10 times more phenolic compounds and 20 times more antioxidant activity compared to mangosteen pulp. Extraction of MP by organic solvent led to the isolations of nonpolar compounds such as xanthones and prenylated benzophenone derivatives. The polar faction harbors some polar compounds of polyphenols and condensed tannins such as catechins, procyanidins, and anthocyanidins (Rizaldy et al., 2022).
Table 2 Extraction yield, total phenolic and xanthone contents of mangosteen peel extracts (MP)
Extract
*Values are given as mean ± S.D. from triplicate.
Different superscript letters (a, b, c) in the same column indicated significant differences (p <0.05; ANOVA,Tukey's HSD test).
3.2 Antioxidant activity of mangosteen peel extract (MP)
Results of antioxidant activity of MP extract that were determined by DPPH, ABTS and FRAP assays, were shown in figure 1. DPPH radical scavenging activity had significantly different between these MP extracts (p<0.05). MP extracts with moderate/lower polarity solvents (MP-AC, MP-ET and MP-EA) tended to be high DPPH activity that the greatest DPPH was found in MP-AC (182.78±10.13 mg TEAC/ g extract) (Fig 1A). However, the lowest DPPH activity was presented in MP-DI extract with high polarity solvent (149.51±10.13 mg TEAC/ g extract; p<0.05). In ABTS activity, although the antioxidant capacity did not significantly different between MP extract (p>0.05), MP-DI exhibited the highest ABTS activity (651.49±24.30 mg TEAC/g extract). Moreover, aqueous MP-DI extract showed the significantly highest FRAP activity (216.22±8.59 mg TEAC/ g extract; p<0.05). The lowest FRAP activity was presented in MP-EA extract (48.25±8.12 mg TEAC/ g extract; p<0.05, Fig 1C). Previous study demonstrated the antioxidant activities of MP extracts obtained by various solvents, which are different polarities. The extraction of MP in ethyl acetate and acetone showed the higher free radical scavenging activity (DPPH and ABTS activities), although lower chelating activity of the extract were detected (Suttirak and Manurakchinakorn, 2014).


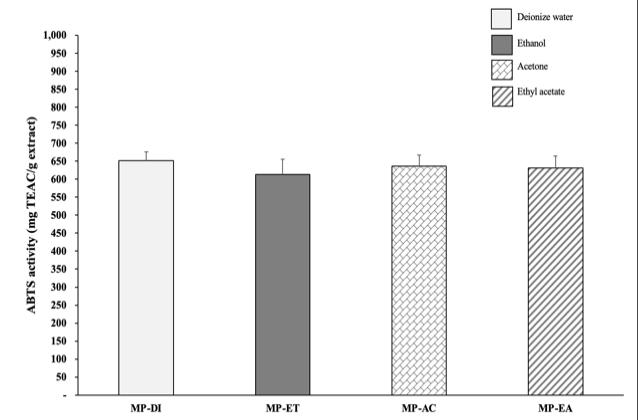
Figure 1 Antioxidant activities using DPPH (a), ABTS (b) and FRAP (c) of mangosteen peel (MP) extract using different solvents (DI waterDI, Ethanol-ET, Acetone-AC and Ethyl acetateEA). Different superscript letters (a, b, c) on histogram indicated significant differences (p<0.05; ANOVA, Tukey's HSD test).
3.4 Base Formula for dental effervescent tablet
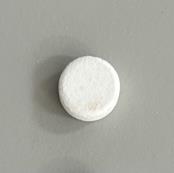
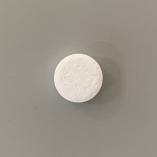
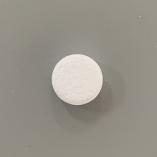
The characteristics of the effervescent tablet formulas are shown in Table 3. The essential ingredients for formulation were sodium carbonate and citric acid to create effervescence and cellulose gumand polyvinylpyrrolidone as bindingagents Thefirst formula (F1) was whiteflat round tablet with low hardness, easily cracking and shortest effervescence time due to amount of acidifying, alkalizing and binding agents. Hence, F2 formula was increased an amount of polyvinylpyrrolidone and added sodium lauryl sulfate as cleaning agent resulting in tablet with low hardness, easily cracking and ability cleaning. F3 formula was increased an amount of alkalizing and binding agent that its tablet exhibited high hardness with some cracking at edge of tablet and short effervescence time (1.48±0.09 minutes). F4 formula was increased an amount of PEG-32 (1% w/w) resulting in white tablet with highest hardness without cracking and moderate effervescence time (2.06±0.37 minutes). The results suggested that the characteristics of formula F4 were easy to effervesce, quicky dissolved, strong hardness and ability to cleaning as a target base formula. Thus, F4 was selected to be the base formula for further study.
Table 3 Characteristic of base effervescent tablet.
Hardness and cracking tablet
Low hardness and easily cracking Low hardness and easily cracking High hardness with some cracking at edge of tablet
Highest hardness without cracking
Characteristic of solution after effervescence Clear solution without foam Clear solution with slightly foam Clear solution with modulate foam Clear solution with high foam Appearance of tablet
Values are given as mean ± S.D. from triplicate.
3.5 Dental effervescent tablet containing mangosteen peel extract
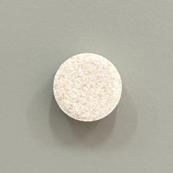
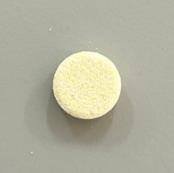
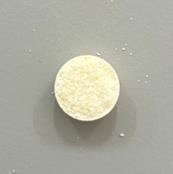
From our previous studies on bioactive compounds (TPC, TXC) and antioxidant activities (DPPH, ABTS, and FRAP), MP-DI, MP-AC and MP-EA extracts exhibited higher xanthone and antioxidant activity than other solvent extract. Therefore, these three MP extracts were chosen as an active ingredient in dental effervescent tablet formula. 0.1% (w/w) of these each three MP extracts (F4A-F4C) and 0.1% (w/w) of mixture extracts (0.05% MP-AC and 0.05% MP-EA extracts) were used by adding to the base formula (Table 4) Results showed that the characteristic of dental effervescent tablet containing MP extracts had a high hardness without cracking. Moreover, effervescent tablet containing 0.1% MP-DI(F4A) exhibited whitecolor withpinkparticledispersionandshort effervescent time (1.46 ± 0.03 minutes). Meanwhile, other tablet formulas (F4B-F4D) containing MP-AC and/or MP-EA extract had a light-yellow color with shorter effervescent time (Table 4). These four formulae of MP tablet provided easy to effervesce, quicky dissolved, strong hardness and ability to cleaning. Previous studies showed that bioactive compounds especially xanthone in MP extract had many bioactivities including antimicrobial or antibacterial and antioxidant activity (Kusmayadi et al., 2018; Widjaja et al., 2019; Rizaldy et al., 2022; Yuvanatemiya et al., 2022). Moreover, MP extract had the inhibitory effects on oral bacterial e.g. S mutants and P. gingivalis in biofilm formation in oral or teeth (Rizaldy et al., 2022). Therefore, dental effervescent tablet with 0.1% ethyl acetate MP extract that had the highest xanthone, was stratified in term of good characteristic and good effervesce and cleaning.
Table 4 Characteristic of effervescent tablet containing MP extract.
and cracking tablet
Characteristic
Appearance
Values are given as mean ± S.D. from triplicate.
4. Conclusion
Comparing the phenolic contents (TPC and TXC) and antioxidant capacities of mangosteen peel (MP) with four different solvents, the significantly highest TPC and FRAP values were found in MPDI extract whereas the greatest TXC was presented in MP-EA and MP-AC. The characteristic of effervescent tablet containing these three MP extracts had a high hardness without cracking. Dental effervescent tablet with 0.1% ethyl acetate MP extract (F4C) that had the highest xanthone, was stratified in term of good characteristic and good effervesce and cleaning. Results suggested that MP extract (especially ethyl acetate extract) might be used as natural source for antimicrobial and antioxidant for inhibiting the bacteria especially oral area that cause tooth decay and plaque on the retainer. However, the efficacy and safe (e.g. the cytotoxicity, anti-microbial and clinical trial) of these MP dental effervescent tablets should be further studies.
5. Acknowledgements
The authors are grateful to the Center of Excellence in Natural Products Innovation (CENPi), the Scientific & Technological Instrument Center, the School of Cosmetic Science and other in Mae Fah Luang University for financial and facilities support.
6. References
Aas, J.A., Paster, B.J., Stokes, L.N., Olsen, I. & Dewhirst, F.E. (2005). Defining the normal bacterial flora of the oral cavity. Journal of Clinical Microbiology, 43, 5721–5732.
Deo, P.N. & Deshmukh, R. (2019). Oral microbiome: Unveiling the fundamentals. Journal of Oral and Maxillofacial Pathology, 23, 122–128.
Kusmayadi, A., Adriani, L., Abun, A., Muchtaridi, M. & Tanuwiria U. (2018). Antioxidant activity of mangosteen peel (Garcinia mangostana L.) extracted using different solvents at the different times. Drug Innovation Today, 11, 44-48.
Kusmayadi, A., Adriani, L., Abun, A., Muchtaridi, M. & Tanuwiria, U. (2018). The effect of solvents and extraction time on total xanthone and antioxidant yields of mangosteen peel (Garcinia mangostana L.) extract. Drug Innovation Today, 10, 2572-2576.
Office of Agricultural Economics. Annual agricultural production data. 2022. Retrieved from https://www.oae.go.th
Rizaldy, D., Hartati,R., Nadhifa, T. & Fidrianny, I. (2022). Chemical compounds and pharmacological activities of mangosteen (Garcinia mangostana L.)-Updated review. Biointerface Research
Applied Chemistry12:2503–2516.
Suttirak,W.&Manurakchinakorn,S. (2014).In vitroantioxidantpropertiesofmangosteen peelextract. Journal of Food Science and Technology. 51(12),3546-3558.
Thitipramote,N.,Imsonpang,S.,Sukphopetch,P.,Pradmeeteekul,P.,Nimkamnerd,J.&Nantitanon,W.(2022).
ChaiyanaW. Health Benefitsand Safetyof Red PigmentedRice (Oryza sativa L.): In Vitro,Cellular, andInVivoActivitiesforHairGrowthPromotingTreatment. Cosmetics. 9(6):111.
Treesuwan, P., Juntavee, A., Rattanathongkom, A., Peerapattana, J., Nualkaew, N. & Chatrchaiwiwatana, S. (2012). Inhibitory effects of polyphenol from mangosteen extracts on Streptococcus mutans in vitro Isan Journal of Pharmaceutical Sciences, 8(1), 221-226
Velliyagounder,K.,Ardeshna,A. & Shah,S. (2022).An In Vivo StudyontheDevelopment ofBacterial Microbiome on Clear Orthodontic Retainer. Dentistry Journal (Basel), 10(12), 239.
Widjaja, J., Wahjuningrum, D. & Cahyani, F. (2019). Antibacterial Effect of Xanthone from Mangosteen PericarpExtract (Garcinia mangostana Linn.) against Porphyromonas gingivalis
Journal of International Dental and Medical Research, 12(1), 19-21.
Yuvanatemiya, V., Srean, P., Klangbud, W.K., Venkatachalam, K., Wongsa, J., Parametthanuwat, T & Charoenphun, N. (2022). A Review of the Influence of Various Extraction Techniques and the Biological Effects of the Xanthones from Mangosteen (Garcinia mangostana L.) Pericarps. Molecules, 27(24), 8775.
Proceeding of Cosmetic and Beauty International Conference (CBIC) 2025 & International Conference on Integrative Medicine (ICIM) 2025 16th-17th January 2025
Utilization of corn (Zea mays) agro-residues by green solvent with ultrasound-assisted extraction as natural active for cosmetic application
Natthawut Thitipramote1,2,3* , Prinyaporn Pradmeeteekul1 , Junniphaphorn Nimkamnerd1, Thiyapan Noppakoon1 and Kornkanok Nukard1
1Center of Excellence in Natural Products Innovation (CENPi), Mae Fah Luang University, Chiang Rai, 57100, Thailand
2School of Cosmetic Science, Mae Fah Luang University, Chiang Rai 57100, Thailand
3Green Cosmetic Technology School of Cosmetic Science, Mae Fah Luang University, Chiang Rai, 57100, Thailand
*Corresponding author: E-mail: natthawut.thi@mfu.ac.th
ABSTRACT
Introduction: Burning corn (Zea mays) agro-residues (CARs) are one of the main causes of smog crisis and tiny particle matter. CARs consist of their stalks (~ 48% of the total dry mass), leaves (28%), tassels (~1%), husks (8%), and cob (15%) as agricultural waste. Green solvents, known as environmentally friendly and safe, are used to extract bioactive compounds. Moreover, the ultrasound-assisted extraction (UAE) method has the advantage of short-time extraction. Thus, this study aimed to utilize CARs using green solvent and UAE method as a natural ingredient for cosmetics.
Methods: CARs were extracted by green solvents [Deionized (DI) water and 80% ethanol] with UAE at 40 kHz for 30 min. Bioactive compounds [total phenolic (TPC) and flavonoid (TFC) contents], antioxidant activities (DPPH, ABTS, and FRAP assay), and anti-tyrosinase activity of these CARs extracts were determined.
Results: The DI water extract of corn leaves exhibited the highest extraction yield (12.44 %yield). For bioactive compounds,the 80%ethanol extracts of corntassels hadthe statistically highest TPC and TFC (661 9 ± 5.5 mg GAE/g extract and 513.3 ± 49.6 mg QE/g extract, p<0.05, respectively). The high antioxidant capacity of these CARs was found in the 80% ethanol extract of corn tassels in ABTS and FRAP assays (4,171.5 ± 47.8 and 749.3 ± 15.4 mg TEAC/g extract, p<0.05, respectively). Meanwhile, the DPPH assay showed that the 80% ethanol extract of corn leaves had the highest antioxidant activity (709 4 ± 7.6 mg TEAC/g extract, p<0.05). Moreover, the DI water extract of corn stalks showed the highest antityrosinase activity (33.8 ± 1.6 %inhibition, p<0.05).
Conclusion: These CARs (especially their tassels and stalks), when processed using a green solvent with the UAE method, could elucidate bioactive compounds and antioxidant activities, which can be value-added and utilized as an alternative source of natural active ingredients in cosmetic and related applications.
Keywords: Bioactivity; Corn agro-residues; Green solvents; Ultrasound-assisted extraction, Utilization
1. Introduction
Corn (Zea mays), known as maize, is one of the main causes of the smog crisis, and tiny particle matter (e.g., PM 2.5) recur yearly, affecting health problems such as respiratory, cardiovascular, skin, and eye diseases in Northern Thailand. Because corn agro-residues (CARs), referring to the parts of corn that are not commercially valuable, are eliminated by burning approximately 60% of the total
residues.In 2022,thecorncultivatedareahadatotalof6.61millionraiwithproductivityof5.15million tons per year and crop residues of 6 million tons yearly. CARs consist of its stalks (~ 48% of the total dry mass), leaves (28%), tassels (~1%), husks (8%), and cob (15%) (Office of Agricultural Economics, Thailand, 2023; Sinpiboon and Chaichana, 2021). Thus, most studies attempted to utilize CARs to produce biomass energy such as corn cob, stems, and leaves but biomass utilization was not popular yet (Tengkaew and Wiwattanadate, 2014). Recently, many studies have focused on agricultural and industrial wastes including CARs searching for natural antioxidants for health or other benefits including cosmetic. Previous studies showed that the husk, cob, stalks, leaves, and tassels of corn extracts exhibited phenolic compound and antioxidant activities (Dong et al., 2014; Jung et al., 2014; Mohsen and Ammar, 2009)
Nowadays, natural antioxidants are widely used as natural active ingredients in health care and cosmetic products due to their beauty benefits such as anti-aging, anti-wrinkle, and skin-lightening properties (Rahaman et al., 2023) These active ingredients are mostly obtained from plant extracts. In the past, organic solvents were commonly used for extraction using conventional extraction methods such as maceration, percolation, or soxhlet extraction. Although organic solvents have relatively good extraction efficiency, some organic solvents are toxic and if solvent residues remain in the extract, it may affect the health of consumers and the environment Thus, the use of alternative solvents or “green solvents” for the extraction of bioactive compounds to replace toxic organic solvents is one of the advantages of green extractionmethods. Green solventsare known as solvents that are environmentally friendly and safe such as water, ethanol, etc. (Chemat et al., 2019).
Asmentionedabove,ourpreviousstudyusedorganicsolventswithconventionalshakingextraction to exert bioactive compounds from CARs and demonstrated that those CAR extracts could be used as a natural antioxidant (Thitipramote et al., 2022b). However, this conventional shaking extraction may have limitations that are the long extraction period and massive consumption of some toxic organic solvents. Ultrasound-assisted extraction (UAE) has some advantages such as easy instrument setup, requiring less time, and low energy throughput. UAE is a non-thermal process that applies acoustic energy to increase the release and diffusion rates of target materials via cavitation or oscillation phenomenon either using an ultrasound probe or an ultrasound bath that operates at 20 kHz or 40 kHz frequencies (Kumar et al., 2021). The ultrasound waves disrupt the plant tissue through physical forces developed during acoustic cavitation and help in the release of extractable components in the solvents such as bioactive compounds including polyphenols, phenolic acids, flavonoids, and carotenoids (Mehta et al., 2022). UAE might be an alternative method for short-time extraction. However, few studies used UAE for the extraction of CARs bioactive compounds. Thus, this study aimed to evaluate corn agro-residues (stalks, leaves, and tassels) bioactive compounds including phenolic and flavonoid contents, and cosmetic biological activity such as antioxidant, and anti-tyrosinase activity using green solvents (water and ethanol)extractionwith ultrasound-assistedextraction(UAE) method. These green solvent extractions might elucidate bioactive compounds from CARs with some biological activities that couldbedevelopedas naturalantioxidantsin naturalproductssuch ascosmeticsor relatedproducts to increase value and utilization.
2. Materials and Methods
2.1 Chemicals and reagents
All chemicals and solvents were analytical grade. ABTS (2,2’-azino-bis(3-ethylbenzthiazoline-6sulfonic acid)), aluminum chloride (AlCl3), catechin, dibasic phosphate, dimethylsulfoxide (DMSO), 2,2-diphenyl-1-picrylhydrazyl (DPPH), gallic acid, quercetin, kojic acid, 2,4,6-tris(2-pyridyl)-1,3,5triazin (TPTZ), trolox, andtyrosinase from mushroom were purchased fromSigma Chemical (St.Louis, MO, USA). Folin-ciocalteu reagent, ferric chloride, monobasic phosphate, potassium acetate (CH3COOK), potassium persulphate (K2S2O8), sodium carbonate (Na2CO3) were purchased from Merck (Darmstadt, Germany).
2.2 Plant preparation and extraction
Corn (Zea mays) agro-residues (CARs) were procured from local farmer on July 2023 in Chiang Rai province, Thailand. The samples were separated into stalks, leaves, and tassel of corn. Then these samples were cleaned and dried by hot air oven at 45°C The dried sample was milled as powder and
kept in a desiccator until used.
CARs were extracted by green solvents including Deionize (DI) water and 80% ethanol with a ratio of sample: solvent (1:10 w/v) using ultrasound-assisted extraction (UAE) at 40 kHz for 30 min. The mixtures were filtrated by Whatman filter paper No.1. Organic solvents were removed by rotary evaporator at 50°C. Extracts were freeze-dried and kept at -20°C until used.
2.3 Determination of bioactive compounds
2.3.1 Total phenolic content (TPC)
TPC was measured according to Thitipramote et al (2016). Briefly, 20 μL of CARs extracts was reacted with 100 μL of 0.2 M Folin-Ciocalteu reagent and 80 μL of 7.5% Na2CO3. The mixture was left to stand in the dark for 30 min at room temperature (RT). The absorbance was measured at 765 nm using a microplate reader (Biotek, Epoch, USA). Gallic acid was used as a reference standard. The results were expressed as mg gallic acid equivalents (GAE)/ g extract.
2.3.2 Total Flavonoid Content (TFC)
TFC was measured with slight modification byThitipramote et al (2022b). Briefly, 25 µL of CARs extracts was mixed with 75 µL of ethanol, 140 µL of DI water, 5 µL of 10% (w/v) AlCl3 and 5 μL of 1M CH3COOK, respectively. The mixture was incubated in the dark for 30 min at RT. The absorbance was measured at 415 nm. Quercetin was used as a reference standard and the results were expressed as mg quercetin equivalents (QE)/g extract.
2.4 Determination of antioxidant activities
2.4.1 DPPH radical scavenging activity
The DPPH radical scavenging activity was performed by Thitipramote et al (2016). Briefly, 10 µL of CARs extract was mixed with 190 µL of DPPH reagent. The reaction mixture was left to stand in the dark for 120 min at RT. The absorbance was measured at 515 nm. Trolox was used as a reference standard. The percentage (%) of inhibition was calculated by following the formula % inhibition = ( (Abs control - Abs extract) )/(Abs control) × 100
The results were expressed as mg Trolox equivalent antioxidant capacity (TEAC)/ g extract.
2.4.2 ABTS radical scavenging activity
The ABTS radical scavenging activity was performed by Thitipramote et al (2016) An ABTS solution was freshly prepared by mixing 7 mM ABTS with 2.45 mM K2S2O8 (v/v). Then, the ABTS solution was diluted with 50 mM Phosphate buffer (pH 7) in a ratio of 1:20 (v/v). For analysis, 10 µL of CARs extracts was added into 190 µL of the diluted ABTS solution. The reaction was performed in the dark at RT for 15 min. The absorbance was measured at 734 nm. Trolox solution was used as the reference standard. The percentage (%) of inhibition was calculated as mentioned above. The results were expressed as mg Trolox equivalent antioxidant capacity (TEAC)/ g extract.
2.4.3 Ferric reducing antioxidant power (FRAP)
Reducing power was measured according to Thitipramote et al. (2016). Briefly, a FRAP solution was freshly prepared by mixing 10 mL of TPTZ solution in 40 mM hydrochloric acid with 10 mL of 20 mM ferric chloride and 100 mL of 0.3 M acetate buffer (pH 3.6). For analysis, 30 μL of CARs extracts were mixed with 570 mL of FRAP solution. The mixture was kept in the dark for 15 minutes at roomtemperature and then theabsorbance was measured at 593 nmusing a microplate reader. Trolox was used as a reference standard, and the results were expressed as mg Trolox equivalent antioxidant capacity (TEAC)/ g extract.
2.5 Anti-tyrosinase activity
Tyrosinase inhibition assays were performed with L-DOPA as substrate according to Wang et al (2020) Briefly, the reaction mixture contained 15 µL of mushroom tyrosinase (2500 U/ mL), in 685 µL phosphate buffer (0.05 M, pH 6.5) was mixed with 200 µL of CARs extract Then 100 µL of LDOPA (5 mM) was added to the reaction mixture and incubated at 37oC for 15 min After incubation,
the reaction was measured at 492 nm using a microplate reader. Kojic acid was used as a positive control. The percentage of tyrosinase inhibition was calculated.
2.6 Statistical analysis
All data measurements were expressed as mean ± standard deviation. Data were compared and analyzed byone-way analysis of variance (ANOVA) test with Duncan’s multiple range test (IBM SPSS version 21.0). A significant difference is considered at the level of p < 0.05.
3. Results and Discussion
The extract yield was calculated on a dry basis (%yield). Table 1 shows the extraction yields of each part of corn with different solvents. Among parts of CARs, corn leaves, both DI water and 80% ethanol extract of corn leaves exhibited higher extraction yields than others (12.44 and 10.04% yield, respectively). The lowest yield was found in the 80% ethanol extract of corn stalks (3 37 %yield).
3.1 Bioactive compound contents
Both phenolic compounds and flavonoids are the major components found in corn maize (Sheng et al., 2018) Many conventional methods used organic solvents to extract phenolic compounds such as hexane, ethyl acetate, methanol, etc. using conventional extraction such as shaking extraction, microwave-assisted extraction (MAE), ultrasound-assisted extraction (UAE), etc. This study demonstrated that CARs including corn stalks, leaves, and tassels with green solvents (Deionized (DI) water and 80% ethanol) extraction had TPC and TFC.
The results showed a significant difference among CARs extracts (p<0.05) as shown in Table 1. The results showed that the 80% ethanol extract of corn tassels and the DI water extract of corn stalk had the highest TPC (661.9 ± 8.4 and 616.5 ± 3.6 mg GAE/g extract, p<0.05, respectively).Theethanol extraction tended to have higher TPC than the DI water extraction except for corn stalks. However, the lowest TPC was found in the DI water extract of corn leaves (348.4 ± 24.0 mg GAE/g extract, p<0.05).
Similar to TPC, the ethanol extraction tended to have higher TFC than DI water extraction. The highest TFC was found in the 80% ethanol extract of corn tassels (513.3 ± 49.6 mg QE/g extract, p<0.05) as shown in Table 1. However, the lowest TFC was occurred in the DI water extract of corn leaves and tassels.
The previous study (Thitipramote et al., 2022b) using the shaking extraction method showed TPC rangingfrom267.5to736.5mg GAE/gextract.Thestudydemonstratedthatthe80%ethanolextraction ofcornstalks,leaves,andtasselstendedtohavegreaterTPCthanDIwaterextraction.TheUAEmethod in this study showed TPC ranging from 348.4 to 661.9 mg GAE/g extract which showed TPC ranging in the order: the 80% ethanol extract of corn tassels > the DI water extract of corn stalks > the DI water extract of corn tassels. When comparing only green solvents (DI water and 80% ethanol), the Thitipramote et al. (2022b) study showed TFC ranging from 15.1 to 570.7 mg QE/g extract. The study demonstratedthat the 80% ethanol extractionof corn stalks, leaves, and tasselsextractshad higher TFC than the DI extraction using the shaking extraction method. This study showed TFC ranging from 26.1 to 513.3 mg QE/g extract and demonstrated that TFC ranges in the order: of the 80% ethanol extract of corn tassels> the DI water extractof corn leaves > the 80% ethanol extract of corn stalks. Both shaking extraction methods and UAE methods could exert phenolic compounds but the advantage of UAE consumed less time. A previous study showed that the ethanolic and methanolic of corn tassels extract had higher total phenoliccontent than other solvents (Mohsenand Ammar, 2009). However, this study showed that CARs extracts had greater TPC than TFC except for the 80% ethanol of corn leaves. Flavonoids commonly found in plants are an indispensable part of the human diet, especially for compounds found in corn silk and corn husks. (Tian et al., 2021 and Zuorro et al., 2019). This study also found in corn stalks, leaves, and tassels. Furthermore, the ethanolic extracts of CARs had higher TFC than the aqueous extracts of CARs. The ethanol extraction might elucidate TFC better than aqueous extraction.
3.2 Antioxidant activities
Antioxidant capacitydescribes the abilityof redox moleculesin biological systems to scavenge free radicals of which excessive free radicals lead to cellular damage, mutation, cell death, and accelerated
aging (Rahaman et al., 2023). There is increasing interest in natural antioxidants for cosmetic ingredients in skin care instead of using chemicals that natural antioxidants could promote skin health and also protect the skin against various harmful factors, including ultraviolet radiation and free radicals DPPH, ABTS, and FRAP assays were used in this study to determine the antioxidant activity of CARs.
Table 1 Extractable yield and bioactive compounds [total phenolic (TPC) and flavonoid (TFC) contents] of CARs extracts including stalks, leaves, and tassels with Deionized (DI) water and 80% ethanol extractions
CARs Solvents
*Values are given as mean ± S.D. (n=3)
*Different superscribe letters (a-e) in the same column indicate significant differences in values (p<0.05, ANOVA, Duncan’s test).
DPPH radical scavenging activity of CARs extracts significantly differed among CARs extracts as shown in Figure 1A. Among CARs, the 80 % ethanol extract of corn leaves showed the highest antioxidant activity (709.4 ± 7.6 mg TEAC/g extract, p<0.05) while the DI water extract of corn leaves had the lowest antioxidant activities. (160.4 ± 25.1 mg TEAC/g extract, p<0.05, respectively).
In contrast, the 80% ethanol extract of corn tasselshadthe highest antioxidant activityinthe ABTS assay (4,171.5 ± 47.8 TEAC/ g extract, p<0.05, respectively) as shown in Figure 1B followed by the DI water extract of corn tasselsand stalks (2,330.3± 84.4and 2,249.0± 86.3 mgTEAC/ gextract, p<0.05). The lowest antioxidant activity was found in the DI water extract of corn leaves.
TheresultsofantioxidantactivityusingFRAPassaywereshowninFigure1C.Theresultsindicated that the 80% ethanol of extract corn tassels had the highest antioxidant activity (749.3 ± 15.4 mg TEAC/g extract, p<0.05). While, the DI water extract of corn tassels had the lowest antioxidant activity (164.8 ± 9.2 mg TEAC/g extract, p<0.05). The ethanol extraction tended to have greater antioxidant activity in FRAP than DI water extraction.
This study demonstrated that the 80% ethanol extraction of CARs had greater antioxidant activities in all assays than the DI water extraction, especially in corn leaves and tassels The DPPH assay results showed that the antioxidant activity tended to correlate with TFC. While other assays showed higher both TPC and TFC had greater antioxidant activities. Thus, some constituents of flavonoids might play an important role in antioxidant activities in CARs by the UAE method as well as corn silk (Zheng et al , 2016).
Thitipramote et al. (2022b) showed that the 80% ethanol extract of corn tassels had higher antioxidant activities in ABTS and FRAP similar to this study, while the 80% ethanol extract of corn stalksexhibitedthegreatestantioxidant activityintheFRAPassaydifferent fromthisstudythat showed inthe80%ethanol extractofcornleaves Furthermore,otherstudiesalsoshowedthattheethanolextract of corn tassels had higher antioxidant activities than DI water extraction, while the ethyl acetate extract of corn stalks had higher antioxidant activity (Jung et al., 2014; Mohsen & Ammar, 2009). The 80% ethanolextractsofCARstendedtohave greaterantioxidantactivitiesinbothshakingandUAEmethods except corn stalks. Thus, the 80% ethanol might be a suitable solvent for extraction to elucidate the antioxidant activity of CARs, especially leaves, and tassels.


Figure 1 Antioxidant activities by using (A) DPPH radical scavenging activity (B) ABTS radical scavenging activity and (C) Ferric reducing antioxidant power (FRAP) of CARs (corn stalks, leaves, and tassels) with Deionized water and 80% ethanol extraction. The error bars represent the standard deviation of the mean. The differences on each histogram letters (a-g) indicate significant difference values (p< 0.05, ANOVA, Duncan test).
(B)
(C)
3.3 Anti-tyrosinase activity
Tyrosinase, the rate-limiting enzyme for the biosynthesis of melanin, catalyzes the oxidation of the substances that transform into melanin. Therefore, tyrosinase inhibitors have gained a lot of use in cosmeceuticals as whitening agents. Although, Kojic acid, as the positive control, showed the highest anti-tyrosinase activity, the DIwater extract of corn stalks exhibited the greatest anti-tyrosinase activity among CARs extracts (54.9 ± 0.6 and 33.8 ± 1.6 %inhibition, p<0.05, respectively). Previous studies showed that by-products of corn exhibited anti-tyrosinase activity. Wang et al., (2020) showed that hydrolysate in post-washing liquor of steam-exploded corn stalk exhibited anti-tyrosinase activity with an IC50 value of 2.17 mg/mL as well as butanol fraction of corn cob with an IC50 value of 99.92 µg/mL (Harahap, et. al.,2024). Yucharoen et al., (2023) demonstrated that the ethanolic extract of corn silk showed strong tyrosinase inhibition with an IC50 value of 12.45 µg/mL that could benefit the development of commercial cosmetic products However,there was no studyoncornleavesandtassels. This study showed that DI water extraction tended to have greater anti-tyrosinase activity than 80% ethanol extracts, especially in corn stalks and tassels. This might suggest that the aqueous extraction could elucidate bioactive compounds inhibiting tyrosinase activity. Among the DI water extract of CARs, the DIwater extract of corn stalks exhibited higher anti-tyrosinase activityas well asTFC.Thus, TFC might play an important role in inhibiting tyrosinase activity.
Table 2 Anti-tyrosinase activity (%inhibition) of CARs including corn stalks, leaves, and tassels at a concentration of 4 mg/mL with Deionized (DI) water and 80% ethanol and kojic acid at a concentration of 250 µg/mL.
CARs Solvents
Kojic acid
Stalks DI water
80% Ethanol 15 9 ± 2.4 c
Leaves
DI water ND
80% Ethanol
*Values are given as mean ± S.D. (n=3)
*Different superscribe letters (a-e) in the same column indicate significant differences in values (p<0.05, ANOVA, Duncan’s test).
** ND = Not detectable
4. Conclusion
Corn agro-residues including their stalks, leaves, and tassels had phytochemicals, especially phenolic and flavonoid contents as corn maize. Ultrasound-assisted extraction method could extract phenolic compounds in CARs with the advantage of less time than shaking extraction. However, the extraction time used in this study may have been too short, therefore the extraction time should be increased to obtain better active compounds. Furthermore, the green solvents (DI water and ethanol) could exert bioactive compounds (phenolic and flavonoid contents) as well as antioxidant activities. Antioxidant capacities tended to be greater in the 80% ethanol of CARs, especially (leaves, and tassels extracts). Furthermore, the tendency of tyrosinase inhibitory activity was high in these CARs stalks extracts (especially the DI water extraction). Therefore, corn agro-residues using green solvent extraction can be value-added and utilized as an alternative source for natural active ingredients in cosmetic and related applications.
5. Acknowledgements
The authors are grateful to the Center of Excellence in Natural Products Innovation (CENPi), School of Cosmetic Science, and others in Mae Fah Luang University for financial and facilities
supports.
6. References
Chemat, F., Abert, V.M., Ravi, H.K., Khadhraoui, B., Hilali, S., Perino, S. & Tixier, A.F. (2019). Review of Alternative Solvents for Green Extraction of Food and Natural Products: Panorama, Principles, Applications and Prospects. Molecules, 24(16), 3007.
Dong, J , Cai, L , Zhu, X , Huang, X , Yin, T , Fang, H. & Ding, Z. (2014) Antioxidant Activities and Phenolic Compounds of Cornhusk, Corncob and Stigma Maydis. Journal of the Brazilian Chemical Society, 25(11), 1956-1964.
Harahap, A., Triamarta, S., Kharisma, D., Hanifah, W., Iqbal, M., Arifa, N., & Ismed, F. (2024). Evaluation of the anti-tyrosinase-anti-aging potential and metabolite profiling from the bioactive fraction of corn cob (Zea Mays L.). International Journal of Applied Pharmaceutics, 16(1), 71–76.
Jung, Y J , Park, J H , Seo, K H , Sabina, S , Lee, D S , Kim, Y C , Kang, H C , Kim, J. & Baek, N I (2014). Phenolic compounds from the stems of Zea mays and their pharmacological activity. Journal of the Korean Society for Applied Biological Chemistry, 57, 379–385.
Kumar, K., Srivastav, S. & Sharanagat, V.S. (2021). Ultrasound assisted extraction (UAE) of bioactive compounds from fruit and vegetable processing by-products: A review. Ultrasonics Sonochemistry, 70, 105325.
Mehta, N.S.J., Kumar, P., Verma, A.K., Umaraw, P., Khatkar, S.K., Khatkar, A.B., Pathak, D., Kaka, U. & Sazili, A.Q. (2022) Ultrasound-Assisted Extraction and the Encapsulation of Bioactive Components for Food Applications. Foods, 11(19), 2973.
Mohsen, S M & Ammar, A S M. (2009). Total phenolic contents and antioxidant activity of corn tassel extracts. Food Chemistry, 112(3), 595-598.
Office of Agricultural Economics. Annual agricultural production data. 2023. Retrieved from https://www.oae.go.th
Rahaman, M M , Hossain, R , Herrera-Bravo, J , Islam, M T , Atolani, O , Adeyemi, O S , Owolodun, O A , Kambizi, L , Daştan, S D , Calina, D. & Sharifi-Rad, J. (2023). Natural antioxidants from some fruits, seeds, foods, natural products, and associated health benefits: An update. Food Science and Nutrition, 11(4), 1657-1670.
Sheng, S., Li, T. & Liu, R. (2018). Corn phytochemicals and their health benefits. Food Science and Human Wellness, 7(3), 185-195.
Sinpiboon,C. & Chaichana,T. (2021). Zero waste management and reducinggreenhouse gasemissions fromelectricalproductionbyusingmaize residuebriquettefuel.[UnpublishedMaster’sthesis]. Maejo University. http://ir.mju.ac.th/dspace/handle/123456789/846.
Tengkaew, S. & Wiwattanadate, D. (2014). Study of Source and Potential of Biomass from Field Corn in Thailand. Princess of Naradhiwas University Journal, 6(3), 102-111.
Thitipramote, N , Pradmeeteekul, P , Nimkamnerd, J , Chaiwut, P , Pintathong, P. & Thitilerdecha, N. (2016). Bioactive compounds and antioxidant activities of red (Brown Red Jasmine) and black (Kam Leum Pua) native pigmented rice. International Food Research Journal, 23(1), 410-414.
Thitipramote, N , Imsonpang, S , Sukphopetch, P , Pradmeeteekul, P , Nimkamnerd, J.& Nantitanon, W. (2022a). Chaiyana W. Health Benefits and Safety of Red Pigmented Rice (Oryza sativa L.): In Vitro, Cellular, and In Vivo Activities for Hair Growth Promoting Treatment. Cosmetics, 9(6), 111.
Thitipramote, N., Pradmeeteekul, P., Nimkamnerd, J., Vongnititorn, P. & Nantitanon, W. (2022b). Utilization of Corn (Zea mays) Agro-residues as Natural Active for Cosmetic Application. Proceeding of Cosmetic and Beauty International Conference, 1-8.
Tian, S., Sun, Y., & Chen, Z. (2021). Extraction of Flavonoids from Corn Silk and Biological Activities In Vitro. Journal of Food Quality, 2021, 1-9.
Wang, R , Wang, G , Sui, W , Zhou, C , Li, S., Ji, Y. & Chuanling, S. (2020). Tyrosinase inhibitory performance of hydrolysate from post-washing liquor of steam exploded corn stalk and its fractionation enhancement. Industrial Crops and Products. 154.
Yucharoen, R., Srisuksomwong, P., Julsrigival, J., Mungmai, L., Kaewkod, T., & Tragoolpua, Y. (2023). Antioxidant, Anti-Tyrosinase, and Anti-Skin Pathogenic Bacterial Activities and Phytochemical Compositions of Corn Silk Extracts, and Stability of Corn Silk Facial Cream Product. Antibiotics, 12(9), 1443.
Zuorro, A., Lavecchia, R., González-Delgado, Á. D., García-Martinez, J. B., & L’Abbate, P. (2019). OptimizationofEnzyme-AssistedExtractionofFlavonoidsfromCornHusks. Processes,7(11), 804.
Proceeding of Cosmetic and Beauty International Conference (CBIC) 2025 & International Conference on Integrative Medicine (ICIM) 2025 16th-17th January 2025
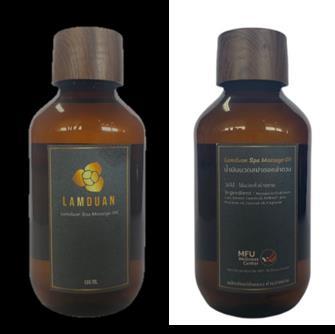
Survey of spa services experience and satisfaction with Lamduan (Melodorum Fruticosum L.) massage oil
Narunan Wuttisin*, Alitsara Khanom and Natjakron Damsuwan
School of Cosmetic Science, Mae Fah Luang University, Chiang Rai 57100, Thailand
*Corresponding author: E-mail: wnarunan@mfu.ac.th
ABSTRACT
Introduction: Melodorum fruticosum L. (Lamduan) oil contains constituents with relaxation properties. Theobjectives ofthisstudywere tosurvey thespaservice experiences ofvolunteers and investigate their satisfaction with Lamduan massage oil. The findings from this research could be used to develop a Lamduan massage oil formulation for use in spas.
Methods: A questionnaire was used to survey the spa experience. In addition, the volunteers were asked to apply 1-2 drops of Lamduan massage oil to their backhands and rub it for 1 minute. Afterward, they were asked to evaluate their satisfaction with the Lamduan massage oil.
Results: The study population comprised 435 volunteers from Chiang Rai Province. Many of them were women aged between 37-44 years. The percentage of volunteers who had never received spa services (65.50%) was higher than those who had received spa services (34.50%). Most volunteers received spa services only once per year (60.70%). The most spa menu experience was Thai massage (74.70%). Only 57 volunteers received an aromatherapy massage and 82.50% preferred floral-scented essential oils. The volunteers were asked to evaluate their satisfaction with Lamduan massage oil. The results showed that the volunteers were highly satisfied with the Lamduan massage oil, particularly in color, oil distribution, and skin moisture.
Conclusion: Many volunteers had no prior experience with spa services, and only a few had received aromatherapy massages to reduce stress. Overall, the satisfaction of volunteers with Lamduan massage oil was excellent. However, Lamduan massage oil still needs further development based on the volunteers' suggestions, such as improvements in packaging, oil viscosity, and occlusive properties, to enhance its effectiveness and distribution in spas.
Keywords: Aromatherapy; Lamduan oil; Massage oil; Melodorum Fruticosum L.; Spa
1. Introduction
Spa originated from the Latin word “Sanitas per Aquas” which means health through water. Spa provides a variety of professional services that encourage a renewal of the mind, body, and spirit (Benedetto and Milikan, 1996). Thailand has long been a leader in the spa and wellness tourism sector. According to the Thailand Spa Association, there are over 2,500 spas across the country, ranging from high-end resort spas to local wellness centers (Ministry of Public Health, 2014). The country is famous for its traditional healing arts, including Thai massage, herbal treatments, and the use of aromatic oils in spa therapies. Aromatherapy is the therapeutic use of essential oils administered via inhalation and topically through bathing, compresses, and massage (Battaglia, 1995). The growing demand for aromatherapy and spa services globally is driven by multiple factors, including increasing consumer awareness of wellness, stress reduction, and the desire for natural and holistic health solutions. Aromatherapy has grown in popularity in Thailand as more people seek natural and non-invasive
treatments for stress, anxiety, and various health concerns. Essential oils are obtained from raw plant materials (flowers, leaves, roots, herbs, wood, bark, branches, seeds, fruits, etc.) by distillation, expression, and maceration (Kiełtyka-Dadasiewicz and Gorzel, 2014). Essential oils are blended with carrier oils and absorbed into the skin during aromatherapy massage (Ernst, 2004; Field et al., 2007; Field et al., 1997; Kim et al., 2005). In addition, essential oil can be inhaled through the lining of the nasal cavity. These aromatic molecules can affect the hypothalamus, autonomic nervous system, and endocrine system. Aromatherapyprovides manybenefits such as decreasingstress (Varneyand Buckle, 2013), promoting blood circulation, regulating heart rate and blood pressure, improving hormonal coordination (Huang et al., 2014), uplifting mood and increasing energy (Malathi, 2014). The most commonly used essential oils in Thai spas include lavender, lemongrass, orange, peppermint jasmine, frangipani, and eucalyptus, all of which have strong therapeutic properties (Patin et al., 2009)
Melodorum fruticosum L. (Devil tree, White cheesewood, or Lamduan) belongs to the Annonaceae family (Pripdeevech and Chukeatirote, 2010). Lamduan has been used as a tonic and a mild cardiac stimulant to reduce fever and as a hematinic to resolve dizziness (Rujjanawate et al., 2008). Lamduan oil was extracted from flowers by steam distillation and investigated by GC-MS. It was found that Lamduanoil was composedof88identifiedvolatileconstituents.Themajorcomponentswereα-pinene, myrcene, and linalool (Pripdeevech and Chukeatirote, 2010). α-Pinene has been shown to improve cognitive function, increase focus and alertness (Volicer et al., 1997), anti-inflammatory (Mercier et al., 2009; Zhou et al., 2004), anti-depressant (Ahmad et al., 2013), anti-convulsant (Consroe et al., 1981), anti-oxidant (Singh et al., 2006), anti-tumoral (Eftekhar et al., 2004) and anti-nociceptive effects (Him et al., 2008). Inhalation of α-pinene in mice produced an anxiolytic effect (Kasuya et al., 2015). Myrcene plays a significant role in muscle relaxation and relaxation from mental stress (Anibijuwon, 2010). Linalool, a monoterpene is the major component of the essential oil produced by several wellknown species including Lavandula augustifolia Mill., Melissa officinalis L , Rosmarinus officinals L. and Cymbopogon citratus DC. which were traditionally used in folk medicine and aromatherapy (Elisabetsky et al., 1995) due to the calming, stress-relieving and relaxing effect (Buchbauer et al., 1991; Buchbauer et al., 1993; Shulz et al., 1998).
Lamduan oil contains constituents that provide relaxation properties, makingit suitable for addition to massage oil. This research aims to survey the spa services experience of volunteers and investigate their satisfaction with Lamduan massage oil. The results obtained from this research might be used to develop the formulation of Lamduan massage oil for use in spas. The data of spa services experiences were further used to set up the spa services in Chiang Rai.
2. Materials and Methods
2.1 Massage oil preparation
Lamduan massage oil (Figure 1) was obtained from the MFU Wellness Center at Mae Fah Luang University. The ingredients of the massage oil are listed in Table 1.
Table 1 Ingredients of Lamduan massage oil by MFU Wellness Center, Mae Fah Luang University.
Oryza Sativa (Rice bran oil) < 0.1%
Cocos Nucifera (Coconut oil) < 0.1%
Octyldodecanol < 0.1%
Ribes Nigrum (Black Current seed oil) < 0.1%
Helianthus Annuus (Sunflower seed oil unsaponofiables) < 0.1%
Cardiospermum Halicacabum (Flower/Leaf/Vine Extract) < 0.1%
Tocopherol < 0.1%
Helianthus Annuus (Sunflower seed oil) < 0.1%
Rosmarinus Officinalis (Rosemary leaf extract) <0.1%
Lamduan fragrance 1.2
Brassica Campestris (Rapeseed oil) Adjust to 100
2.2 Participants
Thestudypopulation comprised 435 volunteersfromChiangRai Province,residingin ChiangSaen District, Phan District, and Mueang Chiang Rai District. The volunteers' ages ranged from 20 to over 61 years. The inclusion criteria required volunteers to agree to participate in the study by signing a consent form and expressing interest in spa services. The exclusion criteria included individuals with underlying conditions such as skin diseases, sinusitis, hypertension, and asthma, those with a history of allergies to essential oils, and pregnant or lactating women. The sample size was calculated using the formulabyTaroYamane(1973).ThisstudywasapprovedbytheEthicsinHumanResearchCommittee of MFU (No. EC 20244-17).
2.3 Irritation
Test
Theirritationtestwasconductedwith10participants,aged22years.OnedropofLamduanmassage oil was placed on Finn chambers and attached to the inner arm. After 24 hours, the patch was removed and the skin was examined for irritation or erythema. Clinical evaluation of skin irritation and erythema was performed using the visual scoring scale of the International Contact Dermatitis Research Group (ICDRG), as follows: 0 = negative reaction, 1 = weak reaction, 2 = strong reaction, and 3 = extreme reaction. The results were presented as the mean irritation index (M.I.I.) value:
M.I.I. = Total cutaneous reactions score (Erythema+Oedema)
Number of volunteers
2.4
Survey design
The volunteers were asked to apply 1-2 drops of Lamduan massage oil to their backhands and rub it for 1 minute. They were then instructed to inhale the oil and observe its color and texture. The satisfaction questionnaire was created using Google Forms (https://forms.gle/tkB9rRJoo93upwqh7).
The study period lasted 4 months, from January 2021 to April 2021. The questionnaire was divided into 5 parts:
Part 1: Personal information, including gender, age, occupation, income, underlying health conditions, and history of chemical and herbal allergies.
Part 2: Spa experience, includingthe frequencyof receivingspa services and thetypes of spa treatments the volunteers have received.
Part 3: Aroma massage oil service experience, including the frequency of receiving aroma massage, characteristicsofmassageoilsthatareconvenienttouse,preferredtypesofessentialoils,priceofaroma massage oil, duration of aroma massage session, and the reasons for choosing aroma massage oil.
Part 4: Volunteers' satisfaction with Lamduan massage oil, including physical characteristics, the feeling during use, the feeling after use, and overall satisfaction with the product.
The satisfaction level of volunteers was calculated using the Five Point Likert scale. The criteria for interpreting satisfaction were divided into 5 levels as follows: 4.21-5.00 (Excellent), 3.41-4.20 (Very good), 2.61-3.40 (Good), 1.81-2.60 (Medium), and 1.00-1.80 (Poor).
Figure 1 Lamduan massage oil
Part 5: Additional suggestions for product improvements.
The questionnaire was pretested to evaluate the clarity and sequence of content before the actual survey among 20 persons whose characteristics were reasonably similar to the survey participants.
2.5 Data analysis
Descriptive statistics were used to describe the demographic characteristics, spa service experience, aroma massage oil service experience, and the satisfaction of volunteers with Lamduan massage oil. The results were presented as percentages. The satisfaction of volunteers with the physical characteristics of Lamduan massage oil was expressed as Mean ± S.D. To assess the association betweencategorical variables,Pearson’schi-squaretestwasemployed.Thistestisusedfordetermining whether there is a significant relationship between two categorical variables including relationship between gender, age, occupation, and spa experience on satisfaction with Lamduan massage oil.
3. Results and Discussion
3.1 Irritation Test
Skinirritationand erythemacausedbyLamduan massageoil wereevaluatedusingthevisual scoring scale of ICDRG and theM.I.I. The results showed noirritation or erythema after 24hoursof application (M.I.I. = 0). Therefore, Lamduan massage oil was considered safe.
3.2 Demographic characteristics
ThedemographiccharacteristicsofthevolunteersarepresentedinTable2.Atotalof435volunteers responded to the online questionnaire. Most were women (83.90%), with ages ranging from 37 to 44 years (26.00%), 20 to 28 years (23.20%), and 29 to 36 years (20.70%). The majority of volunteers had a monthly income between 15,000 and 20,000 THB (38.90%). Most volunteers had no underlying diseases (92.00%) and no history of chemical or herbal allergies (99.10%).
Table 2 Demographic characteristics.
3.3 Spa services experience
The spa service experience of volunteers is presented in Table 3. Most volunteers had never received a spa treatment (65.50%), while 34.50% had. Among those who had received spa services, 60.70% reported receiving them only once per year. The most common spa treatments received were Thai massage (74.70%), Thai massage with oil (38.70%), herbal compress massage (38.00%), aromatherapy massage (38.00%), facial and body massage (35.30%), facial and body scrub (31.30%), facial and body mask (18.70%), hot stone massage (8.00%), Swedish massage (4.70%), lymphatic drainage massage (1.40%), and herbal sauna (1.40%). Thai massage is particularly popular due to its health benefits. Research has shown that Thai massage can significantly reduce stress and muscle tension, improve blood circulation, enhance flexibility, and promote mental relaxation (Li et al., 2019).
Table 3 Spa services experience.
Behaviors
3.4 Aroma massage oil service experience
The aroma massage oil service experience of volunteers is presented in Table 4. Only 38.00% of volunteers had used massage oil. The most common frequency of receiving aroma massage was once per year (54.40%).Thepreferredtypes of massage oil productschosenbyvolunteers were oil (91.20%), cream (7.00%), and spray (1.80%), respectively. The most popular scents selected by volunteers for aroma massage were floral (82.50%) and herbaceous (50.90%). Previous studies have shown that certain floral scent compounds are pleasant and relaxing, making them effective for therapy in treating psychological and physiological conditions (Corley, 2007; Lorig and Schwarta, 1988). Volunteers chose to receive aroma massage services at a price range of 1,000-1,999 (63.20%). The most common duration for the service was 1.30 hours (52.60%). Volunteers had various reasons for receiving aroma massage, including reducing stress (86.00%), relieving muscle pain (66.70%), nourishing skin (54.40%), and improving sleep (33.30%). Additionally, aromatherapy has proven to be an effective treatment for reducing stress and anxiety levels (Paula et al., 2017).
Table 4 Aroma massage oil service experience.
Characteristics of massage oil that are convenient to use (N = 57)
essential oils that volunteers prefer*
(N = 57)
* More than one answer can be chosen.
3.5 The satisfaction of volunteers with Lamduan massage oil
Thesatisfaction of volunteers with Lamduan massage oil is presentedinTable 5.The surveyfound that volunteers were highly satisfied with the color of Lamduan massage oil, rating it at an excellent level (4.63±0.56). The highest satisfaction was reported with the moisturization of the skin (4.46±0.65) and the oil's distribution on the skin (4.25±0.64). Satisfaction with the odor (4.02±0.68) and packaging (3.93±0.79) of Lamduan massage oil was rated at a very good level. This could be attributed to the preference for Thai essential oils (i.e., oils derived from plants cultivated in Thailand) over essential oils from plants cultivated outside of Thailand (Patin et al., 2009). Based on the survey results, the use of Lamduan massage oil should be encouraged in Thai spas.Therefore, these characteristics, alongwith its pleasant fragrance, should be promoted to meet the demands of the spa industry.
In addition, volunteers provided suggestions for improving the packaging of Lamduan massage oil, such as adjusting the font size and color of the labels for better visibility and readability, making the packaging smaller for portability, and including a dropper to prevent dirt and stains. A previous study indicated that packaging design, color, size, and shape influence purchasing decisions. Packaging must be strong and eye-catching, as it helps customers make quick purchasing decisions (Rojanadilok
et al., 2013).
Table 5 The volunteers' satisfaction with Lamduan massage oil.
Satisfaction details
Physical characteristics
when applying massage oil
0.79
The data were expressed as Mean±S.D. (N=435).
3.6 Volunteers' feelings after applying Lamduan massage oil.
Thevolunteers’ feelingsafter applyingLamduan massageoil areshowninTable6.Most volunteers were satisfied with the scent of Lamduan massage oil (97.00%), while some volunteers expressed dissatisfaction and suggested enhancing the scent. A few volunteers reported noticing a rancid smell in Lamduan massage oil. Therefore, it is suggested that an antioxidant should be added to reduce rancidity and improve stability. Most volunteers felt that the texture was light (89.90%), while some found it too heavy and recommended reducing the thickness to allow the oil to penetrate the skin more easily. Most volunteers felt relaxed (66.70%) and refreshed (51.00%) after smelling the massage oil. These results may be attributed to mood and emotional states, such as the pleasure of relaxation, invigoration, or pleasant memories evoked by the scent of essential oils (Perry et al., 2006). Additionally, 42.30% of volunteers reported feeling pleasant after smelling the oil, while a small percentage found the scent unpleasant (1.60%). Only 0.90% of volunteers felt dizzy after smelling the massage oil, and all volunteers (100.00%) reported no irritation after use.
Table 6 Volunteers' feelings after applying Lamduan massage oil
3.7 The relationship between gender, age, occupation, spa experience, and satisfaction with Lamduan massage oil
The relationship between gender, age, occupation, spa experience, and satisfaction with Lamduan massage oil was determined using Pearson’s chi-square and is presented in Table 7. Volunteers of different genders showed varying levels of satisfaction with the odor, color, oil distribution, skin moisture, occlusive properties, and overall satisfaction with Lamduan massage oil, at different significance levels (P<0.05). There were significant differences in volunteer satisfaction regarding color, packaging, oil absorption, oil viscosity, scent, and oil residue based on age (P<0.05). Age also influences skin penetration, as the structure of the skin changes with increasing age. The stratum corneum becomes drier as the activity of sebaceous glands decreases and surface lipids diminish. Studies have noted a marked decrease in lipids, particularly up to the age of 50 (Rogers et al., 1996). Satisfaction with the odor, oil viscosity, and scent of the oil showed significant differences (P<0.05) across different occupations. Additionally, volunteers who had experienced spa services, whether previously or not, showed significant differences in satisfaction with oil distribution and skin moisture (P<0.05).
4. Conclusion
Most volunteers had never received a spa treatment, and only a few had experienced an aromatherapy massage for stress reduction. Volunteers rated their satisfaction with the color, oil distribution, and skin moisture of Lamduan massage oil as excellent. However, further development is needed based on volunteer suggestions, including improvements to the packaging, oil viscosity, occlusive properties, and scent, in order to enhance its effectiveness and suitability for use in spas.
5. Suggestion
This survey focused on the satisfaction with Lamduan massage oil for potential use in spa and wellness centers. Future studies should focus more on the volunteer outside Chiang Rai province and investigate the effectiveness of Lamduan massage oil. Additionally, improvements to its physical properties are recommended, and further research should explore its long-term effects on the psychological well-being of volunteers.
6. Acknowledgements
We would like to express our gratitude to the MFU Wellness Center, Mae Fah Luang University, for providingLamduan massage oil for this study, and to the volunteers who participated bycompleting the questionnaire
Table 7 Relationship between gender, age, occupation and spa experience to satisfaction of Lamduan massage oil.
* Significantly difference (P<0.05) .
7. References
Ahmad, A., Husain, A. & Mujeebetal, M. (2013). A review on therapeutic potential of Nigella sativa: a miracle herb. Asian Pacific Journal of Tropical Biomedicine, 3, 337-352.
Anibijuwon, II (2010). Studies on extracts of three medicinal plants of South-Western Nigeria: Hoslundia opposita, Lantana camara and Cymbopogon citratus The Journal of Applied Science, 4, 93-98.
Battaglia, S. (1995). The complete guide to aromatherapy. The Perfect Portion, Queensland.
Benedetto, A.V & Millikan, L.E. (1996). Mineral water and spas in the United States. Clinics in Dermatology Journal, 14, 583-600.
Buchbauer, G., Jirovetz, L., Jager, W., Dietrich, H. & Plank, C. (1991). Aromatherapy evidence for sedative effects of the essential oil of lavender after inhalation. Zeitschrift für Naturforschung C, 46, 1067-1072.
Buchbauer, G., Jirovetz, L., Jager, W., Plank, C. & Dietrich, H. (1993). Fragrance compounds and essential oils with sedative effects upon inhalation. Journal of Pharmaceutical Sciences, 82, 660-664.
Eftekhar, F., Yousefzadi, M. & Borhani, K. (2004). Anti-bacterial activity of the essential oil from Ferula gummosa seed. Fitoterapia, 75, 758-759.
Elisabetsky, E., Coelho de Souza, G.P., Dos Santos, M.A.C., Siqueira, I.R. & Amador, T.A. (1995). Sedative properties of linalool. Fitoterapia, 5, 407-414.
Ernst, E. (2004). Musculoskeletal conditions and complementary alternative medicine. Best Practice & Research Clinical Rheumatology, 18(4), 539-556.
Field,T.,Hernandez-Reif,M.,Seligmen,S.,Krasnegor,J.,Sunshine,W.,Rivas-Chacon,R.,Schanberg, S. & Kuhn, C. (1997). Juvenile rheumatoid arthritis: Benefits from massage therapy. Journal of Pediatric Psychology, 22(5), 607-617.
Field, T., Diego, M., Hernandez-Reif, M. & Shea, J. (2007). Hand arthritis pain is reduced by massage therapy. Journal of Bodywork and Movement Therapies, 11(1), 21-24.
Him, A., Ozbek, H., Turel, I. & Oner, A.C. (2008). Anti-nociceptive activity of alpha-pinene and fenchone. Pharmacologyonline, 3, 363-369.
Huang, S.H., Fang, L. & Fang, S.H. (2014). The effectiveness of aromatherapy with lavender essential oil in relieving post arthroscopy pain. JMED Research Journal, 1-9.
Kasuya, H., Okada, N., Kubohara, M., Satou, T., Masuo, Y. & Koike, K. (2015). Expression of BDNF and TH mRNA in the brain following inhaled administration of α-pinene. Phytotherapy Research, 29(1), 43-47.
Kim, M.J., Nam, E.S. & Paik, S.I. (2005). The effects of aromatherapy on pain, depression, and life satisfaction of arthritis patients. Taehan Kanho Hakhoe Chi, 35, 186-194.
Kiełtyka-Dadasiewicz, A & Gorzel, M. (2014). Alternative therapies. Aromatherapy raw materials and treatments. European Journal of Medical Technologies, 1, 72-79.
Li, H , Zhao, M , Shi, Y , Xing, Z , Li, Y , Wang, S , Ying, J , Zhang, M , & Sun, J. (2019). The effectiveness of aromatherapy and massage on stress management in nurses: A systematic review. Journal of Clinical Nursing, 28(3-4), 372-385.
Lorig,T.S&Schwarta,G.E.(1988).BrainandodorI.AlterationofhumanEEGbyodoradministration. Psychobiology, 16, 281-289.
Malathi, T. (2014). A study to assess the effectiveness of aromatherapy massage on level of anxiety among elderly people residing in selected old age homes at tirunelveli. Tamilnadu Dr. M. G. R. Medical University, Chennai.
Mercier, B., Prost, J. & Prost, M. (2009). The essential oil of turpentine and its major volatile fraction (α- and β-pinenes): A review. International Journal of Occupational Medicine and Environmental Health, 22(4), 331-342.
Ministry of Public Health. (2014). Health service standards for overseas establishment. Ministry of Public Health, Nonthaburi.
Patin, R., Kanlayavattanakul, M. & Lourith, N. (2009). Aromatherapy and essential oils in Thai spa business Isan Journal of Pharmaceutical Sciences, 5(2), 160-166.
Paula, D., Luís, P., Olívia, R.P. & João, S.M. (2017). Aromatherapy in the control of stress and anxiety. Alternative and Integrative Medicine, 6, 248.
Perry, N & Perry, E. (2006). Aromatherapy in the management of psychiatric disorders clinical and neuropharmacological perspectives. CNS Drugs, 20, 257-280.
Pripdeevech, P & Chukeatirote, E. (2010). Chemical compositions antifungal and antioxidant activities of essential oil and various extracts of Melodorum fruticosum L. flowers. Journal Food and Chemical Toxicology, 48(10), 2754-2758.
Rogers, J., Harding, C., Mayo, A., Banks, J. & Rawlings, A. (1996). Stratum corneum lipids: the effect of ageing and the seasons. Archives of Dermatological Research, 288, 765-770.
Rojanadilok, T & Nanagara, B. (2013). Marketing strategies of herbal cosmetic products: Thai and imported products. Journal of Economics and Behavioral Studies, 5, 242-251.
Rujjanawate, C., Hargreave, O.D., Sansomchai, P., Wongnut, P. & Hongsing, P. (2008). The Essence of Thai Herbs. PTT Publish Company Limited, Bangkok, Thailand, 189.
Shulz, H., Jobert, M. & Huebner, W.D. (1998). The quantitative EEG as a screening instrument to identify sedative effects of single dose of plant extracts in comparison with diazepam. Phytomedicine, 5, 449-458.
Singh, H.P., Batish, D.R., Kaur, S., Arora, K. & Kohli, R.K. (2006). α-Pinene inhibits growth and induces oxidative stress in roots. Annals of Botany, 98, 1261-1269.
Varney, E & Buckle, J. (2013). Effect of inhaled essential oils on mental exhaustion and moderate burnout: a small pilot study. Journal of Alternative and Complementary Medicine, 19(1), 6971.
Volicer, L., Stelly, M., Morris, J., McLaughlin, J. & Volicer, B.J. (1997). Effects of dronabinol on anorexia and disturbed behavior in patients with Alzheimer’s disease. International Journal of Geriatric Psychiatry, 12, 913-919.
Zhou, J.Y., Tang, F.D., Mao, G.G. & Bian, R.L. (2004). Effect of alpha-pinene on nuclear translocation of NF-kappa B in THP-1 cells. Acta Pharmacologica Sinica, 25, 480-484.
Proceeding of Cosmetic and Beauty International Conference (CBIC) 2025 & International Conference on Integrative Medicine (ICIM) 2025 16th-17th January 2025
Genomic characterization of extrachromosomal circular DNAs in cholangiocarcinoma
Zar Zar Win1 , Hasaya Dokduang3,4, Siriyakorn Kulwong2, Watcharin Loilome2,3 , Nisana Namwat2,3 , Thidathip Wongsurawat5, Piroon Jenjaroenpun5, Poramate Klanrit2,3 and Arporn Wangwiwatsin2,3,*
1 Department of Biochemistry, Faculty of Medicine, Khon Kaen University, Khon Kaen, 40002, Thailand
2 Department of System Bioscience and Computational Medicine, Faculty of Medicine, Khon Kaen University, Khon Kaen, 40002, Thailand
3 Cholangiocarcinoma Research Institute, Khon Kaen University, Khon Kaen University, Khon Kaen, 40002, Thailand
4 Faculty of Medicine, Maha Sarakham University, Maha Sarakham, 44000, Thailand
5 Division of Medical Bioinformatics, Department of Research, Faculty of Medicine, Siriraj Hospital, Mahidol University, Bangkok, 10700, Thailand
* Corresponding author email: arpowa@kku.ac.th
ABSTRACT
Introduction: Extrachromosomal circular DNAs (eccDNAs) have emerged as a novel contributor in cancer biology, especially regarding their potential correlation with increased oncogene copy numbers in various malignancies. Although eccDNAs have been detected in both normal and other malignant cells, their profiles and genomic landscape in cholangiocarcinoma (CCA) remain poorly explored. This study aims to explore eccDNAs in liver-fluke related CCA, a highly aggressive biliary tract cancer known for its significant heterogeneity and distinct molecular changes.
Methods: We conducted a modified CircleSeq technique and long-read Oxford Nanopore sequencing to investigate the eccDNAs in liver-fluke related CCA. Two enzymatic methods were applied for eccDNA isolation, allowing the characterization of eccDNA features unique to CCA, specifically their genetic composition and chromosomal origins.
Results: Our analysis revealed the distinctive nature of eccDNA in CCA, including a diverse array of lengths, and predominant origination from intergenic or non-coding areas of the genome. The notable difference in read-depth coverage of eccDNAs from cancer samples and their multi-chromosomal origins indicates that eccDNAs may serve as potential biomarkers or important additions to cholangiocarcinogenesis and chromosome instability.
Conclusion: Our findings revealed for the first time the distinction of eccDNA in liver flukeassociated cancer cell lines relative to a non-cancerous cell line. It also underscores the importance of evaluating the methodologies for eccDNA isolation from total DNA, as this may result in altered eccDNA profiles and the potential omission of certain eccDNA.
Keywords: eccDNAs, cholangiocarcinoma, bioinformatics
1. Introduction
Cholangiocarcinoma (CCA) is an aggressive biliary tract malignancy emerging from different anatomical locations of the biliary tree (Banales et al., 2016) The tumor's anatomical position complicates diagnosis and resection, presenting nonspecific symptoms in the initial stages. The global incidence rate has been increasing over the past few decades, especially in Southeast Asia, where liver fluke(Opisthorchis viverrini)infectionisstronglylinkedtotheonset ofCCA (Sripa&Kaewkes,2000). Genetic modificationsinbiliarymalignancyhave beeninvestigated, withprospective studiesenhancing efforts to label the cancer for diagnostic and therapeutic purposes (Jusakul et al., 2015). Despite this progress, the molecular factors driving the tumor diversity and unique markers of CCA remain under investigation.
Extrachromosomal circular DNAs (eccDNAs) are defined as double-stranded circular DNA structures derived from chromosomes and are detectable in both physiological and pathological conditions (Møller et al., 2018). After generation, these DNAs are thought to be independent from normal chromosomal genomesegregation (Kumar et al.,2017).EccDNAsareinvolvedin physiological functions in healthy cells, for instance, providing genetic diversity important for evolution (Møller et al., 2018) EccDNAs have been identified in whole-genome sequencing data of clinical cancer specimens. Nevertheless, the proportion of identifiable specimens was low, suggesting either the scarcity of eccDNA across cancer types or the challenges in detecting eccDNA from tissues (Bailey et al., 2024) EccDNAs in cancer cells may heighten disease adversity through oncogene amplification and enhance tumor heterogeneity (Chen et al., 2024; Hung et al., 2024; Turner et al., 2017)
Many studies have demonstrated promising roles of eccDNAs as biomarkers for liquid biopsies EccDNAs have been found in circulation of cancer patients and in an animal xenograft model (Kumar et al., 2017) Serum eccDNA levels can effectively differentiate between early and late stages of lung adenocarcinoma (Xu et al.,2022) Elevated eccDNA levels have beenobserved duringthe development of acute myeloid leukemia (Zeng et al., 2022) Besides the cancer field, eccDNAs have been detected in the blood serum of diabetic individuals (Kong et al., 2024) Moreover, fetal eccDNAs have been identified in maternal plasma and may be a better candidate for prenatal diagnostics due to their close circular structure (Sin et al., 2020)
In specific malignancies, such as liver fluke-associated CCA, eccDNAs have not been thoroughly examined (Koche et al., 2020). Additionally, existing methods for isolating eccDNAs from total DNA raise concerns about potential biases and their effects on the observed eccDNA profiles (Feng et al., 2022). These challenges highlight the importance of chosen approaches to accurately characterize eccDNA structures, particularly since their biogenesis may involve complex fragmentation and recombination of multiple chromosomal regions (Bailey et al., 2024; Koche et al., 2020).
In this study, we employed third-generation long-read Oxford Nanopore sequencing to achieve high-resolution analysis of eccDNA structures. Using this data, we compared eccDNAs derived from cancer and non-cancer cell lines, obtained using two distinct enzymatic methods for eccDNA isolation. OurworkaimedtoadvanceunderstandingofthegenomiccharacteristicsofeccDNAsinCCA,establish foundational knowledge of their features, and pave the way for exploring their potential as diagnostic biomarkers in precision medicine.
2. Materials and Methods
2.1 Cultivation and cell harvesting
The human CCA cell lines (KKU213A and KKU452) were cultured in Dulbecco’s modified Eagle’s medium (DMEM) culture medium supplemented with 10% fetal bovine serum (FBS; Gibco) and 100 units/mL penicillin (Invitrogen), and 0.1 mg/mL streptomycin (Invitrogen) at 37 °C with 5% CO2 and maximum humidity. The immortalized non-tumor cholangiocyte cells (MMNK1) were cultured in Ham’s F12 complete medium supplemented with 10% FBS (Gibco) in a humidified incubator with 5% CO2 at 37 ºC. Cells were maintained at 70-90% confluence and passaged regularly. For experiments, cells were trypsinized to collect as a pellet. After trypsinization, the cells were resuspended in medium and pelleted before further processing by centrifugation (Hettich - Universal
30 RF) at 800 x g for 5 min.
2.2 Genomic DNA extraction
Total DNA was extracted from cell pellets using MagAttract HMW DNA Kit (Qiagen) following manufacturer’s protocol. Briefly, fresh cell pellets were lysed with Proteinase K and Buffer ATL by incubation at 56ºC for 16 h, with shaking at 900 rpm. DNA was captured using magnetic bead and eluted in buffer AE. DNA concentration and purity were quantified by Qubit 3.0 Fluorometer (Invitrogen) and Nanodrop.
2.3 Enrichment of eccDNA
EccDNA was enriched, purified, and prepared for sequencing using a modified Circle-Seq method (Møller et al., 2018). First linear chromosomal DNA was removed by enzymatic digestion using exonuclease V (exoV) RecBCD (NEB), followed by purification of the remaining circular DNAs (eccDNA and mitochondrial DNA (mtDNA)) using 1.8X QIAseq beads (Qiagen). Two enzymatic choices were used for mtDNA depletion in this study: MssI endonuclease treatment and a Cas9-based approach. In theMssI/Pmel approach,followingthe Circle-Seq method (Møller et al., 2018), post-exoV DNA was treated with MssI/PmeI endonuclease (Invitrogen) to linearize mtDNA. For the Cas9-based approach, the post-exoV DNA was treated with Cas9 nuclease (NEB) and two sgRNAs targeting MTND1 and MT-ND5 regions. The sgRNA sequences followed a published method (Feng et al., 2022) andweresynthesizedbySynthego(USA).Thetreatment ofCas9followedthepublishedprotocol (Feng et al., 2022) with some modifications such that the final concentration of Cas9 was doubled. After MssI or Cas9 treatment, the samples were further digested using exoV (NEB) to remove linearized mtDNA. To amplify the eccDNAs, the exoV-digested DNA was subjected to Phi29-based rolling-circle amplification (RCA) using GenomiPhi V2 kit (Cytiva), following the manufacturer’s protocol.
2.4 Library preparation and sequencing of eccDNAs
The RCA product was debranched using T7 endonuclease I (NEB) in NEBuffer 2 to resolve branchpoints within RCA amplicons, which otherwise would deteriorate sequencing efficiency The debranched DNA was used for library preparation following the Native Barcoding Kit 24 V14 protocol (SQK-NBD114.24) provided by Oxford Nanopore Technologies (ONT). After tagmentation and adapter attachment, pooled libraries were primed and loaded onto a MinION flow cell (R10.4.1). The data acquisition and initial base calling were performed using the MinKNOW software (ONT)
2.5 Read processing and genome mapping
Raw sequencing readings in FAST5 format were exported from MinKNOW program. FASTQ files were generated using high-accuracy basecalling with guppy_barcoder, followed by low-quality base and adapter trimming with Porechop v0.2.4. (Wick et al., 2017). Resulting data were used for subsequent analyses,includinggenome mapping, eccDNA identification, and annotation usingCReSIL tool (Wanchai et al., 2022). Downstream analysis, investigation, and data visualization were performed using IGV (Thorvaldsdottir et al., 2013), and R (www.R-project.org).
3. Results and Discussion
DNA was extracted from three cell lines (two representing CCA and one representing non-cancer cholangiocyte) and prepared for eccDNA enrichment using two enzymatic methods (Cas9 or MssI), with three replicates per method. The total of 18 samples were subsequently sequenced using ONT, yielding a total of 7.16 million reads for all samples. The read length ranged from 200 to 40,728 bp. The pre-processed reads were then analyzed using CReSIL to reconstruct circular DNA sequences. Tens of thousands of eccDNAs were identified from all cell lines. Among which, a replicate of MssItreated MMNK1 produced the highest number with 5,250 unique eccDNAs, while a replicate of Cas9treated KKU213A exhibited the lowest number with 237 unique eccDNAs.
3.1 Effect of eccDNA isolation method
To examine which enzymatic method can offer a better enrichment of eccDNAs, and because the diversity of eccDNAs identified could be influenced by the total number of sequencing reads obtained
from each sample, we normalized the number of unique eccDNAs as count per million across all samples. Our results displayed no significant difference in terms of the number of eccDNAs identified between the two enzyme choices, but a varying number of unique eccDNAs for both approach between replicates (Figure 1A). This emphasizes the heterogeneity nature of eccDNAs and suggests the potential benefit of employing both methods together rather than relying on a single one.
In addition, we examined the variation in MssI cleavage site frequency among sample groups. Assessingthe distributionof these sitescanpotentiallypredict theimpactofMssItreatment oneccDNA enrichment. MssI digestion of mtDNA, which targets the 5’ GTTTAAAC 3’ sequence, could accidentally cleave eccDNAs with identical recognition sites or through unspecific activity. We found the distribution of MssI recognition sequences and observed that MssI-treated samples revealed a considerably lower number of eccDNAs containing the cleavage sites compared to Cas9-based samples (Figure 1B). This finding indicates that some eccDNAs might have been unintentionally subjected to off-target cuttingbyMssIenzymes.Another explanationcouldbethat remnantsofmtDNA hadescaped sgRNA-cas9 cleavage. However, furtherinvestigationof these Cas9-uniqueeccDNAs showedthat they were originated from chromosomal regions and not from mtDNA.
A.
Figure 1 The number of unique eccDNAs identified by each method. (A) Normalized eccDNAs count per million reads of all samples. The graph depicts the comparison of the normalized number of unique eccDNAs identified for each sample using the established CReSIL pipeline. (B) MssI cutting site sequence in eccDNA. The plot demonstrates the frequency of MssI cutting sites (GTTTAAAC) on the resulting eccDNA sequences across all samples
We employed two enrichment methods: MssI-based and Cas9-based to eliminate mtDNA. MssI approach effectively depleted mtDNA but introduced off-target eccDNAs and revealed lower IGV read depth across all regions, remarkably in non-tumor samples, suggesting potential loss of large eccDNAs containing MssI restriction sites. Although Cas9 was more precise for elimination of mtDNA, it was not entirely efficient, with a previous study reporting an 85.9% ± 12.6% efficiency (Feng et al., 2022). Factors like enzyme-substrate interactions, SNP variations, spacer design, mitochondrial heteroplasmy (Almeida et al., 2022), RNA-DNA duplex stability, chromatin environment, and sgRNA loading may further influence its efficacy (Wu et al., 2014)
3.2 Heterogeneity of eccDNAs and between cancer and non-cancer cell lines
Principal component analysis (PCA) was conducted on the genome mapping locations from the sequencing data to analyze differences in eccDNA pattern between CCA and non-CCA cell lines (Figure 2A). The analysis revealed that the non-tumor samples exhibited more consistency between replicatesandwereclearlyseparatedfromthetumorsamples.Furthermore, thetumorsamplesexhibited higher heterogeneity, with replicates scattered more widely along the PC2 axis (Figure 2A).
Accordingtoourgenome mappingdata,eccDNAswereoriginatedfromoneormorechromosomes. Most eccDNAs are composed of regions from a single chromosome, while a small percentage of
B.
eccDNA are composed of regions from multiple chromosomes (Figure 2B). Interestingly, both CCA cell lines showed a slightly higher proportion of eccDNAs that derived from multiple chromosomes, showing that eccDNAs from cancer cell lines appeared to be more complex than eccDNAs from noncancer cell line (Figure 2B).
Figure 2 EccDNA profiles between cancer and non-cancer cell lines. (A) PCA of eccDNA genomic coverage based on their mapped reads to the human reference genome (hg38) The PCA illustrates sample clustering, where shorter distances along the axes indicate greater similarity in the variance of eccDNA chromosomal origins. (B) Chromosomal origin of eccDNAs, showing single vs. multiple fragment origins of eccDNAs from KKU213A, KKU452, and MMNK1 cell lines. The plots demonstrate the percentage distribution of eccDNA composition based on the number of chromosomal regions detected within each eccDNA molecule
Our data uncovered a large number of eccDNAs in both cancer and non-cancer samples, although thecount ofeccDNAscanvaryfromonecelllinetoanother(DosSantoset al.,2023).Thechromosomal distribution analysis showed most of the identified eccDNAs originated from one or two regions; however, cancer-derived eccDNAs were more frequently observed to derive from multiple chromosomal fragments, indicatingthe prominent roleof genomic rearrangements (Koche et al., 2020), and highlighting their unpredictable biogenesis nature (Henriksen et al., 2022).
In addition, we used the genome browser IGV to explore the eccDNA-mapped regions, focusing on read depth distribution and other features across the reference genome. It is worth noting that the
cancer cell lines demonstrated greater diversity of origins in both read depth distribution and genomic origins than the non-cancer samples, highlighting again the greater heterogeneity in genomic coverage for the cancer group (Figure 3A). We found a considerable uniformity of read depth in certain genomic areas, regardless of whether it is cancer or non-cancer samples. Notably, we observed that the majority of reads from all samples were derived from non-coding intergenic regions of the chromosomes, all of which exhibited a similar pattern; for examples, chromosome 4, 6, 10, 16, 17, 18, 19, and 20 (Figure 3B) showing a representative intergenic region from chromosome 6)


Figure 3 IGV visualization of read depth of eccDNA samples The aligned sequencing data was compared between samples, focusing on the read depth distribution across the reference genome. (A) Comparative read depth of all samples on all chromosomes This figure highlights inter-sample variations in genomic coverage. (B) The figure highlights the distinctive pattern of read depth at a representative intergenic region from chromosome 6, focusing on their non-coding origin.
The variation in the number of eccDNAs and read depth coverage within characterized eccDNAs aligns with previous studies, highlighting the heterogeneous nature of eccDNA origins and structures (Dos Santos et al., 2023). The observed diversity might be imposed by inherent sample differences in eccDNA composition (Dos Santos et al., 2023) or potential technical biases introduced during amplification, such as phi29 polymerase preference for specific eccDNA types. It is important to note that the eccDNA content of cancer cell lines may differ from that of primary tumors (Von Hoff et al., 1992), as eccDNAs can reintegrate into chromosomes during long-term culture (Wahl, 1989).
3.3 EccDNA landscape: size and genomic elements
SizedistributionofeccDNAs revealedsizevariationinbothtumorsamplesandnon-tumorsamples,
A. B.
but no clear distinction in eccDNA sizes between cancer and non-cancer cell lines. The data exhibited broad length distributions of identified eccDNAs, spanning 200–5000 bp in KKU213A, 200–10000 bp in KKU452, and 200–8000 bp in MMNK1 samples (Figure 4A)
Figure 4 Size and contents of eccDNAs (A) Length distribution of eccDNAs (B) Genomic composition of eccDNAs obtained by the MssI approach The figure demonstrates the frequency of intronic, exonic, intergenic, and repetitive sequences within eccDNAs for each sample group. (C) Genomic composition of eccDNAs obtained by the Cas9 approach. Generic elements are represented as percentages. Where the number is over 100%, this indicates that there were often multiple copies of such genetic elements in multiple eccDNAs.
The genomic composition of eccDNAs could play a vital role in determining their phenotypic impact, particularly in how they contribute to cancer progression. To examine these potential roles, we annotated the eccDNA sequences with genic and non-genic features. Among all, short interspersed nuclear element (SINE) was the most abundant repetitive transposable element (TE) found within eccDNAs, followed by long interspersed nuclear element (LINE) All samples showed a predominance of introns over exons (Figure 4B-C), which is consistent with previous studies (Kumar et al., 2017; Wanchai et al., 2022). Interestingly, a greater percentage of repeats and TEs drew notice to KKU452 samples, which harbored, on average, more elements such as SINE, LINE, long terminal repeat (LTR), and microsatellites than KKU213A and MMNK1 cell lines. A similar trend was observed in genic elements such as intron and exon, although it was less prominent compared to the non-genic elements (Figure 4B-C).
From our data, eccDNA sequences predominantly originated from intergenic regions rather than genic regions The genic and non-genic characteristics of identified eccDNAs were found to be consistent with prior reports, with prominent components beingintrons and non-codingregions (Kumar et al., 2017; Møller et al., 2018; Wanchai et al., 2022) In addition, identified eccDNAs preferably harbored a higher number of introns compared to CpG, exons, and TEs, which is consistent with previous findings (Kumar et al., 2017; Sin et al., 2020; Wanchai et al., 2022). This pattern indicates that their biological formation could be sophistically regulated and not random (Hung et al., 2024) The aberrant TEs activity is the well-reported contribution to various diseases, including cancer (Anwar et al., 2017; Karttunen et al., 2023). The major presence of TEs such as LINE and SINE elements in eccDNAs proposes possible roles in their stability, mobility, or function and could be involved in the regulation of gene expression (Lee et al., 2012; Swets et al., 2016). Further studies are essential to elucidate the roles of TEs and non-coding regions in eccDNAs and their contribution to tumorigenesis.
4. Conclusion
We evaluated two different methods of eccDNA enrichment and observed distinct profiles from each method. Cancer-derived eccDNAs show much higher heterogeneity and span wider chromosomal origins compared to the non-cancer counterpart, highlighting the complexity of eccDNA landscapes in CCA. The majority of eccDNAs were derived from intergenic or non-coding regions, and their lengths varied considerably. The higher read-depth in certain areas of eccDNAs from cancer cell lines accents the potential of eccDNAs as biomarkers and their putative involvement in CCA pathogenesis. These findings provide vital groundwork for future research on patient samples. Importantly, we illustrated the importance of choices of eccDNA enzymatic enrichment method, which could be further applied to eccDNA studies beyond the field of cancer research.
5. Acknowledgements
The authors would like to thank Khon Kaen University ASEAN-GMS scholarship and financial support from the National Science Research and Innovation Fund (NSRF) under the Fundamental Research Fund through Khon Kaen University. We would like to thank Dr Lapatrada Taemaitree, Dr Thomas Crellen, members of CPMR group and members of MBMB graduate program for helpful discussion and technical support. Computationally intensive analyses were performed on highperformance computer facility provided by Khon Kaen University Office of Digital Technology.
6. References
Almeida, J., Pérez-Figueroa, A., Alves, J. M., Valecha, M., Prado-López, S., Alvariño, P., CameselleTeijeiro, J. M., Chantada, D., Fonseca, M. M., & Posada, D. (2022). Single-cell mtDNA heteroplasmy in colorectal cancer. Genomics, 114(2), 110315. https://doi.org/10.1016/j.ygeno.2022.110315
Anwar, S., Wulaningsih, W., & Lehmann, U. (2017). Transposable Elements in Human Cancer: Causes and Consequences of Deregulation. International Journal of Molecular Sciences, 18(5), 974. https://doi.org/10.3390/ijms18050974
Bailey, C., Pich, O., Thol, K., Watkins, T. B. K., Luebeck, J., Rowan, A., Stavrou, G., Weiser, N. E., Dameracharla, B., Bentham, R., Lu, W.-T., Kittel, J., Yang, S. Y. C., Howitt, B. E., Sharma,
N., Litovchenko, M., Salgado, R., Hung, K. L., Cornish, A. J., … Swanton, C. (2024). Origins and impact of extrachromosomal DNA. Nature, 635(8037), 193–200. https://doi.org/10.1038/s41586-024-08107-3
Banales, J. M., Cardinale, V., Carpino, G., Marzioni, M., Andersen, J. B., Invernizzi, P., Lind, G. E., Folseraas, T., Forbes, S. J., Fouassier, L., Geier, A., Calvisi, D. F., Mertens, J. C., Trauner, M., Benedetti, A., Maroni, L., Vaquero, J., Macias, R. I. R., Raggi, C., … Alvaro, D. (2016). Expert consensus document: Cholangiocarcinoma: Current knowledge and future perspectives consensus statement from the European Network for the Study of Cholangiocarcinoma (ENS-CCA). Nature Reviews Gastroenterology and Hepatology, 13(5), 261–280. https://doi.org/10.1038/nrgastro.2016.51
Chen, J. P., Diekmann, C., Wu, H., Chen, C., Della Chiara, G., Berrino, E., Georgiadis, K. L., Bouwman, B. A. M., Virdi, M., Harbers, L., Bellomo, S. E., Marchiò, C., Bienko, M., & Crosetto, N. (2024). scCircle-seq unveils the diversity and complexity of extrachromosomal circular DNAs in single cells. Nature Communications, 15(1), 1768. https://doi.org/10.1038/s41467-024-45972-y
Dos Santos, C. R., Hansen, L. B., Rojas-Triana, M., Johansen, A. Z., Perez-Moreno, M., & Regenberg, B. (2023). Variation of extrachromosomal circular DNA in cancer cell lines. Computational and Structural Biotechnology Journal, 21, 4207–4214. https://doi.org/10.1016/j.csbj.2023.08.027
Feng, W., Arrey, G., Zole, E., lv, W., Liang, X., Han, P., Mohiyuddin, M., Pilegaard, H., & Regenberg, B. (2022). Targeted removal of mitochondrial DNA from mouse and human extrachromosomal circular DNA with CRISPR-Cas9. Computational and Structural Biotechnology Journal, 20, 3059–3067. https://doi.org/10.1016/j.csbj.2022.06.028
Henriksen, R. A., Jenjaroenpun, P., Sjøstrøm, I. B., Jensen, K. R., Prada-Luengo, I., Wongsurawat, T., Nookaew, I., & Regenberg, B. (2022). Circular DNA in the human germline and its association with recombination. Molecular Cell, 82(1), 209-217.e7. https://doi.org/10.1016/j.molcel.2021.11.027
Hung, K. L., Jones, M. G., Wong, I. T.-L., Curtis, E. J., Lange, J. T., He, B. J., Luebeck, J., Schmargon, R., Scanu, E., Brückner, L., Yan, X., Li, R., Gnanasekar, A., Chamorro González, R., Belk, J. A., Liu, Z., Melillo, B., Bafna, V., Dörr, J. R., … Chang, H. Y. (2024). Coordinated inheritance of extrachromosomal DNAs in cancer cells. Nature, 635(8037), 201–209. https://doi.org/10.1038/s41586-024-07861-8
Jusakul, A., Kongpetch, S., & Teh, B. T. (2015). Genetics of Opisthorchis viverrini-related cholangiocarcinoma: Current Opinion in Gastroenterology, 31(3), 258–263. https://doi.org/10.1097/MOG.0000000000000162
Karttunen, K., Patel, D., Xia, J., Fei, L., Palin, K., Aaltonen, L., & Sahu, B. (2023). Transposable elements as tissue-specific enhancers in cancers of endodermal lineage. Nature Communications, 14(1), 5313. https://doi.org/10.1038/s41467-023-41081-4
Koche, R. P., Rodriguez-Fos, E., Helmsauer, K., Burkert, M., MacArthur, I. C., Maag, J., Chamorro, R., Munoz-Perez, N., Puiggròs, M., Dorado Garcia, H., Bei, Y., Röefzaad, C., Bardinet, V., Szymansky, A., Winkler, A., Thole, T., Timme, N., Kasack, K., Fuchs, S., … Henssen, A. G. (2020). Extrachromosomal circular DNA drives oncogenic genome remodeling in neuroblastoma. Nature Genetics, 52(1), 29–34. https://doi.org/10.1038/s41588-019-0547-z Kong, X., Wan, S., Chen, T., Jiang, L., Xing, Y., Bai, Y., Hua, Q., Yao, X., Zhao, Y., Zhang, H., Wang, D., Su, Q., & Lv, K. (2024). Increased serum extrachromosomal circular DNA SORBS1circle level is associated with insulin resistance in patients with newly diagnosed type 2 diabetes mellitus. Cellular & Molecular Biology Letters, 29(1), 12. https://doi.org/10.1186/s11658-023-00530-0
Kumar, P., Dillon, L. W., Shibata, Y., Jazaeri, A. A., Jones, D. R., & Dutta, A. (2017). Normal and cancerous tissues release extrachromosomal circular DNA (eccDNA) into the circulation. Molecular Cancer Research, 15(9), 1197–1205. https://doi.org/10.1158/1541-7786.MCR-170095
Lee, E., Iskow, R., Yang, L., Gokcumen, O., Haseley, P., Luquette, L. J., Lohr, J. G., Harris, C. C., Ding, L., Wilson, R. K., Wheeler, D. A., Gibbs, R. A., Kucherlapati, R., Lee, C., Kharchenko,
P. V., Park, P. J., & The Cancer Genome Atlas Research Network. (2012). Landscape of Somatic Retrotransposition in Human Cancers. Science, 337(6097), 967–971.
https://doi.org/10.1126/science.1222077
Møller, H. D., Mohiyuddin, M., Prada-Luengo, I., Sailani, M. R., Halling, J. F., Plomgaard, P., Maretty, L., Hansen, A. J., Snyder, M. P., Pilegaard, H., Lam, H. Y. K., & Regenberg, B. (2018). Circular DNA elements of chromosomal origin are common in healthy human somatic tissue. Nature Communications, 9(1). https://doi.org/10.1038/s41467-018-03369-8
Sin, S. T. K., Jiang, P., Deng, J., Ji, L., Cheng, S. H., Dutta, A., Leung, T. Y., Chan, K. C. A., Chiu, R. W. K., & Lo, Y. M. D. (2020). Identification and characterization of extrachromosomal circular DNA in maternal plasma. Proceedings of the National Academy of Sciences, 117(3), 1658–1665. https://doi.org/10.1073/pnas.1914949117
Sripa, B., & Kaewkes, S. (2000). Localisation of parasite antigens and inflammatory responses in experimental opisthorchiasis. International Journal for Parasitology, 30(6), 735–740. https://doi.org/10.1016/s0020-7519(00)00054-0
Swets, M., Zaalberg, A., Boot, A., Van Wezel, T., Frouws, M., Bastiaannet, E., Gelderblom, H., Van De Velde, C., & Kuppen, P. (2016). Tumor LINE-1 Methylation Level in Association with Survival of Patients with Stage II Colon Cancer. International Journal of Molecular Sciences, 18(1), 36. https://doi.org/10.3390/ijms18010036
Thorvaldsdottir, H., Robinson, J. T., & Mesirov, J. P. (2013). Integrative Genomics Viewer (IGV): High-performance genomics data visualization and exploration. Briefings in Bioinformatics, 14(2), 178–192. https://doi.org/10.1093/bib/bbs017
Turner, K. M., Deshpande, V., Beyter, D., Koga, T., Rusert, J., Lee, C., Li, B., Arden, K., Ren, B., Nathanson, D. A., Kornblum, H. I., Taylor, M. D., Kaushal, S., Cavenee, W. K., WechslerReya, R., Furnari, F. B., Vandenberg, S. R., Rao, P. N., Wahl, G. M., … Mischel, P. S. (2017). Extrachromosomal oncogene amplification drives tumour evolution and genetic heterogeneity. Nature, 543(7643), 122–125. https://doi.org/10.1038/nature21356
Von Hoff, D. D., McGill, J. R., Forseth, B. J., Davidson, K. K., Bradley, T. P., Van Devanter, D. R., & Wahl, G. M. (1992). Elimination of extrachromosomally amplified MYC genes from human tumor cells reduces their tumorigenicity. Proceedings of the National Academy of Sciences of the United States of America, 89(17), 8165–8169. https://doi.org/10.1073/pnas.89.17.8165
Wahl, G. M. (1989). The importance of circular DNA in mammalian gene amplification. Cancer Research, 49(6), 1333–1340.
Wanchai, V., Jenjaroenpun, P., Leangapichart, T., Arrey, G., Burnham, C. M., Tümmler, M. C., Delgado-Calle, J., Regenberg, B., & Nookaew, I. (2022). CReSIL: Accurate identification of extrachromosomal circular DNA from long-read sequences. Briefings in Bioinformatics, 23(6), bbac422. https://doi.org/10.1093/bib/bbac422
Wick, R. R., Judd, L. M., Gorrie, C. L., & Holt, K. E. (2017). Completing bacterial genome assemblies with multiplex MinION sequencing. Microbial Genomics, 3(10). https://doi.org/10.1099/mgen.0.000132
Wu, X., Kriz, A. J., & Sharp, P. A. (2014). Target specificity of the CRISPR‐Cas9 system. Quantitative Biology, 2(2), 59–70. https://doi.org/10.1007/s40484-014-0030-x
Xu, G., Shi, W., Ling, L., Li, C., Shao, F., Chen, J., & Wang, Y. (2022). Differential expression and analysis of extrachromosomal circular DNAs as serum biomarkers in lung adenocarcinoma. Journal of Clinical Laboratory Analysis, 36(6), e24425. https://doi.org/10.1002/jcla.24425
Zeng, T., Huang, W., Cui, L., Zhu, P., Lin, Q., Zhang, W., Li, J., Deng, C., Wu, Z., Huang, Z., Zhang, Z., Qian, T., Xie, W., Xiao, M., Chen, Y., & Fu, L. (2022). The landscape of extrachromosomal circular DNA (eccDNA) in the normal hematopoiesis and leukemia evolution. Cell Death Discovery, 8(1), 400. https://doi.org/10.1038/s41420-022-01189-w
Proceeding of Cosmetic and Beauty International Conference (CBIC) 2025 & International Conference on Integrative Medicine (ICIM) 2025 16th-17th January 2025
Comparative study of antioxidant inhibitory activities Glycyrrhiza uralensis Fisch. and Glycyrrhiza glabra extract
Chantharat Arammontilalai1, Pariworada Wanichwongsa1 and Mayuramas Wilai1,2*
1School of Cosmetic Science, Mae Fah Luang University, Chiang Rai 57100, Thailand
2Phytocosmetics and Cosmeceuticals Research Group, Mae Fah Luang University, Chiang Rai, Thailand
*Corresponding author E-mail: mayuramas@mfu.ac.th
ABSTRACT
Introduction: Licorice (Glycyrrhiza species) is renowned for its broad range of bioactivities, including its antioxidant properties, which protect the skin from oxidative stress caused by reactive oxygen species (ROS). This study aimed to compare the antioxidant potential of Glycyrrhiza glabra (Licorice) and Glycyrrhiza uralensis Fisch. (Chinese licorice) ethanol extracts.
Methods: The licorice and Chinese licorice extracts were prepared and analyzed for total phenolic, total flavonoid contents and antioxidant activities. Antioxidant activities of the extractswereperformed usingtheDPPHradicalscavengingandtheferricreducingantioxidant power (FRAP) assays.
Results: The results showed no significant difference in total phenolic content between licorice (2.50 ± 0.04 mg GAE/g extract) and Chinese licirice (2.51 ± 0.04 mg GAE/g extract). However, licorice extract displayed significantly higher total flavonoid (p = 0.006) content (12.90 ± 0.13 mg QE/g extract) than Chinese licirice (12.36 ± 0.12 mg QE/g extract). Additionally, licorice demonstrated superior antioxidant activity, with a lower IC50 value in the DPPH assay (4.11 ± 0.14 mg/mL) than Chinese licorice (5.28 ± 0.04 mg/mL). The FRAP assay also confirmed greater ferric-reducing power for licorice (27.08 ± 0.12 mM Fe2+/g extract) compared to Chinese licorice (24.14 ± 0.10 mM Fe2+/g extract).
Conclusion:Theresults indicatedthat licorice possessesgreaterantioxidantpotentialandmay offer valuable benefits for cosmetic applications. Therefore, further investigations to clarify their potential value for cosmetic industries.
Keywords: Antioxidant activity; Licorice extracts; Glycyrrhiza glabra; Glycyrrhiza uralensis Fisch.
1. Introduction
Antioxidants have important functions in protecting the skin from damage caused by reactive oxygen species (ROS) and reactive nitrogen species (RNS), which are unstable molecules which can be produced during intracellular metabolic process such as electron transport chain or induced extrinsically by UVA, UVB, visible light and pollutants. When ROS and RNS accumulate in the skin, it results in an imbalance in an antioxidant system, which ultimately leads to the skin pigmentation and aging process via accumulated oxidative stress in the skin (Aranda-Rivera et al., 2022; Chen et al., 2021).
Licorice (Glycyrrhiza species) is a perennial herb in the Leguminosae family with medicinal properties that are widespread throughout Central Asia and Europe (Lee et al., 2020). Licorice has been used for centuries as both a flavoring agent and a natural sweetener. The dried root of licorice, also known as a perennial herb in the genus Glycyrrhiza, has been used to treat colds, coughs, asthma,
fatigue, and respiratory tract infections. Because licorice has a wide range of bioactivities, including antioxidants, antimicrobial, antitumor, antiplatelet, anti-inflammatory, and immunomodulatory properties (Kim et al., 2021; Liao et al., 2012).
Licorice roots contain important biological compounds, including triterpenes saponins, and flavonoids. Notable examples include glycyrrhizic acid, liquiritigenin, liquiritin, and isoliquiritigenin (Raoufinejad et al., 2020). Isoliquiritigenin, in particular, is a flavonoid found in licorice that has demonstrated various pharmaceutical activities, such as antiplatelet, anti-allergic, anti-cancer, antiinflammatory, and antioxidant properties (Lin et al., 2020). Glabridin, a prenylated isoflavonoid derived from the roots of Glycyrrhiza glabra, exhibits diverse biological activities, including antioxidants, anti-inflammatory, cardioprotective, metabolic regulatory, estrogenic, neuroprotective, and bone-strengthening effects (Simmler et al., 2013). In this study, extracts of licorice root were analyzed for their phenolic and flavonoid content. Their antioxidant potential was assessed using standard in vitro methods, including the Ferric reducing Antioxidant Power (FRAP) test and DPPH free radical scavenging assay (Mradu et al., 2016). The main aim of this study was to compare the antioxidant activities of Glycyrrhiza glabra (Licorice) and Glycyrrhiza uralensis Fisch. (Chinese liquorice) to evaluate performance differences between the two species.


2. Materials and Methods
2.1 Plant materials
Licorice (Glycyrrhiza glabra) was purchased from Thaphrachan Herb Company, located at 63 Phet Kasem 28 Alley, Lane 1, Khwaeng Pak Khlong Phasi Charoen, Khet Phasi Charoen, Bangkok, Thailand.
Chinese licorice (Glycyrrhiza uralensis Fisch.) was purchased from Huachiew Traditional Chinese Medicine located at 14 Soi Nak Kasem, Klongmahanak, Pomprab Sattru Pai, Bangkok, Thailand.
2.2 Preparation of the extracts
The roots of licorice and Chinese licorice Fisch. were ground with blender, and then 10 g of the powdered plant material was mixed with 200 mL of the 80% ethanol in a 250 mL Erlenmeyer flask. The extraction process occurred in an ultrasonic bath operating at 9 kHz for 20 min (modifyfromTian et al.,2008). The bath temperature was maintained at 65°C (Xing et al.,2022). After extraction, the mixture was filtered and evaporated with an evaporator to remove ethanol. All extracts were stored in the dark at -40°C for 2 days. The extracts were then put into a freeze dryer for 2 days. After that, the extracts were stored in the dark at -20°C.
2.3 FTIR spectroscopy analysis
Fourier Transform Infrared Spectroscopy (FT-IR) analysis was performed at room temperature using a spectrophotometer equipped with a DTGS detector and an ATR accessory to evaluate the
Figure 1 (A) Glycyrrhiza glabra and (B) Glycyrrhiza uralensis Fisch. (Photography by Chantharat A. and Pariworada W., 2024)
chemical composition of Glycyrrhiza glabra and Glycyrrhiza uralensis Fisch. samples. The analysis was conducted with the OMNIC software version 9.11.745.
Eachsamplewaspreparedinaquantityofapproximately10 mgtoinvestigatethefunctional groups present.TheFT-IRspectrawererecordedover ascanningfrequencyrange of4,000-400cm-1,providing detailed insights into the chemical structure and functional groups of the samples.
2.4 Determination of total phenolic content
The Folin-Ciocalteu reagent was used to measure the total phenolic in the extracts, slightly altering the Singleton and Rossi (1965) method. The UV-Vis Spectrophotometric technique was used to determine the sample and standard readings at 765 nm in comparison to a reagent blank.
A 20 µL portion of the extract (concentration range between 0.1-0.03 g/mL) and 20 µL of FolinCiocalteu’s phenol reagent were combined with water in a 10 mL volumetric flask. After 5 minutes, 100 µL of a saturated sodium carbonate solution (8% w/v in water) was added, and the mixture was transferred to a 96-well plate. The reaction mixture was kept in the dark for 30 minutes.The absorbance of the blue colour from each sample was measured at 765 nm. Phenolic content was quantified as milligrams of gallic acid equivalents (GAE) per gram dry matter of extract based on a standard calibration curve of Gallic acid (0.5-0.0039 mg/mL, y = 15.606x + 0.0307, R2 = 0.9973).
2.5 Determination of total flavonoid content
The total flavonoid concentration of sample extracts was ascertained using the aluminium chloride colorimetric technique. A standard curve is created using quercetin to determine the total flavonoids. Quercetin is dissolved at a concentration of 0.2 mg/mL to create a quercetin stock solution. Next, 10% w/v aluminum chloride is added to the quercetin standard solution in a 96-well plate. The mixture is then allowed to sit at room temperature for 15 minutes. A spectrophotometer is used to measure the mixture's absorbance at a wavelength of 415 nm. The calibration curve (y = 16.718x - 0.006, R2 = 0.9927) is used to determine the test sample's total flavonoid concentration (modify from Navanath et al., 2012).Thetotal flavonoid content was shownas amilligramofquercetinequivalents(QE)per gram dry matter of extract.
2.6 Determination of antioxidant activity
2.6.1 DPPH free radical scavenging assay
Free radical scavenging ability of the extracts was tested by DPPH radical scavenging assay as described by Blois et al. (1958) and Desmarchelier et al. (1997). The hydrogen atom donating ability of the plant extractives was determined by the decolorization of ethanol solution of 2,2-diphe-nyl-1picrylhydrazyl (DPPH). DPPH produces violet/purple colour in ethanol solution and fades to shades of yellow colour in the presence of antioxidants. A solution of 0.2 mM DPPH in ethanol was prepared and incubated in a 96-well plate. The reaction mixture was allowed to leave at room temperature in the dark for half an hour. Using spectrophotometry, the mixture's absorbance was determined at 515 nm. Gallic acid served as the standard (y = 5401.4x - 0.7185, R2 = 0.9929). Using the following formula, the percentage of DPPH radical scavenging activity was determined:
% DPPH radical scavenging activity = (1)
where A0 isthe absorbance ofthecontrol,andA1 istheabsorbanceof theextracts/standard.Then% of inhibition was plotted against concentration, and from the graph IC50 was calculated.The experiment was repeated three times at each concentration.
2.6.2 Ferric reducing antioxidant power (FRAP) test
The FRAP reagent solution is made by combining 300 mM Acetate buffer pH 3.6 solution, 20 mM Iron (III) chloride hexahydrate solution, and 10 mM 2,4,6-Tris (2-pyridyl-1,3,5-triazine) or TPTZ solution in 40 mM Hydrochloric in a 10:1:1 ratio. The concentration of the sample in water was 0.080.01 g/mL. The material was combined with the FRAP reagent. The wavelength at which the absorbance was measured was 593 nm. Determine the absorbance value using the equation (n = 3).
Absorbance = (A-B) - (C-D) (2)
Calculate the electron donor capacity (FRAP value) by comparing the obtained value with the standard graph of Ferrous sulphate (FeSO4) (y = 0.016x - 0.0415, R2 = 0.9893), showing the value in terms of millimolar equivalent of Fe2+/gram extract (mM Fe2+ equivalent/g extract) (modify from Benzie & Strain, 1996)
2.7 Statistics analysis
All the measurements were performed in triplicate. The results were expressed as mean ± standard deviation. Statistical analysis was performed using t-test for comparing between two groups of plant extracts. The software IBM SPSS Statistic 20 was used to generate all the results and outputs for this study with 0.05 significant value. A p-value lower than 0.05 was considered to be statistically significant.
3. Results and Discussion
3.1 Preparation of the extract
The extracts of both licorice and Chinese licorice showed viscous characteristic with sweet odor. The licorice extract showed a light-yellow color, while the Chinese licorice extract exhibited darker yellow color.
There are several researchers explored the major chemical constituents have been isolated from licorice and Chinese licorice roots extracts mainly classified as flavonoids and triterpenoid saponins (Cerulli et al.,2022).Inthisstudy,macerationisthefamousmethodusedfor flavonoidsandtriterpenoid saponins, while water and ethanol (20:80 v/v) was used as extraction solvent (He et al., 2023, El Aziz et al., 2019, Colvin D.M. 2018, Majinda 2012). The percentage yield of licorice and Chinese licorice extracted with 80% ethanol using ultrasonic bath technique found that Chinese licorice had an average extraction yield at 24.29 2.27% while licorice had the average extraction yield at 16.04 1.41%. The statistical analysis revealed a significant difference between the two species (p = 0.06), which is shown in Table 1.
Table 1 Extraction yield (%) of Glycyrrhiza glabra and Glycyrrhiza uralensis Fisch.
Species
Glycyrrhiza glabra 16.04 1.41a
Glycyrrhiza uralensis Fisch. 24.29 2.27b
Values are given as mean ± S.D. from triplicate.
Different letters in the same column indicate significant differences (P<0.05).
3.2 FTIR spectroscopy analysis
FT-IR spectral analysis was used to detect functional groups of compounds present in licorice and Chinese licorice. There was based on peak values in the region of infrared radiation. The presence of phenolic, flavonoids and saponin compounds contains in the extracts was indicated by the vibration frequencies that FT-IR analysis acquired for OH stretching, C=C stretching, C-O stretching, and C-H bending (Thummajitsakul and Silprasit, 2022). The FT-IR overlay spectrum of both species showed similar absorbance values, which could be due to their comparable chemical composition and structure, shown on Figure 2. The characteristic absorption bands corresponding to the vibration frequencies of 3282 cm-1 and 3289 cm-1 in the IR spectra are due to the -OH groups of phenolic compounds and flavonoids. The characteristic absorption bands corresponding to the vibration frequencies of 1604 cm1 and 1606 cm-1 are dueto the C=C stretchingof phenoliccompounds andflavonoids.The characteristic absorption bands corresponding to the vibration frequencies of 1042 cm-1 and 1040 cm-1 in the IR spectra are due to the C-O stretching of the phenolic compounds and flavonoids (Nandiyanto et al., 2019 and Rangarajan et al., 2021).

3.3 Determination of total phenolic content
The total phenolic content was measured using a spectrophotometer at a wavelength of 765 nm. As shown in Table 2, the mean total phenolic content of licorice was 2.50 ± 0.04 mg GAE/g extract, while that of Chinese licorice was 2.51 ± 0.04 mg GAE/g extract. Statistical analysis revealing no significant difference between the two species (p = 0.763), indicating comparable levels of phenolic compounds. However, the measured values were lower than those reported by Gupta et al (2016), which recorded a total phenolic content of 18.07 mg GAE/g extract.
Table 2 Total Phenolic and Total Flavonoid Content of Glycyrrhiza glabra and Glycyrrhiza uralensis Fisch extracts
Species
uralensis Fisch.
Values are given as mean ± S.D. from triplicate.
Different letters in the same column indicate significant differences (P<0.05).
3.4 Determination of total flavonoid content
Total flavonoid content was measured using a spectrophotometric method at a wavelength of 415 nm.AsshowninTable2,themeantotal flavonoidcontent oflicoricewas12.90 ±0.13mgQE/gextract, while that of Chinese licorice was 12.36 ± 0.12 mg QE/g extract. Statistical analysis revealing a significant difference in flavonoid content (p = 0.006), with licorice exhibiting a higher value compared to Chinese licorice , suggesting a greater concentration of flavonoids, which may enhance its antioxidant properties. However, the measured flavonoid content in this study is lower than the results reported by Gupta et al. (2016), which found a total flavonoid content of 15.03 mg GAE/g extract.
The differences in the total phenolic and flavonoid content values may be due to different geographical collection areas, arises from variations in genetic backgrounds, environmental factors, agronomicpracticesaswell(Phuyal etal. 2020).AsreportedfromOloumiandHassibiin2011,climatic factors, such as temperature, sunlight, and humidity, influence the phenolics and flavonoids content in the roots of licorice. The reveal report from Phuyal in 2020 indicated that the concentration of phenols and flavonoids also depends on the polarity of the solvents used for extraction. This study suggests that different environmental conditions can explain the discrepancies in the phenolic and flavonoid content results when compared to Gupta et al. (2016).
Figure 2 FT-IR spectrum of Glycyrrhiza glabra and Glycyrrhiza uralensis Fisch.
3.5 DPPH free radical scavenging assay
The DPPH assay is a widely used method for evaluating the free-radical scavenging activity of various antioxidant substances. In this experiment, antioxidants reduce the stable DPPH radical to the yellow colour diphenyl-picryl hydrazine, measurable at a wavelength of 515 nm.
A comparison of DPPH free radicals scavenging value between licorice and Chinese licorice revealed that the mean of DPPH values for licorice was 1.78 ± 0.01 mg GAE/g extract, while that for Chineselicoricewas 1.68±0.02 mgGAE/gextract. Statistical analysisindicatedsignificant differences in DPPH values between the two species (p = 0.001), as presented in Table 3. The higher DPPH value in licorice indicates a stronger ability to scavenge free radicals compared to Chinese licorice
A comparison of IC50 values between licorice, Chinese licorice., and gallic acid revealed significant differences in antioxidant potential. The mean IC50 value for licorice was 4.11 ± 0.14 mg/mL, which was lower than that of Chinese licorice (5.28 ± 0.04 mg/mL), indicating that licorice possesses a higher free-radical scavenging ability. A lower IC50 value signifies that a smaller concentration of extract is required to achieve 50% free-radical scavenging activity. When compared to gallic acid, which exhibited a significantly lower IC50 value of 0.01 ± 0.002 mg/mL, both Glycyrrhiza species showed substantiallyweakerantioxidantactivity.Theseresultssuggestthatwhilelicoricedemonstratessuperior antioxidant potential relative to Chinese licorice, its efficacy remains far below that of gallic acid, a standardreference compound. The discrepancybetween the IC50 value of licorice observed inthis study is lower than the results reported by Gupta et al. (2016), which found a IC50 value of 1.424 mg/mL.
The antioxidant response of phenolic compounds varies remarkably, depending on their chemical structure including an interference rising from other chemical components present in the extract such as sugars moiety. The radical scavenging activity of different extracts of Glycyrrhiza species may be due to the presence of polyphenols, flavonoids, a phenolic compound (Phuyal et al. 2020).
Table 3 Free radical scavenging activity (DPPH) and ferric reducing antioxidant power (FRAP) of Glycyrrhiza glabra, Glycyrrhiza uralensis Fisch extract, and Gallic acid
Species
Gallic acid
Values are given as mean ± S.D. from triplicate.
Different letters in the same column indicate significant differences (P<0.05).
3.6 Ferric reducing antioxidant power assay (FRAP)
In this assay, the yellow colour of the test solution changes to various shades of green and blue depending upon the reducing power of each compound. The presence of radicals (i.e. antioxidants) causes the conversion of the Fe3+/ferricyanide complex used in this method to the Fe2+/ferrous form indicated by the formation of blue at 593 nm.
A comparison of FRAP values between licorice and Chinese licorice revealed that the mean FRAP value for licorice was 27.08 ± 0.12 Fe²⁺ mM/g extract, while Chinese licorice was 24.14 ± 0.10 Fe²⁺ mM/g extract. Statistical analysis indicated a significant difference in FRAP values between the two species(p = 0.000).The higher FRAP value inlicorice suggests stronger antioxidant capacitycompared to Chinese licorice., indicating its superior antioxidant potential, as shown in Table 3. However, the FRAP value measured in this study is lower than the result reported by Zhou et al. (2019), which was Fe²⁺ mM/g. The FRAP assay showed positive correlation between reducing power and phenolic content in licorice and Chinese licorice extracts.
For further enhance this research, it is important to focus on three key areas. These include expanding studies on the safety of the extract, with a particular emphasis on long-term toxicity and its
impact on the skin. Additionally, evaluating the efficacy of the extract in stressful environments such as UV exposure, heat, and pollution should be prioritized. Finally, the development of products that focus on protecting the skin from wrinkles and environmental pollutants using licorice, which possess significant antioxidant potential, should be explored.
4. Conclusion
Thisstudydemonstratedthat Glycyrrhiza glabra (licorice)exhibitedsuperiorantioxidant properties compared to Glycyrrhiza uralensis Fisch. (Chinese licorice) Specifically, Glycyrrhiza glabra showed higher total flavonoid content and demonstrated more effective antioxidant activity, as indicated by its lower IC50 value and high DPPH value in the DPPH assay, and higher ferric-reducing power in the FRAP assay. The results provide valuable insights into the development of antioxidant-rich cosmetic products. The results of the present study suggested that the licorice and Chinese licorice root extracts potent source of natural antioxidants for using in cosmetic formulations because of their phenolic and flavonoid contents and their remarkable scavenging effect on DPPH and FRAP assays. Further studies should be directed towards the extensive in vivo antioxidant activities of the plant.
5. Acknowledgements
This research was supported by funding from Mae Fah Luang University, School of Cosmetic Science. The authors gratefully acknowledge the university’s generous support, which made this study possible. Additionally, we extend our sincere appreciation to the faculty and staff of the School of Cosmetic Science for their guidance and assistance throughout this project.
6. References
Aranda-Rivera, A. K.; Cruz-Gregorio, A.; Arancibia-Hernández, Y. L.; Hernández-Cruz, E. Y.; Pedraza-Chaverri, J. (2022). RONS and Oxidative Stress: An overview of basic concepts. Oxygen, 2, 437–478. https://doi.org/10.3390/ oxygen2040030
El Aziz, M. M. A., Ashour, A. S., Melad, A. S. G. (20190. A review on saponins from medicinal plants: chemistry, isolation, and determination. Journal of Nanomedicine Resesrch, 7(4),282‒288. DOI: 10.15406/jnmr.2019.07.00199
Benzie, I. F. F., & Strain, J. J. (1996). The ferric reducing ability of plasma (FRAP) as a measure of “Antioxidant Power” the FRAP assay. Analytical Biochemistry, 239(1), 70-76. https://doi.org/10.1006/abio.1996.0292
Blois, MS. (1958). Antioxidant determinations by the use of a stable free radical. Nature, 181(4617), 1199-1200.
Cerulli, A., Masullo, M., Montoro, P., and Piacente, S. (2022). Licorice (Glycyrrhiza glabra, G. uralensis, and G. inflata) and Their Constituents as Active Cosmeceutical Ingredients. Cosmetics, 9(7), https://doi.org/10.3390/cosmetics9010007
Chen J., Liu Y., Zhao Z., and Qiu J. (2021). Oxidative stress in the skin: Impact and related protection. International Journal of Cosmetic Science, 43,495–509.
Colvin, D. M. (2018). A review on comparison of the extraction methods used in licorice root; Their principle, strength and limitation. Medicinal & Aromatic Plants (Los Angeles) 7: 323. doi:10.4172/2167-0412.1000323
Desmarchelier, C., Bermudez, M. J. N., Coussio, G., Ciccia, G., & Boveris, A. (1997). Antioxidant and prooxidant activities in aqueous extracts of Argentine plants. International Journal of Pharmacognosy, 35(2), 116-120. http://dx.doi.org/10.1076/phbi.35.2.116.13282
Gupta, M., Karmakar, N., Sasmal, S., Chowdhury, S., & Biswas, S. (2016). Free radical scavenging activity of aqueous and alcoholic extracts of Glycyrrhiza glabra Linn. measured by ferric reducing antioxidant power (FRAP), ABTS bleaching assay (αTEAC), DPPH assay and peroxylradicalantioxidantassay. International Journal of Pharmacology and Toxicology,4(2), 235-240. https://doi.org/10.14419/ijpt.v4i2.6578
He, R., Ma, T., Gong, M., Wie, K., Wang, Z., and Li, J. (2023). The correlation between pharmaco.ogical activity and contents of eight constituents of Glycyrrhiza uralensis Fisch. Heliyon, 9,e14570, doi.org/10.1016/j.heliyon.2023.e14570
Kim, D. G., Lee, J., Kim, W., An, H. J., Lee, J. H., Chang, J., Kang, S. H., Song, Y. J., Jeon, Y. D., & Jin, J. S. (2021). Assessment of general toxicity of the Glycyrrhiza new variety extract in rats. Plants, 10, 1126.
Kang, M.H.,Jang, G. Y.,Ji, Y.J., Lee,J. H., Choi, S.J., Hyun, T.K.,& Kim, H. D. (2021). Antioxidant and anti-melanogenic activities of heat-treated licorice (Wongam, Glycyrrhizaglabra×G. uralensis) extract. Current Issues in Molecular Biology, 43(2), 1171–1187. https://doi.org/10.3390/cimb43020083
Lee, J.-H., Oh, M.-W., Lee, S.-H., Park, C.-G., Jeong, J.-T., Han, J.-W., Ma, K.-H., & Chang, J.-K. (2020). ‘Wongam’, a a Licorice interspecific hybrid cultivar with high yield. Korean Journal of Breeding Science, 52, 454–459.
Liao, W. C., Lin, Y. H., Chang, T. M., & Huang, W. Y. (2012). Identification of two licorice species, Glycyrrhiza uralensis and Glycyrrhiza glabra, based on separation and identification of their bioactive components. Food Chemistry, 132, 2188–2193.
Lin, P. H., Chiang, Y. F., Shieh, T. M., Chen, H. Y., Shih, C. K., Wang, T. H., Wang, K. L., Huang, T. C., Hong, Y. H., Li, S. C., et al. (2020). Dietary compound isoliquiritigenin, an antioxidant from licorice, suppresses triple-negative breast tumor growth via apoptotic death program activation in cell and xenograft animal models. Antioxidants, 9, 228.
Majinda, R. R. T., (2012). Extraction and isolation of saponins. Natural Products Isolation, Methods in Molecular Biology, 864, DOI 10.1007/978-1-61779-624-1_16, © Springer Science+Business Media, LLC 2012
Nandiyanto,A.B.D.,Oktiani,R.,&Ragadhita,R.(2019).Howtoreadandinterpret FTIRspectroscope of organic material. Indonesian Journal of Science and Technology, 4(1), 97–118. https://doi.org/10.17509/ijost.v4i1.15806
Oloumi, H., & Hassibi, N. (2011). Study the correlation between some climate parameters and the content of phenolic compounds in roots of Glycyrrhiza glabra Journal of Medicinal Plants Research, 5(25), 6011-6016. https://doi.org/10.5897/JMPR11.666
Phuyal, N., Jha, P. K., Raturi, P. P., and Rajbhandary, S. (2020). Total phenolic, flavonoid contents, andantioxidantactivitiesoffruit,seed,andbarkextractsof Zanthoxylum armatun DC. Hindawi The Scientific World Journal, ID 8780704, 7 pages, https://doi.org/10.1155/2020/8780704
Raoufinejad, K., Rajabi, M., Sarafian, G. (2020). Licorice in the treatment of acne vulgaris and postinflammatory hyperpigmentation: A Review. Journal of Pharmaceutical Care, 8(4),186195.
Rangarajan, N., Sampath, V., Dass Prakash, M. V., & Mohanasundaram, S. (2021). UV spectrophotometry and FTIR analysis of phenolic compounds with antioxidant potentials in Glycyrrhiza glabra and Zingiber officinale. International Journal of Research in PharmaceuticalSciences, 12(1), 877–883. https://doi.org/10.26452/ijrps.v12i1.4215
Navanath, B. P., Vaishali, B. A., Elija, K., Asha, A. K., Shilpa, P. T., Nirmala, R. D. (2012). Spectroscopic Determination of Total Phenolic and Flavonoid Contents of Tribulus terrestris Fruits. International Journal of ChemTech Research, 4(3),899-902.
Simmler, C., Pauli, G. F., & Chen, S.-N. (2013). Phytochemistry and biological properties of glabridin. Fitoterapia, 90, 160–184. https://doi.org/10.1016/j.fitote.2013.07.003
Singleton, V. L., & Rossi, J. A. (1965). Colorimetry of total phenolics with phosphomolybdicphosphotungstic acid reagents. The American Journal of Enology and Viticulture, 16, 144–158. https://doi.org/10.5344/ajev.1965.16.3.144
Thummajitsakul, S., & Silprasit, K. (2022). Analysis of FTIR spectra, flavonoid content and antityrosinase activity of extracts and lotion from Garcinia schomburgkiana by multivariate method. Trends in Sciences, 19(18), 5780. https://doi.org/10.48048/tis.2022.5780
Tian, M., Yan, H., & Row, K. H. (2008). Extraction of glycyrrhizic acid and glabridin from licorice. International Journal of Molecular Sciences, 9(4), 571–577. https://doi.org/10.3390/ijms9040571
Xing, C., Cui, W.-Q., Zhang, Y., Zou, X.-S., Hao, J.-Y., Zheng, S.-D., Wang, T.-T., Wang, X.-Z., Wu, T.,Liu,Y.-Y., Chen,X.-Y., Yuan,S.-G., Zhang, Z.-Y., &Li,Y.-H.(2022).Ultrasound-assisted deep eutectic solvents extraction of glabridin and isoliquiritigenin from Glycyrrhizaglabra: Optimization, extraction mechanism and in vitro bioactivities. UltrasonicsSonochemistry, 83, 105946. https://doi.org/10.1016/j.ultsonch.2022.105946
Zhou, J.-X., Braun, M. S., Wetterauer, P., Wetterauer, B., & Wink, M. (2019). Antioxidant, cytotoxic, and antimicrobial activities of Glycyrrhiza glabra L., Paeonia lactiflora Pall., and Eriobotrya japonica (Thunb.) Lindl. extracts. Medicines, 6(2), 43. https://doi.org/10.3390/medicines6020043
Proceeding of Cosmetic and Beauty International Conference (CBIC) 2025 & International Conference on Integrative Medicine (ICIM) 2025 16th-17th January 2025
The extraction of polysaccharides from Spirogyra sp. for cosmetic utilization
Tawanan Sripisut1 , Chanon Suansawat2 , Aphiwut Wongsa2 and Sudarat Jiamphun1*
1Cosmetics for Beauty and Wellness Research Unit, School of Cosmetic Science, Mae Fah Luang University, Chiang Rai 57100, Thailand
2School of Cosmetic Science, Mae Fah Luang University, Chiang Rai 57100, Thailand
*Corresponding author: E-mail: Sudarat.jia@mfu.ac.th
ABSTRACT
Introduction: Spirogyra sp., is a filamentous green alga commonly found in freshwater environments. It is prevalent in the northern part of Thailand and has antioxidant properties. The cell walls of Spirogyra sp. are rich in pectin and hemicellulose polysaccharides.
Methods: 1 g of the Spirogyra sp. was extracted with 30 mL of distilled water at 80 °C under different extraction times (1, 3, and 5 hours). The structural characteristics of Spirogyra sp. polysaccharide (SP) was analyzed using Fourier-Transform Infrared (FT-IR) spectroscopy and compared to pectin and hydroxyethyl cellulose (HEC) The SP was also investigated for physiochemical properties, total polysaccharide content, and antioxidant activity by DPPH radical scavenging activity assay
Results:A5-hourextraction timeexhibitedthehighest yield of 2.40%and totalpolysaccharide content of 241.94±32.7 mg glucose/g extract. The pH decreased as the extraction time increased. SP's color value (L*, a*, and Chroma) also decreased with longer extraction times, shifting the color from brown to gray. The rheological behavior indicated an increase in rheological properties with the prolonged extraction time, suggesting enhanced polysaccharide extraction. In vitro hydration testing demonstrated that SP exhibited a hydration efficacy of 44.71±0.5 g/g. Antioxidant activity of SP at 100 µg/mL showed an inhibition of 89.13±15.6%.
Conclusion: From this research, it can be suggested that SP could be an alternative ingredient for use as a humectant and thickener with antioxidant properties.
Keywords: Spirogyra sp., Polysaccharide, Anti-oxidant, Hydration, Thickener
1. Introduction
Polysaccharides are remarkable molecules found abundantly in nature. These complex carbohydratesare composed of long chains of simpler sugar units known as monosaccharides.Theyare widely distributed among various organisms, including algae, bacteria, plants, animals, and microorganisms. A key characteristic of polysaccharides is their abundance of hydrophilic (waterloving) groups such as hydroxyl and carboxyl groups. This unique structure endows them with several valuablephysicaland chemical properties.For instance,polysaccharidesreadilyformgels, exhibithigh viscosity(thickness),andcaneasilyformfilms.Thesepropertiesmake themhighlyversatileforvarious applications across different industries (Hong, 2017).
In the cosmetic industry, algal polysaccharides are highly valued for their multifunctional benefits. They serve as excellent humectants and moisturizers, attracting and retaining water in the skin. Additionally, these molecules function as effective thickening and gelling agents, which improve the texture and stability of cosmetic formulations. Algal polysaccharides also form a protective film on the skin, serving as a barrier against environmental stressors. Their emulsifying properties facilitate the blending of oil and water components, further enhancing the formulation of skincare and cosmetic
products (Domżał-Kędzia et al., 2017; Lautenschläger,2009)
Spirogyra sp (Tao) is a unique green algae belonging to the Zygnemataceae family, stands out for its unbranched, filamentous structure and characteristic spirally coiled chloroplast. Spirogyra sp. can thrive in stagnant or slow-moving freshwater environments It is a commonly found in northern Thailand, particularly in rural areas (Peerapornpisal Y, 2006). Beyond its ecological significance, Spirogyra sp. has garnered interest due to its rich nutritional profile and potential health benefits. Previous research indicated it contained various essential nutrients, including carbohydrates, proteins, fats, and vitamins (Peerapornpisal et al., 2005, Phinyo K, 2012). The cell walls of Spirogyra sp. were rich in pectin and hemicellulosic polysaccharides (Permann C. et al., 2021). Additionally, bioactive compounds with potential health applications were identified in these algae (Naik Ansari et al., 2012; Kamble S.M. et al., 2012; SnehalathaD. and Digamber Rao B., 2015). Moreover,its potential immunestimulating, anti-mutagenic, and antioxidant properties associated with Spirogyra sp. (Surayot et al., 2015; Thumvijit et al., 2013). However, the different extraction times in SP as well as evaluation of their properties have not yet been thoroughly investigated This study aimed to effect of the extraction time for polysaccharides and evaluate their properties
2. Materials and Methods
2.1 Materials
Ethanol (95%, AR grade) was purchased from Labscan Ltd., Thailand. Phenol was purchased from Sigma-Aldrich Corporation, USA. L-ascorbic acid (98%) and sulfuric acid were purchased from Fisher Scientific, USA. Glucose was purchased from Loba, India. 2,2-Diphenyl-1-picrylhydrazyl (DPPH) was purchased from Gibco™ (Thermo Fisher Scientific, Waltham, MA, USA).
2.2 Plant Material
Freshwater algae including Spirogyra sp. and Cladophora sp. were obtained from freshwater sources in Chiang rai on February 2024. Spirogyra sp. was dried at 55°C in a hot air oven (Memmert, Germany) for 24 hours, ground into small particles using a Spice & Herb Gringer HR-10B (ZHE JIANG, China), following the method of Surayot et al. (2015) with slight modifications
2.3 Identification of Spirogyra sp.
Spirogyra sp. was identified by comparison with Cladophora sp. using macroscopic and microscopic methods.
2.4 Extraction Method
For the extraction of crude SP, 1 g of milled sample was extracted with 30 mL of distilled water at 80 °C under different extraction times (1,3 and5 hours).The extract wasfilteredthrough cheesecloth to remove solid residues, leaving only the water-based extract. The water extract was centrifuged at 4500 × g for 5 minutes to collect the supernatant. The extract was then concentrated to half its volume via evaporation. Subsequently, 95%ethanol was addedtotheconcentratedsupernatant,andthesolution was stored at 4°C for 24 hours to precipitate the crude polysaccharides. The precipitate was obtained by centrifugation at 6000 × g for 10 minutes and then dried at 55°C in a tray dryer. The yield of crude SP was calculated based on the initial dried biomass.
The extraction yield (%) = weight of Spirogyra sp. polysaccharide (g)/weight of pretreated Spirogyra sp. powder (g) × 100 (1)
2.5 Physiochemical Properties of SP
The solution of SP was prepared at various concentrations (0.5-10 mg/mL) with DIwater at various duration times. The physiochemical properties including;
2.5.1 Color Measurement
Following the method of (Boonyathan et al., 2022), The color properties of the biopolymers during extraction were evaluated at 1, 3, and 5 hours using a colorimeter (Hunter lab, Thailand). The L*
parameter indicates lightness, a* reflects the green (-) to red (+) spectrum, and b* represents the blue (-) to yellow (+) spectrum. For each sample, three random measurements were recorded and used to calculate the Chroma and hue angle (h°) values by
Chroma = ((a2) + (b2)) ½ (2)
h° = Arctan b*/a* (3)
2.5.2 pH Measurement
The pH value was measured by pH meter.
2.6 Determination of Total Polysaccharide Content
Thephenol-sulfuricacidmethodwasusedtoquantifythetotalpolysaccharidecontent,withglucose as the standard reference (Chanpirom et al., 2022). In this procedure, 100 µL of the SP extract solution was combined with 150 µL of concentrated sulfuric acid (98%) and 30 µL of 5% phenol solution. The mixture was then heated at 95°C for 10 minutes. After heating, the solution was transferred to a 96-well microplate, and its absorbance was measured at a wavelength of 490 nm. The polysaccharide content was reported as milligrams of glucose equivalent per gram of extract.
2.7 FT-IR Characterization of SP
Fourier Transform Infrared (FT-IR) spectroscopy was conducted to analyze the chemical structure and functional groups of the samples. The dried extract (0.5 g) was taken to ATR-FTIR (Attenuated Total Reflection Fourier Transform Infrared Spectroscopy) (Thermo Scientific Nicolet iS50 FT-IR spectrometer ATR type Diamond and Germanium). The sample was placed on the diamond sample holder with a spectral range from about 4000 cm-1 to 400 cm-1 and 16 scans with 4 cm −1 resolution
2.8
Rheology Measurement
The rheological properties were assessed based on an adaptation of the method outlined by (Benyounes et al., 2018). Measurements were performed using a Rheometer HAAKE LMS Instrument Co., LTD (USA). The steady shear flow characteristics were examined by applying a shear rate ranging from 0.01 to 1000 s⁻¹ at a temperature of 25 °C. The flow behavior was characterized by an analysis of the shear rate curve.
2.9 In vitro Hydration of SP
Water absorption was determined (Kanlayavattanakul and Lourith, 2017) by adding 0.1 g of SP extract to 6 mL of distilled water. The mixture was incubated for 18 hours and then centrifuged at 8000 rpm for 20 minutes. After centrifugation, the supernatant was removed, and the remaining residue was weighed to assess water absorption.
Water absorption = {Water (g) – Supernatant (g)}/ Dry weight of SP (g) (4)
2.10 Determination of Antioxidant Activity by DPPH Radical Scavenging Activity Assay
The antioxidant activity of the samples was evaluated using the DPPH assay, as described by (Chanpirom et al., 2022). A methanolic DPPH solution (6 × 10⁻⁵ M) was mixed with 100 µL of the sample solution at concentrations ranging from 0.1 to 1 mg/mL. L-ascorbic acid, at concentrations of 1–8 µg/mL, was utilized as standard. The mixture was kept in the dark for 30 minutes before measuring the absorbance at 517 nm using a spectrophotometer. Each concentration was tested in triplicate
The percentage of DPPH inhibition was calculated by the following equation:
% DPPH inhibition = {[(A-B) – (C-D)] / (A-B)} × 100 (5)
Where; A is the absorbance of control without sample
B is the absorbance of the control without sample and DPPH solution.
C is the absorbance of a test sample.
D is the absorbance of a test sample without DPPH solution.
2.11 Statistical analysis
All experiments were performed in triplicate. The IBM SPSS software ver. 25.0 was used for statistical analysis. Kruskal-Wallis H test and pair t-test were used to evaluate the samples. p-value less than 0.05 (p< 0.05) was regarded as statistically significant.
3. Results and Discussion
3.1 Microscope
Spirogyra sp , commonly known as green algae or pond scum, is a type of freshwater green algae. It feels slippery and is often found floating on mats or attached to objects. Spirogyra sp. has a filamentous, unbranched structure, bright green color, and is covered in mucilage. Inside the cells, a central nucleus is present, and it can produce its food through photosynthesis due to its chloroplasts, which have a unique spiral shape. Along the chloroplast strands. Pyrenoids in Spirogyra sp. (Figure A) are unique organelles located within the chloroplasts of various algae and certain land plants. They are encased by polysaccharide layers that play a vital role in trapping CO2, thereby boosting the efficiency of photosynthesis. This interaction between pyrenoids and polysaccharides is essential for maintaining a high concentration of carbon around Rubisco, ensuring efficient photosynthetic activity compared to Cladophora sp. that had no pyrenoids in the chloroplast. (Figure B) (Meyer et al., 2017).

3.2 Spirogyra sp. Polysaccharides (SP)
Dried Spirogyra sp. was extracted through hot water extraction (Surayot et al., 2015), followed by precipitation using95% ethanol toisolate water-solublepolysaccharides.Thepolysaccharideextraction yields were calculated on the dry weight. Increasing the extraction time resulted in a higher polysaccharide content. The extraction yield increased from 1.7 to 1.92 and 2.40%, respectively. This is because the extraction time affects the diffusion of the duration times and solvent into and out of the membrane and cell walls, reaching the cytoplasm of the sample (Khoa et al., 2019). The pH value decreased from 7.44±0.01, 7.26±0.02, and 7.03±0.02 when increased extraction times to 1, 3, and 5 hours, respectively. It might be that prolonged exposure to heat during extraction may exacerbate this degradation, further contributing to acidity. Therefore, while longer extraction times initially enhance yield, they can ultimately result in lower pH due to these degradation processes (Feng et al., 2022; Honwichit et al., 2022).
The resulting polysaccharide appeared as a brown to dull gray. This decrease in chroma can occur through mixing with gray or complementary colors, resulting in a duller appearance (Briggs, 2007), the results of a* that show as minus (-) because the green color are from the green chlorophyll (Palta, 2009) as depicted in Table 1. Protein-polysaccharide conjugates were produced from brown algae and carries various components such as polysaccharides, proteins, and pigments out of the cells, which aligns with the polysaccharide content that was analyzed. Additionally, the color values of the biopolymer, measured as Chroma, L* and a*, decreased with increased extraction time (Boonyathan et al., 2022).
Figure 1. Physical Structure of Spirogyra sp. (A) and Cladophora sp. (B) under a microscope
Table 1 The extraction yield pH and color of polysaccharide from Spirogyra sp. extracted from different time
1
Values are given as mean ± S.D. from triplicate.
3.3 Total polysaccharide content
Total polysaccharides were tested by using the phenol-sulfuric acid method. The mechanism of the phenol-sulfuric method is to break down polysaccharides into monosaccharides by sulfuric acid and then react with phenol to give a yellow to brown color. The high intensity of the color relates to the high amount of monosaccharide contained in the extract (Chanpirom et al., 2022). As shown in Table 2, total polysaccharidecontentsof Spirogyra sp. had 227.51±28.58(1 hour),236.17±0.01(3hours),and 241.94±32.65(5 hours) mg glucose/g when preparedwith the total polysaccharidecontent of A. cornea at 3 hr. (Khan et al., 2023), C. Atramentaria at 2 hr. and L. Bertillonii at 2 hr. (Heleno et al., 2013) had polysaccharide content at 215.9±2.4, 16.27±0.5 and 7.91±0.3 mg/g respectively. Polysaccharides in algae typically have higher molecular weights and structural complexity compared to those in mushrooms. Algal polysaccharides, such as alginate and ulvan, are primarily composed of unique monosaccharidesand exhibitdiverseglycosidiclinkages,contributingtotheirfunctionalpropertieslike gelationandbioactivity(Beaumont et al.,2021;Li et al.,2024).In contrast,mushroom polysaccharides, mainly chitinand glucans, are generally simpler and less varied in structure(Xu et al., 2017; Stadnik & Freitas, 2014). Thus, the Spirogyra sp. polysaccharide extract for 5 hours (SP-5) exhibited the highest yield and total polysaccharide content. Thus, SP-5 was selected for FT-IR characterization, rheology behavior, water absorption and determination of antioxidant activity by DPPH radical scavenging activity assay.
Table 2 The total polysaccharide content of Spirogyra sp.
Extract time (hours)
1 hr. SP
3 hr. SP
5 hr. SP
3 hr. A. cornea (Khan et al., 2023)
Polysaccharide content (mg glucose equivalent/g extract)
227.51±28.6a
236.17±0.01a
241.94±32.7a
215.9±2.4
2 hr. C. Atramentaria (Heleno et al., 2013) 16.27±0.5
2 hr. L. bertillonii (Heleno et al., 2013)
7.91±0.3
Different letters in the same column indicate significant differences (p <0.05).
3.4 FT-IR Characterization of Polysaccharide
The result of FTIR spectra of the SP is shown in Figure 2. The IR spectrum of SP-5 showed the band at 3589 cm⁻¹ (O-H stretch), 3277 cm⁻¹ (O-H bend), 2940-2985 cm⁻¹ (C-H stretch), 1678 cm⁻¹ (C=C stretch),1408 cm⁻¹ (C-C bend),1371 cm⁻¹ (C-O stretch,strong, alkyl aryl ether),1077-1170 cm⁻¹ (C-O stretch,strong, alkyl aryl ether),1004 cm⁻¹ (C-O stretch),976 cm⁻¹ (C-H bend), 685-879 cm⁻¹ (CH oop), 567 cm⁻¹ (C-Cl stretch). Functional groups, including the C=O band and C-O stretch, were assigned to the glycosidic bond. Compared to the standard HEC and pectin from Figure 5 and 6, the spectrum of HEC indicated a peak at 3566, 3288, 2940 and 2881 cm⁻¹, while the pectin spectrum indicated a peak at 1633, 1439, 1370, 1109, 1070, 1008, 993 and 832 cm⁻¹ which were similar in the SP. Thus, the SP might be cellulose and pectin.
3.5 Rheology behavior of SP-5
The study on the flow behavior of polysaccharides from SP-5 at concentrations of 0.5, 1, 3, 5, and 10 mg/ml were investigated by an increase in rheological properties in proportion to the concentration. Thisindicatedthatincreasingtheextractconcentrationsofpolysaccharidesresultedinahigherviscosity of thesample. Generally,the solutemolecules arenumerous in the solutionand interconnectedbetween bonds and their structure. This results in a study framework that demands substantial force to break those bonds (Hao et al., 2018). The flow behavior observed was influenced by extract duration times. The results showed that solutions behaved as non-Newtonian (pseudoplastic fluids), exhibiting shear thinning, where an increase in shear rate leads to a decrease in viscosity like polysaccharide from Ceramium virgatum, Cladophora vagabunda and Anabaena sp. ATCC 33047 (Cioroiu et al., 2017; Benyouns et al., 2018 and Bernaerts et al., 2019).
Figure 2 FTIR spectra of SP-5, HEC and Pectin
Figure 3 Rheology behavior of SP-5 that various concentrations
3.6 Water Absorption
Due to its unique molecular structure and interactions, the water absorption and retention capacity of SP-5 had lower water absorption 44.71±0.5 g/g compared to that of hydroxyethyl cellulose (HEC) 53.00±0.5g/g.Hydrophilichydroxyl groupsofHECformstronghydrogenbondswithwater,enhancing its moisture retention capabilities (Chen et al., 2024). In contrast, polysaccharides often have a more rigid structure that limits their water absorption and can lead to brittleness when hydrated (Zhao et al., 2021). The results of water absorption had significantly difference between SP and HEC (P < 0.05)
Table 3 Water absorption of SP-5
Sample Water absorption (g/g)
SP-5
HEC
Different letters in the same column indicate significant differences (p <0.05).
3.7 Antioxidant activity of SP-5 by using DPPH assay
Water absorption (g/g)
44.71±0.5a
53.00±0.5b
The antioxidant activity of Spirogyra sp. was tested using the DPPH assay, and the results showed that the water extract of Spirogyra sp. at a dose of 100 µg/mL had the highest antioxidant activity of 89.13±15.6%, compared to Cladophora glomerata at 71% (Amornlerdpison et al., 2011), and other seaweed extracts such as Padina australis at 53.3% and Sargassum echinocarpum at 27.97% (Nursid et al., 2016) Polysaccharides are often associated with other components such as amino acids, proteins, lipids, and nucleic acids (Chen et al., 2008). A study on the characteristics of polysaccharides in Spirogyra sp revealed that it consists of 68-85.3% carbohydrates, 3.2-4.9% uronic acids, 2.2-12.2% sulfate, and 2.6-17.1% protein (Srayot et al., 2015). Several studies have found that proteins or peptide groups in polysaccharides play a role in scavenging free radicals. According to (Liu et al., 1997), the antioxidant activity of proteins and peptides is linked to amino acids that can donate protons to electron efficient free radicals (Elias et al., 2008; Minelli et al., 2008; Perez et al., 2007). The absorbance of the stable free radical DPPH decreased as the concentration of Spirogyra sp crude extract increased. Using the absorbance values obtained for DPPH at various concentrations of the crude extract prepared with ethanol and methanol as solvents, the percentage of inhibition (% inhibition) was determined (Suphan et al., 2021).
Table 4 Antioxidant activity of polysaccharides
Samples
Cladophora glomerata (Amornlerdpison et al., 2011)
Padina australis (Nursid et al., 2016)
Sargassum echinocarpum (Nursid et al., 2016)
4. Conclusion
This study highlights the assessment of SP-5 for application in cosmetic. The hot water extraction process effectivelyyieldedpolysaccharides with notable antioxidant properties, hydration capacity, and functionality as thickeners. Extraction for five hours produced the highest polysaccharide content and demonstrated excellent antioxidant activity. Additionally, it could enhance moisture retention. These results suggest that SP could be a sustainable and natural alternative to synthetic ingredients in cosmetic formulations. To fully realize its commercial potential, future studies should focus on the formulation and stability of cosmetic products and clinical trials to validate its efficacy and safety.
5. Acknowledgements
The authors thank Mae Fah Luang University (MFU) for providing laboratory facilities and financial support.
6. References
Amorlerdpison, D., Duangjan, K., Kanjanapothi, D., Taesotikul, T., & Peerapornpisal, Y., (2012). Gastroprotective activity of Spirogyra neglecta (Hassall) Kützing. 19(2), 88-94. https://doi.org/10.14456/paj.2022.11
Awolu, O. O., Oyebanji, O. V., & Sodipo, M. A. (2017). Optimization of proximate composition and functional properties of composite flours consisting wheat, cocoyam (Colocasia esculenta) and bambara groundnut (Vigna subterranea). International Food Research Journal, 24(1). https://www.researchgate.net/publication/315816763
Barahona, T., Encinas, M. V., Mónica Imarai, Mansilla, A., Matsuhiro, B., Torres, R., & Valenzuela, B. (2014). Bioactive polysaccharides from marine algae. Bioactive Carbohydrates and Dietary Fibre, 4(2), 125–138. https://doi.org/10.1016/j.bcdf.2014.09.002
Beaumont, M., Tran, R., Vera, G., Niedrist, D., Rousset, A., Pierre, R., Shastri, V. P., & Forget, A. (2021). Hydrogel-Forming Algae Polysaccharides: From Seaweed to Biomedical Applications. Biomacromolecules, 22(3), 1027–1052. https://doi.org/10.1021/acs.biomac.0c01406
Benyounes, K., Remli, S., & Benmounah, A., (2018). Rheological behavior of Hydroxyethylcellulose (HEC) Solutions. Journal of Physics. 1045, 012008. https://doi.org/10.1088/17426596/1045/1/012008
Boonyathan, B., Laohakunjit, N., Uthairatanakij, A., & Kaisangsri, N., (2022). Extraction, Characterization and Antioxidant Capacity of Biopolymersfrom Nostoc commune using Hot Water and Combined Hot Water and Ultrasound-Assisted Extraction. https://doi.org/10.14456/kmuttrd.2022.10
Cao, C., Feng, Y., Kong, B., Xia, X., Liu, M., Chen, J., Zhang, F., & Liu, Q., (2021). Textural and gel properties of frankfurters as influenced by various κ-carrageenan incorporation methods. 176, 108483. https://doi.org/10.1016/j.meatsci.2021.108483
Carneiro-da-Cunha, M. G. (n.d.)., Cerqueira, M.A., Souza, B.W.S., Teixeira, J.A., & Vicente, A.A., (2011). Influence of concentration, ionic strength and pH on zeta potential and mean hydrodynamic diameter of edible polysaccharide solutions envisaged for multinanolayered films production. 85(3), 522-528. https://doi.org/10.1016/j.carbpol.2011.03.001
Chanpirom, S., Saewan, N., & Sripisut, T., (2022). Alternative Utilization of Vegetable Crop: Pumpkin Polysaccharide Extract and Their Efficacy on Skin Hydration. 9(6), 113. https://doi.org/10.3390/cosmetics9060113
Chen, B. J., Liu, G. G., Wang, X., Liu, H. R., Zhang, Y., Wang, C. F., Liu, C. X., & Qiao, Y. J. (2024). Development and Characterization of an Antioxidant and Antimicrobial Film Composited by Hydroxyethyl Cellulose and Sulfated Rice Bran Polysaccharides for Food Packaging. Foods (Basel, Switzerland), 13(6), 819. https://doi.org/10.3390/foods13060819
Cioroiu, D. R., Parvulescu, O. C., Koncsag, C. I., Dobre, T., & Raducanu, C. (2017). Rheological Characterization of Algal Suspensions for Bioethanol Processing. Revista de Chimie, 68(10), 2311–2316. https://doi.org/10.37358/rc.17.10.5875
Deng, L. Z., Pan, Z., Zhang, Q., Liu, Z. L., Zhang, Y., Meng, J. S., Gao, Z. J., & Xiao, H. W. (2019). Effects of ripening stage on physicochemical properties, drying kinetics, pectin polysaccharides contents and nanostructure of apricots. Carbohydrate polymers, 222, 114980. https://doi.org/10.1016/j.carbpol.2019.114980
Domżał-Kędzia, M., Lewińska, A., Jaromin, A., Weselski, M., Pluskota, R., & Łukaszewicz, M., (2019). Fermentation parameters and conditions affecting levan production and its
potential applications in cosmetics. Bioorganic chemistry, 93, 102787. https://doi.org/10.1016/j.bioorg.2019.02.012
Duangjai, A., Limpeanchob, N., Trisat, K., & Amornlerdpison, D. (2016). Spirogyra neglecta inhibits the absorption and synthesis of cholesterol in vitro. Integrative medicine research, 5(4), 301– 308. https://doi.org/10.1016/j.imr.2016.08.004
Feng, S., Tang, M., Jiang, Z., Ruan, Y., Liu, L., Kong, Q., Xiang, Z., Chen, T., Zhou, L., Yang, H., Yuan, M., & Ding, C. (2022). Optimization of Extraction Process, Structure Characterization, andAntioxidant Activityof Polysaccharides fromDifferent Partsof Camellia oleifera Abel. Foods (Basel, Switzerland), 11(20), 3185. https://doi.org/10.3390/foods11203185
Ghosh, S., Khatua, S., Dasgupta, A., & Acharya, K. (2021). Crude polysaccharide from the milky mushroom, Calocybe indica, modulates innate immunity of macrophage cells by triggering MyD88-dependent TLR4/NF-κB pathway. The Journal of pharmacy and pharmacology, 73(1),70–81. https://doi.org/10.1093/jpp/rgaa020
Gustaw,W., &Mleko, S.,(2003).The Effect ofpH andCarrageenan ConcentrationonThe Rheological Properties of Whey Protein Gels. https://journal.pan.olsztyn.pl/pdf-9775630209?filename=30209.pdf
He, J., Chen, L., Chu, B., & Zhang, C., (2018). Determination of Total Polysaccharides and Total Flavonoids in Chrysanthemum morifolium Using Near-Infrared Hyperspectral Imaging and Multivariate Analysis. 23(9), 2395. https://doi.org/10.3390/molecules23092395
Hentati, F., Pierre, G., Ursu, A. V. (n.d.)., Vial, C., Delattre, C., Abdelkafi, S., & Michaud, P., (2020). Rheological investigations of water-soluble polysaccharides from the Tunisian brown seaweed Cystoseira compressa. 103, 105631. https://doi.org/10.1016/j.foodhyd.2019.105631
Heleno, S. A., Barros, L., Martins, A., Queiroz, M. J., Santos-Buelga, C., & Ferreira, I. C. (2012). Phenolic, polysaccharidic, and lipidic fractions of mushrooms from northeastern Portugal: chemical compounds with antioxidant properties. Journal of agricultural and food chemistry, 60(18), 4634–4640. https://doi.org/10.1021/jf300739m
Honwichit, O., Ruengsaengrob , P., Buathongjan , C., & Charoensiddhi, S. . (2022). Influence of Extraction Methods on the Chemical Composition and Antioxidant Activity of Polysaccharide Extracts from Discarded Sea Grape (Caulerpa lentillifera). Journal of Fisheries and Environment, 46(1), 169-179. Retrieved from https://li01.tcithaijo.org/index.php/JFE/article/view/254386
Institute for the Promotion of Teaching Science and Technology. (n.d.). สไปโรไจรา (เทานา). Retrieved November 20, 2024, from http://biology.ipst.ac.th/?p=971
Kamble, S.M., Rokde, A.U., & Chavan, A., (2012). Antifungal activity of algal extracts against plant pathogenic fungi. 2(3), 23-24. https://core.ac.uk/download/pdf/236014979.pdf
Khan, A. A., Lu, L. X., Yao, F. J., Fang, M., Wang, P., Zhang, Y. M., Meng, J. J., Ma, X. X., He, Q., Shao, K. S., Wei, Y. H., & Xu, B. (2023). Characterization, antioxidant activity, and mineral profilingof Auricularia cornea mushroomstrains. Frontiers in nutrition, 10, 1167805. https://doi.org/10.3389/fnut.2023.1167805
Lautenschläger, H., (2009). (Poly) saccharides in cosmetic products -from alginate to xanthan gum.(4), 12-15.https://dermaviduals.de/cms/upload/Publikationen_english/KP-04-09-Polysaccharideengl.pdf
Li, C., Wang, H., Zhu, B., Yao, Z., & Ning, L. (2024). Polysaccharides and oligosaccharides originated fromgreen algae: structure,extraction, purification,activityand applications. Bioresourcesand bioprocessing, 11(1), 85. https://doi.org/10.1186/s40643-024-00800-5
Mahae, N., Sirivongpaisal, P., & Wattanakul, U., (2010). Extraction and Characterization of Polysaccharides from Gracilaria fisheri, Ulva rigida and Caulerpa racemosa.
https://www.repository.rmutsv.ac.th/handle/123456789/2084
Meyer, M.T., Whittaker, C,. & Griffiths, H. (2017). The algal pyrenoid: key unanswered questions. 68(14), 3739-3749. https://doi.org/10.1093/jxb/erx178
Naik Ansari, A., Hemavani, C., & Thippeswamy, В., (2012). Evaluation of antimicrobial property of Spirogyra species. 2(2), 13-15. https://core.ac.uk/download/pdf/236014931.pdf
Nursid, M., Marraskuranto, E., Atmojo, K. B. (n.d.)., Hartono, M. P., Nur Meinita, M. D., & R, R., (2017). Investigation on Antioxidant Compounds from Marine Algae Extracts Collected from Binuangeun Coast, Banten, Indonesia.11(2), 59-67. https://doi.org/10.15578/squalen.v11i2.243
Palta, J. P. (1990). Leaf chlorophyll content. Remote Sensing Reviews, 5(1), 207–213. https://doi.org/10.1080/02757259009532129
Permann, C., Herburger, K., Felhofer, M., Gierlinger, N., Lewis, L. A., & Holzinger, A. (2021). Induction of Conjugation and Zygospore Cell Wall Characteristics in the Alpine Spirogyra mirabilis (Zygnematophyceae, Charophyta): Advantage under Climate Change Scenarios. Plants (Basel, Switzerland), 10(8), 1740. https://doi.org/10.3390/plants10081740
Phattarasupa, P., Rimkeeree, H., & Dhamvithee1, P., (2018). Effect of the Extraction Conditions on Antioxidant Activity and Total Phenolic Contents of Spirogyra spp. Liquid Extract. https://doi.org/10.14457/KU.res.2018.259
Phinyo K. (2012). Potentials of polysaccharides from Tao [Spirogyra neglecta (Hassall) Kützing/ for use as prebiotic. https://cmudc.library.cmu.ac.th/frontend/Info/item/dc:118229
Phonrin, A., (2017). Determination of Total Phenolic and Antioxidant Activity in Fresh Water Macro Algae from Nan Province. https://buuir.buu.ac.th/xmlui/handle/1234567890/6167
Renard, C.M.G.C., Rohou, Y., Hubert, C., Della Valle, G., Thibault, J.-F., & Savina, J.-P., (2002). Bleaching of Apple Pomace by Hydrogen Peroxide in Alkaline Conditions: Optimisation and Characterisation of the Products. 30(4), 125-138. https://doi.org/10.1006/fstl.1996.0195
Ruangrit, K., Chaipoot, S., Phongphisutthinant, R., Duangjan, K., Phinyo, K., Jeerapan, I., Pekkoh, J., & Srinuanpan, S., (2021). A successful biorefinery approach of macroalgal biomassas a promising sustainable source to produce bioactive nutraceutical and biodiesel. https://doi.org/10.1007/s13399-021-01310-6
Rutikanga, A., Gitu, L., Oyaro, N., & Chacha, S., (2014). Mineral Composition, Antioxidant and Antimicrobial Activities of Freshwater Algae (Spirogyra Genus). http://journals.jkuat.ac.ke/index.php/jscp/article/viewFile/882/783
Sang-ngern, M., & Saansomchai, J., (2008). Development of Spirulina spp., Cladophora glomerata and Spirogyra spp. Extract for moisturizing agent. https://archives.mfu.ac.th/database/files/original/d7d7fe7a637861512daf4e390e723e8d.pdf
Shibaev, A. V., Muravlev, D. A., Muravleva, A. K., Matveev, V. V., Chalykh, A. E., & Philippova, O. E. (2020). pH-Dependent Gelation of a Stiff Anionic Polysaccharide in the Presence of Metal Ions. Polymers, 12(4), 868. https://doi.org/10.3390/polym12040868
Sitthiwong, N., (2019). Pigmentand Nutritional Value of Spirogyraspp.in Sakon Nakhon, Nakhon Phanom and Mukdahan Provinces. 9(1), 10-21. https://doi.org/10.14456/10.14456/stj.2019.2
Snehalatha, D., & Digamber Rao, B., (2015). Antifungal activity of freshwater green-algae (Chlorophyceae). https://www.ejpmr.com/home/abstract_id/423
Song, F., Ning, F., Feng, Y., Zhang, Y., Gong, F., Ning, C., Yu, Y., Zhang, R., Han, R., Qi, Y., Meng, M., & Sun, H., (2024). The polysaccharides from blackened jujube with ultrasonic assistance extraction: Optimization of extraction conditions, antioxidant activity and structural analysis. 213, 117077. https://doi.org/10.1016/j.lwt.2024.117077
Stadnik, M.J., & Freitas, M.B.d.(n.d.)., (2014). Algal polysaccharides as source of plant resistance inducers Tropical Plant Pathology, 39(2), 111–118. https://doi.org/10.1590/s198256762014000200001
Suphan, S., Sodmanee, P., Koomkan, P., Rachar, S., Prajankett, P., (2021). The Biological Activity of Spirogyra SP. Crude Extracts. 9(2), 2287-0083. https://ph01.tcithaijo.org/index.php/scudru/article/download/243827/166887/
Surayot, U., Wang, J., Lee, J. H., Kanongnuch, C., Peerapornpisal, Y., & You, S. (2015). Characterization and immunomodulatory activities of polysaccharides from Spirogyra neglecta (Hassall) Kützing. Bioscience, biotechnology, and biochemistry, 79(10), 1644–1653. https://doi.org/10.1080/09168451.2015.1043119
Tantapakul, C., Khat-udomkiri, N., Sitthichai, P., Chomsak, A., Thananusak, N., Phukhatmuen, P., Vinardell, M.P., & Sripisut, T., (2024). Exploring the physicochemical properties of polysaccharides extracted from cocoa pod husk waste and their efficacy in skin hydration. 222(4), 119940. https://doi.org/10.1016/j.indcrop.2024.119940
Tepsongkroh, B., Thaihuttakij, C., Supawong, S., & Jangchud, K. (2023). Impact of high-pressure pretreatment and hot water extraction on chemical properties of crude polysaccharide extract obtained from mushroom (Volvariella volvacea). Food chemistry: X, 19, 100864. https://doi.org/10.1016/j.fochx.2023.100864
Thumvijit, T., Inboot, W., Peerapornpisal, Y., Amornlerdpison, D., & Wongpoomchai, R., (2013). The antimutagenic and antioxidant properties of Spirogyra neglecta (Hassall) Kützing. Journal of Medicinal Plants Research,7(34), 2494-2500. https://doi.org/10.5897/jmpr2013.4427
Xu, S. Y., Huang, X., & Cheong, K. L. (2017). Recent Advances in Marine Algae Polysaccharides: Isolation, Structure, and Activities. Marine drugs, 15(12), 388. https://doi.org/10.3390/md15120388
Yosboonruang, A., Duangjai, A., Amormlerdpison, D., & Viyoach, J., (2018). Screening for Biological Activities of Spirogyra neglecta Water Extract. Walailak Journal of Science and Technology (WJST), 17(4), 359–368. https://doi.org/10.48048/wjst.2020.4638
Yu, X. H., Liu, Y., Wu, X. L., Liu, L. Z., Fu, W., & Song, D. D. (2017). Isolation, purification, characterization and immunostimulatory activity of polysaccharides derived from American ginseng. Carbohydrate polymers, 156, 9–18. https://doi.org/10.1016/j.carbpol.2016.08.092
Zhao, Y., Li, B., Li, C., Xu, Y., Luo, Y., Liang, D., & Huang, C. (2021). Comprehensive Review of Polysaccharide-Based Materials in Edible Packaging: A Sustainable Approach. Foods (Basel, Switzerland), 10(8), 1845. https://doi.org/10.3390/foods10081845
Zheng, P., Dai, W., Tan, B.K., Zhang, Y., Lin, S., & Hu, J., (2024). Combination of steam explosion pretreatment and mixture design optimization as a strategy to enhance the antioxidant activity of crude polysaccharides isolated from edible mushrooms. LWT, 200, 116215–116215. https://doi.org/10.1016/j.lwt.2024.116215
ABSTRACT & FULL PAPER ABSTRACT & FULL PAPER ICIM
FULL
Proceeding of Cosmetic and Beauty International Conference (CBIC) 2025 & International Conference on Integrative Medicine (ICIM) 2025 16th-17th January 2025
Antimicrobial activities of bark, leaf, seed and fruit of Cleistocalyx nervosum var. paniala ethanolic extracts
Sawika Koedmanee1, Areeya Chantrachirathumrong1, Orawan Akkapong1 , Chutinan Suksaard2, Aunyachulee Ganogpichayagrai1*
1 School of Integrative Medicine, Mae Fah Luang University, Chiang Rai 57100, Thailand
2 School of Health Science, Mae Fah Luang University, Chiang Rai 57100, Thailand
*Corresponding author: E-mail: aunyachulee.gan@mfu.ac.th
ABSTRACT
Introduction: Cleistocalyx nervosum var. paniala (Makiang) is beneficial as a medicinal plant for treating many symptoms. The study aims to investigate antimicrobial activities of bark, leaf, seed and fruit ethanolic extracts of C. nervosum.
Methods: Antimicrobial activities were determined against five gram-positive bacteria (Bacillus cereus, Bacillus subtilis, Kocuria rhizophila, Staphylococcus aureus and Staphylococcus epidermidis), seven gram-negative bacteria (Escherichia coli, Enterobacter aerogenes, Pseudomonas aeruginosa, Salmonella typhi, Salmonella typhimurium, Shigella flexneri and Vibrio cholera) and two fungi (Saccharomyces cerevisiae and Candida albicans). Zone of inhibition was determined, according to the Kirby-Bauer disk diffusion guideline. MIC was determined using Broth microdilution technique, according to the CLSI guideline, then MBC and MFC were determined by subculturing the clear solution of inoculate broth on sterile agar afterward.
Results: The bark, leaf, seed and fruit ethanolic extracts of C. nervosum showed inhibition zone against all tested bacteria; inhibitory activity against tested gram-positive bacteria, with MIC ranging from 62.5 to 2,000 µg/ ml; bactericidal activity against gram-positive bacteria, ranging from 250 to 2,000 µg/ ml.
Conclusion: The ethanolic extracts of C. nervosum antibacterial activity against gram-positive bacteria; however, theyhadinactivebactericidal activityagainst testedgram-negative bacteria, and also inactive fungicidal activity against tested fungi. C. nervosum can be an alternative source of plant with a slightly bactericidal potential against gram-positive bacteria.
Keywords: Cleistocalyx nervosum; Inhibition zone; MIC; MBC; MFC
1. Introduction
Cleistocalyx nervosum var. paniala (Makiang) is the local plant of Thailand and can be found in the upper North of Thailand in Chiang Mai, Chiang Rai, Lamphun, Lampang, Phayao, Phrae, Nan, and Phitsanulok(Chareonsap,2015).In ancientpharmacopeia,the barkwas usedtreat Parkinson'sdiseases, relievediarrhea,treatskindiseases,woundhealing.Barkcontainsahighamountoftannins,whichhave an antioxidant effect (Puechkaset, 2021). Leaf contains high amounts of phenolics and flavonoids, which have an anti-aging effect (Chareonsap, 2015; Manosroi et al., 2015). Fruit has a sour taste, astringent, and has an aroma. It is popular to bring fruit to eat and make processed products in food products. It contains phenolics, anthocyanins, and flavonoids that have antioxidants that slow down agingandanti-cancer(Chareonsap,2015).Seedcontainsflavonoids,phenolics,andtannins,whichhave antioxidant and anti-cancereffects, in addition, seed is used to extract oil for cooking or as a mixture in cosmetics and perfumes, and other industrial products (Manosroi et al., 2015; Puechkaset, 2021; Prasanth, 2020).
Drug resistance leads to more difficulty treating infections. There is a need to discover new antimicrobial herbs or drugs. Previous study mentioned that C. nervosum had antimicrobial activities against Propionibacterium acne and Staphylococcus aureus (fruit extract) (Arsa, 2008), and against Escherichia coli, Salmonella typhimurium and Staphylococcus aureus (seed extract) (Balmuang et al., 2008). Due to insufficient data for antimicrobial activities, the purpose of this study is to investigate antimicrobial activities of bark, leaf, seed and fruit ethanolic extracts of C. nervosum.
2. Materials and Methods
Microorganisms
Bacillus cereus (DMST 5040), Bacillus subtilis (DMST 15890), Kocuria rhizophila (DMST 15503), Staphylococcus aureus (DMST 8840), Staphylococcus epidermidis (DMST 15505), Escherichia coli (DMST 4212), Enterobacter aerogenes (TISTR 1540), Pseudomonas aeruginosa (DMST 4739), Salmonella typhi (DMST 22842), Salmonella typhimurium (DMST 562), Shigella flexneri (DMST 4423), Vibrio cholera (DMST 2873), Saccharomyces cerevisiae (TISTR 5019) and Candidaalbicans (DMST15313)wereobtainedfromScientificandTechnologicalInstrumentsCenter, Mae Fah Luang University, Thailand.
Bacteria were grown on Mueller Hinton Agar (MHA), and fungi were grown on Sabouraud Dextrose Agar (SDA). Microorganisms were incubated at 37 ºC, for 24 hours. The turbidity was adjusted to 0.5 McFarland standards. Each microorganism was suspended in 0.85% normal saline. C. nervosum extraction
Bark, leaf, fruit, and seed of C. nervosum were collected from May to October 2021, from Chiang Mai, Chiang Rai, Phayao and Mae Hong Son Provinces, Thailand. C. nervosum samples were authenticated by Manop Suksaard, Former director of the Chiang Rai provincial agricultural extension office. Voucher specimens were deposited at School of Integrative Medicine, Mae Fah Luang University, Thailand.
C. nervosum samples were dried at 50 °C in hot air oven, then ground to a fine powder. For mix part of C. nervosum: barks, leaves, fruits and seeds were mixed in equal weights. Plant powders were extracted in 95% ethanol using a Soxhlet apparatus, then evaporated using a Rotary evaporator. The extracts were store at -20 °C.
Antimicrobial activities
Determination of Zone of inhibition
Disk diffusion test was used to determine the zone of inhibition, as according to the Kirby-Bauer disk diffusion guideline (Hudzicki, 2009) with a minor modification. The double agar layer technique was performed; 100 μl of each microbial suspension was added to 5 ml sterile agar (MHA or SDA), then poured on 20 ml sterile agar base. All plates were dried at room temperature. The tested extracts and positive controls were dissolved in Dimethyl sulfoxide ( DMSO) 6-mm filter paper disk
Figure 1: Bark, leaf, fruit, and seed of C. nervosum var. paniala
impregnated with 20 μl of each part or mix of C. nervosum extract (200 mg/ml), 20 μl of positive control (Ampicillin (1 mg/ml), Gentamicin (1 mg/ml), and Ketoconazole (1 mg/ml)), or 20 μl of negative control (DMSO), were placed on each agar plates with microbial suspension. All agar plates were incubated at 37 °C for 24 hours, then evaluated by measuring the diameter from edge to edge across zone of inhibition. All tests were performed in triplicate.
Determination of MIC, MBC and MFC
Minimum inhibitory concentration test (MIC) was used to determine susceptibility of microbial strainsusingmicrodilutionmethodin96-wellplates,asaccordingtotheCLSIguideline(Andrews,2001). Each well (100 µl/ well) was filled with 80 µl of broth (Mueller Hinton Broth (MHB) for bacteria, or Sabouraud Dextrose Broth (SDB) for fungi), 10 μl of each tested solution (Columns 1st to 10th for each plant extracts, or positive control, Column 11th for negative control and Column 12th for broth) and 10 μl of each microbial suspension. All 96-well plates were incubated at 37 °C for 24 hours, then evaluated by observing the last well (the lowest concentration), which shown clear solution (no visible growth of a microorganism).
Subculture the clear solution of inoculate broth (MHB or SDB) on sterileagar base (MHA or SDA), incubated at 37 °C for 24 hours. The minimum bactericidal concentrations (MBC) and minimum fungicidal concentrations (MFC) were evaluated by observing the lowest concentration with no visible growth of a microorganism (Ma, 2006; Kowalska-Krochmal et al, 2021). All tests were performed in triplicate.
3. Results and Discussion
For disk diffusion test, C. nervosum ethanolic extracts showed inhibition zones against tested bacteria They had no inhibition zones against tested fungi. (Table 1)
Table 1: Inhibition zones of C. nervosum, positive control and negative control
Microorganisms Inhibition zone (mm)*
epidermidis
aerogenes
Pseudomonas aeruginosa
Bark Leaf Fruit Seed Mix
Ampicillin
Gentamicin
Ketoconazole
DMSO
Microorganisms
nervosum var. paniala
Inhibition zone (mm)*
Salmonella typhi
flexneri
Saccharomyces cerevisiae
* mean ± SD, N/A = No activity
Figure 2: Inhibition zones against Bacillus cereus B=Bark, L=Leaf, F=Fruit, S=Seed, M=Mix, D=DMSO, A=Ampicillin, G=Gentamicin
For Brothmicrodilutionmethod, C. nervosum ethanolicextractsshowed inhibitoryactivityagainst all tested gram-positive bacteria, ranging from 62.5 to 2,000 µg/ ml. After subculturing the clear solution of inoculate broth on sterile agar. C. nervosum ethanolic extracts showed bactericidal activity against gram-positive bacteria, especially for Bacillus cereus ranging from 500 to 1,000 µg/ ml. However, C. nervosum ethanolic extracts had no inhibitory and no bactericidal activities against tested gram-negative bacteria, and no fungicidal activity tested fungi. (Table 2)
Candida
Table 2: Minimum inhibitory concentration (MIC) and minimum bactericidal concentrations (MBC) of C. nervosum, positive control and negative control
Micro organisms
aeruginosa
S. typhimurium
S. flexneri
lerae
* N/A = No activity
Diskdiffusiontestwasusedfor invitro qualityantimicrobialscreening,todeterminethesensitivity or resistance of each microorganism (Hudzicki, 2009), including to five gram-positive bacteria ( B. cereus, B subtilis, K. rhizophila, S. aureus, and S. epidermidis), seven gram-negative bacteria (E. coli, E. aerogenes, P. aeruginosa, S. typhi, S. typhimurium, S. flexneri, and V. cholerae) and two fungi (S Cerevisiae and C. albicans) to the ethanolic extracts of Cleistocalyx nervosum var. paniala (200 mg/ml) The extracts (bark, leaf, fruit and seed) showed inhibition zones against five gram-positive bacteria (sensitivity), ranging from 10.00 ± 0.00 mm. to 19.00 ± 0.00 mm. Widest inhibition zone diameter against B. cereus, B subtilis, K. rhizophila, S. aureus, and S. epidermidis was found to be 16.33 ± 0.58 (seed), 15.00 ± 0.00 (leaf and seed), 17.00 ± 0.00 (seed), 15.66 ± 1.15 (leaf), 19.00 ± 0.00 mm. (leaf), respectively. However, the bark, leaf and seed extracts showed no inhibition zone, or smallest inhibition zone (7.00 ± 0.00 mm.) to gram-negative bacteria (resistance). Except for V. cholerae, with inhibition zone ranging from 11.00 ± 0.00 to 15.00 ± 0.00 mm.
Broth microdilution method was used for in vitro quantity antimicrobial screening, to find the lowest concentration of C nervosum extracts that inhibited the visible growth of a tested microbial (Andrews, 2001; Kowalska-Krochmal et al, 2021). According to the criterion of Holetz et al., defined the antimicrobial potential as good, moderate,slightly and resistance (inactive)with MIC less than 100 µg/ ml, 100 to 500 µg/ ml, 500 to 1,000 µg/ ml and over 1,000 µg/ ml, respectively(Holetz et al, 2002). For gram-positive bacteria, bark, leaf, and seed extracts had moderate potential to inhibit the visible growth of tested gram-positive bacteria, with the concentration ranging from 125.00-250.00 µg/ ml, exceptleafextracthadgood antimicrobialpotentialtoinhibitthevisiblegrowthof S.epidermidis.After subculturing the clear solution of inoculate broth on sterile agar base for 24 hours, the lowest concentration of the extracts to kill a tested microbial was observed as minimum bactericidal
concentrations (MBC), or minimum fungicidal concentrations (MFC). Bark, leaf and seed extracts had slightly potential to kill the visible growth of tested gram-positive bacteria, except leaf extract had moderateantimicrobialpotentialto kill the visiblegrowth of S. aureusand S. epidermidis.C. nervosum extracts had inactive bactericidal activityagainst tested gram-negative bacteria, and inactive fungicidal activity against Fungi, S. cerevisiae and C. albicans
4. Conclusion
C. nervosum ethanolic extracts showed antibacterial activity against gram-positive bacteria; however, they had inactive bactericidal activity against tested gram-negative bacteria, and also inactive fungicidal activityagainsttestedfungi. C.nervosum hadnoantimicrobialsynergisticeffect,when mixedbarks,leaves, fruits and seeds together in equal weights. C. nervosum can be an alternative source of plant, with a slightly bactericidal potential against gram-positive bacteria.
5. Acknowledgements
The authors are grateful to Mae Fah Luang University for funding the research. The authors are also grateful to Medicinal Plant Innovation Center of Mae Fah Luang University for necessary assistance and laboratory facilities.
6. References
Chareonsap P.P. (2015) Makiang:Conserved Plant in RSPG. Plant Genetic Conservation Project under the Royal Initiative of Her Royal Highness Princess Maha Chakri Sirindhorn by Uttaradit Rajabhat University, Uttaradit
Manosroi J, Chankhampan C, Kumguan K, Manosroi W, & Manosroi A. (2015) In vitro anti-aging activitiesofextractsfromleavesofMaKiang(Cleistocalyxnervosum var. paniala).Pharmaceutical Biology; 53(6):862–9.
Puechkaset A. (2021) Makiang properties and benefits. Puechkaset.com. Available from: http://puechkaset.com/มะเกี๋ยง/
PrasanthM.I., SivamaruthiB.S., SukprasansapM,Chuchawankul S, TencomnaoT, &Chaiyasut C.(2020) Functional propertiesandBioactivitiesof Cleistocalyxnervosum var. paniala berryplant:areview. Food Sci Technol; 40(suppl 2):369–73.
Arsa P. (2008) Chemical constituents and antibacterial activity on Propionibacterium acnes and Staphylococcus aureus of Cleistocalyx nervosum var. paniala seeds ( dissertation) . Chiangmai: Chiangmai University
Balmuang N, Tantratien S, & Chanritisen T. (2016) Increasing antimicrobial efficiency of Ma-kiang (Cleistocalyx nervosum var. paniala) seed extract using adsorbents. Proceeding of RSU National Research Conference; Pathumthani, Thailand; 2016. p. 477-85.
Hudzicki J. (2009) Kirby-Bauer disk diffusion susceptibility test protocol. American society for microbiology. Dec 8;15:55-63.
MA W. (2006) Methods for dilution antimicrobial susceptibility tests for bacteria that grow aerobically: approved standard. CLSI (Nccls); 26:M7-A7.
Andrews (2001) J M. Determination of minimum inhibitory concentrations. Journal of antimicrobial Chemotherap;48(suppl_1):5-16.
Kowalska-Krochmal B., Dudek-Wicher R. (2021) The minimum inhibitory concentration of antibiotics: Methods, interpretation, clinical relevance. Pathogens;10(2):165.
HoletzF B ,PessiniG L ,SanchesN R ,CortezD A ,NakamuraC V , &DiasFilhoB P.(2002) Screening ofsomeplantsusedintheBrazilianfolkmedicineforthetreatmentofinfectiousdiseases.Memórias do Instituto Oswaldo Cruz; 97:1027-31.
Proceeding of Cosmetic and Beauty International Conference (CBIC) 2025 & International Conference on Integrative Medicine (ICIM) 2025 16th-17th January 2025
The effectiveness of probiotic on erythrocyte sedimentation rate in stressed individuals: a randomized controlled trial
Teethawat
Jiravichada1, Parama Pratummus1*
1School of Anti-aging and Regenerative Medicine, Mae Fah Luang University, Bangkok, Thailand
*Corresponding author: Parama Pratummus E-mail: parama.pra@mfu.ac.th
ABSTRACT
Introduction: Mental health is considered an important issue and stress is one of the problems. Stress is a reaction to certain situations that can result in increased inflammation towards situations resulting in increased inflammation. Generally, inflammation is evaluated by erythrocyte sedimentation rate (ESR). Nowadays, probiotic which is a good microorganism has been widely mentioned due to their benefits to the health. Therefore, the objective of this study is to investigate the effectiveness of probiotic on inflammation marker (ESR) aiming that probiotic would be an alternative treatment on inflammatory conditions without using conventional medication.
Method: The study was conducted in a randomized, placebo controlled trial with 34 volunteers with stress, which is classified into probiotic group and placebo group. Volunteers aged between 35-65 years old both male and female with mild level of stress. During the study, 1 tablet of probiotic is administered before breakfast in probiotic group and 1 tablet of placebo is administered before breakfast in placebo group for 8 weeks. Evaluation of erythrocyte sedimentation rate is performed at week 0, 4 and 8.
Result: In the study, the result demonstrated no statistical significance of erythrocyte sedimentation rate within probiotic group and placebo group by repeated measured ANOVA. Furthermore, the result demonstrated no statistical significance of erythrocyte sedimentation rate between before and after taking probiotic by paired sample t-test.
Conclusion: There are no sufficient evidence supporting that supplementation with probiotic Bifidobacterium longum for 8 weeks decrease inflammation measured by erythrocyte sedimentation rate. Therefore, further study regarding probiotic on erythrocyte sedimentation rate should be investigated.
Keywords: Probiotic; Inflammation; Erythrocyte Sedimentation Rate; Stress
1. Introduction
World Health Organization mentioned that mental health is an important issue after economic crisis affecting 970 millions people (World Health Organization, 2022). Stress is a reaction of the body towards perceived threats. Chronic stress leads to conditions and diseases such as increased heart rate, muscle pain, insomnia, impaired immunity, cardiovascular diseases and also psychiatry conditions such as depression and anxiety (Brianna Chu et al., 2022). There are 2 main mechanisms related to stress response including hypothalamic-pituitary-adrenal axis (HPA axis) and sympathoadrenal-medullary axis (SAM axis). In Sympatho-adrenal-medullary axis, adrenaline and noreadrenaline are secreted via vagus nerve. These hormones leads to increased blood pressure, increased respiratory rate, lowering bowel motility.While in hypothalamic-pituitary-adrenal axis, hypothalamus secrete corticotrophin releasing hormone or CRH leading anterior pituitary to secrete adrenocorticotrophic hormone (ACTH) and then secrete cortisol (Valencia Florez et al., 2023).
In 2001, Food and Agriculture organization of the United Nations and World Health Organization define probiotic as living microorganisms in adequate amount leads to health benefit (Reid et al., 2019). Probiotic has beneficial effects in various systems including lowering cholesterol level, preventing urinary tract infection, enhancing immunity, preventing cancer, decreasing oral odor and tooth caries, treating gastrointestinal disorders, lowering allergy, eczema and inflammatory diseases (Bodke & Jogdand, 2022). Generally, probiotics are found in fermented products such as beer, wine, breads, cheese and yogurts. Amount of probiotic is measured by colony-forming unit or CFU (Latif et al., 2023). Probiotic has the potential in preventing inflammation by various mechanisms such as preventing infection destroying mucosa by inhibiting the attachment of infection and also maintain tight junction. Probiotic prevents diseases associated with allergy or conditions associated with inflammation by lowering inflammation by T regulatory cell (Mengheri, 2008). Bifidobacterium longum is a species of probiotic found in human intestine commonly found in infants with breastfeeding and decrease along with aging. Bifidobacterium longum is classified in Actinobacteria phylum and also found beneficial in improving immunity, preventing and treating intestinal disorders including antibiotic-induced diarrhea, lactose intolerance, preventing intestinal infection, alleviating inflammatory bowel and also preventing allergy and asthma (Hidalgo-Cantabrana et al., 2017).
Inflammation is a process in which the body reacting to the injured tissue causing from infectious or non-infectious factors including tissue ischemia. Severe or chronic inflammation leads to disease such as cardiovascular diseases and cancer. In physiologic changes of inflammation, first physiological process is vascular dilation. Second step is extravasation. To manifest extravasation, there are 5 processes including margination, rolling, adhesion, diapedesis and migration (Kumar et al., 2010). Erythrocyte sedimentation rate is sedimentation of red blood cell within 1 hour and this could evaluate and monitor inflammatory conditions including infection and cancer (Tishkowski & Gupta, 2023). Therefore, the objective of this study is to investigate the effectiveness of probiotic on inflammatory marker (ESR) in stressed individuals aiming that probiotic would be an alternative treatment on inflammatory conditions without using conventional medication.
2. Materials and Methods
2.1 Methodology
A randomized, double-blinded placebo controlled trial was conducted by blood test including erythrocyte sedimentation rate at week 0, 4 and 8. Erythrocyte sedimentation rate was a tool used to measure inflammation in the study. Comparison of erythrocyte sedimentation rate within probiotic group and placebo group by repeated measure ANOVA and compared before and after taking probiotic by paired sample t-test. Inclusion criteria in the study were male or female, age between 3565 years old, healthy individuals without underlying diseases, evaluated with mild stress measured by Thai stress test and also conducting informed consent. Exclusion criteria were volunteers taking probiotic within 3 months, milk allergy, underlying diseases such as liver, kidney, inflammatory bowel and immune disorders, pregnancy, breast feeding, psychiatry disorder and insomnia. Discontinuation criteria included serious complications, not follow the appointment and rules, willing to discontinue and also pregnant during the study.
In the screening visit, researcher clearly explained the objective of the study to the volunteer. Volunteers were recruited by inclusion and exclusion criteria. Volunteers were then grouped into 2 groups by simple randomization with 17 volunteers in each group. First group was probiotic group which take probiotic 1 tablet before the breakfast per day for 8 weeks. Probiotics used in this study is Bifidobacterium longum BB536, 14.4 mg tablet with 2 billion CFU/cap, REAL ELIXIR brand, which has been approved by the Food and Drug Administration, serial number 11-1-00364-5-002. While, second group was placebo group, take placebo 1 tablet before breakfast per day for 8 weeks. During enrollment visit, volunteers did inform consent and note individual data in the OPD card. After that, volunteers picked labels T or C. T represented individuals receiving Bifidobacterium longum. C represented individuals receiving placebo. In follow-up visit, volunteers were measured erythrocyte sedimentation rate by drawing blood into EDTA tube with total volume 6 ml by nurse at week 0 (baseline), week 4 and week 8 respectively. Erythrocyte sedimentation rate measuring inflammation in the body was evaluated at week 0, 4 and 8 in both groups of volunteers.
The study received ethical approval from The Mae Fah Luang University Ethics Committee on Human Research and the reference number was EC 24029-20.
2.2 Statistical analysis
Categorical data was described in frequency and percentage. Continuous data was described in mean (x) and standard deviation (SD) if normal distribution. Comparison erythrocyte sedimentation rate within probiotic and placebo group at week 0, 4 and 8 respectively by repeated measure ANOVA at statistical significant at p<0.05. Comparison erythrocyte sedimentation rate before and after taking by paired sample t-test with statistical significant at p<0.05. In this study, confounding factor including age was controlled by matching with the difference within 5 years. SPSS version 26.0.0.0 was used in this analysis.
3. Results and Discussion
3.1 Result
Table 1 Baseline characteristics.
= 17)
According to the table 1, most of the volunteers were 35-44 years old with 8 volunteers in probiotic group and 8 volunteers in placebo group. Between 45-54 years old, there were 5 volunteers in probiotic group and 4 volunteers in placebo group. Between 55-65 years old, there were 4 volunteers in probiotic group and 5 volunteers in placebo group. With regards to gender, most of the
Jiravichada
volunteers in probiotic group were female and majority of placebo group us male. In probiotic group, there were 4 male volunteers, 10 female volunteers and 3 LGBTQ volunteers. In placebo group, there were 10 male volunteers, 6 female volunteers and 1 LGBTQ volunteer. With regards to body mass index, majority of volunteers were normal range of body mass index. In probiotic group, there were 1 underweight (<18.5 kg/m2) volunteer and 16 volunteers with normal range of body mass index. Whereas, there were 1 volunteer with underweight (<18.5 kg/m2) and 16 volunteers with normal range (18.5-24.9 kg/m2). In terms of marital status, majority of volunteers were married. In probiotic group, there were 6 single volunteers and 11 married volunteers. In placebo group, there were 4 single volunteers, 11 married volunteers and 2 divorced volunteers. Regarding educational status, educational status of volunteers were less than Bachelor’s degree and Bachelor’s degree. In probiotic group, there were 8 volunteers with less than Bachelor’s degree and 9 volunteers with Bachelor’s degree. In placebo group, there were 10 volunteers with less than Bachelor’s degree and 7 volunteers with Bachelor’s degree.
Table 2 Mean and standard deviation of erythrocyte sedimentation rate of both probiotic group and placebo group at week 0 (baseline), week 4 and week 8 respectively with the number of 17 volunteers in each group.
Week Mean ± SD of probiotic group (mm/h) Mean ± SD of placebo group (mm/h)
Week 0 (baseline)
Week 4
23.65 ± 18.53
± 10.78
Week 8 17.76 ± 10.36
± 11.86
± 9.99
± 9.93
P >0.05 >0.05
According to table 2, mean and standard deviation of erythrocyte sedimentation rate of probiotic is 23.65 ± 18.53, 17.76 ± 10.78 and 17.76 ± 10.36 at week 0 (baseline), week 4 and week 8 respectively. ESR decreases from week 0, week 4 to week 8. Whereas, mean and standard deviation of erythrocyte sedimentation rate of placebo is 19.94 ± 11.86, 13.94 ± 9.99 and 15.82 ± 9.93 at week 0 (baseline), week 4 and week 8 respectively. ESR decreases from week 0 to week 8, but increase from week 4 to week 8. To conclude, comparison of ESR within probiotic and placebo group by repeated ANOVA show no statistical significance at p = 0.05.
Table 3 Mean and standard deviation of erythrocyte sedimentation rate before and after taking both probiotic and placebo (n = 17 in probiotic group and 17 volunteers in placebo group)
Before After
According to table 3, mean of ESR at week 0 is 23.64 ± 18.53 and mean of ESR at week 8 is 17.76 ± 10.36. In probiotic group, erythrocyte sedimentation rate decreases from week 0 to week 8. Therefore, difference of ESR at week 0 and week 8 is 5.88 ± 8.17, t = 1.266, p = 0.223. To conclude, comparison of erythrocyte sedimentation rate before and after taking probiotic by paired t-test revealed no statistical significance at p = 0.05. In aspects of placebo, mean of ESR at week 0 is 19.94 ± 11.86 and mean of ESR at week 8 is 15.82 ± 9.93. In placebo group, erythrocyte sedimentation rate decreases from week 0 to week 8. Therefore, difference between mean at week 0 and week 8 is 4.11 ± 1.93, t = 1.473, p = 0.160. To conclude, comparison of erythrocyte sedimentation rate between before and after taking placebo revealed no statistical significance at p = 0.05.
Table 4 Difference of mean and standard deviation of ESR between timeline
Compare between time Difference of ESR (mean difference ± SD) (mm/h) P-value Baseline – week 4
Baseline – week 8
± 2.214
± 2.711
Week4 – week 8 0.941 ± 1.369
According to table 4, the table shows comparison between of time between probiotic group and placebo group at week 0 (baseline), week 4 and week 8 by repeated measured ANOVA. Firstly, difference of erythrocyte sedimentation rate between week 0 (baseline) and week 4 is 5.941 ± 2.214, p-value = 0.034. Whereas, difference of erythrocyte sedimentation rate between week 0 (baseline) and week 8 is 5.000 ± 2.711, p-value = 0.223. Lastly, difference of erythrocyte sedimentation rate between week 4 and week 8 is 0.941 ± 1.369, p-value = 1.000
3.2 Discussion
There was a previous study about the effectiveness of probiotic on inflammatory marker in patients with rheumatoid arthritis. The study was conducted in a randomized controlled trial with 42 volunteers. Volunteers were divided into 2 groups including probiotic and placebo group. Probiotic group consisted of Lactobacillus acidophilus BL-04, Lactobacillus casei LC-11, Lactobacillus lactis L1-23 , Bifidobacterium lactis BL-04 and Bifidobacterium bifidum Bb-06. As the result, there were no significant difference on erythrocyte sedimentation rate (Cannarella et al., 2021). This study correlated with author’s study which investigated about the effectiveness of probiotic on erythrocyte sedimentation rate. Comparing the studies, the difference between these studies were different strains of probiotic and different volunteers. In the previous study, there were greater diversity of strains leading to greater performance by acting in different parts of the gastrointestinal tract due to decreasing in inflammatory markers such as white blood cell and interleukin-6. Another study was conducted as a single-center, prospective, randomized controlled trial with 45 volunteers with inflammatory bowel diseases. 25 volunteers were classified into treatment group with 400 mL/day Kefir (fermented dairy product) containing Lactobacillus kefiri, Lactobacillus casei, Lactobacillus kefiranofaciens, Pediococcus acidilactici and Lactobacillus lactis for 4 weeks day and night. 20 volunteers were classified into control group. As a result, there was a significant decrease in erythrocyte sedimentation rate and C-reactive protein This study did not correlate with the study performed by Yilmaz I. et.al.. To compare, there were different in various aspects including various strains of probiotic which greater diversity leading to greater performance by acting in different parts of gastrointestinal tract (Yilmaz I. et.al., 2018). Stress results in increased inflammation and also affect on the composition of gut microbiota. Regarding probiotic, probiotic secretes anti-inflammatory cytokines (Patterson E. et.al., 2024). Furthermore, Bifidobacterium has the properties of up-regulating suppressive regulatory T cells, maintaining intestinal barrier function, modulating dendritic cell and macrophage activity and resisting intestinal Th2 and Th17 program (Gavzy S. et.al., 2023). In the realm of stress, probiotics also relieve stress by affecting immune function, tryptophan metabolism, neurotransmitters and brain-derived neurotrophic factor (BDNF) (Patterson E. et.al., 2024). Regarding the result, the study revealed no statistical significance within probiotic group and placebo group at week 0, 4 and 8 by repeated ANOVA at p = 0.05 and the results demonstrated no statistical significance in erythrocyte sedimentation rate (ESR) between the probiotic group and the placebo group by paired t-test at p = 0.05. Exploring potential reasons for the lack of significant difference, no control of compliance of the volunteers could be one of the reasons. In the study, there were strengths and weaknesses. With regards to strengths, the study was conducted in randomized, double-blinded, controlled trials. This type of study was considered as high hierarchy of evidence. Double-blinding decrease bias and there was no loss of follow up in the study. Lastly, probiotic was considered as a safe supplement in clinical practice. On the contrary, there were drawbacks in this study including time consuming and expensive. In the future research, there are topics which are interesting including comparison between probiotic and non-steroid anti-inflammatory drugs on inflammatory markers in stressed patients. Moreover, comparison between types of probiotic on inflammatory markers in stressed patients should be further investigated.
4. Conclusion
In this study, comparison of erythrocyte sedimentation rate within probiotic group and placebo group at week 0, 4 and 8 by repeated measured ANOVA, the conclusion revealed no statistical significance at p = 0.05. Comparison of erythrocyte sedimentation rate before and after taking probiotic by paired t-test revealed no statistical significance at p = 0.05. There were no sufficient evidence supporting probiotic was effective in decreasing inflammation measured by erythrocyte sedimentation rate. However, further study is needed to investigate the effectiveness of probiotic on inflammatory marker.
5. Acknowledgements
The authors thank all the volunteers who participated in the study.
5.1 Funding
Probiotic and placebo were supported by Nutrition Profess Public Company Limited. Volunteers compensation in attending the study were received from author personal funding
5.2 Competing interests
The authors declare that they have no known competing financial interests or personal relationships that could have appeared to influence the work reported in this paper.
5.3 Author contributions
Teethawat Jiravichada M.D., researcher and Parama Pratramus M.D., pH.D., co-researcher had responsibility for the following: study conception, design, data collection, analysis and interpretation of results and manuscript preparation
6. References
Bodke, H., & Jogdand, S. (2022). Role of probiotics in human health. Cureus, 14(11), e31313. https://doi.org/10.7759/cureus.31313
Chu, B., Marwaha, K., Sanvictores, T., Awosika, A. O., & Ayers, D. (2022). Physiology, stress reaction. StatPearls Publishing.
Gavzy, S. J., Kensiski, A., Lee, Z. L., Mongodin, E. F., Ma, B., & Bromberg, J. S. (2023). Bifidobacterium mechanisms of immune modulation and tolerance. Gut Microbes, 15(2), 2291164.
Hidalgo-Cantabrana, C., Delgado, S., Ruiz, L., Ruas-Madiedo, P., Sánchez, B., & Margolles, A. (2017). Bifidobacteria and their health-promoting effects. Microbiology Spectrum, 5(3), 10.1128/microbiolspec.BAD-0010-2016. https://doi.org/10.1128/microbiolspec.BAD-00102016
Kumar, V., Robbins, S. L., & Cotran, R. S. (2010). Robbins and Cotran review of pathology. Saunders.
Latif, A., Shehzad, A., Niazi, S., Zahid, A., Ashraf, W., Iqbal, M. W., Korma, S. A. (2023). Probiotics: Mechanism of action, health benefits and their application in food industries. Frontiers in Microbiology, 14, 1216674. https://doi.org/10.3389/fmicb.2023.1216674
Mengheri E. (2008). Health, probiotics, and inflammation. Journal of Clinical Gastroenterology, 42(Suppl 3 Pt 2), S177–S178. https://doi.org/10.1097/MCG.0b013e31817eedc4
Patterson, E., Tan, H. T. T., Groeger, D., Andrews, M., Buckley, M., Murphy, E. F., & Groeger, J. A. (2024). Bifidobacterium longum 1714 improves sleep quality and aspects of well-being in healthy adults: A randomized, double-blind, placebo-controlled clinical trial. Scientific Reports, 14(1), 3725.
Reid, G., Gadir, A. A., & Dhir, R. (2019). Probiotics: Reiterating what they are and what they are not. Frontiers in Microbiology, 10, 424. https://doi.org/10.3389/fmicb.2019.00424
Tishkowski, K., & Gupta, V. (2024). Erythrocyte sedimentation rate. StatPearls Publishing.
Valencia-Florez, K. B., Sánchez-Castillo, H., Vázquez, P., Zarate, P., & Paz, D. B. (2023). Stress, a brief update. International Journal of Psychological Research, 16(2), 105–121. https://doi.org/10.21500/20112084.5815
World Health Organization (WHO). (2022). Mental disorders. https://www.who.int/news-room/factsheets/detail/mental-disorders
Yılmaz, İ., Dolar, M. E., & Özpınar, H. (2018). Effect of administering kefir on the changes in fecal microbiota and symptoms of inflammatory bowel disease: A randomized controlled trial. The Turkish Journal of Gastroenterology, 30(3), 242.
Proceeding of Cosmetic and Beauty International Conference (CBIC) 2025 & International Conference on Integrative Medicine (ICIM) 2025 16th-17th January 2025
Research Progress on the Treatment of Myofascial Pain Syndrome Using Traditional Chinese Tuina and Thai Massage
Hu Yankai1 , Xing Jingfang2 , Sitthichock Vadphimai3*and Li Ying Zhi2
1Second Clinical Medical College, Yunnan University of Chinese Medicine, Yunnan 650500, China
2Second Clinical Medical College, Yunnan University of Chinese Medicine, Yunnan 650500, China
3School of Integrative Medicine, Mae Fah Luang University, Chiang Rai 57100, Thailand
*Corresponding author: E-mail: sitthichock.vad@mfu.ac.th
ABSTRACT
This review synthesizes research on Traditional Thai Massage (TTM) and Chinese Tuina for myofascial pain syndrome (MPS), a common condition with an incidence of 21-30%, characterized by muscle or fascial trigger points and manifesting as localized pain and tension. Both TTM and Tuina are non-pharmacological, non-invasive treatments with proven efficacy inclinicalsettings.TTMtargetsenergypathways andacupoints,whileTuinafocusesontendon relaxation and collateral dredging to alleviate pain and spasms, enhance local circulation, and prevent adhesions.
Evidence suggests that TTM is effective in releasing trigger points, reducing pain, and modulating neuroelectrophysiological responses, which may involve changes in local circulation and body temperature. Similarly, Tuina techniques, including trigger point stimulation and joint movement, have been shown to significantly improve MPS symptoms by activating intrinsic repair mechanisms and clearing sensitizing substances.
The combined use of TTM and Tuina may offer enhanced therapeutic benefits for MPS. As global exchanges in traditional medicine intensify, cross-learning between Chinese Tuina and Thai Massage holds promise for integrating treatment approaches and advancing mechanistic understanding, potentially improving clinical outcomes for MPS patients.
Keywords: Thai Massage; Tuina; Myofascial pain syndrome
Introduction
Myofascialfasciitis,alsoknownasmyofascialpainsyndrome(MPS),isamyogenicpaincondition occurring in specific areas, characterized by the presence of myofascial trigger points (MTrPs) in muscles orfascia(Urits etal., 2020).Clinically,it primarilymanifestsasdiffuse, dull paininthelumbar and dorsal regions, along with localized myofascial tension and tenderness. Its incidence rate is approximately 21%–30% (Borg-Stein & Iaccarino, 2014).
Unhealthy postural habits, genetic factors, joint-related work injuries, nutritional and metabolic disorders, and other factors may contribute to an abnormal increase in local myofascial tension. Over time, this can lead to aseptic inflammation, exudation, and fibrosis in the lumbar and dorsal myofascial regions and muscles, resulting in dysfunction (Huang Jinwen et al., 2016)
The treatment of MPS focuses on managing MTrPs and aims to correct the structural and mechanical imbalances that contribute to their formation. Treatment should also address sympathetic nerve dysfunction, identify emotional stressors, and manage advanced complications (Borg-Stein & Iaccarino, 2014).
Massage therapy, as a non-invasive and safe non-pharmacological approach, is widely used in clinical practice. Among these therapies, Traditional Thai Massage (TTM) is a globally recognized treatment originating from Thailand. It focuses on the ten main energy pathways (Sen Sib) (Laohapand & Jaturatamrong, 2014) that run through the body, targeting reactive acupoints as key treatment areas.
TTM involves manual pressing techniques combined with joint movements and muscle stretching to treat musculoskeletal and various internal medical conditions (Guan Jinshun, 2016).
Similarly, Tuina, a traditional Chinese medicine practice, is known for its ability to relax tendons, dredge collaterals, and relieve spasms and pain. Tuina directly targets the affected areas, applying pressure to local tissues and blood vessels to create a “muscle pump” effect. This improves local circulation, alleviates muscle spasms, and prevents myofascial adhesions (Tang Xuezhang et al.,2009).
This article aims to summarize and compare the similarities and differences between Traditional Thai Massage and Tuina in traditional Chinese medicine in terms of their conceptual understanding, treatment methods, and mechanisms of action in treating MPS. This review included a total of 16 articlesonThai massageforthetreatment ofMPS,consistingof11randomizedcontrolledtrials(RCTs) conducted between 2005 and 2024. Additionally, there were two descriptive and experimental studies, and three articles focused on ancient texts and theoretical research. Regarding the literature on Tuina, 7 RCTs were conducted between 2012 and 2021. Moreover, there were 5 animal studies investigating the electrophysiological and biomolecular mechanisms of Tuina in the treatment of MPS. The aim is to integrate the advantages of both approaches into clinical practice to achieve improved therapeutic outcomes.
1. Understanding of Myofascial Pain Syndrome in Chinese and Thai Medicine
1.1 Thai Medicine’s Understanding of Myofascial Pain Syndrome
TTM attributes the causes of MPS to overwork, insufficient rest, incorrect posture, trauma, and an imbalance of the body’s elements. Symptoms of cervical myofascial fasciitis also influence the body’s elemental balance. These changes can be summarized as follows: when muscles are overused, muscle spasms occur, indicating that the earth element in the body begins to harden. This hardening disrupts the movement of the water and wind elements, leading to decreased local blood supply. Consequently, symptoms such as muscle tightness, vascular narrowing, local swelling and pain, and a feeling of tightness and hardness upon palpation develop. Additionally, the fire element in the affected area may cause the skin to feel warm or inflamed, reflecting localized muscle inflammation (HONGLADAROMP), 2021).
1.2 Chinese Medicine’s Understanding of Myofascial Pain Syndrome
In traditional Chinese medicine (TCM), myofascial fasciitis is classified under the categories of “Bi Syndrome,” “Jingjin Bi,” and “Neck, Lumbar, and Dorsal Musculotendinous Injuries.” External injuries, overwork, or invasion by the six pathogenic factors can cause blood circulation to become sluggish. Combined with internal deficiencies, such as insufficient kidney qi, pathogenic factors invade the surface meridians and become trapped. This stagnation results in sluggish qi and blood, the inability of blood to nourish the tendons, and muscle contracture, which induce the disease (Li Qinglin et al., 2015). Treatment should focus on expelling wind, promoting blood circulation, warming yang, regulating qi, dispelling cold, and dredging the collaterals (Xu Hui et al., 2016)
2. Thai Massage in the Treatment of MPS
2.1 Treatment Methods of Thai Massage
The ten lines in Thai massage correspond to specific muscle groups on the body, and massaging these lines can directly affect the relevant MTrPs. By massaging the trigger points along these lines, the pain caused by MTrPs can be reduced or eliminated (Eungpinichpong, 2004). Stimulating these trigger points helps relax tense muscles, reduce muscle nodules and tension, and relieve muscle pain. It also increases the supply of oxygen and nutrients to help muscles recover and repair. For example, MaSPMA - 2, located above the brachial artery, is believed to open the “wind gate” or Perd - Pra - Tu - Lom in Thai, which increases blood flow to the area (Laohapand & Jaturatamrong, 2014). There are three commonly used treatment methods:
Sen Sib Method: This method focuses on manual treatment of perceived blockages along the ten basic vital energy lines, originating from a central point just below the abdominal surface (about two finger-widths wide from the umbilical area). Each basic acupoint on the energy path is stimulated for about 10-15 seconds and repeated three times. The total treatment time is approximately 15-30 minutes.
Ratchsamnak Method: Also known as the “Royal Style,” this method involves deep muscle massage using fingers, thumbs, outstretched arms, and elbows to slowly apply increasing pressure to the taut, palpable nodules (“trigger points”) along the meridian lines. The treatment targets the back, inside and outside of the legs, arms, shoulders, abdomen, and the frontal and occipital parts of the head, including stretchingmovementsofthe upper limbs. Thetreatment time varies depending onthespecific symptoms, lasting about 30-60 minutes.
Chaloeysak Method: Known as the “Folk Style,” this method includes a series of progressive movementstorelaxandstretchmusclesandjoints,suchasdeepmuscle-positionpressing,usingfingers, thumbs, palms, elbows, knees, and feet to stimulate over 200 points along the main theoretical energy lines.Thetreatmentisthoroughandrobust,releasingenergyfrom thebodyat adeeplevel.Thetherapist often changes posture during the treatment. The total massage time is about 30-60 minutes(Yoopat, Maes, Poriau, & Vanwonterghem, 2015).
2.2 Therapeutic Effects of Thai Massage on MPS
Thai Traditional Medicine can release trigger points and relieve pain, with a unique therapeutic effect on MPS. Buttagat et al. (2012) used the energy-pathway-reactive-point-pressing method of TTM combined with three specific stretching techniques to treat scapulocostal syndrome. This treatment reduced pain, muscle tension, and anxiety, and also increased the pressure pain threshold (PPT). Another study by Buttagat et al. (2024) on wrist extensors showed that TTM could increase the range of joint motion, in addition to the previously mentioned effects. However, in this study, muscle strength didnotchange.ResearchhasyieldeddifferentconclusionsregardingwhetherTTMcanchangepatients’ muscle strength (Hongsuwan, Eungpinichpong, Chatchawan, & Yamauchi, 2015; Miyahara et al., 2018). Nonetheless, TTM’s effects in reducing pain, increasing pain threshold, improving the range of joint motion inthe affectedarea,and reducing muscle tension have been widely verified(Keeratitanont, Jensen, Chatchawan, & Auvichayapat, 2015).
When treating MPS in the spinal area, TTM can relieve muscle tension and increase the range of spinal motion. Buttagat et al. (2016)used the pressing method in TTM to target three horizontal lines in the upper trapezius muscle area and three points on the superior nuchal line, combined with stretching, to treat upper back pain related to MTrPs. The electromyographic activity, muscle tension, and pain intensity of patients were significantly reduced. Boonruab et al. (2021) used the pressing method on four acupoints on the trapezius muscle to treat MPS and found that, in addition to relieving pain in the muscle, the range of cervical vertebra motion increased significantly. Chatchawan et al. (2005) used the acupoint pressing method along two energy lines beside the spinous processes of the back to treat MPS and achieved similar results.
2.3
Research Progress on the Mechanism of TTM in the Treatment of MPS
2.3.1 Influence on Neuroelectrophysiology
Buttagat et al.(2016)used the BIOPAC system to measure the electromyogram (EMG) activity of the trapezius muscle before and after TTM treatment, finding a significant decrease in EMG activity compared to sham microwave diathermy. In another study on scapulocostal syndrome, Buttagat (2012) observed changes in electroencephalogram (EEG) activity before and after massage. After the massage, δ-activity increased while θ, α, and β-activities decreased, which is believed to enhance relaxation and reduce arousal.
Patients with MPShavedecreased parasympathetic nerve activity andincreasedsympathetic nerve activity (Perry, Heller, Kamiya, & Levine, 1989). Buttagat et al. (2011) performed TTM on the back muscles of patients with back pain related to MTrPs and found a significant increase in heart rate variability (HRV) after treatment. HRV is jointly regulated by the sympathetic and parasympathetic systems. An increase in HRV reflects an increase in cardiac parasympathetic nerve activity and a decrease in sympathetic nerve activity, which helps relieve anxiety and stress, inducing a relaxation response. This effect may result from the deep pressing of TTM, which stimulates baroreceptors, activates the vagus nerve, or increases local blood flow, thus activating the parasympathetic nerve.
TTM can also interfere with the transmission of nociceptive signals at the spinal cord level by affecting the release of neurotransmitters, limiting their upward conduction. Mackawan et al. (2007) measured the level of substance P in the saliva of patients with non-specific low back pain treated with
TTM and found that, after treatment, pain was significantly relieved, and the level of substance P decreased. Substance P, a neuropeptide involved in nociceptive signal transmission, can prolong nerve cell depolarization and increase the response to C-fibers. Since its content is higher in saliva than plasma, it is widely used in pain-related research (Levine et al., 1984; Parris, Kambam, Naukam, & RamaSastry,1990).Srikaw etal.(2022)observedadecreaseinsubstancePlevelsalongsideareduction in pain after TTM treatment of MPS in the upper trapezius muscle. The gate-control theorymay explain TTM’s influence on neuroelectrophysiology, where mechanical receptor activation of afferent fibers below the threshold stimulates glial cells, inhibiting synapses on nociceptor afferent endings and preventing nociceptive signals from being transmitted to higher centers.
2.3.2 Influence on Local Circulation and Body Temperature
Deep-pressuremassagetechniquescanincreasemusclebloodvolumeandskinbloodflow,helping deactivate MTrPs (Plakornkul et al., 2016). Chenpanich et al. (1981) found that by performing TTM on patients’ legs, the temperature of both legs increased when only one leg was treated. Additionally, pulse rate, systolic blood pressure, and diastolic blood pressure decreased significantly during and after themassage.Vasana etal.(2016)measuredbloodflow,peaksystolicvelocity,andarterydiameterusing ultrasoundandfoundsignificantchanges(P<0.05)aftermassage.Inthisstudy,theyalsomeasuredlocal skintemperature at major treatment points(MaSP), which showed asignificant increase after treatment, indicating enhanced local blood flow. Viravud et al. (2017) measured changes in dorsal pedal artery blood flow in patients after massaging MaSPs in the lower limbs. They observed short-term changes in blood flow parameters, including volume flow and mean velocity, and peak systolic velocity at the MaSPs of the lower limbs.
3. Tuina in Traditional Chinese Medicine for the Treatment of MPS
3.1 Methods and Effects of Tuina in Traditional Chinese Medicine for the Treatment of MPS
Tuina in Traditional Chinese Medicine is divided into traction, oscillation, and kneading-rubbing manipulation techniques. Through the doctor’s hands acting on the patient’s skin, gentle and forceful manipulation techniques are used to penetrate from the skin surface to the underlying tissues, aiming to treat diseases. It has the functions of balancing yin and yang and dredging qi and blood. Clinically, it has shown remarkable curative effects in the treatment of “tendon-bi syndrome.”
Trigger Point Stimulation Category: These manipulation techniques stimulate trigger points through methods such as pressure or traction of varying intensities to deactivate them for the treatment of MPS. Mo Qiao et al. (2019) used MTrPs dynamic extension tuina to treat MPS in the lumbar and dorsal regions, significantly improving the patients’ pain and spinal function, with both short-term and long-term curative effects being remarkable. Huang Weichang et al. (2013) used MTrPs pluckingpushing tuina to treat MPS of the trapezius muscle. In the treatment group, the tenderness, the presence of cord-like masses in the lumbar and dorsal regions, and the scores of lumbar-dorsal functional activities were all improved. Tang Yong (2019) used the thumb-metacarpophalangeal joint tuina method at trigger points to treat MPS in the nape and dorsal regions. Patients’ pain and function were significantly improved, and the curative effect had a strong lasting impact. Trigger points are very similar to Ashi points in Traditional Chinese Medicine, as both are areas where tenderness and softtissue lesions can be palpated locally. Ashi points not only reflect myofascial lesions but also manifest external signs of many zang-fu diseases. Therefore, some scholars(Wang Lie et al., 2021) believe that trigger points should be included in the category of Ashi points.
Meridian-Pushing and Pressing Type: This manipulation mainly uses techniques such as pushing, pressing, or rubbing on the diseased meridians. Guided by the tendon-regulating theory, it has therapeutic effects on the muscle-tendon regions along the meridian routes by treating the diseased meridians. Yang Lixin (2019) applied pivot-meridian massage (pushing and pressing along the Bladder Meridian, Gallbladder Meridian, and Kidney Meridian routes and their acupoints) to treat lumbodorsal MPS. Compared to before treatment, the pain conditions and soft-tissue tension of the patients in the treatment group showed significant improvement. Zheng Peng et al. (2012) used ointment-rubbing, kneading, and plucking of diseased tissues such as subcutaneous cord-like nodules to treat MPS in the shoulder and back, and the patients’ pain was significantly relieved after treatment.
Joint-Moving Type: By adjusting the positions of joints such as the sacroiliac joint and spinal facet joints, the human body’s biomechanical lines are restored to normal, dysfunction isrelieved, and fascial tension is balanced. For example, Jing Ming et al. (2024) used techniques of relaxing muscles and regulating tendons, bone-setting, and balance-adjusting, combined with fist-bouncing-pressing method, stretching method, and lumbar oblique-pulling method to treat MPS of the lumbar and gluteal muscles. Over years of application, this manipulation has been found to relax muscles, relieve spasms, enhance strength, and regulate tension. Chen Yizhao et al. (2021) used Peng’s tendon-separating massage therapy, which includes palm-kneading of the shoulder and back and lumbosacral regions, fist-pushing along the Bladder Meridian of Foot-Taiyang, one-finger-meditation-plucking of the sacrospinal muscles on both sides of the spine, Weizhong (BL40), Chengshan (BL57), relaxing with the hypothenar-rolling method, and lumbar oblique-pulling method for tendon-regulation. This therapy has shown a good curative effect on pain and dysfunction.
3.2 Mechanism Research
3.2.1
Neuroelectrophysiological Effects
Huihui Li et al. (2021) analyzed the alpha rhythm of the electroencephalogram (EEG) using sampleentropy(SampEn)andpermutationentropy(PermuEn)intheexperiment.Itwasfoundthat after massage, the SampEn and PermuEn values in all five states (rest, motor imagery (MI) of left and right lateral flexion, motor execution (ME) of left and right lateral flexion) decreased in almost all fourteen channels, indicating that massage affected not only the resting state but also motor imagery and motor execution.
3.2.2
Signal Pathway Changes
Lei Siyuan (2023) found in experimental research that the S100A8/A9/TLR4 signal pathway can affect the inflammatory state after skeletal muscle injury, activate multiple inflammatory pathways, cause an energy crisis at the injury site, and promote the formation of MTrPs. This leads to MPS, fascia densification, and central sensitization. After tuina treatment, the levels of these proteins decreased significantly, indicating that Tuina can inhibit the activation of the S100A8/A9/TLR4 signal pathway, improvethe inflammatory state, and subsequentlyinhibittheaforementioned processes.Kuang Xiaoxia (2022) found that after pressing manipulation treatment, the contents of ATP, ATP synthase, muscle glycogen, and the number of mitochondria increased. The morphological structure of mitochondria returned to normal, and the levels of sensitizing substances such as substance P (SP), calcitonin generelated peptide (CGRP), prostaglandin E2 (PGE2), and bradykinin (BK) decreased. This suggests that the therapeutic effect of pressing manipulation on trigger points may be achieved through mechanical stimulation, activating the endogenous repair mechanism in skeletal muscle, promoting local energy metabolism, and clearing sensitizing substances. Jiang Quanrui (2022) determined that local pressing manipulationstimulationonMTrPsmaydecreaseintracellular [Ca2+]i bydown-regulatingthecontents of cAMP, PKA, P-RyR1, and up-regulating the contents of PDE4D, FKBP12, and Ca2+-ATPase, thus relaxing the contracted nodules of MTrPs and relieving pain. Yuan Yuan et al. (2021) found that pressing manipulation stimulation on trigger points can reduce the content of 5-HT and increase the contents of TRPV1, eNOS, and NO in trigger point tissues. However, when TRPV1 is inhibited, the aforementioned effects are also inhibited. Pressing manipulation stimulation on trigger points may achieve its effect by activating TRPV1, improving local blood circulation.
4. Conclusion
This paper reviews the research progress on Thai massage and Tuina in the treatment of MPS and analyzes the mechanisms of action of both therapies. In clinical practice, both approaches effectively deactivate MTrPs to treat MPS, providing significant pain relief for patients. Thai massage specifically focuses on reducing patients’ anxiety and muscle tension, promoting complete relaxation of both the body and mind. On the other hand, Tuina emphasizes restoring joint function and altering local fascial tension. Additionally, Tuina addresses spinal biomechanics adjustments.
In terms of research on treatment mechanisms, studies on Thai massage have observed
changes in patients’ EMG and EEG, as well as biomolecular-level investigations. In contrast, Tuina lacks extensive observation of clinical objective indicators in patients. However, related animal studies on Tuina are more in-depth compared to Thai massage, covering a wider range of research on signaling pathways and energy metabolism at the microscopic level.
With economic globalization, exchanges between traditional medicine systems from different countries have become increasingly common. As two of the most renowned nonpharmacological alternative therapies for musculoskeletal disorders in Asia, mutual learning and integration between Tuina and Thai massage are highly necessary. This exchange involves not only the integration of manual techniques but also the sharing of diagnostic and therapeutic approaches, as well as the development of innovative ideas in mechanistic research. For instance, Tuina could adopt the mind-body synchronization concept from Thai massage to make its techniques gentler and more soothing, while Thai massage could incorporate Tuina’s meridian theory and spinal facet joint adjustments.
In terms of mechanistic studies, Tuina could enhance the observation of clinical objective indicators, while Thai massage could further explore the molecular pathways underlying its therapeutic effects.
This study primarily relied on Chinese and English literature, with limited exploration of Thai-language sources, which presents certain limitations. Furthermore, current research on Thai massage largely focuses on a narrow selection of techniques. Future studies should include more RCTs to expand the variety of techniques analyzed.
5. References
Boonruab, J., Poonsuk, P., Damjuti, W., & Supamethangkura, W. (2021). Myofascial Pain Syndrome
Focused on the Upper Trapezius Muscle: A Comparative Randomized Controlled Trial of the Court-Type Traditional Thai Massage versus the Thai Hermit. J Evid Based Integr Med, 26, 2515690x211030852. doi:10.1177/2515690x211030852
Borg-Stein, J., & Iaccarino, M. A. (2014). Myofascial pain syndrome treatments. Phys Med Rehabil Clin N Am, 25(2), 357-374. doi:10.1016/j.pmr.2014.01.012.
Buttagat, V., Eungpinichpong, W., Chatchawan, U., & Arayawichanon, P. (2012). Therapeutic effects of traditional Thai massage on pain, muscle tension and anxiety in patients with scapulocostal syndrome: a randomized single-blinded pilot study. Journal of Bodywork and Movement Therapies, 16(1), 57-63. doi:10.1016/j.jbmt.2011.04.005
Buttagat, V., Eungpinichpong,W., Chatchawan, U., & Kharmwan, S. (2011). The immediateeffectsof traditional Thai massage on heart rate variability and stress-related parameters in patients with back pain associated with myofascial trigger points. Journal of Bodywork and Movement Therapies, 15(1), 15-23. doi:10.1016/j.jbmt.2009.06.005
Buttagat, V., Eungpinichpong, W., Kaber, D., Chatchawan, U., & Arayawichanon, P. (2012). Acute effects of traditional Thai massage on electroencephalogram in patients with scapulocostal syndrome. Complement Ther Med, 20(4), 167-174. doi:10.1016/j.ctim.2012.02.002
Buttagat, V., Kluayhomthong, S., & Areeudomwong, P. (2024). The beneficial effects of traditional Thai massage on young patients with latent myofascial trigger points in the wrist extensor muscles: A randomized controlled trial. Journal of Bodywork and Movement Therapies, 40, 1201-1207. doi:10.1016/j.jbmt.2023.04.024
Buttagat, V., Narktro, T., Onsrira, K., & Pobsamai, C. (2016). Short-term effects of traditional Thai
massage on electromyogram, muscle tension and pain among patients with upper back pain associated with myofascial trigger points. Complement Ther Med, 28, 8-12. doi:10.1016/j.ctim.2016.07.004
Chatchawan, U., Thinkhamrop, B., Kharmwan, S., Knowles, J., & Eungpinichpong, W. (2005).
Effectiveness of traditional Thai massage versus Swedish massage among patients with back pain associatedwith myofascialtrigger points. Journal of Bodywork and Movement Therapies, 9(4), 298-309. doi:https://doi.org/10.1016/j.jbmt.2005.02.001
Chenpanich,K., & Tuchinda,P. J. S. H. G. (1981).Effect of Thai traditionalmassageon the circulatory system. 33(9), 575-581.
Eungpinichpong, W. (2004). The ten lines of traditional Thai massage and myofascial trigger points. Journal of Medical Technology and Physical Therapy, 16, 8-13.
Hongladaromp, N. L. (2021). Comparative study of Chinese and Thai Tui Na massage therapy in the treatment of cervical myofascitis [Master’s thesis, Liaoning University of Traditional Chinese Medicine]. Available from CNKI
Hongsuwan,C.,Eungpinichpong,W.,Chatchawan,U.,&Yamauchi,J.(2015).EffectsofThaimassage on physical fitness in soccer players. J Phys Ther Sci, 27(2), 505-508. doi:10.1589/jpts.27.505
Keeratitanont, K., Jensen, M. P., Chatchawan, U., & Auvichayapat, P. (2015). The efficacy of traditional Thai massage for the treatment of chronic pain: A systematic review. Complement Ther Clin Pract, 21(1), 26-32. doi:10.1016/j.ctcp.2015.01.006
Laohapand, T., & Jaturatamrong, U. (2014). Thai traditional massage (The court-type Thai traditional massage): The signal point massage. In: Bangkok: Supavanich Press.Levine, J. D., Clark, R., Devor, M., Helms, C., Moskowitz, M. A., & Basbaum, A. I. (1984). Intraneuronal substance P contributes to the severity of experimental arthritis. Science, 226(4674), 547-549. doi:10.1126/science.6208609
Li, H., Fan, K., Ma, J., Wang, B., Qiao, X., Yan, Y., . . . Wang, L. (2021). Massage Therapy's Effectiveness on the Decoding EEG Rhythms of Left/Right Motor Imagery and Motion Execution in Patients With Skeletal Muscle Pain. IEEE J Transl Eng Health Med, 9, 2100320. doi:10.1109/jtehm.2021.3056911
Mackawan, S., Eungpinichpong, W., Pantumethakul, R., Chatchawan, U., Hunsawong, T., & Arayawichanon, P. (2007). Effects of traditional Thai massage versus joint mobilization on substance P and pain perception in patients with non-specific low back pain. Journal of Bodywork and Movement Therapies, 11(1), 9-16. doi:10.1016/j.jbmt.2005.11.001
Miyahara,Y., Jitkritsadakul,O., Sringean,J., Aungkab, N., Khongprasert,S., & Bhidayasiri,R. (2018). Can therapeutic Thai massage improve upper limb muscle strength in Parkinson's disease? An objective randomized-controlled trial. J Tradit Complement Med, 8(2), 261-266. doi:10.1016/j.jtcme.2018.01.004
Parris, W. C., Kambam, J. R., Naukam, R. J., & Rama Sastry, B. V. (1990). Immunoreactivesubstance P is decreasedin salivaof patientswith chronicback pain syndromes.Anesth Analg, 70(1), 6367. doi:10.1213/00000539-199001000-00010
Perry, F., Heller, P. H., Kamiya, J., & Levine, J. D. (1989). Altered autonomicfunction in patientswith arthritisorwithchronicmyofascialpain.Pain,39(1),77-84.doi:10.1016/0304-3959(89)901772 Plakornkul, V., Vannabhum, M., Viravud, Y., Roongruangchai, J., Mutirangura, P., Akarasereenont, P., & Laohapand, T. (2016). The effects of the court-type Thai traditional
massage on anatomical relations, blood flow, and skin temperature of the neck, shoulder, and arm. BMC Complementary and Alternative Medicine, 16(1), 363. doi:10.1186/s12906-0161282-y
Srikaew, N., Kietinun, S., Sriyakul, K., Tungsukruthai, P., & Pawa, K. K. (2022). Effectiveness of court-type traditional Thai massage plus meditation in patients with myofascial pain syndrome on upper trapezius. Advances in Integrative Medicine, 9(1), 63-68. doi:https://doi.org/10.1016/j.aimed.2021.07.006
Urits, I., Charipova, K., Gress, K., Schaaf, A. L., Gupta, S., Kiernan, H. C., . . . Viswanath, O. (2020). Treatment and management of myofascial pain syndrome. Best Pract Res Clin Anaesthesiol, 34(3), 427-448. doi:10.1016/j.bpa.2020.08.003
Viravud, Y., Apichartvorakit, A., Mutirangura, P., Plakornkul, V., Roongruangchai, J., Vannabhum, M., . . . Akarasereenont,P. (2017).The anatomical studyofthe majorsignalpointsof thecourttype Thai traditional massage on legs and their effects on blood flow and skin temperature. Journal of Integrative Medicine, 15(2), 142-150. doi:https://doi.org/10.1016/S20954964(17)60323-6
Yoopat, P., Maes, C., Poriau, S., & Vanwonterghem, K. (2015). Thai traditional massage: Efficiencyassessment of three traditional massage methods on office workers: An explorative study. Journal of Bodywork and Movement Therapies, 19(2), 246-252. doi:https://doi.org/10.1016/j.jbmt.2014.04.006
Chen, Y., Huang, C., & Peng, X. (2021). Clinical observation of Peng's fascia-relaxing Tui Na therapy in the treatment of lumbar and back myofascitis. Journal of Guangzhou University of Chinese Medicine, 38(2), 340-345. doi:https://doi.org/10.13359/j.cnki.gzxbtcm.2021.02.022
Huang, J., & Pang, Z. (2016). Research progress on traditional Chinese medicine treatment for lumbar and back myofascitis. Journal of Clinical Rational Drug Use, 9(31), 177-179. https://doi.org/10.15887/j.cnki.13-1389/r.2016.31.114
Huang, W., Li, S., Fan, Z., Wu, S., Huang, Z., & Cheng, L. (2013). Clinical study of 30 cases of myofascial pain syndrome in the lumbar and back treated with trigger point manipulation. Jiangsu Journal of Traditional Chinese Medicine, 45(8), 47-49.
Jiang, Q. (2022). Mechanism of pain point deactivation effect based on RyR regulation of intracellular calcium [Doctoral dissertation, Guangzhou University of Chinese Medicine]. CNKI https://link.cnki.net/doi/10.27138/d.cnki.ghuzc.2022.000020
Kuang, X. (2022). Mechanism of pain point deactivation effect based on AMPK regulation of skeletal muscle energy metabolism [Doctoral dissertation, Guangzhou University of Chinese Medicine]. CNKI https://link.cnki.net/doi/10.27138/d.cnki.ghuzc.2022.000003
Lei, S. (2023). Analysis of the effect of knot-relieving Tui Na for myofascial pain syndrome based on the S100A8/A9-TLR4 signaling pathway [Doctoral dissertation, Guangxi University of Chinese Medicine]. CNKI. https://link.cnki.net/doi/10.26980/d.cnki.gcczc.2023.000068
Li, Q., Song, M., & Sun, D. (2015). Research progress on clinical studies of myofascitis in traditional Chinese medicine. Chinese Medicine Research, 28(3), 75-77.
Mo, Q., Luo, L., Liu, T., Peng, Q., & Zhang, L. (2019). Clinical study of 30 cases of trapezius myofascial pain syndrome treated with dynamic stretching Tui Na at trigger points. Jiangsu Journal of Traditional Chinese Medicine, 51(7), 39-41.
Su, F., Shi, Y., Liu, Y., & Jing, M. (2024). Experiencesummaryof Chief Physician Jing Ming's Tui Na
therapyforglutealmyofascialpainsyndrome. ChineseJournalofHealthandWellness,42(17), 182-185.
Tang, X., & Ding, H. (2009). Efficacy evaluation of pain point Tui Na versus traditional Tui Na in the treatment of back myofascitis. Chinese Journal of Traditional Chinese Medicine, 24(7), 908909.
Tang, Y. (2019). Clinical study on thumb-palm joint special Tui Na for cervical and back myofascitis at trigger points [Master’s thesis, Guangzhou University of Chinese Medicine]. CNKI. https://link.cnki.net/doi/10.26988/d.cnki.gcdzu.2019.000504
Wang, L., Ma, S., Ma, T., Dong, B., Xu, W., & Li, G. (2021). Analysis of trigger points, Ahshi points, tender points, acupuncture points, myofascial points, and fascial lesion points. Journal of Integrated Traditional Chinese and Western Medicine, 13(6), 415-417.
Xu, H., Si, N., Li, L., Gao, Q., & Li, P. (2016). Efficacy and prognosis of traditional Chinese medicine for dispelling wind and cold combined with promoting blood circulation and unblocking meridians in the treatment of lumbar and back myofascitis. Chinese Journal of Traditional Chinese Medicine, 34(8), 1933-1935. https://doi.org/10.13193/j.issn.1673-7717.2016.08.041
Yang, L., & Wang, X. (2019). Effects of Shu Jing Tui Na on soft tissue tension in patients with lumbar and back myofascial pain syndrome. Shanxi Journal of Traditional Chinese Medicine, 35(12), 28-29, 31.
Yuan,Y.,Jiang,Q.,Wu,Q.,Zhu,X.,Kuang,X.,Jiang,Y.,&Li,J.(2021).EffectsofTuiNastimulation of trigger points on TRPV1 in a rat model of myofascial pain. Journal of Hunan University of Chinese Medicine, 41(8), 1217-1222.
Zheng, P., & Gao, C. (2012). Observation of the efficacy of plaster therapy for shoulder and back myofascitis. Guide of China Medicine, 10(35), 304-305. https://doi.org/10.15912/j.cnki.gocm.2012.35.036