Infrastructure Partnerships Australia is an industry think tank and an executive member network, providing research focused on excellence in social and economic infrastructure. We exist to shape public debate and drive reform for the national interest.
For more information contact:
Adrian Dwyer Chief Executive Officer E adrian.dwyer@infrastructure.org.au
Isaac Husarek Policy Analyst - Infrastructure Projects E isaac.husarek@infrastructure.org.au
Matthew Corless Policy Adviser E matthew.corless@infrastructure.org.au
Shannon Chan Graduate Policy Analyst E shannon.chan@infrastructure.org.au
For all media enquiries please contact:
Boronia Morison Head of External Affairs E boronia.morison@infrastructure.org.au
MESSAGE FROM THE CEO
The 2024-25 Budget Season saw Australia’s state and territory governments outline their plans for the next four years amidst growing fiscal constraints and sustained cost-of-living pressures felt across the country. Accordingly, this Budget Season saw few infrastructure surprises, with the majority of spending directed towards the existing pipeline of projects.
Infrastructure spending grew moderately, with $270.4 billion in general government expenditure allocated to infrastructure across all states and territories over the four years to FY2027-28. This represents a $13.8 billion increase from the FY2023-24 Budget Season. This Budget Season’s infrastructure funding as a proportion of total government expenditure remained consistent year-over-year at 15.4 per cent.
Victoria takes out the top spot in Budget Monitor rankings for the fourth year running, allocating 18.7 per cent of its total general government expenditure to infrastructure. Despite a year-onyear decrease in expenditure – including a $1.1 billion decrease from the 2023-24 Budget, which itself was a $6.7 billion decrease on its 2022-23 allocation – Victoria remains ahead of the pack. New South Wales took out second place once again, with a $86.4 billion allocation over four years, representing 16 per cent of its total general government expenditure.
The maintenance of existing large-scale pipelines has been a core budget theme for several years, with nips, tucks and top-ups in the existing pipeline accounting for the bulk of overall expenditure this Budget Season. With last year’s Independent Strategic Review of the Federal Infrastructure Investment Program in the rear view mirror, most expected few surprises in infrastructure spending. South Australia, Queensland and Western Australia received the majority of a $6.8 billion funding reallocation in response to the Review’s recommendations last December, laying the groundwork for the new Federal Funding Agreement Schedule on Land Transport Infrastructure Projects for 2024-29, which nearly all states and territories have signed on to at publication.
In this Budget Season, jurisdictions focused their attention towards major allocations that ease mounting housing-supply pressures, aligned with the commencement of the Federal Housing Australia Future Fund and the National Housing Accord. The health infrastructure pipeline maintains its strength following a slew of commitments headlined by $1.7 billion in new funding in Victoria, and a $1 billion “equity funding” commitment to the Queensland Capacity Expansion Program.
Existing major road and rail projects, many of which are in construction and at the peak of their expenditure requirements – with a few notable exceptions – were the other key feature of this Budget Season. The declining volume of new project announcements over the past few budget cycles all but locks in a decline in funding certainty for road and rail in the coming years, despite existing project top ups giving buoyancy to the topline numbers in the short-term.
With announcements of new road and rail projects dwindling, the market appears poised to shift attention to the steadily approaching renewables transition. However, without dedicated attention to regulatory processes and an easing of supply chain pressures to facilitate the required pace of this shift, the Australian infrastructure sector risks losing hard earnt skills to international competition.
We hope you find the 2024-25 Australian Infrastructure Budget Monitor useful. If you are interested in learning more about the infrastructure pipeline in Australia, you can find more information on our Australia and New Zealand Infrastructure Pipeline (ANZIP). Further detailed analysis of each jurisdiction’s Budget is available exclusively for Infrastructure Partnerships Australia members.
Adrian Dwyer Chief Executive Officer
Source: Infrastructure Partnerships Australia analysis of 2024-25 and 2023-24 Budgets
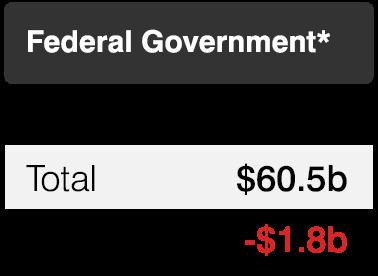
*The Federal Government primarily funds state and territory infrastructure projects. As such it is not formally included in the rankings. We include it in the report to provide a comprehensive overview of all funding commitments.
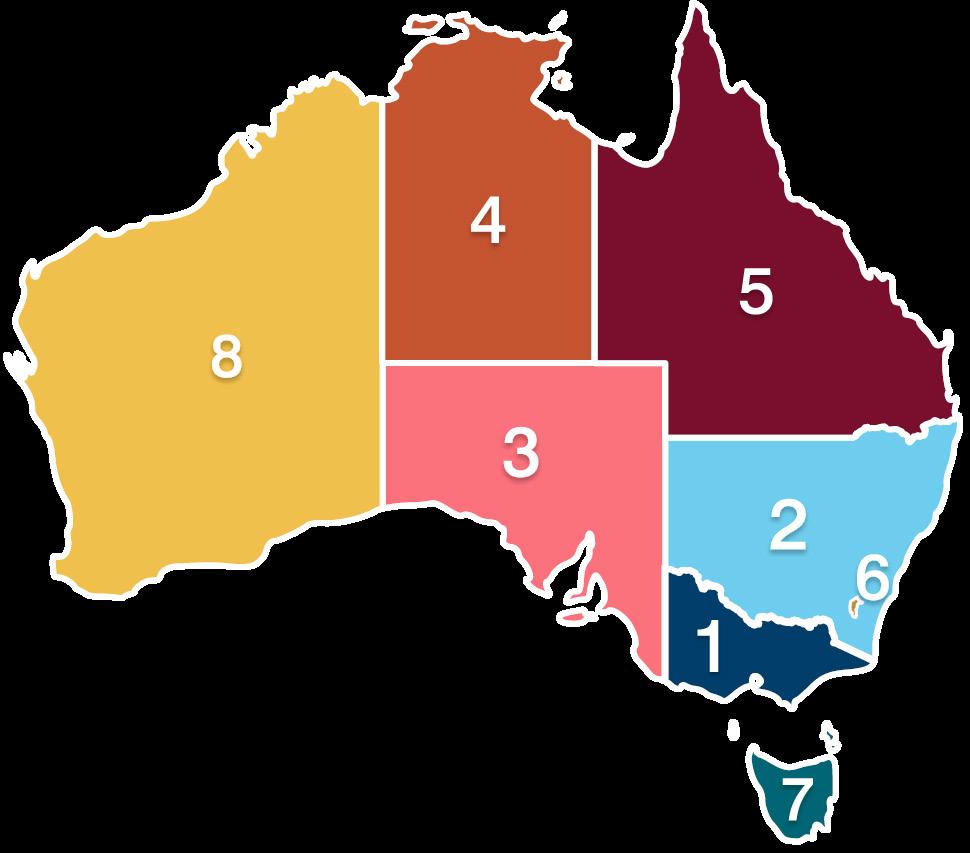
Figure 1: 2024-25 Australian infrastructure funding levels, ranked by share of budget expenditure
KEY INSIGHTS
A total of $270.4 billion in general government expenditure has been allocated to infrastructure over the four years to FY2027-28 – $13.8 billion more than the FY2023-24 Budget Season.
Allocations to infrastructure represent 15.4 per cent of general government expenditure, a minor decrease from the 15.5 per cent allocation share in FY2023-24.
Victoria remains at the top of Budget Monitor rankings for the fourth consecutive year. The Victorian Government will spend 18.7 per cent of its total general government expenditure on infrastructure over four years, a reduction on the 20 per cent in last year’s Budget.
Queensland rose from sixth to fifth place, having increased its infrastructure share to 14.6 per cent. This reflects an increase of 22.8 per cent on last year’s outlay, which itself was a 20 per cent increase on the year before.
Average per capita expenditure on infrastructure across state and territory allocations over four years is now $10,903, up 6.5 per cent compared to last year’s figure of $10,241 per capita.
Though the Federal Government’s allocation to infrastructure as a share of general government expenditure decreased by one per cent against last year’s Budget, it still remains above the ten-year average infrastructure share.
VIC NSW SA
Infrastructure spend remains steady in a constrained environment
The allocation of $270.4 billion in general government expenditure over the four years to FY2027-28 represents a modest increase of $13.8 billion or $4 billion in real terms. This follows last year’s increase of just $1.6 billion in infrastructure funding. While now on the other side of the slew of strategic reviews that were underway last Budget Season – including the Federal Government’s Strategic Review of its Infrastructure Investment Program – fiscal and perceived market capacity constraints still restrain government appetite for new infrastructure commitments.
The limited volume of new projects announced in both the 2023-24 and 2024-25 Budgets all but locks in a decline in funding certainty for road and rail in the medium-term despite being buoyed by tail funding and overrun allocations in the near-term. Whilst infrastructure funding and delivery tends to be cyclical in response to community needs and population growth, the forthcoming transport valley risks creating a period of funding instability. The pipeline of potential energy projects offers an opportunity to fill this funding valley, however will require action from governments and industry to ensure a transition from plans to reality.
While not included in the rankings, the Federal Government has allocated $60.5 billion over four years to FY2027-28, a slight reduction compared to last year’s $62.8 billion. However, infrastructure funding allocated in FY2024-25 is budgeted to reach an all-time high of $16.6 billion, representing 2.2 per cent of total government expenditure.
Governments redirect funding allocations after last year’s energy commitments
In a distinct change from last year’s Budget Monitor, only minor allocations were made to energy projects this year. In the 2023-24 Budget Season, interventions were headlined by the establishment of the State Energy Corporation in Victoria, the Energy Security Corporation in NSW, Queensland Hydro, and the allocation of general government expenditure to energy generation projects in Western Australia.
This Budget Season, major energy expenditure commitments came from state-owned corporations, which, due to costs being funded by user charges, does not constitute general government expenditure and therefore is not included in the Budget Monitor’s analysis methodology. This methodology, used consistently in previous editions of the Budget Monitor, ensures that our analysis focuses only on government-funded allocations, derived from taxpayer funds, rather than a broader inclusion of non-funded sources like user-pays expenditure or equity financing, which increase the headline spending figures but do not deliver additional public infrastructure.
Source: Infrastructure Partnerships Australia analysis of the 2024-25 Federal Budget
Figure 2: Federal Budget infrastructure allocations by jurisdiction and asset class
Jurisdiction rankings
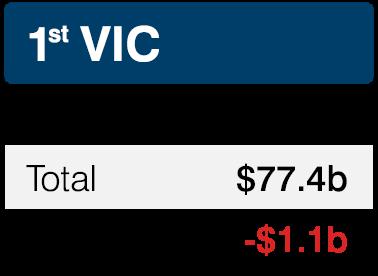
After overtaking New South Wales for the top spot in the 2021-22 Budget Season, Victoria has once again finished in first place in the Budget Monitor rankings with a $77.4 billion allocation to infrastructure – representing 18.7 per cent of the state’s total general government expenditure. Victoria maintains its position despite a decline in infrastructure expenditure of $1.1 billion and a moderation of allocated infrastructure spend as a percentage of general government expenditure from 20 per cent in last year’s Budget. This represents a significant tempering from the record 23.1 per cent of government expenditure in 2022-23.
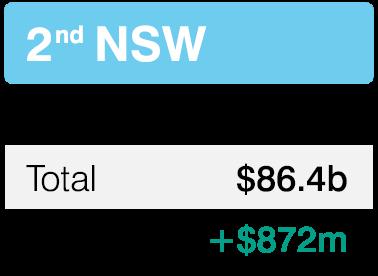
New South Wales continues in second place, allocating $86.4 billion in general government expenditure to infrastructure over four years – the fifth year in a row it has surpassed $80 billion. This $872 million increase in infrastructure allocations comes off the back of general government expenditure increases throughout the Budget in response to high inflation, with infrastructure representing 16 per cent of total expenditure, slightly below the 10-year average of 16.5 per cent. As the jurisdictions leading the transport tsunami of recent years, NSW and Victoria are beginning to see the crest of their respective road and rail expenditure pipelines. South Australia and the Northern Territory have come in at third and fourth place, having been neck and neck for a podium position over the last few years. At 15.6 per cent and 15.4 per cent of total government expenditure proportioned to infrastructure respectively, the two jurisdictions are edging ever closer towards placing in top two positions in the coming Budget Seasons.
In distinct contrast to its other state and territory counterparts, Queensland saw a strong increase in its share of infrastructure spending, from 12.9 per cent of total government expenditure to 14.6 per cent this year on the back of substantial increases in coal royalties to the state. As one of the most significant increases in share of infrastructure spending this year, this shifts the state up into fifth place. This represents a third successive increase in the government’s infrastructure share – with a 19 per cent increase in FY2022-23, a 21 per cent increase in FY2023-24, and now a 23 per cent increase in FY2024-25.
As a result of Queensland’s jump, the Australian Capital Territory has fallen one place to sixth, maintaining a steady infrastructure allocation of 13.6 per cent.
Tasmania holds its position in seventh place but has seen a swift two-year decline in infrastructure allocation from 13.5 per cent in FY2022-23 to 9.8 per cent this year.
Western Australia has once again finished in last place with an 8.8 per cent allocation to infrastructure – down from 9.6 per cent last year, and below the 10-year average of 8.9 per cent.
Per capita infrastructure spend analysis
This year’s Budget Season sees largely positive results for per capita infrastructure spend, with three jurisdictions delivering large increases, and the remaining jurisdictions seeing relatively minor changes. The Northern Territory experienced a significant $3,410 increase bringing the total per capita spend to $20,994, 19 per cent higher than last year’s Budget. With its dispersed population and expansive geography, it comes as no surprise that the Territory remains well above other states in its per capita share.
Queensland and South Australia also saw per capita increases over $1,500, and though the ACT increased by a small $787, this saw the jurisdiction take second place in per capita spending with a total of $11,479 per capita. New South Wales and Western Australia saw minor increases in nominal per capita spend, with Victoria and Tasmania the only jurisdictions recording a decrease in per capita spend. Despite this, per capita spending for Victoria and New South Wales was relatively stable at $11,202 and $10,249 respectively, while Western Australia averaged $5,306 per capita. Figure 3 shows the per capita infrastructure investment across these jurisdictions over the last two years.
Source: Infrastructure Partnerships Australia’s analysis of 2024-25 and 2023-24 Budgets
Figure 3: Per capita infrastructure funding by state and territory governments over the last two years
ABOUT THE BUDGET MONITOR
Background
Infrastructure Partnerships Australia’s Australian Infrastructure Budget Monitor 2024-25 measures infrastructure funding commitments by jurisdictions for the current Budget year and forward estimates (being FY2024-25 to FY2027-28). This report collates information from the latest Budget papers from Federal, state and territory governments to provide insights into their infrastructure investment programs beyond the headline figures. The purpose of the Budget Monitor is to inform the community, industry and researchers about historical and projected public infrastructure investment in Australia. It allows readers to compare and evaluate the commitments by governments to building infrastructure.
Methodology
The strength of each jurisdiction’s infrastructure program is assessed according to the aggregate general government sector infrastructure funding commitment over the period FY2024-25 to FY2027-28 as a share of total general government sector expenditure. This methodology allows for comparison of small and large jurisdictions and provides insights into the relative importance of infrastructure as a government priority over time.
Infrastructure funding figures reported in government budgets are used where available. In other cases, the sum of purchases of non-financial assets and finance leases (such as expenditure from governments to private consortia through Public Private Partnership contracts) is used as a proxy. This seeks to account for the diversity of budgetary approaches across the nation.
The analysis uses total general government sector expenditure as a consistent measure of government spending. Total expenditure is calculated by adding total expenses and net acquisitions of non-financial assets, and accounts for spending on non-commercial aspects of the government.
This means spending by government-owned corporations (for example, water and energy utilities and government-owned ports) is excluded from this analysis. This provides a sound basis for comparison, and appropriately isolates the analysis to infrastructure that is paid for by taxes rather than through user charges. If this rule was not applied, jurisdictions with a higher proportion of infrastructure owned by government would appear disproportionately higher, with no real world expenditure impact.
This approach has been utilised to more accurately reflect the direct decisions and choices of governments in determining capital allocations to infrastructure, whilst accounting for differences in institutional settings. This methodology ensures that our analysis focuses only on taxpayer-funded sources, rather than a broader dataset that captures user-pays expenditure or equity financing, which both make the headline figures higher, but do not deliver any additional public infrastructure.
For this reason, the figures found in the Budget Monitor may differ from the headline figures governments use in media releases and interviews related to infrastructure funding.
As government priorities evolve, we include new vehicles and sources of infrastructure investment across broad remits and portfolios of government. We ensure all funding items and associated measures are traced back and added to previous years’ aggregates where necessary to retain comparability.
1ST PLACE: VICTORIA
Victoria stays atop of the Budget Monitor rankings for the fourth year running
The 2024-25 Victorian Budget sees a continuation of Victoria’s investment in a major pipeline of projects, with a $77.4 billion four-year allocation to general government infrastructure expenditure. This represents 18.7 per cent of total general government expenditure and equates to approximately $1.6 billion per month for infrastructure spend.
Though this places Victoria again at the top of the Budget Monitor rankings, it is the second year in a row that infrastructure funding has decreased. This is reflective of Victoria’s restrained fiscal settings following increases over the pandemic years, and an undertaking to moderate new infrastructure investment, matched with a strong already-committed infrastructure pipeline.
Victoria’s transport pipeline remains focused on existing road and rail infrastructure amidst delays and limited new projects
This year’s Budget is focused squarely on delivering previously announced rail and road projects, with only $164 million in new funding allocated to road and $304 million new funding flowing to rail.
Existing road projects received a confirmed total of $5.8 billion in previously announced funds allocated to FY2024-25. Among these, the West Gate Tunnel is expected to be completed by the end of 2025, with a $513 million allocation. As part of the North East Link project, FY2024-25 sees a total of $2.9 billion allocated to the North East Link – Primary Package (Tunnels), $766 million allocated to the M80 Ring Road Upgrade (Greensborough), and $458 million in for the North East Link Connections (Bulleen/Watsonia) package. Additionally, the Level Crossing Removal program continues at pace, with a total of $1.5 billion allocated for FY2024-25.
The majority of changes to rail infrastructure is centred on delivery timelines. The Suburban Rail Loop – Airport, also known as Melbourne Airport Rail, has been delayed by ‘at least’ four years, with no total estimated cost or completion date confirmed. Meanwhile, the Suburban Rail Loop East – Development, Initial and Early Works has seen a revised completion date of Q3 FY2025-26, a nine-month delay compared to last year’s Budget, with $449 million in funding allocated in FY2024-25. The Melbourne Metro Tunnel project has been allocated $517 million in this financial year.
The Budget also confirms that the Geelong Fast Rail project has been discontinued following the withdrawal of Federal Government funding as a result of its Infrastructure Investment Program Strategic Review.
Social infrastructure takes centre stage of new funding commitments once again
This year’s Budget commits $1.7 billion for new and upgraded health infrastructure – although approximately $458 million of this is allocated beyond the forward estimates. Three key projects have been allocated funds to progress to construction, including $673 million for the Northern Hospital Redevelopment, $498 million for the Monash Medical Centre Redevelopment, and $230 million for the Austin Hospital Emergency Department Upgrade.
The Budget also allocates a further $116 million over the next three years, including $26 million in FY2024-25, for planning and design of West Gippsland Hospital, Queen Elizabeth Hospital, Wonthaggi Hospital Redevelopment and the Dandenong Hospital as part of the Hospital Infrastructure Delivery Fund.
In education, the next phase of the capital program will see new funding allocated to the delivery of 16 schools and the upgrading of 25 more as part of a $1.6 billion funding commitment – including $787 million committed in this financial year. The Government’s commitment to construct early learning infrastructure facilities over five years, a headline announcement in last year’s Budget, has had its estimated completion date and expenditure marked removed from this Budget, with details to be confirmed pending further planning. The early childhood education element of the program has also been revised to a 15-year infrastructure program with a completion date of FY2036-37.
Major new funding allocations in Victoria Victoria infrastructure statistics Value Description
18.7% Share of general government expenditure dedicated to infrastructure
15.4% Decade-average share of Budget dedicated to infrastructure
$13.8b Above decade-average infrastructure funding level over four years to FY2027-28
$77.4b Total infrastructure funding over four years to FY2027-28
-$1.1b Decrease in infrastructure funding in this Budget
ROAD
$2.9 BILLION to the North East Link Primary Package (Tunnels) in FY2024-25
$1.7 BILLION for new and upgraded health infrastructure over four years
EDUCATION
$787 MILLION to funding new education and skills infrastructure in FY2024-25
RAIL
$517 MILLION for the Melbourne Metro Tunnel in FY2024-25
Source: Infrastructure Partnerships Australia’s analysis of the 2024-25 Victorian Budget
2ND PLACE: NEW SOUTH WALES
New South Wales allocates over $80 billion for the fifth consecutive budget to remain in second place
The NSW Budget allocates $86.4 billion general government infrastructure funding over the four years to FY2027-28 – the fifth year in a row in which the state has allocated more than $80 billion to infrastructure. This is a one percent increase on the planned outlay in last year’s NSW Budget – however, it represents 16 per cent of general government expenditure, a 0.6 percentage point decrease from last year’s Budget. Despite consistent infrastructure funding, the five per cent increase in total general government expenditure in FY2024-25 has resulted in NSW being one of the two jurisdictions – alongside Western Australia – to dip below its 10-year average infrastructure share of 16.46 per cent.
This year’s Budget addresses the previously announced commitment to reduce infrastructure expenditure toward two per cent of Gross State Product, extending the deadline from FY2026-27 to FY2027-28.
Housing commitments headline the social infrastructure pipeline
This year, the NSW Government has turned its attention to housing, announcing the Building Homes for NSW program, which includes a headline capital commitment of $5.1 billion over four years from FY2024-25 for new social housing. This is intended for the construction of a total of 8,400 homes, including 6,200 new dwellings and 2,200 replacements of existing stock.
The Land and Housing Corporation has been allocated $1.6 billion over 11 years to 2034 for supply of new social housing, although it is unclear how this will integrate with the broader program being funded by general government expenditure. A further $1 billion has been allocated over four years to the maintenance and repair of 33,500 existing social homes; $665 million for more than 500 rental homes for key workers, including a $450 million equity injection for a Key Worker Buildto-Rent Program; and $423 million to deliver 850 new homes through the Federally-funded Social Housing Accelerator.
Regional housing also benefited in this Budget, with the Northern Rivers and Central West regions receiving $623 million for new housing, including $525 million for voluntary buybacks. An additional $200 million has been allocated to key health worker accommodation in regional and rural areas, and $153 million has been allocated to the Regional Housing Program.
In other social infrastructure, $12.8 billion has been allocated to capital expenditure on new and upgraded hospital and health infrastructure over the next four years, including $782 million in new capital works and an additional $395 million under the Building Better Hospitals program to cover cost increasing across nine projects.
$9.5 billion capital expenditure has been earmarked for education infrastructure, the vast majority of which is dedicated to existing projects.
Western Sydney receives majority of new transport funding allocations
The Budget provides $4.9 billion in new funding to transport projects, most of which is directed to projects in Western Sydney.
Headlining new allocations is an additional $2.1 billion to Parramatta Light Rail Stage 2 with the intention of fulfilling the commitment that construction would commence on the project in this Government’s term. Western Sydney receives a significant share of new road funding as well, with the NSW Budget allocating $661 million over four years to the Elizabeth Drive Upgrade and a further $606 million over four years to Mamre Road-Erskine Part Road to Kerrs Road. Total funding for the Elizabeth Drive and Mamre Road projects is $800 million and $1 billion respectively, with both projects subject to a 50:50 funding ratio between the NSW and Federal Governments.
The Budget also provides an additional $110 million to fully fund the M7-M12 Integration following the Federal Government announcing it would no longer contribute to the project as part of its response to the Infrastructure Investment Program Strategic Review. The NSW Government will now contribute the full public-sector funded portion of the $1.7 billion project, which is being delivered as a Public Private Partnership with WSO Co.
The rest of the commitments in transport flow to existing projects, with the bulk of rail funding allocated to various Sydney Metro projects while road funding was directed toward the Western Harbour Tunnel and Princes Highway Corridor projects. With most of the Budget’s funding committed to projects that have reached the peak of their expenditure, NSW may experience a deficit in the medium to long term pipeline.
New South Wales infrastructure statistics
Value Description
16.0% Share of general government expenditure dedicated to infrastructure
16.5% Decade-average share of Budget dedicated to infrastructure
▼
$2.3b Below decade-average infrastructure funding level over four years to FY2027-28
$86.4b Total infrastructure funding over four years to FY2027-28
Major new funding allocations in New South Wales
+$872m Increase in infrastructure funding in this Budget RAIL
$20.1 BILLION over four years to Sydney Metro
$12.8 BILLION over four years for hospital and health infrastructure
$5.1 BILLION over four years to new social housing
$1.9 BILLION over four years for Zero Emissions Buses
3RD PLACE: SOUTH AUSTRALIA
South Australia rises in the ranks to re-enter third place
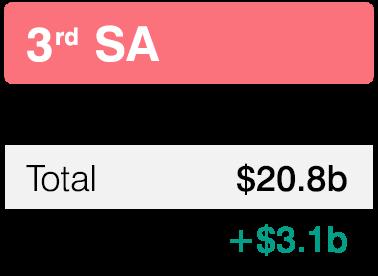
This year’s South Australia Budget contains an infrastructure investment of $20.8 billion, or 15.6 per cent of general government expenditure over the next four years, including $4.5 billion in FY2024-25. This four-year infrastructure spend represents a $3.1 billion increase on last year’s Budget and a 0.8 percentage point increase in the share of total infrastructure expenditure. This continued growth can be attributed to additional funding allocated to a handful of key, multibillion dollar projects, rather than new commitments. The 2024-25 Budget’s four-year allocation places the infrastructure share significantly higher than the 10-year average of 10.9 per cent.
South Australia’s growth in infrastructure share has moved it into the highly contested 3rd place. This continues the State’s closely fought struggle for the position over the last three Budget Monitors against the Northern Territory, who held the spot last year. Despite rising in the rankings, the Budget registers an infrastructure underspend of $521 million, following on from the previous year’s infrastructure underspend of $537 million.
Budget spending targeted at delivering existing projects across the pipeline
South Australia’s North South Corridor continues to receive a significant share of infrastructure funding. With main works expected to commence next year, $952 million was allocated to the Torrens to Darlington section in FY2024-25. The South Australia Budget earmarked a total $7.7 billion allocation to the Torrens to Darlington section from FY2023-24 to FY2027-28. This follows last November’s Federal Government response to the Strategic Review of the National Infrastructure Investment Program, which allocated an additional $2.7 billion funding to the project, increasing the Federal Government’s total contribution to $7.7 billion and matching the South Australian Government’s expenditure.
An additional $200 million has also been allocated to the South Eastern Freeway upgrade over three years, increasing the project’s total estimated cost to $350 million. The Fleurieu Connections Package was also allocated $145 million in FY2024-25, bringing the project’s total estimated cost from $685 million to $810 million.
Hospital projects headline SA’s social infrastructure allocations
Existing health infrastructure projects were allocated $741 million of the $793 million total health expenditure in FY2024-25, including $198 million in FY2024-25 for the $3.2 billion New Women’s and Children’s Hospital. Over the same period $114 million was committed for the Flinders Medical Centre Upgrade and Expansion –with the Budget confirming a total project cost increase from $400 million to $498 million – and the $321 million new Mount Barker Hospital received a $58 million allocation.
South Australia infrastructure statistics
Value Description
15.6% Share of general government expenditure dedicated to infrastructure
11.0% Decade-average share of Budget dedicated to infrastructure
▲
$6.2b Above decade-average infrastructure funding level over four years to FY2027-28
$20.8b Total infrastructure funding over four years to FY2027-28
+$3.1b Increase in infrastructure funding in this Budget
Major funding allocations in South Australia
ROAD
$952 MILLION for the Torrens to Darlington in FY2024-25
HEALTH
$741 MILLION for health infrastructure in FY2024-25
ENERGY
$389 MILLION for the Hydrogen Jobs Plan in FY2024-25 Source: Infrastructure
EDUCATION
$256 MILLION for capital works in FY2024-25
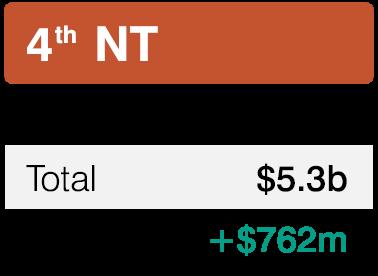
4TH PLACE: NORTHERN TERRITORY
Despite sustaining its share of infrastructure funding, the Northern Territory drops to fourth place in the rankings
The Northern Territory Government has allocated $5.3 billion in general government infrastructure expenditure over the next four years. This represents a $762 million, or 17 per cent, increase in infrastructure funding over four years compared to last year’s Budget. However, the NT Government’s share of total government expenditure on infrastructure of 15.4 per cent remains unchanged from last year’s Budget due to a proportionate increase in general government expenditure. This sees the Territory dropping to fourth place, overtaken by South Australia.
Transport allocations headlined by regional and remote road, and marine upgrades
The Budget allocates $2.3 billion in transport capital works expenditure over the next four years, comprising 53 per cent of the entire capital works program. Major transport allocations include $341 million over four years for sealing, strengthening, and widening industry roads between Alice Springs to Darwin, Newman to Katherine, and Tennant Creek to Townsville, $209 million for Central Arnhem Road upgrades and $189 million to upgrade sections of the Plenty Highway as part of the Outback Way Upgrade.
The $515 million Darwin Ship Lift Facility sees $437 million allocated over the next four years, including $108 million in additional funding. While improving the state’s maritime capabilities offers economic and industry benefit, the project is also intended to provide support for Australian Defence Force vessels. The Darwin Ship Lift Facility on its own accounts for 9.9 per cent of all capital works expenditure over the next four years.
Provision of social housing continues in the Territory
The housing and community amenities capital works outlined in the Budget total $1 billion over four years, accounting for 23 per cent of total capital works funding. This includes $682 million for remote housing across the Territory. Of the remote housing spend, $431 million has been allocated to the Remote Housing Investment Package
The remote housing funding also includes $223 million for the new HomeBuild NT and land service works as part of the $4 billion, 10-year investment between the Federal and NT Governments for housing in remote communities. The initiative, announced prior to the Budget in March, intends to deliver up to 270 homes a year.
Northern Territory infrastructure statistics
Value Description
15.4% Share of general government expenditure dedicated to infrastructure
13.0% Decade-average share of Budget dedicated to infrastructure
▲
$834m Above decade-average infrastructure funding level over four years to FY2027-28
$5.3b Total infrastructure funding over four years to FY2027-28
+$762m Increase in infrastructure funding in this Budget
Major funding allocations in the Northern Territory over four years
TRANSPORT
$2.3 BILLION for transport infrastructure
HOUSING $1 BILLION for housing and community works FREIGHT
$437 MILLION for the Darwin Ship Lift Facility
$217 MILLION for community safety infrastructure
5TH PLACE: QUEENSLAND
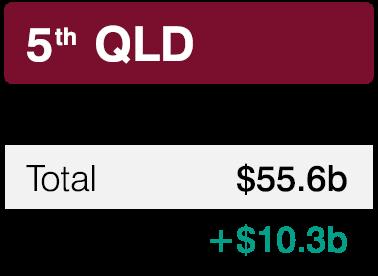
The Queensland Budget makes third successive major infrastructure spend increase, shifts up to fifth position
Ahead of the State Election on 26 October, the 2024-25 Queensland Budget outlines a total of $55.6 billion in general government infrastructure spending over the four years to FY2027-28 – a $10.3 billion or 22.8 per cent increase on last year’s outlay. This is the third year in a row that the State’s four-year allocation to infrastructure has climbed – with increases of 19 per cent in the 202223 Budget and 20 per cent in the 2023-24 Budget. This allocation brings the total share of government expenditure on infrastructure to 14.6 per cent.
Cost increases to major projects in a number of asset classes
The Queensland Budget consists of few new commitments across transport assets, with the majority of funding flowing to previously announced projects and several cost increases in road and rail infrastructure. Notable increases across road projects include an $863 million increase to the Coomera Connector Stage One, bringing the total project cost to $3 billion; a $665 million increase to the Rockhampton Ring Road, bringing the total cost to $1.7 billion; and $500 million to the M1 Pacific Motorway – Varsity Lakes to Tugun, bringing the total project cost to $1.5 billion. In rail, the Logan and Gold Coast Faster Rail project’s total estimated cost has increased by $3.2 billion, now with a total estimated cost of $5.8 billion, and Stage One of the Beerburrum to Nambour Rail Upgrade has increased from $551 million to $1 billion total estimated cost. With these allocations, transport projects made up a substantive 70 per cent of infrastructure expenditure in FY2024-25, compared to just 58 per cent last year.
Turning to social infrastructure, the Budget confirmed that the total cost of the Queensland Health Capacity Expansion Program has increased from $9.8 billion to $11.2 billion over six years. The Government also allocated an additional $1 billion in ‘equity funding’ to ‘optimise patient flow within hospitals, reduce wait times and improve healthcare delivery’. However, the Budget provided no further information on what form this equity will take, or how the Queensland Government intends to seek a return on this equity from its public health system.
2032 Olympic and Paralympic Games receives Budget commitments following Sports Venue Review
Following the Queensland Government’s response to the Independent Review of the 2032 Brisbane Olympic and Paralympic Games’ venue infrastructure in March, the Budget allocates $560 million for venue projects that have commenced or will soon commence procurement as part of Games’ Minor Venues Program. This includes a $27 million allocation to FY2024-25. While the Budget foreshadows a $7.1 billion capital investment program over nine years to deliver venue infrastructure for the 2032 Games, the Budget includes no detail of how this funding is allocated. Funding for specific venues is subject to Government investment decisions following completion of project assessments.
In addition, $62 million has been provided over four years from FY2024-25 for the establishment of the Olympic Games Venue and Legacy Delivery Authority and to prepare Project Validation Reports for venue infrastructure.
Queensland infrastructure statistics
Value Description
14.6% Share of general government expenditure dedicated to infrastructure
11.3% Decade-average share of Budget dedicated to infrastructure
▲
$12.6b Above decade-average infrastructure funding level over four years to FY2027-28
$55.6b Total infrastructure funding over four years to FY2027-28
+$10.3b Increase in infrastructure funding in this Budget
Major funding allocations in Queensland
HEALTH
$2.2 BILLION in FY2024-25 to the health capital program EDUCATION
$1.3 BILLION in FY2024-25 to education infrastructure
$786 MILLION in FY2024-25 to the Queensland Train Manufacturing Program
$650 MILLION in FY2024-25 for the Coomera Connector Stage One
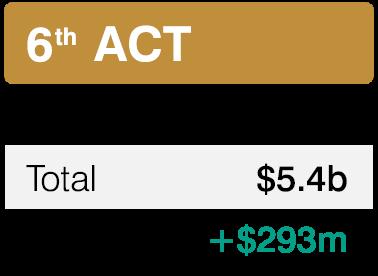
6TH PLACE: AUSTRALIAN CAPITAL TERRITORY
The Australian Capital Territory maintains infrastructure spending in line with last year’s Budget
The 2024-25 ACT Budget includes an infrastructure investment of $5.4 billion in general government expenditure over the four years to FY2027-28. This capital commitment to infrastructure represents a $293 million – or six per cent – increase from the 2023-24 Budget. The share of total government expenditure on infrastructure remains unchanged at 13.6 per cent, and above the 10-year average of 11.7 per cent –however, this consistency has moved the ACT down into sixth place as Queensland increases its infrastructure expenditure share.
This year’s Budget continues to follow a five-year budgeting and reporting cycle for its capital works program, including for general government sector infrastructure spending. The five-year total commitment for infrastructure is $6.4 billion. To maintain comparability of commitments – both as a share of total spending, and across state, territory and Federal levels – the Budget Monitor will continue to focus on a four-year reporting cycle, accounting for the current Budget year and three forward estimate years.
In a turnaround from last year, this Budget includes minimal new capital works
The Budget commits $57 million over four years to new capital works, marking a significant reduction from the $995 million allocated in last year’s Budget for new project announcements such as the new Northside Hospital. The majority of this year’s $3.8 billion in funding is committed to capital works currently under delivery, including $1.2 billion in FY2024-25. Additionally, $472 million has been allocated to maintain and improve the service delivery capacity of existing infrastructure assets and $1.3 billion is held in provisions for projects yet to receive final approvals.
New and ongoing allocations demonstrative of diverse pipeline
In transport, $649 million has been allocated over the next four years to deliver the ACT Light Rail Stage 2A, with a further $100 million committed over the next three years to build the light rail to Woden as part of the Stage 2A main works contract. This is a significant increase from the $76 million over two years allocated to the ACT Light Rail Stages 2A and 2B in the 2023-24 ACT Budget. Major road projects also were apportioned increased funding as work progresses, with $183 million over the next three years to deliver the Molonglo River Bridge and $122 million over the same period to deliver the Monaro Highway Upgrades.
The ACT Budget continues to invest in the Canberra Institute of Technology Campus, with $154 million committed over the next two years to the new campus in Woden and accompanying bus interchange. The Budget also makes several key commitments to delivering new and expanded schools, including $114 million over the next four years to deliver a second college for Gungahlin.
An allocation of $206 million over three years was also made to public housing maintenance and repairs.
Australian Capital Territory infrastructure statistics
Value Description
13.6% Share of general government expenditure dedicated to infrastructure
11.7% Decade-average share of Budget dedicated to infrastructure
▲
$731m Above decade-average infrastructure funding level over four years to FY2027-28
$5.4b Total infrastructure funding over four years to FY2027-28
+$293m Increase in infrastructure funding in this Budget
Major funding allocations in the Australian Capital Territory
RAIL
$649 MILLION over four years for the ACT Light Rail
HOUSING
$206 MILLION over three years for public housing maintenance and repairs
ROAD
$183 MILLION over three years for the Molonglo River Bridge
EDUCATION
$145 MILLION over two years for the Canberra Institute of Technology
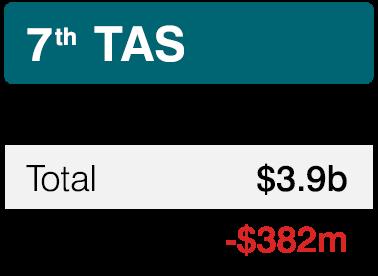
7TH PLACE: TASMANIA
Tasmania infrastructure spending slows down as major projects descend from peak
The Tasmanian Budget allocated $3.9 billion general government infrastructure spend over the next four years, including $1.1 billion in FY2024-25. This fouryear infrastructure spend is $382 million lower than the previous Tasmanian Budget, which was in turn $582 million lower than the 2022-23 Budget. The 9.8 per cent of general government expenditure apportioned to infrastructure is 1.8 percentage points lower than last year but narrowly remains above the State’s 10year average of 9.5 per cent. The State has forecasted a $314 million underspend in FY2023-24, or 25.4 per cent of last year’s budgeted general government infrastructure allocation.
Transport continues to dominate Tasmania’s infrastructure spending
As in previous years, Tasmania’s infrastructure expenditure continues to be dominated by transport projects with $1.9 billion allocated for road and bridge infrastructure, including $557 million in FY2024-25. There are few new funding commitments within the road allocation, with the majority of funding allocated to existing projects. This includes $296 million over the next four years for the $786 million New Bridgewater Bridge project, with $190 million committed in FY2024-25.
The Budget allocated $128 million over four years through the Roads of Strategic Importance program, including $23 million in FY2024-25. A portion of funding from the Roads of Strategic Importance program in this Budget has been diverted towards several road corridor packages, including the $440 million Bass Highway Corridor and the $245 million Tasman Highway Corridor. Across all the road corridor packages, $52 million was allocated to these projects for FY2024-25.
Health and education funding focuses on existing commitments
The 2024-25 Rockcliff Budget allocates $790 million towards health infrastructure over the four years to FY2027-28, including $196 million in FY2024-25. This includes $106 million over four years towards the $648 million Launceston General Hospital Redevelopment – Stage Two, $120 million over four years towards the $180 million Digital Health Transformation program, and $105 million towards the $118 million Royal Hobart Hospital Redevelopment – Expanded Stage Two.
For education infrastructure, $408 million is allocated over the next four years, including $109 million in FY2024-25, however, the majority of this – $106 million – is for existing projects, including $25 million to the New Brighton High School.
▲
Major funding allocations in Tasmania Tasmania infrastructure statistics
9.8% Share of general government expenditure dedicated to infrastructure
9.5% Decade-average share of Budget dedicated to infrastructure
$115m Above decade-average infrastructure funding level over four years to FY2027-28
$3.9b Total infrastructure funding over four years to FY2027-28
-$382m Decrease in infrastructure funding in this Budget
HEALTH
$790 MILLION for health infrastructure over four years
EDUCATION
$408 MILLION for education infrastructure over four years
TRANSPORT
$296 MILLION over four years for New Bridgewater Bridge
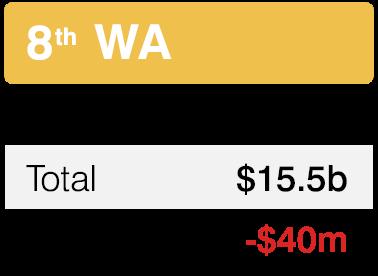
8TH PLACE: WESTERN AUSTRALIA
The Government of Western Australia maintains infrastructure spending in line with last year’s Budget
The Government of Western Australia’s 2024-25 Budget allocates $15.5 billion to infrastructure over the next four years, including $3.6 billion in FY2024-25. This represents a 0.3 per cent decrease in infrastructure funding compared to last year’s Budget. This decrease leaves infrastructure expenditure at 8.8 per cent of general government expenditure over the next four years – below the 10-year average of nine per cent –and places Western Australia last in the Budget Monitor rankings for the eighth consecutive year.
Notably, the Budget includes a headline figure of $42 billion for infrastructure spending over the next four years, however the majority of this is being undertaken by non-financial public corporations. This expenditure is recouped through the corporations’ own-source revenue such as utility bills, rather than being funded through taxpayer dollars and therefore is not included in the Budget Monitor ranking analysis.
A number of significant cost escalations for road and rail projects headline the Budget
METRONET has been allocated $4.8 billion over the next four years, including $2.7 billion in FY2024-25. For the second year in a row, the Budget outlines a number of cost escalations for METRONET including $578 million for the Victoria Park-Canning Level Crossing Removal project, $96 million for acquiring and replacing the METRONET rail cars, and $90 million for the HighCapacity Signalling program of works. The Government has cited cost increases in manufacturing and cost increases in labour, equipment and materials as the reasons for additional investment in the METRONET railcars and Victoria Park-Canning Level Crossing Removal.
The Budget also includes an additional $477 million over the four-year budget period, jointly funded by the Federal Government, to account for cost increases to several road projects, including Mitchell Freeway – Stephenson Avenue, which has increased from $155 million to $288 million, Bunbury Outer Ring Road from $1.4 billion to $1.5 billion, and Transforming Freeways – Mitchell Freeway Corridor from $140 million to $210 million. The Government has attributed the need for additional investment to market-driven cost increases and minor scope enhancements. Outside of cost escalations, this year’s Budget provides very little additional road funding to projects, with $4.5 billion allocated to regional road infrastructure over the next four years.
WA Budget supports strong social infrastructure pipeline
This Budget introduces the Social and Affordable Housing Investment Fund, the repurposed Social Housing Investment Fund with a widened scope to support affordable housing initiatives, bringing the Government’s commitment to new social housing to 4,900 dwellings by FY2027-28. As part of the scope change, an additional $400 million has been allocated to the fund, bringing its total mandate to $1.6 billion.
The State Budget continues its focus on delivering its existing social infrastructure projects, with $3.3 billion allocated over the next four years for capital works in health, including $1 billion towards the $1.8 billion New Women and Babies Hospital over the next four years. An additional $217 million funding has also been allocated for regional hospitals over four years, with the Government again citing cost increases. This includes an additional $173 million to the Bunbury Hospital Redevelopment, bringing the project’s total estimated cost to $451 million. $1.6 billion has also been allocated over the next four years for the construction, refurbishment and expansion of public education infrastructure, including $608 million in FY2024-25. Of this, just $148 million is dedicated to new works over four years, with the vast majority allocated to existing projects.
Western Australia infrastructure statistics
Value Description
8.8% Share of general government expenditure dedicated to infrastructure
8.9% Decade-average share of Budget dedicated to infrastructure
▼
$124m Below decade-average infrastructure funding level over four years to FY2027-28
$15.5b Total infrastructure funding over four years to FY2027-28
-$40m Decrease in infrastructure funding in this Budget
Major funding allocations in Western Australia
RAIL
$4.8 BILLION for METRONET over four years
EDUCATION
$1.6 BILLION for public education infrastructure over four years
HOUSING
$1 BILLION for Social and Affordable Housing over four years
HEALTH
$1 BILLION for the New Women and Babies Hospital over four years
FEDERAL GOVERNMENT
This year’s Budget confirms the halcyon days of year-on-year infrastructure spending growth are in the past
The 2024-25 Federal Budget commits general government infrastructure funding of $60.5 billion over the four years to FY2027-28. This is $1.8 billion – or almost three per cent – lower than the four-year spend of last year’s Budget. However, this allocation represents 1.92 per cent of total general government spending, with this Budget’s four-year spend equating to $9.6 billion above the infrastructure expenditure long-term trend of 1.61 per cent of general government expenditure. As shown in Figure 2, of the Federal Government’s infrastructure allocations, Queensland will receive the lion’s share with $14.7 billion allocated over the next four years, while NSW will receive $14.3 billion and Victoria $11.2 billion.
Top ups to existing projects headline transport spending
The Federal Budget sees $39.2 billion allocated to roads over four years, including $9.9 billion in FY2024-25, and $13.2 billion to rail over four years, including $3.6 billion in FY2024-25. Following the completion of the Strategic Review of the Federal Infrastructure Investment Program last November, there are few surprises with the majority of spending in this year’s Budget allocated to existing transport projects within the Program. While the Budget Papers contain little detailed information on the breakdown of this new spending for the FY2024-25 and forward estimate period, a commitment of an additional $10.1 billion over an 11-year period from FY2023-24 is made to existing projects, including $4.4 billion for North East Link, $1.2 billion for the Direct Sunshine Coast Right Line, $1.4 billion for METRONET projects, and $432 million for the Coomera Connector Stage One.
In addition, Western Sydney road and rail upgrades received significant support with a new $1.9 billion allocation over a seven-year period from FY2024-25. This commitment includes $500 million funding for the Mamre Road Stage Two Upgrade and $400 million funding for Elizabeth Drive (Priority Sections) Upgrade.
The Future Made in Australia program featured heavily in this Budget
The Budget provides a headline $19.7 billion over a 10-year horizon from FY2024-25 towards renewable energy infrastructure in its ‘Future Made in Australia’ program. However, this includes just $1.9 billion – or approximately 10 per cent – allocated over the next four years, including $193 million in FY2024-25. This allocation is primarily directed toward supporting the development of Australia’s hydrogen industry, supporting innovation and commercialisation of ‘priority sectors,’ and investing in renewable energy projects.
The water pipeline was reined in from previous spending
In water, the Budget announced a $2.7 billion commitment over 12 years from FY2023-24 through the National Water Grid Fund. Of this total, $1.2 billion has been allocated over the next four years, including $588 million in FY2024-25 for water infrastructure projects in regional areas. Critically, the Budget has deferred $592 million over five years from FY2023-24 from the fund for three water supply projects in Central Queensland, pending an investment decision upon the completion of planning and a business case.
Federal Government infrastructure statistics
Value Description
1.92% Share of general government expenditure dedicated to infrastructure
1.61% Decade-average share of Budget dedicated to infrastructure
▲
$9.6b Above decade-average infrastructure funding level over four years to FY2027-28
$60.5b Total infrastructure funding over four years to FY2027-28
-$1.8b Decrease in infrastructure funding in this Budget
Major Federal funding allocations
$39.2 BILLION for road infrastructure over four years RAIL
$13.2 BILLION for rail infrastructure over four years
SOCIAL AND AFFORDABLE HOUSING
$8.8 BILLION over four years
HEALTH
$1.3 BILLION for health infrastructure over four years