Institute for Public Policy Research


Institute for Public Policy Research
Dave Hawkey
March 2025
Dave Hawkey is a senior research fellow at IPPR Scotland
The purpose of this paper is to assess Scottish child poverty rates against the target that fewer than 10 per cent of children be in poverty in 2030. It asks what impact a significant boost to parents’ earnings from employment would have and finds additional action will be needed to reach the target. Section 2 of the paper describes why working families’ earnings often need to be topped up with social security if children are to be kept out of poverty.
The author would like to thank colleagues across IPPR and IPPR Scotland who have commented and contributed to this work. Particular thanks to (in alphabetical order) Stephen Boyd, Rosie Lockwood, Jamie O’Halloran and Sukhada Tatke.
Download
This document is available to download as a free PDF and in other formats at: http://www.ippr.org/articles/achieving-the-2030-child-poverty-target
Citation
If you are using this document in your own writing, our preferred citation is: Hawkey D (2025) Achieving the 2030 child poverty target: The distance left to travel, IPPR Scotland http://www.ippr.org/articles/achieving-the-2030-child-poverty-target
Permission to share
This document is published under a creative commons licence: Attribution-NonCommercial-NoDerivs 2.0 UK http://creativecommons.org/licenses/by-nc-nd/2.0/uk/ For commercial use, please contact info@ippr.org

“My first priority is to eradicate child poverty. Not tackle. Not reduce. But eradicate child poverty. This will be the single most important objective of my government and my cabinet.”
(Swinney 2024)
On 27 March, the Scottish government will announce whether Scotland’s 2023 child poverty target – no more than 18 per cent of children in poverty – was achieved. While 2023 will be the first year we see the full impact of the “game changing” Scottish Child Payment, there is widespread pessimism that the target will have been achieved Child poverty is a tough nut to crack.
In this briefing we look forward to 2030 to assess what more will be needed to get the child poverty rate below the 10 per cent target. We anticipate Scottish social security policy will play an important role, and will keep child poverty levels well below the rest of the UK. But existing policies projected forward will still leave twice as many children in poverty as required by the target.
The first minister recently expressed the view that above-inflation rises to the Scottish Child Payment have been “maxed out”, and that “families will be in a better position if parents can get into well-paid, sustainable, good quality employment” (Bol 2025).
We model the effect of a series of such scenarios to understand their effect on the 2030 target – increasing pay rates, cutting unemployment, increasing hours and reducing the rate of economic inactivity among parents. We find that, even with highly optimistic employment assumptions that go far beyond current trends, the child poverty rate in 2030 would still be at least 16 per cent, well above the 10 per cent target.
Figure S.1: The 2030 child poverty target is difficult to deliver, even with improvements in the labour market and a further boost to social security
Modelled child poverty rates in 2030 and changes due to Scottish social security policy and assumptions on increases to parents’ earnings
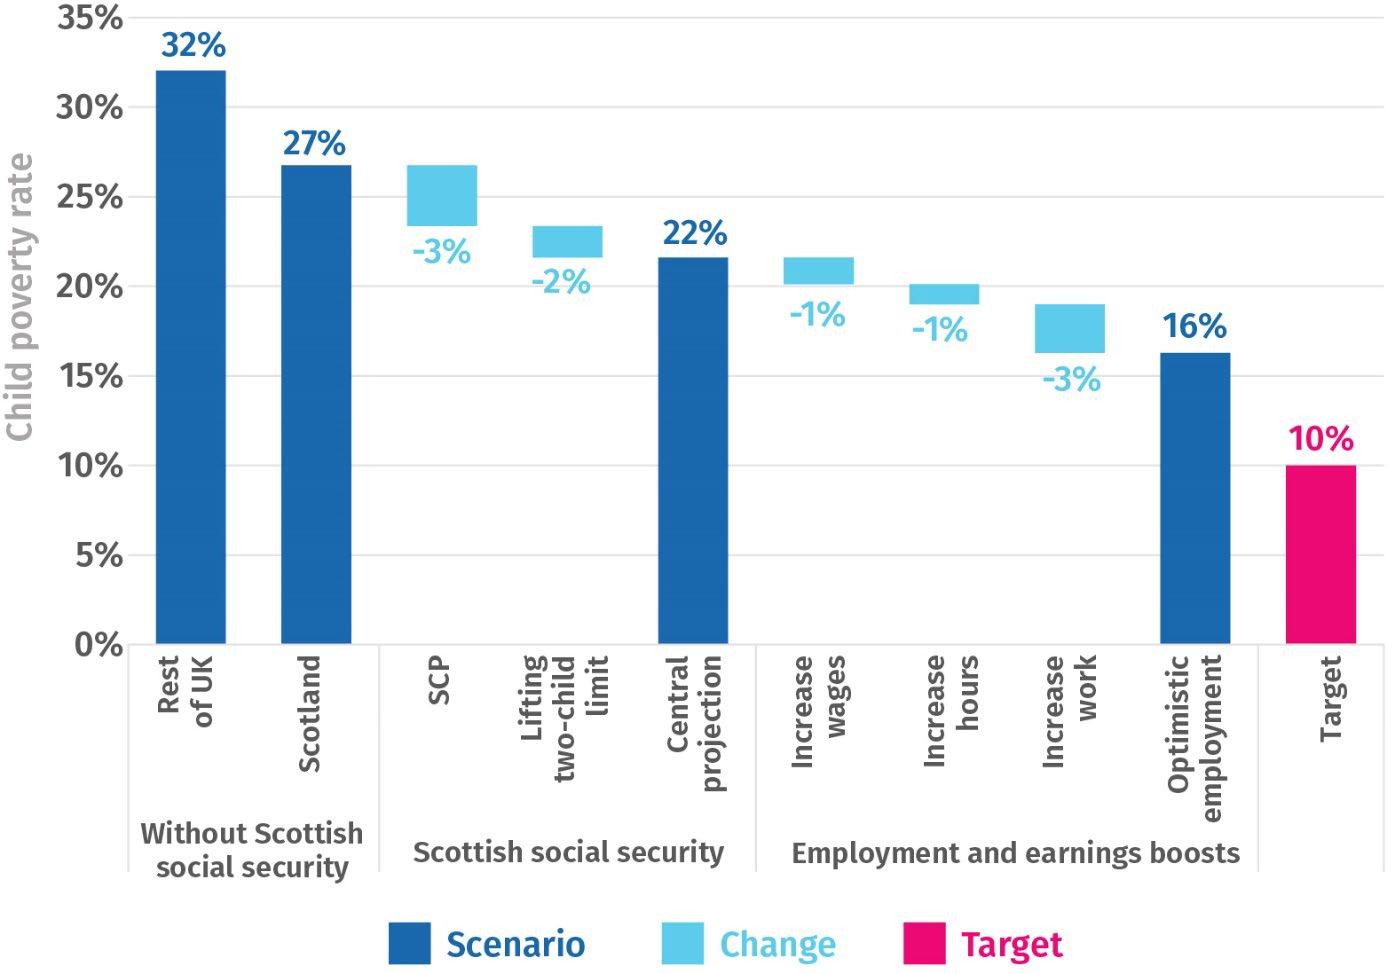
Source: Author’s analysis using IPPR tax and benefit model, based on Family Resources Survey data from 2019/20, 2021/22 and 2022/23. Figures may not sum due to rounding.
What does this mean for reaching the 2030 target? Key to understanding why it is so difficult to drive child poverty rates down is understanding the different reasons children in different households might be in poverty. The second part of this briefing breaks these down into how much the adults in a household earn, how much they spend on housing, how many people (children and adults) have to share the household’s income, and what additional income the household receives in benefits. We show why employment alone is not always enough to lift a family out of poverty, and why social security will always have a role in preventing in-work poverty for families with children.
Helping parents into secure, well-paid work, is clearly an important policy objective and, if successful, will help reduce the number of children in poverty. However, the inescapable conclusion of our analysis is that hitting the 2030 target will be nigh on impossible without additional fiscal commitments. The most direct route to achieving this in the near
term would be to increase benefits payments to families in or at risk of poverty, with investment in social housing an important longer term complement. 1
This will be an unwelcome message for policy makers trying to reach the 2030 target. Fiscal pressures are mounting, driven by geopolitical tension, our ageing society, the costs of reducing emissions and the climate damage already caused by the world’s failure to achieve those reductions fast enough. This unhappy context is compounded by emerging UK government policy which intends to reduce welfare spending through reform of disability benefits. The precise consequences for Scotland are as yet unclear, given the reforms affect both universal credit (a UK benefit) and Personal Independence Payments (a benefit that has been replaced in Scotland by Adult Disability Payment). However, given the reforms are intended to reduce social security spending, it is hard to see them not filtering through to either reduced support in Scotland or greater pressure on the Scottish budget.
The Scottish government is in the early stages of developing its next child poverty delivery plan to cover the period up to 2030. For that plan to be credible, it needs to set out clearly not just the actions the Scottish government will take to reduce child poverty, but what impact it expects these actions to have If, as we anticipate, this pathway analysis shows the target is unachievable without additional fiscal resource, this should be the starting point for a much clearer debate in Scotland about the right balance between tax and spending.
1 Our model does not explicitly implement rent control measures proposed in the Housing (Scotland) Bill, but our assumed rate of rent increase is below the Scottish government’s proposed cap of 1 percentage point above the CPI inflation rate which, in any case, would not apply to tenancies in designated rent control areas.
When the Scottish government legislated its child poverty targets in 2017, 24 per cent of children were in poverty. In 2022/23, the latest year for which we have data, the proportion was 26 per cent, essentially unchanged within the margins of error (Scottish government 2024).
This is not to say there was no progress. Over this period, the Scottish Child Payment was developed and introduced, with eligibility extended and value increased. In November 2022 it reached £25 per week and was available to children under the age of 16 in families receiving qualifying benefits (predominantly universal credit). As this was mid-way through the financial year, the full impact of the payment is not evident in the 2022/23 statistics.
The imminent child poverty statistics for 2023/24 will, therefore, be the first year to include the full effect of the SCP. We expect this to have a significant impact, bringing the child poverty rate down to around 19 per cent, missing the 18 per cent target . But given the margin of error in poverty there is a possibility that the actual statistic will show the target was met.
However, were child poverty policy to stop there, we would likely see an upward trend in the child poverty rate, common with UK level projections (Clegg and Corlett 2025) This is driven by a range of factors, including the practice of uprating benefits by inflation, which allows them to fall behind wages and rent. Our business-as-usual 2030 estimate, which includes the Scottish government’s commitment to mitigate the two-child limit, would see the child poverty rate rise back up to 22 per cent.
Table 1.1: Scotland’s existing social security policies play an important role in limiting child poverty in 2030
Child poverty rate without the Scottish Child Payment, and with the two-child limit
Impact of the Scottish Child Payment (fixed in real terms)
Source: Authors’ analysis using IPPR tax and benefit model, based on Family Resources Survey years 2019/20, 2021/22 and 2022/23
The choices that the Scottish government has already made on social security will have a significant impact on the child poverty rate. Clearly, though, other economic dynamics increasing the child poverty rate mean these policies alone will be insufficient to even keep the child poverty rate static.
To what extent can child poverty be tackled by increasing parents’ earnings? While it is obvious that the children of parents with relatively high earned incomes are very unlikely to experience poverty, a policy that addresses poverty across society must work within the realities of the labour market. Those realities include the lower end of the wage distribution. It would be unfair to expect that only those workers who command a relatively high wage could become parents, just as it would be unrealistic to expect employers to pay workers a higher wage just because they have children.
To estimate the impact of increasing low-income parents’ wages, we cannot assume an unlimited wage increase would be generally available. Instead, we estimate the impact of
lifting all parents’ wages to the real living wage 2 (RLW), a standard that runs through Scottish government policies.
We also estimate the impact of more parents working. Much of the reduction in child poverty from the end of the 1990s through the early 2000s was accompanied by an increase in parental employment. While this shows work as an effective route out of poverty, it is a phenomenon that has limited scope to be repeated – many of the parents who can work already do (Clegg and Corlett 2025).
Our model increases parents wages so none is paid less than the RLW, and assumes those working part-time increase their work week to the hours assumed by the Resolution Foundation when calculating the real living wage (Cominetti and Murphy 2024). 3
In addition, we model the impact of reducing unemployment and economic inactivity among parents. This is a difficult change to model due to much uncertainty and indeed controversy as to how many parents could realistically be supported into work. As we explore later in this briefing, the diverse reasons why some parents are not in work are include issues such as disability and caring responsibilities, and the intensity of these constraints exists along a spectrum. Accordingly, we model a reduction in inactivity which is likely at the outer limit of what is feasible, and assume work for half of unemployed parents and a quarter of inactive parents (excluding students, retired parents and parents with a child under the age of one).
Our assumptions should be read as intentionally optimistic as to the effectiveness of parental employment policies. Our assumption amounts to around 40,000 parents who would otherwise be inactive finding work. By comparison, the Scottish government’s employability schemes currently support around 12,000 parents each year of whom around 4,000 (Scottish government 2024b) At that pace, the number of parents supported into work by 2030 would be half what our modelling assumes. Furthermore, support for parents to stay in work would also need to be more effective as currently around 60 per cent of parents supported do not sustain work for more than a year (ibid). On top of this we assume no parent has low wages or inadequate hours. Even with these stretching assumptions the child poverty rate would remain stubbornly high, dipping just two points below the 2023 target and remaining far above the 2030 target of 10 per cent.
2 We use the 2024/25 real living wage rate of £12.60 and uprate this by anticipated wage inflation in the IPPR tax and benefit model.
3 For couples with children, the assumption is that one works 37.5 hours per week while the other works 28. For single parents, the assumption is 22 hours of work per week. Where parents already work longer hours or at a higher wage than the RLW, we make no change to their employment.
Table 1.2: Increasing parents’ wages and employment can reduce the child poverty rate, but even with highly optimistic assumptions the 2030 target would be missed
Source: Authors’ analysis using IPPR tax and benefit model, based on Family Resources Survey years 2019/20, 2021/22 and 2022/23. Figures do not sum due to rounding.
Given that, even with heroic assumptions on increased parental earnings, the child poverty target will be missed, it is clear that additional resource will need to be targeted directly to families if the target is to be hit. We have explored this by modelling the impact of doubling the Scottish Child Payment. Our baseline assumption is that the value of the SCP tracks inflation to reach £30.30 per child in 2030, so in our doubled-value scenario we model it at £60.60.
Table 1.3: Doubling the Scottish Child Payment would further reduce the child poverty rate but the 2030 target would still be missed.
Source: Authors’ analysis using IPPR tax and benefit model, based on Family Resources Survey years 2019/20, 2021/22 and 2022/23. Figures do not sum due to rounding.
In our baseline estimate, £530 million would be paid to families in 2030 as Scottish Child Payments. Our optimistic earnings assumptions would bring this down to around £480 million as some families would lose eligibility. Doubling the payment would take the total cost up to £960 million. These figures are intended to illustrate the scale of additional social security budget needed to get closer to the 2030 target. The details of how best to use social security payments to better support families would need further analysis.
Around 70 per cent of children in poverty live in a working household (Scottish government 2024a). To understand why work appears not to be sufficient protection against poverty, this section explores the relationship between earnings and disposable income for working parents. We start unpacking this relationship by analysing parents’ earnings.
In Scotland, while it is common for parents of both genders to work, family earnings are characterised by a “breadwinner” model: within couples, one parent usually has considerably higher earnings than the other, and the higher earner is, in around 70 per cent of cases, male. 4 This reflects a strongly gendered division of labour, characteristic of households across the UK (Andrew et al 2021), in which one parent, usually the mother, steps back from the labour market when their first child is born. This tends to result in lower earnings, even in cases when mothers return to work full time
Single parents, over 90 per cent of whom are women, have a remarkably similar profile of earnings as the lower-earning members of couple-parents, and these patterns are similar across families with different numbers of children (figure 2.1).
4 Statistics on the gender of parents calculated from DWP Households Below Average Income dataset, averaged across 2021/22 and 2022/23
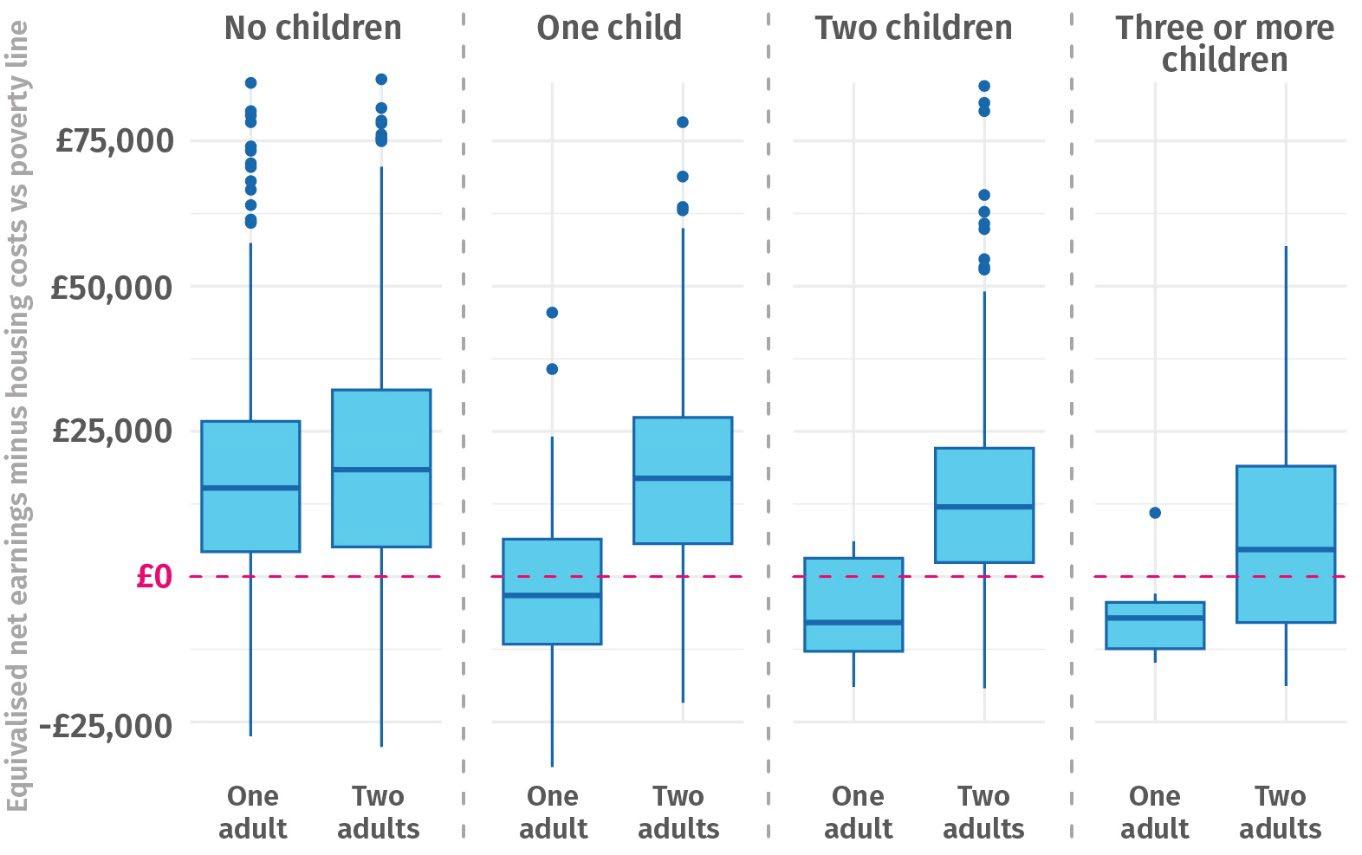
Figure 2.1: Single parents and the lower earner of couple-parents have very similar earnings in Scotland
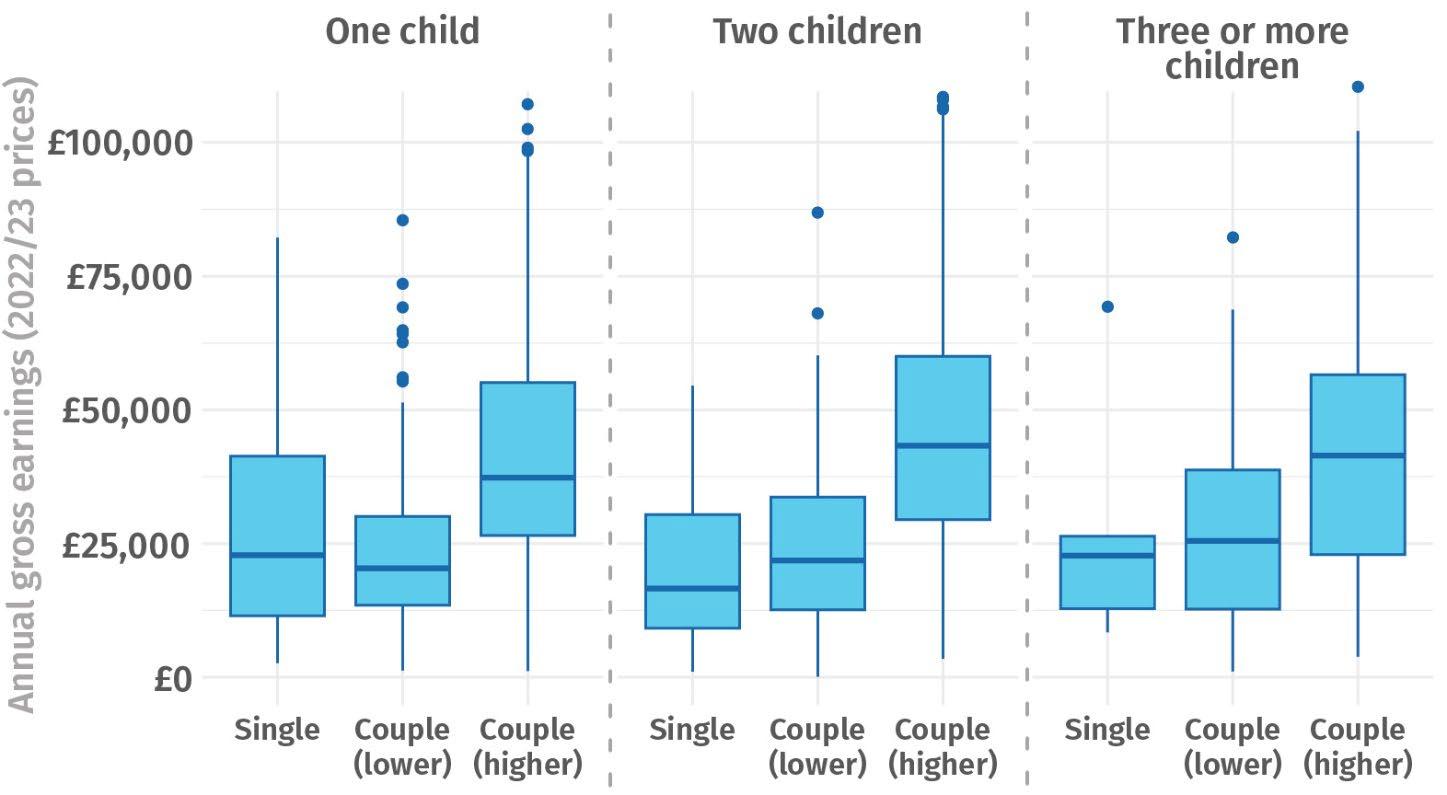
Source: Authors’ analysis of DWP (2024) Households Below Average Income (years 2021/22 and 2022/23 combined). Includes only working age parents with earnings. Boxplot description: central band shows median (half of each population is above, and half below this level), box shows the range from the first to the third quartile (the middle half of the population falls within the box), and whiskers show the full range excluding outliers.
This similarity, and the similarity of working patterns (discussed below), suggests that lower earnings are a consequence of having children, not of having a higher earning partner and so having less incentive to work. The realities of Scottish society in the 21st century mean parents spend a chunk of their time and energy being parents, time and energy they do not have to spend at work.
The definition of poverty used in the Scottish government’s 10 per cent target considers disposable income after housing costs. Variation in housing costs feeds directly into poverty risks, and the cost of adequate housing increases with children – children obviously need space.
Figure 2.2: Households with children tend to have higher housing costs than households without, and single-parent households rarely have low housing costs
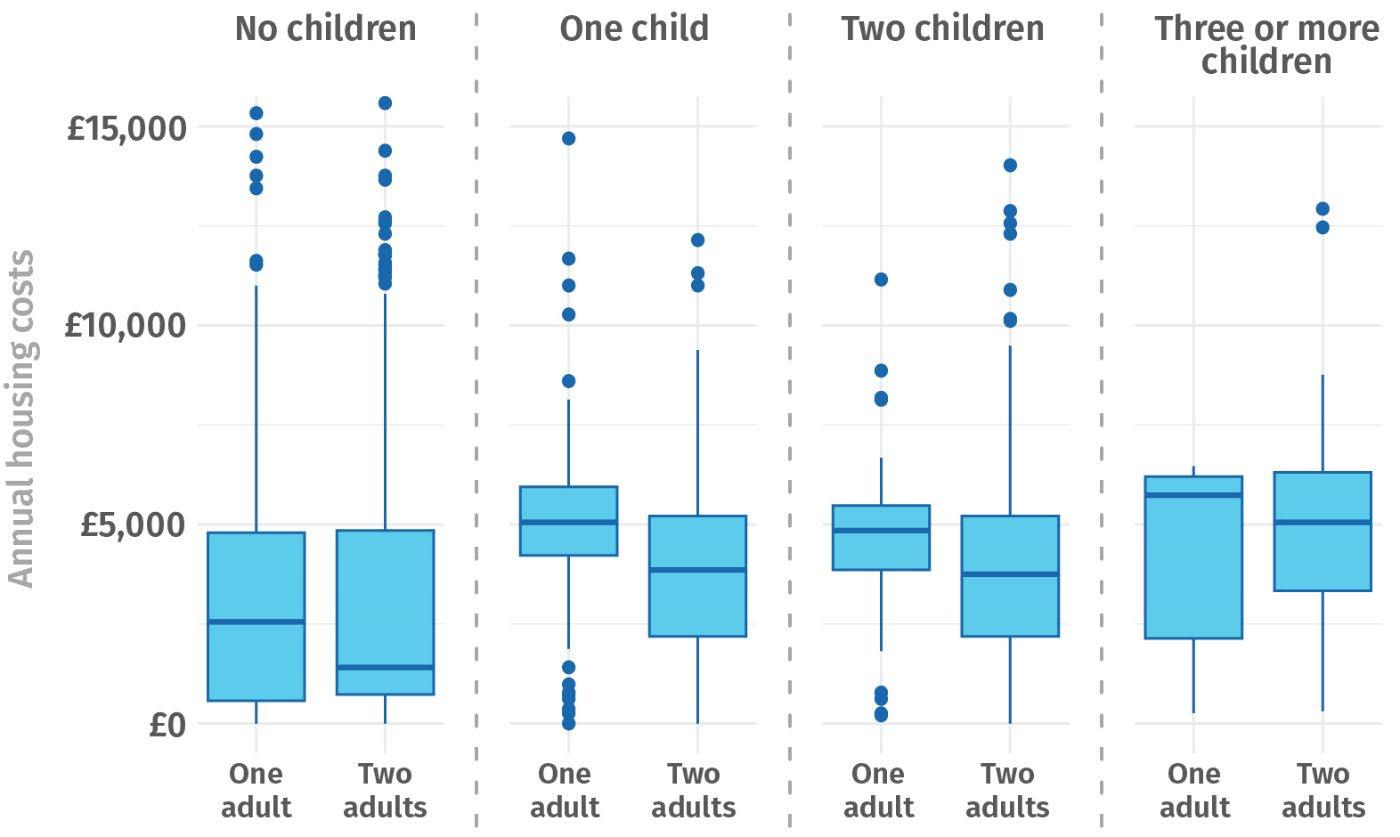
Source: Authors’ analysis of DWP (2024) Households Below Average Income (years 2021/22 and 2022/23 combined). See figure 2.1 for description of boxplot parameters.
In Scotland, not only do families with children tend to have higher housing costs, but also single parent households rarely have particularly low housing costs. This is because only a small minority (19 per cent) of single parents own their home and benefit from the low housing costs this brings. By comparison, three quarters of couple-parent households are homeowners (figure 2.3).
Figure 2.3: Single parents in Scotland are far more likely to be renting than couple-parents
Proportion of households with children by tenure
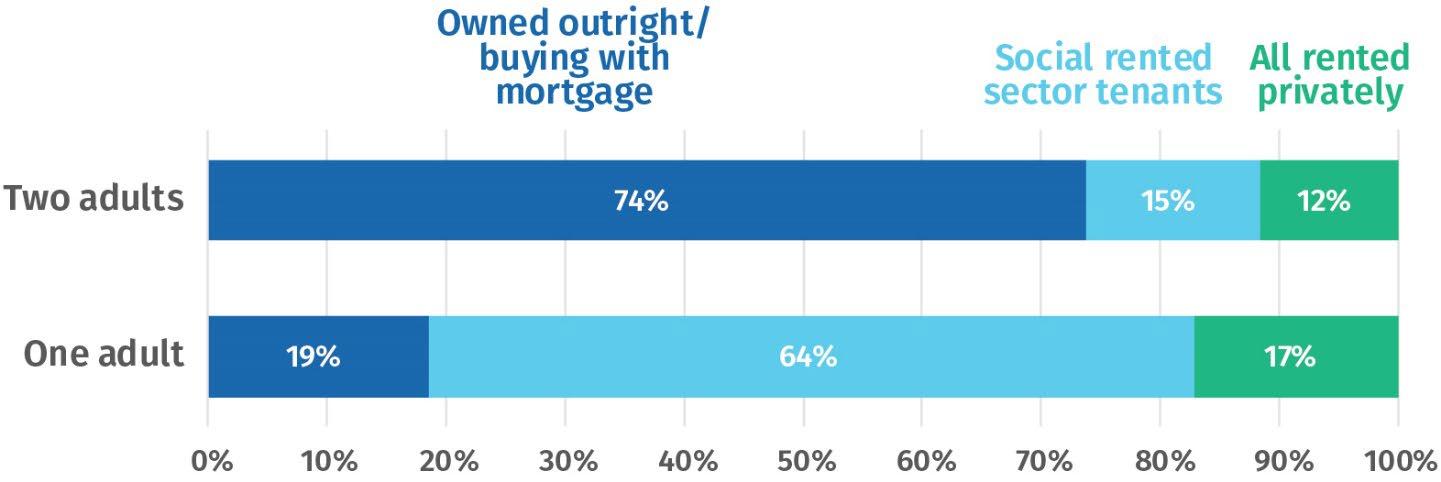
Authors’ analysis of DWP (2024) Households Below Average Income (years 2021/22 and 2022/23 combined).
The amount of money a family needs is naturally related to the number of people in the household. Standard poverty calculations handle this through “equivalisation” – dividing income by an index that aims to capture the different needs of children and adults. If we apply equivalisation to what’s left from parents’ earnings after income tax and national insurance as well as housing costs, we see a clear pattern of low income emerging. As the number of children in a family increases, net earnings are stretched further and so less is available per person.
Families with just one adult have particularly low resources on this measure for three compounding reasons: earnings are low (compared with the higher earner in couple households), just one adult’s earnings must cover housing costs, these costs are rarely low, and the remainder is shared with children.
Figure 2.4: Sharing after-housing cost earnings among household members reduces disposable income for larger families and single parents
Source: Authors’ analysis of DWP (2024) Households Below Average Income (years 2021/22 and 2022/23 combined). Red line at £0 represents the poverty line. Analysis excludes pensioners and households with no earnings. See figure 2.1 for boxplot description.
Figure 2.4 presents an intentionally partial picture of families’ available resources. The major missing factor in these calculations is benefit income, to which we turn in subsequent sections. But figure 2.4 starkly shows that, while work is always going to be an important factor in lifting families’ incomes above the poverty line, by itself there are a great many cases in which more will be needed if poverty is to be eradicated
In particular, well over half of single parent households do not earn enough to get above the poverty line. Clearly, then, having earnings that are too low to stay above the poverty line is not an unusual situation for single parents. That this is such a widespread phenomenon means it can’t be attributed to these parents having unusually low earnings.
Single parents are a particularly stark example of the fact that families may face the risk of poverty even when parents earn a reasonable level of income (in the sense of not being exceptionally low, given the constraints being a parent places on how much people can work). For these families, social security will always play a critical role in keeping total disposable income above the poverty line.
Single parents in Scotland are more likely than couples to report being permanently sick or disabled. Children in these households are even more dependent on the social security system to keep them out of poverty.
Figure 2.5: Single parents in Scotland are more likely than couple-parents to report being long term sick or disabled
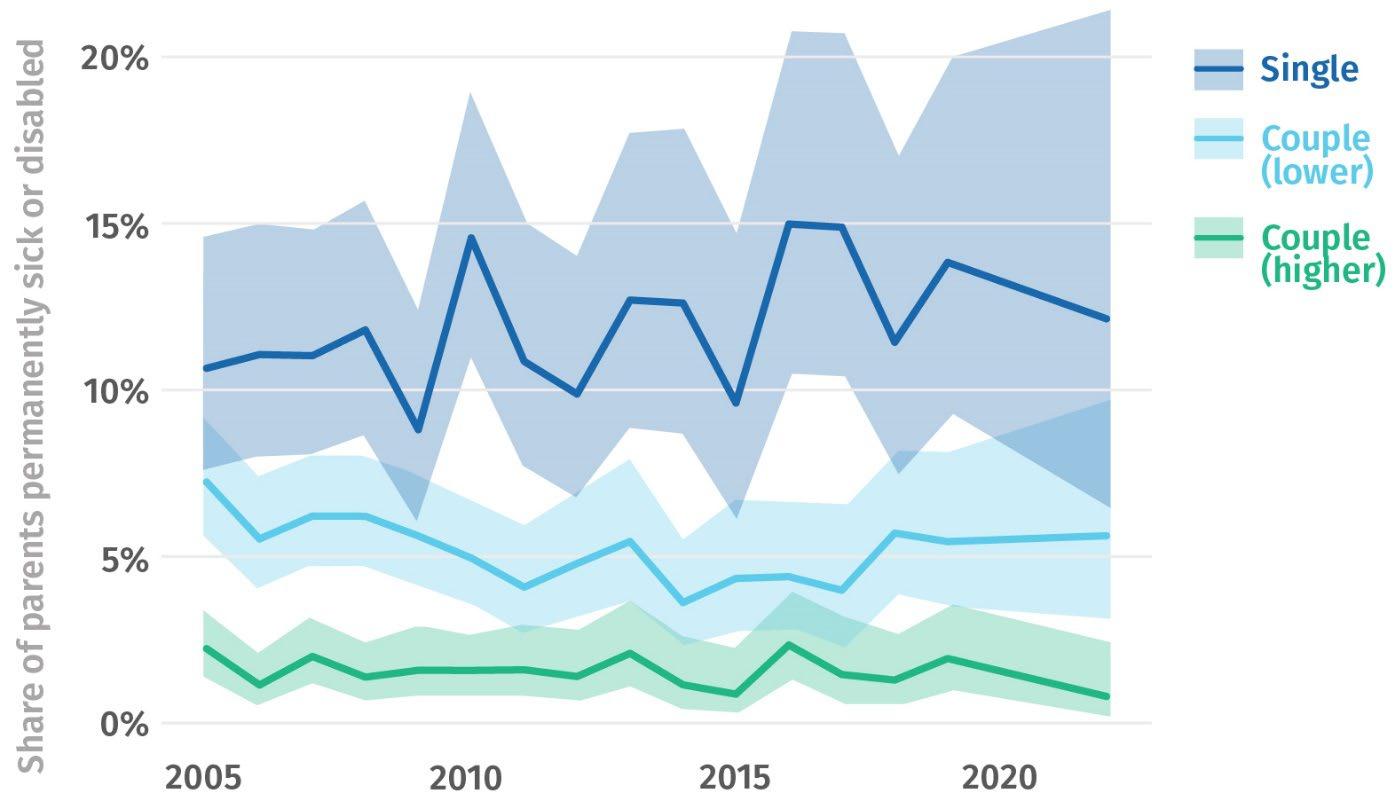
Source: Authors’ analysis of DWP (2024) Households Below Average Income (years 2005/06 to 2022/23, excluding 2020/21 and 2021/22 affected by covid). Shaded region shows 95 per cent confidence interval.
The issue of long term sickness, and the potential role of the design of the benefit system, is a live issue gathering much attention and competing interpretations (Lords Economic Affairs Committee 2025; Murphy 2025). While figure 2.5 shows the period since the pandemic may have seen an increase in parents being long term sick, the difference between single parents and couples is long standing.
Various factors may explain the difference, and different parents will have different experiences. One potential explanation is a higher level of stress faced by single parents dealing with bringing up children alone. Another concerns the role of incapacity benefits in shaping parents’ choices – the risk of losing access to benefits having a greater impact when a family is reliant on just one adult’s income. This is not to accuse single parents of being incentivised to “game the system” – the perception that one is at risk of losing incapacity benefits may itself contribute to poor health, particularly mental health conditions such as anxiety.
There may be scope to better support long term sick parents to find work, whether that be through recovering from sickness or at-work support that means a health condition is less limiting. Further research to better understand why single parents are more at risk of long term sickness would support better targeted help.
While supporting parents into work, where appropriate, is an important policy objective, our modelling suggests the impact on the overall rate of child poverty will be limited. This is due both to the fact that a minority of parents experience long term sickness, and the potential reduction in benefit eligibility may accompany recovery and return to work.
When we exclude people who are sick, single parents and lower-earning couple-parents have very similar patterns of economic activity – similar proportions working full time or part time, and similar proportions are looking after family or home
Figure 2.6: Single parents have very similar patterns of economic activity as the lower earning member of a parent couple, but much higher poverty risks

This suggests that aside from the heightened rates of sickness among single parents, their economic activity is very similar to the parent in couples who primarily takes on the work of raising children. In turn, this indicates it is the needs and capacities of adults and children in the context of Scottish society that shape these patterns.
While patterns of activity are similar, poverty risks are much higher for single parents in each activity group. For part time workers and parents not working, the poverty risk for single parents is around double the risk for a member of a couple. For those in full time work, the risk is around 50 per cent higher. This is due to the dynamics discussed above. This further suggests that patterns of economic activity may be difficult to change, and indeed there are many cases in which it will not be desirable to shift them – to the extent that part time work and looking after family is itself an important contribution to children’s wellbeing.
The discussion above has highlighted how different family structures and parents’ work patterns mean the disposable earnings available to support children vary systematically. Of course, the disposable income available includes money received in benefits like child benefit and universal credit (UC).
While the design of UC is complex, two features of it are relevant to understanding its role in shaping the risk of poverty across families: allowances and the taper. The basic amount of UC for which a family is eligible reflects the composition of the family, with different amounts for single adults and couples, and additional amounts for children. This means in broad terms that adding a UC award to a family’s income can reverse the patterns seen in figure 2.4. In principle, this differentiation is a potential means to address the issues that lead different families to have different disposable incomes even if their earnings are similar.
The ”U” in universal credit does not mean it is a payment that all families receive – it is targeted at families whose non-benefit income is low. If a hard threshold determined whether a family could receive support, this would create a cliff edge – a family whose non-benefit income was just below the threshold would face a huge reduction in total income if their earnings increased a small amount. To avoid this cliff edge, UC tapers benefit payments as families’ earnings increase. For every additional (after tax) £1 a family earns, its UC award is reduced by 55p. 5
One effect of tapering is that the difference in incomes between UC recipients is smaller than the difference in their earnings. If two otherwise identical families have a difference in earnings of £10 per week (after tax), the taper means the difference in their income will be £4.50.
Therefore, the disposable incomes of families who receive universal credit turn out to be quite similar across different family configurations. The distribution of incomes is both consistent across different family types and lies close to the poverty line.
5 The system is actually more complex than this as some UC recipients have a ‘work allowance’ – an amount they can earn before their UC award begins to be tapered.
Figure 2.7: Households receiving universal credit have similar equivalised disposable incomes across different family configurations
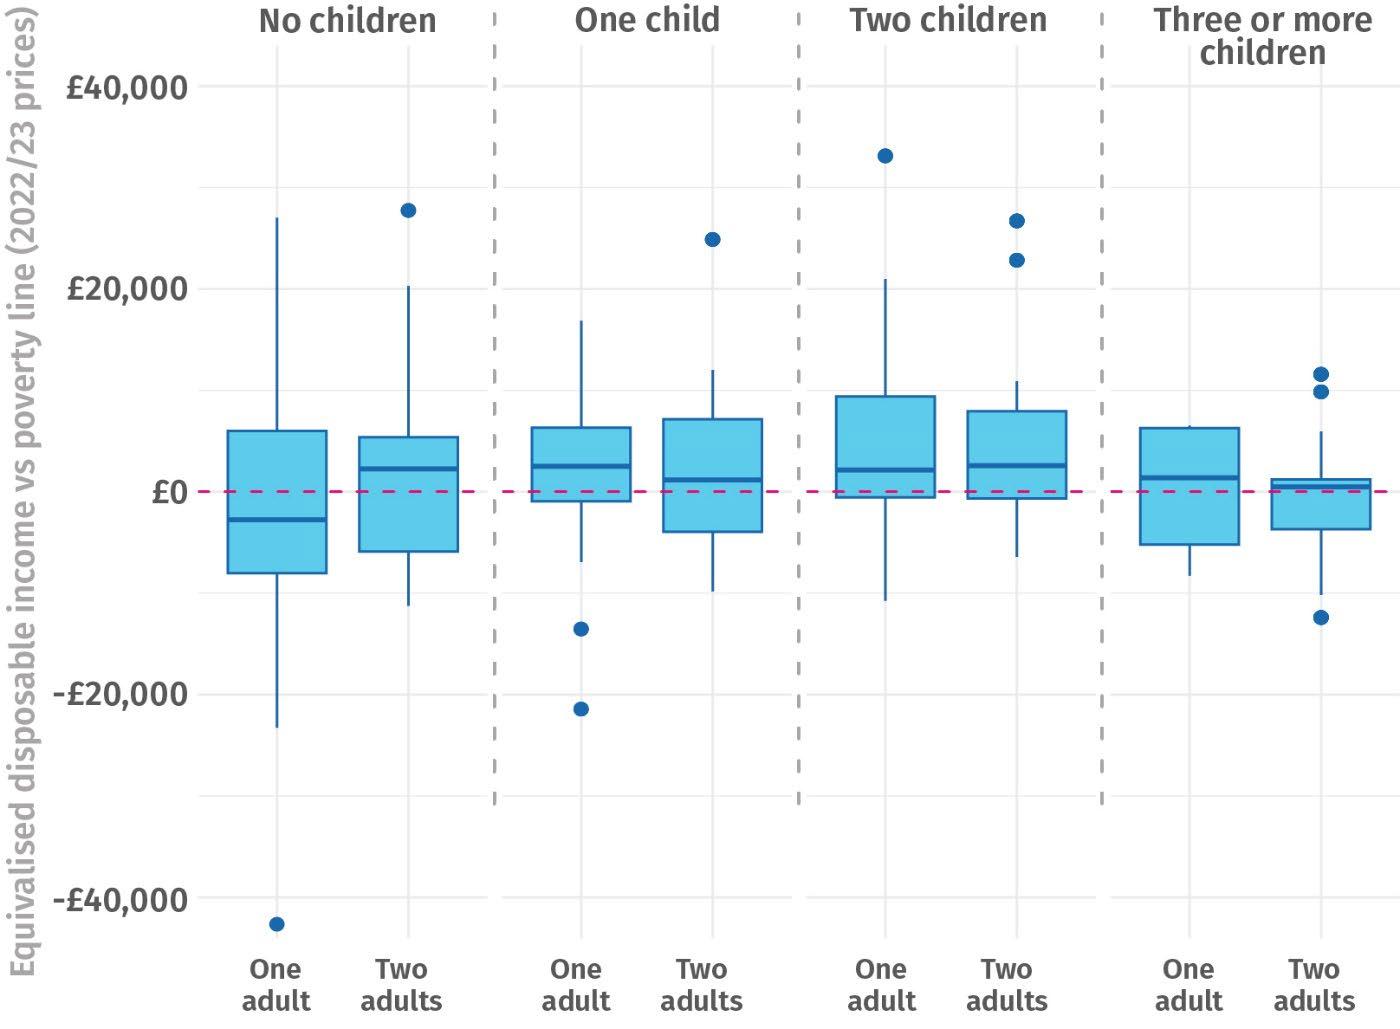
Source: Authors’ analysis of DWP (2024) Households Below Average Income (years 2021/22 and 2022/23 combined). Red line at £0 represents the poverty line. Analysis excludes households with more than one benefit unit. See figure 2.1 for boxplot description.
This could be regarded as a positive feature of the way the benefits system is designed. It responds to families’ different circumstances and tends to combine with earnings to lift incomes to a region around the poverty line, with many families lifted above that threshold. This is not to say the system is perfect, as many children are, of course, still below the poverty line after all benefits have been taken into account.
There is a major exception to the notion that UC broadly brings families’ incomes to the same level in relation to the poverty line, namely the two-child limit. A family affected by the limit will have the same total income as an otherwise equivalent family with two children but will have to share this income more thinly. This cannot but increase the number of children experiencing poverty, but we should be clear eyed about the scale of this in the context of the wider prevalence of child poverty. The Scottish government estimates that mitigating the two-child limit in Scotland will reduce the number of children in poverty by 15,000, or about 6 per cent of the 240,000 children in poverty in 2020-23.
The similarity of disposable incomes across families who receive UC has implications for how we should interpret different poverty rates across different groups. If the benefit
system broadly results in different groups having similar poverty risks when they receive their full entitlement, the causes of different groups having different poverty risks must lie elsewhere: some combination of (a) the risk that a family’s non-benefit income is low enough to be eligible for UC, and (b) the proportion of those families who do not receive their full benefits entitlement.
Our analyses of work, earnings, housing costs and income sharing above show why larger families and single parent families are more likely to have incomes low enough to be eligible for UC. Figure 2.8 shows a significant proportion of the child poverty total comes from couple families who do not receive universal credit (or equivalent benefits). Families in poverty may not receive UC for a variety of reasons, including a lack of awareness of entitlement, a reluctance to apply which may be based in perceived stigma, or being ineligible, for example, due to a family’s immigration status.
Figure 2.8: A large share of children in poverty in Scotland have couple parents who do not receive universal credit (or equivalent benefits that precede universal credit)
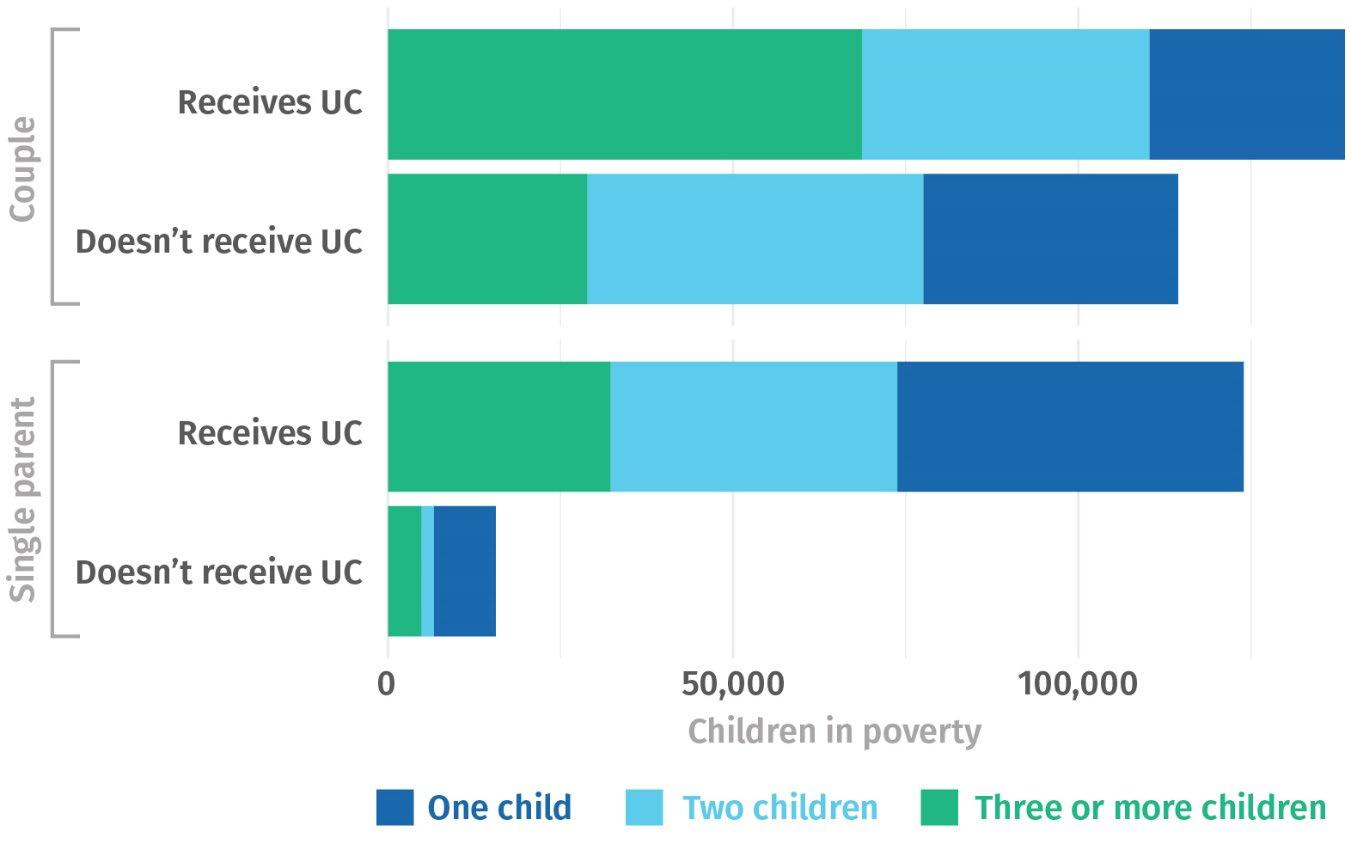
Source: Authors’ analysis of DWP (2024) Households Below Average Income (years 2021/22 and 2022/23 averaged).
Increasing take-up of benefits would help reduce the child poverty rate. Naturally, this would increase spending on universal credit and the Scottish child payment. It could be achieved through information campaigns and efforts to reduce stigma. The Scottish government’s approach to social security, grounded in the principles of dignity and respect, is intentionally de-stigmatising. However, as universal credit is a reserved benefit there are limits to how impactful devolved policy can be.
It should be noted that the number of children not receiving UC complicates our understanding of child poverty in Scotland, as the underlying survey – the Family
Resources Survey – is known to undercount the number of people receiving benefits, whether due to underreporting among survey recipients or other methodological challenges. While this means the estimate of the number of children in poverty who do not receive UC likely overstates the true number, the difference between single parents and couples in figure 2.8 likely is not a result of the FRS undercounting benefit recipients.
The eradication of child poverty is, in the words of the first minister, “the single most important objective” of the Scottish government (Swinney 2024). It is indeed an important objective to support a flourishing society and end the harms caused by poverty (Whyte et al 2023).
The importance of this agenda and the emphasis the Scottish government places on it do not mean it is straightforward to achieve. This briefing has explored the dynamics of child poverty and the prospects for meeting the Scottish government’s 2030 target. We find that, even if we push our assumptions about increased wages and employment to their outer limits, too many children will still experience poverty in 2030. The inescapable conclusion is that hitting the 2030 target will be nigh on impossible without additional fiscal commitments. The most direct route to achieving this would be to increase benefits payments to families in or at risk of poverty
It is worth underscoring why. There are some very basic, but often overlooked, economic dynamics that underpin stubbornly high rates of child poverty. Parents’ earnings from work obviously make an important contribution to keeping a family’s income above the poverty line, but they are not always enough. Being a parent takes time and energy, meaning there is less scope to generate income through earnings, and households with children have to share their income among more people. Social security will always have a role in supporting the incomes of children, for the same reason social security, in the form of pensioner benefits, will always have a role to support the income of retirees. The labour market distributes income only to workers, so the social security system is necessary to distribute income to those who cannot work, including those who are too young as well as those who are too old.
This sets a clear challenge to Scottish policymakers. The Scottish government is in the early stages of developing its next child poverty delivery plan to cover the period up to 2030. For that plan to be credible, it needs to set out clearly not just the actions the Scottish government will take to reduce child poverty, but also what impact it expects these actions to have. If, as we anticipate, this pathway analysis shows the target is unachievable without additional fiscal resource, this should be the starting point for a much clearer debate in Scotland about the right balance between tax and spending.
Andrew A, Bandiera O, Costa Dias M and Landais C (2021) 'Women and men at work' in IFS Deaton Review of Inequalities. https://ifs.org.uk/inequality/women-and-men-at-work/
Bol D (2025) 'John Swinney rules out further hikes to flagship Scottish Child Payment - here’s why' . Scotsman. https://www.scotsman.com/news/politics/john-swinney-scottish-child-payment-snpchild-poverty-4968586
Clegg A and Corlett A (2025) Turning the tide: what it will take to reduce child poverty in the UK. https://www.resolutionfoundation.org/publications/turning-the-tide/ [Accessed 12 March 2025]
Cominetti N and Murphy L (2024) Calculating the Real Living Wage for London and the rest of the UK: 2024. https://www.resolutionfoundation.org/publications/calculating-the-realliving-wage-2024/
Department for Work and Pensions [DWP] (2024) Households Below Average Income, 1994/952022/23, dataset
Lords Economic Affairs Committee, (2025) Urgent action needed to tackle the spiralling costs of the health benefit trap. https://committees.parliament.uk/committee/175/economic-affairscommittee/news/204794/urgent-action-needed-to-tackle-the-spiralling-costs-of-the-healthbenefit-trap/
Murphy L (2025) Delivering the undeliverable: Five principles to guide policy makers through reforming incapacity and disability benefits, Resolution Foundation. https://www.resolutionfoundation.org/publications/delivering-the-undeliverable/
Scottish government (2024a) Poverty and Income Inequality in Scotland 2020-23, dataset. https://data.gov.scot/poverty/
Scottish government (2024b) Scotland’s Devolved Employment Services: Statistical Summary May 2024, dataset. https://www.gov.scot/publications/scotlands-devolved-employment-servicesstatistical-summary-may-2024/
Swinney J (2024) Priorities for Scotland: First Minister’s statement. https://www.gov.scot/publications/first-ministers-priorities-scotland/ [Accessed 16 March 2025]
Whyte P, Hawkey D and Smith C (2023) Tipping the scales: The social and economic harm of poverty in Scotland, IPPR Scotland. https://www.ippr.org/articles/tipping-the-scales
IPPR Scotland shapes public policy in pursuit of a fairer, greener, more prosperous Scotland.
Through policy, research, and communications, we work to create tangible progressive change, and turn bold ideas into common sense realities. We are cross-party and neutral on the question of Scotland’s independence – but not on the question of Scotland’s future.
IPPR, the Institute for Public Policy Research, is an independent charity working towards a fairer, greener, and more prosperous society. We are researchers, communicators, and policy experts creating tangible progressive change, and turning bold ideas into common sense realities. Working across the UK, IPPR, IPPR North, and IPPR Scotland are deeply connected to the people of our nations and regions, and the issues our communities face.
We have helped shape national conversations and progressive policy change for more than 30 years. From making the early case for the minimum wage and tackling regional inequality, to proposing a windfall tax on energy companies, IPPR’s research and policy work has put forward practical solutions for the crises facing society.
E: info@ippr.org www.ippr.org
Registered charity no: 800065 (England and Wales), SC046557 (Scotland)
This paper was first published in March 2025. © IPPR 2025
The contents and opinions expressed in this paper are those of the authors only.
The progressive policy think tank