
International Research Journal of Engineering and Technology (IRJET) e-ISSN: 2395-0056
Volume: 11 Issue: 12 | Dec 2024 www.irjet.net p-ISSN: 2395-0072

International Research Journal of Engineering and Technology (IRJET) e-ISSN: 2395-0056
Volume: 11 Issue: 12 | Dec 2024 www.irjet.net p-ISSN: 2395-0072
Prof. Sathish H1 , Anish Rajendra Gaikwad2 , Darshan T V3, Gokul R4, Mohammed Rayan Habeeb5
1Assistant Professor, Dept. of Mechanical Engineering, MIT Mysore, Karnataka, India 2-5Undergraduate students, Dept. of Mechanical Engineering, MIT Mysore, Karnataka, India ***
Abstract - This study explores the aerodynamic performance of a 2D sports car model using Computational Fluid Dynamics (CFD). A wind tunnel simulation with a 12 m × 45 m test section modeled airflow around the car at 20 m/s. The investigation included geometry definition, structured meshing, and numerical analysis in ANSYS Fluent to assess static pressure and velocity contours, drag forces, and areas for design optimization. Results indicatedhigh-pressurezones at the front stagnation point and low-pressure regions over the roof, consistent withstreamlinedairflow.Velocitycontours revealed accelerated flow over the roof and wake regions at the rear, highlighting flow separation and potential areas for improvement. The drag coefficient converged at 0.012, while the drag force stabilized at 70 N, showcasing the car’s aerodynamic efficiency. The study demonstrates the effectiveness of CFD in optimizing vehicle design by reducing drag and improving performance. These findings provide valuable insights into fuel efficiency, speed, and stability enhancements for high-performance sports cars, laying a foundation for future innovations in automotive aerodynamics.
Key Words: Externalflows,CFD,dragforce,dragcoefficient, 2D-Sportscar,Aerodynamics,ComputationalFluidDynamics.
In the modern automotive industry, achieving superior aerodynamic performance is paramount for optimizing vehicle efficiency, speed, and sustainability. This paper delvesintothecomputationalstudyofairflowaroundatwodimensional (2D) sports car model, employing ComputationalFluidDynamics(CFD)techniques.CFDserves asapivotaltool,enablingtheanalysisandsimulationoffluid flow phenomena that are often challenging to replicate throughphysicalexperiments.
The study's primary focus is on analyzing aerodynamic characteristics, including drag coefficient, drag force, and flowpatternsaroundthecarmodel.Utilizingtoolssuchas ANSYSFluent,acomprehensivesimulationwasconductedin a virtual wind tunnel environment. This setup included a streamlined car geometry, well-defined boundary conditions, and turbulence modeling to ensure accurate predictionsofreal-worldbehavior.
Keyoutcomesoftheresearchdemonstratetheeffectiveness of CFD in identifying and mitigating aerodynamic inefficiencies.Byvisualizingflowpatternsandquantifying aerodynamicforces,thisworkprovidesactionableinsights forenhancingthedesignofhigh-performancevehicles.The findings contribute to the broader goal of reducing aerodynamic resistance, thereby advancing the fields of energyefficiencyandautomotiveengineering.
Computational Fluid Dynamics (CFD) has emerged as a transformative tool in modern engineering and science, enablingthesimulationandanalysisofcomplexfluidflow phenomena with remarkable precision. By solving the governingequationsoffluidmotion suchasthecontinuity, momentum, and energy equations CFD provides a computationalframeworktomodelthebehavioroffluidsin diverse scenarios, from aerospace and automotive applicationstobiomedicalandenvironmentalengineering.
The core strength of CFD lies in its ability to address challengesthatareeitherimpracticalorcost-prohibitiveto explore experimentally. Using numerical methods and computational algorithms, it transforms physical domains intodiscretegridsormeshes,wherefluidpropertiessuchas pressure, velocity, and temperature are computed. This process offers insights into intricate flow patterns, turbulence characteristics, and heat transfer mechanisms, guidingtheoptimizationofdesignsandprocesses.
Despite its advantages, CFD is not without challenges. Accuratesimulationsdemandhigh-qualitymeshgeneration, careful selection of turbulence models, and the implementation of precise boundary conditions. Furthermore,thecomputationalcostassociatedwithhighfidelity simulations remains a significant consideration, particularly for problems involving large-scale or highly dynamicflows.
This paper explores the application of CFD in analyzing aerodynamic properties of a two-dimensional sports car model, emphasizing its role in predicting drag forces, visualizing flow behavior, and optimizing vehicle performance.ThestudyhighlightstheversatilityofCFDin bridging the gap between theoretical fluid mechanics and
International Research Journal of Engineering and Technology (IRJET) e-ISSN: 2395-0056
Volume: 11 Issue: 12 | Dec 2024 www.irjet.net p-ISSN: 2395-0072
practical engineering applications, underscoring its indispensabilityincontemporaryresearchanddevelopment.
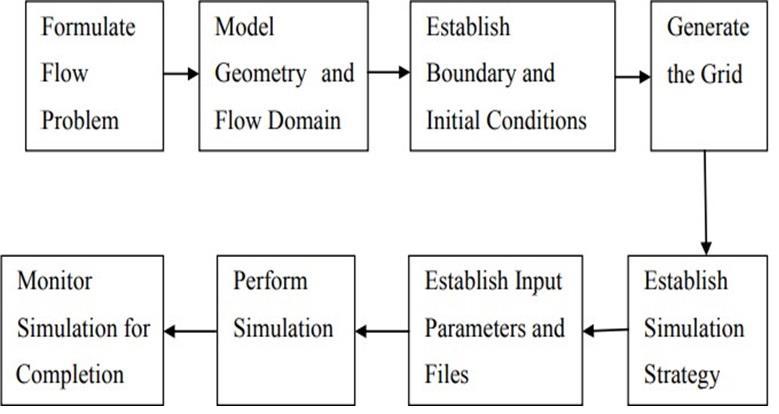
Fig -2.1:StepsinvolvedinCFD
2.1 About the project
The project involves simulating airflow over a 2D crosssection of a sports car traveling at 72 km/h. Using specialized software (Ansys Fluent), the simulation setup includesimportingpre-definedmeshfilesandperformingan analysisofdragforcesofsportscar.Thisapproachhighlights the potential for design optimization, enabling the development of vehicles with reduced aerodynamic resistanceandenhancedperformance
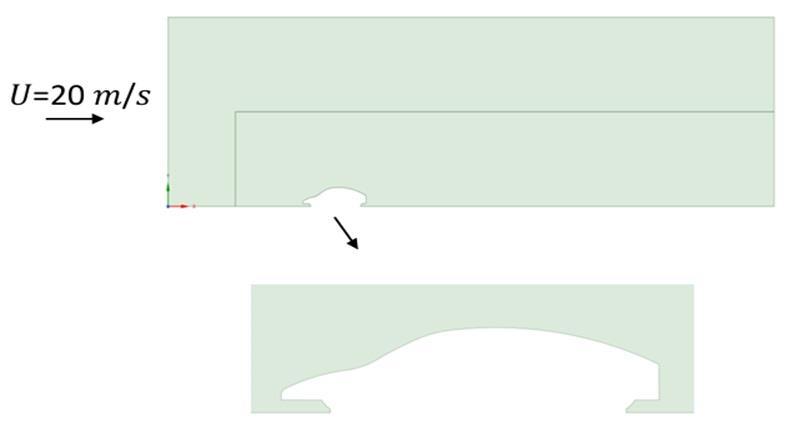
Fig -2.1:Problemdescription
Thewindtunnelmodelsetupcomprisesa12mx45mtest sectiondesignedtosimulatereal-worldwindconditions.A referencecarmodelwithdimensionsof5meterinlength, 2.34m2 frontalarea,and1.8metersdepthisplacedwithin this section. This configuration enables the study of aerodynamic characteristics like drag and lift. The wind tunneldata,coupledwithCFDsimulations,providesvaluable insightsforautomotiveengineerstorefinevehicledesigns andimproveoverallaerodynamicperformance.
Incompressible flow: Sinceforinletvelocityof20m/s whichcorrespondstoMachnumberof0.06,effectsofair compressibility are, in general, negligible when Mach numberislessthank0.3
Turbulent flow: Since the Reynolds number is Re = 6.4*10^6
Steady flow: The variables like velocity, pressure, density, and temperature remain constant at a fixed locationastimeprogresses
Density of air,ρ_air=1.225kg⁄m^3
Viscosity of air,μ_air=1.7894×10^-5kg⁄m-s
MachNumberis0.06correspondstoinletvelocityof 20m/s
3.3 Boundary conditions
Thevariousboundaryconditionsareasfollows:
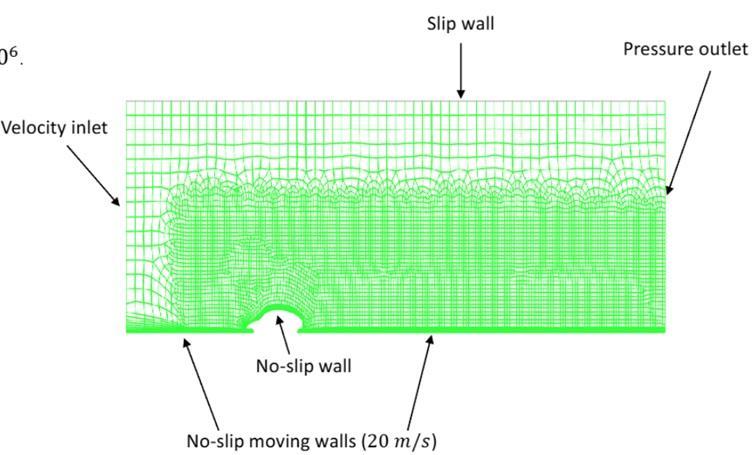
Fig -3.3:Boundaryconditions
Table -3.3: Boundarypatchesandconditions
International Research Journal of Engineering and Technology (IRJET) e-ISSN: 2395-0056
Volume: 11 Issue: 12 | Dec 2024 www.irjet.net p-ISSN: 2395-0072
The primary objective of this mini-project is to conduct a comprehensivenumericalsimulationofairflowaroundacar modelinawindtunnel.Thisanalysisaimsto:
1. Validate the Numerical Model: Ensuretheaccuracyof the simulation by checking mass conservation (continuityequation).
2. Visualize Flow Patterns: Generate contour plots of static pressure and velocity magnitude to understand theflowfieldaroundthecar.
3. Analyze Flow Vectors: Plot velocity vectors to visualize the direction and magnitude of flow at differentpoints.
4. Quantify Aerodynamic Drag: Calculatepressure drag,viscousdrag,coefficientofdrag,andthetotal dragforceactingonthecar
5. METHODOLOGY
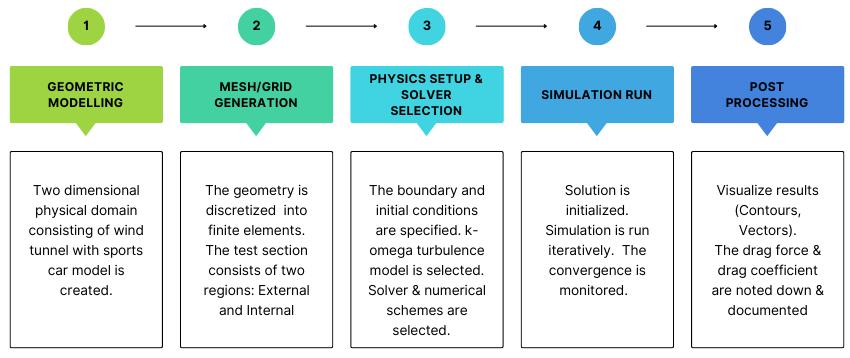
6.1 Geometric Modelling
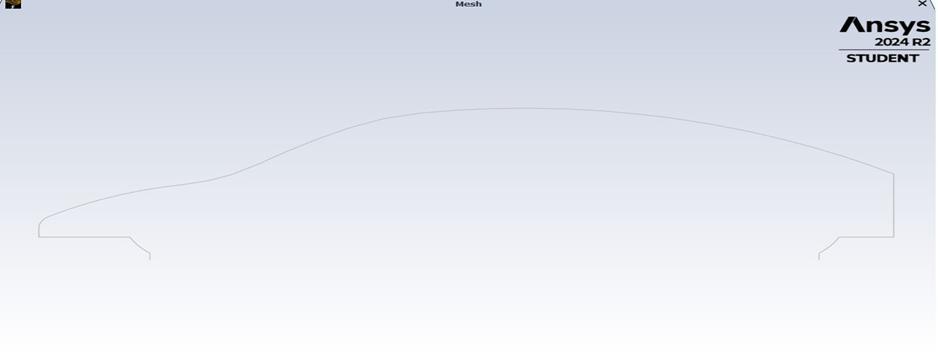
Fig -6.1:2DSportscargeometry
Thewindtunnelsetupfeaturesatestsectionmeasuring12 meters in width and 45 meters in length, specifically designedtoreplicatereal-worldwindconditions.Withinthis section, a reference car model is positioned, having dimensionsof5metersinlength,afrontalareaof2.34m², anda depthof1.8meters.AfterthecreationofGeometric model using the required coordinates, creation of parts is done corresponding to the boundaries. Association of the entitiestothegeometryisalsoDone.
Thewholeofthetestsectionconsistsoftworegions:
External:
Wheremeshislessrefined(Consistingofcoarseelements)
Internal:
Themeshismorerefined(Consistingoffineelements)
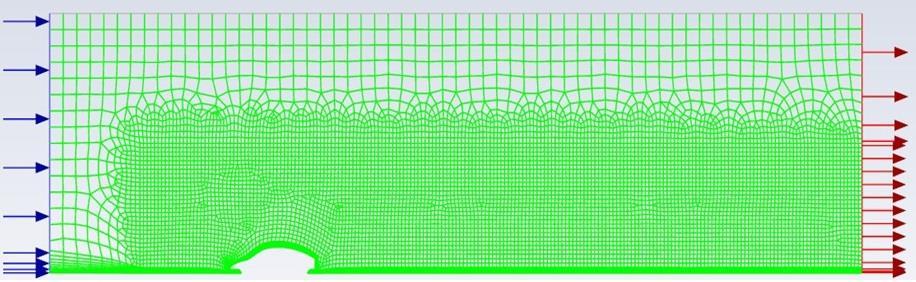
Fig -6.2.1:Meshgeneration
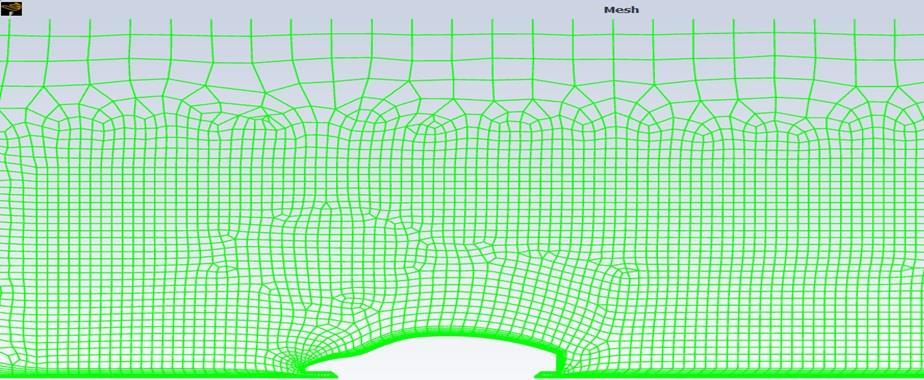
Fig -6.2.2:Meshgeneration~zoomedview
7. Results and Discussions:
Theresultsconsistofresidualswhichquantifyhowfarthe current solution deviates from satisfying the governing equations. The Velocity magnitude contours visualize the distribution of flow speed around a 2D car, highlighting accelerationzones,separationregions,andboundarylayer effectscriticalforunderstandingaerodynamicperformance ThePressurecontoursof2Dcarrevealareasofhighandlow static pressure, indicating stagnation points, pressure gradients,andrecoveryzonesthatdirectlyimpactlift,drag, and flow stability. The velocity vectors illustrate the directionandmagnitudeofflow,providinginsightintoflow patterns,recirculationzones,andboundarylayerbehavior around the 2D car model Also results involves the calculation of drag force, quantifies the aerodynamic resistance experienced 2D sports car, while the drag coefficient is a dimensionless measure of its efficiency in minimizingdragrelativetoitsshapeandflowconditions.
International Research Journal of Engineering and Technology (IRJET) e-ISSN: 2395-0056
Volume: 11 Issue: 12 | Dec 2024 www.irjet.net p-ISSN: 2395-0072
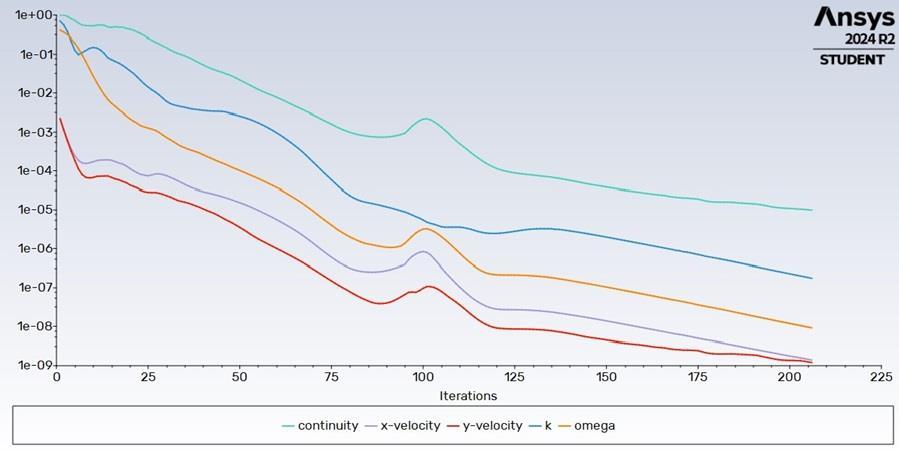
Fig -7.1:
The residuals of continuity, x-velocity, y-velocity, k and omegaareasshownintheFig-7.1:Theobservationsfrom theresidualplotsareasfollows.
General Trend: All residuals (continuity, x-velocity, yvelocity,kandomega)decreaseoveriterations,which indicatesthesolutionisconverging.
Continuity Residuals: Thecontinuityresidual(lightblue line)decreasesbutstabilizesatahighervaluethanthe other parameters. This may indicate slight mass conservationissuesorthatfurtherrefinementisneeded forbetterconvergence.
Velocity Components: Residuals for x-velocity (orange line) and y-velocity (red line) drop significantly and stabilizebelow,thissuggeststhatmomentumequations arewellresolved.
Turbulence Parameters (k and omega): Theturbulence parameters (k and omega) also converge well. Stabilizingbelow.Thisindicatesgoodresolutionofthe turbulencemodel.
Number of Iterations: Converges:Convergenceappears to occur around 175 to 200 iterations, indicating reasonablecomputationalsetup
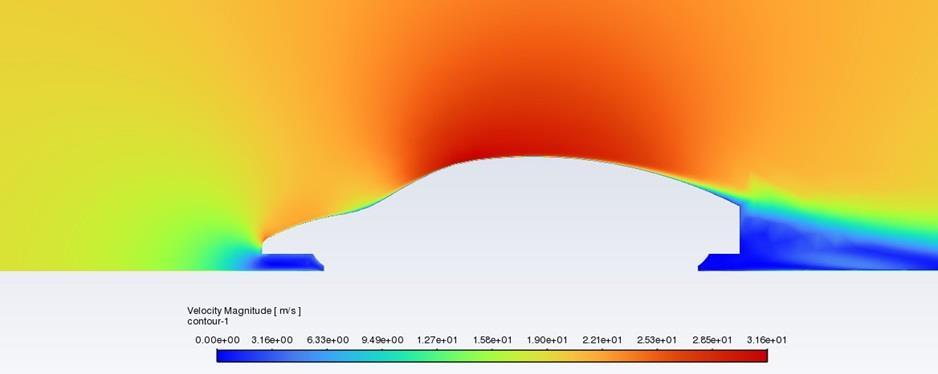
Thevelocitymagnitudecontoursaroundthe2Dsportscar are shown in Fig-7.2. The observations from the velocity magnitudecontoursareasfollow.
Highvelocityregionovertheroof: Theredtoorangecolor abovethecarindicatesairflowaccelerationovertheroof. Thissuggestsastreamlinedflowbutmightalsocauselift, dependingonthepressuredistribution.
Flowseparationat therear: Theblue/greenregionatthe rear of the car could indicate flow deceleration and potential separation, which increases drag. This separationzonesuggestsopportunitiestooptimizethe car’s rear design (example adding a diffuser or optimizingthetailshape)
Lowvelocityregionnear theground: Theblueregionnear thebaseofthecarshowshowvelocitiesduetoboundary layereffects.Thismightleadtoincreasedpressuredrag ifnotcarefullydesigned.
Gradient and transition zones: Observethesmoothcolor transitionfromgreentoorangeorredaroundthefront hood and windshield. This indicates gradual velocity changes,whichisfavorableforreducingthedrag.
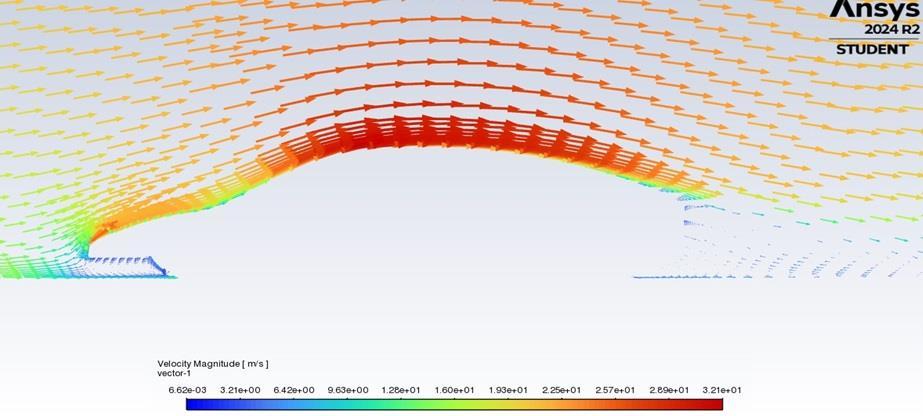
Fig -7.3:Velocityvectors
Thevelocityvectorsaroundthe2Dsportscarareshownin Fig-73. The observations from the velocity vectors are as follow.
Accelerated Flow over the Roof (Red Region): Theairflow accelerates significantly over the roof of the car, as indicatedbythedenselypackedandelongatedvectors withhighvelocity(redregion).Thisisacharacteristicof streamlined flow over a curved surface, reducing pressure(asperBernoulli'sprinciple).
Stagnation at the Front (Blue Region): Theblueregionat the front of the car shows minimal velocity due to stagnation.Thiscorrespondstothehigh-pressurezone observedinthestaticpressureplot.
WakeRegionat theRear: Behindthecar,vectorsbecome lessuniformandexhibitrecirculationzones,indicating
International Research Journal of Engineering and Technology (IRJET) e-ISSN: 2395-0056
Volume: 11 Issue: 12 | Dec 2024 www.irjet.net p-ISSN: 2395-0072
flow separation and wake formation. This wake contributes to drag and is an area for aerodynamic optimization.
Ground Flow Interaction: Nearthegroundandthecar's base, airflow vectors indicate boundary layer effects. Velocitydecreasesnearthesurfacedueto frictionand theno-slipcondition.
Flow Direction Consistency: Overall, the vector field showswell-directedflowwithnosignificantturbulence except in the rear wake, indicating a relatively clean aerodynamicprofile
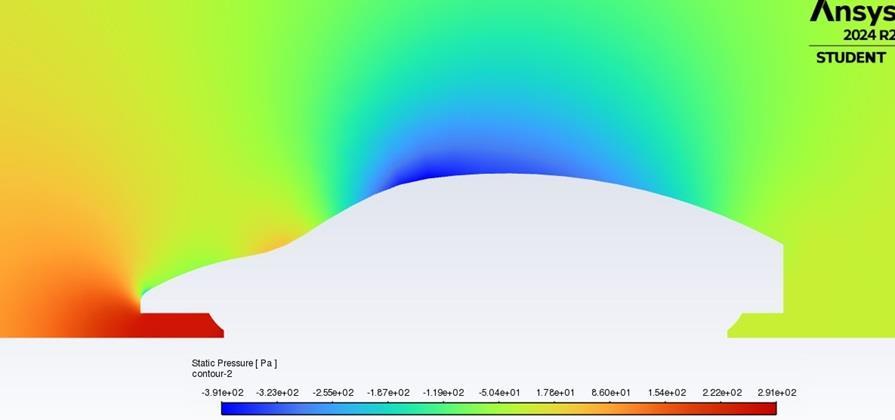
Fig -7 4:Staticpressurecontours
The static pressure distribution around the car exhibited expectedtrends.Observationsfromthestaticpressureplot areasfollows:
High pressure region wasobservedatthefrontstagnation point of the car (red zone): The red region atthecar’s front indicates a stagnation zone where the airflows slow down and pressure increases. This contributes significantlytothedragforce.
Low pressure region over the roof (blue zone): Theblue zone indicates air flow acceleration over the car, reducingstaticpressure.
Pressure gradient transition from the front to rear: The gradualtransitionfromhightolowpressurealongthe carsbodysuggestssmoothairflowattachment.
Rear pressure zone: Thegreen/yellowregionattherear indicatesmoderatepressurerecovery.
Ground pressure: Theconsistentpressurenearthebase ofthecarindicatestheboundarylayereffect.
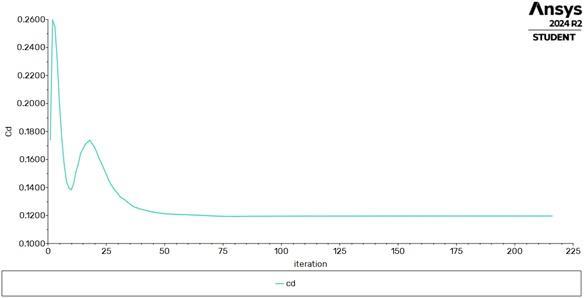
Chart -7.5:Dragcoefficient
Initial Oscillations: Thedragcoefficientstartsatahigh value (~0.26) and shows oscillations during the early iterations.Thisbehaviorindicatesthesolveradjusting toinitialflowconditions.
Convergence: Afteraround50iterationstheoscillations reduce significantly, and stabilizes. By approximately 200iterations,thesimulationreachesasteadystate.
Final Drag Coefficient: The converged value is approximately0.02,representingthecar’saerodynamic dragundersteadyconditions.
Aerodynamic Performance: Thedragcoefficientof0.02is verylow,highlightingthestreamlineddesignofthe2D sportscarmodel.Thisindicatesexcellentaerodynamic efficiency,reducingdragforces.
Practical Insight: Low drag improves vehicle speed, stability,andfuelefficiency,whicharecrucialforsports carperformance.
TheDragforceVs.numberofiterationsisasshowninthe Chart7.6.
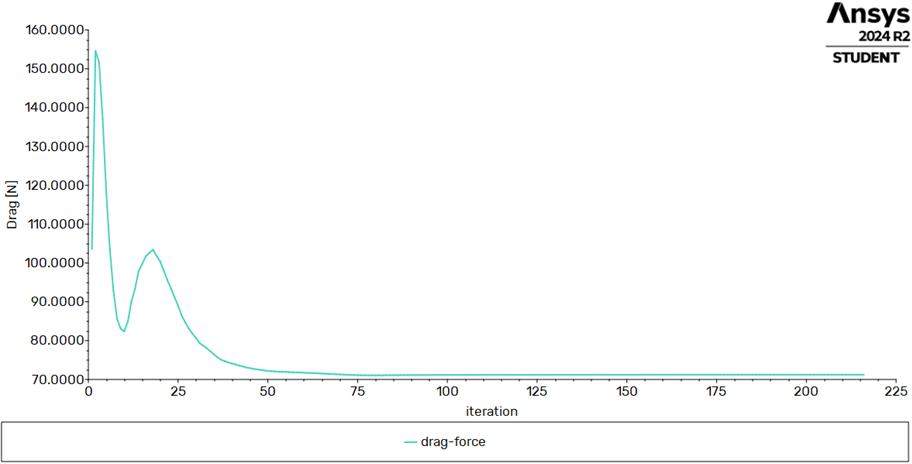
Chart -7.6:Dragforce
International Research Journal of Engineering and Technology (IRJET) e-ISSN: 2395-0056
Volume: 11 Issue: 12 | Dec 2024 www.irjet.net p-ISSN: 2395-0072
Initial Oscillations: Thedragforcestartsatahighvalue (~160N)andshowssignificantfluctuationsintheearly iterations.
Convergence: After approximately 50 iterations, the oscillationsdiminish,and thedragforce stabilizes. By around 200 iterations, the solution converges to a steadyvalue.
Final Drag Force: The converged drag force is approximately 70N, representing the aerodynamic resistanceexperiencedbthe2Dsportscarmodel.
Relation to Aerodynamics: Thereduction in dragforce highlights the streamlined design’s effectiveness in minimizingaerodynamicresistance.
Practical Insight: Alowerforcedirectlyimprovesvehicle performance by enhancing fuel efficiency, speed, and stability. This is particularly crucial for sports cars to achievehighspeedefficiency.
[1] Y. A. Cengel and J. M. Simbala, “Fluid Mechanics –Fundamentals & Applications” 2nd ed., McGraw-Hill, 2010.
[2] HSathishandKJYogeshKumar, “Computational Fluid Dynamics - Laboratory Manual,” MIT Mysore, unpublished.
[3] R.K.Bansal, “FluidMechanics&HydraulicMachines” 9th ed.,LaxmiPublications,2005.
[4] B. R. Munson and D. F. Young, “Fundamentals of Fluid Mechanics” Wiley,2013.
[5] W.-H.Hucho, “Aerodynamics of Road Vehicles, fromFluid Mechanics to Vehicle Engineering” Butterworth & Co. Ltd.,1987.
[6] J. D. Anderson, “Fundamentals of Aerodynamics” McGraw-Hill,2001.
[7] ANSYS, “ANSYSTutorials” version19.2,Canonsburg,PA, ANSYSInc.,2018.
[8] M.PericandJ.H.Ferziger, “Computational Methods for FluidDynamics” Springer-Verlag,1996.