
International Research Journal of Engineering and Technology (IRJET) e-ISSN: 2395-0056
Volume: 11 Issue: 12 | Dec 2024 www.irjet.net p-ISSN: 2395-0072

International Research Journal of Engineering and Technology (IRJET) e-ISSN: 2395-0056
Volume: 11 Issue: 12 | Dec 2024 www.irjet.net p-ISSN: 2395-0072
KAMAL NABH TRIPATHI1, Surendra Roy2, Mohd Raish Ansari3
1Department of Civil Engineering, Babu Banarasi Das University, Lucknow, India, 2Department of Civil Engineering, Babu Banarasi Das University, Lucknow, India, 3Department of Civil Engineering, Jahangirabad Institute of Technology, Barabanki, India, ***
Abstract - Rapid population growth, urbanization, and industrial expansion, many countries are experiencing increasedenvironmentalpollution,whichnegativelyimpacts both quality of life and ecological systems. These pollutants often enter the soil through various channels, such as improper waste disposal, industrial and urban wastewater discharge, sewage sludge, pesticides, fertilizers, and unauthorized dumping of household waste. The use of untreatedsolidwasteandsewageeffluent inagriculture isa significant source of toxic metal and organic pollutant contamination in soils. This issue is particularly pressing in developing countries, where the disposal of untreated municipal solid waste (MSW) poses a major threat. The presence of hazardous pollutants in this waste can have serious consequences for both human health and the environment. This study focuses on assessing the impact of leachingpollutantsfrommunicipalsolidwasteonthequality ofsub-soil.
Key Words: MSW,LeachingPollutants,WaterQualityand ToxicMetals,soil.
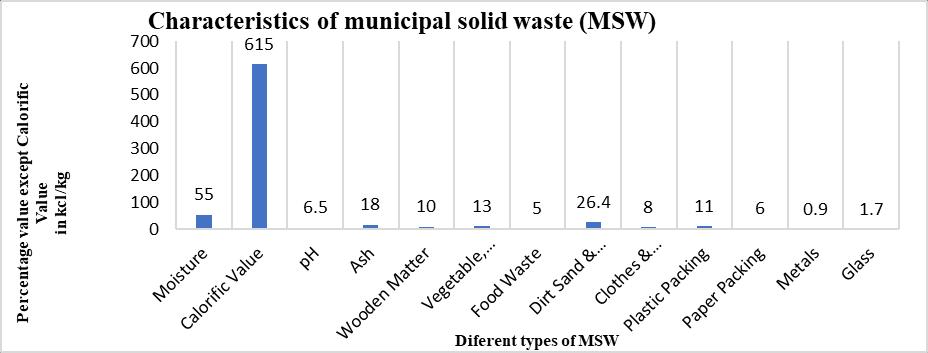
Developmentoftensignificantlyimpactstheenvironment, affecting ecology, water resources, and plant life. Rapid urbanization and populationgrowth have further stressed groundwaterresourcesandincreasedmunicipalsolidwaste (MSW) production. Leachate, a liquid produced from decomposingMSW,posesamajorthreattowaterresources, human health, and sanitation. This highly concentrated mixtureoforganicmatter,inorganiccompounds,andheavy metalsformsduringtheacidicphaseofwastedecomposition, with its composition varying based on waste type, depth, moisture,andage(Kjeldsenetal.,2002).MSWisalsoknown as garbage. MSW is the combination of commercial waste, constructionwaste,demolitionwaste,agriculturalwaste.It includes trash, grass cutting, food scraps, disposable, appliances, kitchen waste, common household waste, syntheticwaste,leather,wastefromdestructionofbuilding, road,bridges,orotherstructure(Archanaetal.,2014).
In 2022, the MSW collection system in Lucknow city followedastructuredprocesswiththeuseofvariousvehicles tocollectandtransport waste across thecity’s 110wards. Hereisanoutlineofthedatarelatedtowastecollectionand
thevehiclesused.Door-to-doorcollectionwasimplemented in 57 wards using rickshaw trolleys and hand carts. In 53 wards, residents disposed of waste directly into nearby dhalaos (waste storage points) or road bins. Total Waste Generated: Approximately 1600-1700 metric tons per day (MTD).MSWistransportedbyvehiclesownedbyLucknow Nagar Nigam (LNN), with no use of private vehicles. LNN operatesafleetconsistingof22-23dumpers,6-10tractors, 48-54 trucks, and around 100 Chhota haathi vehicles to transferwastefromprimaryandsecondarycollectionpoints tolandfillsites(Rawatetal.,2022).
Groundwater,aprimarysourceofdrinkingwater,accounts for over 90% of the world's fresh water and is a critical reservoir of clean water. Compared to surface water, groundwaterisgenerallylesspollutedanditssuitabilityfor various uses depends on its quality (Singh, et al., (2011). Monitoringwaterqualityisessentialformaintaininghuman healthandthestabilityofaquaticecosystems.InIndia,MSW isfrequentlydisposedofinlow-lyingareaswithoutproper precautions,resultinginopendumpsthatarecalledlandfill sites. This unregulated disposal negatively impacts the environment and human health, particularly through groundwater contamination. The waste decomposes and produces leachate a toxic liquid with various harmful chemicalsthatcanseep into groundwaterif noprotective measures are in place (Archana et al., 2014; Singh and Uchimura, 2023; Kumar and Kumar Rana, 2024). MSW is complexrefuseconsistingofvariousmaterialswithdifferent properties.Someofthecomponentsarestablewhileothers degradebecauseofbiologicalandchemicalprocesses(Gupta etal.,2013;Amanoetal.,2021).
International Research Journal of Engineering and Technology (IRJET) e-ISSN: 2395-0056
Volume: 11 Issue: 12 | Dec 2024 www.irjet.net p-ISSN: 2395-0072
Uroojetal.,(2019)assessedwaterqualitynearlandfillsites and found high turbidity, electrical conductivity, and pH levelsoutsideWHO'spermissiblelimits,indicatingsignificant contamination. Dehghani et al. (2021) found that water sourcesnearlandfillsiteshadhighcadmiumlevels,making themunsafefordrinking.TheacidicpHinthesewaterswas linked to decomposed organic material from the landfill, whichlowersthepHandincreasesthesolubilityandtoxicity ofheavymetals.SinghandTripathi,(2023)highlightedthat solid waste disposal in water bodies leads to significant pollution,necessitatingproperwastemanagementpractices toprotectpublichealth.Magnaetal.,(2018)foundthatwater near waste dumping sites had poor quality, with high turbidity and contamination from leachates, making it unsuitablefordomesticuse.(ChhipaandNandwana,2014; Saralakumari,etal.,1993)emphasizedthatMSWdumping contaminatesgroundwaterwithhighchlorideandfluoride levels,posinghealthriskslikefluorosis.Wickramasingheet al.(2018)observedthatsoilsnearwastedumpingsiteswere acidic,whilegroundwatershowedelevatedlevelsofnitrates, sulphates,andheavymetalsduetoleachatecontamination. (AliandSingh,2018;Pillaietal.2014)examinedsoilbeneath wastedumpsandfoundthatcontaminationfromleachates altersitsgeotechnicalproperties,reducingitsstrengthand increasing the risk of groundwater pollution. Singh and Tripathi, (2023) concluded that industrial contamination significantly deteriorates soil properties, making it more plastic, compressible, and less permeable. Special considerationsarenecessaryforconstructiononsuchsoils, with geomembranes suggested to mitigate contamination effects.
ThelandfillsiteisonbankofGomtiriverfromHardoiRoad. The land is filled by garbage of varying depth of 1.00m to 5.00m at various length of bank. This site is discontinued since2007.LucknowissituatedinthecentreofUP. Itlies between26°55'northlatitudeand80°59'eastlongitude.Itis closedon2007.Itisverynecessarytoknowthecomposition ofwasteofthedumpsite.(Rawatetal.,2022).
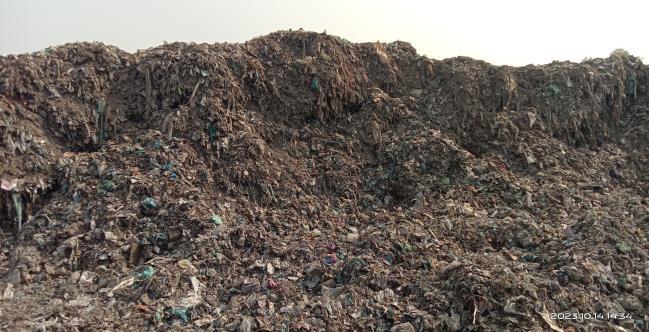
Lucknowcoversanareaof2,528squarekilometersand hadapopulationofapproximately4.580millionaccordingto the 2011 Census of India. Lucknow generates about 1,600 tonsofMSWdaily,withorganicwastemakingupasignificant portion (46-55%) of this total. Waste disposal in the city commonlyinvolvesopendumpinginlow-lyingareaswithout protective liners or leachate collection systems (Final City SanitationPlanforLucknow,2011).Therewerearound23 municipalsolidwastedumpingsitesinLucknow,allsitesare closed both old and new, with Dubagga being the primary one. TheDubagga landfill islocatedat andtothe westof Lucknow.Thislow-lyingareaisclosetothefishmarketand bankofGomtiriver.Thislandfillsiteremainsafter2007itis not in use. It spans an area of approximately 61,420.08 squaremeters,andhasaheightof4to5.5meters(Aliand Singh,2018).
FivesoilsamplelocationswerechosennearbytheDubagga municipallandfillsite.Thesoilwasspreadoncleansurface, debriswereremovedfromthesoilsample.Thesoilsample containing lumps was broken into small pieces. It was air dried and sieved through 2 mm IS: sieve. IS: 1904-1978 specifiesthatallfoundationsshouldextendtoadepthofat least50cmbelowthenaturalgroundsurface(Arora,1988), therefore,samplesfromdifferentlocationsoftheareawere collectedfromthisdepth.Thetoolsliketrowel,spade,auger, etc.wereusedforsamplescollection.Samplingtubesmade up of steel were used for the collection of bulk density samples. The collected samples kept into thick quality polythene bags were labeled, sealed, and brought to the laboratoryforanalysis.Soilsamplewerecollectedfromthe baseofdumpingsitedesignatedsample1,2,3,4and5was taken.All thesamples were collectedatthesameday,the 5thsamplesweretakenfromoutsideofdumpsitenearthe Dubaggaat100metersdistanceandlabeledassample1,2, 3, 4 and 5. The all-soil samples were collected from 100 meterfromeachother.
Groundwatersamplewerecollectedfromsurroundingthe dumping site designated samples was collected from oppositeofgreencorridor,nearahouseofLucknowgreen corridor road, M.C. Saxena college mod and nearby the agriculturelandwastaken.Allthesampleswerecollectedat the same day, a 500 meters radius and labeled as sample GW1,GW2,GW3andGW4.
For determining the suitability for crop production, the physicalpropertiesofsoilplayimportantrole.Thephysical propertiesofthesoilareinterconnectedtothecharacteristic like ability to support and bear, cultivation practice, moisture storage capacity and its availability to plants,
International Research Journal of Engineering and Technology (IRJET) e-ISSN: 2395-0056
Volume: 11 Issue: 12 | Dec 2024 www.irjet.net p-ISSN: 2395-0072
drainage,maintaintheplantnutrient.ForPlantgrowthsoil shouldalsobephysicallyfertile.Plantsaresupportedbysoil whichisthemixtureofsolids,liquid,gaseswhichiscalled three phase system. The important physical properties of soilare(FatimaandTripathi,2022).Soilcolordependson the presence of organic matter and mineral present in it (IndianStandards,1972,1973).
Cation-exchangecapacity(CEC)isthemaximumquantityof total cations that a soil can hold, at a given pH value, availableforexchangewiththesoilsolution.Itisexpressed as centi-mol of Hydrogen per kg (cmolc/kg or 100 meqc/100g).Measurementofacidityoralkalinityofthesoil isdonebypH. Moreprecisely,itisameasureofhydrogen ionconcentrationinanaqueoussolutionandrangesinsoils from3.5(veryacid)to9.5(veryalkaline).TheeffectofpHis to remove from the soil or to make available certain ions. Soilswithhighacidity(<5.5)tendtohavetoxicamountsof aluminiumandmanganese.Soilswithhighalkalinity(>8.5) tendtodisperse.(ofIndianStandards,1987,1972).Leaching refers to the downward movement of pollutants through permeable soil, which can contaminate groundwater and soil. Contaminants from municipal solid waste, including non-biodegradableandhazardousmaterials,canleachinto the soil. This contamination reduces soil quality (Indian Standards, 1972). Soil samples were air-dried, sieved througha2mmISsieve,andanalyzedformoisturecontent, electrical conductivity, pH, organic carbon, available nitrogen,phosphorous,andpotassium.Standardmethodsas perIScodeswerefollowed.Thesamplewascollectedand were analyzed for their physio-chemical properties by variousmethodswhicharelistedhere.pHfrompHmeter, moisture content from oven drying method, electrical conductivity (µ mhos/cm) from electrical conductivity meter,organiccarbonpercentagefromtitrimetricmethod (Walkleyandblack,1934),availablenitrogenasN(mg/kg) frommicroKjeldhalmethod,phosphorousasP₂O₅(mg/kg) from spectrophotometric method and potassium as K(mg/kg)fromflamephotometermethod.
5.RESULT AND DISCUSSION
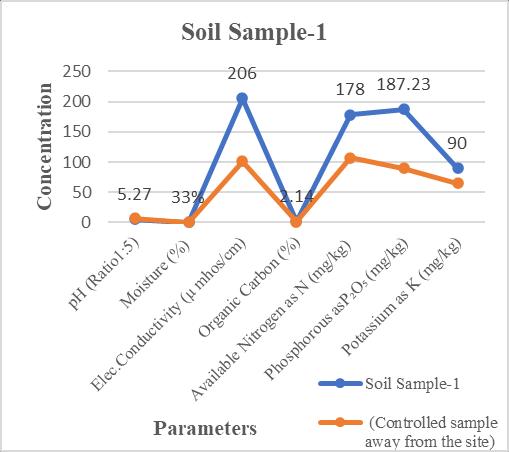
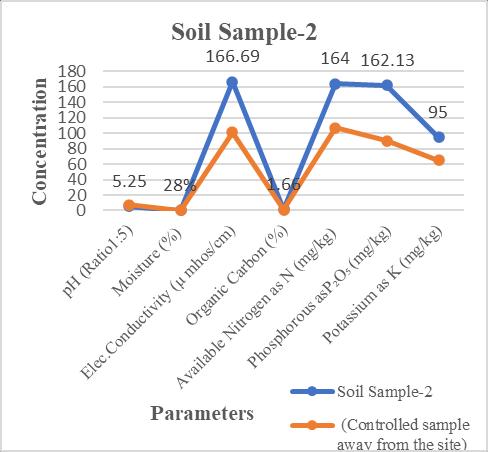
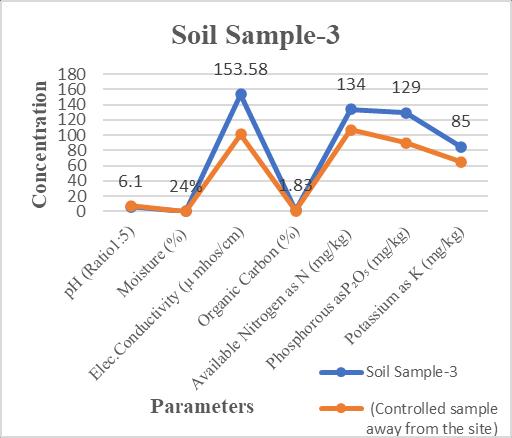
Theanalysisofsoilsamplesfromdifferentsitesfigures3(a) to 3(d) along with a controlled sample provides valuable insightsintothesoilcharacteristicsintermsofpH,moisture, electrical conductivity, organic carbon, available nitrogen, phosphorus,andpotassium,herearethekeypointsderived fromthedata.
International Research Journal of Engineering and Technology (IRJET) e-ISSN: 2395-0056
Volume: 11 Issue: 12 | Dec 2024 www.irjet.net p-ISSN: 2395-0072
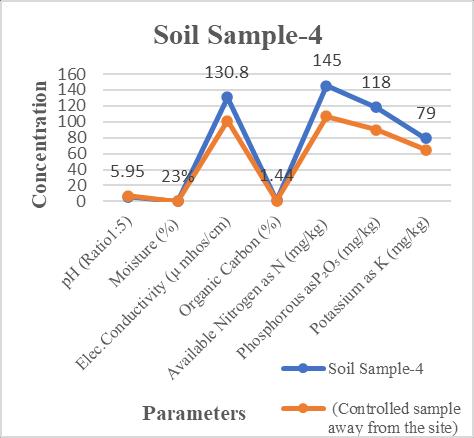
The pH values of the soil samples range from 5.25 to 6.1, indicating mildly acidic soil conditions. The controlled sample,withapHof7.21,isneutral,suggestingthatthesitespecific soil samples are more acidic, likely due to sitespecific factors (e.g., proximity to waste materials or industrial activities). The higher acidity (lower pH) in the sitesamplescanaffectnutrientavailability,particularlyfor elementslikephosphorus.Themoisturecontentdecreases fromfigure4(a)(33%)tofigure4(d)(23%).Thecontrolled sample has the lowest moisture content at 21%. Higher moisture in site samples could be due to water retention from organic content or proximity to water sources. It indicates that the soil in the site area retains more water compared to the control, potentially affecting microbial activityandplantgrowth.Electricalconductivity(EC)values showadecliningtrendfromfigure4(a)(206µmhos/cm)to figure4(d) (130.8 µmhos/cm),withthe control sample at 101.32µmhos/cm.TheelevatedEClevelsinthesitesamples suggestahigherconcentrationofsolublesalts,whichcould bearesultofleachatefromnearbywasteorcontaminants. Higher salinity can impact soil health and plant growth negatively by limiting water absorption. Organic carbon content is highest in figure 4(a) (2.14%) and decreases progressivelytofigure4(d)(1.44%).Thecontrolledsample has a significantly lower organic carbon content (0.98%). The elevated organic carbon levels in the site-specific samples suggest higher organic matter decomposition, possiblyduetoorganicwasteaccumulation.Organiccarbon is essential for soil structure and fertility, promoting microbialactivityandnutrientretention.AvailableNitrogen (N)levelsarerelativelyhigherinfigure4(a)(178mg/kg) and decrease through figure 4(d) (145 mg/kg), with the controlledsamplehavingthelowestlevel(107mg/kg).The increased nitrogen content in site samples may indicate nutrient enrichment due to waste deposits or fertilizers. However, excessive nitrogen can also lead to nutrient imbalancesandaffectplanthealth.Phosphorus(P₂O₅)levels arehighestinfigure4(a)(187.23mg/kg)anddecrease to 118mg/kginfigure4(d),withthecontrolsamplehavinga phosphoruslevelof90.01mg/kg.Highphosphoruscontent
in the site samples suggests possible accumulation from wastematerialsorfertilizers.Excessphosphoruscanleadto water contamination through runoff, leading to eutrophicationofnearbywaterbodies.Potassium(K)levels showasimilartrend,withhighervaluesinthesitesamples (90mg/kginfigure4(a),reducingto79mg/kginfigure4(a) comparedtothecontrol(65mg/kg).Potassiumisessential for plant growth, but its higher levels in the site samples might indicate leaching or accumulation from external sourcesBureauofIndianStandards(BIS:10500-2012).
Groundwatersampleswereanalyzedforparameterssuchas pH, total dissolved solids (TDS), total hardness, alkalinity, calcium,magnesium,chloride,nitrate,sulphate,andfluoride. Methods included pH meter readings, digital TDS meter, titration methods, and spectrophotometric analysis. WQI wascalculatedusingtheweightedarithmeticindexmethod, considering parameters like pH, TDS, nitrate, fluoride, chloride, sulphate, alkalinity, and total hardness. The standardsusedwereprescribedbytheBIS:10500-2012.
International Research Journal of Engineering and Technology (IRJET) e-ISSN: 2395-0056
Volume: 11 Issue: 12 | Dec 2024 www.irjet.net p-ISSN: 2395-0072
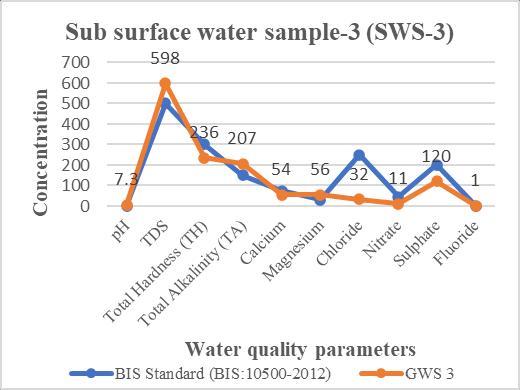
Figure-4(c): SubSurfaceWaterSample-3.
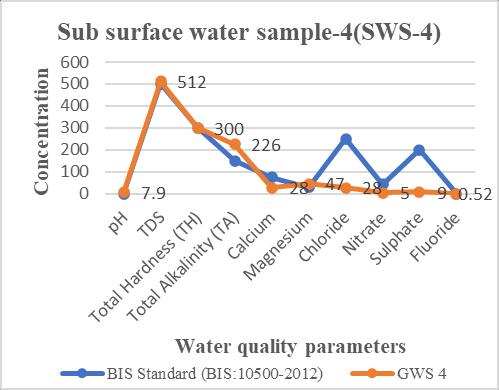
Figure-4(d): SubSurfaceWaterSample-4.
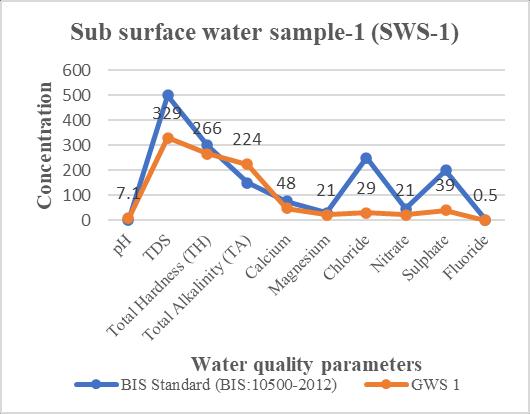
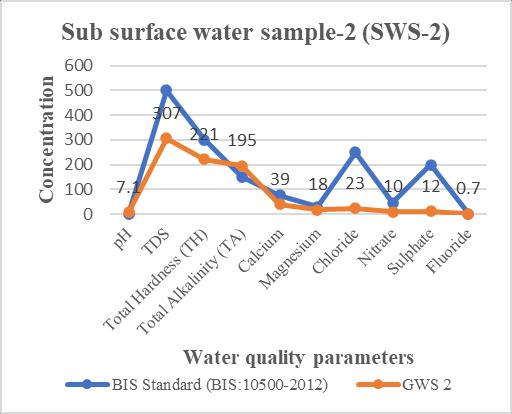
Thegroundwater(GW-1toGW-4)inabovefigure5(a)to 5(d)wereanalyzedforvariousphysicochemicalparameters and compared with the BIS Standard for drinking water. Hereisadetaileddiscussionbasedontheresults
ThepHvaluesofallgroundwatersamplesrangebetween7.1 and7.9,whichfallswithintheacceptableBISrangeof6.5to 8.5. This indicates that the sub surface water samples are slightly alkaline, which is suitable for drinking water and poses no significant risk in terms of acidity or alkalinity.
Total.TheBISstandardforTDSis500mg/L,withfigure5(a) (329mg/L)andfigure5(b)(307mg/L)withinthisrange, whileinfigure5(c)(598mg/L)andfigure5(d)(512mg/L) exceed the permissible limit. The elevated TDS levels in figure 5(c) and figure 5(d) may indicate the presence of dissolvedsalts,whichcanaffectwatertasteandmayrequire treatment before consumption. The BIS limit for total hardnessis300mg/L,with all samplesexceptfigure5(d) (300mg/L)fallingbelowthisthreshold.Whilefigure5(d) reachestheupperlimit,theothersampleshaveacceptable hardness levels, making the water safe for consumption. Hard water can lead to scaling in pipes and may cause problemsforthosewithsensitiveskin.TheBISstandardfor alkalinity is 150 mg/L. However, all sub surface water
samples exceed this limit, with values ranging from 195 mg/L figure 5(b) to 226 mg/L figure 5(d). High alkalinity levels suggest the presence of carbonate and bicarbonate ions,whichcouldaffectthetasteofwaterandmayrequire treatmenttobalancethewaterchemistryforlong-termuse. The BIS limit for calcium is 75 mg/L, and all sub surface watersamplesfallwithinthisrange(28mg/Lto54mg/L). Thecalciumcontentinthewaterissuitablefordrinkingand doesnotposeanysignificanthealthrisks.Themagnesium levelsinsubsurfacewatersamplesrangefrom18mg/Lto 56mg/L,exceedingtheBISlimitof30mg/Linfigure5(c) (56 mg/L) and figure 5(d) (47 mg/L). High magnesium concentrations can contribute to hardness and may cause gastrointestinal issues for sensitive individuals. The BIS standardforchlorideis250mg/L,andallsubsurfacewater sampleshavechloridelevelswellbelowthisthreshold(23 mg/L to 32 mg/L). Low chloride levels indicate that the waterisfreefromsignificantcontaminationfromchloride salts, which could otherwise affect the taste or cause corrosioninpipes.TheBISlimitfornitrateis45mg/L,and allsubsurfacewatersamplesarewellwithinthisrange(5 mg/Lto21mg/L).Nitratelevelsindrinkingwateraresafe, with no risk of nitrate contamination, which is crucial for preventing methemoglobinemia (blue baby syndrome) in infants.TheBISlimitforsulphateis200mg/L,andallsub surfacewatersampleshavesulphatelevelswithinthislimit (9 mg/L to 120 mg/L). Sulphate levels are acceptable for drinking,withfigure5(c)showingthehighestconcentration (120 mg/L), which is still below the threshold. The BIS standardforfluorideis1mg/L.figure5(a)(0.5mg/L),GW-2 (0.7mg/L),andfigure5(d)(0.52mg/L)fallbelowthislimit, while figure 5(c) (1 mg/L) is at the permissible limit. Fluoride levels are safe and pose no risk of fluorosis, a conditioncausedbyexcessivefluorideconsumption.
Afteranalyzingthephysico-chemicalcharacteristicsofboth contaminatedanduncontaminatedsoilsamples,theresults demonstratetheadverseeffectsofpollutantsfromMSWdue toleaching,leadingtoalossofsoilfertilitycomparedtothe controlsamples.Thetestresultshighlightnotablechangesin the geotechnical properties of contaminated soils when compared to the parent (uncontaminated) soil. The introductionofacidicandbasiccontaminantsaltersthesoil pH. Contaminated soils exhibit increased electrical conductivityduetothepresenceofmorefreeions.Thesoil pH ranges from 7.35 to 8.10, indicating a slightly alkaline nature, which can cause corrosive damage to plant stems androotsystems.Contaminantsincreasethesoilplasticity due to chemical interactions with soil particles. Contaminated soils become more compressible, while the decreaseinthecoefficientofconsolidationindicatesreduced permeability.
The analysis of groundwater samples indicates that the waterqualityisgenerallywithinsafelimitsaccordingtothe
International Research Journal of Engineering and Technology (IRJET) e-ISSN: 2395-0056
Volume: 11 Issue: 12 | Dec 2024 www.irjet.net p-ISSN: 2395-0072
BISstandards,butTDSlevelsinfigure5(c)andfigure5(d) exceedtheBISlimit,whichmayrequiretreatmenttoremove excess dissolved solids for improving taste and reducing potential scaling. Total alkalinity exceeds the permissible limit in all samples, suggesting that the water may need treatmenttoreducealkalinityforlong-termuse.Magnesium levelsarehighinfigure5(c) andfigure5(d),whichcould contributetowaterhardnessandmaycausehealthissues for sensitive individuals. Overall, the groundwater is not suitable for consumption without treatment needed to address the high alkalinity, TDS, and magnesium levels in some samples. Regular monitoring of these parameters is recommended to ensure continued compliance with drinkingwaterstandards.
[1] Ali, S., and Singh, N. B. (2018), “Groundwater Quality Characterization and Assessment at old and New Landfill Sites in Lucknow,” Journal of Emerging Technologies and Innovative Research, 5(9), pp. 149154
[2] Amano,K.O.A.,Danso-Boateng,E.,Adom,E.,Nkansah,D. K.,Amoamah,E.S.,&Appiah-Danquah,E.(2021)“Effect of waste landfill site on surface and ground water drinking quality,” Water and Environment Journal, 35(3),pp663-674
[3] Archana,Daoud,A.,Mohammad,Y.andDutta,V.(2014). “Assessment of the Status of Municipal Solid Waste Management(MSWM)inLucknow–CapitalcityofUttar Pradesh, India,” Journal of Environmental Science, ToxicologyandFoodTechnology,8(5),pp.41–49
[4] Bureau of Indian Standards (BIS) (1991). Indian standarddrinkingwaterspecifications(IS10500:2012), NewDelhi.
[5] Chhipa,R.C.,andNandwana,R.(2014).“ImpactofSolid Waste Disposal on Ground Water Quality in Different Disposal Site at Jaipur, India,”International Journal of Engineering Sciences and Research Technology, 3(8), pp.93-101
[6] Dehghani, M. H., Omrani, G. A. and Karri, R. R. (2021). “SolidWasteSources,Toxicity,andTheirConsequences toHumanHealth,”SoftComputingTechniquesinSolid WasteandWastewaterManagementElsevier,pp.205–213
[7] Fatima, M. and Nabh Tripathi, K. (2023). “Study and AnalysisofLeachingPollutantinAgriculturalSub-Soil Environment,” International Journal of Engineering ResearchandTechnology,12(7),pp.42-46
[8] FinalCitySanitationPlanforLucknow(2011).
[9] Gupta, S. K., Pandey, S. K. and Singh N. B. (2013). “Municipal Solid Waste Characterizations and Management Strategies for the Lucknow City, India,” InternationalJournalofAppliedEngineeringResearch, 8,pp.2031-2036
[10] Kjeldsen, P. et al. (2002) “Present and Long-Term Composition of MSW Landfill Leachate: A Review,” Critical Reviews in Environmental Science and Technology,32(4),pp.297–336
[11] Kumar, A. and Kumar R. N. (2024) “Significance of SourceSegregationofSolidWasteintheCourseofSolid Waste Management: An Overview of Varanasi City, India,”SolidWasteManagement,aBookChapter,pp.128
[12] Magna,E.K.etal.(2018)“AssessmentoftheImpactof SolidWasteDisposalonthePortabilityofSurfaceWater andGroundwaterUsingWaterQualityIndex(WQI)in Kpassa, Nkwanta North District of Ghana,” Civil and EnvironmentalResearch,10(9),pp.36-42
[13] IndianStandards,IS2720-2(1973):Methodsoftestfor soils,Part2:Determinationofwatercontent.
[14] IndianStandards,IS2720-3-1(1980):Methodsoftest for soils, Part 3: Determination of specific gravity, Section1:Finegrainedsoils.
[15] IndianStandards,IS2720-4(1985):Methodsoftestfor soils,Part4:Grainsizeanalysis.
[16] IndianStandards,IS2720-22(1972):Methodsoftestfor soils,Part22:Determinationoforganicmatter.
[17] IndianStandards,IS2720-26(1987):Methodoftestfor soils,Part26:DeterminationofpHvalue.
[18] Rawat,R.,Kumar,V.andShukla,S.(2022).“Municipal Solid Waste Characterization and Management in Lucknow-Capital city of Uttar Pradesh, India,” International Research Journal of Engineering and Technology,9(3),pp.1465-1470
[19] Singh,A.,Tripathi,K.N.(2023)“AReviewPaperonthe ImpactofMunicipalSolidWasteSurfaceWaterQuality,” InternationalJournalofScienceandResearch,12(7),pp. 9–13
[20] Singh, V. and Uchimura, T. (2023) “Effect of Material Composition on Geotechnical Properties Study on SyntheticMunicipalSolidWaste,”Geotechnics,3(2),pp. 397–415
[21] Saralakumari, D., & Ramakrishna, K. (1993), An epidemiologicalstudyofendemicfluorosisinthevillage ofRallaAnantapuram,AndhraPradesh.Fluoride,26(3), pp177-180.
International Research Journal of Engineering and Technology (IRJET) e-ISSN: 2395-0056
Volume: 11 Issue: 12 | Dec 2024 www.irjet.net p-ISSN: 2395-0072
[22] Singh, S. K., Rai, S., & Upadhyay, A. K. (2011), Groundwater quality effects from an old dumpsite in Agra city. International Journal of Environmental Sciences,2(1),pp195-203.
[23] Urooj,A.,Ilyas,R.andHumayun,N.H.(2019)“Effectsof DumpingSolidWasteonWaterQualityofSurfaceWater Bodies,”JournalofPlantandEnvironment,1(1),pp.21–24
© 2024, IRJET | Impact Factor value: 8.315 | ISO 9001:2008 Certified Journal | Page503