
International Research Journal of Engineering and Technology (IRJET) e-ISSN: 2395-0056
Volume: 11 Issue: 12 | Dec 2024 www.irjet.net p-ISSN: 2395-0072

International Research Journal of Engineering and Technology (IRJET) e-ISSN: 2395-0056
Volume: 11 Issue: 12 | Dec 2024 www.irjet.net p-ISSN: 2395-0072
Dr.P. VaraPrasad,
Professor of CSE, Sai Rajeswari institute of Technology, Proddatur, AP, India
Abstract - Stockmarketpredictionisachallengingtaskdue totheinherentcomplexityandvolatilityoffinancialmarkets. Accuratepredictionsofstockpricescansignificantlybenefit investors,traders,andfinancialanalystsinmakinginformed decisions. This study explores the application of Support Vector Machines (SVM), a supervised machine learning technique,forpredictingstockmarketprices.SVMisknown foritsrobustnessinhandlingnon-lineardataanditsability to perform well in high-dimensional spaces, making it suitable for financial time series data. The study incorporates historical stock price data, including open, close,high,low,andvolume,asfeaturesformodeltraining. Various pre-processing techniques, such as data normalization and feature selection, are employed to enhance the model's performance. Additionally, the SVM model's performance is evaluated using metrics such as Mean Squared Error (MSE), Root Mean Squared Error (RMSE),andpredictionaccuracy.
Key Words: Stock market prediction, Support Vector Machines (SVM), machine learning, financial forecasting, time series analysis.
1.INTRODUCTION
The stock market is a cornerstone of the global economy, influencing investment strategies, financial planning, and economicpolicymaking.Accuratelypredictingstockmarket prices has long been a topic of interest for researchers, investors, and traders due to its potential for maximizing profits and minimizing risks. However, the prediction of stock prices is a complex task, as market movements are influencedbyamyriadoffactors,includinghistoricalprice trends. This introduction sets the stage for an in-depth explorationofSVMasamachinelearningtechniqueforstock market prediction, outlining its strengths, challenges, and potential applications in the dynamic field of financial forecasting.Theaimofthispaperistostudytheeffectiveness of SVM in predicting stock prices using historical market data and identify which model metrics provide more accurateandreliablepredictions.
Kyoung-jaeKiminvestigationsithasbeenfoundthatSVM providesapromisingalternativetostockmarketprediction [3]. Traditionalmodelshave been used in stock market forecasting, including Support Vector Machines (SVM) [4].The use of SVM, NN, and Genetic Adversarial Network (GAN) machine learning techniquesin stock market
forecasting applicationshas beenthesubject of extensive research[7,8].Thedataanalyzeremployedsupportvector regression (SVR)and neuralnetwork(ANN) machine learning algorithms to guessthe stock market price index[9].
Koharaet al.[1]improvedstock marketprediction performance byincorporatingprior knowledge. Extensive research [5,6] was conducted in the area of stock market forecastingapplicationsintheusingSVM,NN,andGenetic adversarial network (GAN) ML techniques. The authorsexamineANN, SVM, and LSTM neural networks,stressingtheiruniquefeaturesanduseful applications,therebyemphasizinghowmachinelearningis revolutionizinginvestmentstrategies[2].Machinelearning methods, such as SVM, Random Forests, and k-Nearest Neighbours,havebeenexploredforstockprediction.
2.1 Dataset
TheTESLAdatasetusedinthisstudyconsistsofhistorical stockprices,fromKaggle,collectedoveraperiodof(20102022).ThedatasetparticularsisshowninTable1andTable 2.
Table
0 2010-06-29
93831500
1 2010-06-30
85935500
41094000
2954 2022-03-23 979.940002 1040.699951 976.400024 999.109985 40225400 2955 2022-03-241009.729980 024.489990988.799988 1013.919983 22901900
International Research Journal of Engineering and Technology (IRJET) e-ISSN: 2395-0056
Volume: 11 Issue: 12 | Dec 2024 www.irjet.net p-ISSN: 2395-0072
Table -2: Datacolumns(total7columns)
# Column Non-Null Count Dtype
0 Date 2956 non-null object
1 Open 2956 non-null float64
2 High 2956 non-null float64
3 Low 2956 non-null float64
4 Close 2956 non-null float64
5 AdjClose 2956 non-null float64
6 Volume 2956 non-null int64
The dataset was pre-processed by normalizing the stock pricestoascalebetween0and1toimprovemodeltraining.
2.3 Support Vector Machine (SVM)
SVMisasupervisedmachinelearningalgorithmthatfinds thehyperplanethatbestseparatesdatapointsintodistinct categories.Inthisstudy,SVMisusedforregression(SVR), whereitattemptstopredictstockpricesbasedonhistorical data.Aradialbasisfunction(RBF)kernelisusedfortheSVR tocapturenonlinearrelationshipsbetweenstockpricesand time.
2.4 Evaluation Metrics
ThemostcommontypesofevaluationmetricsforMachine Learning models are MSE, RMSE, MAE, and MAPE. Let’s explainwhateachacronymmeans

MeanSquaredError(MSE):Measurestheaverageofthe squaresoftheerrorsbetweenpredictedandactualin Fig.1
MSE=1/n

n=numberofobservations
Yi = actualvalue
Y⌃i=Predictedorforecastedvalue
This metric is essential for identifying outliers in models. Duetoitseasycomprehensibility,RMSEis widelyused to compare the performances of different models. From a geometric perspective, RMSE and MAE represent mean forms of the L2 and L1 norms, which correspond to the EuclideandistanceandtheManhattandistance,respectively.
TheEuclideandistanceiscommonlyusedinalgorithmssuch as k-nearest neighbors (classification) and k-means (clustering) to find the closest points to a sample, determiningtheirproximitybasedondifferencesalongthe variables.
Root Mean Squared Error (RMSE): Square root of MSE to bringtheerrorbacktotheoriginalscaleofthestockprices.
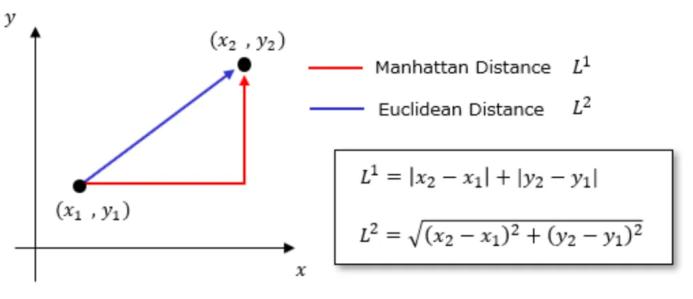
2 Euclideandistance
practicalapplicationforthecommonuseofRMSE,withouta doubt,liesintheperformanceofMachineLearningmodels.
In simple terms, the Manhattan distance is the sum of the absolute differences between the horizontal and vertical coordinatesofthepoints.
Similarly, MAE is the calculation of the average absolute differencesbetweentheexpectedandactualvalues.MAEis notassensitivetooutliersasMSEandRMSE.
A very important metric for measuring regressions and frequencydistributions.Similarlytoothermetrics,thelower thevalueofMAE,themoreaccuratethemodelis.
International Research Journal of Engineering and Technology (IRJET) e-ISSN: 2395-0056
Volume: 11 Issue: 12 | Dec 2024 www.irjet.net p-ISSN: 2395-0072
Mean Absolute Percentage Error (MAPE)
MAPE calculates the average of the absolute percentage differencesbetweenthemodel’spredictionsandtheactual values.
MAPE=1/n
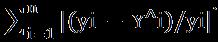
MAPE penalizes negative errors more heavily (when the predicted value exceeds the actual). Consequently, MAPE tends to favour models that underestimate rather than overestimate.
However,inthisstudywefocusedonMSE,RMSEandMAPE metricsinevaluationofperformanceofmodel.
ThefindingsofthisstudyhighlightthepotentialofSupport Vector Machines (SVM) as an effective machine learning techniqueforstock market priceprediction.However,the resultsalsounderlineseveralconsiderations,challenges,and opportunitiesforimprovement,whicharediscussedinthis section.
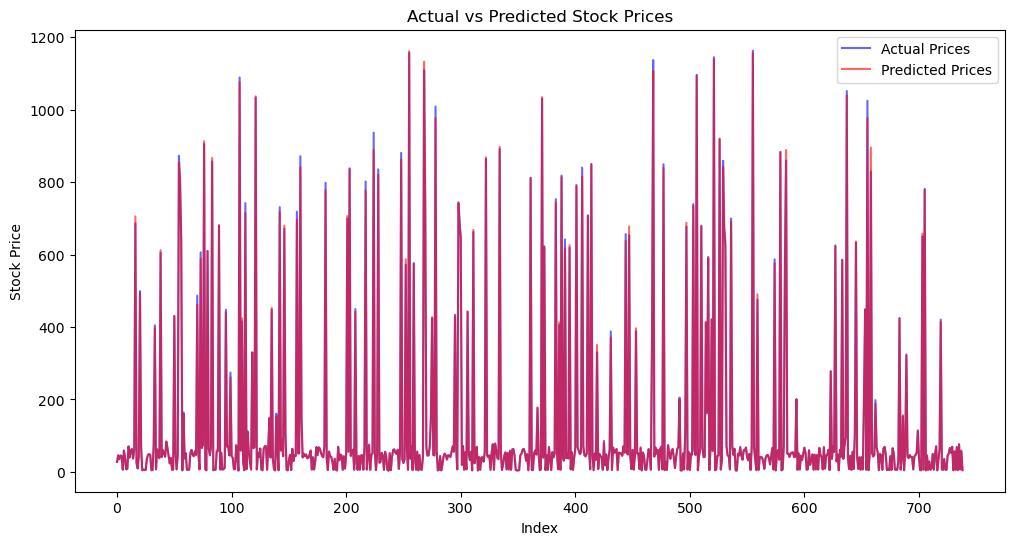
TheFig.3depictsthevariationsinactualpriceandPredicted stockpricefordifferentindexvalues.Theerrorvaluesare moderate, hence the SVM model is well suitable for predictionofstockprice.
The Mean Squared Error measures the average squared differencesbetweenpredictedandactualstockprices.This value indicates that the squared deviations are relatively low,suggestingthatthemodelperformswellinminimizing errors.
A mean square error value of 36.46 suggests a strong performance,especiallywhenthestockpricerangeishigh. Themodel'sperformanceshowsmoderateaccuracybutalso some room for improvement, as both MAE and RMSE indicate prediction errors that could be significant dependingonthestock'stypicalpricerange.
The Mean Squared Error measures the average squared differencesbetweenpredictedandactualstockprices.This value indicates that the squared deviations are relatively low,suggestingthatthemodelperformswellinminimizing errors.
TheRootMeanSquaredErrortranslatestheMSEbacktothe original units of the stock prices, making it easier to interpret. An RMSE of 6.04 means that the typical error magnitude is about 6 units. The slightly higher value comparedtoMAEreflectstheinfluenceofoccasionallarger errors,butoverall,theRMSEisstillverylow.
TheRootMeanSquaredErrortranslatestheMSEbacktothe original units of the stock prices, making it easier to interpret. An RMSE of 6.04 means that the typical error magnitude is about 6 units. The slightly higher value comparedtoMAEreflectstheinfluenceofoccasionallarger errors,butoverall,theRMSEisstillverylow.
[1]K.Kohara,T.Ishikawa,Y.Fukuhara,Y.Nakamura,Stock pricepredictionusingpriorknowledgeandneuralnetworks, Int.J.Intell.Syst.AccountingFinanceManage.6(1)(1997) 11–22.
TheSVMmodeldemonstratednotableaccuracyincapturing stockmarkettrendsandpredictingfuturepricesbasedon historical data. Key performance metrics such as Mean SquaredError(MSE),RootMeanSquaredError(RMSE),and R-squared(R²)indicatedthatSVMcaneffectivelyhandlethe non-linearanddynamicnatureoffinancialdata.However, themodel'spredictivecapabilitywaslimitedwhenapplied tohighlyvolatilestocksorduringperiodsofsuddenmarket fluctuations.
[2]Chhajer,P.;Shah,M.;Kshirsagar,A.Theapplicationsof artificial neural networks, support vector machines, and long–shorttermmemoryforstockmarketprediction.Decis. Anal.J.2021,2,100015.
[3]Kyoung-jaeKim,2003.Financialtimeseriesforecasting using support vector machines, Neurocomputing 55 (1-2) 307–319.
[4]R.Tsaih,Y.Hsu,C.C.Lai,ForecastingS&P500stockindex futureswithahybridAIsystem,DecisionSupportSyst.23 (2)(1998)161–174.
International Research Journal of Engineering and Technology (IRJET) e-ISSN: 2395-0056
Volume: 11 Issue: 12 | Dec 2024 www.irjet.net p-ISSN: 2395-0072
[5] Ahmad Waqas, Analyzing different ML techniques for stockmarketprediction,Int.J.Comput.Sci.Inform.Sec.12 (2014)12–17.
[6] H. Yang, L. Chan, I. King. Support vector machine regression for volatile stock market prediction. In InternationalConferenceonIntelligentDataEngineeringand AutomatedLearning2002Aug12(pp.391-396).Springer, Berlin,Heidelberg.
[7] Ahmad Waqas, Analyzing different ML techniques for stockmarketprediction,Int.J.Comput.Sci.Inform.Sec.12 (2014)12–17.
[8] H. Yang, L. Chan, I. King. Support vector machine regression for volatile stock market prediction. In InternationalConferenceonIntelligentDataEngineeringand AutomatedLearning2002Aug12(pp.391-396).Springer, Berlin,Heidelberg.
[9]H.R.Patel,S.M.Parikh,D.N.Darji.Predictionmodelfor thestockmarketusingnewsbaseddifferentClassification, Regression, and Statistical Techniques: (PMSMN). In2016 International Conference on ICT in Business Industry & Government(ICTBIG)2016Nov18(pp.1-5).IEEE.

1’st Author
Dr.P.VaraPrasadhasworkedasa teacherformorethan20years.He is now working as a professorof CSE at Sai Rajeswari Institute of Technology in Proddatur, AP He received his PhD in CSE from GlocalUniversityaftercompleting his B.Tech and M.Tech degrees in CSEatJNTUniversity.Hisareasof interest in research are deep learningandmachinelearning.