

International Research Journal of Engineering and Technology (IRJET) e-ISSN:2395-0056
TRACKING THE STORM: VISUALIZING TRENDS IN U.S. HURRICANES & CLIMATE IMPACT
RUTH BALAJI
B.E.,M.E
IntelligentSystemsEngineeringIndiana UniversityBloomington,IN,USA.
MOHIT SAI TATINENI
B.E.,M.S
ComputerScience
IndianaUniversityBloomington,IN,USA.
Abstract- Hurricanes are among the most impactful natural disasters, causing significant economic, environmental, and societal damage. With their frequency and intensity escalating due to climate change, understanding hurricane dynamics is crucial for improving preparedness and resilience. This study leverages decades of U.S. hurricane data to analyze key variables such as wind speed, pressure, spatial trajectories, and temporal patterns. Using advanced visualization techniques, including multivariate scatterplots, temporal gradients, and geospatial overlays, the research uncovers critical insights into storm behavior, such as wind asymmetries, pressure-intensity relationships, and spatial- temporal evolution. These findings contribute to a deeper understanding of hurricane dynamics, offering actionable insights for climate research, disaster management, and policy development.
1. INTRODUCTION
1.1.MOTIVATION
Hurricanes are among the most destructive natural disasters, causing extensive damage through powerful winds, heavy rainfall, and storm surges. In the United States alone, hurricanes have resulted in over $1 trillion in damages since 1980, displacing millions of people and overwhelming critical infrastructure resilience (NOAA, 2022) [3]. Climate change has intensified these storms, with Category 4 and 5 hurricanes the most catastrophic becoming 30% morefrequentoverthepast40years(Kossinetal.,2020) [8].
Recenteventsexemplifythegrowingrisks.InSeptember 2024, Hurricane Helene, a Category 4 storm, devastated Florida’s Big Bend region, causing catastrophic flooding that extended into western North Carolina. This event claimed 234 lives and caused damages exceeding $89
Volume: 12 Issue: 01 | Jan 2025 www.irjet.net p-ISSN:2395-0072 © 2025, IRJET | Impact Factor value: 8.315 | ISO 9001:2008 Certified Journal | Page262
ADITHYA SINGUPATI
B.E.,M.S
DataScience
IndianaUniversityBloomington,IN,USA.
RASAGHNA KUTURU
B.E.,M.S
DataScience
IndianaUniversityBloomington,IN,USA.
billion. Shortly thereafter, Hurricane Milton struck Florida’s west coast as a Category 5 storm, resulting in 35fatalitiesandover$85billionindamages.Thesebackto-back disasters underscore the escalating threat and highlight the urgent need for a deeper understanding of hurricanedynamics.
As hurricanes grow in intensity and frequency, it is imperative to enhance our ability to analyze and communicate their impacts. Effective data analysis and clear visualizations are essential tools for protecting vulnerable communities, informing policymakers, and improving disaster preparedness strategies. This study leveragesdecadesofhurricanedata toexploretrendsin frequency, intensity, and geographic distribution, providing critical insights into hurricane behavior in an eraofrapidlychangingclimateconditions.
1.2.BACKGROUND
The coastal regions of the United States, particularlyalongtheGulfandAtlanticcoasts,havelong beenvulnerabletohurricanes.Withthegrowinginfluence of climate change, these storms are becoming more frequent and intense, posing significant challenges for researchers, policymakers, and disaster response teams. Recentstudies(Knutson et al.,2019[1];Gray,2005[2]) highlight the role of human-induced climate change in intensifying tropical cyclones, with rising global temperaturescontributingtothe development of larger, moredestructivehurricanes.
This project aims to analyze and map historical U.S. hurricane landfalls to identify patterns in frequency, intensity, andhigh-risk areas,particularlyin thecontext of climate change. By examining a dataset containing detailssuchaslandfalldates,locations,windspeeds,and meteorological variables, the study seeks to uncover trendsthatarecriticalfordisasterpreparednessandrisk mitigation. Understanding these patterns will provide vulnerable regions with actionable insights to enhance theircapacitytorespondtofuturestorms.
International Research Journal of Engineering and Technology (IRJET) e-ISSN:2395-0056
Volume: 12 Issue: 01 | Jan 2025 www.irjet.net p-ISSN:2395-0072

Figure 1: NOAA’s Historical Hurricane Tracks map, offersanextensivedatasetbutisoverwhelmingdueto thelargevolumeofinformationpresent[3].
The motivation for this project stems from the increasing need toadapt disaster responsestrategiesas hurricanesbecomemoreunpredictable.Theprojectwill explore how hurricane activity has changed in recent decadesandhowthisinformationcanbeusedtoinform policymakers, disaster response teams, and affected communities. The insights gained fromthisanalysiswill beinstrumentalinshapingfuture disaster preparedness strategies. Existing visualizations, such as NOAA’s Historical Hurricane Tracks map (Figure 1), provide comprehensivedata butare oftenclutteredanddifficult tointerpretduetothesheervolumeofinformation.

U.S.Hurricane,whichsimplifieshurricanepathdata, but lacks interactivity and depth for more detailed explorationoftrends[4].
A more refined approach, like The Washington Post’s Mapping Every U.S. Hurricane (Figure 2), presents a simplifiedoverviewofstormpathsbutlacksinteractivity and depth. Similarly, FiveThirtyEight’s The Rising Costs ofHurricanes focuses on the financial toll of storms but doesn'taddressmeteorologicaltrends.

Figure 3: FiveThirtyEight’sTheRisingCostsof Hurricanesgraph,whichhighlightseconomicimpacts butdoesn'tofferadeeperanalysisofstorm characteristicsorclimatechangeimplications[5].
1.3.OBJECTIVE
This project aims to provide a comprehensive analysis of hurricane dynamics by leveraging advanced visualization techniques to uncover patterns in frequency, intensity, geographic distribution, and storm lifespans. By integrating time-series analyses, geospatial distributions, and multivariate relationships, the study offers a multidimensional exploration of hurricane behaviorunderchangingclimaticconditions.
The visualizations developed in this project, including correlations between wind speed and minimum pressure,seasonalactivitytrends,andgeospatiallandfall patterns, reveal nuanced insights into hurricane dynamics. Time-series decomposition highlights longterm trends alongside seasonal variations, while cluster analysesuncoverrelationshipsbetweenstormpathsand lifespans, addressing gaps overlooked by simpler analyses.
The findings have practical implications for climate research and disaster preparedness, offering actionable insights for identifying high- risk areas and understanding the increasing intensity of hurricanes. By synthesizing complex datasets into clear, interactive visualizations, this project bridges gaps in existing tools and contributes to a deeper understanding of hurricane behavioranditsconnectiontoclimatechange.
International Research Journal of Engineering and Technology (IRJET) e-ISSN:2395-0056
Volume: 12 Issue: 01 | Jan 2025 www.irjet.net p-ISSN:2395-0072
2. DATASET AND ANALYSIS
2.1.ANALYSISOFDATA
The dataset used in this project is a comprehensive tabular resource, spanning the years 1851 to 2015, with 49,105 entries across 22 columns [7]. It contains both numerical and categorical data related to historical hurricanes in the United States, making it ideal for analyzing long-term trends and patternsinhurricaneactivity.Keyfeaturesofthedataset include:
Unique Identifiers: Each hurricane is representedbyauniqueIDfortracking.
Temporal Data: Detailed event dates and times foraccuratechronologicalanalysis.
Geospatial Coordinates: Latitude and longitude datatomaphurricanetrajectoriesandlandfalls.
Meteorological Variables:Maximumwindspeed, Minimum pressure and Wind measurements at varying intensities (low, moderate, and high) across different quadrants (northeast, southeast, southwest,northwest).
The dataset’s detailed structure allows for a thorough analysis of hurricane frequency, intensity, geographic distribution, and lifespans. Its richness supports the project's objectives of uncovering long-term trends and providing actionable insights for disaster preparedness andclimateresearch.

2.2.DATAPREPROCESSING
2.2.1. HANDLING MISSING & INVALID VALUES
To ensure data integrity, placeholder values suchas-999weresystematicallyidentifiedandremoved where necessary. Missing entries in critical columns, such as wind speed and minimum pressure, were carefully analyzed. Depending on the context, missing
valueswereeitherinterpolatedtopreservecontinuityor excluded to maintain consistency. Following these procedures, no null values remained in the dataset, confirmingitsreadinessforanalysis.
2.2.2.GEOGRAPHICCOORDINATE
Date fields were standardized into a consistent datetimeformattofacilitateseamlesstemporalanalyses. Geographic coordinates, originally recorded as directional strings (e.g., "28.5N"), were converted into numeric values compatible with geospatial tools, enablingprecisemappingandspatialanalysis.
2.2.3.OUTLIERDETECTION
Box plots and interquartile range (IQR) methods were employed to identify and address outliers in key variables, such as wind speed and minimum pressure. While extreme values representing valid intense storms wereretainedfortheirsignificance,erroneousorinvalid entries were removed to enhance data accuracy and reliability.
2.2.4.COREIDEAS
&PROTOTYPE
The project’s central focus is to provide a comprehensive analysis of hurricane trends by employing a combination of time-series, geospatial, and multivariate visualizations. Early prototypes were developed to experiment with various visualization techniques, refining approaches to effectively capture andcommunicatehurricanedynamics.
2.3.
CANDIDATE VISUALIZATION METHODS & SELECTION
This project explores a range of visualization techniques to analyze hurricane patterns, focusing on clarity, analytical depth, and interactivity. Each method was assessed for its ability to uncover meaningful insightsabouthurricanefrequency,intensity,andspatial behavior.
2.3.1.TIMESERIES
PLOTS
Time-series plots were employed to analyze long-term trends in hurricane frequency and intensity. Line plots were refined with additional layers to highlight hurricane categories and intensity variations over time. While they excel at representing temporal changes clearly and concisely, their ability to depict seasonal variations or multivariate relationships is limited. To address this, these plots were enhanced to provide insights into overarching patterns spanning decades.
International Research Journal of Engineering and Technology (IRJET) e-ISSN:2395-0056
Volume: 12 Issue: 01 | Jan 2025 www.irjet.net p-ISSN:2395-0072

5: Time-SeriesPlot.
2.3.2.GEOSPATIALVISUALIZATIONS
Geospatial techniques, such as heatmaps and trajectory maps, were used to map hurricane paths, density, and regional hotspots. Heatmaps effectively highlighted areas of frequent hurricane activity, while trajectory maps illustrated storm paths. However, static visuals were found to lack interactivity and clarity in denseregions.Toovercomethesechallenges,interactive heatmaps with temporal sliders were chosen, offering dynamic exploration of spatial data while maintaining visualclarity.

2.3.3.SCATTERPLOTS&PAIRPLOTS
Scatterplots and pairplots were used to investigate relationships between variables like wind speed, pressure, and storm categories. Scatterplots, enhanced with transparency and color-coded variables, effectively captured key correlations and multivariate interactions. Pairplots, though useful for smaller datasets, suffered from overplotting and clutter when applied to dense data. Consequently, they were selectively applied to smaller subsets to ensure interpretability.

2.3.4.BOXPLOTS&KDEPLOTS
Boxplots and KDE plots were used to visualize seasonal variations and intensity distributions. Boxplots highlighted monthly patterns of hurricane activity, particularly during peak months, while KDE plots showcased the rarity of extreme storms through smoothedprobabilitydistributions.Thoughlesseffective for long-term trends, these plots provided valuable insights into seasonal and distributional characteristics ofhurricanes.
8: BoxPlot[11].
2.3.5.CLUSTERANALYSIS
Clusteranalysiswasappliedtogrouphurricanes basedontheirpathsandbehaviors.Usingclustergraphs with labeled groupings, distinct spatial clusters were identified, revealing patterns in storm origins and trajectories. Despite challenges in interpreting cluster boundaries without geographic overlays, this method effectively highlighted high-risk regions and unique storm behaviors, offering actionable insights for spatial analysis.
International Research Journal of Engineering and Technology (IRJET) e-ISSN:2395-0056
Volume: 12 Issue: 01 | Jan 2025 www.irjet.net p-ISSN:2395-0072

Figure 9: ClusterAnalysis[12].
2.4.FAILEDEXPERIMENTS
Several visualization experiments did not yield meaningfulresultsorpresentedchallengesthatrequired iterativerefinements:
2.4.1.3DVISUALIZATIONS
3D scatterplots were initially tested to representspatialhurricane data,aimingtoadddepthto the analysis. However, overlapping points and limited interactivity rendered these visualizations difficult to interpret. The complexity of 3D representations often obscured insights rather than enhancing clarity. As a result, the focus shifted toward 2D geospatial visualizations, which offered better interactivity and readabilitywhilepreservingthespatialdetailneededfor analysis.
2.4.2.OVERLOADED PAIRPLOTS
Pairplots were utilized to explore multivariate relationships,includingwindspeed,pressure,andstorm categories. However, early attempts included too many variables simultaneously, resulting in visually overwhelming and cluttered plots. This lack of clarity hindered effective pattern recognition. To address this, theapproach wasrefined byselectivelyfocusingonkey variables and applying pairplots to smaller, targeted subsets of the data, improving their interpretability and analyticalvalue.
3.RESULTS & INSIGHTS
3.1.VISUALIZATIONS&INSIGHTS
3.1.1. TEMPORAL TRENDS IN HURRICANE ACTIVITY
3.1.1.1. BAR CHART OF HURRICANE FREQUENCY BY YEAR
The bar chart illustrates the frequency of hurricanes over time, covering the period from 1851 to 2015. In the early years of the dataset, hurricane occurrences were relatively low, reflecting either fewer storms,incompleterecords,orlimitationsinobservation technologyandreportingmethodsduringthatera.
Asthetimelineprogressesintothelatterhalfofthe19th century,hurricaneactivityshowsasteadyincrease.This upward trend likely reflects advancements in storm detection, meteorological instrumentation, and documentation accuracy, as well as changes in climatic conditions influenced by natural variability and anthropogenicfactors.
The data reveals noticeable fluctuations, with periodic spikes in hurricane activity during certain years. These variationssuggesttheinfluenceofnaturalclimaticcycles or anomalies, such as El Niño-Southern Oscillation (ENSO) phenomena, including El Niño and La Niña events,whichsignificantlyaffectthefrequency,intensity, andtrajectoryoftropicalstorms.
Over the entire observed period, the frequency of hurricanes demonstrates a general upward trend, culminating in a peak in recent decades. Thispattern may be attributed to global warming, improvements in satellite technology, radar systems, and monitoring efforts, as well as heightened awareness and data collection in the modern era. These findings underscore the evolving nature of hurricane activity, the role of climate change, and the importance of continuous monitoring, data analysis, and scientific research to betterunderstandlong-termtrendsandtheirimpactson vulnerableregions.
International Research Journal of Engineering and Technology (IRJET) e-ISSN:2395-0056
Volume: 12 Issue: 01 | Jan 2025 www.irjet.net p-ISSN:2395-0072

Year.
3.1.1.2. LINE PLOT OF MAXIMUM WIND SPEEDS OVER TIME
The line plot depicts trends in maximum wind speeds from 1850 to the early 2000s, showcasing the variability and evolution of hurricane intensity over time. In the earlier years, wind speeds display considerable fluctuations without a clear or consistent pattern, reflecting the natural variability of storms and potential limitations in historical data collection methods.
As the timeline progresses, particularly from the mid20th century onwards, there is a noticeable upward trend in maximum wind speeds. This gradual increase may be indicative of stronger hurricanes forming over time, possibly driven by factors such as warming ocean temperatures, changing atmospheric conditions, and increased ocean heat content. Alternatively, it may reflect advancements in measurement techniques, such as the introduction of satellite technology, aircraft reconnaissance, and improved anemometer accuracy, which have enhanced the precision of recording wind speeds.
Peaksinwindspeedbecomemorepronouncedinrecent decades, highlighting the emergence of more intense storms. This trend could signify a shift toward higherintensityhurricanes,consistentwiththegrowingimpact of global climate change on extreme weather events, including the increased likelihood of Category 4 and 5 hurricanes.
Despitetheoverallupwardtrend,thedataremainshighly variable, with both exceptionally high and low wind speeds occurring unpredictably throughout the period. This variability underscores the complex interplay of factors influencing hurricane intensity, such as oceanatmosphere interactions, climatic cycles, and regional anomalies, and highlights the need for continued researchintothedriversofthesechanges.

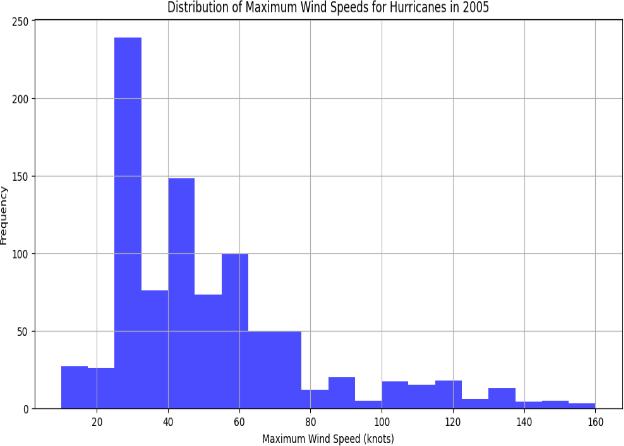
3.1.1.3. BAR CHART OF ANALYZING THE DISTRIBUTION OF WIND SPPED FOR 2005
The hurricane data from 2005 the year with the highest occurrence of hurricanes reveals that the majorityofstormsduringtheyearexhibitedwindspeeds inthe20-40knot range, indicating thatmosthurricanes were of relatively low intensity. This suggests that weaker hurricanes were more common than stronger onesinthisperiod.
The distribution of hurricane wind speeds is notably right-skewed, with fewer occurrences at higher wind speeds. This pattern highlights the relative rarity of strong hurricanes, emphasizing that extreme weather eventswithhighwindspeedswereinfrequentcompared totheirlessintensecounterparts.
Notably, the 20-40 knot range accounted for the highest frequency of hurricanes, with over 250 storms falling into this category. This underscores the dominance of low-intensity hurricanes during 2005. However, a small subset of hurricanes registered wind speeds exceeding 100 knots. These storms, though fewer in number, representthemostpowerfulandpotentiallydevastating events of the year, posing significant risks to affected regions.
International Research Journal of Engineering and Technology (IRJET) e-ISSN:2395-0056
Volume: 12 Issue: 01 | Jan 2025 www.irjet.net p-ISSN:2395-0072
speedfor2005.
3.1.1.4.
BARCHARTOFHURRICANE FREQUENCY BY DECADE
The bar chart illustrates the frequency of hurricanes bydecade,revealing adistinct upward trend inhurricaneactivityfromthemid-19thcenturythrough the mid-20th century. This steady increase reflects the growth in recorded storm events, likely influenced by advancements in storm detection and reporting technologiesduringthisperiod.
Thefrequencyofhurricanescontinuestorise,peakingin the2000s,whichrepresentsthedecadewiththehighest recorded activity. This peak underscore a period of heightened hurricane occurrence, possibly driven by favorable climate patterns,globalwarming,orimproved monitoringcapabilities.
Following this peak, there is a gradual decline in hurricane frequency in subsequent decades. The noticeable decrease may be attributed to a combination of factors, such as shifts in climate dynamics, enhanced early warning systems that detect and track hurricanes earlier, and potential changes in data collection and reportingmethodologies.
The overall trend highlights a significant increase in hurricaneactivitythroughthe20thcentury,culminating in a peak in the 2000s, followed by a slight decline in more recent decades. This pattern emphasizes the evolving nature of hurricane activity and the role of technological advancements,environmental factors,and climate variability in shaping our understanding of stormtrendsovertime.

3.1.1.5. LINE PLOT OF RELATIONSHIP BETWEEN MINIMUM PRESSURE & NUMBER OF HURRICANES
Thelineplotillustratestherelationshipbetween minimum pressure (in hPa) and the number of hurricanes, revealing key insights into the distribution and intensity of storms. The plot shows that hurricanes are most frequent at pressures around 1000 hPa, with the count peaking sharply nearthis value.Thissuggests thatmoderate-intensitystormsarethemostcommon.
As minimum pressure decreases below 1000 hPa, the numberofhurricanesgraduallydeclines.Thisreflectsthe relative rarity of storms with extremely low pressures, which are typically the most intense hurricanes. These low-pressure systems are less frequent but are often associatedwithgreaterdestructivepotential.
Similarly, as pressure increases above 1000 hPa, the frequency of hurricanes also diminishes. This trend highlights the scarcity of weaker storms or tropical depressions within the dataset, suggesting that storms withhigherminimumpressuresarelesslikelytodevelop orberecordedashurricanes.
Overall, the pattern emphasizes a strong correlation between lower pressure and storm intensity, with most hurricanes clustering around moderate pressure levels. This distribution provides valuable insights into the typical pressure ranges associated with hurricanes and underscores the critical role of pressure in defining stormstrengthandfrequency.
International Research Journal of Engineering and Technology (IRJET) e-ISSN:2395-0056
Volume: 12 Issue: 01 | Jan 2025 www.irjet.net p-ISSN:2395-0072

14: LinePlotofRelationshipBetweenMinimum PressureandNumberofHurricanes.
3.2.SEASONALPATTERNS
3.2.1.
BAR CHART OF HURRICANE FREQUENCY BY MONTH
The bar chart illustrating hurricane frequency by month highlights a well-defined seasonal pattern in storm activity. From January through May, hurricane occurrences are minimal, reflecting the off-season for Atlantic hurricanes when atmospheric and oceanic conditionsarelessfavorableforstormdevelopment.
Hurricane activity begins to rise gradually in June, signallingtheonsetoftheofficial hurricaneseason.This increase accelerates during the summer months, peaking sharply in August and September. These two months stand out as the most active period for hurricanes, driven by optimal conditions such as warm sea surface temperatures and conducive atmospheric dynamicsthatfuelstormformationandintensification.
Following this peak, hurricane activity declines in October as seasonal conditions become less supportive ofstormdevelopment.ByNovemberandDecember,the frequencyofhurricanestapers off significantly, marking thetransitionintotheoff-season.
This observed pattern aligns closely with the typical Atlantic hurricane season, characterized by the highest storm activity in late summer and early fall. The data underscores the influence of seasonal environmental factorsonhurricaneformationandhighlightsthecritical need for preparedness during the peak months of AugustandSeptember.

15: BarChartofHurricaneFrequencybyMonth.
3.2.2. BAR CHART OF WIND SPEED DISTRIBUTION FOR HURRICANES IN SEPTEMBER
The analysis of hurricane activity in September reveals that the majority of storms during this month had maximum wind speeds between 20-60 knots. This indicates that most hurricanes were weaker tropical storms or low- intensity hurricanes, contributing to a larger proportion of less severe weather events during thepeakofhurricaneseason.
A significant number of hurricanes were observed with wind speeds in the 60-100 knot range. These storms represent more intense hurricanes, indicating an increased likelihood of stronger weather systems occurringalongsidethemajorityofweakerstorms.
Additionally, a small subset of hurricanes in September recorded wind speeds exceeding 100 knots. These storms were the most powerful and potentially destructive, highlighting the risk of extreme weather eventsevenwithinthecontextof a month dominated by lessseverestorms.
Theoveralldistributionofwindspeedsisright-skewed, with the majority of hurricanes at lower intensity levels and a smaller number achieving significantly higher wind speeds. This pattern underscores the variability in hurricaneintensity,emphasizingthatwhilemoststorms are less severe, the potential for highly destructive hurricanesremainsa critical concernduringSeptember, themostactivemonthofthehurricaneseason.
International Research Journal of Engineering and Technology (IRJET) e-ISSN:2395-0056
Volume: 12 Issue: 01 | Jan 2025 www.irjet.net p-ISSN:2395-0072

3.2.3.
BOX PLOT OF MAXIMUM WIND SPEEDS BY MONTH
The box plot illustrates the distribution of maximum wind speeds for hurricanes across different months, highlighting seasonal variations in storm intensity. From January to May, median wind speeds remain relatively consistent, with moderate ranges and fewer extreme values. This suggests a quieter period withlessintensestorms,reflectingthetypicaloff-season forhurricanes.
StartinginJune,thevariabilityinwindspeedsbeginsto increase, as indicated by the wider interquartile ranges and the emergence of more outliers. This marks the onsetofthehurricaneseason,withconditionsbecoming increasingly favorable for storm development and intensification.
ThemonthsofAugust,September,andOctobershowthe peak in both maximum wind speeds and variability. During this period, median wind speeds rise significantly, and the distributions broaden, with a notableincreaseinthenumberof extremeoutliers.This pattern aligns with the peak of the hurricane season, when powerful storms are more likely to occur due to optimalatmosphericandoceanicconditions.
After October, wind speeds and their variability gradually decrease, returning to lower levels by December.Thisdeclinecorrespondstothetransitionout of the hurricane season, as environmental factors becomelessconducivetostormformation.Thisseasonal analysis underscores the heightened risk during late summer and early fall and the relative stability of wind speedsoutsidethisactiveperiod.

3.3.HURRICANEINTENSITYTRENDS
3.3.1. PLOT OF MAXIMUM WIND OVER TIME
The analysis of hurricane intensity categories overtime revealsdistincttrendsintheir frequency and variability. Category 1 hurricanes exhibit a moderately high and stable range throughout the timeline, with no sharp declines or anomalies. This indicates a consistent frequency of occurrence, reflecting the stability of this categoryovertime.
In contrast, Category 2 hurricanes show greater variability, with noticeable spikes that suggest occasional increases in activity. This category's timeline features both high and low extremes, emphasizing a moredynamicpatterncomparedtoCategory1.
Category3hurricanesfollowatrendsimilartoCategory 1 but display slightly more pronounced fluctuations. Peaks and troughs are evident, indicating periods of increased activity interspersed with quieter phases. While these fluctuations are more apparent, the overall trend remains relatively stable compared to higher categories.
The most variability is observed in Category 4 hurricanes, characterized by significant peaks and declines. These fluctuations suggest sporadic occurrences, making this category less consistent over timethanthelower-intensitycategories.This variability could be influenced by external factors such as climate anomalies, ocean temperature variations, or changes in reportingpractices.
Overall,Categories1and3demonstraterelativestability in their frequency, whereas Categories 2 and 4 exhibit marked variability. This analysis highlights how hurricane intensity varies by category, with higher-
International Research Journal of Engineering and Technology (IRJET) e-ISSN:2395-0056
Volume: 12 Issue: 01 | Jan 2025 www.irjet.net p-ISSN:2395-0072
intensity hurricanes (e.g., Category 4) showing less stability and more dynamic patterns than lower categories. These findings offer insights into the behavior of hurricanes across different intensity levels and underline the influence of external factors on their occurrence.

18: PlotofMaximumWindOverTime.
3.4.GEOGRAPHICDISTRIBUTION
3.4.1. HEATMAP OF HURRICANE DENSITY
The heatmap visualization effectively demonstrates the density or intensity of data points within a specific region. Areas represented by brighter colors, transitioning from green to yellow and red, indicate regions of higher density or frequency of activity. These regions stand out as focal points where valuesoroccurrencesaresignificantlyconcentrated.
Incontrast,darkerblueregionsreflect areaswithlower density, where activity is sparse or less frequent. Black areas on the heatmap signify the absence of activity, markingregionswithnorecordeddatapointsorevents.
The clustering of brighter colors in specific sections highlights hotspots or zones of heightened activity. These focal areas suggest trends or patterns within the dataset, providing valuable insights into regions of interest or concern when compared to the surrounding areas with lower intensity. This visualization helps identify and analyse spatial or categorical distribution patternseffectively.

3.4.2. CLUSTER ANALYSIS OF HURRICANE PATHS
The scatter plot provides a visualization of hurricane paths, clustered by region, with each cluster distinguished by a unique color. The x- axis represents longitude, while the y-axis represents latitude, allowing for a clear geographic grouping of hurricanes based on theirtrajectories.
One notable cluster is concentrated in the southern latitudes and spans a relatively narrow longitudinal range, likely corresponding to hurricanes that form and remain within tropical regions. These storms are typically influenced by warm ocean temperatures and stableatmosphericconditionsprevalentintheseareas.
Otherclusters extendintohigher latitudes, representing hurricanes that move further north. These storms often undergo transitions into extratropical systems as they encounter cooler waters and different atmospheric dynamics.Thedispersionoftheseclustersillustratesthe variabilityinhurricanepathsandbehaviors.
The separation between clusters reflects variations in hurricane activity influenced by geographic and environmental factors, such as ocean temperatures, atmospheric conditions, and prevailing wind patterns. These distinctions help identify regions with specific stormcharacteristicsandbehaviors.
Additionally, one cluster appears out of place at a farright longitude, potentially signalling anomalous data or unique storm behavior. This anomaly warrants further investigationtodeterminewhetheritreflectsanerroror an unusual hurricane trajectory. Overall, this visualization effectively highlights the geographic patterns and differences in hurricane paths, offering valuable insights into storm behavior and regional activity.
Volume: 12 Issue: 01 | Jan 2025 www.irjet.net p-ISSN:2395-0072

3.5.STATISTICAL RELATIONSHIPS
3.5.1.CORRELATION
MATRIX
The correlation matrix provides an overview of therelationshipsbetweenthreekeyvariables:Maximum Wind,MinimumPressure,andYear.Thediagonalvalues, all equal to 1.00, confirm that each variable is perfectly correlated with itself, serving as a baseline for interpretation.
The correlation between Maximum Wind and Minimum Pressure is near zero (0.01), indicating no significant linear relationship between these variables. This suggeststhatvariationsinonedonotpredictchangesin the other within the dataset. This lack of correlation couldreflectthecomplexinterplayoffactorsinfluencing windspeedsandpressureduringstorms.
The relationship between Minimum Pressure and Year showsastrongpositivecorrelation(0.72).Thisindicates a trend toward lower minimum pressures as time progresses, which could reflect an increase in storm intensityinrecentyears.Lowerminimumpressuresare oftenassociatedwithmorepowerfulhurricanes,making this trend noteworthy for understanding changes in stormdynamicsovertime.
Incontrast,thecorrelationbetweenMaximumWindand Year is weakly negative (-0.22). This suggests a slight decrease in maximum wind speeds over the observed period. However, the weak nature of this correlation indicatesthatthistrendisnotverypronouncedandmay beinfluencedbyotherfactorsorvariabilityinthedata.
Overall, the correlation matrix highlights key insights into the interrelationships among these variables. The strongconnectionbetween YearandMinimumPressure stands out as a significant finding, while the weaker correlations suggest more nuanced dynamics that may requireadditionalinvestigationandanalysis.

3.5.2.PAIRPLOT
The pair plot offers a comprehensive visualization of the relationships between Maximum Wind, Minimum Pressure, and Year, while also illustratingthedistributionofeachvariable.
The diagonal plots show the distributions for each variable. Maximum Wind displays a right-skewed distribution,indicatingthatlowerwindspeedsare more common, with fewer instances of extreme high speeds. Minimum Pressure has a bimodal distribution, suggesting the presence of two distinct groups, likely reflectingdifferencesinstormintensity.Thedistribution for Year reveals an increasing concentration of data points in recent decades, which can be attributed to improvedmeasurementtechniquesandmoreconsistent record-keeping.
The scatter plots in the off-diagonal grids provide insights into pairwise relationships. The relationship between Maximum Wind and Minimum Pressure is inversely proportional, with higher wind speeds generally corresponding to lower pressures. This aligns with established hurricane dynamics, where stronger stormsareassociatedwithlowercentralpressures.
The scatter plots involving Year demonstrate an increasingdensityofdatapointsinmorerecentyearsfor bothMaximumWindandMinimumPressure.Thistrend reflects advancements in storm monitoring and the expansionofhistoricalstormrecords,resultinginamore comprehensivedatasetovertime.
Additionally, the data points are color-coded based on storm status (e.g., HU for hurricanes, TS for tropical storms, EX for extratropical systems). This color coding revealsdistinctclustersthatcorrespondtodifferencesin stormintensityandcharacteristics,furtherenrichingthe analysisoftherelationshipsbetweenthevariables.
Overall, the pair plot provides valuable insights into the trends and relationships among these variables, emphasizing how storm data has evolved over time and howstormcharacteristicsdifferbyintensity.
International Research Journal of Engineering and Technology (IRJET) e-ISSN:2395-0056
Volume: 12 Issue: 01 | Jan 2025 www.irjet.net p-ISSN:2395-0072

3.6.HURRICANE LIFESPANS
3.6.1. HISTOGRAM OF HURRICANE LIFESPANS
The histogram illustrates the distribution of hurricanelifespansmeasuredindays, shedding light on the typical duration of these storms. The majority of hurricaneshavelifespansbetween1to5days,withthis range exhibiting the highest frequency. This finding underscores that most hurricanes are relatively shortlivedevents.
Beyond the 5-day mark, the frequency of hurricanes decreases steadily. This trend indicates that as storms persist for longer durations, their occurrence becomes increasingly rare. Lifespans exceeding 15 days are uncommon, and hurricanes lasting over 20 days are exceptionallyrare,representingoutliersinthedataset.
This distribution emphasizes that most hurricanes rely on favorable environmental conditions, such as warm ocean waters and conducive atmospheric dynamics, to sustain their intensity and longevity. These conditions often dissipate quickly, leading totheshort-livednature ofthemajorityofstorms.Thehistogramprovidesaclear depiction of the typical lifespan of hurricanes, with a sharpdeclineinfrequencyasdurationsextendbeyonda fewdays.

Figure23: HistogramofHurricaneLifespans.
3.7.CUMULATIVEIMPACT
3.7.1. LINE PLOT OF CUMULATIVE HURRICANE LANDFALLS
The line plot illustrates the cumulative number ofhurricanelandfallsovertime,spanning from the mid19th century to the early 21st century. The consistent upwardtrendindicatesasteadyincreaseintherecorded number of landfalls. This pattern could reflect either an actual rise in hurricane landfall occurrences or improvementsindetectionandrecord-keepingpractices overtheyears.
The slope of the curve remains relatively uniform, suggesting that the overall rate of landfalls has not undergone significant changes over time. While minor fluctuations are visible, they do not appear to represent substantial shifts in the underlying trend, pointing to a relativelystablelong-termpattern.
This visualization highlights the cumulative nature of hurricane activity, capturing the growing total of recorded landfalls over the observed period. It also underscores theinfluence of historical advancements in tracking and reporting, which likely contributed to the consistentincreaseinrecordedevents.Theplotprovides acleardepictionofhowthecumulativetotaloflandfalls has evolved, offering insights into both natural and technologicalfactorsshapingthedata.

Figure 24: LinePlotofCumulativeHurricaneLandfalls.
3.8.DIRECTIONALPATTERNS
3.8.1.
POLAR PLOT OF HURRICANE DIRECTIONS
The polarchart providesa clearvisualizationof the distribution of hurricane directions, illustrating the frequency of storms moving in specific compass directions. The data reveals that the most prominent activity is concentrated in the northeast (NE) quadrant, indicating that hurricanes predominantly travel in this
International Research Journal of Engineering and Technology (IRJET) e-ISSN:2395-0056
Volume: 12 Issue: 01 | Jan 2025 www.irjet.net p-ISSN:2395-0072
direction. This trend is likely driven by atmospheric pressure systems and prevailing wind patterns that steerstormstowardthenortheast.
Moderate activity is also observed in the northwest (NW) and east (E) directions, reflecting additional commonpathwaysforhurricanemovement.Incontrast, the southern quadrants (SW and SE) show minimal hurricane frequency, suggesting that storms rarely travel in these directions, likely due to the geographic and atmospheric constraints in hurricaneproneregions.
The radial values of the chart quantify the number of hurricanes for each direction, emphasizing the dominance of the NE quadrant while showcasing the relative frequencies of other directions. This visualization effectively highlights the primary directional patterns of hurricanes, providing insights into their typical trajectories and the environmental factorsinfluencingtheirmovement.

The analysis of hurricane wind speeds by direction reveals significant trends in storm intensity across compass directions. Hurricanes moving in the northeast (NE) direction exhibit the highest average wind speeds across all categories Low, Moderate, and High. This confirms that hurricanes tend to intensify as they move northeast, likely influenced by favorable atmosphericconditionsandprevailingwindpatterns.
In the southeast (SE) and northwest (NW) directions, average wind speeds are comparable but slightly lower than those in the NE direction. This indicates that hurricanesmaintainmoderateintensitywhilemovingin these directions, suggesting a balance between conduciveconditionsandlimitingfactors.
In contrast, the southwest (SW) direction records the lowest average wind speeds. This trend suggests that hurricanes rarely sustain high winds when moving SW, possibly due to interactions with landmasses or cooler watertemperaturesthatinhibitstormintensity.
Interestingly, across all directions, the Low Wind categoryhasthehighestaveragespeedscomparedtothe Moderate and High Wind categories. This indicates that hurricanes with broaderwind fields at lower intensities are more common, reflecting the typical structure and behaviorofmanystorms.
Overall, this directional analysis highlights the tendency of hurricanes to intensify in the NE direction, maintain moderatestrengthinSEandNWdirections,andweaken in the SW direction, while also emphasizing the prevalence of broader, low-intensity wind fields in storms.

26: BarChartofAverageWindSpeedsby Directions.
3.9.PRESSURE-WINDRELATIONSHIPS OVER TIME
3.9.1. LINE CHART OF TRENDS IN AVERAGE MINIMUMPRESSURE&WIND SPEEED BY DECADE
The chart illustrates the trends in two key metrics, Average Minimum Pressure (hPa) and Average Maximum Wind Speed (mph), over time, highlighting notabledifferencesintheirbehaviorandvariability.
The blue line, representing Average Minimum Pressure, shows a dramatic shift beginning around the mid-20th century, particularly post-1940. Before this period, values were in the negative range, likely due to early measurement inaccuracies or data inconsistencies. However, after the 1940s, there is a steep positive trend, indicating significant changes in pressuretrends.Thisshiftcouldreflectadvancementsin measurement techniques, changes in data reporting practices, or environmental factors such as shifts in atmosphericoroceanicconditionsduringthatera.
International Research Journal of Engineering and Technology (IRJET) e-ISSN:2395-0056
Volume: 12 Issue: 01 | Jan 2025 www.irjet.net p-ISSN:2395-0072
In contrast, the orange line, representing Average Maximum Wind Speed, remains relatively flat across all decades, indicating stability in wind speeds over time. The consistent scale for wind speed, closer to zero with much less variability, suggests that wind speed has not experienced the same dramatic changes as pressure duringtheobservedperiod.
The notable increase in Average Minimum Pressure after the 1940s, compared to the flat trend in wind speed, suggests a lack of direct correlation between these two metrics in this dataset. This divergence emphasizes that changes in one metric do not necessarily reflect similar patterns in the other, potentially due to differences in the underlying factors influencingpressureandwindspeed.
Overall, the sharp rise in pressure trends after 1940 highlights the impact of historical advancements in meteorological measurements or significant environmentalchanges,whilethestabilityinwindspeed underscores the need to explore other contributing factorstohurricanedynamics.

Figure 27: LinechartoftrendsinAverageMinimum PressureandWindSpeedbyDecade.
3.10.KDEPLOT OFWIND SPEEDS
3.10.1. KERNEL DENSITY ESTIMATION (KDE) PLOT
The KDE plot provides a detailed visualization of the distribution of maximum wind speeds, highlightingkeypatternsinstormintensity.Thedensity curve peaks around moderate wind speeds, suggesting that the majority of recorded storms fall within this range and are not extreme in nature. This peak representsthetypicalintensityofmoststorms.
Aswind speed increases,thedensity graduallydeclines, indicating that fewer storms achieve high wind speeds. This trend reflects the relative rarity of extreme hurricanes, with only a small proportion of storms reachingexceptionalintensity.
An isolated density peak is observed at negative wind speeds. This anomaly is likely due to data irregularities, such as measurement errors, data entry mistakes, or cases involving reversed directionality in storm reporting. This warrants further investigation to clarify itsorigin.
Overall, the plot reveals a skewed distribution, with a concentrationofstormsatmoderatetohighwindspeeds. Thispatternalignswiththecharacteristicsofhurricanes andstrongstorms,emphasizingthatwhileextremewind speeds are uncommon, they remain a critical feature of thedataset.

3.11.TIMESERIES ANALYSIS
3.11.1. TIME SERIES DECOMPOSITION OF HURRICANE COUNTS OVER YEARS
The time series decomposition provides a detailed breakdown of the data into its key components observed, trend, seasonal, and residual offering a comprehensive view of the underlying patternsandvariations.
Thetoppanel,displayingtheobserveddata,capturesthe overall fluctuations and variability over time. This providesahigh-levelviewofthedata'sbehavior,setting thestageforadeeperanalysisofitscomponents.
Thetrendcomponent,showninthesecondpanel,reveals a gradual increase over time, particularly evident in the 20thcentury.Thisupwardtrendlikelyreflectslong-term growth or changes within the data, possibly due to external factors or systemic developments affecting the underlyingphenomenon.
Theseasonalcomponent,representedinthethirdpanel, exhibits a consistent, repeating pattern over time, highlighting the presence of strong seasonality. This
International Research Journal of Engineering and Technology (IRJET) e-ISSN:2395-0056
Volume: 12 Issue: 01 | Jan 2025 www.irjet.net p-ISSN:2395-0072
regular cycle underscores the influence of periodic factors that recur at predictable intervals, driving significantportionsofthedata'svariability.
Finally, the residuals, displayed in the bottom panel, appear randomly distributed around zero. This randomness indicates that the decomposition has effectively captured the primary patterns in the data, leaving only noise or unexplained variability in the residuals.
This analysis demonstrates both the long-term growth trend and the strong seasonal cycles present in the dataset, while confirming the effectiveness of the decomposition process in isolating these key components. It provides valuable insights into the structure and drivers of the data, facilitating a clearer understandingofitsbehaviorovertime.

4.CHALLENGES AND FAILED EXPERIMENTS
4.1.OUTLIERDETECTION& RETENTION
Identifying and managing outliers was crucial for maintaining the dataset's integrity, especially for variables like maximum wind speed and minimum pressure. However, defining appropriate thresholds posed a challenge since extreme values often represented rare but meaningful hurricane events. Removing too many outliers risked losing critical insights into the most intense storms, necessitating a balancedapproach.
4.2.
COMPLEXITYOFMULTIVARIATE DATA
Pair plots and scatter plots were initially overwhelmed by overlapping clusters caused by high variability in storm characteristics. This limited the
visual clarity and interpretability of the relationships between variables. Filtering the data or categorizing storms by status improved the ability to draw meaningfulconclusions.
4.3.GEOSPATIALVISUALIZATIONS
Early iterations of heatmaps suffered from clutter due to the high density of hurricane data, which obscured regional patterns. Refining the heatmaps by filtering based on intensity or clustering by region significantlyenhancedtheirclarityandusability.
4.4.
TEMPORAL VARIABILITY & DATA LIMITATIONS
Therelationshipbetweenstormcharacteristics,such as wind speed and pressure, and time was complicated byhistorical variations in data collection and reporting. For example, underreporting in earlier years likely biased trend analyses, requiring careful consideration wheninterpretinglong-termresults.
4.5.
METHODOLOGICAL ADAPTATIONS
Time-series decomposition was effective for analyzing long-term and seasonal trends but less suited for capturing short-term anomalies, which required the developmentofseparateanomalydetectionmethods.
Clustering methods for hurricane paths revealed useful geographic patterns but occasionally produced outliers or misclassified storms due to atypical paths or inconsistentdata.
4.6.
INSIGHTSANDIMPLICATIONS
The project utilized a diverse range of visualizations to analyze critical aspects of hurricane activity and their broader implications. Time-series analyses revealed a steady increase in hurricane frequency over the decades, reflecting environmental changes and improved detection technologies. Significantspikesinactivityduringspecificperiodswere attributedtoclimaticphenomenasuchasElNiñoandLa Niña, underscoring the influence of global weather patterns on storm behavior. A stacked area chart highlighted a marked rise in severe hurricanes (Categories 3–4), linked to rising sea surface temperatures and shifting atmospheric conditions, indicative of the growing impact of climate change on stormintensity.
Geographic patterns were analyzed using heatmaps, which pinpointed high hurricane activity zones, particularlyalongwarmcurrentsintheAtlanticandGulf of Mexico, providing clear insights into geographic vulnerabilities. Seasonal trends emerged from monthly
International Research Journal of Engineering and Technology (IRJET) e-ISSN:2395-0056
Volume: 12 Issue: 01 | Jan 2025 www.irjet.net p-ISSN:2395-0072
frequency analyses, identifying late summer and early fall as peak hurricane periods, emphasizing the predictability of hurricane activity during specific times of the year. Directional trends were visualized using polar charts, illustrating the predominant northeastwardmovementofhurricanes,shapedbyprevailing windpatternsandatmosphericpressuresystems.
Correlation matrices and line charts reinforced fundamental hurricane dynamics, such as the inverse relationship between wind speed and pressure, while clustering methods identified distinct storm trajectories and high-risk regions, providing a more granular understanding of hurricane paths. These visualizations collectively offered a detailed exploration of hurricane behavior, revealing patterns that have significant implications for disaster preparedness and mitigation strategies.
The insights derived from this study are both clear and actionable. Hurricanes are becoming more severe and frequent, reflecting the growing influence of global warming and environmental changes. High-risk regions and specific seasonal periods emphasize the need for localized disaster preparedness strategies. Directional patterns and clustering insights provide predictive cues for hurricane behavior, aiding in disaster response planning. Additionally, advancements in tracking and detection technologies have significantly enhanced the accuracy and depth of hurricane data, enabling more reliableandactionableanalyses.
Thisanalysissuccessfullycapturedlong-termtrendsand nuanced patterns in hurricane behavior, offering valuable insights into the evolving nature of these storms. By employing innovative visualization techniques, the project not only deepened the understanding of hurricane dynamics butalsoprovided actionable knowledge to inform climate research, disaster response, and policy development. The study underscores the importance of data-driven strategies in mitigating the increasing impacts of hurricanes in a changingclimate.
5.FUTURE DIRECTIONS
5.1.
DISCSSION
This study uncovered significant trends in hurricane activity, particularly their increasing frequency and intensity over time. Severe storms, especially those in higher categories (Category 3 and above), have become more common in recent decades. Geographic analysis showed that hurricanes are concentrated in specific hotspots within the Atlantic basin, closely associated with warmoceancurrents and atmospheric conditions. Seasonal patterns aligned with
expectations, with the majority of hurricanes occurring in late summer and early fall, during the Atlantic hurricane season. Additionally, directional patterns indicated a predominant north-eastward movement of hurricanes, influenced by prevailing winds and atmosphericpressuresystems.
However, some limitations must be acknowledged. Incomplete historical records and variations in measurementmethodsovertimemayaffecttheaccuracy of long-term trends. The study's focus on the Atlantic basin further limits its generalizability to global hurricane patterns. Addressing these limitations in future work could enhance the robustness and applicabilityofthefindings.
5.2.CONCLUSION
The findings of this study emphasize that hurricanes are becoming stronger and more frequent, likely as a result of climate change. The analysis also underscored the importance of focusing on specific regions and seasonal patterns to improve preparedness for hurricane activity. By leveraging advanced visualization techniques and comprehensive data analysis, the project provided valuable insights into hurricane behavior and its evolution over time. These results not only enhance our understanding of hurricanes but also offer actionable knowledge for disaster response planning and climate adaptation strategies.
5.3.FUTUREWORK
Future research can expand on this study by examining hurricanes on a global scale to compare trends across different regions. Incorporating additional climate data, such as sea surface temperatures, rainfall, and atmospheric pressure variations, could offer deeper insights into the factors driving hurricane behavior. Machine learning models could further refine predictions of storm intensity and trajectories, enhancingearlywarningsystemsandforecastaccuracy.
Lastly, exploring the socioeconomic impacts of hurricanes, including their effects on communities and economies, could help inform more effective disaster planning and recovery efforts. These steps will advance our understanding of hurricanes and support the development of more comprehensive mitigation strategies, ultimately helping communities better prepareforfuturestorms.
REFERENCES:
[1] Knutson, T. R., et al. (2019). Tropical Cyclones and ClimateChangeAssessment:PartI: Detectionand
International Research Journal of Engineering and Technology (IRJET) e-ISSN:2395-0056
Volume: 12 Issue: 01 | Jan 2025 www.irjet.net p-ISSN:2395-0072
Attribution, https://doi.org/10.1175/BAMS-D18-0189.1
[2] Emanuel, K. A. (2005). Increasing destructiveness oftropicalcyclonesoverthepast
30 years. Nature, 436, 686-688, https://www.researchgate.net/publication/769034
9_Increasing_Destructiveness_of_Tropical_Cycl ones_Over_the_Past_30_Years
[3] NOAA. (2015). Historical Hurricane Tracks, https://oceanservice.noaa.gov/news/historicalhurricanes/
[4] The Washington Post. (2019). Mapping Every U.S. Hurricane, https://www.washingtonpost.com/graphics/2019/ national/mapping-disasters/
[5] FiveThirtyEight. (2017). The Rising Costs of Hurricanes, https://fivethirtyeight.com/features/hurricane- harveysimpact-and-how-it-compares-to-otherstorms/
[6] National Oceanic and Atmospheric Administration (NOAA).HistoricalHurricaneTracks from https://www.nhc.noaa.gov/data/#tracks
[7]https://www.kaggle.com/code/gi0vanni/analys ison-us-hurricane-landfalls/input
[8] Kossin et al., 2020 https://www.pnas.org/doi/full/10.1073/pnas.1920 849117
[9]https://www.nature.com/articles/nature03906
[10]https://www.storytellingwithdata.com/blog/2 017/10/1/how-youd-visualize-hurricanes
[11]https://mynasadata.larc.nasa.gov/minilessonactivity/tropical-cyclone-counts-box-plot
[12]https://www.researchgate.net/figure/Plot-ofHurricane-Harvey-diaster_fig4_367601702
[13]https://images.app.goo.gl/UTSurgVtunbsq943A
© 2025, IRJET | Impact Factor value: 8.315 | ISO 9001:2008 Certified Journal | Page278