
International Research Journal of Engineering and Technology (IRJET) e-ISSN: 2395-0056
Volume: 11 Issue: 12 | Dec 2024 www.irjet.net p-ISSN: 2395-0072

International Research Journal of Engineering and Technology (IRJET) e-ISSN: 2395-0056
Volume: 11 Issue: 12 | Dec 2024 www.irjet.net p-ISSN: 2395-0072
Sharadreddy Patil1 , Almaas Bagwan2 , Manjunath3 , Murtuza4, Ramesh5, Ravikant Guttedar6
1Assistant Professor, Dept. of Civil Engg, Veerappa Nisty Engineering College, Shorapur, Yadgir, Karnatak, India 2,3,4,5,6UG Student Department of Civil Engineering, Veerappa Nisty Engineering College, Shorapur
Abstract - Biogasisa renewableandalternativeenergy source produced through anaerobic digestion of organic matter. The experiment utilized a closed-loop system. In thisprocesskitchenwaste,cowdungandsewagewateris used.Thecombinationofalltheseorganicmatterproduce gaseslikemethane,carbondioxideetc.,thegasiscollected andusedforvariouspurposes.
Key Words: Anaerobic Digestion, Biogas, Kitchen waste, Cow dung, Sewage water, Methane
Biogasisproducedinmanywayssuchasbyusing kitchen waste, food, cattle waste, agricultural waste etc. These wastes are used as raw material for production of biogas ,because of easy availability in large amount and continuousgenerationofthesewastes.
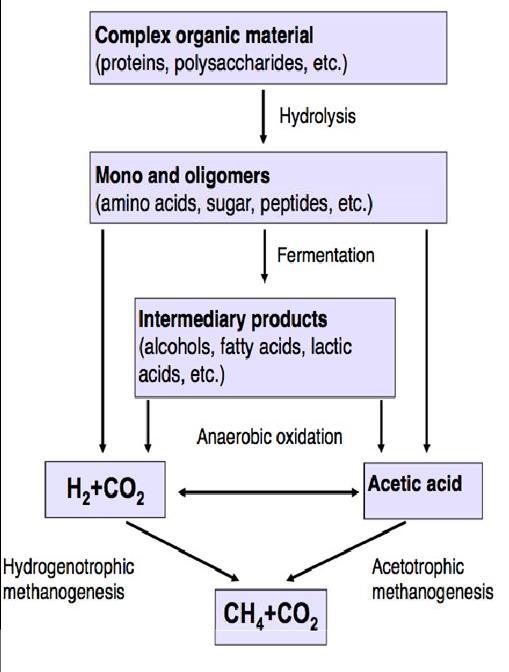
The biochemistry and kinetics of anaerobic process are complicated and the biological conversion of organic matter into methane is brought about by a group ofspecificmicroorganisms.Theschematicsoftheprocess as described by Gujer, Zehnder (1983) involving the hydrolysis of biopolymers such as carbohydrates, lipids and proteins, oxidation and fermentation of amino acids and sugars, fatty acids, alcohol’s and intermediates and the conversion of acetate and hydrogen into methane are schematicallyrepresentedinthefollowingfigure1 [2]
1.2 OBJECTIVES OF THE STUDY
1. Togenerateenergyfromwaste.
2. To study the different physical and chemical parameters
3. offoodwaste,cowdungandsewagewater.
4. ComparisonofBioGasfromconventionalresources.
5. To improve the properties of the soil through the highqualityorganicfertilizer.
6. Tofindecofriendlydisposalmethod.
7. Togeneraterevenuefromthemanureproducedfrom digestedsludge.
2. MATERIALS AND METHODOLOGY
2.1 MATERIALS USED FOR EXPERIMENTAL SETUP
1. 10Lcapacitycontainer(Digester)
2. 10Lcapacitycontainer(Brinesolution)
3. 5Lcapacitycontainer(watercollector)
International Research Journal of Engineering and Technology (IRJET) e-ISSN: 2395-0056
Volume: 11 Issue: 12 | Dec 2024 www.irjet.net p-ISSN: 2395-0072
4. Solidtape
5. Funnel
6. M-seal
7. Pipe1/2"
8. Valve
9. Scale(15CM)
10. LaboratoryNaCl salt(brinesolution)
2.2 WASTE COLLECTION AND PROCESSING
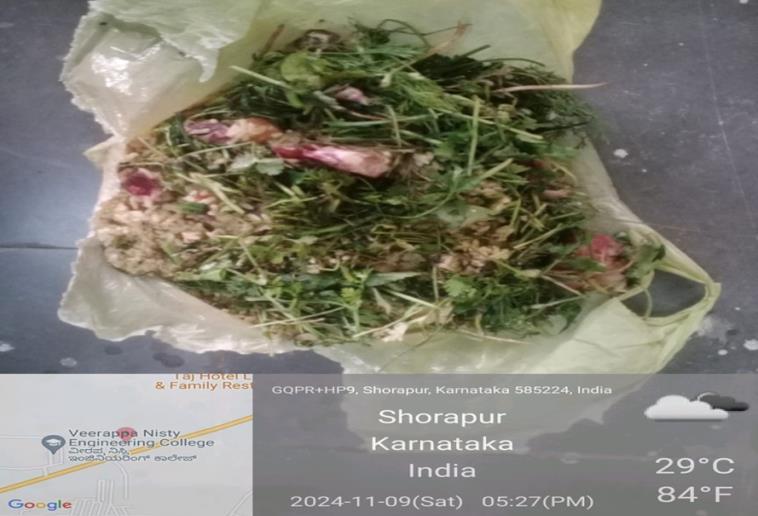
2.2.1 KITCHEN WASTE
Kitchen waste (KW) sample was collected from house. This kitchen waste constitutes of vegetables, cooked rice, peels and unused parts of vegetables, fruit peelsetc.
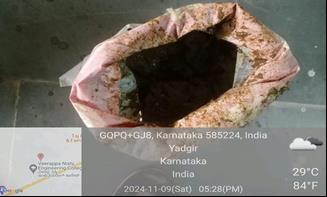
2.2.2 COW DUNG
Cow dung is equine cattle-waste product. Cow manureisindigestibleaccumulationofplantmaterialthat has transversed the gut of the cow This is minerally rich. The colours vary from greenish to blackish, sometimes darkeningshortlyafterairexposure.
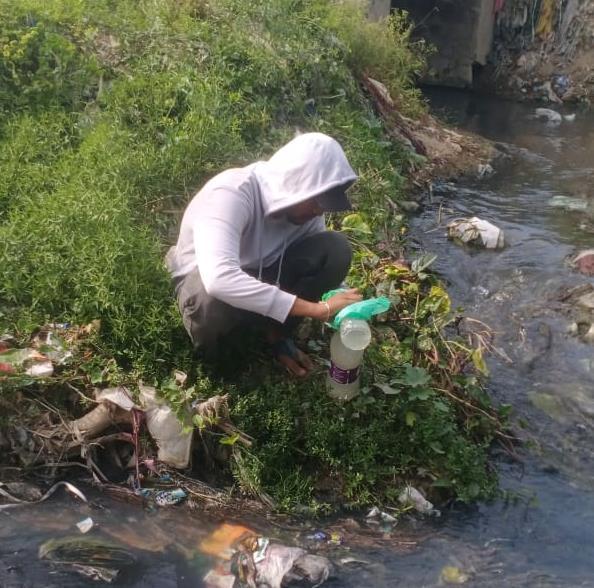
2.2.3 WASTE WATER
The domestic waste water was collected from Rangampetnala.
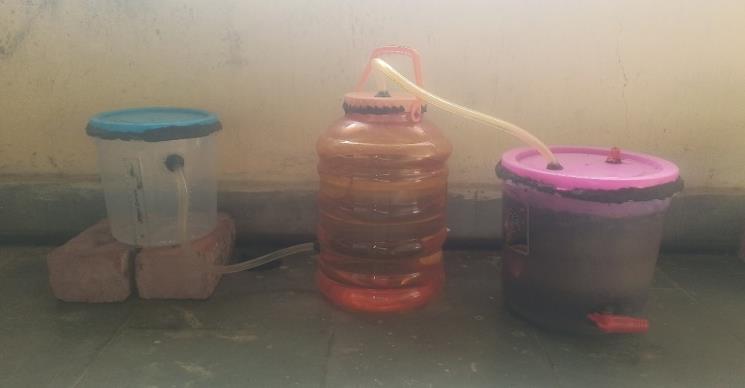
2.3 BIOGAS PRODUCTION
Biogas production was measured daily by waterdisplacementmethod.
2.4 SAMPLING PROCEDURE
The domestic wastewater was collected in 2 L capacity bottle 12 in numbers. Where there is steady flow, the sample was collected keeping in mind all the precautions. The colour, odour and temperature of the domestic wastewater were observed and noted at the point of collection. After collection of sample, it was brought to Environmental Engineering laboratory of civil engineering department, VNEC, shorapur analysed for various characteristics, such as pH, alkalinity, acidity, total solids, suspended solids, dissolved solids, chlorides, dissolved oxygen, COD and BOD.
2.5
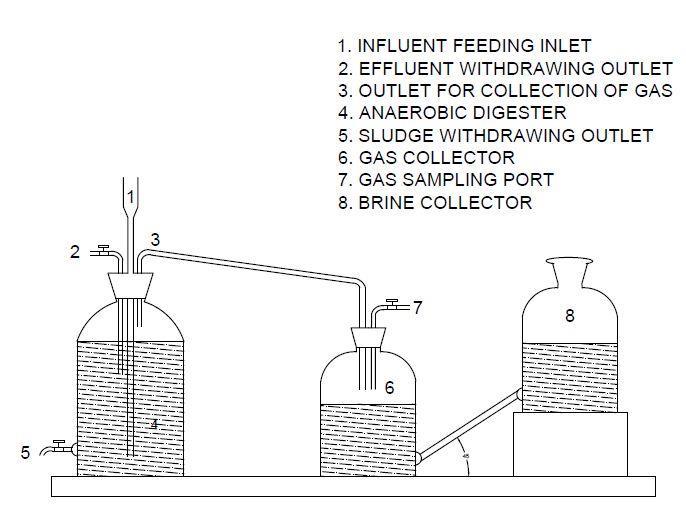
The schematic diagram of the experimental setup used for the present study. 10 L capacity container was used as digester in the study. The container of 10 L capacity connected with the container of 10 L capacity, which contains the brine solution.
The produced gas will collect in container of 5 L capacity by downward displacement of brine solution. To study the performance of digester the digester effluent withdrawn will be analyse for pH, total alkalinity, per cent COD removal, per cent BOD removal,suspendedsolidsetc.
International Research Journal of Engineering and Technology (IRJET) e-ISSN: 2395-0056
Volume: 11 Issue: 12 | Dec 2024 www.irjet.net p-ISSN: 2395-0072
The daily gas production and temperature under which COD were recorded for effluent. The suspended solid concentration in the reactors was determined in conformity with Standard Methods (2005).
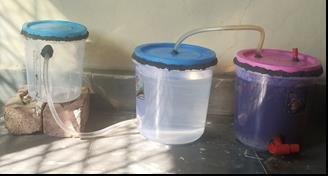
2.5.1 SET UP -1
800 gram of kitchen waste is mixed with 7.2 litre of sewage water and transferred it to 10 litre capacity container. This is connected to 10 L capacity container whichcontainsthe brinesolution(800gramoflaboratory NaCl is mixed with 8 L of distilled water) which is again connected to 5 L capacity container to collect the brine solution by water displacement method. In this study the volume of produced gas was measured by water displacement method considering the volume of the generatedgasequaltothatofexpelledwaterinthewater collector.
2.5.2 SET UP -2
800 gram of cow-dung is mixed with 7.2 litre of sewage water and transferred it to 10 litre capacity container.Connectionissameasthesetup1
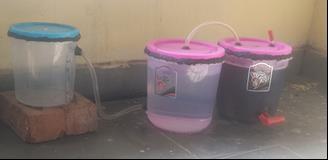
2.5.3 SET UP-3
800 gram of kitchen waste and 800 gram of cowdung is mixed with 6.4 litre of sewage water and transferred it to 10 litre capacity container. Connection is sameasthesetup1.
2.6 EXPERIMENTS CONDUCTED
pH
Totalalkalinity
Acidity
Totalsolids
Dissolvedsolids(ds)
Suspendedsolids(ss)
Chlorides
Biologicaloxygendemand
Dissolvedoxygen
3 RESULTS AND DISCUSSION
3.1 GENERAL
The laboratory bench scale experiments were carried for production of Biogas in container of 10 Lts working volume. In laboratory the following physical and chemical characteristics of the samples were analysed for pH, BOD, alkalinity, acidity, total solids, suspendedsolids,dissolvedsolids,and chlorides.
The study was conducted at laboratory temperature varying from 25 – 30 ˚C. The results obtained during the study has been presented and discussedinthe following sections.
International Research Journal of Engineering and Technology (IRJET) e-ISSN: 2395-0056
Volume: 11 Issue: 12 | Dec 2024 www.irjet.net p-ISSN: 2395-0072
This section deals with the characteristics of domestic wastewater. The fresh domestic wastewater sample was brought to laboratory for period of 10 days to analyse the typical characteristics of domestic waste water. The physical characteristics of domestic wastewatershownin table 3.1
Table 3.1: Physical characteristicsofdomestic wastewater SI No.
01 Colour Dark grey
02 Odour Foul smell
03 Temperature ˚C 22to28
Table 3.2 : Characteristicsofdomesticwastewater
Figure 3.1: pHduringevery5daysofintervalforSetup1
Table 3.4:pHduringevery5daysofintervalforSetup2
3.3
The setup is operated for 30 days. The results of pH, BOD for Setup 1, 2, 3 are shown in table 3.3, 3.4, 3.5, 3.6, 3.7, 3.8, respectively and figure 3.1, 3.2, 3.3, 3.4, 3.5, 3.6,respectively.
Table 3.3: pHduringevery5daysofintervalforSetup1
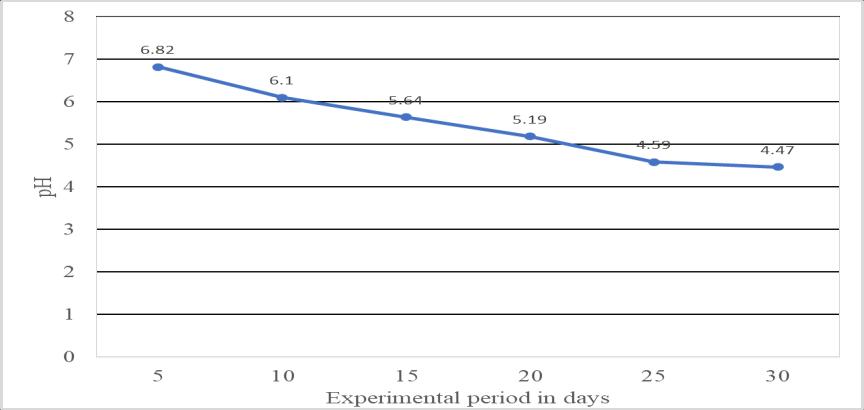
Figure 3.2: pHduringevery5daysofintervalforSetup2
Table 3.5: pHduringevery5daysofintervalforSetup3
International Research Journal of Engineering and
Volume: 11 Issue: 12 | Dec 2024 www.irjet.net
Figure 3.3: pHduringevery5daysofintervalforSetup3
The figure 4.1, 4.2, 4.3 showing the variation in pH value of domestic wastewater during day 3 to day 30. This indicates decrease in pH of wastewater during day 03 to day 30. This because releases of volatile fatty acids during digestion process. This leadspHvaluetocomedownday byday.
Table 3.6: BODduringevery5daysofintervalforSetup1
Fig 3.5:BODduringevery5daysofintervalforSetup2
Table 3.8: BODduringevery5daysofintervalforSetup3 S. No. Experimental period in days
Figure 3.4: BODduringevery5daysofintervalforSetup 1
Table 3.7: BODduringevery5daysofintervalforSetup2
Fig 3.6: BODduringevery5daysofintervalforSetup3
The figure 3.4, 3.5, 3.6 showing the variation in the value of BOD of domestic wastewater during day 03 to day 30. This indicates decrease in BOD of wastewater during day 03 to day 30. This because decrease in bacterial growthduring digestion process
The production of biogas from day 3 to day 30 shown intable3.9,3.10,3.11respectivelyand figure3.7, 3.8,3.9respectively.
International Research Journal of Engineering and Technology (IRJET) e-ISSN: 2395-0056
Volume: 11 Issue: 12 | Dec 2024 www.irjet.net p-ISSN: 2395-0072
Table 3.9: Biogasproductionduringday3today30for Setup1
S.
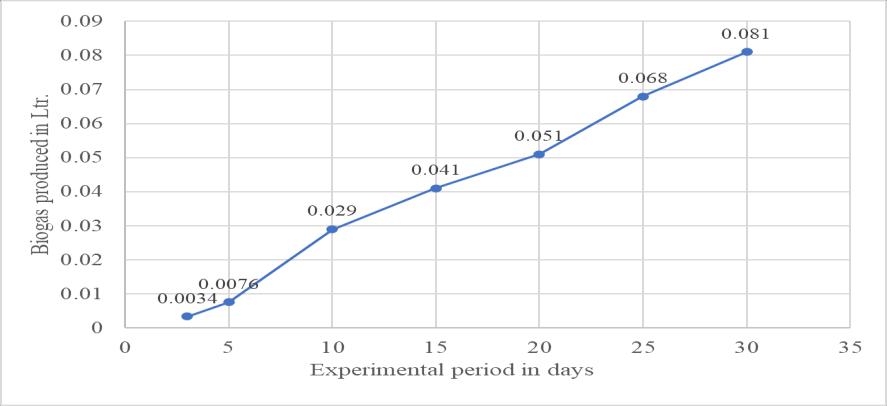
Fig 3.7 : Biogasproductionduringday3today30for Setup1
Table 3.10: Biogasproductionduringday3today30for Setup2
Table 3.11: Biogasproductionduringday3today30for Setup3
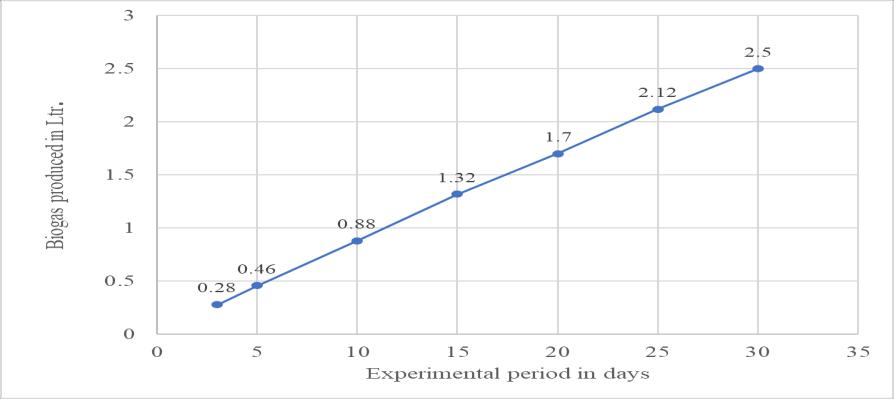
Figure 3.8 : Biogasproductionduringday3today30for Setup2
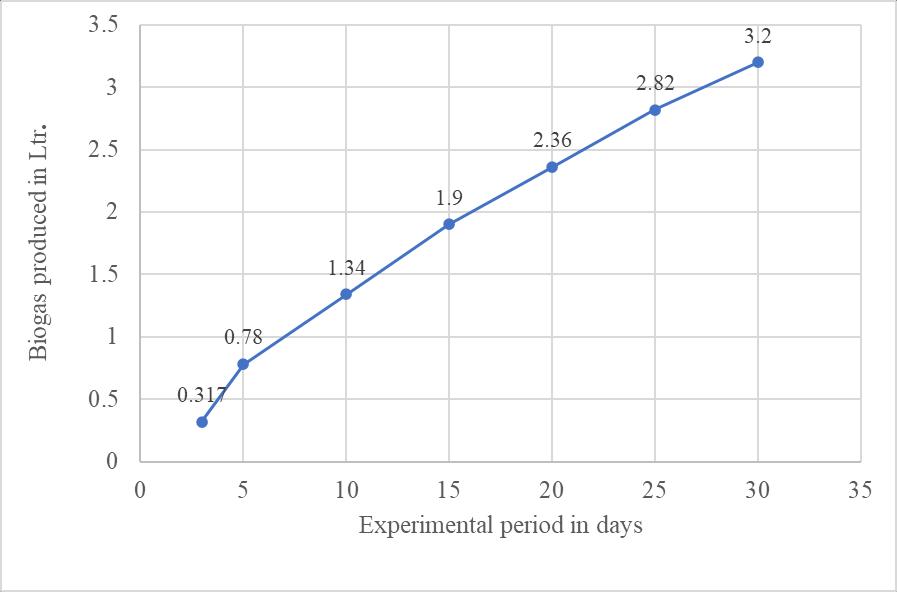
Figure 3.9 : Biogasproductionduringday3today30for Setup3.
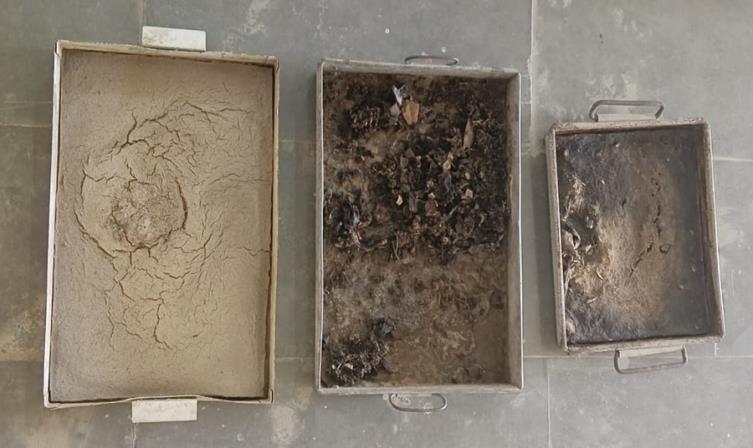
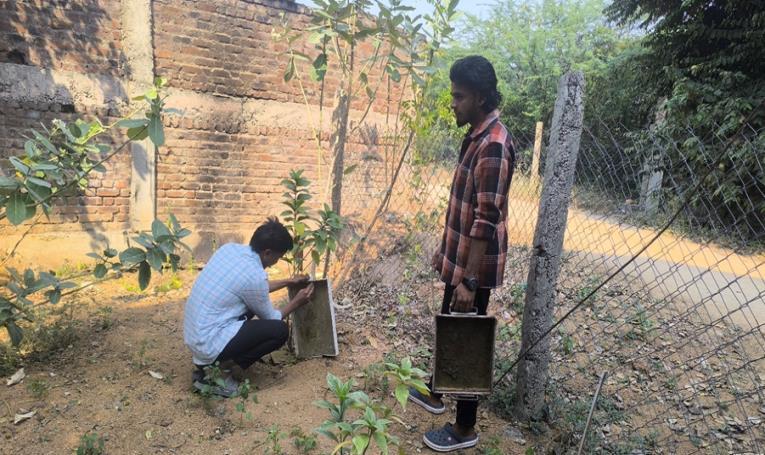
After completion of digestion process, the digestate is separated into two phases that is liquid and solid. The sludge has been dried and used as manure to improvesoilfertility.
International Research Journal of Engineering and Technology (IRJET) e-ISSN: 2395-0056
Volume: 11 Issue: 12 | Dec 2024 www.irjet.net p-ISSN: 2395-0072
Basedontheexperimentalstudyfollowingconclusionscan bedrawn
1. The degradation of the organic matter is achieved morethan90%
2. The maximum biogas produced in Setup 1 is 0.081 Ltsonthe30th day
3. The maximum biogas produced in Setup 2 is 2.5 Lts onthe30th day
4. The maximum biogas produced in Setup 3 is 3.2 Lts onthe30th day
5. After completion of the digestion process, the sludge hasbeentakenoutanddried.Afterdryingthesludge hasbeenusedasmanuretoimprove fertilityofsoil.
[1] Aditya Dalvi, Atul Bhosale, prof. Santosh Ingel: “The production of biogas from food waste”. Volume:05 Issue:04/April-2013. International Research Journal of modernization in Engineering, Technology & scienceP.P.4960-4964.
[2] B. G. Mahendra , Sharadreddy Patil. “Anaerobic digestion of domestic wastewater”. International journal of research in engineering & technology. P.P. 283-284.
[3] Umapathy H, D P Nagarajappa, Dr. P. Shiva Keshava kumar. “Biogas Production from Kitchen waste”. Volume 07, Issue:08/August 2020. International Research Journal of Engineering and Technology. P.P 1777
[4] Azza A. Mostafa, A. Elbanna, Fathy Elbehiry and Heba Elbasiouny. “Biogas Production from Kitchen wastes: Special focus on Kitchen and Household wastes in Egypt”.P.No.132-141