
CYBERSECURITY FOR FINANCIAL INDUSTRY: AN ANALYSIS OF THE CYBER RESILIENCE ASSESSMENT FRAMEWORK
1
CONTENTS 2 CONTENTSPREFACEEXECUTIVESUMMARY1.THECYBERRESILIENCE ASSESSMENT FRAMEWORK (C-RAF) CybersecurityIntroduction Assessment C-RAF and Other Cybersecurity Assessment Frameworks 2. INHERENT RISK ASSESSMENT (IRA) SurveySurveyOverviewResultResult – by size Indicator and Sub-domain Analysis Analysis by Service Provision Hierarchical Clustering Factor InherentAnalysisRiskAnalysis: Summary 3. MATURITY ASSESSMENT (MA) ControlsSurveyOverviewResultandSub-Domain Analysis Responses IRA: Low Cybersecurity Staffing Risk for High-risk AIs Maturity Assessment: Summary 4. INHERENT RISK AND MATURITY InherentDomainOverviewComparisonRiskandMaturity Analysis Summary 5. C-RAF AND REAL-LIFE MEASURES SSL Certification Adoption Suboptimal Certification Adoption Time-series Analysis C-RAF and Real-life Measures: Summary APPENDIXCONCLUSION 54 6967646260565350504746423937343229262422181613 7069
Editorial: Fintech Research Project, HKUST Business School Artwork and Design: Andrew Tang @JamFactory Print production: Media Technology and Publishing Center, HKUST Enquiries: fintech@ust.hk
Founded in 1991, the HKUST Business School is young, innovative and committed to advancing global business knowledge. The School has forged an international reputation for world-class education programs and research performance, and has received many top global rankings. It is one of the first Asian business schools accredited by both AACSB and EQUIS. The School strives to contribute to the economic and social advancement of the region by developing future leaders who possess an innovative and entrepreneurial spirit as well as a strong sense of responsibility. We also take active steps to promote knowledge advancement in many significant business areas. For more information, please visit www.bm.ust.hk.
This report documents the findings and insights from research conducted by HKUST Business School as part of the Fintech Theme-based Research Project, “Contributing to the Development of Hong Kong into a Global Fintech Hub” (Project No. T31-604/18-N), funded by the Research Grants Council (RGC).
About Fintech Research Project
© February 2022 HKUST Business School, The Hong Kong University of Science and Technology All Rights Reserved.
The Fintech Research Project is funded by the Research Grants Council (RGC) under the Theme-based Research Scheme 2018-19, titled “Contributing to the Development of Hong Kong into a Global Fintech Hub”. The project aims to provide a roadmap for transforming Hong Kong into a global fintech hub through the delivery of policy recommendations, scholarly contributions, and industrial impact. A team of researchers from HKUST and other universities with expertise spanning finance, information systems, statistics, computer science, accounting, and economics are tackling eight major research tasks that cover blockchain, cybersecurity, risk preference, robo-advising, artificial intelligence / machine learning, systemic risk, financial innovation policy, and manpower development.
About HKUST Business School
3
The Hong Kong University of Science and Technology Wei Thoo Yue Department of Information Systems City University of Hong Kong
Cyberattacks have been on the rise globally. The COVID-19 pandemic saw many organizations across the world shifting to remote work, giving ways to new opportunities for cybercrime, along with other cybersecurity threats such as phishing and ransomware.
PREFACE 4 PREFACE
Financial institutions such as banks and credit agencies continue to be popular targets.
To understand the effectiveness of the security measures undertaking by FIs under the C-RAF and to assess the impact of C-RAF adoption on security in the industry, we have conducted a comprehensive research over the course of 24 months. This report documents our findings on the detailed assessment and analysis of the C-RAF measures that would provide additional views on how these measures can expose the state of security development of financial institutions.
We hope the findings presented in this report provide useful insights for financial institutions, practitioners, and regulators on whether their current security measures, policies and regulations are sufficient and worthy of investments so that we can continue to develop good practices and cybersecurity protection schemes for the financial institutions in Hong Kong.
Kai-Lung Hui School of Business and Management
Many governments and organizations have proposed initiatives to strengthen cybersecurity such as filtering tools which limit access by malicious content. Their effectiveness, however, remains unclear. In 2016, the Hong Kong Monetary Authority (HKMA) launched a Cybersecurity Fortification Initiative (CFI), a key component of which is the Cyber Resilience Assessment Framework (C-RAF), where financial institutions (FIs) are required to assess its cybersecurity risk and determine the adequacy of its cybersecurity measures. While FIs should formulate necessary plans and strengthen their security to address any gaps, are their investments worth the cost?
To provide a better understanding of the correlation of AIs’ risk profile with their business operations and underlying causes of their cyber risk, we conducted detailed analyses from various dimensions.
Through a survey conducted with the participating AIs, we assessed the two processes of the C-RAF – Inherent Risk Assessment (IRA) and Maturity Assessment (MA). In the IRA process, AIs performed self-assessment under five domains to reflect their cybersecurity threat level, which is mapped to their expected maturity level of cyber resilience. In the MA process, they assessed cybersecurity controls under seven domains to determine their maturity level.
We calculated a risk score for each AI by converting its survey responses on an ordinal scale to quantify the results.
5 EXECUTIVE SUMMARY
Inherent Risk Score
One of the CFI’s components is the Cyber Resilience Assessment Framework (C-RAF). Between January 2019 and June 2021, we compiled a detailed list of Cyber Resilience Assessment Framework (C-RAF) measures, surveyed 22 AIs and collected public data on the participating banks for a comprehensive assessment using different models of analysis to study the effectiveness of the C-RAF and the banks’ cybersecurity performance relative to industry peers.
Our observations:
1. The Technologies domain contributes to the biggest difference between high- and mediumrisk AIs.
The surveyed AIs selected the most appropriate inherent risk level (Low, Medium or High) for each risk indicator in the five domains of IRA: Technologies, Delivery Channels, Products and Technology Services, Organizational Characteristics and Tracked Records on Cyber Threats. An AI’s overall risk level is determined by the most common risk level. The inherent risk level is identified to be low for the majority of AIs (45%), implying they tend to face lower cybersecurity risk. On the contrary, 14% of the surveyed AIs are identified as high-risk AIs with the highest risk exposure among the three classes.
The Hong Kong Monetary Authority (HKMA) has developed the Cybersecurity Fortification Initiative (CFI) to strengthen the cyber resilience of authorized institutions (AIs) in Hong Kong.
2. The Products and Technology Services domain sees the largest gap between low- and medium-risk AIs.
3. As indicated by the Tracked Records on Cyber Threats domain, the inherent risk related to past cyberattacks is similar to AIs at all the risk levels.
I. KEY FINDINGS OF INHERENT RISK ASSESSMENT (IRA)
Technologies Delivery Channels Products and Technology Services CharacteristicsOrganizational Tracked Records On Cyber Threats Inherent Risk Assessment - Risk Score Comparison by Domain Low HighMedium Inherent
Organizational
by
MediumHighLow OnTrackedCharacteristicsOrganizationalTechnologyProductsDeliveryTechnologiesChannelsandServicesRecordsCyberThreats
1. The Technologies domain remains to have the most noticeable gap between high- and medium-risk AIs.
2. The Delivery Channels domain appears to pose the highest inherent risk to both high- and medium-risk AIs. Each has about a 15 percentage point difference to its second riskiest domain.
EXECUTIVE SUMMARY 6 Percentage Risk Score As the number of indicators (security controls) in each domain is not the same, we used a percentage risk score to provide a standardised view of risk propensity independent of the number of indicators. Our observations:
3. Low-risk AIs do not appear to suffer from the risk posed by the Delivery Channels domain. Characteristics is the most prominent risk for them. Risk Assessment Percentage Risk Score Risk Class Domain
–
by
Our observations:
Correlation of Risk with Equity of AIs
2. As we expect, the AIs’ inherent risk level increases as their equity level goes up.
sub-domains.61<$10bn(Low) $10bn89-$30bn(Medium) >$30bn92(High) Risk Score Comparison between Equity Size and Risk Class Size Risk Class Top "Not Applicable" Risk Indicator Prepaid Card Risk Cloud Computing Services Risk Host IT Services Risk Merchant Acquier Model Risk Merchant Acquier Merchant Risk 1616192020 20 250 15105
Risk Indicator and Sub-domain Level
6. The narrow gap in the Organizational characteristics domain between low-risk AIs and their peers were partially caused by the lower number of cybersecurity staff.
We
Each domain comprises a number of risk indicators that reflect various business and operational aspects of AIs. We found that the AIs’ risk level depends partly on how widely applicable the risk indicators are. For risk indicators such as Prepaid Card Risk and Cloud Computing Services Risk, most AIs responded with “Not Applicable”, hence a low-risk score. further analyzed risk indicators in details to see how the risk varies between risk classes. To simplify the analytical process, we have grouped related indicators within a domain into various
7
We grouped the AIs by their size (equity) to assess their risk level. The hypothesize is that larger AIs will show a higher inherent risk.
1. Despite showing high risk in the Organizational Characteristics domain, all low-risk AIs are small in size, i.e. with total equity of less than HK$10 billion.
3. While we expect large AIs to show high risk in the Technologies domain due to the potential of having more difficulties in managing IT systems, it turns out not the case.
4. The group with the highest total equity reported to have a lower level of suboptimal software systems and reliance on third parties than some of its smaller counterparts, hence a lower risk in the Technologies domain.
5. The risk from the Products and Technology Services domain is more salient for large- and medium-sized AIs. The high risk appears to be caused by the wide range of services these AIs offer.
2. The large gap in Technologies (domain) between high- and medium-risk AIs is mainly prompted by third-party related risk (sub-domain risk indicator). This perhaps shows that firms with high-risk classification use more third-party software/hardware or outsource various duties to vendors, making risk control more challenging.
1. Half of the surveyed AIs reported that they are offering either payment card or ATM service or both services at the same time.
Our observations:
Our observations:
Correlation of Risk with Service Offerings by AIs
At the sub-domain level, we found that service provisions account for a large gap between different risk groups. Hence, we conducted further analysis to investigate how service provision impacts risk level.
Thesepresence.observations indicate that many risk indicators are interconnected and prompted our study with exploratory factor analysis, which is discussed in more details in a later section of this report.
3. The higher the risk class, the lower the cybersecurity staffing risk (sub-domain risk indicator). High-risk AIs outperform both low- and medium-risk peers, suggesting that AIs with higher risk might be more aware of their own cybersecurity risk and have hired appropriate professionals to mitigate their risk.
2. Many of the AIs provide both services at the same time, therefore risk score in both services is closely linked together. For the service-providing AIs, we found a high risk in their mobile
EXECUTIVE SUMMARY 8
Correlation of Risk with AIs’ Business Nature and Target Customers
To identify any hidden characteristics among the AIs, which are not directly captured in the IRA, we identified three groups of AIs using hierarchical cluster analysis. Group A is composed of low- and medium-risk AIs, Group B contains five medium risk and one high-risk AIs , and Group C consists of AIs from all three risk classes. Risk Class Proportion By Service Provided
100%80%60%40%20%0% Payment Card ATMNon-PaymentCard Non-ATM MediumHighLow9% 18% 64% 64% 27% 18% 9%18%82%18% 73%
1. When measured by percentage risk score, high- and medium-risk AIs have a high risk in Delivery Channels (domain) while low-risk AIs do not. The gap is mostly driven by a discrepancy in their mobile presence (sub-domain risk indicator), indicating that high- and medium-risk AIs offer a much wider range of mobile banking services than low-risk AIs.
HighMediumLow MATURITY LEVEL AdvancedIntermediateBaseline
Overall, we found that not all the AIs have reached their required maturity level. Gaps are identified in their cybersecurity measures and there are areas of improvement for them to enhance cyber resilience.
II. KEY FINDINGS OF MATURITY ASSESSMENT (MA)
2. Medium-risk AIs perform less well. Their underperformance mostly comes from the Governance, Protection and Third-party Risk Management domains.
Our observations:
2. Upon examining the key characteristics between the groups, we found that the overarching difference among the three groups is on their service provision and overall size – perhaps in terms of the number of staff, assets or total amount of client deposits.
9
INHERENT RISK LEVEL
1. AIs in each group appear to have a similar risk score. While the risk classifications are mixed, inherent risk scores and percentage scores within a group are mostly similar.
3. Low-risk AIs have mixed results. They are mostly on target in terms of Protection, Situational Awareness, Response and Recovery and Third-party Risk Management. However, they do not meet the minimum standard in three other domains, which are related to governance and internal environment.
3. While we cannot conclusively suggest how the type of AIs impacts their risk level, the clustering result reveals that the AIs’ overall risk might be closely related to their business nature and target audience.
The inherent risk levels of the AIs identified in the IRA process are mapped to their required maturity levels of cyber resilience: Baseline, Intermediate and Advanced. They assessed applicable security controls according to their corresponding maturity level.
1.OurManagement.observations:High-riskAIshave adopted almost all security controls and hence high attainment rate of cybersecurity measures across the three maturity levels.
The AIs conducted assessment under the seven domains of MA: Governance, Identification, Protection, Detection, Response and Recovery, Situational Awareness and Third-party Risk
Not All AIs Reach Required Maturity Levels
1. Data security is the best performing component with over 99% attainment rate, showing that all surveyed AIs have taken as many controls as possible to safeguard their sensitive information and data.
2. Many medium-risk AIs have failed to reach their target maturity level. Their underperformance is not due to outliers but a group-wise issue.
3. The average maturity attainment rate is over 80% for all of the worst performing components, which is an encouraging finding.
III. OVERALL RELATIONSHIP BETWEEN INHERENT RISK LEVEL AND MATURITY LEVEL
2. Overall, the AIs do the best under the Response and Recovery domain in which three of its components (Incident Management, Escalation and Reporting, and Response Planning) are among the best performing ones. This shows that most AIs perform well in implementing follow-up measures in case of cybersecurity incidents.
EXECUTIVE SUMMARY 10 Best Performing Components Data Security Incident Management Escalation And AccessReportingControl Threat Monitoring And Analysis Response Planning 95.8%96.3%96.5%96.7%97.3%99.1% Common Strengths and Weaknesses Each domain comprises a number of components. We have identified the best and worst performing maturity components to reflect the strengths and weaknesses of AIs in taking cybersecurity measures. Worst Performing Components Audit Anomalies Activity Detection Cyber Risk Identification And Assessment External Connections Ongoing Monitoring On Third-party Risk Third-party Management 82.9%84.9%88.2%89.1%90.8%90.8% Our observations:
1. After a thorough investigation and analysis, we found a positive relationship between the AIs’ inherent risk score and their maturity level. A high overall risk tends to mean a higher maturity score in each domain.
3. High-risk AIs are more mature than medium-risk AIs under many maturity domains, despite having better track records in terms of their cybersecurity threats and having an equal or lower risk in many inherent risk domains.
2. AIs with high maturity attainment rate appear to show a higher adoption rate of security certifications and a low adoption rate of suboptimal certificates such as self-signed or weak hashing algorithm certificates.
AI’s Cyber Resilience Over Time
Our observations:
To understand how well the maturity assessment reflects the surveyed AIs’ actual security practices, we examined the AIs’ adoption of Secure Sockets Layer (SSL) and suboptimal certificates. SSL certificate is a digital certificate that authenticates a website identity. Suboptimal certificates make AIs more vulnerable to cyberattacks.
We analysed the AIs’ adoption of SSL certifications to gain a better understanding on how the AIs’ cyber resilience has changed over time after the C-RAF survey and how the selfassessment exercise impacts the AIs’ intention in implementing cybersecurity measures.
1. We found a steady improvement in AIs’ SSL certification adoption rate. The improvement comes from those who have not attained all the required maturity measures.
Our observations:
2. There is a decrease in the adoption of weak hashing algorithm certificates among the AIs. For AIs whose attainment rate is 100%, the drop is even more than those AIs without full attainment.
3. In order to understand the impact of C-RAF in improving AIs’ cyber resilience over time, we suggest the C-RAF framework to further examine if AIs have taken additional cybersecurity measures or compare the number of cybersecurity incidents they face after the C-RAF selfassessment exercise.
3. The Maturity Assessment reflects the AIs’ actual cybersecurity measures. AIs that perform better in the Maturity Assessment in terms of their attainment percentage rate tend to take adequate cybersecurity measures to safeguard their assets.
IV. AI’S CYBERSECURITY PRACTICE IN REAL LIFE
11
1. The AIs’ overall maturity level and particularly the maturity level in the Protection domain appears to be significantly correlated to the adoption rate of SSL certificates.
12 (C-RAF)FRAMEWORKASSESSMENTRESILIENCECYBER
[ Exhibit 1 ] Global loss and cost from cybercrime McAfee (2020). The Hidden Cost of Cybercrime. Available at https://www.mcafee.com/enterprise/en-us/assets/ [accessed March 19, 2021]. 2.HKCERT and SSH.com (2020). SSH Hong Kong Enterprise Cyber Security Readiness Index 2020 Survey. Available at [accessed March 19, 2021].
13 CYBER RESILIENCE ASSESSMENT FRAMEWORK (C-RAF) INTRODUCTION
https://events.hkpc.org/1613633199/SSH-HKECSRI2020.pdf
McAfee estimates that since 2018, the cost of global cybercrime reached over $1 TRILLION US$5232018billion 2020 US$945 billion +80%
Cybersecurity is a growing concern worldwide across various sectors. According to a McAfee report, the global loss from cybercrime is estimated to be approximately US$945 billion in 2020.1 Meanwhile, the spending on cybersecurity is expected to exceed US$145 billion, putting the total cost related to cybercrime to more than US$1 trillion.
Nevertheless, the report above shows that only a handful of organizations have plans to prevent and respond to information technology security incidents. In the 2020 “SSH Hong Kong Enterprise Cyber Security Readiness Index” survey, Hong Kong companies’ overall cybersecurity readiness index fell by 2.4 points from the previous year to 46.9 out of 100. While financial services firms are the most vigilant performers, they have only scored a merely 62.9.
1.
Global loss from cybercrime
reports/rp-hidden-costs-of-cybercrime.pdf
Readiness
INHERENT RISK
• Inherent Risk Assessment (IRA)
In 2016, HKMA launched a campaign called cybersecurity fortification initiative (CFI), which comprises three components: (1) the Cyber Resilience Assessment Framework (C‐RAF); (2) the Professional Development Program (PDP); and (3) Cyber Intelligence Sharing Platform (CISP). C-RAF is a risk-based cybersecurity assessment framework for authorized institutions (AIs) to assess their risk profiles and the maturity of their cybersecurity measures. Through this process, AIs will be able to better understand and continuously improve their cyber resilience. C‐RAF further comprises three stages:
20202019
AdvancedIntermediateBaseline [ Exhibit 3 ] Inherent
Given the growing cybersecurity risks, the Hong Kong Monetary Authority (HKMA) has been working with the banking industry to oversee and monitor their handling and management of cybersecurity risks.
• Intelligence-led Cyber Attack Simulation Testing (iCAST)
HighMediumLow
A self-assessment form across seven domains to determine the actual maturity level of the Als LEVEL risk assessment and maturity assessment introduction
The Als perform an assessment across five domains to reflect their inherent risk level, which in turn determines the expected maturity level LEVEL ASSESSMENT
This report focuses on the Inherent Risk Assessment (IRA) and Maturity Assessment (MA) under C-RAF, both of which are self-assessment exercises. IRA ensures the AIs in Hong Kong are mindful of their intrinsic risks related to their business size, scope, and variety of services. MA ensures the AIs have the corresponding security controls commensurate with their risk levels.
• Maturity Assessment (MA)
MATURITY
MATURITY
14
SSH Hong Kong Enterprise Cyber Security Index 46.9 44.5 -2.4 Hong Kong Enterprise Cyber Security Readiness Index ASSESSMENT
INHERENT RISK LEVEL
2019frompoints [ Exhibit 2 ] SSH
To provide some context, Exhibits 4 and 5 show a few examples of indicators (controls) for the five key domains for the Inherent Risk Assessment and the seven domains for the Maturity Assessment. We will elaborate on the two assessments in later sections.
15 CYBER RESILIENCE ASSESSMENT FRAMEWORK (C-RAF) The Five Domains of the Inherent Risk Assessment Domain Sample Indicators Technologies • The number of Internet service provider connections connected to the corporate network • Wholesale customers with dedicated connections Delivery Channels • Internet presence (customer) • Automated Teller Machines (ATM) (Operation) Products TechnologyandServices • Issue debit or credit cards • Global remittances CharacteristicsOrganizational • Total number of branches • Changes in IT and cybersecurity staffing Tracked Records on Cyber Threats • Reported cyberattacks impacting the AI for Hong Kong businesses (last 12 months) The Seven Maturity Domains of the Maturity Assessment Domain Sample Indicators Governance • Cyber resilience oversight • Strategy and policies Identification • IT asset identification • Cyber risk identification and assessment Protection • Infrastructure protection controls • Access control Detection • Vulnerability detection • Anomalies activity detection Response and Recovery • Response planning • Incident management Situational Awareness • Threat intelligence (information about emerging or existing threats) • Threat intelligence sharing Third-party ManagementRisk • External connections • Third-party management [ Exhibit 4 ] The five domains of inherent risk assessment and their sample indicators [ Exhibit 5 ] The seven domains of maturity assessment and their sample indicators
Twenty-two AIs including licensed banks, restricted licensed banks and deposit-taking companies participated in a survey to capture the self-assessed classification and detailed responses of AIs. For example, for each of the IRA indicators, the AIs would note down one of the “Low”, “Medium” and “High” answers based on the threshold set in the survey, and to provide additional detailed information in both writing and numbers (when applicable). With the Maturity Assessment, the AIs would respond to whether the maturity controls are met while providing information on the implementation and any gaps noted. This allows us to conduct an investigation using the categorical responses and examine the detailed responses to gain a more in-depth understanding.
CYBERSECURITY ASSESSMENT
Another form of self-regulation is alliances. Companies have started entering cybersecurity alliances, such as operational alliances and normative alliances. Built around small groups of companies, an operational alliance shares information about cyberattacks and threats to raise the collective level of cybersecurity (Dobrygowski, 2019). Examples of such operational alliances include the Cyber Threat Alliance, the Global Cyber Alliance, and the Trusted Computing Group. On the other hand, a normative alliance strives to proactively spur collective action in favour of digital peace and non-aggression. They explicitly call for government support and limit the use of private systems and networks against citizens (especially by a nation-state) (Dobrygowski, 2019). The Charter of Trust, initiated by Siemens, and the Cybersecurity Tech Accord, originated by Microsoft and other leading technology companies, are two examples of normative alliances.
Before we analyse the C-RAF assessment survey data, we first review the motivation, purpose, and state of cybersecurity regulation and assessment development. We then report on other popular cybersecurity assessment frameworks and tools, and draw a comparison with C-RAF.
16
Cybersecurity regulation can be broadly classified into three categories: (1) Self-regulation, (2) Co-regulation, and (3) Statutory regulation, depending on the balance between government intervention and voluntary industry participation. Unlike co-regulation, which includes state participation and enforcement, self-regulation is represented by non-hierarchical private actors, such as industry associations and organizations that implement different mechanisms to regulate the security practices within the industry. The involvement of these actors in fighting cybercrime and providing cybersecurity varies from ad hoc collaboration upon police request to sustainable self-regulation, for example, private hotlines for reporting illegal content (Tropina & Callanan, 2015).
The Center for Internet Security Critical Security Controls (CIS CSC) The CIS CSC is a set of prioritized and simplified best practice guidelines for computer security. Also known as CIS Controls, the publication is owned by the Center for Internet Security, a communitydriven non-profit organization of IT Aimedprofessionals.atprotecting organizations and data from known cyberattack vectors, the controls consist of 20 key actions for three implementation groups. The actions cover basic, foundational and organizational measures ranging from asset management, data protection to incident response and penetration testing.
The standard covers ten clauses, including the organization’s context, leadership and commitment, planning, support, operation, performance evaluation and improvement. Organizations that meet the standard’s requirements can choose to be certified by an accredited certification body after completing an audit.
17 CYBER RESILIENCE ASSESSMENT FRAMEWORK (C-RAF)
The framework consists of three parts: Framework Core, Framework Profile and Framework Implementation Tiers Notably, the Framework Core is a set of cybersecurity activities, desired outcomes and applicable references that are common across critical infrastructure sectors. The core includes five high-level functions: Identify, Protect, Detect, Respond, and Recovery
As defined on the official site, the NIST cybersecurity framework focuses on using business drivers to guide cybersecurity activities and considering cybersecurity risks as part of the organization’s risk management processes
The ISO 27001 is a globally recognized standard for information security management system (ISMS), focusing on keeping the information assets secure. This ISO standard gives organizations guidance on implementing,establishing,maintaining, and continually improving an ISMS.
[ Exhibit 6 ]
Examples of commonly used cybersecurity assessment frameworks
National Institute of Standards and Technology (NIST) cybersecurity framework
International Standards Organization (ISO)/IEC 27001
A security framework provides a common reference to measure cybersecurity capabilities within an organization (Le and Hoang, 2016). The framework may variously consider user, networking device, software, network, process, application, and information in storage or transit that can be directly or indirectly connected to the network (Srinivas et al., 2018). Multiple parties worldwide, including industry organizations, governments, and international organizations, have published cybersecurity standards, frameworks, or guidance. Below, we briefly introduce three internationally applied frameworks, compare them against C-RAF in terms of coverage and focus, and provide a comparison table with additional frameworks.
[
C-RAF AND OTHER CYBERSECURITY ASSESSMENT FRAMEWORKS
C-RAF* Domain of Analysis* Governance (81) Governance (59) Expertise and training (22) Protection (106) Data security (28) Security control and incident prevention (78) Detection (60) Detection (60) Response and Recovery (51) Incident management (51) Situational Awareness (18) Situational awareness (18) Third-party Risk Management (27) Oversight of interconnections (27) Identification (23) Risk analysis and assessment (23) Continuous learning/improvement
Recall that the C-RAF Maturity Assessment consists of seven domains: Governance, Identification, Protection, Detection, Response and Recovery, Situational Awareness, and Third-party Risk Management. These domains have in fact incorporated more aspects than their name implies. We have split and mapped the relevant areas in Exhibit 7.
WithAssessment.themapping in mind, Exhibit 8 presents a table that compares C-RAF with a few additional reference frameworks in terms of 10 domains: governance, risk analysis and assessment, data security, security control and incident prevention, expertise and training, detection, incident management, situational awareness, oversight of interconnections, and continuous learning / improvement. Essentially, we found that the C-RAF has covered nine of the ten domains commonly included in other cybersecurity frameworks, but C-RAF does not measure continuous learning and improvement, similar to the NERC Cybersecurity standards and the BCBS Cyber-Resilience-Range of Practice.
Exhibit 7 ] Mapping of maturity assessment domains and the ten domains of analysis
* Numbers in brackets denote the number of controls included in the C-RAF Maturity
18
19 CYBER RESILIENCE ASSESSMENT FRAMEWORK (C-RAF) GuidanceInternational BCBS13 Banking IOSCOCPMI-14 Financial InfrastructuresMarkets Testing as a separate function G7-CEG15 Financial Sector OECD16 National policy [ Exhibit 8 ] Cybersecurity frameworks table of comparison National ASD5 Australia CREST6 Int GoC7 Canada FRFI8 Organizations and Resources FFIEC9 US InstitutionsFinancial ETSI10 Int mechanismsFacilitation FINRA11 Small firms in US Finance IIROC12 Canada Investment Cyber insurance Gov1 Risk Data Sec Exp Det Inc Situa Over Cont Scope Unique Standards/Framework C-RAF HK institutionsfinancialauthorized NIST Int SupplyEnvironment,BusinessChain Risk Management UK NCSC2 UK NERC CIP3 US Electricity PCI DSS Payment card NZISM4 New Zealand ISO Int CIS CSC Int COBIT Int 1. Domain abbreviations: Gov for governance, Risk for risk analysis and assessment, Data for data security, Sec for security control and incident prevention, Exp for expertise and training, Det for detection, Inc for incident management, Situa for situational awareness, Over for oversight for interconnections, Cont for continuous learning/ improvement 2. UK National Cyber Security Centre, Cyber Assessment Framework 3. North American Electric Reliability Corporation - Critical Infrastructure Protection, Cyber Security Standards 4. Government of New Zealand, NZISM Protective Security Requirements 5. Australian Signals Directorate (ASD) Strategies to Mitigate Cyber Security Incidents 6. CREST Maturity Assessment Tools 7. Government of Canada, Cyber Security Self-Assessment Guidance 8. Federally Regulated Financial Institutions
11.
12.
13.
15.
10.
14.
20
9. Federal Financial Institutions Examination Council's (FFIEC), Cyber Assessment Tool ETSI TR 103 305-1 V3.1.1 Financial Industry Regulation Authority (FINRA), small firm cyber security checklist Investment Industry Regulatory Organization of Canada (IIROC), cybersecurity best practices guide & cyber governance guide Basel Committee on Banking Supervision (BCBS), Cyber-Resilience-Range of Practices The Committee on Payments and Market Infrastructures (CPMI) and the Board of the International Organization of Securities Commissions (IOSCO) , the Guidance on cyber resilience for financial market infrastructures G7 Cyber Expert Group (CEG) Fundamental Elements for Cybersecurity Organization for Economic Co-operation and Development (OECD), Recommendation of the Council on Digital Security of Critical Activities
While the coverage of cybersecurity maturity of C-RAF is consistent with most internationally well-recognized frameworks, it also offers some unique advantages over its peers. As mentioned above, C-RAF consists of three parts: (1) Inherent Risk Assessment, (2) Maturity Assessment, and (3) Intelligence-led Cyber Attack Simulation Testing (iCAST). The three parts work cohesively to offer a more customisable measure to the organizations. First, IRA allows the entities to identify their own risk, then suggest the corresponding risk level and maturity requirement. Next, the AIs could evaluate their maturity level based on the requirement, identify any gaps for improvement and set the corresponding deadlines. Finally, the iCAST offers an opportunity for organizations to test their cybersecurity level beyond traditional penetration tests. Therefore, it forms a complete and tailored experience to the AIs that reflects their actual risk and maturity to help minimize potential cybersecurity induced losses.
16.
21 INHERENT RISK ASSESSMENT (IRA) (IRA)RISKINHERENTASSESSMENT
[ Exhibit 10 ] Risk class population of surveyed AIs[ Exhibit 9 ] Key statistics of surveyed AIs AIs’ Business Size Average (HK$) Total Assets $227.3bn Deposits Customersfrom $132.4bn Total Equity $29.2bn Capital Ratio 26.7 45% 14% 41%
OVERVIEW As the first part of the C-RAF framework, the Inherent Risk Assessment is designed to reflect AIs’ cybersecurity threat level, determine their cyber risk exposure, and decide which threshold they should be subject to in the Maturity Assessment. For each of the 51 indicators in the Inherent Risk Assessment, AIs would report their self-assessed risk levels, which are “Low”, “Medium”, “High”, or “Not Applicable”. By default, an AI’s overall risk level is determined by the most common risk level in the survey. An AI also can indicate an alternative classification by considering other relevant factors, including its size and business model. We calculated a risk score for each AI by converting its response on an ordinal scale to quantify the results better, where we assigned a score of one to a low-risk response, two to a mediumrisk response, three to a high-risk response, and zero when a risk indicator is deemed “Not Applicable” by the AI. To extract any insights, we first grouped the AIs in terms of their overall risk level and broke the domains down by various indicator groupings. We then categorized the AIs by attributes such as business size and the type of services they provide. Lastly, we applied a clustering algorithm to identify hidden groupings based on their survey responses and utilized factor analysis to extract latent factors. High Medium Risk Class Population
22
Low
There are 4 risk indicators under the “Delivery Channels” domain, which measure the AI’s exposure and presence in various channels to interact with their customers, including their internet, social media and mobile presence. Last but not least, this domain also assesses the risk induced by offering ATM services ChannelsDelivery
The five Inherent Risk Assessment domains
23 INHERENT RISK ASSESSMENT (IRA) [ Exhibit 11 ]
The “Technologies” domain contains 17 indicators including aspects such as the number of network-connected devices and hardware related issues . This domain also assesses the condition of the software eco-system of an AI by taking the number of suboptimal software systems and the degree to which the AI rely on third parties into considerations. Technologies
In summary, we found that the overall risk increases as an AI provides a broader range of services under the IRA framework assessment criteria. Simultaneously, the expansion of an AI in size would accelerate the rise in cybersecurity risk. However, we also found that the riskiest and largest of AIs have made self-awareness about the issues they face and have taken actions to mitigate them better when efforts in their less risky counterparts are to be improved. Overall, the IRA framework risk class calculation methodologies effectively categorize the AIs, aligning with both classifications by size and service provision. Lastly, we have made a few suggestions for improving the risk calculation methodology according to our findings.
The “Products and Technology Services” domain comprises 14 indicators , which assess the AI’s risk induced by banking-related services . The three main aspects are related to the provision of payment cards, fund transfer and other services, including treasury, trust and securities trading. Products ServicesTechnologyand “Organizational Characteristics” consists of 9 indicators, assessing the AI’s risk in terms of their size and risk areas indirectly related to service provision, including the number of employees. Moreover, this domain also measures the risk related to the lack of cybersecurity staff and the turnover of cybersecurity staff CharacteristicsOrganizational As the name suggests, the “Cyber Threat Tracked Records” domain hosts a total of 7 risk indicators related to the AI’s history to cyber attack . There are broadly two categories of risk, including the frequency and variety of cyberattacks, recording both successful and failed attempts Cyber RecordsTrackedThreat
24 SURVEY RESULT Let us first take a holistic view to understand the differences in risk levels among the three risk classes. Recall that the most common risk level determines the AIs’ overall risk. It is expected that higher-risk AIs would show elevated risk in each domain. The chart in Exhibit 12 helps us identify “Technologies” as the key differentiating domain between medium- and high-risk AIs, while “Products and Technology Services” presents the greatest gap between low-risk AIs and their peers. Lastly, we observed that “Tracked Records on Cyber Threats” is comparable across the three risk classes. However, the risk score does not provide a fair comparison across the five domains as each has a different number of indicators. To provide a standardized view of risk propensity independent of the number of indicators, we computed the percentage risk by dividing the total scores by the maximum possible in each domain. Exhibit 13 shows how a percentage risk score is calculated. Technologies Delivery Channels Products and Technology Services CharacteristicsOrganizational Tracked Records On Cyber Threats Risk Score Comparision Low HighMedium [ Exhibit 12 ] Inherent Risk Assessment – risk score comparison [ Exhibit 13] Inherent risk score and percentage risk score calculation Similar across all risk classes Biggest gap between medium- and highrisk AIs Largest gap between low- and mediumrisk AIs Cyber RecordsTrackedThreat For example –Under the “Delivery Channels” domain, which has a total of FOUR indicators ChannelsDelivery An AI responded with: 1x Low-risk 2x Medium-risk 1x High Risk But the maximum score is the number of indicators multiple by three, i.e. 3 x 4=12 Hence the percentage risk score of: 8/12 = 67% Therefore a risk score of: 1 x 1 + 2 x 2 + 1 x 3 = 8 17 24 32 5 9 9 12 21 21 14 15 17 10 12 11
OnTrackedCharacteristicsOrganizationalTechnologyProductsDeliveryTechnologiesChannelsandServicesRecordsCyberThreats
1. The Gap in “Technologies” Remains Salient The discrepancy in “Technologies” between medium- and high-risk AIs remain the most salient, with a 16 percentage points difference.
25 INHERENT RISK ASSESSMENT (IRA) Percentage Risk Score High 0% 10% 90%80%70%60%50%40%30%20% MediumLow [ Exhibit 14 ] Risk class percentage risk score
Based on the percentage risk score, we observed the following:
2. “Delivery Channels” Becomes Much Riskier High- and medium-risk AIs face the most potent threat in “Delivery Channels”, each with about a 15 percentage points lead compared to their second riskiest domain.
3. Low-risk AIs Show High Organizational Characteristics Risk
On the other hand, low-risk AIs face the highest risk in “Organizational Characteristics” while facing lower risk in “Delivery Channels”, “Technologies”, and “Products and Technology AnServices”.absence of obvious risk pattern when comparing across risk classes has suggested that some risk class-dependent factors might lead to the discrepancy, signalling differences in the dynamic of cybersecurity risk across groups. There are serval possibilities to the overall lowrisk score to the low-risk group. For example, the observation above either indicates that they are competent in addressing technical and service induced risks; or have a low reliance on technologies and face fewer clients, but might have struggled in aspects such as IT staffing and cybersecurity staff retention. Meanwhile, medium- and high-risk AIs have experienced the highest risk in “Delivery Channels”, which could be driven by the active use of various external communication channels or a more comprehensive range of service provision. To determine the underlying reasons for the observation above, we have conducted a more thorough investigation in a later section.
26 [ Exhibit 15 ] Relationship between AIs’ equity and their overall risk score [ Exhibit 16 ] Survey risk class and equity size mapping SURVEY RESULT – BY SIZE
According to Fitch Rating’s Managing Director Christopher Wolfe,3 larger banks might face higher cybersecurity risk as they are more likely to have complicated or perhaps legacy IT infrastructure compared to smaller banks. Therefore, we sought to analyse the IRA results by grouping the AIs with equity instead of their risk level. As illustrated in the right-hand chart, when the log of equity increases, the overall score of the AIs rises. More specifically, we found that the log equity has a modest to a high positive relationship with its overall risk scores, and a 1% change in the equity level would, on average, increase the AI’s risk score by 0.11 percentage points.
To generalize our analysis, we have grouped the AIs into different equity bins. An AI is said to be small when it has an equity level of below HK$10 billion, and it is classified as large when it has an equity level of over HK$30 billion, with a medium anywhere in between.
3. https://www.fitchratings.com/research/banks/bigger-not-always-better-for-bank-cyber-risk-scores-13-04-2021
Exhibitdomain.17
Interestingly, none of the low-risk AIs is of medium and large size when measured by their equity level, despite as seen in the section above, “Organizational Characteristics” is their worst performing domain percentage-wise. This provides evidence that the low-risk AIs have experienced risk from non-business-size-related risk under the “Organization Characteristics” indicates when we break the AIs down into three by size, we obtain a similar average score compared to when breaking down by risk class, despite a difference in sample size.
Relationship between Equity and Overall Risk Score
Equity Size (HKD$ Billion) Small (<$10bn) Medium ($10bn-$30bn) Large (>$30bn) ClassRisk Low 3 0 0 Medium 1 3 3 High 1 1 1 * With data of 13 respondents ScoreOverall Log Equity 100806040 07 08 09 10 11 12 Low HighMedium
categories
1. Outperformance in “Technologies” “Technologies” is the least risky domain for the large AIs with 50% risk score, compared to the 63% for the high-risk AIs as seen in the previous section.
(Medium)$30bn >$30bn92(High) Risk Score Comparison between Equity Size and Risk Class Size Risk Class 100020406080 [ Exhibit 17 ] Risk score comparison between equity size and risk class Percentage Risk Score (By Size) Large 0% 10% 90%80%70%60%50%40%30%20% MediumSmall [ Exhibit 18 ] Percentage risk score across the three equity categories OnTrackedCharacteristicsOrganizationalTechnologyProductsDeliveryTechnologiesChannelsandServicesRecordsCyberThreats
<$10bn61(Low)
27 INHERENT RISK ASSESSMENT (IRA)
2. “Products and Technology Services” Becomes More Large-Salientand medium-sized AIs face higher risk in “Products and Technology Services” when mapped against large- and mediumrisk AIs, while AIs with lower than HK$10 billion equity have little changes compared to the low-risk AIs.
3. Narrow Gap in “Organizational Characteristics” Despite containing risk indicators that measure an AI’s size, in the “Organizational Characteristics” domain, we found the smallest gap between small-sized AIs and their peers. $10bn89-
The bar chart in Exhibit 18 helps identify the best and worst performing domains for each group and allows us to compare the grouping with the overall risk class. Based on the percentage risk scores across equity categories, we observe the following:
Low “Technologies” risk score in large AIs
Strikingly, technology risk is among the best performing risk areas for AIs across all three sizes, while medium-sized AIs face higher risk compared to their larger peers. This contradicts our beliefs that larger AIs might face higher cyber risk due to more complex and challenging IT infrastructure. Indeed, we found that larger AIs have lower suboptimal software systems and a lower number of applications and reliance on third-party service providers. This suggests that largest banks might have already taken the initiative to move away from their legacy system, put substantial effort into digital transformation, and structurally organize their software systems to mitigate their technology risk.
Large AIs’ “Technologies” risk profile
Although large AIs have notably more network devices, including servers, routers and firewall (both physically and Comparevirtual)to medium-sized AIs, large AIs have less: - End Of Life applications - Without commercial-support open-source software - Amount of third parties Compare to both medium- and low-risk AIs: - Less in-house applications
28 [ Exhibit 19 ]
The large gap in “Products and Technology Services” and “Delivery Channels” between a small AI and its larger counterpart suggests that smaller AIs offer a narrower range of services to their customers and hence face lower cybersecurity risks. Lastly, by examining the detailed responses, we believe that the lack of cybersecurity staff could partially explain the narrow gap in “Organizational Characteristics”. As most small AIs reported a high risk in the number of cybersecurity staff, where the answers are predominantly medium risk or below for their larger Overall,peers.theresults above suggest that while larger AIs face a higher risk for offering a more comprehensive range of services, they have also invested in mitigating technology-related / induced risks. Meanwhile, smaller AIs face lower risk partly due to their smaller exposure but are not equally invested in reducing the risk they face. While the similarity in risk levels between the two classification methods reveals little new insight about the AIs, it provides support to the effectiveness of the IRA framework’s risk classification methodology, given that business size is correlated to the firm’s overall risk score, as shown above.
29 INHERENT RISK ASSESSMENT (IRA) Most Risky Indicators by Risk Score Least Risky Indicators by Risk Score [ Exhibit 20 ] Most and least risky indicators by risk score INDICATOR AND SUB-DOMAIN ANALYSIS To better understand which area AIs often struggle with, we have sorted the top and bottom five risk indicators out of the 51 IRA indicators in terms of total risk score, subject to the same score calculation rule above. The charts in Exhibits 20 and 21 reveal some interesting characteristics of the surveyed AIs. For example, Exhibit 20 helps identify that many of the respondents have a strong internet presence, indicating their use of the internet to provide online retail banking, wholesale banking and other banking services, instead of merely a channel that is just for providing information and not services. Again, the high risk in treasury services indicates that the surveyed AIs offer a large range of treasury services, including lockbox, currency services and online investing. NumberNetworkofDevices77% 3%83% 3%85% 6%88% 15%88% 15% ComputingofNumberClouldServicesPresenceInternet PrepaidCardsTreasuryServicesRisk Host ServiceITAssetRiskValue ConnectionDedicatedTransferWireChannelRisk ModelMerchantAcquirerRisk Relevance of Risk Indicators to AIs
Another observation we have made is how risky a risk indicator is depended partly on the applicability of the indicator to the AIs. For example, we observe an exceptionally low risk score for “Cloud Computing Services” and “Prepaid Cards” mainly because many AIs have indicated that these risk indicators are not applicable to them, hence a risk score of zero. Exhibit 21 shows the top five risk indicators by their number of “Not Applicable” response. The red dotted line is the maximum number possible, i.e. the number of surveyed AIs. The high “Not Applicable” rate, however, does not mean these risk indicators are redundant. Using cloud computing services risk as an example, with the increased progression of technology and increase in popularity of cloud computing services, AIs could in the future adopt the use of various cloud computing services, and the Inherent Risk Assessment would have acted as a benchmark to help AIs identify how much additional risk might be added and to incentivize them to implement the necessary
measures.Prepaid Card Risk Cloud Computing Services Risk Host IT Services Risk Merchant Acquier Model Risk Merchant Acquier Merchant Risk 1616192020 [ Exhibit 21 ] Top “Not Applicable” risk indicators 20 250 15105
30 [ Exhibit 22 ] Inherent risk indicator grouping example [ Exhibit 23 ] Risk sub-domain percentage-point difference between low-risk AIs and its peers Grouping of Related Risk Indicators into Sub-domains Next, we shall analyse the indicators and see how the risk varies between risk classes. To simplify the analytical process, we have grouped related indicators within a domain into various sub-domains. For example, for the “Technologies” risk domain, we have grouped the 17 indicators into three sub-domains: (1) Network risks, (2) Third-party risks and (3) Internal risks. A complete mapping is provided in the appendix (appendix 1). Cyber TheTrackedThreatRecordsofficialcatagory of the Inherent Risk Assessment, which takes into account various business and operational aspects of the AIs. DOMAIN A sub-catagory grouping done within this report, to simplify the analytical process and reduce data dimension. SUB-DOMAIN For each assessment indicators, the AIs select the most appropriate description under "low", "medium" or "high" inherent risk. INDICATOR Cyber FrequencyThreat 1. Number of Attempted Cyber Attacks 2. Number of Successful Attacks 3. Number of Breaches Cyber VarietyThreat 1. Phishing Attempts 2. Denial-of-Service (DoS) Attacks 3. Social Engineering 4. Malware Percentage Point Difference Risk sub-domain Medium - Low High - Low Network risks 8% 14% Third-party risks 7% 54% Internal risks 26% 16% Internet presence 23% 30% Mobile presence 56% 67% Social media presence 16% 23% ATM 38% 38% Payment card risks 32% 36% Fund transfer risks 11% 20% Client services 28% 5% Size risks 8% 11% Service risks 12% 31% Cybersecurity staffing risks -5% -20% Frequency -3% 9% Variety -11% 2% * in percentage points Bottom 3 in eachTopcolumn3in each columnTechnologiesDeliveryChannelsProductsandTechnologyServicesOrganizationalCharacteristicsTrackedRecordsOnCyberThreats
31 INHERENT RISK ASSESSMENT (IRA)
Our Observations:
3. Third-party Risk Caused Technology Risk Gap
2. Relatively Small Gap in Social Media Risk Under “Delivery Channels” domain, low-risk AIs have the smallest gap with their peers in social media presence. This is perhaps because low-risk AIs do not need to provide mobile banking services but would still, albeit to a smaller extent, use social media to interact with their customers.
4. Higher Risk AIs See Lower Risk In Cybersecurity Staffing Related Area Intriguingly, the higher the risk class, the lower the cybersecurity staffing risk appears to be. Here we observe that high-risk AIs outperform both the low- and medium-risk peers by 20 and 15 percentage points respectively. This suggests higher risk AIs might be more aware of their own cybersecurity risk and have subsequently taken actions to hire the appropriate professionals to manage their cybersecurity risk.
The table in Exhibit 23 also shows that the extent of risks in terms of frequency and variety of threats from the past track records is similar across all AIs. Overall, only one out of the 22 AIs reported three breaches, while all others reported none. Collectively, the responding AIs signal that they experience the lowest risk in social engineering and Denial-Of-Service (DOS) attacks, both with 16 out of 22 AIs reporting low risk. Meanwhile, phishing and malware attacks are deemed riskier, each with over 15 AIs responding with a medium rating, though most supplemented that their anti-virus software could stop those attacks. In addition, some AIs reported other types of attacks that were not captured in the IRA questionnaire. More particularly, in the detailed responses one of the AIs reported a large number of SQL injection attempts while another one AI reported incidences of ransomware attacks. Amid the fast-changing cybersecurity landscape, we suggest adding an “Other Attacks” column in the IRA questionnaire for AIs to report other types of cyberattacks they have faced. This may give a fuller picture and help their peers and regulators to be aware of new forms of cybersecurity threats.
Recall that high- and medium-risk AIs face the most potent risk in “Delivery Channels”. We see that it is mainly driven by their mobile presence risk, which are 56 and 67 percentage points higher than their low-risk counterparts.
1. Delivery Channels Risk Driven by Mobile Presence
In previous sections, “Technologies” is the main distinguishing characteristic between medium- and high-risk AIs. Here we found that it is mainly prompted by third-party related risks, perhaps signalling firms with a high-risk classification use more third-party software / hardware or outsource various duties to vendors, making risk control more challenging.
32
As analyses in the previous section demonstrated, there is a large gap between the sub-domain risks for service provision, where high- and medium-risk AIs show more than 30 percentagepoint difference compared to low-risk AIs. To further investigate how they impact their overall cybersecurity risk level, we have conducted some analysis based on the types of services they Amongprovide. the 22 surveyed AIs, 11 offer payment card services and 11 offer ATM services. (N.B. some AIs could offer both payment card and ATM services simultaneously.)
Risk Class Proportion By Service Provided
ANALYSIS BY SERVICE PROVISION
[ Exhibit 24 ] Risk class proportion by service provided
As Exhibit 24 shows, service-providing AIs are predominantly high- and medium-risk, while most non-service providing AIs are low-risk. Evidently, AIs that offer a larger variety of consumer services would be more exposed to cybersecurity risk. Since AIs often provide both payment card and ATM services, the two sub-domains are the most salient for both groups. In addition, both groups see a high mobile presence risk, which could be interpreted as they would also offer mobile banking to facilitate service provision. This would magnify their overall risk level. Overall, the observations above have helped us identify the key element of risk for the three groups. By looking at the detailed responses of the AIs, we could rationalize such differences and determine the cause of discrepancies. Therefore, based on the experience of conducting the analysis above, we believe the IRA exercise could allow regulators and AIs alike to easily identify their cybersecurity weaknesses and better establish plans to fill up any gaps.
100%80%60%40%20%0% Payment Card ATMNon-PaymentCard Non-ATM MediumHighLow9% 18% 64% 64% 27% 18% 9%18%82%18% 73%
33 INHERENT RISK ASSESSMENT (IRA) [ Exhibit 25 ] Risk sub-domain percentage-point difference between service-providing and non-service-providing AIs Percentage Point Difference Risk sub-domain ∆ ATM & Non-ATM ∆ Payment & Non-Payment Network risks 12% 14% Third-party risks 7% 17% Internal risks 14% 21% Internet presence 15% 21% Mobile presence 45% 58% Social media presence 15% 21% ATM 55% 48% Payment card risks 38% 41% Fund transfer risks 18% 19% Client services 17% 17% Size risks 15% 15% Service risks 7% 14% Cybersecurity staffing risks -3% -6% Frequency 0% 2% Variety -2% 3% Bottom 3 in each columnTopcolumnTechnologiesDeliveryChannelsProductsandTechnologyServicesOrganizationalCharacteristicsTrackedRecordsOnCyberThreats3ineach Correction of Risk with AIs’ Service Offerings While service-providing AIs should show a higher risk under the sub-domain on the relevant services, the AIs often show high-risk scores in other possibly related sub-domains. The key takeaway is that under the design of the Inherent Risk Assessment, many areas of risk could be interrelated, which explains the large gap between service-providing and non-service providing AIs. Hence we utilize factor analysis in a later section to identify any unobserved factors that lead to the higher cybersecurity risk.
Thesample.chartbelow shows that the surveyed AIs have been grouped into three clusters, where the x-axis is the AIs, and the y-axis represents how close the AIs are in terms of their survey response.
AI
50Closeness 010203040 - CodeColourDendrogram Group Low Medium High A 7 2 B 5 1 C 3 2 2 Indicators (on average) Group A Group B Group C Equity $3.9bn $51.6bn $14.5bn Deposits from customers $48.8bn $301.2bn $83.2bn Overall Percentage Risk 54.4 90.3 76.5 # Third parties 3.9 5.8 6.5 # in-house application 4.8 9.7 25.0 # EOL System 1.4 4.7 4.2 # OSS no commercial support 0.0 0.8 2.8 # Network device 76.8 1311.5 354.3 # Branches 8.9 43.7 15.2 # Employees 289.0 2106.7 872.2 Social Media Presence 0.1 1.5 1.3 # Cards issued 2,000 466,000 43,000 # P2P cosmotrons 0.0 70,000 3,000 # Treasury clients 3,000 45,000 3,000 # Correspondent banks 110 490 30 # Entities the AI act as a merchant acquirer for 90 200 400
By examining the dendrogram in Exhibit 26, we have identified three clusters. Group A is composed of low- and medium-risk AIs, Group B contains five medium-risk and one high-risk AIs, and Group C consists of AIs from all three risk classes. While the risk classifications are mixed, we can see from the charts in Exhibit 28 that the domains’ inherent risk scores and percentage scores within a group are mostly similar.
34 IRA Response Dendrogram Hierarchical Clustering Group Attributes [ Exhibit 26 ] IRA Response dendrogram and hierarchical cluster groupings [ Exhibit 27 ] Hierarchical clustering group attributes HIERARCHICAL CLUSTERING
While most AIs adhere to their default risk level, the rule does not categorize the AIs by their characteristics manifested in their survey responses. To identify any hidden groupings with the AIs, we utilized hierarchical clustering. We applied the clustering algorithm on the total scores over the five inherent risk domains for each AI. As seen in the heat map in the appendix (appendix 2), each AI has been sorted, and similar AIs are clustered closer together.
Hierarchical clustering, or hierarchical cluster analysis (HCA), divides a dataset into clusters iteratively and creates a tree-like structured dendrogram. The dendrogram is then used to explain the relationship between all data points in the
35 INHERENT RISK ASSESSMENT (IRA) [ Exhibit 28 ] Hierarchical cluster grouping risk score Technologies ServicesTechnologyProductsChannalsDeliveryandCyberRecordsCharacteristicsOrganizationalTrackedonThreats Technologies ServicesTechnologyProductsChannalsDeliveryandCyberRecordsCharacteristicsOrganizationalTrackedonThreats Technologies ServicesTechnologyProductsChannalsDeliveryandCyberRecordsCharacteristicsOrganizationalTrackedonThreats Group A Average Group B Average Group C Average 0.540.510.29 0.270.420.790.580.630.390.540.540.470.500.630.53
36
Correlation of Risk with AIs’ Business Nature and Target Customers
By examining the detailed responses in the survey, we have identified a few key statistics that might help us endow meaning to the three clusters. Exhibit 27 shows a full table of comparisons. An immediate observation we can make from the data is that, on average, Group B is the largest amongst the three groups, followed by Group C. The former is the largest in terms of multiple monetary measures, the number of branches, staff, and customers. Next, Group C is mostly defined by the high number of third-party, in-house applications, without commercial support Open-Source Software (OSS) and End-of-Life (EOL) systems, signalling that their risks are mainly from their weakness in managing technical risk. Intriguingly, Group A is the smallest on average by almost all measures. AIs in this group have only issued a small number of payment cards and have a weak presence in the P2P transaction space, yet they are almost as competitive in the treasury service space as Group C. The observation above indicates that Group A is mostly small-sized retail banks with a low number of branches and employees. They also have a limited outreach in terms of their digital presence and service provision. On the other hand, Group B appears to be large banks with mature internal technology systems and high outreach in their internet presence and P2P transaction. The high average deposit from customers indicates they might have a certain degree to support higher net worth customers or corporate clients. Meanwhile, Group C, being smaller than Group B but with a noticeably higher presence as a merchant acquirer, could be AIs that focus on the payment system side and support businesses on payment solutions.
While we cannot conclusively suggest how the type of AIs impact their risk, the analyses above have provided evidence for such possibilities.
Overall, the clustering result reveals that an AIs’ overall risk might be closely related to its business nature and target audience, which are not directly captured in the IRA framework.
patterns of
Variable Factor 1 Factor 2 Factor 3 Factor 4 1 Payment Card Risks PresenceInternet StaffingCybersecurityRisks Cyber VarietyThreat 2 PresenceMobile Risks Fund Transfer Risks Cyber FrequencyThreat 3 ATM Provision Size Risks 4 Size Risks Client Services Risks 5 Internal Risks Other RelatedService-Risks Factor 1 Payment Provision Risk Factor 2 Banking Services Risk Factor 3 Cyber Threat Risk Factor 4 Attack Variety Risk [ Exhibit 29 ] Factor analysis variable groupings Note: See appendix 3 for the full factor loading score table. Exploratory
While the IRA process provides a comprehensive view of the AIs’ cybersecurity risk exposure, the number of indicators presents a challenge in generalising the statistical findings and insights. To better understand the root cause of the inherent risk and identify any underlying factors that drive an AI’s cybersecurity risk, we have utilized exploratory factor analysis (EFA).
we
our
37 INHERENT RISK ASSESSMENT (IRA) FACTOR ANALYSIS
The sub-domain score is calculated by summing up all the indicators scores. For example, there are three indicators under the sub-domain “Cyber Threat Tracked Records – Frequency”. If an AI reported medium risk for two of the indicators and high risk for the remaining one indicator, it would have a score of 2 × 2 + 3 × 1 = 7 for this Aftersub-domain.obtainingall the sub-domain scores, we fitted a factor model with orthogonal rotation and drew a scree plot to determine the number of latent factors. As the correlation result below shows, we expect the EFA to help us identify and distil the sub-domain even further.
risk
Essentially,
Ideally, we would conduct EFA on all the 51 indicators and have the algorithm determine a set of latent risk factors. However, limited by the sample size, we could not simply feed all the indicators into the algorithm, as the “curse of dimensionality”4 impacts the validity of our EFA variables. Therefore, we substitute the 51 indicators with the 15 grouped sub-domains provided in the previous section.
an
exposed
relationships. The
greater than one explains more variance than an observed variable.642 2 4 6 8 10 Factor CardPaymentPresenceMobileRisk RiskProvisionPayment Size Risk ATM Risk Scree Plot Eignvalue 12 14 0 [ Exhibit 30 ] Factor analysis scree plot [ Exhibit 31 ] Factor analysis illustration Below is an illustration of observed variable to factor mapping. VariablesObserved Factors
we
4. Since we have more features than observations (51 versus 22), could be to the of overfitting model. Factor Analysis is a tool for investigating variable key concept is that multiple observed variables have similar responses because they are all associated with a latent (i.e., not directly measured) variable. used a scree plot to help us determine how many factors should use. The eigenvalue measures the explanatory power of the factor. a factor with eigenvalue
We
To deduce what each factor represents, we examined the sub-domains with the highest correlation scores.
38 30252015103505
latent
11 23 22 24 32 34 7 8 6 5 7 7
Next, factor 3 seems to be explained by the cyberattack frequency and the inverse of their cybersecurity staffing risk. Finally, the fourth factor appears to be largely about the cyberattack variety risk. We then regenerate IRA plots using the extracted risk factors. The following chart shows that the risk score between high- and medium-risk AIs have been pulled much closer after the analysis. Yet, the distribution of risk appears to align with the observations we made in distinguishing the AIs. More particularly, we see a strong presence in payment provision for both medium- and high-risk AIs, while high-risk AIs offer more other banking-related services. four factors
The grouping above forms a coherent picture of our findings in the sections above, where we found that type of services is particularly salient in explaining the overall risk of the AIs (factor 1) while confirming our observation that cybersecurity staffing risk is inversely related to cyberattack frequency risk. Moreover, it reveals that the banking and fund transfer services of the AIs, together with their internet presence, have helped contributed the second most of the risk level as a group. The latent factors above reveal the underlying cause of cyber risk and demonstrate that indicators across each domain can be highly correlated.
Underlying Factors of Inherent Risks
Risk Score Comparison On The Four Factors Low HighPaymentMediumProvisionRisk BankingRiskServices Cyber Threat Risk Attack Variety Risk [ Exhibit 32 ] Inherent risk score comparison between the
First, for the left-most factor, the most dominant risk indicator group is the Payment Card Risks, followed by ATM and mobile presence risk. This suggests that the first factor is highly likely to represent the payment provision risk of an AI. Moving on to factor 2, we can see that the firm’s fund transfer services, internet presence, and size are the top three sub-domains explaining this factor, indicating this factor is related to an AI’s fund transfer and banking service provision.
As described in this section, we have conducted a thorough investigation on the Inherent Risk Assessment results of the 22 AIs. In summary, when comparing the AIs with the classification rule set out in the IRA framework, we found that “Technologies” is the main difference between high- and medium-risk AIs, which is mainly driven by third-party risk, with a difference of 47 percentage points, and the largest gap in any sub-domains. We also found that low-risk AIs differ from their riskier peers due to low risk in “Products and Technology Services”, driven by the narrower range of services the low-risk AIs provide.
Next, the key takeaway of the service provision analysis is that many of the indicators are interconnected despite being in different domains. For example, mobile risk presence is highly related to payment card services, which means AIs who issue payment cards often have an accompanying mobile application for their clients. This has led us to investigate the unobserved latent factors on the survey responses using Exploratory Factor Analysis. Using EFA, we found that the risk specific to our 22 AIs is mainly caused by banking and payment service provision, which is correlated to internal and size risk areas.
Comparing the AIs by their equity size, we found a similar risk score as the one under risk classification rule. Nevertheless, there are a few interesting observations. More specifically, we found that the “Technologies” risk score for large AIs is lower compared to medium-sized AIs, suggesting that largest AIs have put in some effort to reduce their technology-related risk. The similarity in risk profile suggests that the IRA classification rule is effective in classifying the AIs, based on our finding that the size of an AI correlates with their risk level.
39 INHERENT RISK ASSESSMENT (IRA)
INHERENT RISK ANALYSIS: SUMMARY
Overall, we believe that the IRA has helped the AIs identify their risk. The classification rule provides a clear guideline to the AIs while also revealing some interesting characteristics about the surveyed AIs. As an extension of our study, we also investigated the classification rule of the C-RAF 2.0.
When we clustered our AIs together by using the hierarchical clustering algorithm, we found three distinct groups. Essentially, the findings form a coherent picture with the factor analysis results. The three groups show differences in characteristics in their internal technology risk, size risk, and service provision risk.
40 C-RAF 2.0 CLASSIFICATION HKMA released a revised version of the Cyber Resilience Assessment Framework (C-RAF 2.0) in November 2020. Here we would like to take a quick look at how our findings are impacted if we use the updated classification rule: “If the number of Low risk assessment criteria is less than or equal to the total number of Medium and High risk level, the inherent risk level should be adjusted to Medium.” After applying the additional IRA classification rule, two out of ten low-risk AIs are upwardly adjusted to medium risk. As the scatter chart above indicates, the two AIs score the highest within the low-risk AIs in terms of overall risk score. This indicates that the additional rule is able to better reflect the overall risk score in this scenario. Low HighMediumAIs' Risk Class Population [ Exhibit 33 ] AIs’ risk class population under the updated classification rule 14% 36% 50% Low HighMediumOverall Risk Score by Banks and Risk Classification C-RAF | C-RAF 2.0 | [ Exhibit 34 ] AIs’ risk score under the C-RAF 2.0 classification rule 40Overall Risk Score | 60 80 100
41 MATURITY ASSESSMENT (MA) (MA)ASSESSMENTMATURITY
The Maturity Assessment (MA) covers seven key domains, with over 360 controls across three maturity levels, which are: “Baseline”, “Intermediate”, and “Advanced”. The MA is designed to provide a comprehensive review of the operating environment and emphasizes a sound governance framework. As introduced in HKMA’s C-RAF consultation paper, the seven domains are split into three levels, depicted in Exhibit 36. The centre represents the governance aspect; the inner circle consists of areas of controls related to the internal environment; and lastly, the outer circle shows the controls related to the external environment. The level of maturity required for each AI depends on the risk classification of the Inherent Risk Assessment. For low-risk AIs, they need to attain the “Baseline” maturity level as a minimum requirement. Correspondingly, medium-risk AIs need to attain an “Intermediate” maturity level, and the “Advanced” level is required for high-risk AIs. In general, the risk controls adopted by all AIs are consistent with their inherent risk level, where higher-risk AIs adopt more controls.
[ Exhibit
42 [ Exhibit 36 ] The seven domains of the maturity assessment5 [ Exhibit 37 ] Percentage maturity control attainment by risk class OVERVIEW
Surveyed AIs' Maturity Assessment Population 35 ] Maturity Assessment population of surveyed AIs can respond to parts of the survey they are not required to, we only conducted analyses on those assessments HKMA (2016). Cyber Resilience Assessment Framework Consultation Draft. AIs are subjected to. Therefore, this section will only report the “Baseline” control responses for low-risk AIs, both “Baseline” and “Intermediate” controls for medium-risk AIs, and finally, all three “Baseline”, “Intermediate”, and “Advanced” controls for high-risk AIs.
5.
14%Advanced 41%Intermediate While45%BaselinetheAIs
Situational Awareness ThirdParty Risk Management ResponseandRecovery ProtectionIdentification Detection Governance AttainmentPercentage Low Medium High Baseline 88.0% 90.7% 99.6% Intermediate 82.8% 100.0% Advanced 99.1% Not Required All Requirements Met Partially Attained the
Risk Profile in Different Environments
A quick examination of the AIs’ risk profile in terms of their Governance, Internal Environment, and External Environment would reveal that low-risk AIs struggle the most under the Governance aspect. This implies that the low-risk AIs commonly fail to take suitable measures in the oversight, strategy, and policy aspects. Meanwhile, medium-risk AIs have struggled the most under the external environment category, implying these AIs perhaps lack good threat intelligence or have issues managing third-party risk. Lastly, high-risk AIs are mostly on target under all three categories, meaning these AIs are rather balanced and well-rounded in preventing losses from cyber threats.
An AI’s level of attainment of the maturity level is calculated by the number of “Yes”, “Alternative Control”, “Risk Accepted”, and “Not Applicable” responses as the percentage of total numbers of control. As evidenced by Exhibit 37, most AIs have identified gaps in their cybersecurity Formeasures.riskcontrols that are not accomplished, surveyed AIs responded with the answer “No”. The average number of “No” under the “Baseline” control given by low-risk AIs is 17.6. Only one lowrisk AI out of ten successfully fulfilled all the “Baseline” controls. On the other hand, mediumrisk AIs noted an average of 17.1 “No” responses under the “Baseline” control and 15.4 at the “Intermediate” level. Of the nine medium-risk AIs, only one has met all the requirements. Highrisk AIs have performed the best under the “Maturity” Assessment. Of the three high-risk AIs, two of them have completed all the required controls, while the remaining one has failed in three “Baseline” controls and two “Advanced” controls.
43 MATURITY ASSESSMENT (MA)
[ Exhibit 38 ] Risk profile in different environments by risk class 90%89%83% LOW HIGHRISKRISK 98%100%99%78%88%88% MEDIUM RISK External Environment CHART LEGEND GovernanceInternalEnvironment
Protection
Introduction to the seven maturity assessment domains Seven Domains of Maturity Assessment
The“Governance" domain contains 81 controls across 5 components as defined by the HKMA. This domain aims to encompass measures related to cyber resilience oversight, cyber risk management, as well as audit and aspects related to staffing, training and policies
The "Detection" domain encompasses 4 components which cover a total of 60 controls. The four components are vulnerability detection, anomalies activity detection , cyber incident detection and finally, threat monitoring and analysis.
“Identification" is one of the four internal environments related domain, alongside "Protection, "Detection", "Response and Recovery". In particular, the "Identification" domain consists of 23 controls across 2 components related to aspects such as IT assets identification and cyber risk identification and assessment
Identification
"Situational Awareness" is one of the two domains under the External environment umbrella, alongside "Third-party Risk Managament". Under the "Situational Awareness" domain, there are only 18 controls, belonging to either the threat intelligence or the threat intelligence sharing component
Governance
44 [ Exhibit 39 ]
Detection
AwarenessSituational
Each domain comprises a number of components. Each component has a set of control principles (controls) for AIs to determine if they achieve the required level or extent of implementation for attaining a particular maturity level of that component.
Response and Recovery
There are 6 components covering 106 controls under the "Protection" domain, the highest number of all seven domains. These controls are related to aspects such as patch management , data security , infrastructure protection and access control.
"Response and Recovery" is a maturity domain composed of 51 controls across 3 components. The maturity controls in this domain are related to response planning, incident management and lastly, escalation and reporting
As the name implies, the "Third-party Risk Managament" domain consists of 27 controls across 3 components related to various aspects of third-party risk related measures. These include the ongoing monitoring of third parties, external connections and other third party related measures
ManagementRiskThird-party
45 MATURITY ASSESSMENT (MA) [ Exhibit 40 ] Maturity control grouping example Domain The scope of the maturity assessment covers seven key domains. These domains are categorized in three levels: governance, internal environment, and external environment. Component Each domain comprises a number of "components", the relationship is defined by the official Maturity Assessment framework. Control The framework has also set out a number of "control principles" which are divided in to different maturityBaseline:levels 1. IT Asset Management 2. IT Configuration Management Intermediate: 1. IT Asset Management 2. IT Configuration Management Advanced: 1. IT Configuration Management IT Asset Identification Identification Baseline: 1. Cyber Risk Identification 2. Assessment Scope Intermediate: 1. Cyber Risk Identification 2. Assessment Scope Advanced: 1. Cyber Risk Identification 2. Assessment Scope Cyber Risk Identification And Assessment In the following section, we will examine the Maturity Assessment responses, assess the landscape of cyber risk control maturity level of the AIs, and investigate the common weakness for improvement. Similar to our work in the Inherent Risk Assessment analysis section, we will examine the domain level, the component (i.e. subcategory) level and the individual control level in an attempt to identify the cause of gaps in their maturity level. In short, the results align with the statistics above, where we found high-risk AIs perform the best while medium-risk AIs are the worst. The underperformance is partly driven by their low attainment rate under the “Third-party Risk Management” domain, which could be due to the relatively low Third-party Risk as shown in the IRA analysis. Nonetheless, when we used the MA results to check against the AIs’ actual security measures, we found that the results are somewhat effective in understanding the real-life implementation of SSL certifications of the AIs.
The previous section shows that high-risk AIs have adopted almost all controls across the three maturity levels. More specifically, only one high-risk AI does not meet all the requirements. Yet, the AI only has a slight shortfall in “Governance”, “Protection”, and “Situation Awareness” and has stated reasonable timelines to fill in the gaps to mitigate those risks. This suggests that high-risk AIs have proactively taken actions to minimize the cyber risk induced by their day-today operations and characteristics and are fast-acting in closing any gaps. This echoes our finding in the Inherent Risk Assessment, where high-risk AIs face lower cyber staffing risk.
2. Most Medium-Risk AIs Fail to Meet the Target
1. High-Risk AIs Outperform
Baseline AdvancedIntermediate % Key findings:
46 [ Exhibit 41 ] Maturity assessment domain result comparisons SURVEY RESULT With the components and controls of the maturity assessment in mind, we began to analyse the performance of different risk classes. Exhibit 41 presents a chart that allows us to examine if there are any areas of improvement for AIs in various risk classes. Note the percentage is calculated in terms of the total number of controls on each maturity level for every domain. For example, under the “Governance” maturity assessment domain, there are a total of 30 baseline controls. If an AI attained 27 of which, it would achieve a score of 90%. Again, we only show the results for the required maturity level for each group of AIs; hence there are only high-risk AIs in the “Advanced” section, and only medium and high risks in the “Intermediate”Lowsection. Medium High Medium HIgh HIgh Governance DetectionIdentification Response and RecoveryProtection Situation Awareness Third-party Risk Management 1000102030405060708090 Maturity Assessment Domain Results
By contrast, medium-risk AIs perform less well, with an overall attainment rate of 87% across the Baseline and Intermediate maturity levels. This group of AIs has underperformance in “Governance”, “Protection”, and “Third-party Risk Management”. On average, they have failed to meet six or more controls in the domain above across the two required maturity levels. In particular, the lack of third-party controls might be caused by their low exposure to third-party
See Mixed Result Across Domains
47 MATURITY ASSESSMENT (MA) risk, as seen in the Inherent Risk Assessment section, where the average medium-risk AIs are only seven percentage points riskier than their low-risk peers. Although low-risk exposure in a certain area is no excuse for omitting adequate measures, it also highlights that AIs might prioritize areas where they face a higher risk when resources are scarce. Regulators could perhaps keep this in mind when adjusting a later iteration of the survey assessment or provide incentives for the AIs to bridge those gaps as a precautionary measure.
CONTROLS AND SUB-DOMAIN ANALYSIS
Key findings:
The data security control has an attainment rate of over 99%, indicating that all surveyed AIs have taken as much control as possible to safeguard their sensitive information and data.
For low-risk AIs, they are mostly on target in terms of “Protection”, “Situation Awareness”, “Response and Recovery”, and “Third-party Risk Management” but have failed to meet expectations under all three other domains. This again signifies that many low-risk AIs have not met the minimum standard and underperformed in terms of internal environment and governance control.
Controls related to end point data security, data protection, and data disposal are of high importance to the AIs, allowing them to avoid data breaches. In fact, CybelAngel, a digital risk protection organization, has found that over 90% of data breaches are due to negligence, and by enforcing such data protection measures, the AIs could greatly reduce potential losses related to data breaches.
2. The AIs Have Performed Particularly Well in Components Under “Response and Recovery” We notice that half of the top six performing maturity components are related to the “Response and Recovery” domain. The components are Incident Management, Escalation and Reporting, and Response Planning. This shows that most of the surveyed AIs have generally performed
1. Near Full Attainment in Data Security
As the maturity assessment covers a wide range of cybersecurity measures, it allows us to identify the common weaknesses and strengths of the responding AIs. Below are some of the best- and worst-performing maturity components out of the total 25 components. The percentage score is calculated by the average attainment rate across the maturity controls inside the components, and only the required maturity controls according to the AIs risk class are considered.
3. Low-Risk AIs
Data Security Incident Management Esclation And AccessReportingControl Threat Monitoring And Analysis Response Planning [ Exhibit 42 ] Best performing maturity components 98 100990 94% 979695.8%96.3%96.5%96.7%97.3%99.1%95
Key findings:
1. Over 80% Attainment Rate for all 25 Maturity Components
2. Components Under The “Third-party Risk Management” Maturity Domain Performed the Worst Components under the “Third-party Risk Management” domain appear to be the worst of the underperformers. The three components in this domain (External Connections, Ongoing Monitoring on Third-party Risk, and Third-party Risk Management) scored the lowest in the level of attainment by the surveyed AIs.
48 Audit Anomalies Activity Detection Cyber Risk Identification and Assessment External Connections Ongoing Monitoring On Third-party Risk Third-party Management [ Exhibit 43 ] Worst-performing maturity components 86 9290880 78% 84828090.8%90.8%89.1%88.2%84.9%82.9% well and are quite all-rounded in implementing follow-up measures in case of a cybersecurity incident. This is a somewhat surprising finding as we see in the previous section, medium-risk AIs struggle with controls under this domain. Upon inspecting individual maturity control results, we found that the “Incident response to widely reported events” 6 control under the “Response and Recovery – Response Planning” component has the single most negative answers out of all 365 controls. The main reason AIs have underperformed in this domain perhaps has to do with the relatively strict condition of this control, where an AI has to meet three different categories to warrant a “Yes” response.
We notice at least 80% attainment rate for all 25 maturity components, which is encouraging. 21 of the 25 components achieve over 90% average attainment rate, and only four components’ with an attainment rate below 90%.
3. Underperformance in “Third-party Risk Management” Due to Low Attainment in Individual Controls
We plotted the attainment rate for the worst-performing controls out of the total 365 maturity controls and have found that the underperformance in “Third-party Risk Management” appears to be due to a wide base underperformance where many individual risk controls show a low attainment rate. This is particularly significant for the “Third-party Risk Management” as it only has 27 controls, some of the lowest in the seven domains.
6. Definition of “Incident response to widely reported events”: If widely reported events such as massive destruction or alternation of data are used to improve incident detection and response.
49 MATURITY ASSESSMENT (MA) Incident response to widely reported events DNSSEC Deployment Security Information Thresholds On-going Third-party Risk Assessment Process to Correlate Event Information Anomalies Activity Detection Thresholds Additional Training for Privileged Users Third-party Due Diligence Before Contract Third-party Responsibility for Notification On-going Third-party Review Security Incidents Third-party Responsibility Establishment [ Exhibit 44 ] Average maturity control percentage attainment [ Exhibit 45 ] Partial adoption of maturity controls 800 40302010% 706050 71%71%71%70%68%68%68%67%64%55%55% Average Attainment Percentage (Maturity Control)
we
the AIs to conduct a thorough check on their cyber risk profile. Over 90% of participating AIs found the C-RAF useful, especially in identifying previously unrecognized gaps.7 7. https://www.moodysanalytics.com/regulatory-news/Nov-03-20-HKMA-Enhances-Cybersecurity-Fortification-Initiative
Top 5 controls by
we
If examine the detailed responses, where AIs who have failed to meet the requirement for a control would note down the gap they noticed, have found that 8 out of 10 AIs responded with a negative answer have indeed partially adopted relevant measure. This is a similar case to many other controls in the Maturity Assessment, where we have found that of the top five controls with the most “No” answers, four of them have been partially adopted by at least half of the AIs. We believe the Maturity Assessment could benefit from a similar three-level system to the Inherent Risk Assessment. Instead of allowing only binary “Yes” and “No” answers, the AIs could indicate a partial adoption of the measures, which could better reflect the implementation status of the vast maturity controls. non-adoption rate Assessment it also opportunity for
Control Total No(s) AdoptedPartially Not Adopted/ No Formal Procedure Widely Reported Incident Response 10 80% 20% DNSSEC Deployment 9 11% 89% Security Information Thresholds 8 75% 25% Ongoing Third-party Risk Assessment 7 57% 43% Process to Correlate Event Information* 7 43% 43% * One response was missing Despite the observation above, we believe the Maturity
not only allows HKMA to understand the gaps in the AIs’ practice better, but
acts as an
In this section, we have investigated the Maturity Assessment survey responses using a topdown approach. We first investigated the overall results across the three risk classes of AIs, based on the maturity requirements they are subjected to and then down to the domain component and control levels. We notice that high-risk AIs have performed particularly well in the Maturity Assessment despite being subjected to the highest number of maturity controls. On average, this AI group achieves over 99% of controls at all the three maturity levels and even completely meet all the requirements at the Intermediate level. On the other hand, the medium-risk AIs have underperformed, achieving only 91% and 83% of controls at the Baseline and Intermediate level respectively. Meanwhile, low-risk AIs have also underperformed at the Baseline level, and on average they achieve less than 90% of their required controls.
50 [ Exhibit 46 ] Staffing and training maturity component attainment rate
RESPONSES IRA: LOW CYBERSECURITY STAFFING RISK FOR HIGH-RISK AI s
The similar findings in both IRA and MA sections have demonstrated that the two selfassessment exercises work coherently together, and the AI’s answers are consistent across both sections. AIs and regulators could then utilize the survey to effectively identify gaps between associated risk and maturity control areas, therefore presenting a tool that allows AIs to target areas in which they notice the biggest gap.
An examination of AIs’ risk profile in terms of Governance, Internal Environment, and External Environment reveals that low-risk AIs struggle the most under the Governance aspect, implying that they commonly fail to take the required measures in aspects related to governance and oversight. Meanwhile, medium-risk AIs have underperformed in the external environment category, indicating these AIs perhaps lack good threat intelligence or have issues managing third-party risk. Finally, high-risk AIs are mostly on target as expected. This reveals that high-risk AIs are rather well-rounded in preventing losses from cyber threats.
Low 87% Medium 89% High 98% A quick inspection would reveal that the highrisk AIs have notably higher attainment under the staffing and training component. This confirms our observation in the IRA section that high-risk AIs have put more effort into investing in their cybersecurity and related staff. More specifically, the high-risk AIs have excelled in controls that are still struggled with by many other lower-risk AIs. For example, in acquiring professionals with adequate qualifications and providing annual training to staff with privileged access.
Risk Class Staffing and Training Component Average Attainment Rate
MATURITY ASSESSMENT: SUMMARY
In the IRA section, we found that high-risk AIs face a lower risk related to cybersecurity staffing, here we investigate the detailed responses between high-risk AIs and their peers. More particularly, we examine controls under the Staffing and Training component in the larger umbrella of the “Governance” domain.
Finally, we cross-checked a finding from the IRA section to draw links between the Inherent Risk Assessment and the Maturity Assessment. In particular, in the IRA section we found that AIs with a “High” overall risk experience the lowest cybersecurity staffing risk. We believe they have conducted the adequate measure in staffing and training their staff. To check if the findings in the maturity assessment align with the abovementioned findings, we investigated a particular maturity component specific to cybersecurity staffing and training. As we expected, we found that the high-risk AIs excel in that component, which is consistent with our IRA finding. The two self-assessment exercises work coherently together, and the AI’s answers are consistent across both sections.
51 MATURITY ASSESSMENT (MA)
At a domain level, we found that the slight shortfall in the high-risk AIs comes from a single AI, who falls short slightly in the “Governance”, “Protection”, and “Situation Awareness” domains, but has established a reasonable timeline to implement the missing measures. By contrast, medium-risk AIs perform worse in “Governance”, “Protection”, and “Third-party Risk Management”. For low-risk AIs, they are mostly on target in terms of “Protection”, “Situation Awareness”, “Response and Recovery”, and “Third-party Risk Management” but have failed to meet expectations under the other three domains. This again signifies that many low-risk AIs have not met the minimum standard and underperformed in the internal environment and governance controls. Next, we seek to understand the best and worst components out of the total 25 components. We found that none of the components is fully adopted by all the AIs. Still, the Data Security component is by far the best performing with an attainment rate of over 99%, suggesting the AIs have taken as much control as possible to safeguard their sensitive information and data. All the components reached at least 80% attainment rate, with the three worst components being from the “Third-party Risk Management” domain. Upon further investigation, we found it is mainly driven by the fact that many of the infidel controls in the “Third-party Risk Management” domain have a low attainment score. Almost half of the twelve worst performing controls are in this domain.
52 MATURITYRISKINHERENTAND
53 OVERVIEW While the rule for minimum maturity attainment gives a clear and concise guideline to AIs, we could expand the idea further by examining the relationship between risk and maturity. As more cybersecurity efforts are required for the riskier entities, we hope to see a positive relationship between an AI’s risk and its maturity, or better yet, AIs with low risk would still attain a high maturity level to minimize chances of cybersecurity-related losses. Here, we have calculated the percentage maturity attainment for the AIs and plotted it against the overall risk score, reflecting each AI’s level of maturity under their required measures. [ Exhibit 47 ] Relationship between inherent risk and maturity score AI Inherent Risk and Maturity Score ScoreMaturity Maximum Maturity Score Inherent Risk Score 100150200250300350400 40 60 80 100 As shown in the figure above, there exists a positive relationship between the AIs’ inherent risk score and their maturity, which is a reassuring sign. To further investigate how each maturity domain varies with respect to the AIs’ inherent risk, we have plotted the seven domains (y-axis) against the overall risk scores of the AIs (x-axis). In Exhibit 48, we have also added the risk class average as a reference to allow a clear comparison between the risk class. In addition, we have drawn dotted lines to indicate the maximum number of control principles for each maturity level. The blue line represents the Baseline level, the yellow line for Baseline and Intermediate level, and the red dotted line acts as the maximum possible value, i.e. the number of indicators in a domain. The AI should reside on its corresponding dotted line and in fact above its corresponding dotted line in the ideal scenario. Low HighMedium
54 INHERENT RISK AND MATURITY Governance Governance Maximum Maturity Score Baseline + Intermediate Baseline Inherent Risk Score LowAverageRisk MediumAverageRiskHighRiskAverage100500 50 100 Protection Protection Inherent Risk Score 100806040 50 100 Identification Identification Inherent Risk Score 10200 50 100 [ Exhibit 48 ] Relationship between the seven maturity domain and inherent risk score Low HighMedium Benchmark Detection Detection Inherent Risk Score 2030405060 50 100
55 Situational Awareness AwarenessSituational Inherent Risk Score 1015205 50 100 Low HighMedium Benchmark Response and Recovery RecoveryandResponse Inherent Risk Score 204060 50 100 Third-party Risk Management ManagementRiskThird-party Inherent Risk Score 1020300 50 100
Key findings:
2. Most Low- and Medium-Risk AIs Fail to Reach Target on a Domain Level As seen in Exhibit 48, only about half of non-high-risk AIs manage to reach or get close to their corresponding target for each domain. This suggests that the underperformance of the groups is often caused by a group of AIs failing to reach target instead of a few anomalies. More worryingly, some medium-risk AIs perform worse than low-risk AIs despite having a higher number of maximum controls, particularly in “Third-party Risk Management” and “Identification”.
1. Align with General Trend - Higher Risk Score Often Accompanies with Higher Maturity Score Similar to the main scatter plot at the beginning of this section, a high overall risk tends to mean a higher maturity score in each domain. They indicate to us that for all the Maturity Assessment domains, riskier AI would have taken the corresponding actions in each domain.
Fortunately, the MA exercise includes fields for AIs to set deadlines to implement these measures. Regulators could utilize this information and investigate the underlying reason for such underperformance and provide support and guidance to these AIs. Relationship between the seven maturity domain and inherent risk score
(cont.) [ Exhibit 48 ]
8. There are five domains under the US National Institute of Standards and Technology (NIST) Security Framework, which are “Identify”, “Protect”, “Detect”, “Respond”, and “Recover”. The five domains above corresponds to four of our Maturity Assessment domains, namely “Identification”, “Protection”, “Detection” and “Respond and Recovery”.
Identification Technologies Risk Score 10200 10 20 30 Maximum Maturity Score Baseline + Intermediate Baseline LowAverageRisk Medium Risk Average High AverageRisk Detection Technologies Risk Score 204060 10 20 30 Protection Technologies Risk Score 100806040 10 20 30 RecoveryandResponse Technologies Risk Score 204060 10 20 30 Group A (1) - Technologies Risk Score versus Four Traditional Maturity Domains
56 INHERENT RISK AND MATURITY [ Exhibit 49 ] Group A scatterplots – “Technologies” risk score versus four traditional maturity domains DOMAIN COMPARISON
DIFFERENT PERSPECTIVES IN MEASURING RISK VS REQUIRED MATURITY
To better understand if the AIs have put sufficient resources into addressing various risks they face, we created various scatterplots based on the Inherent Risk and Maturity Assessment Domains. We first examine the relationship between the AIs’ “Technologies” and “Cyber Threat Track Records” risk against the “Identification”, “Protection”, “Detection” and “Thirdparty Management” maturity domains. We focus on these four domains in particular as they are deemed the traditional or typical steps advocated for cybersecurity risk management, as depicted in cybersecurity risk management frameworks such as the US National Institute of Standards and Technology (NIST) Security Framework.8
57 [ Exhibit 50 ] Group A scatterplots – “Tracked Records on Cyber Threats” risk score versus four traditional maturity domains Group A (2) - Tracked Records on Cyber Threats Risk Score versus Four Traditional Maturity Domains Identification Technologies Risk Score 10200 Maximum Maturity Score Baseline + Intermediate Baseline Low RiskMediumAverageRisk Average High Risk Average 10 15 Protection Technologies Risk Score 100806040 10 15 Detection Technologies Risk Score 204060 10 15 RecoveryandResponse Technologies Risk Score 204060 10 15 By examining Exhibits 49 and 50, we see that the overall trend persists, where high-risk AIs often perform better in the various maturity domains. Interestingly, we also observe that, on average high-risk AIs are more mature compared to medium-risk AIs under the four traditional maturity control domains, despite having better track records in terms of their cybersecurity threats. The above finding reinforces that AIs facing low risk in certain areas are not excused from implementing the appropriate measures and likely indicate that AIs could see lower cyber threats levels as they implement tougher security measurements.
Next, we take an organization and governance perspective by plotting the AIs’ “Product and Technology Services Risk” and “Organizational Characteristics” against their maturity level in “Governance” and “Situation Awareness.” This grouping allows us to identify gaps between the AIs’ risk induced from organizational planning and the measures taken at an organizational management level.
58 INHERENT RISK AND MATURITY [ Exhibit 51 ] Group B scatterplots – “Products and Technology Services” and “Organizational Characteristics” versus “Governance” and “Situational Awareness” Group B (2) - Organizational Characteristics versus Governance and Situational Awareness Governance Products and Technology Services 100500 Maximum Maturity Score Baseline + Intermediate Baseline Low Risk AverageMedium RiskAverageHighAverageRisk 10 20 30 Group B (1) - Products and Technology Services versus Governance and Situational Awareness AwarenessSituational Products and Technology Services 10152050 10 20 30
10152050 10 15 30
By examining the Group B plots, we noticed while high- and medium-risk AIs have the same average score under the “Products and Technology Services” risk domain, they have adopted more controls in the “Governance” and “Situational Awareness” maturity domain, both in terms of the total number of required controls and percentage of controls. Meanwhile, results in the two bottom charts with “Organizational Characteristics” are mostly in line with our expectations. The number of controls adopted was mostly consistent within each group, with a few mediumand low-risk AIs failing to meet their targets. Nevertheless, it also allows us to identify that some medium- and low-risk AIs have adopted a high number of required controls despite a low “Organizational Characteristics” risk score. We have plotted a final set of charts on all the five domains of the AIs and “Response and Recovery” maturity domain. This grouping shows the performance of the AIs in terms of their Governance Organizational Characteristics Organizational Characteristics
100500 10 15 30 AwarenessSituational
59 risk against how well they can minimize or mitigate losses arising from potential cybersecurityrelated incidences. For riskier AIs, we wish to see a higher score in “Response and Recovery”, which signals that they could better respond to their cybersecurity flaws or vulnerabilities. Otherwise, inappropriately reacting to cybersecurity incidents could deepen losses. [ Exhibit 52 ] Group C scatterplots – All inherent risk domains versus the “Response and Recovery” maturity domain Group C - All Five Inherent Risk Domains versus Response and Recovery Maturity Domain Maximum Maturity Score Baseline + Intermediate Baseline Low Risk AverageMedium Risk AverageHighRisk AverageRecoveryandResponse Technologies 204060 10 20 30 RecoveryandResponse Products and Technology Services 204060 100 20 30 RecoveryandResponse RecoveryandResponse Delivery Channels 204060 5 10 RecoveryandResponse Organizational Characteristics 20406010 15 20 Tracked Records on Cyber Threats 204060 10 15
INHERENT RISK AND MATURITY ANALYSIS SUMMARY
INHERENT RISK AND MATURITY
The Group C plots (Exhibit 52) have revealed that high-risk AIs have met all controls on postevent risk mitigation while most other AIs have failed to do so. This is an interesting observation as high-risk AIs experience same or lower risk in “Delivery Channel”, “Products and Technology Services”, and “Tracked Records on Cyber Threats” compared to medium-risk AIs. It appears that the main motivation for such increased controls could be largely driven by their higher technology and organizational characteristics related risks.
As mentioned at the beginning of this report, the C-RAF framework is unique because it offers an assessment framework tailored to their cybersecurity risk level. In this section, we have investigated the connection and correlation between the two self-assessment exercises. One of the main findings in this section is a positive relationship between the AIs’ inherent risk score and their maturity. We also found that the underperformance of low and medium-risk AIs appears to be a group-wide phenomenon where most low- and medium-risk AIs have failed to meet the required maturity level in each of the seven maturity domains.
To better understand if the AIs have put sufficient resources into addressing various risks they faced, we then took three different perspectives in examining the AIs’ risk and maturity in more detail. The three groups of additional scatterplots are able to demonstrate the relationship in (1) The traditional cybersecurity measurement perspective, (2) An organizational planning and characteristics view, and (3) A response and recovery perspective. Essentially, under the three groupings, we found that high-risk AIs are more mature than medium-risk AIs under many of the maturity control domains, despite having better track records regarding their cybersecurity threats and having an equal or lower risk in many inherent risk domains.
60
61 C-RAF REAL-LIFEANDMEASURES
We looked at the longitudinal average adoption rate of SSL certificates for each AI over the 17 periods and have calculated the average SSL certificate adoption rate. The idea behind is that it allows us to see the full picture of the AI’s implementation instead of merely a snapshot. More specifically, if an AI adopts no SSL certificates at a given time, it will have a score of zero at that period and one otherwise. For example, an AI who started using SSL certificates to secure their websites at the final ten periods would have an adoption rate of 1017 =59%
Secure Sockets Layers (SSL) certificate is a global standard security digital certificate that enables encrypted communication between a web browser and server. Companies need SSL certificates for their websites to keep user data secure and to verify the validity on the website, preventing malicious attackers from creating a counterfeit version of the Whensite.a website is secured by an SSL certificate, HTTPs will appear in the start of the URL
As set out at the beginning of the report, one of our aims is to identify if C-RAF and hence the Maturity Assessment are able to reflect the actual cybersecurity practice of the AIs. To achieve this, we have gathered data on the SSL certification adoption data for the AIs’ official websites across 17 six-month periods, which allow us to identify the AIs’ actual level of maturity practice beyond the self-assessment exercise. Later in this section, we have also conducted analyses on the time trend and adoption rate of suboptimal SSL certifications, including the self-sign certificates and weak hashing algorithm
An AI started using SSL certificates to secure their websites in the last ten of the 17 six-month periods. Hence a percentage adoption rate of: 10/17 = 59%
SSL CERTIFICATION ADOPTION
The number of SSL certificates is less than one The number of SSL certificates is at least one 0 7 17 SSL
SSL certification adoption rate calculation
SSL CERTIFICATION ADOPTION Rate Calculation Example-
Whilecertifications.theadoption of SSL certificates is only a small part of the vast measure an AI ought to take, we believe it reflects the AI’s awareness and willingness to implement the fundamental measures in cybersecurity.
SSL CERTIFICATES
62 C-RAF AND REAL-LIFE MEASURES
[ Exhibit 54 ]
63 By applying least square regression, we found that both the overall maturity assessment score and the “Protection” maturity domain score are significantly correlated with the average adoption rate of SSL certificates over the 17 periods, despite having a modest level of explanatory power (~0.4 R2 ). To better understand the relationship between the two areas and the SSL cert adoption, we plot the data as a scatterplot. [ Exhibit 55 ] Number of SSL certification and adoption rate versus Maturity Assessment score Average Certification Adoption Rate and Maturity Assessment Score Average Certification Adoption Rate and Maturity Assessment Score CertificationofNumberAverage Maturity 100806040200 50 100 250150 300200 350 400 RateAdoptionCertificationAverage Maturity 0.00.20.40.60.81.0 50 100 250150 300200 350 400 Low HighMedium Low HighMedium
Another crucial aspect that dictates if an SSL certificate effectively provides the desired security is the type of hashing algorithm used. If an SSL certificate is signed using a weak hashing algorithm (such as MD5 and SHA1), it will likely be vulnerable to collision attacks. The attacker could then exploit this to create a certificate with the same signature and thus allowing them to disguise as the affected service.
Alternatively, an AI could issue a self-signed certificate for its sites, which provides basic security and still enables data encryption between the user and the application. However, since the users cannot authenticate these certificates by a known root CA, users are warned about the unknown certificate and must accept it to proceed.
[ Exhibit 56 ] Self-signed SSL certification warning message
In addition to the above analysis, we have also studied the use of the various types of SSL certificates of the AIs, mainly those that might prove to be vulnerable to cyberattacks due to problems such as the lack of sophisticated encryption algorithm. Although in most cases the number of SSL certificates does not reflect how secure the AI is, the number of suboptimal certification types reflects if the problem is an organization-wide problem or specific to a part of the organization.
In the ideal scenario, an SSL certificate should be verified by a trusted third party, known as a Certificate Authority (CA), trusted by the users’ browsers, providing an extra layer of security.
By examining the scatterplots, we can better understand how the maturity score correlated with the adoption of SSL certificates of each AI. While the number of certificates has little to no correlation with the AI’s maturity score, the average adoption rate over the 17 periods shows a positive relationship with the maturity score. This can be explained by the nature of SSL certificates, where a company could opt to use one SSL certificate to cover all its website subdomains instead of using one certificate for each sub-domain. It is also reassuring to see that, as shown in Exhibit 55, several low- and medium-risk AIs had a full SSL certification adoption rate over the period, which is essential to safeguard consumer data and the security of the AI’s official site.
SUBOPTIMAL CERTIFICATION ADOPTION
64 C-RAF AND REAL-LIFE MEASURES
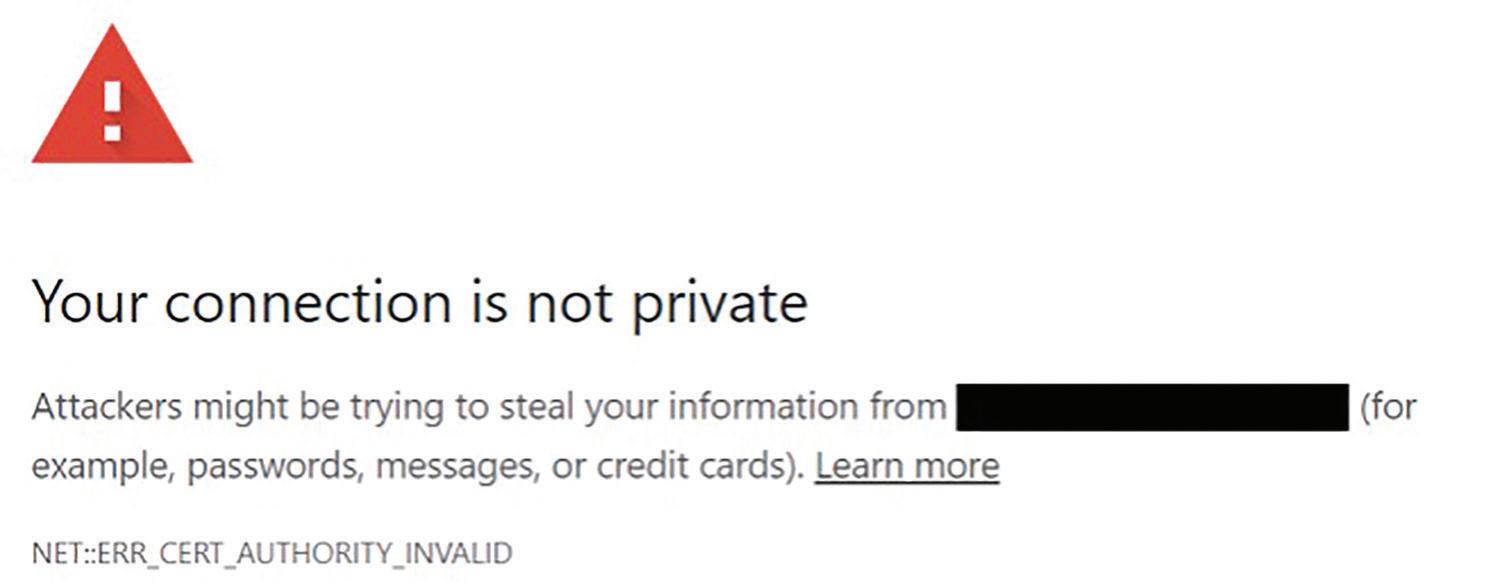
65 [ Exhibit 57 ] Percentage suboptimal SSL certifications versus maturity assessment scores Self-signed Certificates and Maturity Assessment Score Weak Hashing Algorithm Certificates and Maturity Assessment Score Self-signedofPercentage Certificates Maturity 0.000.050.100.150.20 100 250150 300200 350 400 HashingWeakofPercentage CertificatesAlgorithm Maturity 0.00.10.20.30.4 100 250150 300200 350 400 Low HighMedium Low HighMedium As the charts in Exhibit 57 indicate, while a few low-risk AIs have a relatively high adoption rate of weak certifications, the relationship is unclear. By conducting a regression, we found that neither the inherent risk of AI nor the maturity scores have significant statistical power in explaining the use of such certifications. Upon closer examination of the detailed Maturity Assessment response, we have found that while many have stated the use of SSL certifications, For the purpose of our analysis, we have obtained the number of self-signed and weak hashing algorithm SSL certificates of the 20 AIs which adopted any SSL certificate during the investigation period. If AIs with higher maturity does take more adequate measures to ensure cybersecurity, we should see the percentage of suboptimal SSL certification used decrease with a higher maturity score.
66 C-RAF AND REAL-LIFE MEASURES Full attainment (100%) High attainment (90%+) Yes No Yes No Number of AIs 4 18 12 10 Certification Adoption Rate* 0.79 0.67 0.72 0.66 Adoption Rate of Self-signed Certificates** 0.00 0.11 0.08 0.11 Adoption Rate of Weak Hashing Certificates**Algorithm 0.29 0.31 0.30 0.31 Number of Certificates**Self-signed 0.00 0.17 0.11 0.16 Number of Weak Hashing Algorithm Certificates** 0.93 1.60 2.08 0.76 Average over the 17 six-month periods * Higher the better; ** Lower the better [ Exhibit 58 ] Certification adoption in full attainment AIs and AIs with high attainment rate (90%+) there was no mention of the type of hashing algorithm used or whether a CA signed the certifications. This has shown that while the Maturity Assessment is able to reflect holistically if the AIs have implemented the appropriate measures, the quality and to what extent it is implemented remain unclear. Nevertheless, we believe the level of details set out in the survey is adequate and is filled with insightful information about the AIs’ cybersecurity measures. Maturity Level Attainment vs Security Certification Adoption To better understand whether AIs with higher cybersecurity maturity controls performs better, we checked the certification adoption status for AIs with a full attainment rate in their required controls and compared the result against those who have failed to meet their requirements. Here we report on the average adoption rate of these AIs and check for the average number of suboptimal certificates and the adoption rate of such certificates. Again, the attainment percentage is calculated concerning maturity controls that the AIs are subjected to, based on their inherent risk level. Exhibit 58 shows that AIs with full attainment have a higher average adoption rate of certificates over the 17 six-month periods than other AIs. In addition, they have not adopted any self-signed certifications. These AIs have also adopted less weak hashing algorithm certificates compared to their peers. These findings are similar for the high attainment grouping, though to a small extent, where the group of AIs with higher maturity control attainment often performs better. This has demonstrated the groupings and classification of the maturity assessment is able to explain to some extent the real-life implementation of cybersecurity measures of the AIs and shows AIs with higher attainment percentage have indeed handled their cybersecurity more appropriately.
67 [ Exhibit 59b ] Change in SSL certification adoption rate overall time – AIs with full attainment [ Exhibit 59a ] Change in SSL certification adoption rate overall time – All AIs TIME-SERIES ANALYSIS Apart from allowing the AIs to identify their inherent risk and gaps in their cybersecurity measures, the implementation of C-RAF could also help raise the AIs’ awareness in cybersecurity. Therefore, we analysed if their adoption of SSL certifications changed after participating in the selfassessment exercise. Exhibit 59 shows the plotted average adoption rate of certification, selfsigned certificate, and weak hashing algorithm certificates based on the AIs’ responses. The postC-RAF period was defined from the first half of 2017 to the first half of 2020. SSL Certification Adoption Rate Change Over Time - All AIs SSL Certification Adoption Rate Change Over Time - AIs With Full Attainment After C-RAF Certification Self-signed Weak Hashing Algoritnm After C-RAF Certification Self-Signed Weak Hashing Algoritnm 0.00.20.40.60.81.0 H1 H2 2012 H1 H2 2016 H1 2014H2 H1 2018H2H1 2013H2 H1 2017H2H1 2015H2 H1 2019H2 2020H1 0.00.10.20.30.40.50.60.70.80.91.0 H1 H2 2012 H1 H2 2016 H1 2014H2 H1 2018H2H1 2013H2 H1 2017H2H1 2015H2 H1 2019H2 2020H1
68 C-RAF AND REAL-LIFE MEASURES [ Exhibit 59c ] Change in SSL certification adoption rate overall time – AIs without full attainment
From our time-series analysis (Exhibit 59a), we see a weak yet increasing trend for the use of certifications and self-signed certifications while finding a strong decreasing trend in using weak hashing algorithms in their SSL certifications. This suggests that the AIs have improved the security of their websites by increasing the use of certifications, eliminating the use of weak hashing algorithms in their certifications, but have adopted slightly more self-signed certificates as a result of the higher overall adoption rate.
SSL Certification Adoption Rate Change Over
Key findings:
Most of the increased adoption of certificates (and self-signed certificates) come from the AIs who have failed to attain the required maturity controls. In comparison, the improvement in the elimination of weak hashing algorithm certificates is from both groups of the AIs (with or without full attainment).
1. Strong Trend Only for The Decrease of Weak Hashing Algorithm
The AIs’ adoption of SSL certifications has not experienced a sharp change after the C-RAF survey. However, the AIs have seen a steady improvement in their certification implementation, signalling that the AIs are aware of the importance of certifications and have adopted suitable measures. This should be encouraging for the regulator since the inherent risk analysis and the maturity analysis have helped AIs identify the areas to improve. The lack of significant change could be caused by a time lag in the impact or reflected in measures higher up in the organizational perspective, which is not reflected here. Better gauges to understand if C-RAF is Time - AIs Without Full Attainment
After C-RAF Certification Self-signed Weak Hashing Algoritnm 0.00.10.20.30.40.50.60.70.80.91.0 H1 H2 2012 H1 H2 2016 H1 2014H2 H1 2018H2H1 2013H2 H1 2017H2H1 2015H2 H1 2019H2 2020H1
3. No Sudden Changes After C-RAF
2. Increased Adoption of Certifications and Self-signed Certificates from AIs Without Full Attainment
Self-assessment is commonly adopted in cybersecurity risk management. The C-RAF is a thoughtful self-assessment framework that combines risk with control measure assessments to help AIs in the financial industry evaluate their risks and address the gaps in protection. This research synthesizes the survey findings from 22 AIs to provide a holistic view of the cybersecurity status of the Hong Kong financial industry. It provides an informative benchmark for AIs and organizations in other industries about the state of cybersecurity, and raises public awareness about the importance of addressing cybersecurity gaps.
C-RAF AND REAL-LIFE MEASURES: SUMMARY
69 effective in improving the AI’s cybersecurity measures would be to (1) identify how much of the improvement the AI claimed to make in security has been implemented, or (2) to compare the cybersecurity incidents before and after participating in the C-RAF exercise.
CONCLUSION
To verify if the Maturity Assessment reflects the AI’s actual maturity practice, we have conducted some studies on the relationship between the maturity assessment results and the AI’s SSL certification implementation status. While the use of SSL certifications is a small part of the cybersecurity measures the AIs ought to take, we found that the Maturity Assessment risk scores and the “Protection” domain show a mild but statistically significant positive relationship with the SSL certificates adoption rate. Lastly, when we checked if the maturity results are related to the use of suboptimal SSL certification, we found that the Maturity Assessment results are not able to reflect them properly. However, we believe the Maturity Assessment survey has acted well as a checklist and tool to help AIs identify their security measure gap. Lastly, we have conducted a time-series analysis on the AI’s change in the adoption of SSL certificates. We hypothesize that the C-RAF exercise is able to impact the AIs in adopting more cybersecurity measures positively. While we did not find evidence supporting our hypothesize, we found that the AIs have progressively improved their adoption rate before the implementation of C-RAF, which might have limited the impact the C-RAF could bring. Indeed, the impact of the C-RAF exercise could have been more towards the bigger picture and have driven the AI to implement more rigorous and robust policies and measures. A better gauge to measure its impact would be to examine the additional measures the AIs take or the change in their cybersecurity incidents after their participation.
APPENDIX 70 APPENDIX 1 INHERENT RISK SUB-DOMAIN MAPPING Technologies risk indicators Network Risks Third-party risks Internal risks ISP connections Non-corporate devices (2) Internally hosted and in-house developed applications Unsecured connectionsexternal Third-party access to internal systems (2) Internally hosted vendordeveloped applications Wireless network access Wholesale devices User developed technologies Network devices (e.g., routers, and firewalls) Individuals and/or third-party service providers supporting critical activities End-of-life systems Cloud computing services hosted externally to support critical activities (2) Open-source software Delivery Channels risk indicators Internet presence Mobile presence Social media presence ATM Internet presence Mobile presence Social media presence ATM Products and Technology Services risk indicators Payment card risks Fund transfer risks Client services Issue debit or credit cards P2P Treasury services and clients (2) Prepaid cards Wire transfers (2) Trust services Merchant acquirer (2) Global remittance Securities trading Act as a correspondent bank
71 Organizational Characteristics risk indicators Size risks Service risks Cybersecurity staffing risks Number of branches Host IT services for other organizations Changes in IT and cybersecurity staffing Revenue Direct employees Number of cybersecurity staff supporting HK business Asset value Privileged access (2) Tracked Records on Cyber Threat risk indicators Frequency Variety Number of attempted cyber attacks Phishing Number of successful attacks DoS Number of breaches Social Malwareengineering
APPENDIX 72 2 HIERARCHICAL CLUSTERING HEATMAP ILLUSTRATION OnTrackedCharacteristicsOrganizationalTechnologyProductsDeliveryTechnologiesChannelsandServicesRecordsCyberThreats
73 3 FACTOR ANALYSIS LOADING SCORE TABLE Factor 1 Factor 2 Factor 3 Factor 4 Network Risks 0.51 0.49 -0.03 0.11 Third-party risks 0.13 0.09 0.17 0.15 Internal risks 0.55 0.13 0.23 0.51 Internet presence 0.21 0.72 -0.03 0.26 Mobile presence 0.69 0.41 0.25 0.25 Social media presence 0.18 0.23 0.60 0.15 ATM 0.69 0.43 0.23 -0.09 Payment card risks 0.94 0.24 -0.09 0.10 Fund transfer risks 0.69 0.81 0.06 -0.05 Client services 0.23 0.55 0.25 0.29 Size risks 0.59 0.56 0.02 -0.13 Service risks 0.32 0.52 0.10 0.12 staffingCybersecurityrisks -0.09 0.11 -0.74 0.19 Frequency -0.01 0.10 0.83 0.27 Variety 0.02 0.13 0.09 0.95
APPENDIX 74
HTTPS://WWW.BM.UST.HK