2022 Boulder Single Family Housing Stats


Change in Single-Family Avg $ from 2nd Qtr YTD and 4th Qtr YTD Numbers 2016 2017 2018 2019 2020 2021 2022 Boulder 0.4% -2.1% -3.5% 1.3% 5.7% -1.0% -2.1% Louisville -0.6% -2.0% -0.2% -4.9% 0.4% 1.2% -5.4% Lafayette -0.5% -2.4% -0.3% 4.7% 6.3% 0.7% -4.4% Longmont 2.2% -0.9% 1.7% 1.2% 3.6% 3.2% -3.0% Plains 0.1% 0.1% -1.0% 0.0% 7.9% -0.8% -6.8% Mountains 0.5% -8.9% 2.8% 2.9% 5.2% -1.5% -10.0% Superior -2.9% -1.8% 1.0% 3.4% 7.3% 5.9% -4.2% Boulder County -1.1% -2.0% -2.8% 0.5% 7.5% -0.9% -4.4% Broomfield 0.1% -2.0% -4.4% -0.1% 0.7% -1.6% -5.9% Erie 3.9% 1.6% 0.4% 1.6% 4.1% -2.3% -5.4%


Single Family

Boulder County Boulder County
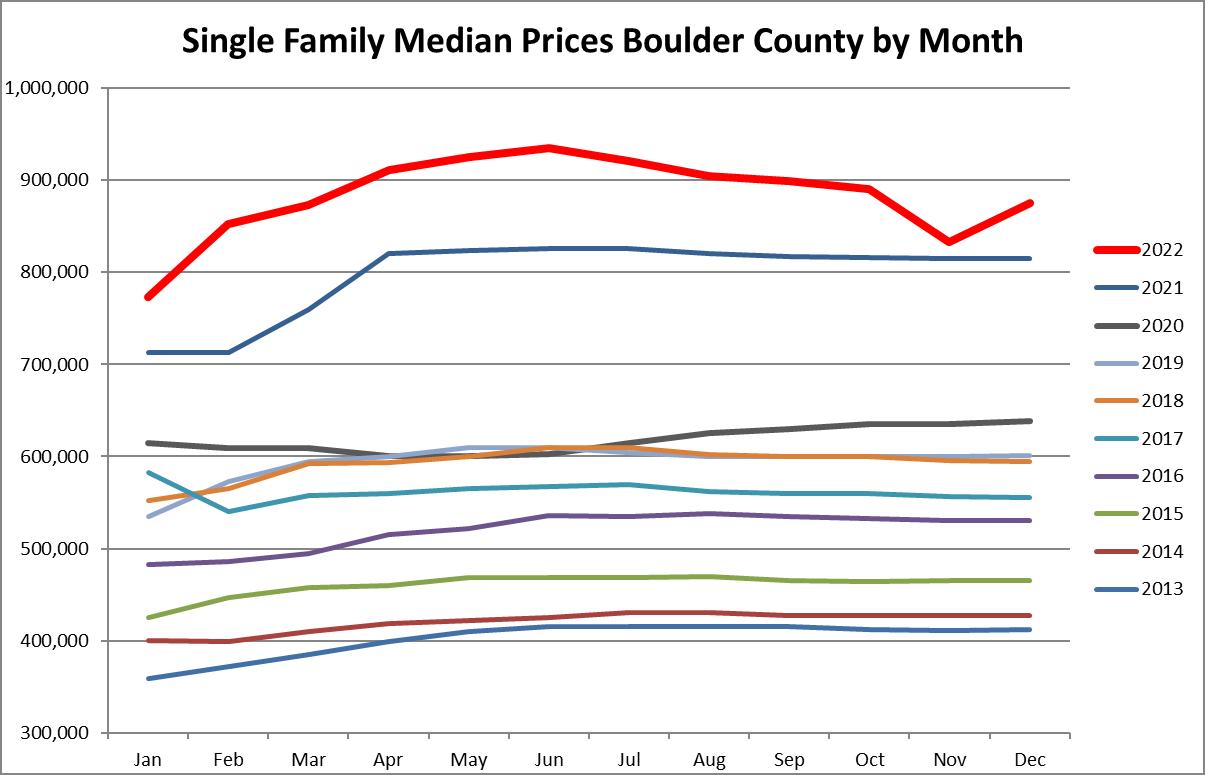
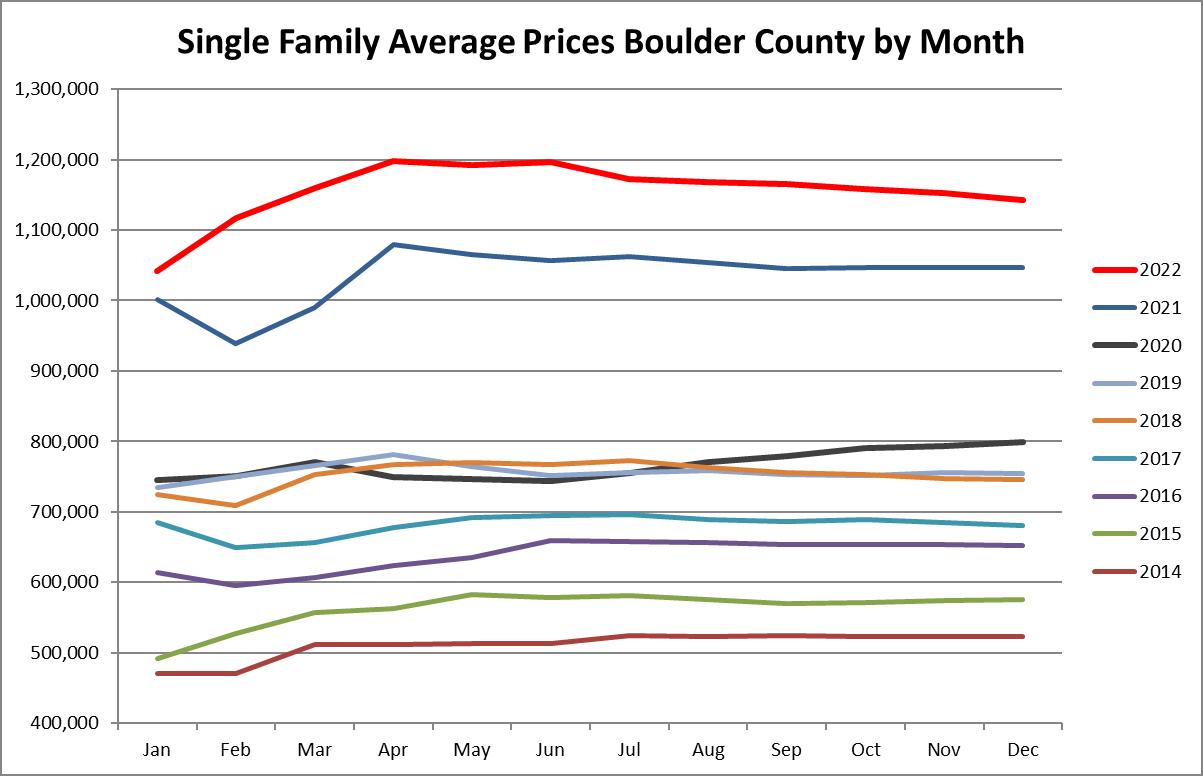
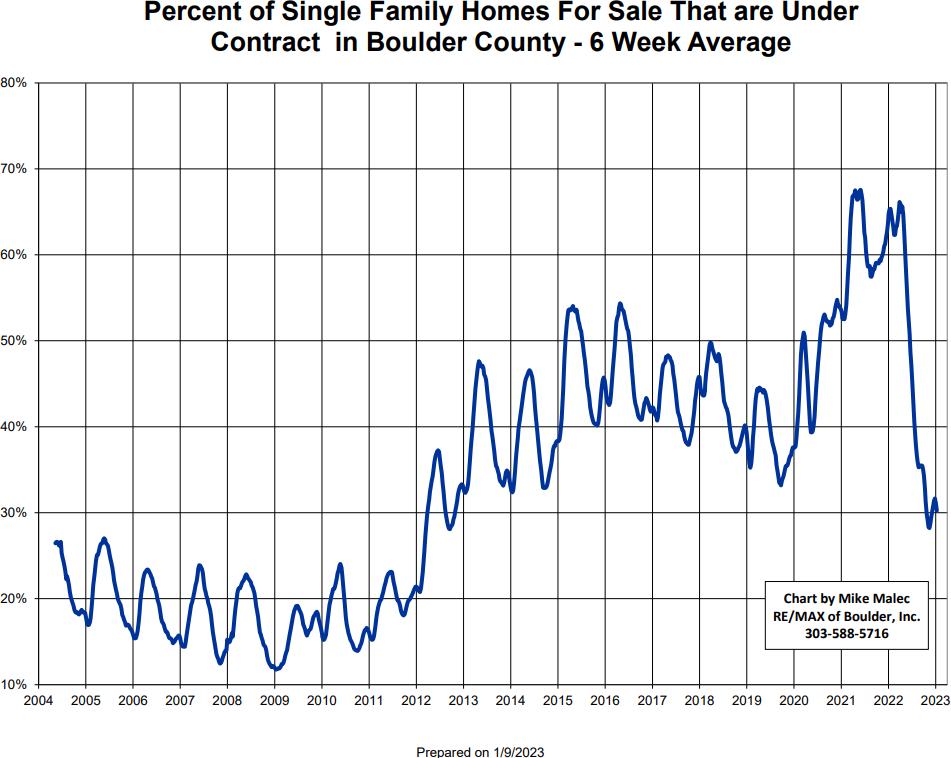
Year 2022 % Change Year 2021 2 yr. Change Year 2020 Total Active Listings 281 106.6% 136 -10.2% 313 Median Sales Price $875,000 7.4% $815,000 37.0% $638,500 Average Sales Price $1,143,282 9.2% $1,046,626 42.9% $799,844 SP/LP Ratio 101.3% -0.4% 101.7% 2.6% 98.7% Average Market Time 43 -2.3% 44 -24.6% 57 Number of Sales YTD 2374 -27.0% 3252 -35.0% 3651 Expired Listings 665 34.9% 493 -30.4% 956 Months of Inventory 1.4 180.0% 0.5 40.0% 1 % Under Contract 32% -53.6% 69% -42.9% 56% 30 Year Mortgage 6.42% 107.1% 3.10% 139.6% 2.68% From IRES MLS 1/5/2023
Single Family

Year 2022 % Change Year 2021 2 yr. Change Year 2020 Total Active Listings 102 82.1% 56 -16.4% 122 Median Sales Price $1,454,250 7.7% $1,350,070 45.4% $1,000,000 Average Sales Price $1,746,046 7.8% $1,619,794 35.2% $1,291,130 SP/LP Ratio 100.9% 0.4% 100.5% 2.7% 98.2% Average Market Time 44 -8.3% 48 -25.4% 59 Number of Sales YTD 537 -28.4% 750 -25.1% 717 Expired Listings 167 -5.1% 176 -48.0% 321 Months of Inventory 2.3 155.6% 0.9 15.0% 2 % Under Contract 31% -38.0% 50% -20.5% 39% 30 Year Mortgage 6.42% 107.1% 3.10% 139.6% 2.68% From IRES MLS 1/5/2023 Boulder County City of Boulder
Single Family

Year 2022 % Change Year 2021 2 yr. Change Year 2020 Total Active Listings 16 45.5% 11 -20.0% 20 Median Sales Price $958,000 11.4% $860,000 34.9% $710,000 Average Sales Price $1,069,437 13.0% $946,393 39.2% $768,251 SP/LP Ratio 103.6% -0.4% 104.0% 3.5% 100.1% Average Market Time 36 20.0% 30 -20.0% 45 Number of Sales YTD 148 -16.4% 177 -29.9% 211 Expired Listings 44 238.5% 13 7.3% 41 Months of Inventory 1.3 62.5% 0.8 18.2% 1.1 % Under Contract 13% -85.7% 91% -84.7% 85% 30 Year Mortgage 6.42% 107.1% 3.10% 139.6% 2.68% From IRES MLS 1/5/2023
Louisville
Boulder County City of
Single Family

Year 2022 % Change Year 2021 2 yr. Change Year 2020 Total Active Listings 29 38.1% 21 -44.2% 52 Median Sales Price $924,857 23.3% $750,000 56.8% $590,000 Average Sales Price $999,979 24.1% $805,493 52.9% $653,892 SP/LP Ratio 102.7% -1.3% 104.1% 2.7% 100.0% Average Market Time 45 7.1% 42 0.0% 45 Number of Sales YTD 194 -23.0% 252 -39.8% 322 Expired Listings 58 141.7% 24 13.7% 51 Months of Inventory 1.8 80.0% 1 -5.3% 1.9 % Under Contract 59% -11.9% 67% -1.7% 60% 30 Year Mortgage 6.42% 107.1% 3.10% 139.6% 2.68% From IRES MLS 1/5/2023
County City of Lafayette
Boulder
Single Family

Year 2022 % Change Year 2021 2 yr. Change Year 2020 Total Active Listings 111 37.0% 81 -11.9% 126 Median Sales Price $614,900 14.2% $538,500 32.8% $463,000 Average Sales Price $661,031 11.6% $592,117 30.0% $508,361 SP/LP Ratio 103.1% -0.5% 103.6% 3.4% 99.7% Average Market Time 34 3.0% 33 -39.3% 56 Number of Sales YTD 737 -30.1% 1054 -42.4% 1279 Expired Listings 122 56.4% 78 -38.4% 198 Months of Inventory 1.8 100.0% 0.9 50.0% 1.2 % Under Contract 33% -62.5% 88% -56.0% 75% 30 Year Mortgage 6.42% 107.1% 3.10% 139.6% 2.68% From IRES MLS 1/5/2023 Boulder County City of Longmont
Single Family

Year 2022 % Change Year 2021 2 yr. Change Year 2020 Total Active Listings 78 36.8% 57 -24.3% 103 Median Sales Price $952,450 4.2% $914,140 30.5% $729,950 Average Sales Price $1,297,449 3.6% $1,252,477 40.2% $925,626 SP/LP Ratio 99.9% -1.3% 101.2% 2.1% 97.8% Average Market Time 47 -11.3% 53 -28.8% 66 Number of Sales YTD 428 -23.0% 556 -35.5% 664 Expired Listings 121 16.3% 104 -37.6% 194 Months of Inventory 2.2 83.3% 1.2 15.8% 1.9 % Under Contract 23% -64.6% 65% -60.3% 58% 30 Year Mortgage 6.42% 107.1% 3.10% 139.6% 2.68% From IRES MLS 1/5/2023 Boulder County Suburban Plains
Single Family

Year 2022 % Change Year 2021 2 yr. Change Year 2020 Total Active Listings 38 52.0% 25 -15.6% 45 Median Sales Price $925,000 4.7% $883,750 39.9% $661,000 Average Sales Price $1,220,386 11.8% $1,091,683 47.2% $828,933 SP/LP Ratio 99.6% -0.4% 100.0% 2.0% 97.6% Average Market Time 60 -9.1% 66 -15.5% 71 Number of Sales YTD 242 -34.9% 372 -18.0% 295 Expired Listings 117 39.3% 84 -12.7% 134 Months of Inventory 1.9 137.5% 0.8 5.6% 1.8 % Under Contract 34% -39.3% 56% 25.9% 27% 30 Year Mortgage 6.42% 107.1% 3.10% 139.6% 2.68% From IRES MLS 1/5/2023 Boulder County Suburban Mountains
Single Family

Year 2022 % Change Year 2021 2 yr. Change Year 2020 Total Active Listings 14 7.7% 13 40.0% 10 Median Sales Price $973,000 -0.4% $976,700 44.1% $675,000 Average Sales Price $991,280 -3.0% $1,021,782 38.6% $714,998 SP/LP Ratio 103.8% -3.4% 107.5% 3.2% 100.6% Average Market Time 45 15.4% 39 15.4% 39 Number of Sales YTD 81 -4.7% 85 -35.7% 126 Expired Listings 32 220.0% 10 166.7% 12 Months of Inventory 2.1 16.7% 1.8 110.0% 1 % Under Contract 50% -7.4% 54% 0.0% 50% 30 Year Mortgage 6.42% 107.1% 3.10% 139.6% 2.68% From IRES MLS 1/5/2023 Boulder County Town of Superior
Family

Boulder County City
Year 2022 % Change Year 2021 2 yr. Change Year 2020 Total Active Listings 158 953.3% 15 485.2% 27 Median Sales Price $685,000 5.0% $652,500 20.2% $570,000 Average Sales Price $761,027 5.2% $723,422 19.9% $634,888 SP/LP Ratio 102.0% -1.3% 103.3% 2.3% 99.7% Average Market Time 33 3.1% 32 -25.0% 44 Number of Sales YTD 803 185.8% 281 81.3% 443 Expired Listings 146 356.3% 32 102.8% 72 Months of Inventory 2.36 293.3% 0.6 237.1% 0.7 % Under Contract 42% -58.0% 100% 13.5% 37% 30 Year Mortgage 6.42% 107.1% 3.10% 139.6% 2.68% From IRES MLS 1/5/2023
of Broomfield Single
Single Family

Year 2022 % Change Year 2021 2 yr. Change Year 2020 Total Active Listings 112 300.0% 28 387.0% 23 Median Sales Price $773,574 12.5% $687,500 35.7% $570,000 Average Sales Price $833,155 13.2% $735,789 38.5% $601,581 SP/LP Ratio 101.3% -1.9% 103.3% 2.1% 99.2% Average Market Time 26 -18.8% 32 -55.9% 59 Number of Sales YTD 624 95.0% 320 18.2% 528 Expired Listings 85 174.2% 31 -7.6% 92 Months of Inventory 2.2 100.0% 1.1 340.0% 0.5 % Under Contract 52% -36.6% 82% 0.0% 52% 30 Year Mortgage 6.42% 107.1% 3.10% 139.6% 2.68% From IRES MLS 1/5/2023 Boulder County Town of Erie