Boulder County Real Estate Report
1st Quarter 2023
FHFA HPI by Metropolitan Area Since 1991Q2
Percent Change in House Prices
Metropolitan Area Rank 1-Quarter 1-Year 5-Years Since 1991Q1 Missoula, MT 15 3.44 19.54 88.12 665.44 Austin-Round Rock-Georgetown, TX 222 -5.35 7.56 75.92 618.91 Salt Lake City, UT 197 -2.92 8.7 74.37 596.7 Boulder, CO 150 -1.96 10.66 47.8 588.29 Bend, OR 221 -2.56 7.57 72.76 586.46 Coeur d'Alene, ID 175 -1.15 9.84 104.63 574.29 Albany-Lebanon, OR 196 -1.08 8.72 68.21 549.86 Denver-Aurora-Lakewood, CO 216 -2.41 7.96 52.15 548.72 Miami-Miami Beach-Kendall, FL 4 2.23 21.62 75.85 539.14 Provo-Orem, UT 206 -3.27 8.39 75.92 514.28 Fort Collins, CO 141 -2.34 10.88 51.04 508.13 Logan, UT-ID 70 -1.12 13.9 91.71 503.24 Boise City, ID 256 -6.44 1.06 96.45 501.63 Portland-Vancouver-Hillsboro, OR-WA 247 -2.87 4.63 43.13 493.76 Ogden-Clearfield, UT 214 -3.29 8.01 79.91 489.15 Wenatchee, WA 180 -0.35 9.66 64.42 472.57 Flagstaff, AZ 115 -0.6 11.73 72.27 465.38 Greeley, CO 207 -3.14 8.35 53.74 462.73
Purchase-Only FHFA HPI (Seasonally Adjusted, Nominal) Period ended 2022 Q4
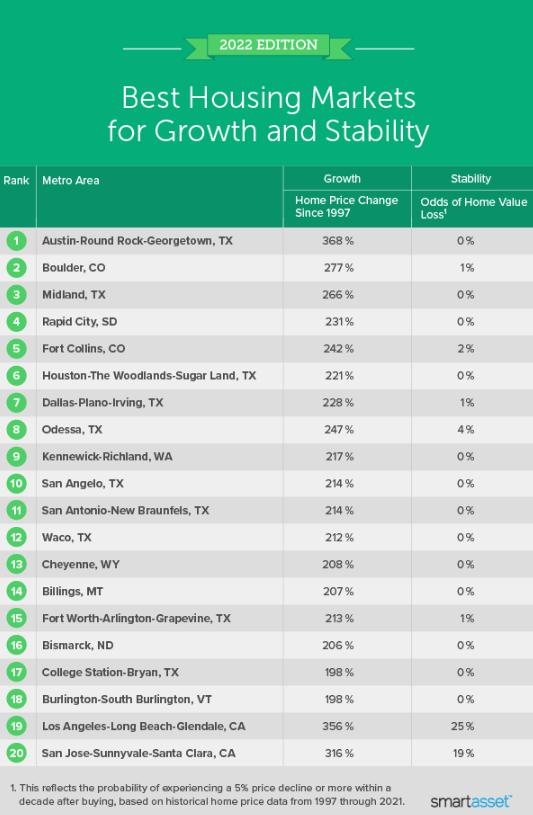
2. Boulder, CO
According to data from the Federal Housing Administration (FHA), the home price index in Boulder, Colorado rose by more than 277% from 1997 through 2021. Additionally, home prices in Boulder have been relatively stable during that 25-year period, with a 1% chance of a 5% or more drop in home price within a decade of buying.
Local Statistics
By Area

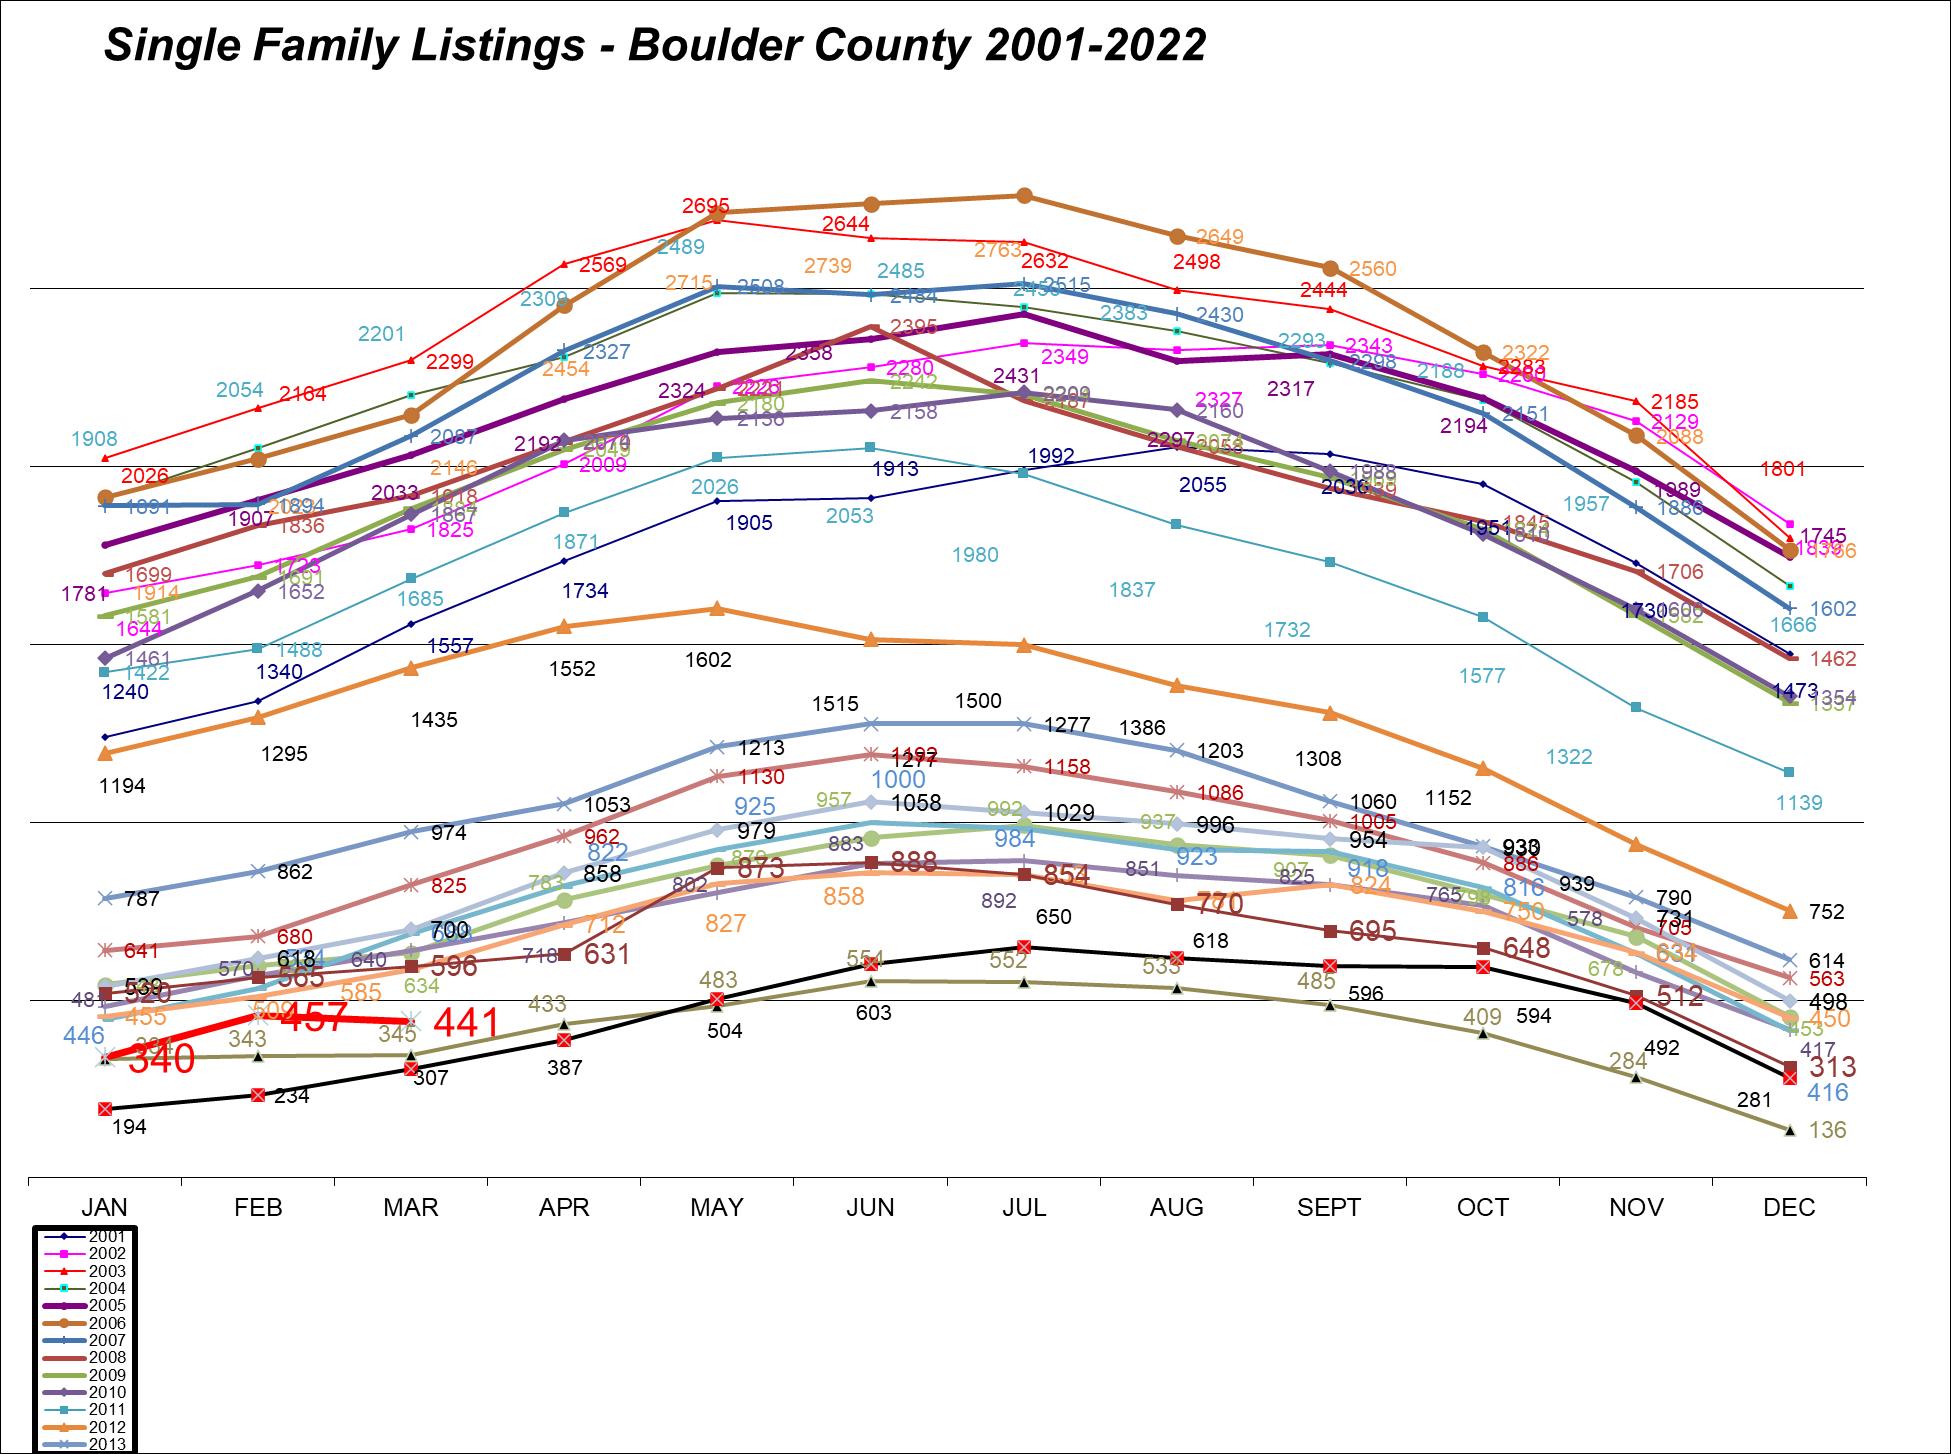
Single-Family
Single Family Q1
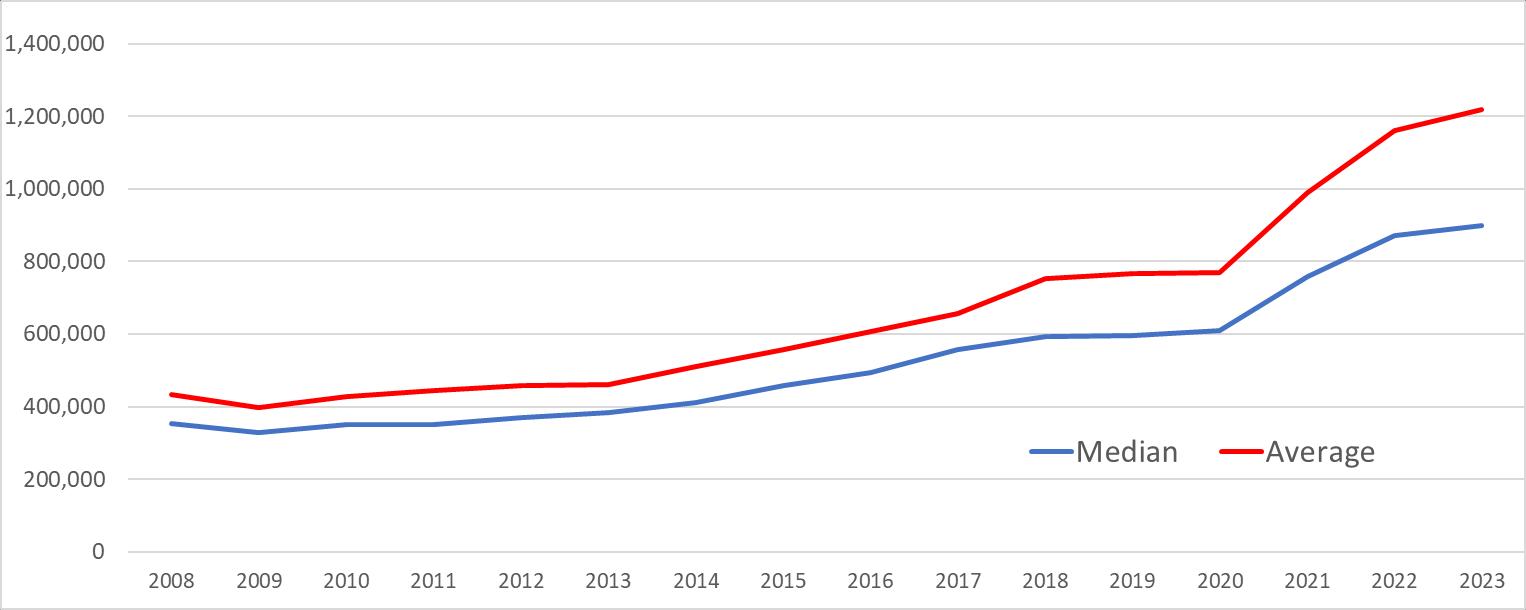
Boulder County
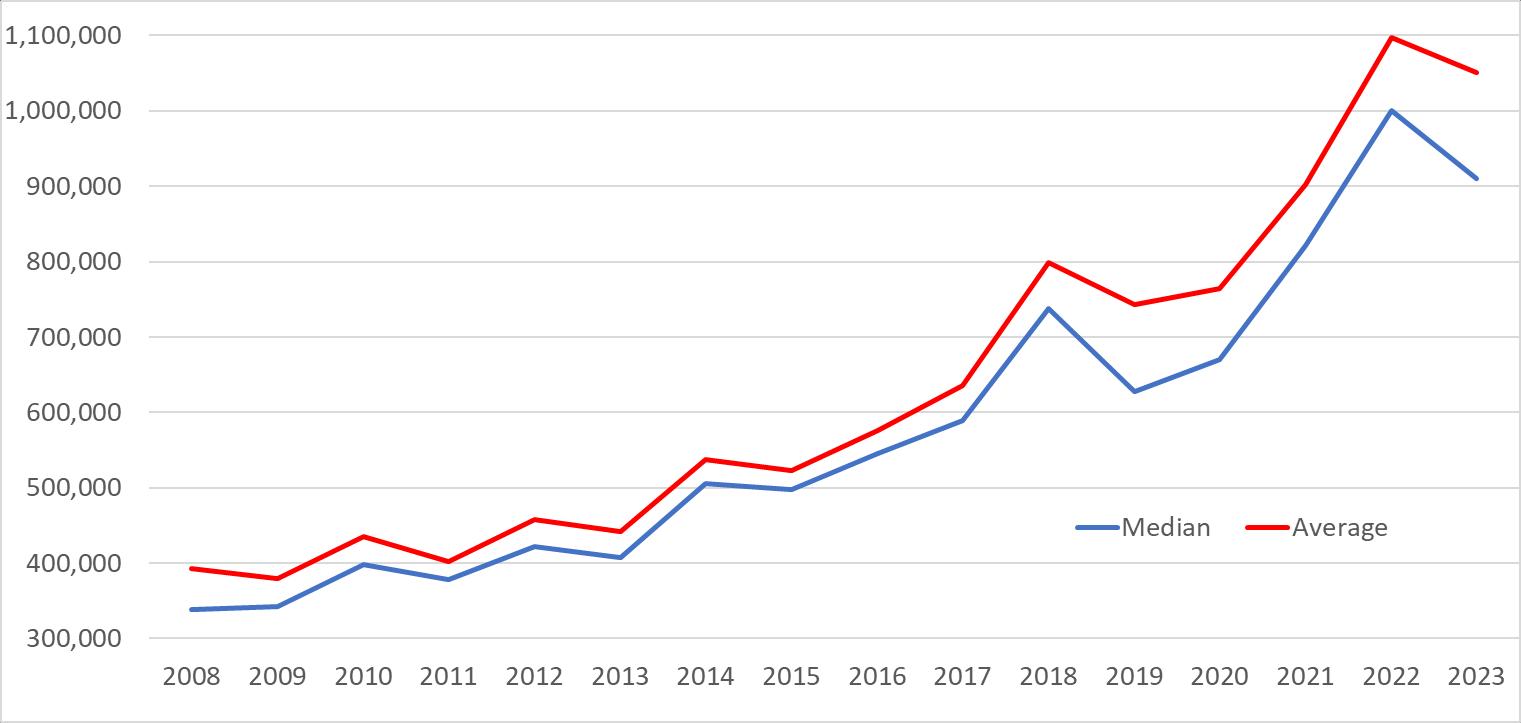
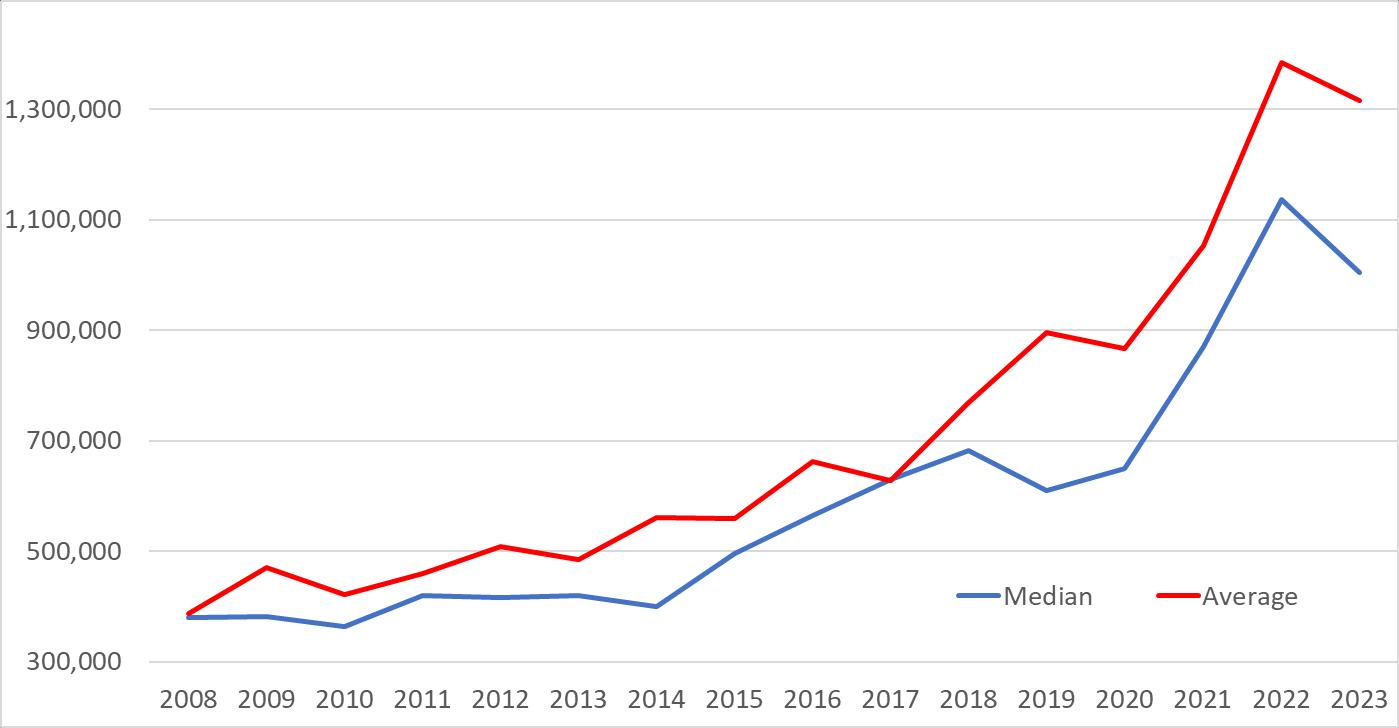
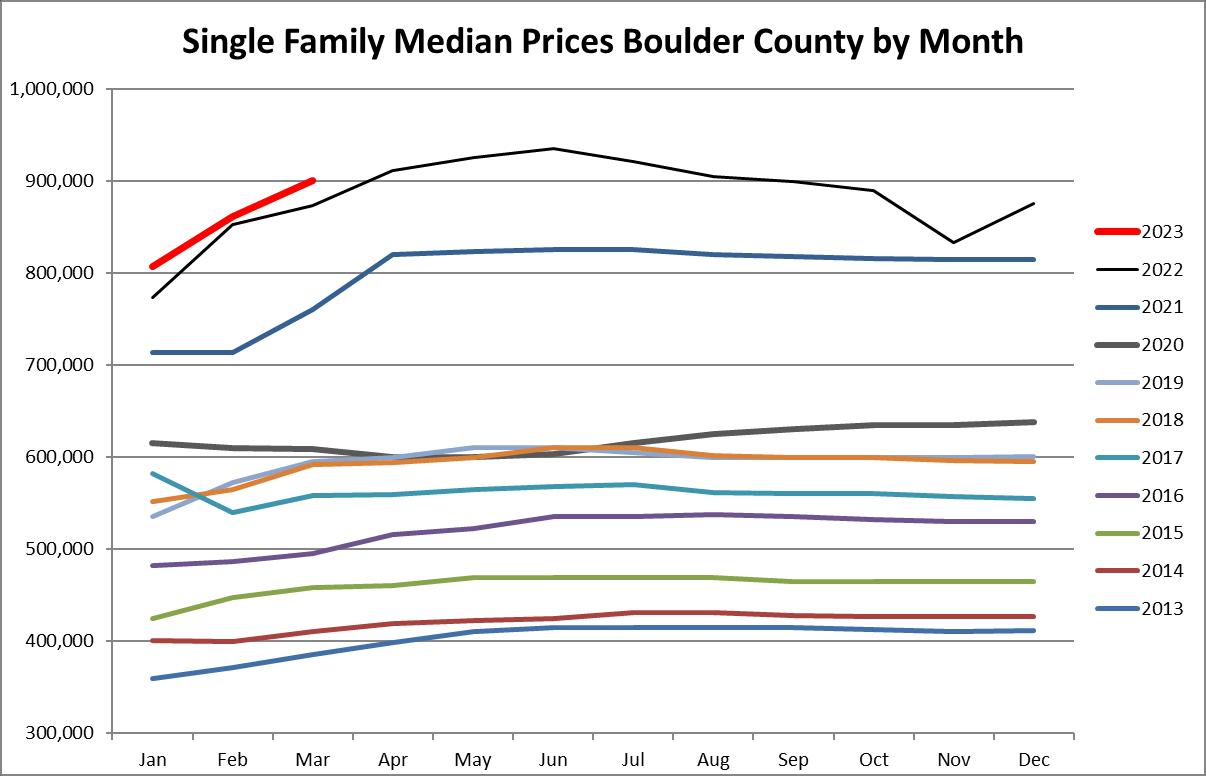
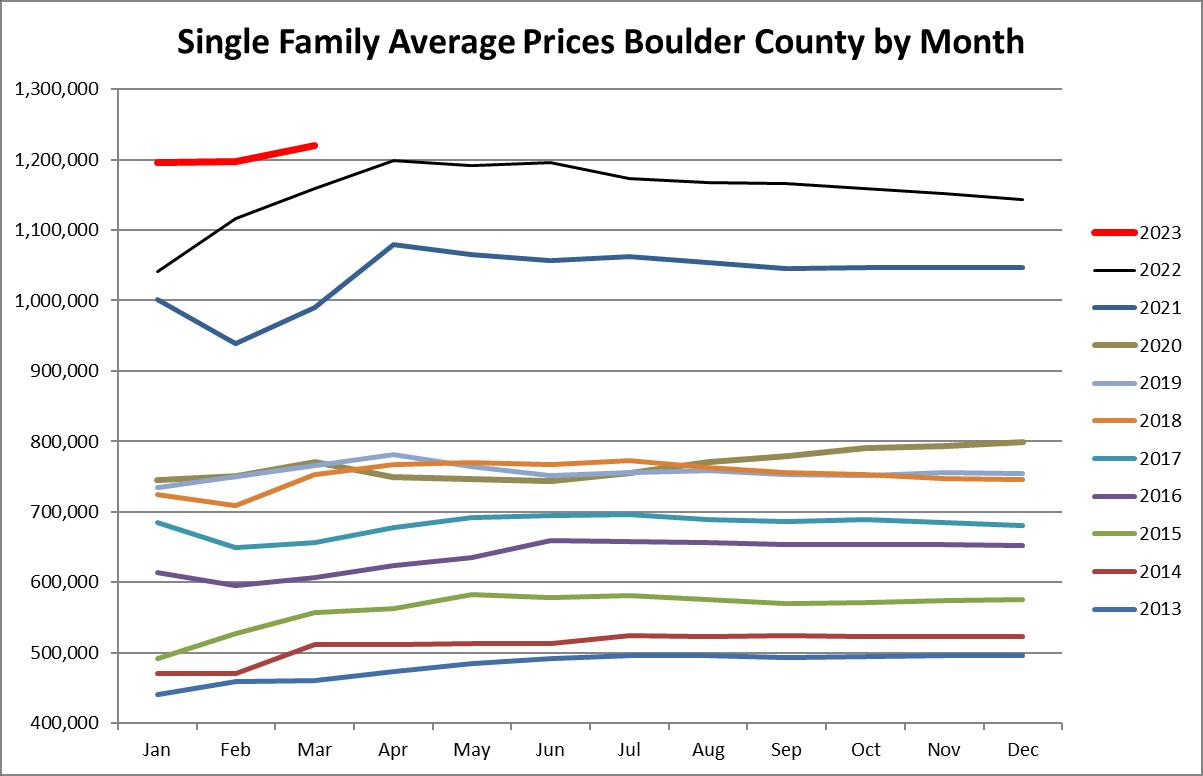
Boulder County Year 2023 % Change Year 2022 2 yr. Change Year 2021 Total Active Listings 441 43.6% 307 27.8% 345 Median Sales Price $900,000 3.1% $872,750 18.4% $760,000 Average Sales Price $1,219,687 5.2% $1,159,510 23.2% $989,990 SP/LP Ratio 98.0% -5.6% 103.9% -2.4% 100.5% Average Market Time 72 84.6% 39 30.9% 55 Number of Sales YTD 351 -24.7% 466 -38.1% 567 Expired Listings 123 108.5% 59 11.8% 110 Months of Inventory 3.8 100.0% 1.9 111.1% 1.8 % Under Contract 40% -44.4% 72% -43.7% 71% 30 Year Mortgage 6.32% 51.6% 4.17% 105.2% 3.08% From IRES MLS 4/5/2023
Single Family Q1
Boulder County
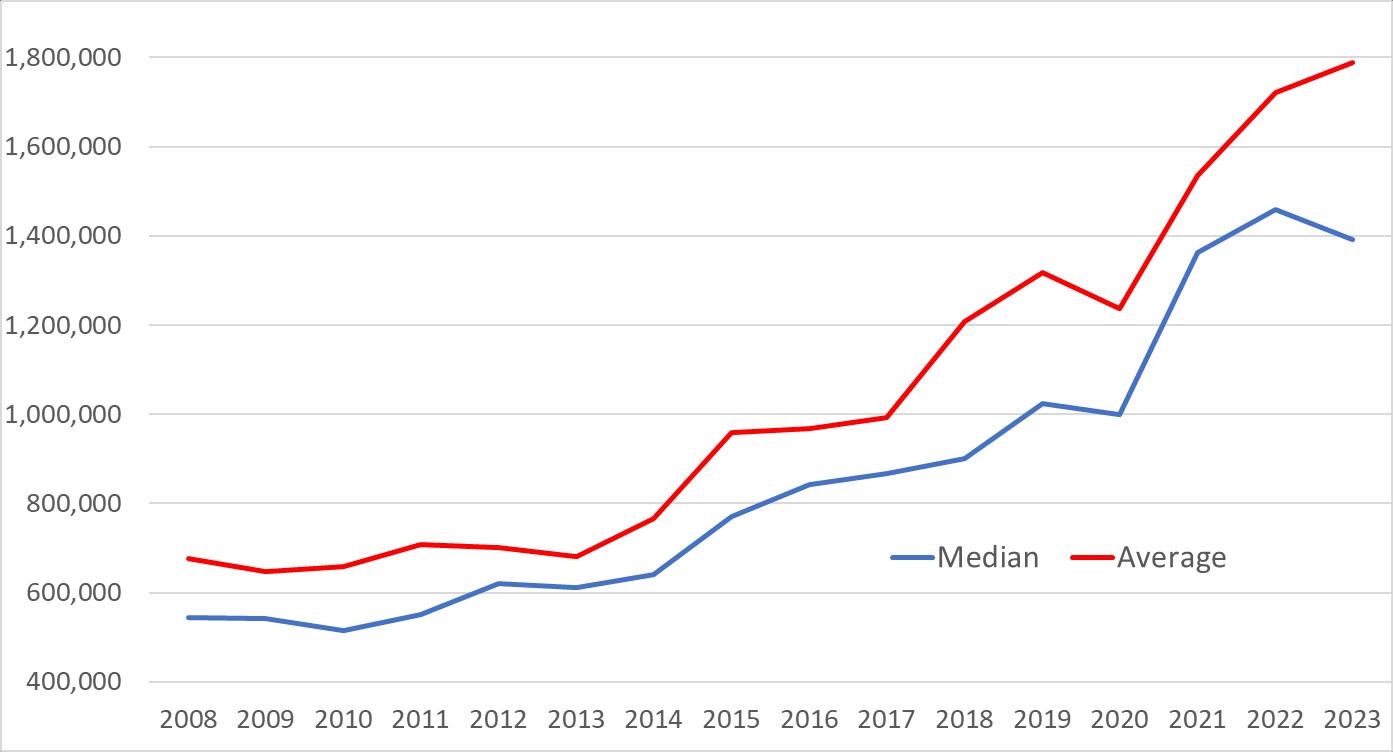
City
Boulder Year 2023 % Change Year 2022 2 yr. Change Year 2021 Total Active Listings 163 139.7% 68 33.6% 122 Median Sales Price $1,392,500 -4.5% $1,458,355 2.2% $1,362,500 Average Sales Price $1,788,831 3.9% $1,720,931 16.6% $1,534,485 SP/LP Ratio 98.7% -5.1% 104.0% -0.7% 99.4% Average Market Time 58 26.1% 46 3.6% 56 Number of Sales YTD 98 -15.5% 116 -27.9% 136 Expired Listings 28 100.0% 14 -37.8% 45 Months of Inventory 5 177.8% 1.8 85.2% 2.7 % Under Contract 33% -47.6% 63% -43.1% 58% 30 Year Mortgage 6.32% 51.6% 4.17% 105.2% 3.08% From IRES MLS 4/5/2023
of
Single Family Q1
Boulder County
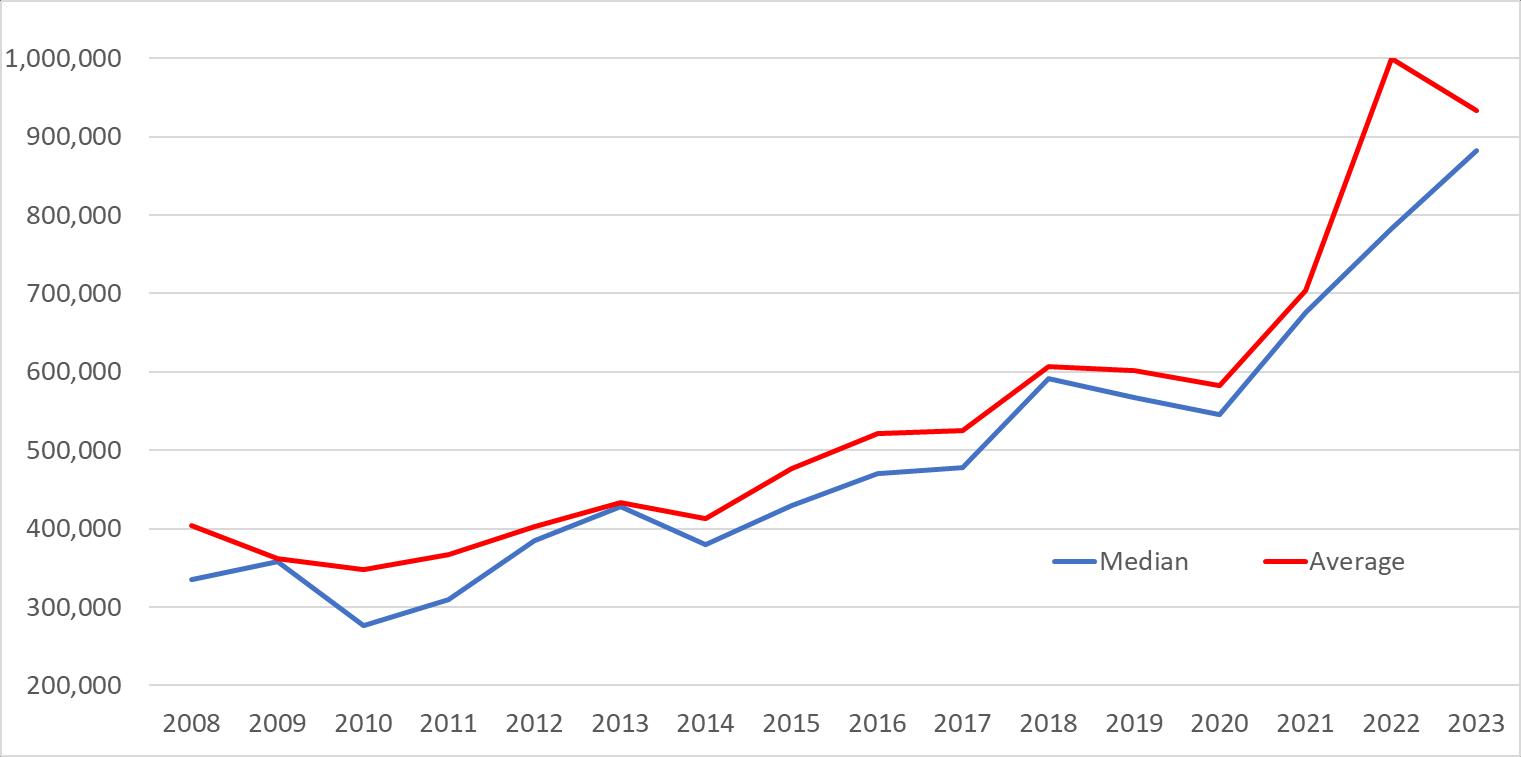
City of Louisville Year 2023 % Change Year 2022 2 yr. Change Year 2021 Total Active Listings 19 58.3% 12 35.7% 14 Median Sales Price $910,000 -9.0% $1,000,000 10.8% $821,250 Average Sales Price $1,051,012 -4.2% $1,097,331 16.4% $902,675 SP/LP Ratio 97.2% -10.1% 108.1% -5.5% 102.9% Average Market Time 68 172.0% 25 61.9% 42 Number of Sales YTD 19 -32.1% 28 -36.7% 30 Expired Listings 4 100.0% 2 ---- 3 Months of Inventory 3 130.8% 1.3 114.3% 1.4 % Under Contract 58% -30.1% 83% -18.3% 71% 30 Year Mortgage 6.32% 51.6% 4.17% 105.2% 3.08% From IRES MLS 4/5/2023
Single Family Q1
Boulder County
City of Lafayette Year 2023 % Change Year 2022 2 yr. Change Year 2021 Total Active Listings 29 26.1% 23 -3.3% 30 Median Sales Price $882,500 12.8% $782,500 30.6% $675,750 Average Sales Price $933,595 -6.6% $1,000,050 32.7% $703,371 SP/LP Ratio 98.8% -9.2% 108.8% -3.8% 102.7% Average Market Time 69 76.9% 39 0.0% 69 Number of Sales YTD 20 -33.3% 30 -61.5% 52 Expired Listings 12 500.0% 2 100.0% 6 Months of Inventory 4.4 91.3% 2.3 158.8% 1.7 % Under Contract 38% -51.3% 78% -52.5% 80% 30 Year Mortgage 6.32% 51.6% 4.17% 105.2% 3.08% From IRES MLS 4/5/2023
Single Family Q1
Boulder County
City
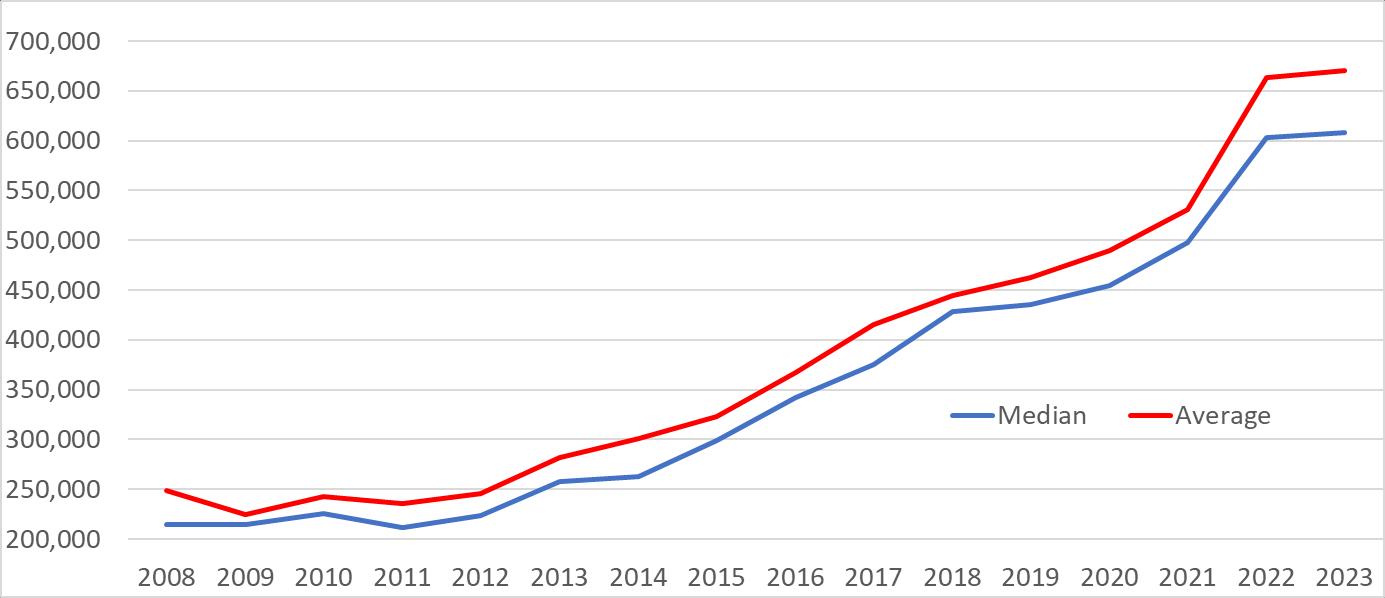
Longmont Year 2023 % Change Year 2022 2 yr. Change Year 2021 Total Active Listings 110 34.1% 82 7.8% 102 Median Sales Price $608,000 0.8% $603,000 22.2% $497,500 Average Sales Price $670,836 1.1% $663,265 26.3% $531,234 SP/LP Ratio 99.3% -6.8% 106.6% -2.9% 102.3% Average Market Time 62 129.6% 27 63.2% 38 Number of Sales YTD 110 -28.6% 154 -42.1% 190 Expired Listings 35 288.9% 9 118.8% 16 Months of Inventory 3 87.5% 1.6 87.5% 1.6 % Under Contract 55% -36.8% 87% -34.5% 84% 30 Year Mortgage 6.32% 51.6% 4.17% 105.2% 3.08% From IRES MLS 4/5/2023
of
Single Family Q1
Boulder County
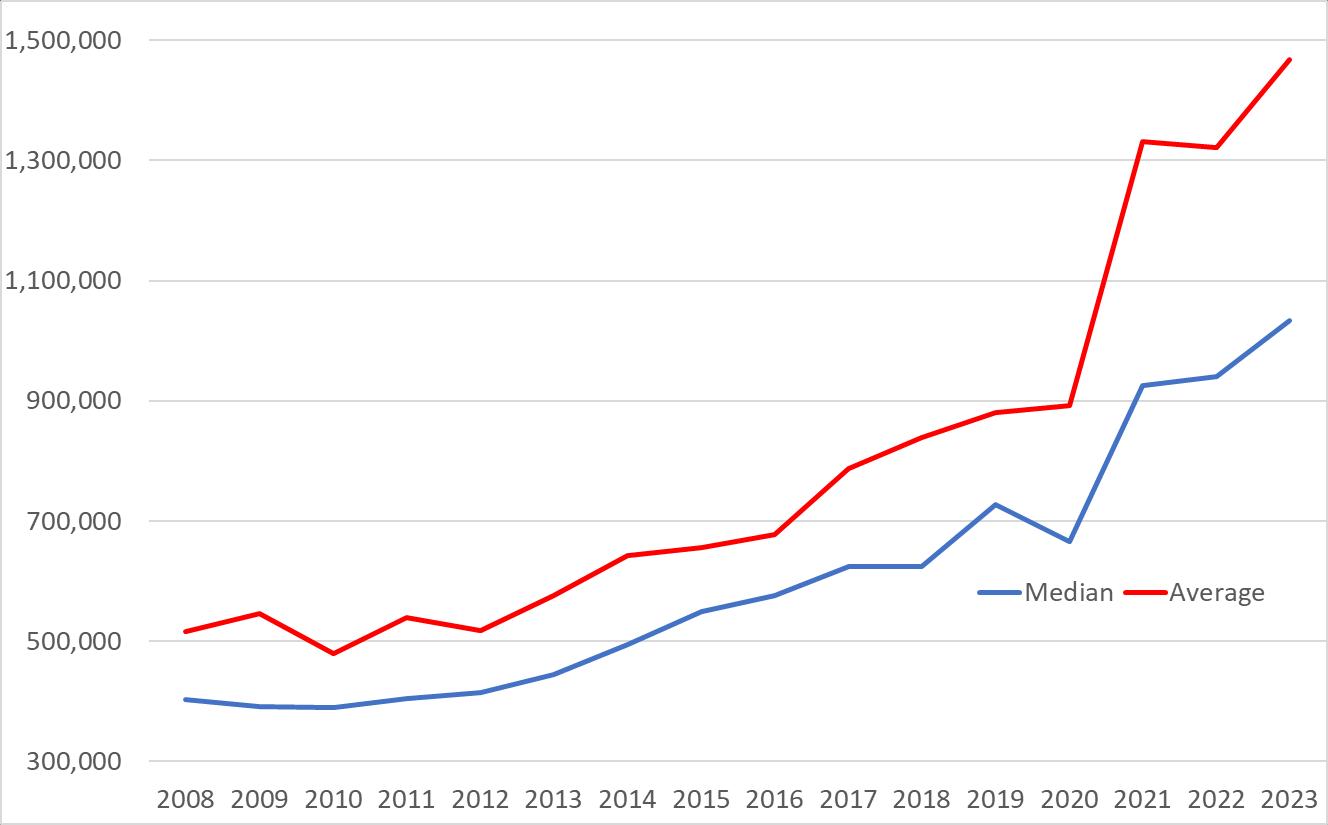
Suburban Plains Year 2023 % Change Year 2022 2 yr. Change Year 2021 Total Active Listings 84 55.6% 54 16.7% 72 Median Sales Price $1,033,500 9.9% $940,500 11.7% $925,000 Average Sales Price $1,467,204 11.1% $1,320,998 10.2% $1,331,109 SP/LP Ratio 96.7% -3.4% 100.0% -2.7% 99.4% Average Market Time 71 42.0% 50 -11.3% 80 Number of Sales YTD 58 -35.6% 90 -33.3% 87 Expired Listings 24 140.0% 10 9.1% 22 Months of Inventory 4.3 138.9% 1.8 72.0% 2.5 % Under Contract 35% -47.8% 67% -52.7% 74% 30 Year Mortgage 6.32% 51.6% 4.17% 105.2% 3.08% From IRES MLS 4/5/2023
Single Family Q1
Boulder County
Suburban Mountains Year 2023 % Change Year 2022 2 yr. Change Year 2021 Total Active Listings 34 25.9% 27 -19.0% 42 Median Sales Price $1,005,000 -11.5% $1,136,000 15.5% $870,000 Average Sales Price $1,316,109 -4.9% $1,383,881 25.0% $1,052,812 SP/LP Ratio 96.3% -4.0% 100.3% -3.9% 100.2% Average Market Time 157 170.7% 58 101.3% 78 Number of Sales YTD 33 6.5% 31 -40.0% 55 Expired Listings 12 -33.3% 18 -33.3% 18 Months of Inventory 3.1 19.2% 2.6 34.8% 2.3 % Under Contract 29% -39.6% 48% -49.1% 57% 30 Year Mortgage 6.32% 51.6% 4.17% 105.2% 3.08% From IRES MLS 4/5/2023
Single Family Q1
Boulder County
Town of Superior Year 2023 % Change Year 2022 2 yr. Change Year 2021 Total Active Listings 11 22.2% 9 0.0% 11 Median Sales Price $920,500 2.6% $897,500 9.8% $838,000 Average Sales Price $926,013 -6.3% $988,656 7.5% $861,736 SP/LP Ratio 98.4% -11.1% 110.6% -9.9% 109.1% Average Market Time 57 147.8% 23 171.4% 21 Number of Sales YTD 12 -25.0% 16 -7.7% 13 Expired Listings 5 150.0% 2 --- 0 Months of Inventory 2.75 61.8% 1.7 10.0% 2.5 % Under Contract 36% -53.8% 78% -60.4% 91% 30 Year Mortgage 6.32% 51.6% 4.17% 105.2% 3.08% From IRES MLS 4/5/2023
Boulder County
City of Broomfield Year 2023 % Change Year 2022 2 yr. Change Year 2021 Total Active Listings 129 437.5% 24 344.8% 29 Median Sales Price $705,500 2.2% $690,050 11.1% $635,000 Average Sales Price $771,151 1.5% $759,671 9.0% $707,439 SP/LP Ratio 99.1% -5.3% 104.6% -3.0% 102.1% Average Market Time 49 48.5% 33 -7.5% 53 Number of Sales YTD 160 281.0% 42 213.7% 51 Expired Listings 36 1700.0% 2 --- 0 Months of Inventory 2.4 41.2% 1.7 41.2% 1.7 % Under Contract 58% -26.6% 79% -37.6% 93% 30 Year Mortgage 6.32% 51.6% 4.17% 105.2% 3.08% From IRES and RECO MLS 4/5/2023
Single Family Q1
Single Family Q1
Boulder County
Town of Erie Year 2023 % Change Year 2022 2 yr. Change Year 2021 Total Active Listings 181 352.5% 40 465.6% 32 Median Sales Price $725,450 -4.9% $762,500 -2.0% $740,000 Average Sales Price $772,957 -9.5% $853,992 -2.3% $791,170 SP/LP Ratio 98.4% -4.4% 102.9% -2.8% 101.2% Average Market Time 58 100.0% 29 13.7% 51 Number of Sales YTD 100 61.3% 62 100.0% 50 Expired Listings 22 1000.0% 2 100.0% 11 Months of Inventory 5.4 184.2% 1.9 184.2% 1.9 % Under Contract 54% -6.9% 58% -33.3% 81% 30 Year Mortgage 6.32% 51.6% 4.17% 105.2% 3.08% From IRES and RECO MLS 4/5/2023
Single-Family Recap
Number of Single-Family Homes Sold - 1st Qtr 2023 2015 2016 2017 2018 2019 2020 2021 2022 2023 Boulder 119 112 112 142 107 141 136 116 98 Louisville 37 26 38 26 40 34 30 28 19 Lafayette 45 43 56 51 50 54 52 30 20 Longmont 227 195 174 216 210 247 190 154 110 Sub. Plains 125 106 105 115 108 120 87 90 58 Sub. Mtns 55 41 42 38 37 33 55 31 33 Superior 23 24 25 12 14 26 13 16 12 Bldr County 624 548 553 600 572 661 567 466 351 Broomfield 53 51 79 76 81 69 51 42 160 Erie 95 62 65 84 88 98 50 62 100
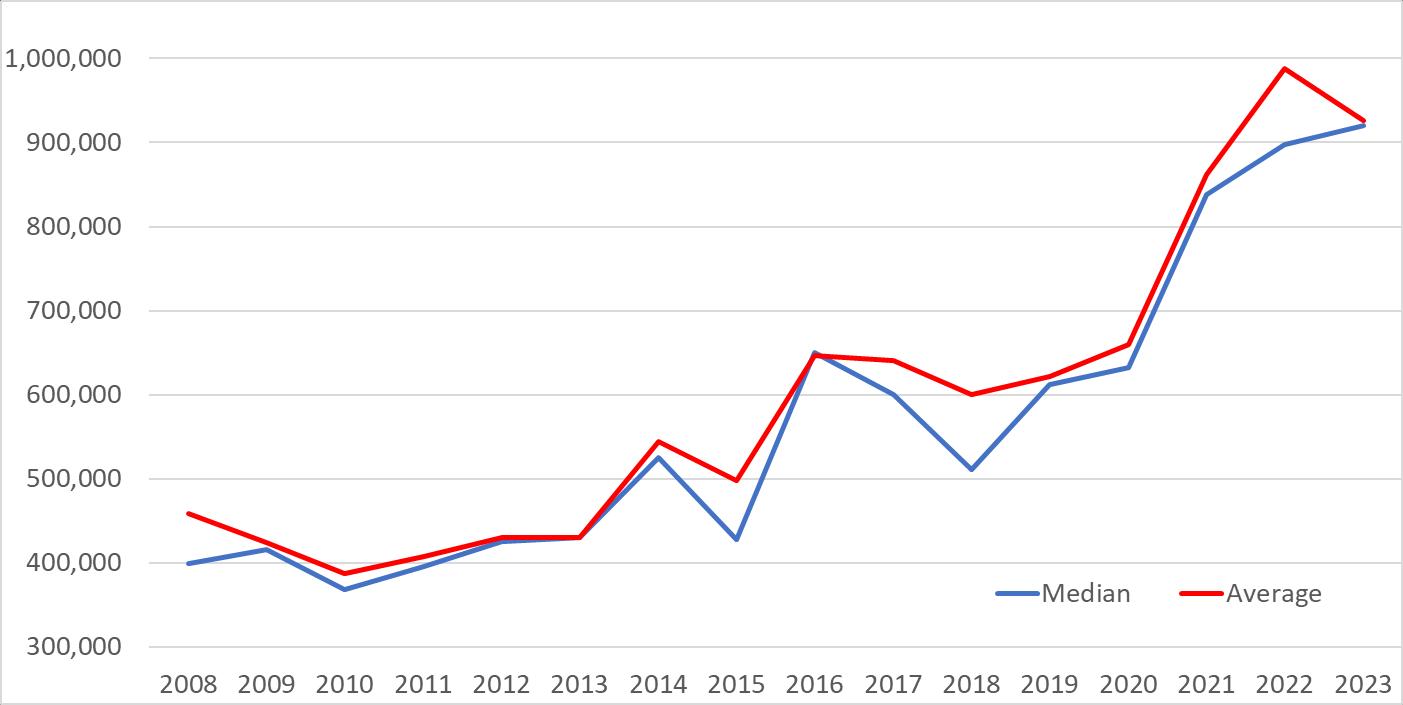
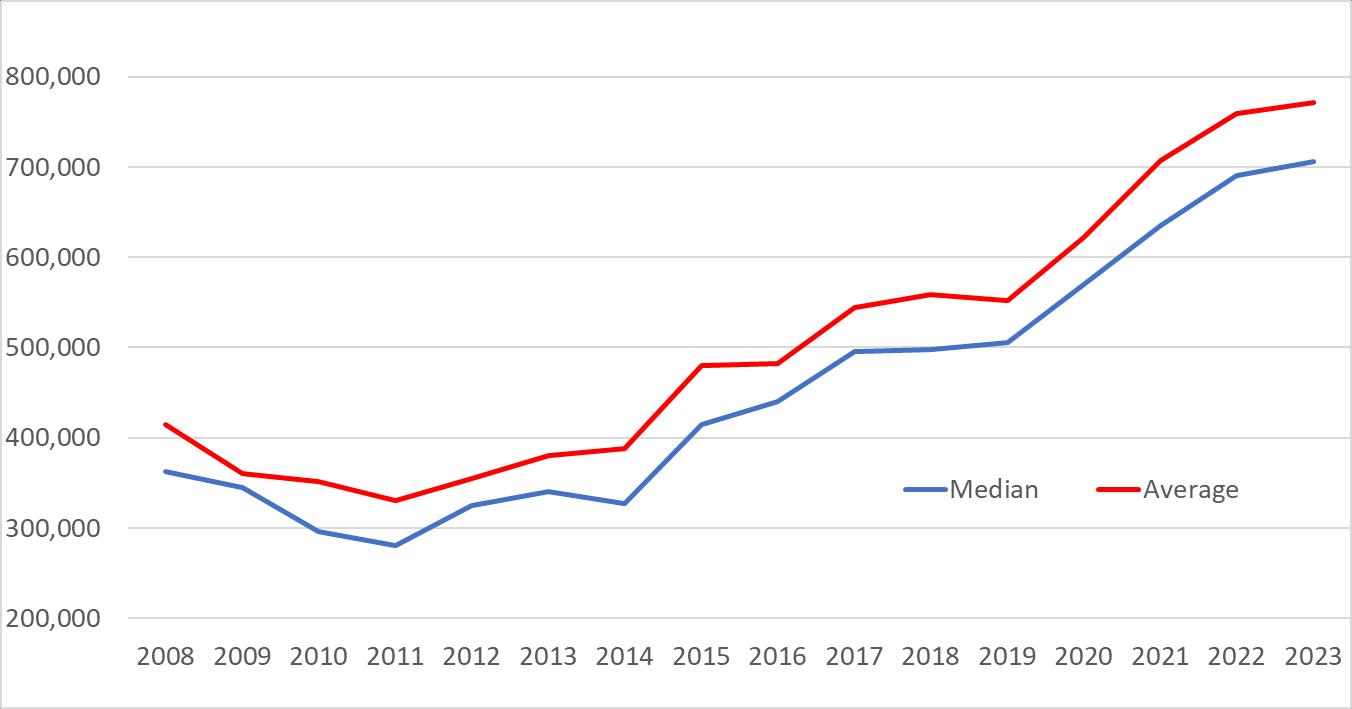
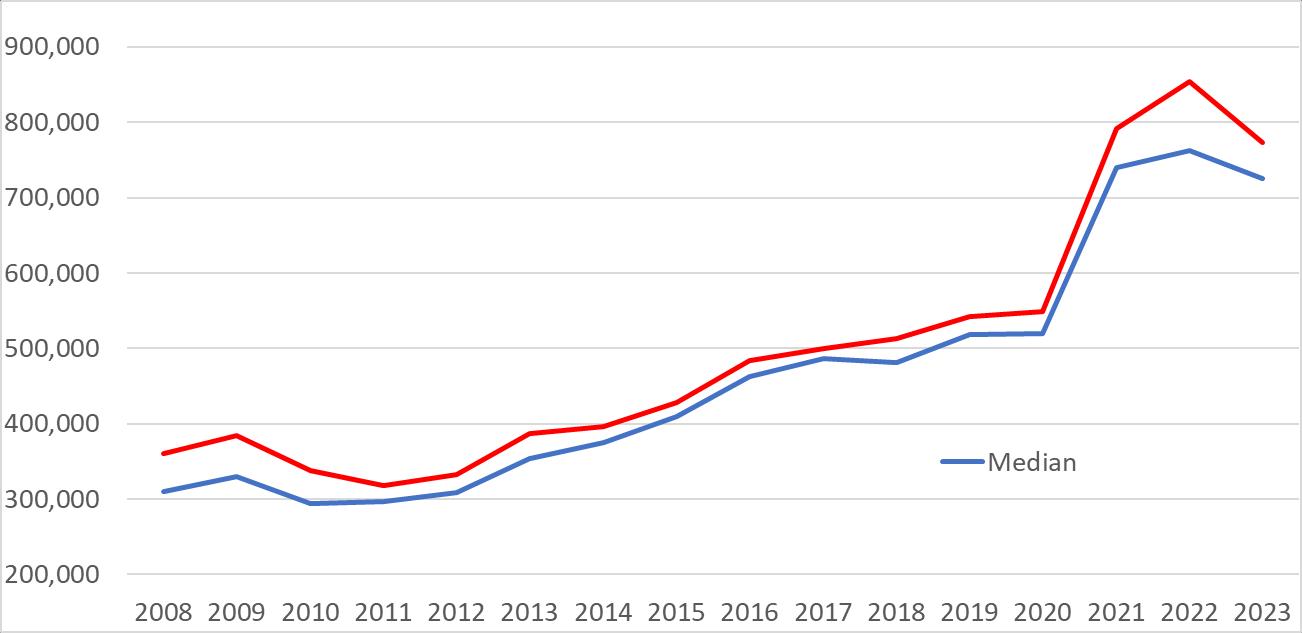
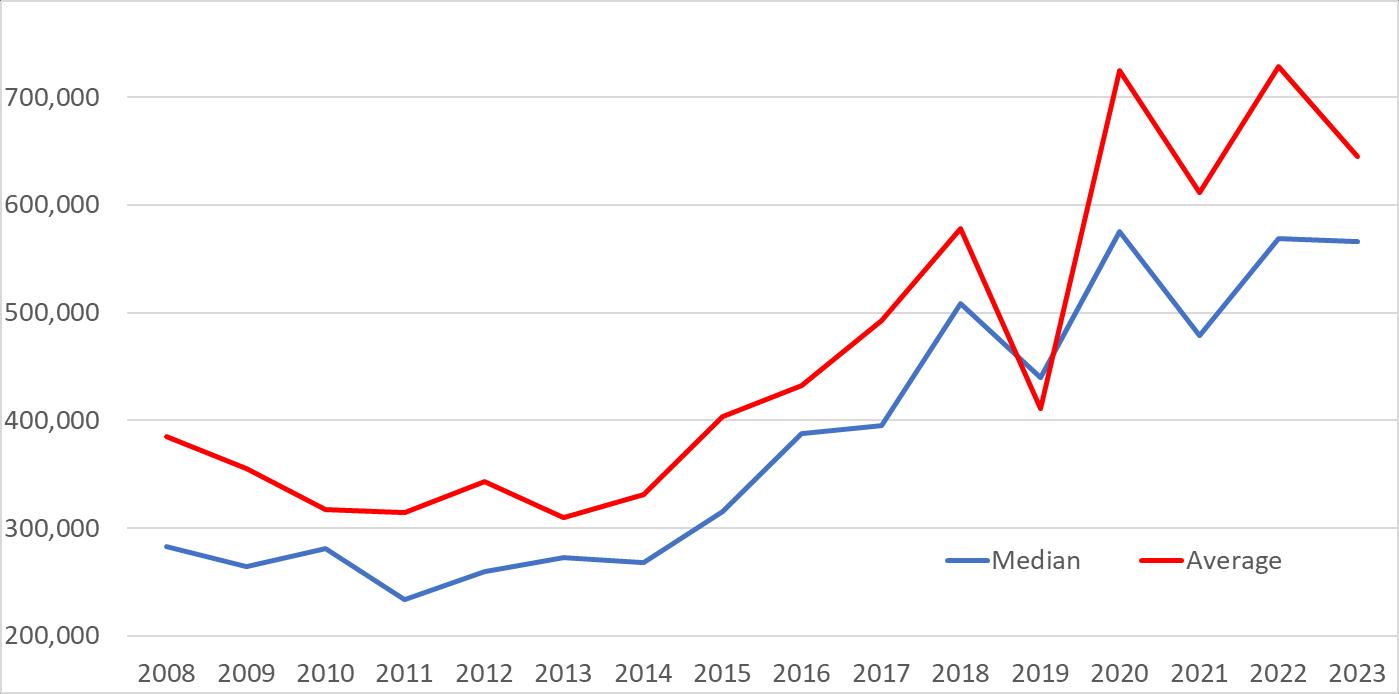
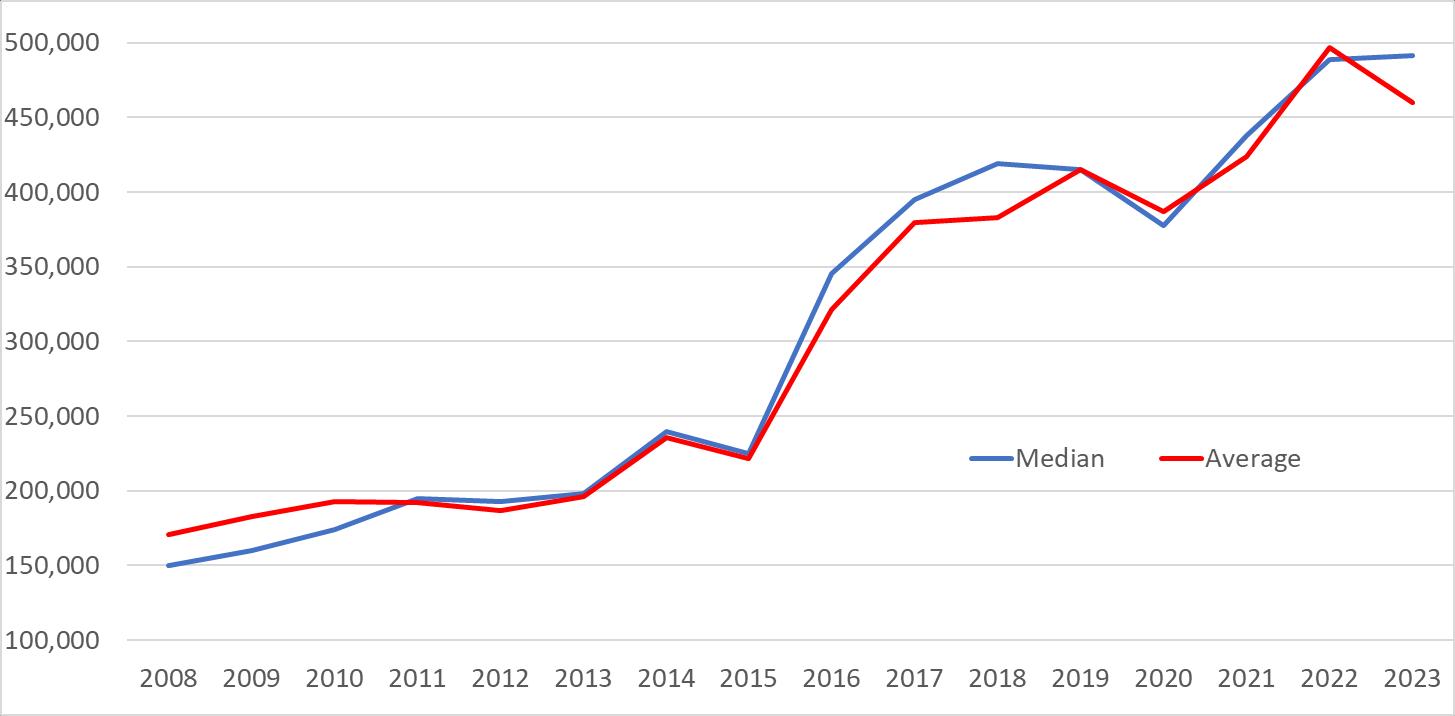
Single Family Median Price by Area - Qtr 1 2023 2015 2016 2017 2018 2019 2020 2021 2022 2023 Boulder $770,000 $842,000 $867,000 $900,000 $1,025,000 $1,000,000 $1,362,500 $1,458,355 $1,392,500 Louisville 497,500 545,000 589,250 737,500 627,500 669,500 821,250 1,000,000 910,000 Lafayette 429,875 470,000 477,900 592,000 567,500 546,000 675,750 782,500 882,500 Longmont 299,000 342,000 375,397 428,500 435,000 455,000 497,500 603,000 608,000 Sub. Plains 550,000 575,778 625,000 625,000 727,500 666,000 925,000 940,500 1,033,500 Sub. Mtns 495,000 564,000 630,250 682,250 610,000 650,000 870,000 1,136,000 1,005,000 Superior 427,700 649,836 600,000 510,250 612,500 632,000 838,000 897,500 920,500 Bldr County 457,964 495,000 558,000 592,000 594,950 609,000 760,000 872,750 900,000 Broomfield 415,000 440,500 495,787 497,500 505,000 570,000 635,000 690,050 705,500 Erie 409,500 462,500 486,000 481,500 518,950 520,000 740,000 762,500 725,450
Single Family Average Sales Price - 1st Qtr 2023 2015 2016 2017 2018 2019 2020 2021 2022 2023 Boulder $969,706 $1,071,554 $1,094,319 $1,215,000 $1,318,240 $1,236,000 $1,534,485 $1,720,931 $1,788,831 Louisville 562,933 634,438 666,128 749,600 742,920 764,875 902,675 1,097,331 1,051,012 Lafayette 489,854 552,981 570,010 618,000 601,960 582,870 703,371 1,000,050 933,595 Longmont 342,009 387,832 422,178 461,700 462,200 489,516 531,234 663,265 670,836 Plains 651,850 731,698 796,447 839,200 879,980 892,005 1,331,109 1,320,998 1,467,204 Mountains 560,868 691,252 632,256 777,800 895,980 866,530 1,052,812 1,383,881 1,316,109 Superior 570,581 614,912 635,117 677,200 621,700 659,675 861,736 988,656 926,013 Boulder Cty 575,753 652,214 680,647 745,985 765,590 770,114 989,990 1,159,510 1,219,687 Broomfield 456,531 496,456 537,262 561,700 552,160 621,470 707,439 759,671 771,151 Erie 450,794 496,007 508,303 535,900 542,200 548,680 791,170 853,992 772,957
Percent of Single-Family Homes U/C - 1st Qtr 2023 2015 2016 2017 2018 2019 2020 2021 2022 2023 Boulder 58 49 43 48 39 36 58 63 33 Louisville 67 49 47 65 51 50 71 83 58 Lafayette 71 65 47 60 47 63 80 78 38 Longmont 70 70 49 69 52 66 84 87 55 Plains 46 45 44 41 38 50 74 67 35 Mountains 37 28 28 47 39 26 57 48 29 Superior 56 23 46 64 68 61 91 78 36 Boulder County 57 53 50 55 45 51 71 72 40
 This representation is based in whole or in part on data supplied by IRES MLS for the time period above
PRICE RANGE # SOLD # ON MARKET MONTHS OF INVENTORY # Listed 1st Qtr 2023 $0 - $99,999 0 0 0 0 $100,000 - 149,999 0 0 0 0 $150,000 - 199,999 0 0 0 0 $200,000 - 249,999 0 1 0 0 $250,000 - 299,999 1 0 0 0 $300,000 - 349,999 2 0 0 0 $350,000 - 399,999 4 0 0 0 $400,000 - 449,999 13 2 0 2 $450,000 - 499,999 15 2 0 0 $500,000 - 549,999 16 4 1 4 $550,000 - 599,999 17 13 2 10 $600,000 - 649,999 24 13 2 8 $650,000 - 699,999 18 13 2 11 $700,000 - 749,999 19 8 1 6 $750,000 - 799,999 15 7 1 5 $800,000 - 849,999 10 7 2 6 $850,000 - 899,999 20 12 2 12 $900,000 - 949,999 14 3 1 2 $950,000 - 999,999 10 15 5 12 $1,000,000 - 1,099,999 16 13 2 11 $1,100,000 - 1,199,999 19 17 3 13 $1,200,000 - 1,299,999 15 11 2 10 $1,300,000 - 1,399,999 9 7 2 6 $1,400,000 - 1,499,999 11 8 2 6 $1,500,000 - 1,599,999 10 9 3 4 $1,600,000 - 1,699,999 7 2 1 2 $1,700,000 - 1,799,999 6 3 2 3 $1,800,000 - 1,899,999 6 12 6 9 $1,900,000 - 1,999,999 2 7 11 6 $2,000,000 - 52 119 7 87 TOTALS: 351 308 2.63 235
Prepared by RE/MAX of Boulder, Inc. For Boulder County on April 6 2023
Multi-Family
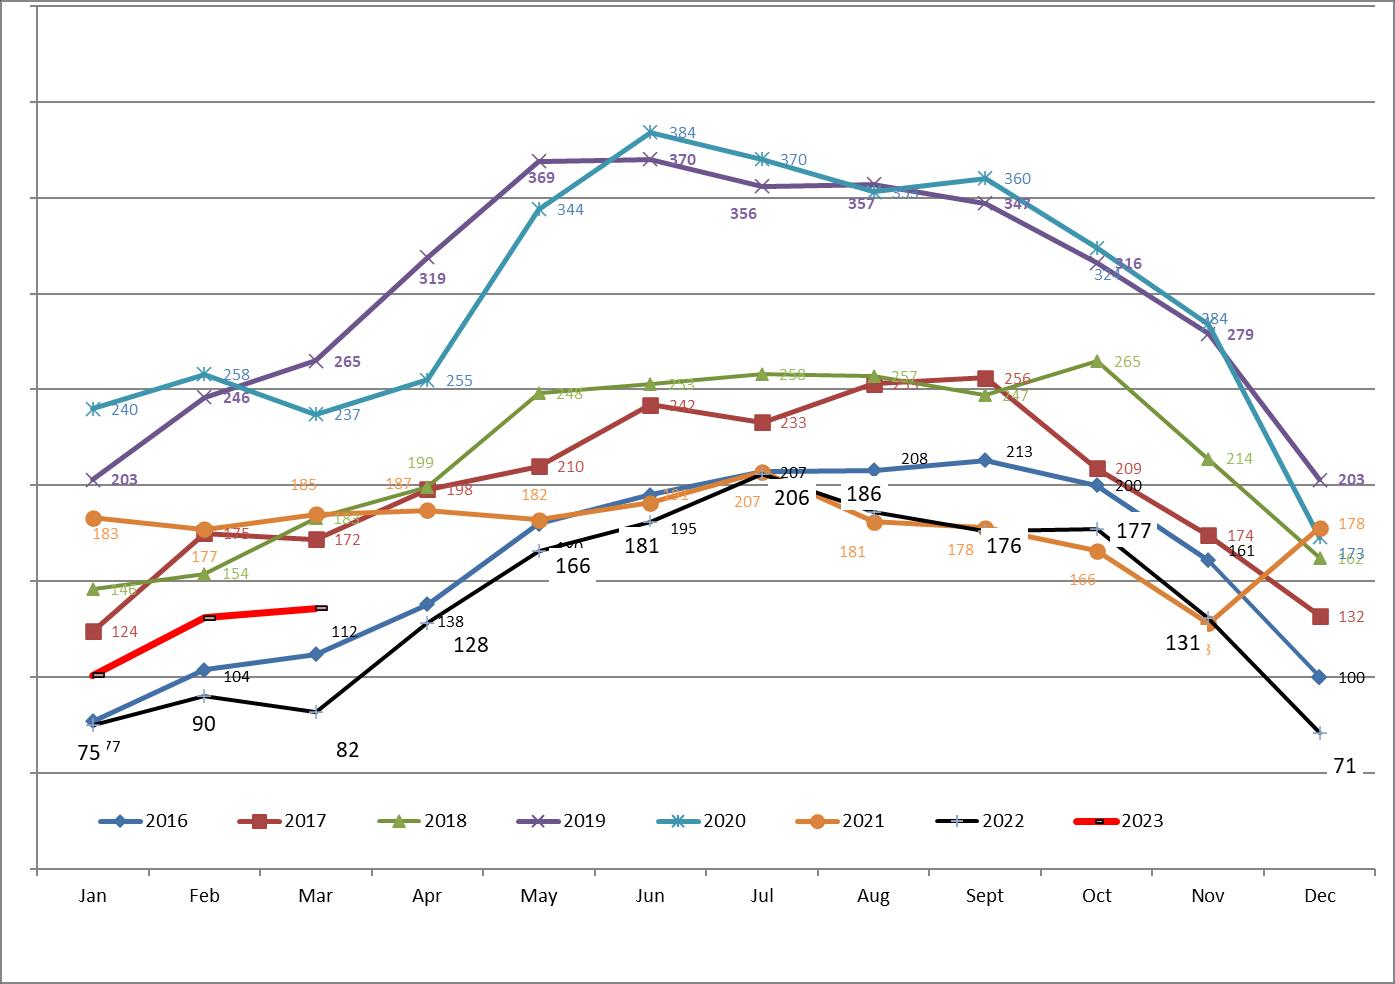
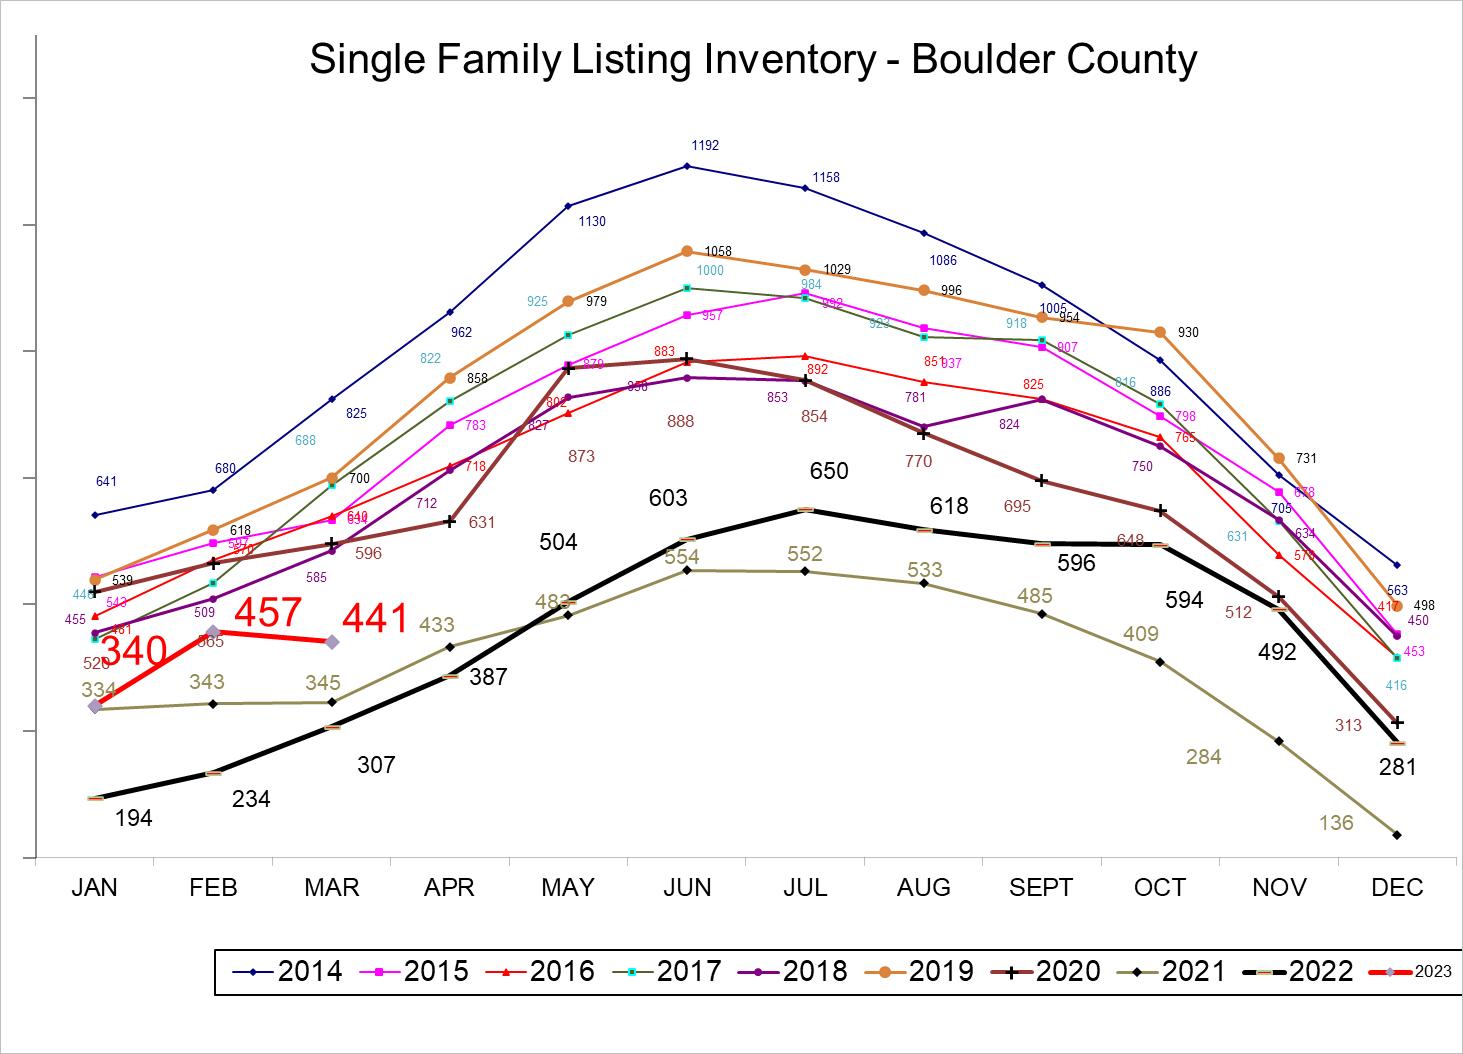
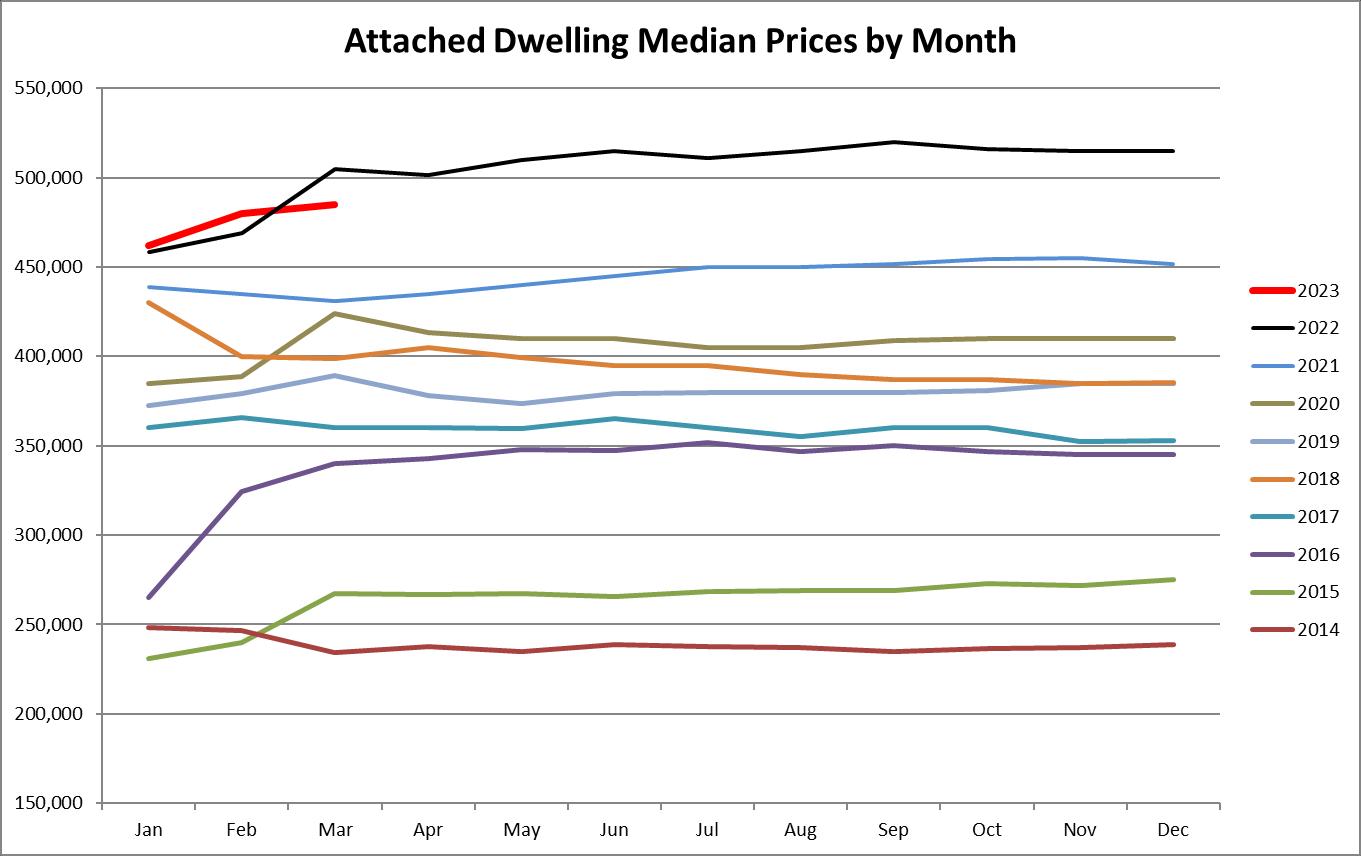
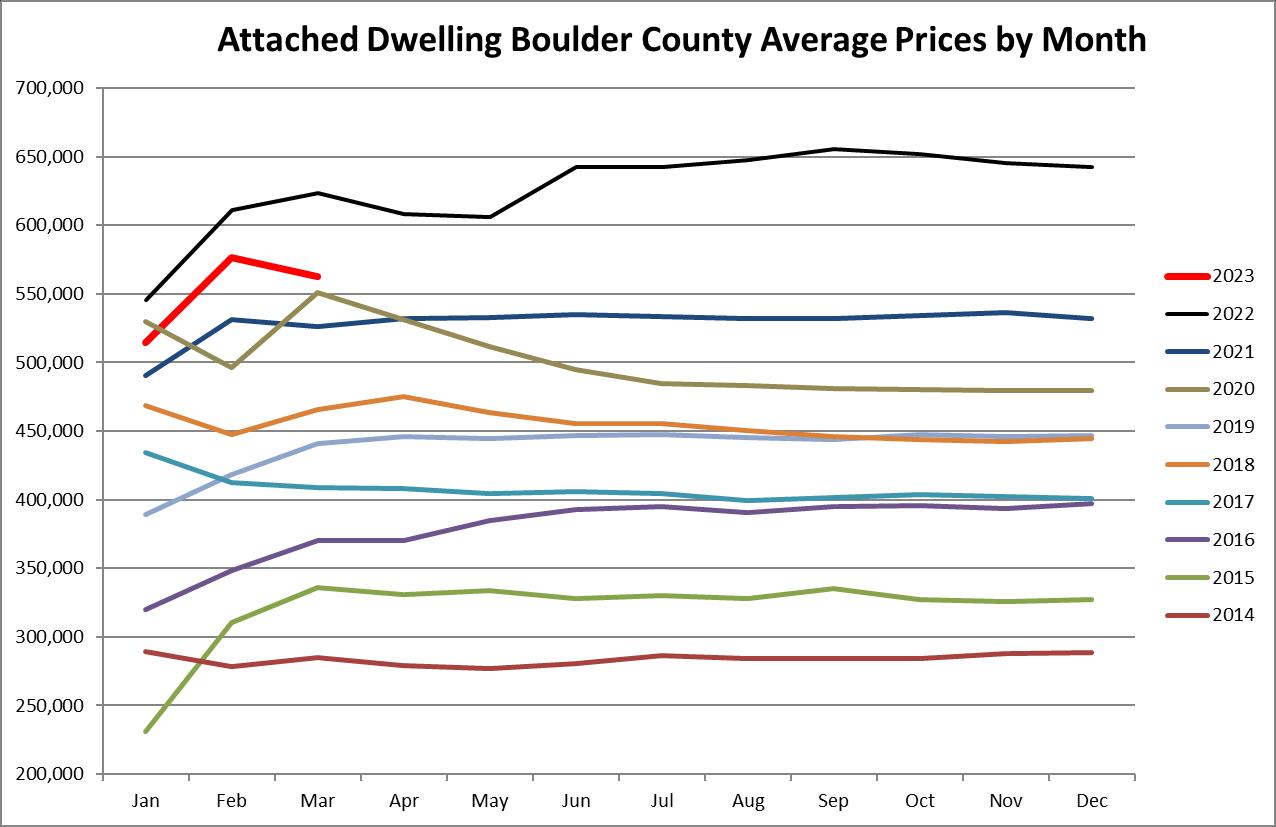
Boulder County Attached Dwelling Listing Inventory
Attached Dwelling Q1
Boulder County
Boulder County Year 2023 % Change Year 2022 2 yr. Change Year 2021 Total Active Listings 136 65.9% 82 -26.5% 185 Median Sales Price $484,960 -4.0% $505,000 12.5% $431,000 Average Sales Price $562,769 -9.8% $623,757 7.0% $526,021 SP/LP Ratio 98.9% -4.4% 103.4% -0.9% 99.8% Average Market Time 67 31.4% 51 -5.6% 71 Number of Sales YTD 173 -29.7% 246 -43.8% 308 Expired Listings 33 57.1% 21 -49.2% 65 Months of Inventory 2.4 140.0% 1 33.3% 1.8 % Under Contract 48% -41.5% 82% -27.4% 66% 30 Year Mortgage 6.32% 51.6% 4.17% 105.2% 3.08% From IRES MLS 4/5/2023
Attached Dwelling Q1
Boulder County
City of Boulder Year 2023 % Change Year 2022 2 yr. Change Year 2021 Total Active Listings 77 -27.4% 106 -45.4% 141 Median Sales Price $566,000 -0.5% $569,000 18.2% $479,000 Average Sales Price $644,716 -11.4% $728,012 5.4% $611,546 SP/LP Ratio 98.7% -3.5% 102.3% -0.5% 99.2% Average Market Time 59 1.7% 58 -35.2% 91 Number of Sales YTD 78 -40.5% 131 -50.9% 159 Expired Listings 17 41.7% 12 -66.0% 50 Months of Inventory 3 25.0% 2.4 11.1% 2.7 % Under Contract 43% -44.4% 77% -19.2% 53% 30 Year Mortgage 6.32% 51.6% 4.17% 105.2% 3.08% From IRES MLS 4/5/2023
Boulder County
City of Louisville Year 2023 % Change Year 2022 2 yr. Change Year 2021 Total Active Listings 5 25.0% 4 -64.3% 14 Median Sales Price $624,338 2.4% $610,000 47.6% $422,900 Average Sales Price $686,459 5.7% $649,444 50.5% $456,192 SP/LP Ratio 98.5% -8.6% 107.8% -1.3% 99.8% Average Market Time 53 194.4% 18 20.5% 44 Number of Sales YTD 8 -11.1% 9 -38.5% 13 Expired Listings 0 ---- 1 ---- 0 Months of Inventory 1.9 46.2% 1.3 -40.6% 3.2 % Under Contract 40% -20.0% 50% -56.9% 93% 30 Year Mortgage 6.32% 51.6% 4.17% 105.2% 3.08% From IRES MLS 4/5/2023
Attached Dwelling Q1
Attached Dwelling Q1
Boulder County
City of Lafayette Year 2023 % Change Year 2022 2 yr. Change Year 2021 Total Active Listings 12 50.0% 8 -63.6% 33 Median Sales Price $491,500 0.5% $489,000 12.2% $438,000 Average Sales Price $460,172 -7.4% $496,990 8.5% $424,072 SP/LP Ratio 100.1% -4.7% 105.0% -1.9% 102.0% Average Market Time 76 -6.2% 81 76.7% 43 Number of Sales YTD 20 -35.5% 31 -31.0% 29 Expired Listings 4 300.0% 1 ----- 0 Months of Inventory 1.8 125.0% 0.8 -47.1% 3.4 % Under Contract 58% -41.7% 100% -23.1% 76% 30 Year Mortgage 6.32% 51.6% 4.17% 105.2% 3.08% From IRES MLS 4/5/2023
Attached Dwelling Q1
Boulder County
City of Longmont Year 2023 % Change Year 2022 2 yr. Change Year 2021 Total Active Listings 109 303.7% 27 165.9% 41 Median Sales Price $473,960 6.9% $443,500 20.1% $394,712 Average Sales Price $486,068 4.3% $465,978 20.3% $404,040 SP/LP Ratio 99.5% -5.8% 105.6% -1.7% 101.2% Average Market Time 86 230.8% 26 95.5% 44 Number of Sales YTD 40 -4.8% 42 -32.2% 59 Expired Listings 7 133.3% 3 -22.2% 9 Months of Inventory 8.2 331.6% 1.9 290.5% 2.1 % Under Contract 48% -43.5% 85% -46.8% 90% 30 Year Mortgage 6.32% 51.6% 4.17% 105.2% 3.08% From IRES MLS 4/5/2023
Boulder County
Suburban Plains Year 2023 % Change Year 2022 2 yr. Change Year 2021 Total Active Listings 12 71.4% 7 -52.0% 25 Median Sales Price $435,000 4.8% $415,000 22.7% $354,500 Average Sales Price $455,594 -10.5% $509,127 14.4% $398,150 SP/LP Ratio 98.7% -4.5% 103.3% -1.1% 99.8% Average Market Time 27 -30.8% 39 -56.5% 62 Number of Sales YTD 17 -26.1% 23 -46.9% 32 Expired Listings 4 --- 0 33.3% 3 Months of Inventory 2.1 133.3% 0.9 -8.7% 2.3 % Under Contract 83% -16.7% 100% 38.8% 60% 30 Year Mortgage 6.32% 51.6% 4.17% 105.2% 3.08% From IRES MLS 4/5/2023
Attached Dwelling Q1
Attached Dwelling Q1
Boulder County
Town of Superior Year 2023 % Change Year 2022 2 yr. Change Year 2021 Total Active Listings 16 0.0% 16 -38.5% 26 Median Sales Price $529,900 -10.5% $592,111 -18.4% $649,300 Average Sales Price $584,771 2.4% $571,326 -7.6% $632,868 SP/LP Ratio 94.8% -10.1% 105.5% -5.2% 100.0% Average Market Time 136 369.0% 29 86.3% 73 Number of Sales YTD 7 -22.2% 9 -53.3% 15 Expired Listings 1 -50.0% 2 -66.7% 3 Months of Inventory 6.9 30.2% 5.3 32.7% 5.2 % Under Contract 50% -50.0% 100% -35.0% 77% 30 Year Mortgage 6.32% 51.6% 4.17% 105.2% 3.08% From IRES MLS 4/5/2023
Boulder County
City of Broomfield Year 2023 % Change Year 2022 2 yr. Change Year 2021 Total Active Listings 66 560.0% 10 214.3% 21 Median Sales Price $534,990 21.6% $440,000 18.2% $452,450 Average Sales Price $513,418 3.8% $494,470 15.8% $443,357 SP/LP Ratio 98.5% -5.8% 104.6% -2.9% 101.4% Average Market Time 76 130.3% 33 117.1% 35 Number of Sales YTD 55 266.7% 15 292.9% 14 Expired Listings 9 ----- 0 ---- 0 Months of Inventory 3.6 80.0% 2 -20.0% 4.5 % Under Contract 54% -32.5% 80% -43.2% 95% 30 Year Mortgage 6.32% 51.6% 4.17% 105.2% 3.08% From IRES and RECO MLS 4/5/2023
Attached Dwelling Q1
Attached Dwelling Q1
Boulder County
Town of Erie Year 2023 % Change Year 2022 2 yr. Change Year 2021 Total Active Listings 42 2000.0% 2 425.0% 8 Median Sales Price $520,000 25.3% $415,000 31.6% $395,000 Average Sales Price $486,684 4.5% $465,882 20.2% $404,885 SP/LP Ratio 98.4% -3.0% 101.4% -2.1% 100.5% Average Market Time 78 160.0% 30 44.4% 54 Number of Sales YTD 26 160.0% 10 160.0% 10 Expired Listings 4 ----- 0 ----- 0 Months of Inventory 4.8 700.0% 0.6 100.0% 2.4 % Under Contract 64% 28.0% 50% -14.7% 75% 30 Year Mortgage 6.32% 51.6% 4.17% 105.2% 3.08% From IRES and RECO MLS 4/5/2023
Multi-Family Recap
Attached Dwelling Sold by Area Year - Q1 2023 2015 2016 2017 2018 2019 2020 2021 2022 2023 Boulder 141 102 119 122 100 143 159 131 78 Louisville 22 11 21 15 17 30 13 9 8 Lafayette 16 24 16 23 29 27 29 31 20 Longmont 58 36 74 63 60 75 59 42 40 Sub. Plains 22 13 24 29 24 20 32 23 17 Superior 5 6 10 28 16 5 15 9 7 Boulder County 258 192 265 283 246 301 308 246 173 Broomfield 14 19 19 23 16 19 14 15 55 Erie 8 7 12 10 17 13 10 10 26
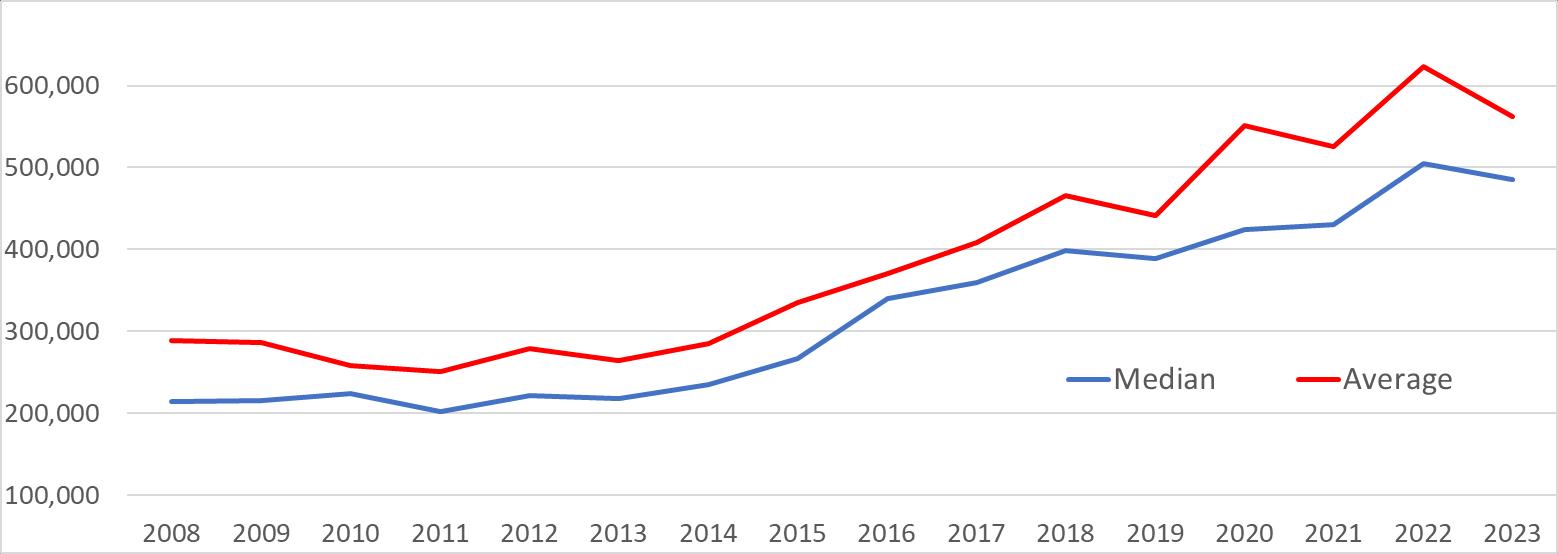
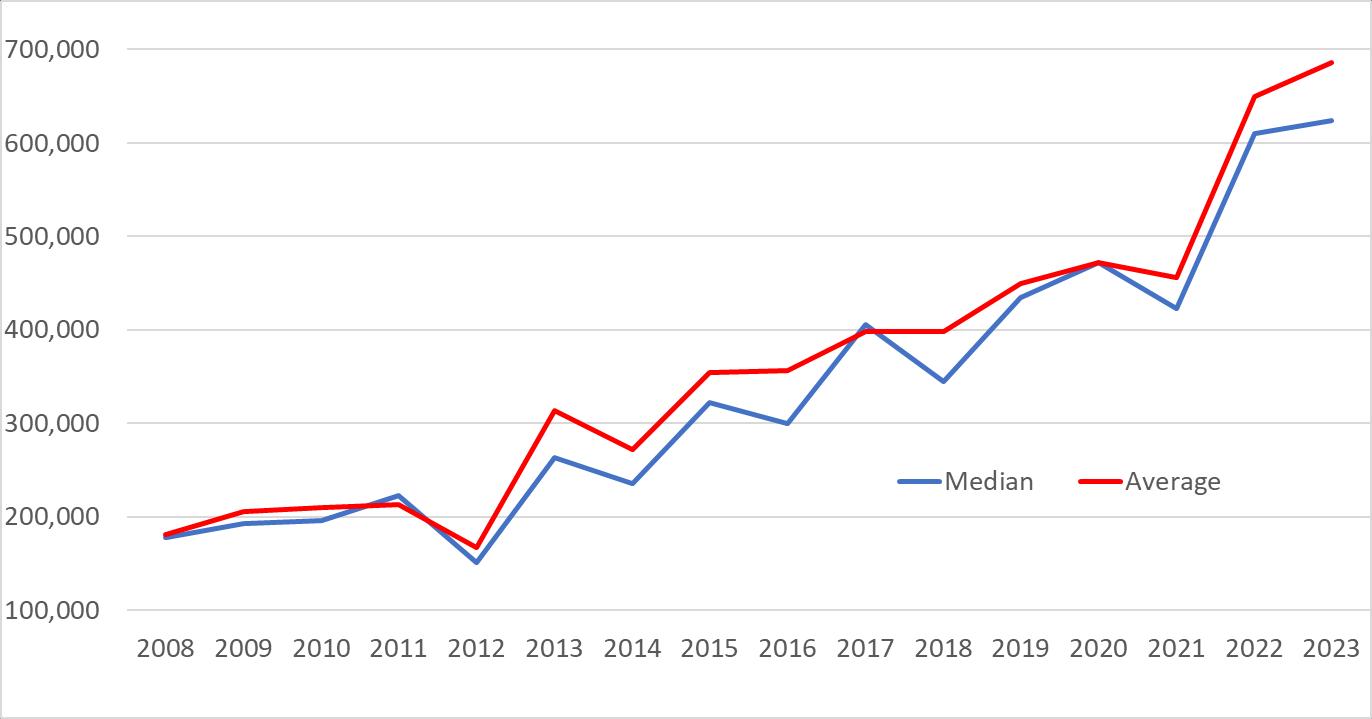
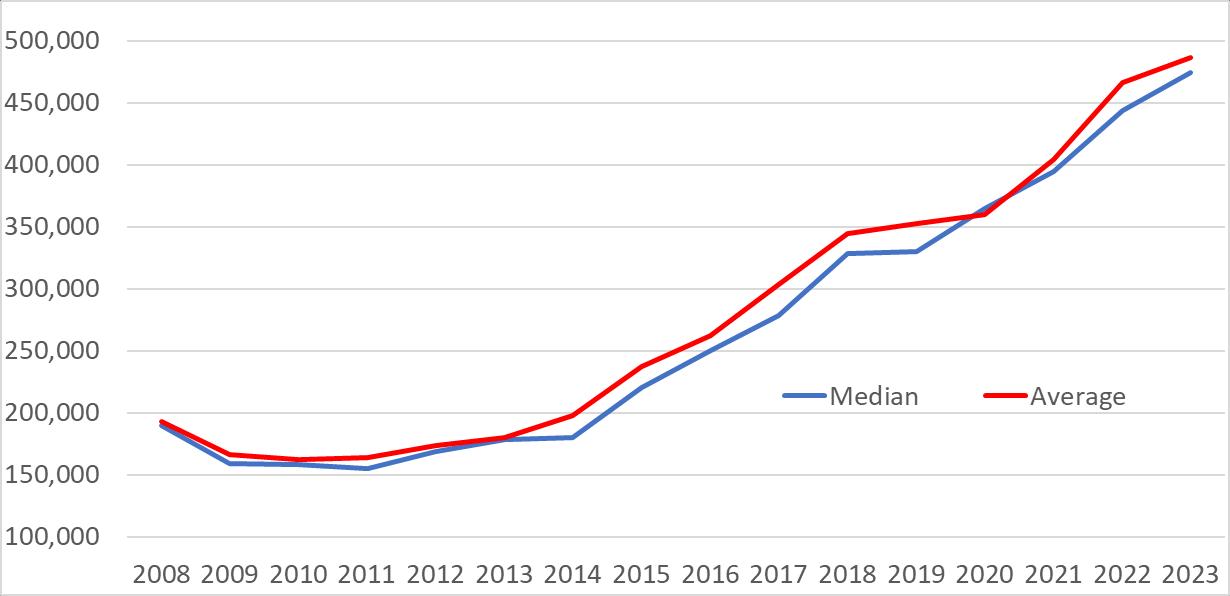
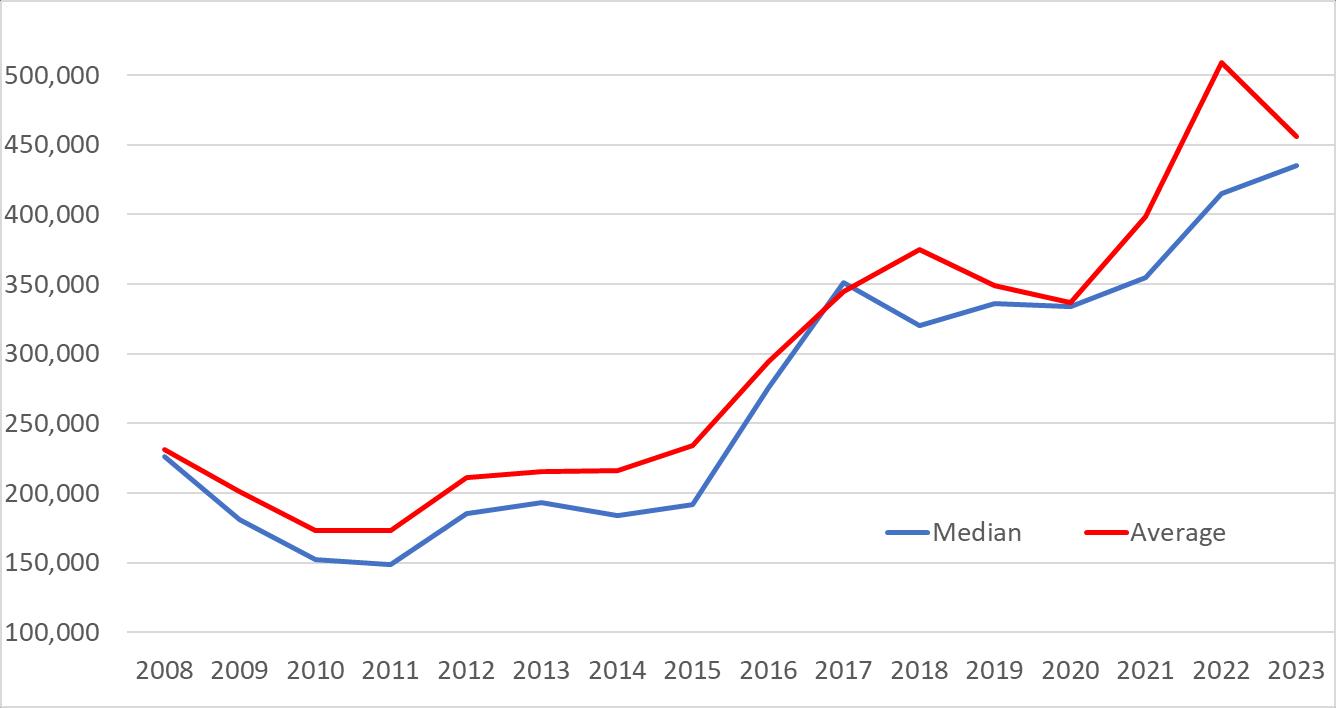
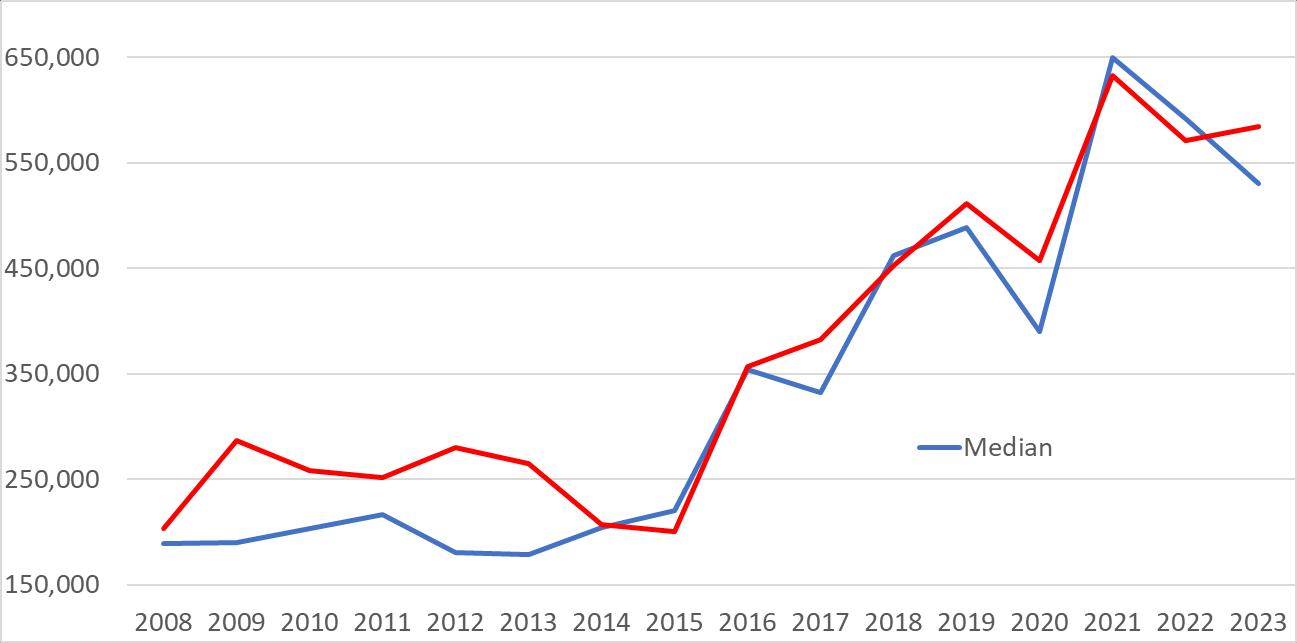
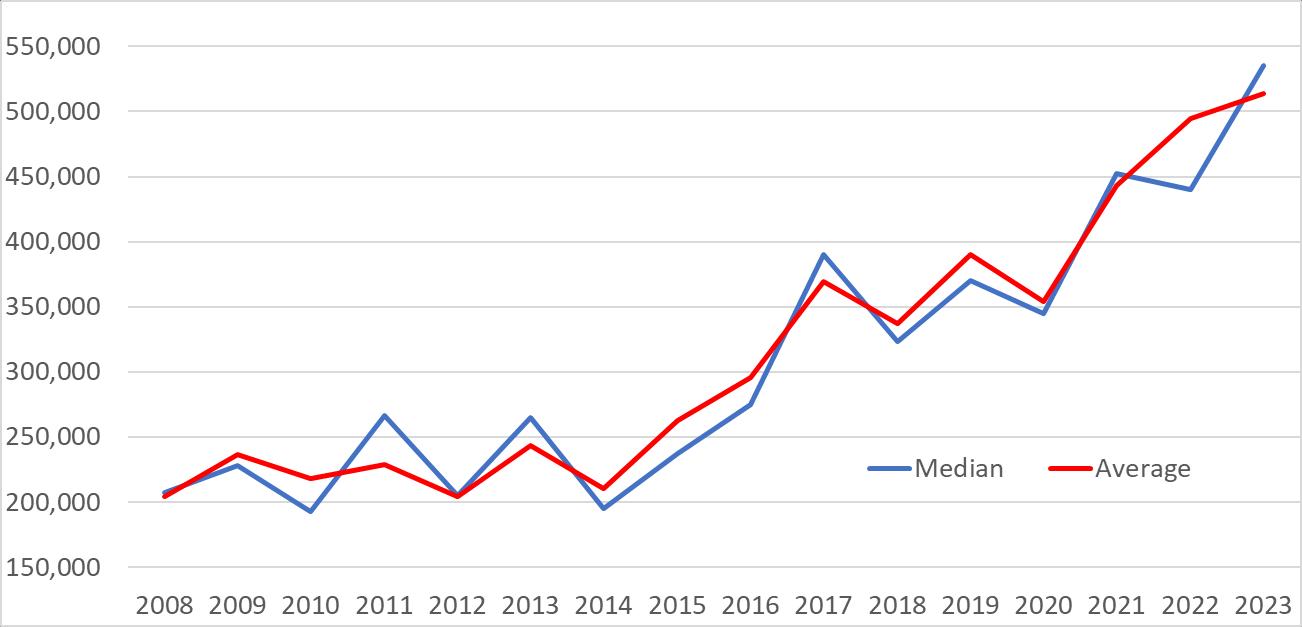
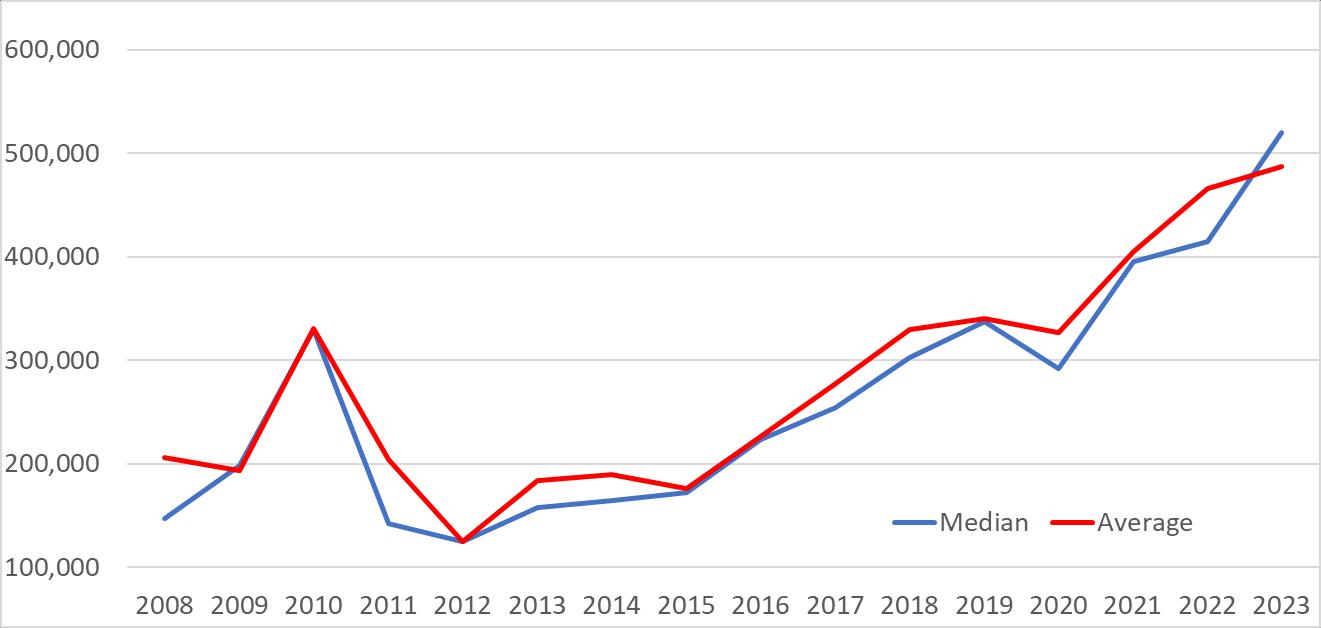
Attached Dwelling Median Sales Price - Q1 2023 2015 2016 2017 2018 2019 2020 2021 2022 2023 Boulder $315,000 $388,000 $395,000 $508,750 $440,000 $575,000 $479,000 $569,000 $566,000 Louisville 322,050 300,000 405,360 345,000 435,000 472,450 422,900 610,000 624,338 Lafayette 224,875 345,297 395,000 419,000 415,000 377,500 438,000 489,000 491,500 Longmont 214,000 250,000 278,000 328,362 329,950 365,000 394,712 443,500 473,960 Sub. Plains 191,200 276,000 351,250 319,900 336,200 333,750 354,500 415,000 435,000 Superior 220,000 353,500 332,500 462,393 489,000 390,000 649,300 592,111 529,900 Boulder County 267,500 340,250 360,000 399,000 389,000 424,000 431,000 505,000 484,960 Broomfield 237,388 275,000 390,000 323,000 390,000 345,000 452,450 440,000 534,990 Erie 171,750 223,000 254,500 302,500 337,400 292,000 395,000 415,000 520,000
Attached Dwelling Average Sales Price - Q1 2023 2015 2016 2017 2018 2019 2020 2021 2022 2023 Boulder $403,884 $431,908 $492,570 $577,794 $511,030 $724,950 $611,546 $728,012 $644,716 Louisville 354,742 356,490 398,065 398,326 449,640 472,120 456,192 649,444 686,459 Lafayette 221,380 321,218 379,687 382,863 415,200 386,780 424,072 496,990 460,172 Longmont 235,921 261,971 303,487 344,267 352,400 359,640 404,040 465,978 486,068 Sub. Plains 231,848 294,253 344,732 374,474 348,630 336,795 398,150 509,127 455,594 Superior 200,600 356,500 382,419 452,305 510,900 457,660 632,868 571,326 584,771 Boulder County 335,943 370,211 408,570 465,961 440,960 550,985 526,021 623,757 562,769 Broomfield 262,220 295,839 369,288 336,936 369,740 354,340 443,357 494,470 513,418 Erie 176,250 225,929 277,462 329,325 339,900 326,165 404,885 465,882 486,684
This representation is based in whole or in part on data supplied by IRES MLS for the time period above
6th,
PRICE RANGE # SOLD # ON MARKET MONTHS OF INVENTORY # Listed 1st Qtr 2023 $0 - $99,999 0 0 0 0 $100,000 - 149,999 0 0 0 0 $150,000 - 199,999 1 2 6 2 $200,000 - 249,999 5 1 1 1 $250,000 - 299,999 8 1 0 1 $300,000 - 349,999 16 5 1 5 $350,000 - 399,999 12 15 4 13 $400,000 - 449,999 24 8 1 3 $450,000 - 499,999 27 7 1 5 $500,000 - 549,999 20 8 1 6 $550,000 - 599,999 10 4 1 3 $600,000 - 649,999 8 11 4 10 $650,000 - 699,999 11 6 2 6 $700,000 - 749,999 3 3 3 2 $750,000 - 799,999 5 5 3 4 $800,000 - 999,999 12 15 4 12 $1,000,000 - 11 25 7 19 TOTALS: 173 116 2.01 92
Prepared by RE/MAX of Boulder, Inc. For Boulder County on April
2023
Luxury Market
$1M + Boulder County
Single Family and Attached Dwelling
Through 1st Quarter 2023
Active SOLD DOM U/C % Sales over $1 Million 2015 214 54 107 18% 8.8% 2016 256 61 103 25% 11.3% 2017 269 69 103 25% 12.5% 2018 261 95 87 28% 15.8% 2019 304 94 83 23% 16.3% 2020 258 145 101 19% 15.0% 2021 241 138 75 48% 24.3% 2022 216 215 57 62% 30.2% 2023 338 166 78 25% 31.4%
Single Family Through 1st Quarter
$1,000,000 – $2,000,000
Boulder County 2017 2018 2019 2020 2021 2022 2023 Total Active Listings 36 108 101 151 % Under Contract 24.3% 66% 64% 37.1% Number Sold 62 73 69 91 124 132 101 Average Days on Mkt 110 84 67 78 73 45 61 % of Total Market Sold 11.1% 11.9% 11.9% 13.7% 21.8% 28.3% 28.7% City of Boulder 2017 2018 2019 2020 2020 2022 2023 Total Active Listings 60 45 38 63 % Under Contract 18.3% 64.4% 81.6% 34.9% Number Sold 32 41 38 55 68 59 43 Average Days on Mkt 77 69 63 68 61 39 41 % of SF Market Sold 28.3% 28.7% 35.5% 38.5% 50% 50.90% 43.4%
$2,000,000 and up Single Family Through 1st Quarter
Boulder County 2017 2018 2019 2020 2021 2022 2023 Total Active Listings 78 98 67 158 % Under Contract 5.1% 35.7% 41.8% 15.8% Number Sold 7 25 25 27 47 55 53 Average Days on Mkt 128 99 129 136 91 59 112 % of Total Market Sold 1.3% 4.1% 4.3% 4.1% 8.3% 11.8% 15.1% City of Boulder 2017 2018 2019 2020 2021 2022 2023 Total Active Listings 35 53 31 89 % Under Contract 2.9% 45.3% 48.4% 16.9% Number Sold 5 18 17 17 28 32 32 Average Days on Mkt 139 81 92 71 72 65 80 % of total market sold 4.4% 12.6% 15.9% 11.9% 20.6% 27.6% 32.3%