Boulder County Real Estate Report
2nd Quarter 2023

Fhfa.gov

Through 1st Quarter 2023
2nd Quarter released end of August
FHFA.GOV House Price Appreciation by State
1 year Rank - Percentage Change in House Prices Seasonally Adjusted, Purchase Only HPI Period Ending March, 2023 State Rank 1-Quarter 1-Year 5-Years Since 1991Q1 South Carolina 1 1.97 9.53 70.84 296.45 North Carolina 2 2.02 9.41 75.5 303.34 Maine 3 1.45 8.94 76.41 324.78 Vermont 4 3.44 8.82 63.8 270.89 Arkansas 5 1.46 8.76 57.29 233.62 South Dakota 6 2.54 8.27 60.67 360.91 Connecticut 7 2.1 8.07 51.3 155.17 Florida 8 0.23 7.86 81.3 427.8 Wisconsin 9 1.68 7.73 56.85 290.18 Kentucky 10 1.56 7.67 53.73 255.55 Rhode Island 11 5.59 7.63 63.02 263.57 Alabama 12 1.02 7.35 61.42 240.23 Iowa 13 1.49 7.3 42.59 238.33 New Mexico 14 1.18 7.22 57.4 268.9 Tennessee 15 1.16 7.04 78.18 344.43 New Jersey 16 1.77 6.85 52.46 252.8 Wyoming 17 2.44 6.81 51.72 402.07 Georgia 18 0.63 6.73 69.87 285.75 Virginia 19 1.44 6.48 51.51 276.91 Mississippi 20 2.6 6.46 46.79 195.71 Alaska 21 2.07 6.3 35.5 245.15 Missouri 22 1.49 6.26 55.9 254.8 Oklahoma 23 0.55 6.24 52.14 250.07 Nebraska 24 0.52 5.99 51.94 286.72
FHFA.GOV House Price Appreciation by State
Percentage Change in House Prices Seasonally Adjusted, Purchase Only HPI Period Ending March, 2023 State Rank 1-Quarter 1-Year 5-Years Since 1991Q1 Indiana 25 0.7 5.91 59.41 219.54 Ohio 26 1.22 5.5 56.42 200.75 Delaware 27 -1.43 5.33 46.14 199.48 Texas 28 0.04 5.07 55.74 330.37 New Hampshire 29 1.97 4.97 67.12 303.23 Kansas 30 1.65 4.82 50.79 254.47 Pennsylvania 31 0.43 4.8 48.77 222.06 Hawaii 32 -2.92 4.72 53.28 273.3 Montana 33 -0.91 4.65 74.03 563.04 North Dakota 34 0.87 4.6 30.97 299.73 Illinois 35 0.67 4.28 37.22 169.49 New York 36 0.34 4.22 48.27 248.37 Michigan 37 1.26 4.17 54.04 233 Massachusetts 38 1.65 3.86 50.65 315.17 West Virginia 39 0.94 3.67 38.5 190.61 Minnesota 40 0.39 2.35 42.71 293.13 Maryland 41 -0.45 1.59 35.9 230.99 Louisiana 42 -1.72 0.73 28.05 248.78 Arizona 43 -0.34 0.67 76.51 435.04 Colorado 44 -0.76 -1.07 52.02 565.04 Oregon 45 -0.47 -1.57 48.22 505.39 Idaho 46 -0.22 -1.6 97.89 503.04 District of Columbia 47 1.12 -2.35 22.76 529.98 Washington 48 -1.51 -2.62 58.64 447.07 California 49 -1.13 -2.86 45.54 295.43 Nevada 50 -2.56 -3.6 56.58 280.41 Utah 51 -2.77 -4.35 71.87 564.73
Purchase-Only FHFA HPI (Seasonally
Period ended 2023 Q1 Census Division Rank 1-Quarter 1-Year 5-Years Since 1991Q1 United States 0.49 4.28 56.06 290.2 South Atlantic Division 1 0.87 7.24 67.49 320.41 East South Central Division 2 1.43 7.21 62.97 269.98 New England Division 3 2.14 6.19 57.46 265.91 East North Central Division 4 1.09 5.26 51.84 214.24 West North Central Division 5 1.17 5.24 48.79 270.08 Middle Atlantic Division 6 0.7 5.03 49.44 239.91 West South Central Division 7 0 4.99 51.8 302.44 Mountain Division 8 -0.78 -0.06 66.92 457.48 Pacific Division 9 -1.12 -2.35 47.98 334.05
FHFA HPI by Census Division Percent Change in House Prices
Adjusted, Nominal)
FHFA HPI by Metropolitan Area Since 1991Q2
Purchase-Only FHFA HPI (Seasonally Adjusted, Nominal) Period ended 2023 Q1 Metropolitan Area Rank 1-Quarter 1-Year 5-Years Since 1991Q1 Missoula, MT 173 -4.25 5.9 77.14 633.62 Austin-Round Rock-Georgetown, TX 235 -1.03 1.27 71.4 610.3 Salt Lake City, UT 220 -0.47 2.88 69.11 591.67 Coeur d'Alene, ID 171 1.31 6.07 100.42 579.43 Bend, OR 230 -1.44 1.94 67.59 575.35 Boulder, CO 222 -1.84 2.79 41.53 572.26 Denver-Aurora-Lakewood, CO 212 0.28 3.48 48.42 549.88 Albany-Lebanon, OR 179 -0.53 5.57 65.06 545.94 Miami-Miami Beach-Kendall, FL (MSAD) 3 1.06 16.82 73.31 545.19 Fort Collins, CO 116 1.55 8.62 51.33 521.86 Provo-Orem, UT 229 -1.09 1.98 69.98 505.65 Boise City, ID 247 -0.9 -2.41 86.91 496.26 Portland-Vancouver-Hillsboro, OR-WA 239 -0.47 0.74 40.35 490.11 Logan, UT-ID 182 -1.65 5.51 83.55 489.63 Ogden-Clearfield, UT 233 -1.67 1.59 73.57 480.35 Naples-Marco Island, FL 2 4.82 17.61 85.19 478.89 Wenatchee, WA 161 0.62 6.57 64 477.75 Greeley, CO 117 2.05 8.58 52.22 473.66 Flagstaff, AZ 199 -0.54 4.31 68.54 462.72 Salem, OR 219 -1.3 3.07 56.38 451.98 Charleston-North Charleston, SC 38 1.57 12.71 64.76 448.34 Grand Junction, CO 93 2.77 9.6 64.22 446.58 Spokane-Spokane Valley, WA 196 -0.3 4.79 82.57 446.18
Percent Change in House Prices
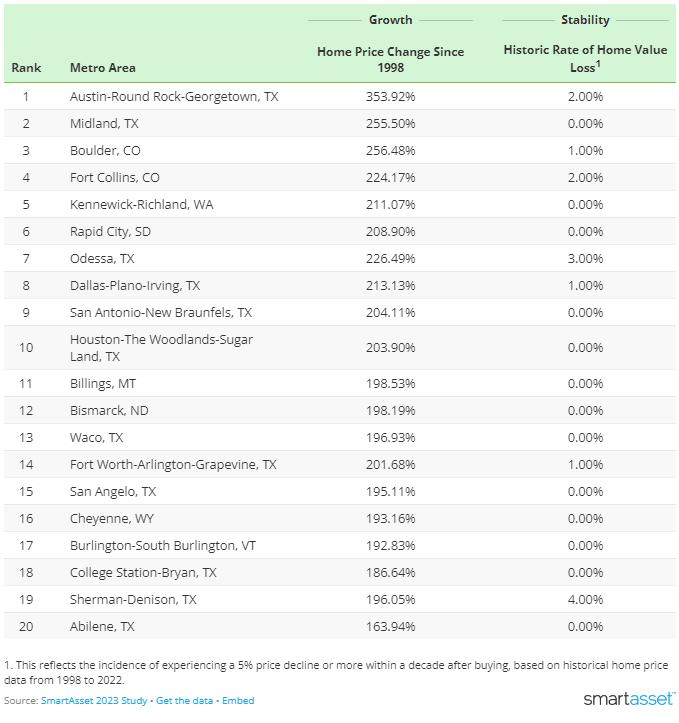
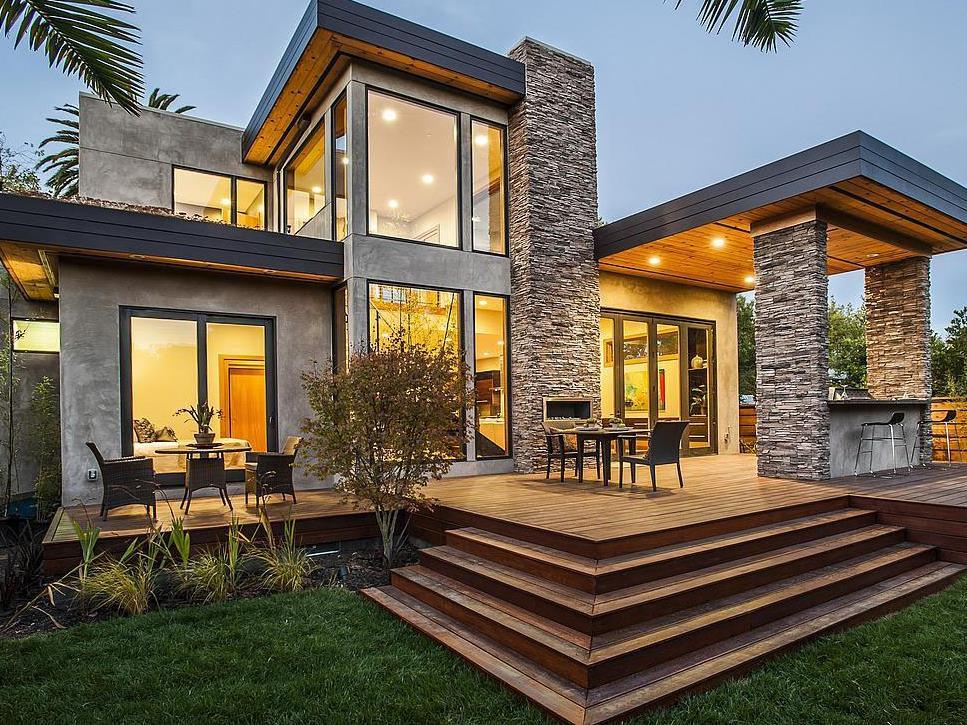
3.Boulder, CO
Home to the University of Colorado’s flagship campus, Boulder ranks third-best for housing market growth and stability. Between 1998 and 2022, home prices rose 256.48%, 33rd-most out of the 400 metro areas. While Boulder hasn’t experienced quite the same population spike as the top two cities for housing and growth, it hosts offices of Google and IBM and has a reputation as a startup city.
Local Statistics By Area

Single-Family
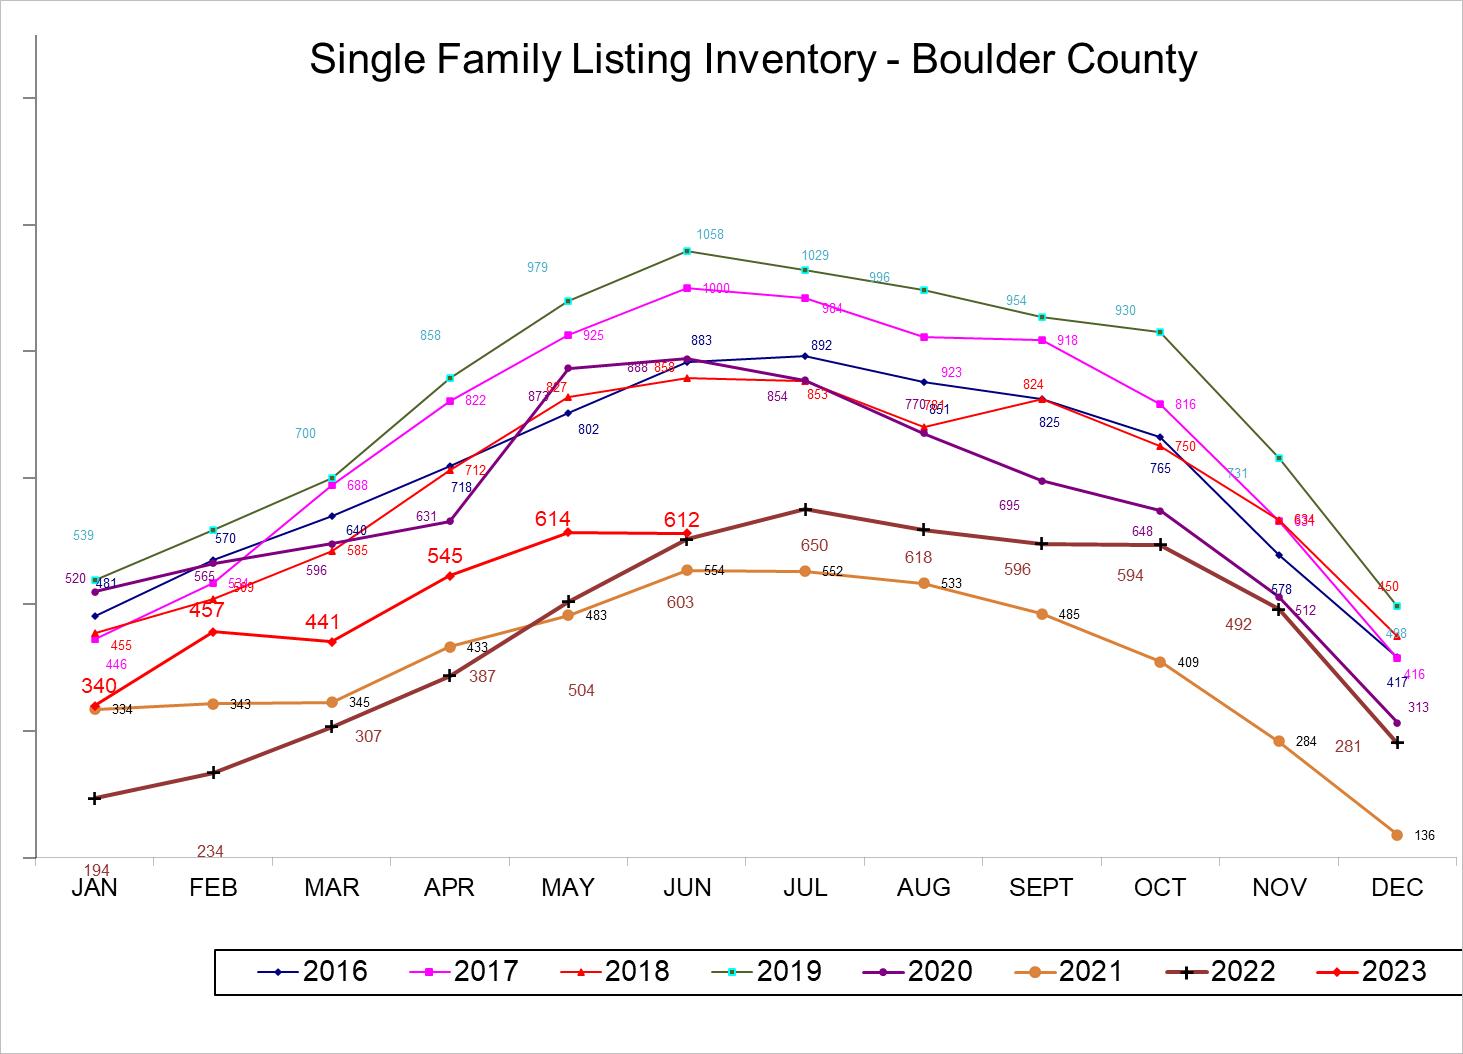
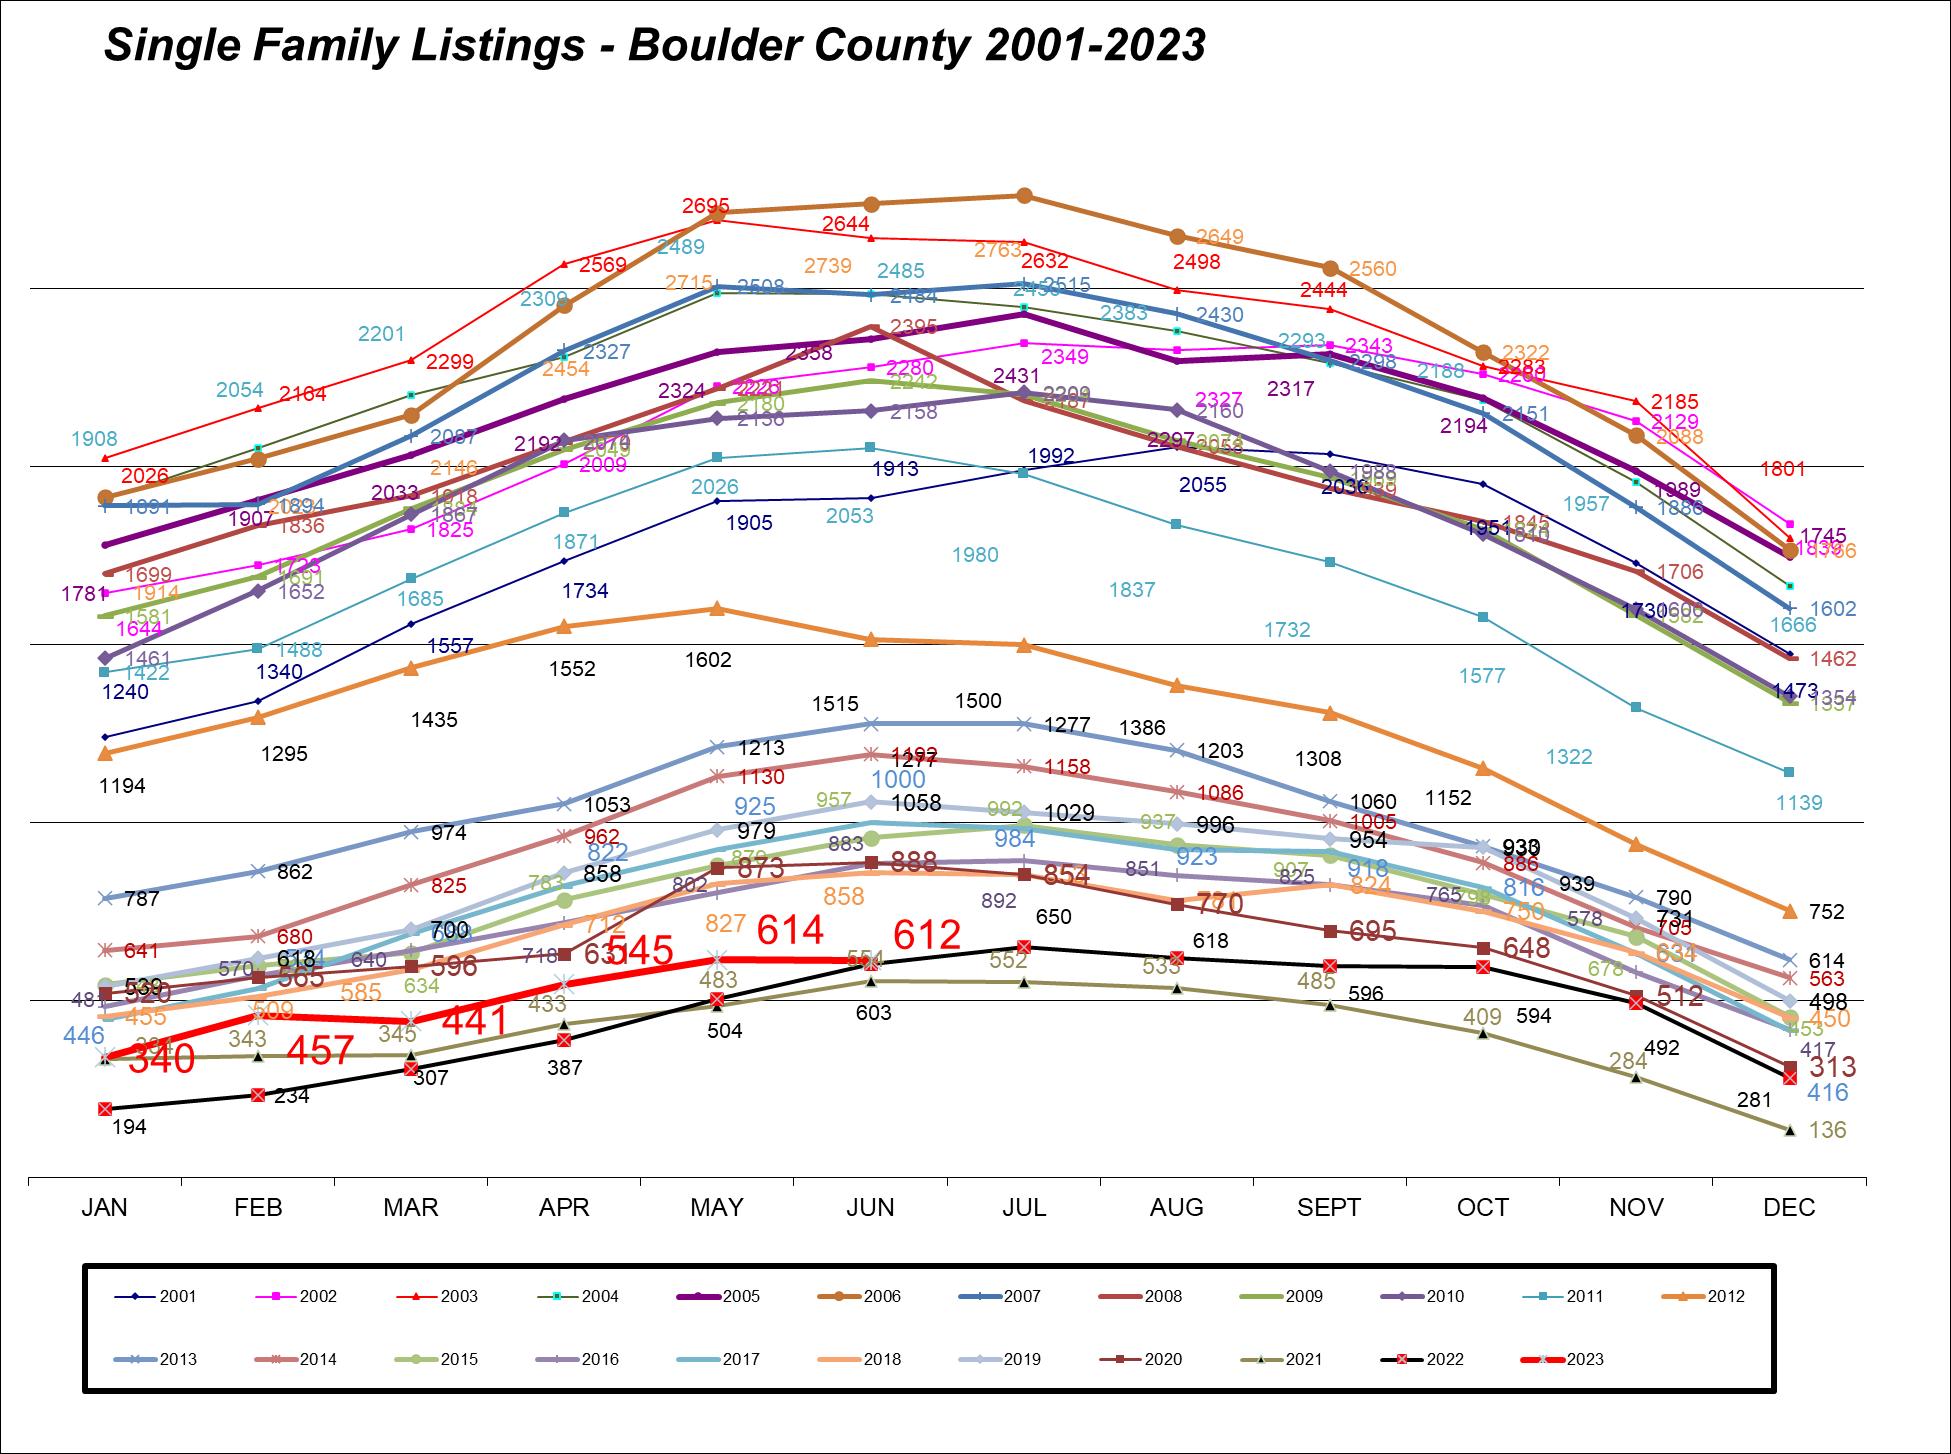
Boulder County
Boulder County Year 2023 % Change Year 2022 2 yr. Change Year 2021 Total Active Listings 612 1.5% 603 10.5% 554 Median Sales Price $887,675 -5.1% $935,000 7.5% $825,500 Average Sales Price $1,211,738 1.3% $1,196,405 14.7% $1,056,066 SP/LP Ratio 98.4% -5.8% 104.4% -3.9% 102.4% Average Market Time 60 76.5% 34 30.4% 46 Number of Sales YTD 984 -20.3% 1234 -35.8% 1532 Expired Listings 270 98.5% 136 37.1% 197 Months of Inventory 3.7 27.6% 2.9 68.2% 2.2 % Under Contract 37% -24.5% 49% -43.1% 65% 30 Year Mortgage 6.71% 21.6% 5.52% 125.2% 2.98% From IRES MLS 7/3/2023
Single Family Q2
Single Family Q2
Boulder County
City of Boulder Year 2023 % Change Year 2022 2 yr. Change Year 2021 Total Active Listings 210 57.9% 133 39.1% 151 Median Sales Price $1,475,000 -1.7% $1,500,000 7.3% $1,375,000 Average Sales Price $1,937,949 8.7% $1,783,275 18.5% $1,636,006 SP/LP Ratio 97.9% -6.1% 104.2% -2.9% 100.8% Average Market Time 58 52.6% 38 13.7% 51 Number of Sales YTD 257 -11.4% 290 -32.7% 382 Expired Listings 75 127.3% 33 5.6% 71 Months of Inventory 4.9 78.2% 2.75 104.2% 2.4 % Under Contract 28% -33.3% 42% -53.3% 60% 30 Year Mortgage 6.71% 21.6% 5.52% 125.2% 2.98% From IRES MLS 7/3/2023
Boulder County
City of Louisville Year 2023 % Change Year 2022 2 yr. Change Year 2021 Total Active Listings 35 2.9% 34 52.2% 23 Median Sales Price $904,500 -13.0% $1,040,000 6.4% $850,000 Average Sales Price $1,011,358 -10.5% $1,130,357 8.1% $935,239 SP/LP Ratio 100.6% -6.9% 108.1% -4.7% 105.6% Average Market Time 49 88.5% 26 75.0% 28 Number of Sales YTD 64 -20.0% 80 -28.9% 90 Expired Listings 10 150.0% 4 66.7% 6 Months of Inventory 3.3 26.9% 2.6 120.0% 1.5 % Under Contract 60% 20.0% 50% -23.1% 78% 30 Year Mortgage 6.71% 21.6% 5.52% 125.2% 2.98% From IRES MLS 7/3/2023
Single Family Q2
Boulder County
City of Lafayette Year 2023 % Change Year 2022 2 yr. Change Year 2021 Total Active Listings 37 -28.8% 52 2.8% 36 Median Sales Price $840,000 -13.5% $971,185 8.9% $771,000 Average Sales Price $929,692 -11.1% $1,046,071 16.2% $800,028 SP/LP Ratio 99.7% -7.0% 107.2% -5.2% 105.2% Average Market Time 43 19.4% 36 -14.0% 50 Number of Sales YTD 63 -33.7% 95 -46.6% 118 Expired Listings 20 100.0% 10 53.8% 13 Months of Inventory 3.5 6.1% 3.3 94.4% 1.8 % Under Contract 49% 6.5% 46% -34.7% 75% 30 Year Mortgage 6.71% 21.6% 5.52% 125.2% 2.98% From IRES MLS 7/3/2023
Single Family Q2
Single Family Q2
Boulder County
City of Longmont Year 2023 % Change Year 2022 2 yr. Change Year 2021 Total Active Listings 156 6.1% 147 9.9% 142 Median Sales Price $615,000 -3.1% $635,000 17.1% $525,000 Average Sales Price $669,791 -1.7% $681,475 16.7% $573,925 SP/LP Ratio 99.5% -6.3% 106.2% -5.1% 104.9% Average Market Time 54 107.7% 26 68.8% 32 Number of Sales YTD 321 -17.9% 391 -34.4% 489 Expired Listings 62 158.3% 24 100.0% 31 Months of Inventory 2.9 26.1% 2.3 70.6% 1.7 % Under Contract 46% -23.3% 60% -41.8% 79% 30 Year Mortgage 6.71% 21.6% 5.52% 125.2% 2.98% From IRES MLS 7/3/2023
Single Family Q2
Boulder County
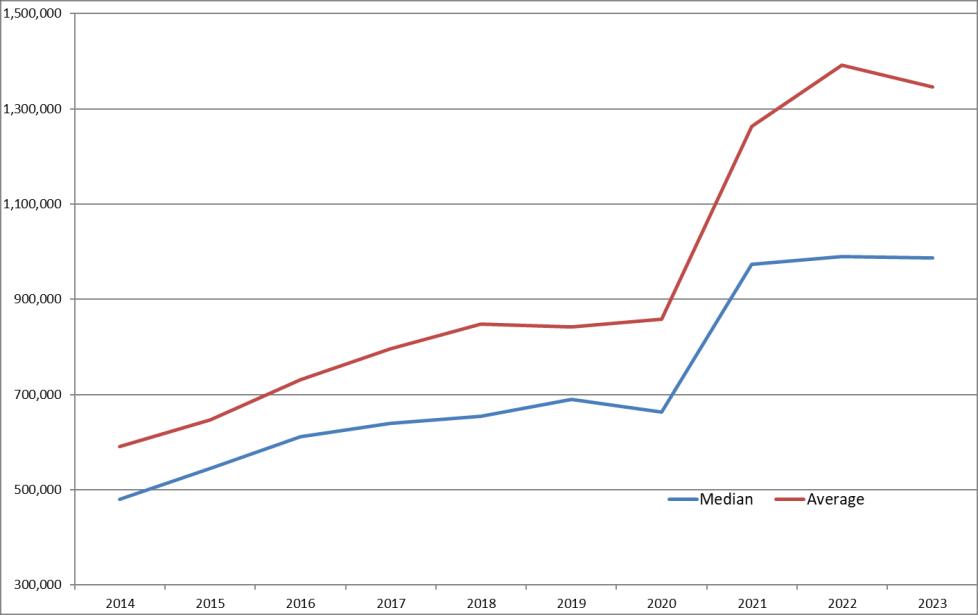
Suburban Plains Year 2023 % Change Year 2022 2 yr. Change Year 2021 Total Active Listings 124 17.0% 106 11.7% 111 Median Sales Price $987,000 -0.3% $990,000 4.2% $947,000 Average Sales Price $1,345,570 -3.3% $1,391,777 6.6% $1,262,471 SP/LP Ratio 97.9% -4.2% 102.2% -3.5% 101.5% Average Market Time 71 69.0% 42 24.6% 57 Number of Sales YTD 163 -29.4% 231 -35.1% 251 Expired Listings 61 144.0% 25 35.6% 45 Months of Inventory 4.6 64.3% 2.8 70.4% 2.7 % Under Contract 31% -41.5% 53% -49.2% 61% 30 Year Mortgage 6.71% 21.6% 5.52% 125.2% 2.98% From IRES MLS 7/3/2023
Single Family Q2
Boulder County
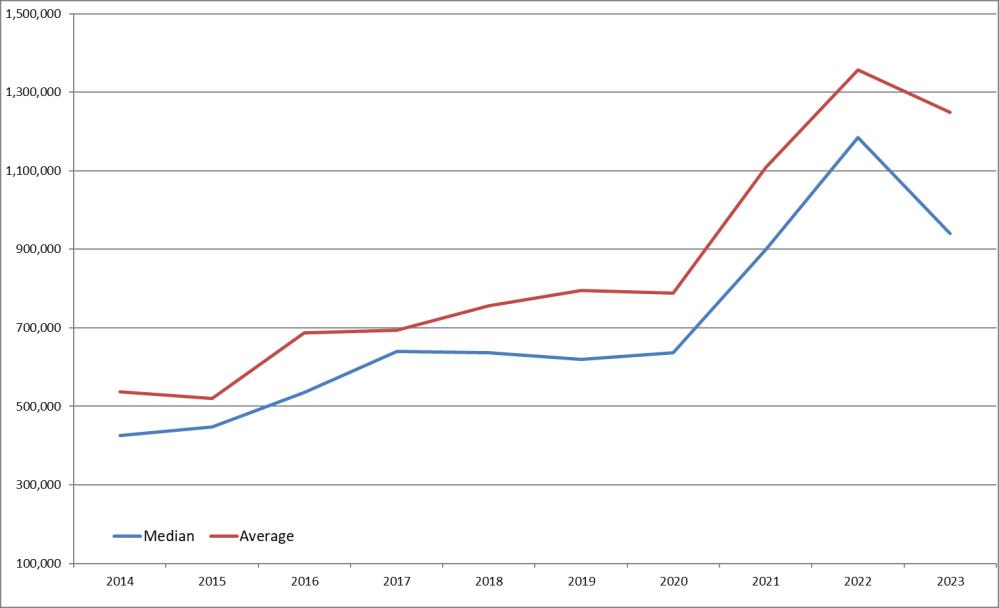
Suburban Mountains Year 2023 % Change Year 2022 2 yr. Change Year 2021 Total Active Listings 78 30.0% 60 20.0% 65 Median Sales Price $940,000 -20.7% $1,185,500 4.4% $900,000 Average Sales Price $1,249,235 -7.9% $1,356,724 12.7% $1,108,863 SP/LP Ratio 97.5% -4.6% 102.2% -4.1% 101.6% Average Market Time 100 117.4% 46 35.1% 74 Number of Sales YTD 81 -13.8% 94 -47.7% 155 Expired Listings 33 -2.9% 34 13.8% 29 Months of Inventory 5.8 52.6% 3.8 132.0% 2.5 % Under Contract 31% -16.2% 37% -27.9% 43% 30 Year Mortgage 6.71% 21.6% 5.52% 125.2% 2.98% From IRES MLS 7/3/2023
Boulder County
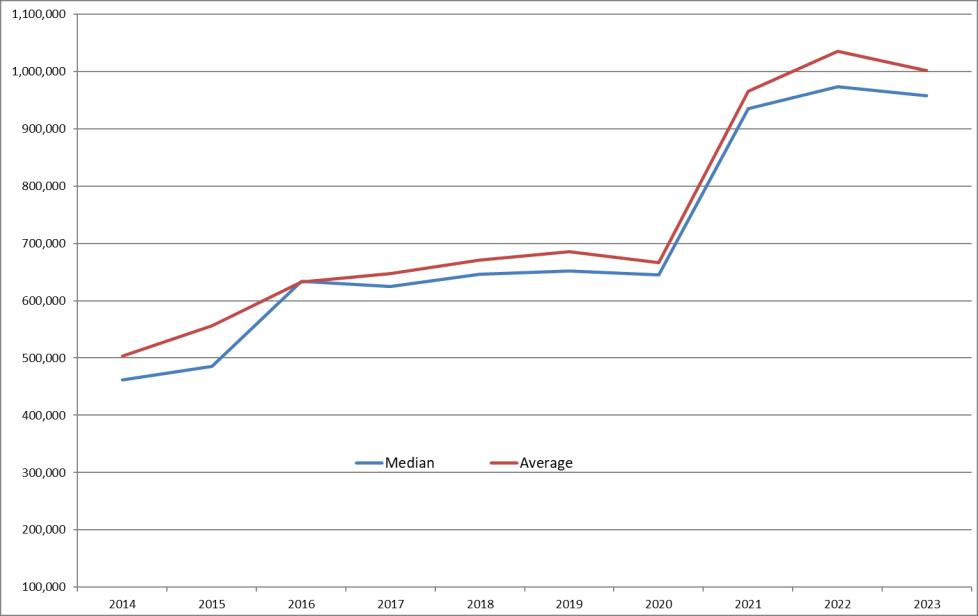
Town of Superior Year 2023 % Change Year 2022 2 yr. Change Year 2021 Total Active Listings 16 -20.0% 20 6.7% 15 Median Sales Price $958,000 -1.5% $973,000 2.5% $935,000 Average Sales Price $1,001,591 -3.2% $1,035,032 3.8% $965,255 SP/LP Ratio 98.6% -7.7% 106.8% -10.6% 110.3% Average Market Time 55 120.0% 25 66.7% 33 Number of Sales YTD 32 -31.9% 47 -25.6% 43 Expired Listings 7 40.0% 5 600.0% 1 Months of Inventory 3 15.4% 2.6 42.9% 2.1 % Under Contract 63% 80.0% 35% -13.7% 73% 30 Year Mortgage 6.71% 21.6% 5.52% 125.2% 2.98% From IRES MLS 7/3/2023
Single Family Q2
Boulder County
City
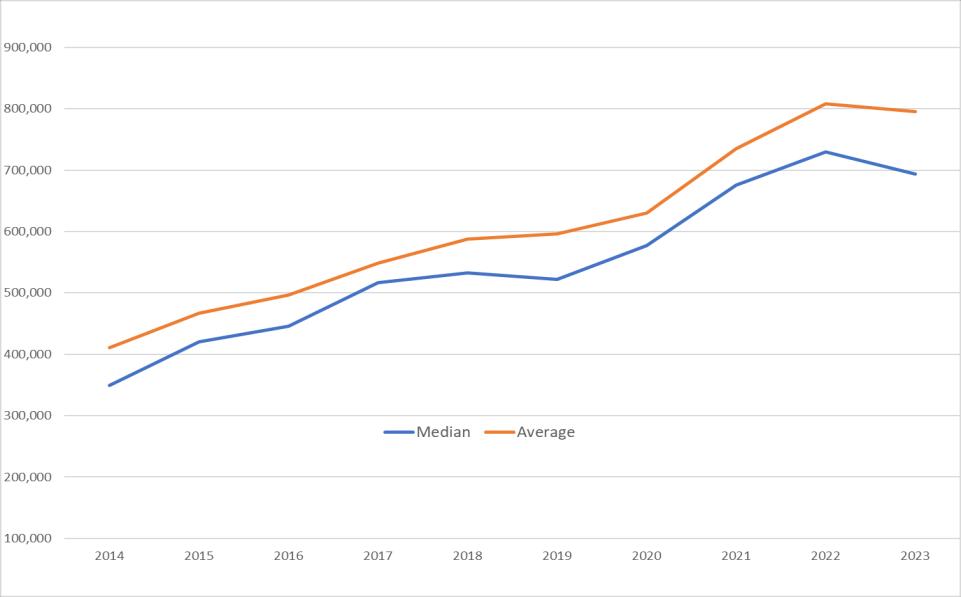
Broomfield Year 2023 % Change Year 2022 2 yr. Change Year 2021 Total Active Listings 149 Median Sales Price $693,500 -5.0% $730,000 2.6% $676,000 Average Sales Price $795,661 -1.6% $808,583 8.2% $735,054 SP/LP Ratio 99.3% -5.5% 105.1% -4.5% 104.0% Average Market Time 38 81.0% 21 0.0% 38 Number of Sales YTD 362 Expired Listings 57 Months of Inventory 2.5 -10.7% % Under Contract 52% 136.4% 22% -22.4% 67% 30 Year Mortgage 6.71% 21.6% 5.52% 125.2% 2.98% RECO added to IRES MLS 7/3/2023 *
Single Family Q2
of
Boulder County
Town of Erie Year 2023 % Change Year 2022 2 yr. Change Year 2021 Total Active Listings 203 Median Sales Price $731,000 -10.9% $820,000 6.7% $685,000 Average Sales Price $794,214 -9.9% $881,031 5.4% $753,281 SP/LP Ratio 99.1% -5.5% 104.9% -4.8% 104.1% Average Market Time 49 96.0% 25 36.1% 36 Number of Sales YTD 267 Expired Listings 53 Months of Inventory 4.6 84.0% 2.5 84.0% 2.5 % Under Contract 50% 19.0% 42% -20.6% 63% 30 Year Mortgage 6.71% 27.8% 5.25% 125.2% 2.98% RECO added to IRES MLS 7/3/2023 *
Single Family Q2
Single-Family Recap
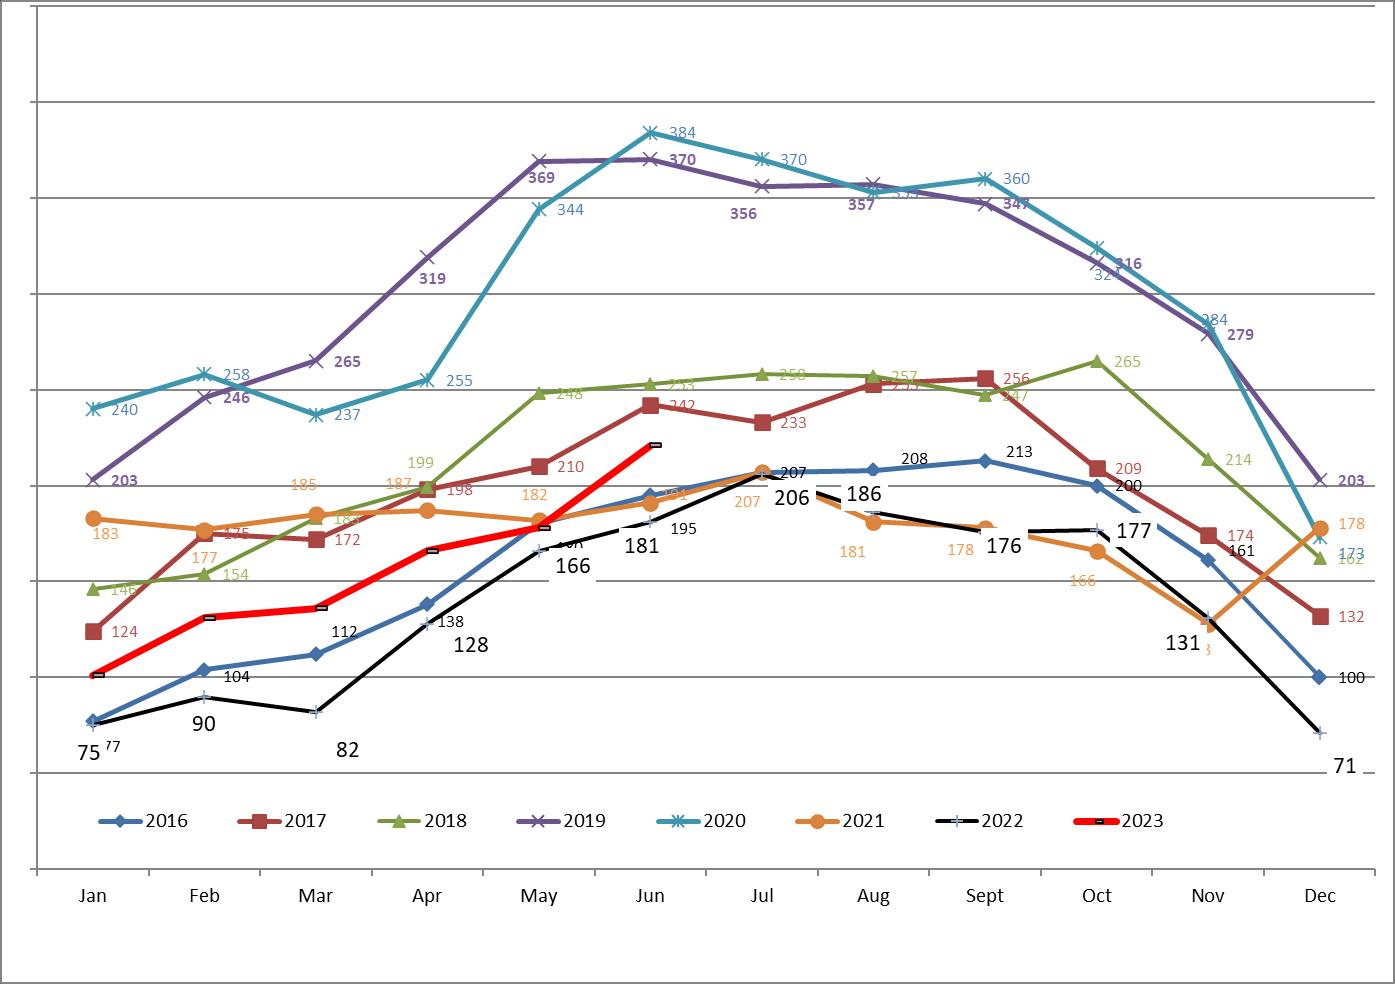
NUMBER OF SINGLE-FAMILY HOMES SOLD - THROUGH 2ND QTR 2023 2018 2019 2020 2021 2022 2023 Boulder 332 317 268 382 290 257 Louisville 97 116 92 90 80 64 Lafayette 136 157 128 118 95 63 Longmont 517 549 547 489 391 321 Plains 333 294 252 251 231 163 Mountains 116 113 93 155 94 81 Superior 46 54 52 43 47 32 Bldr County 1578 1613 1447 1532 1234 984 Broomfield 218 224 178 129 101 362* Erie 222 240 232 144 154 267*
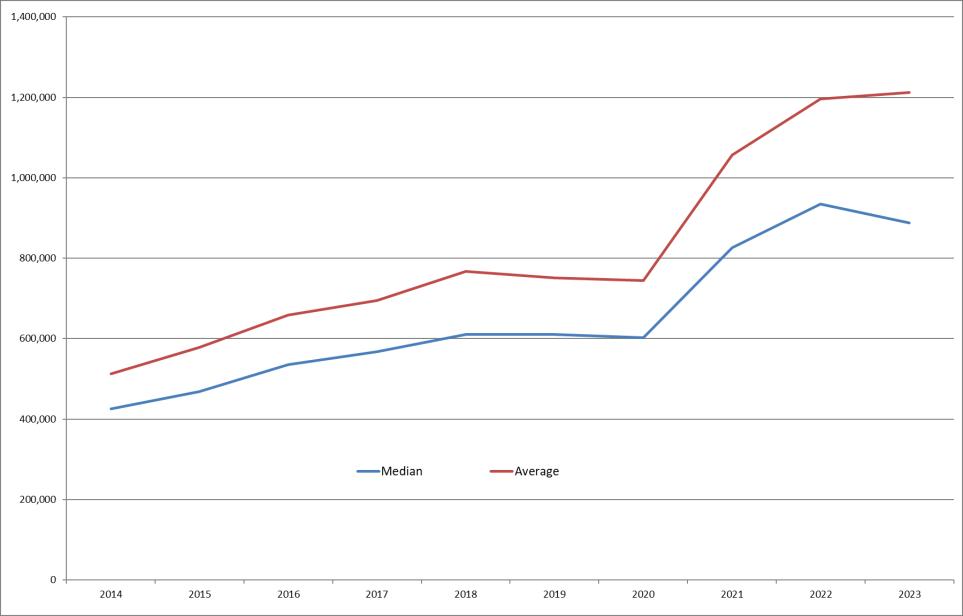
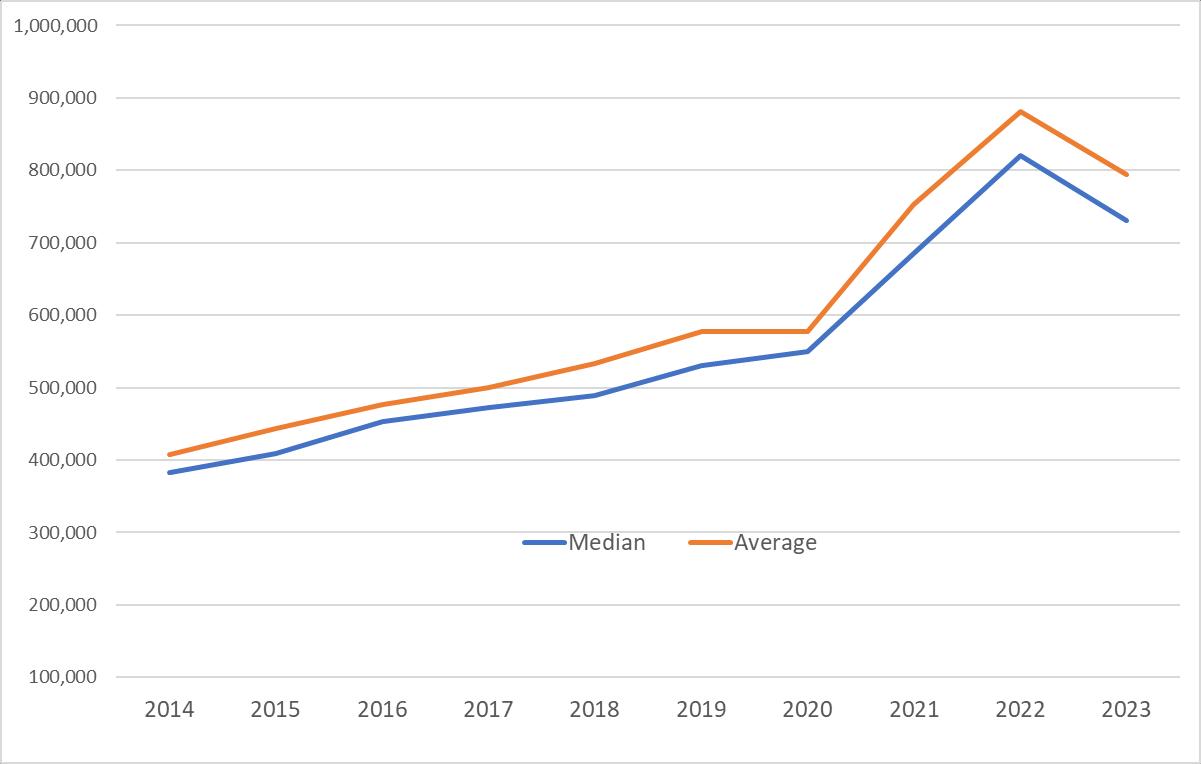
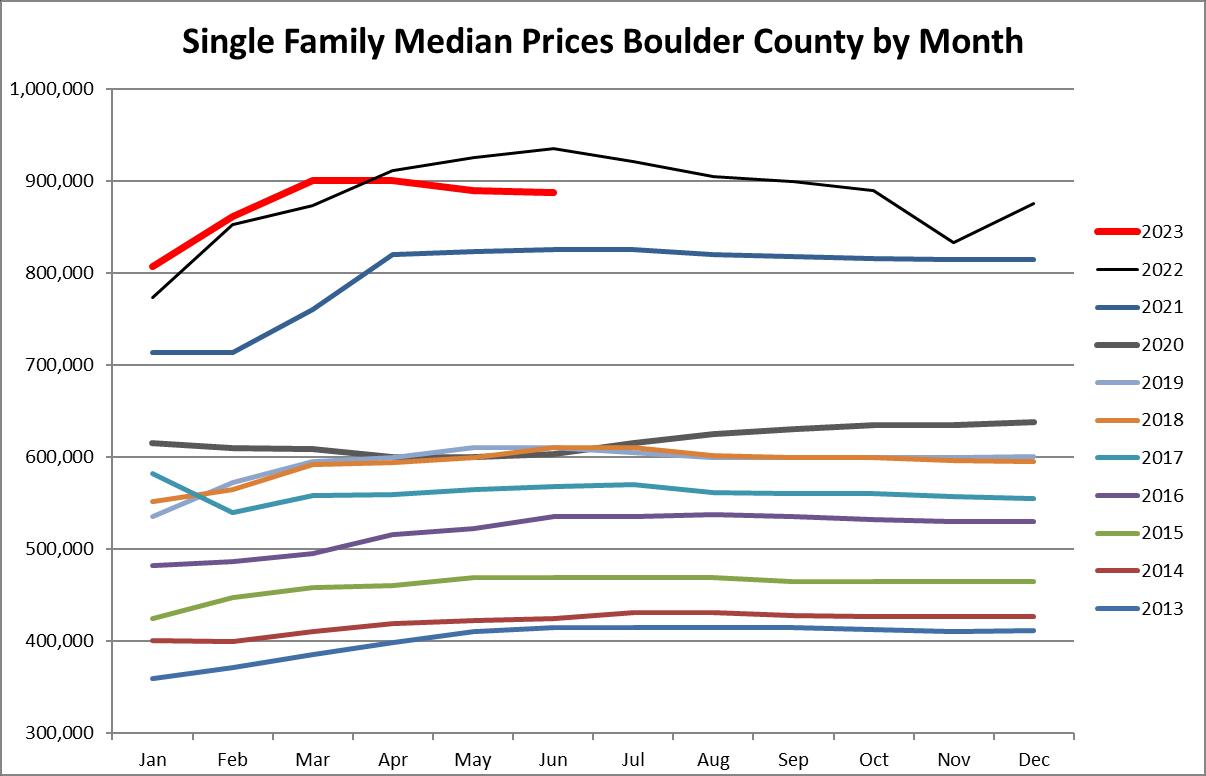
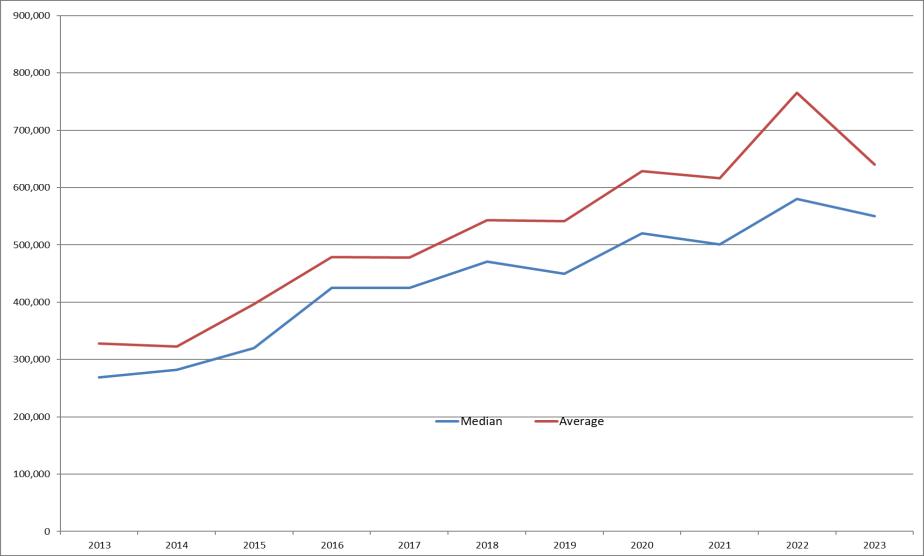
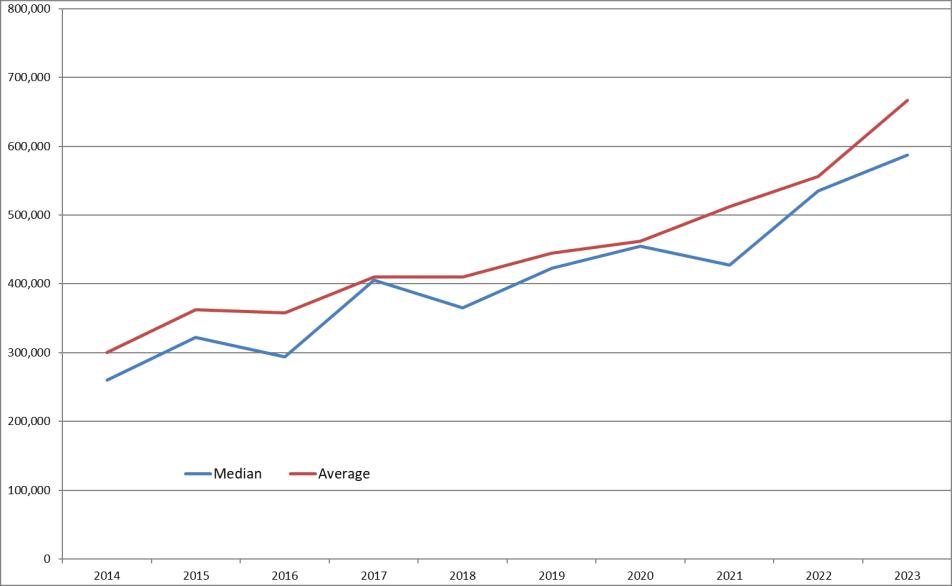
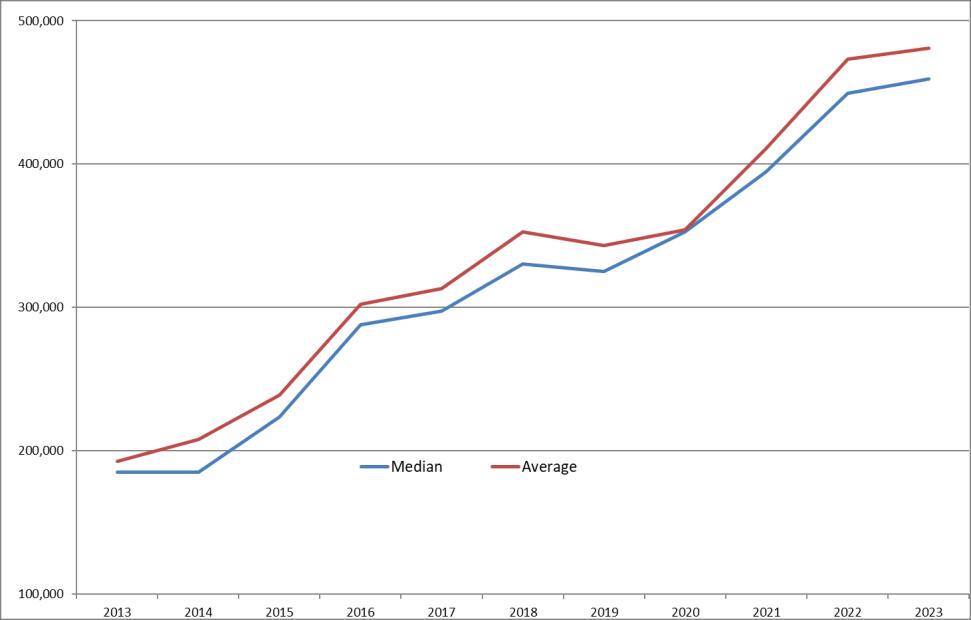
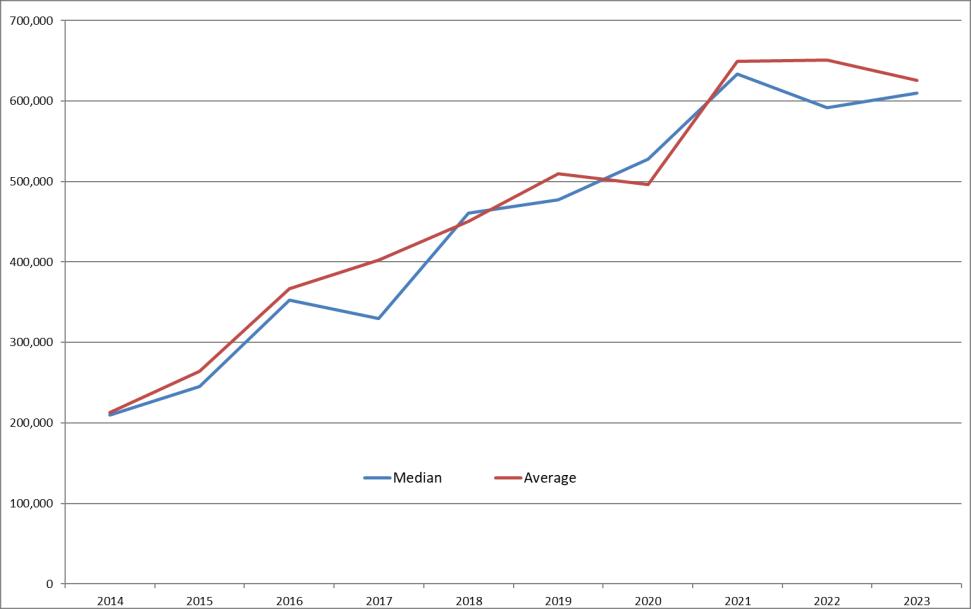
Single-Family Median Sales Prices Through 2nd Qtr
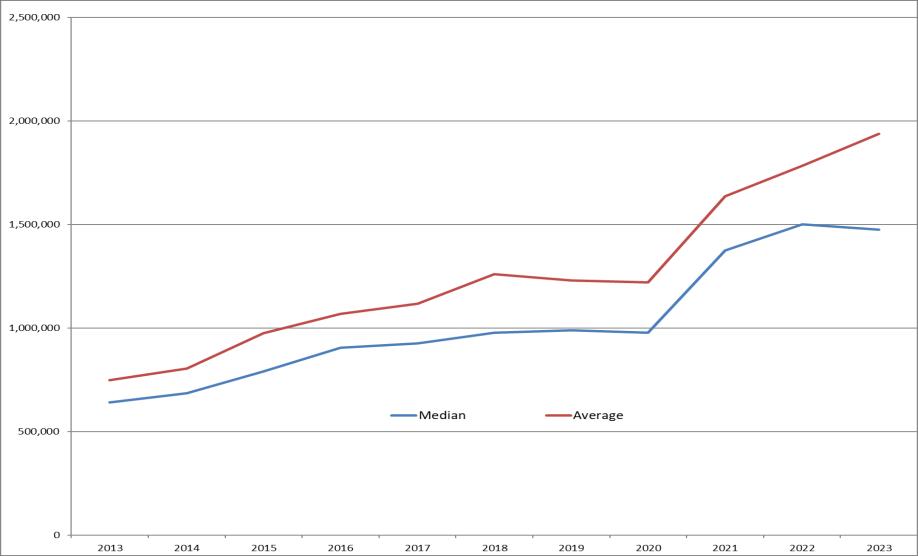
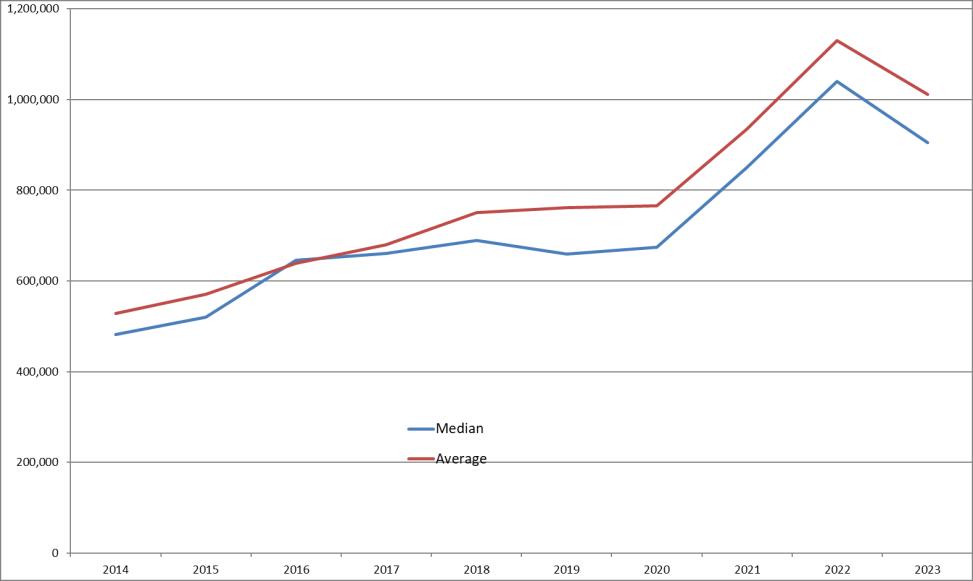
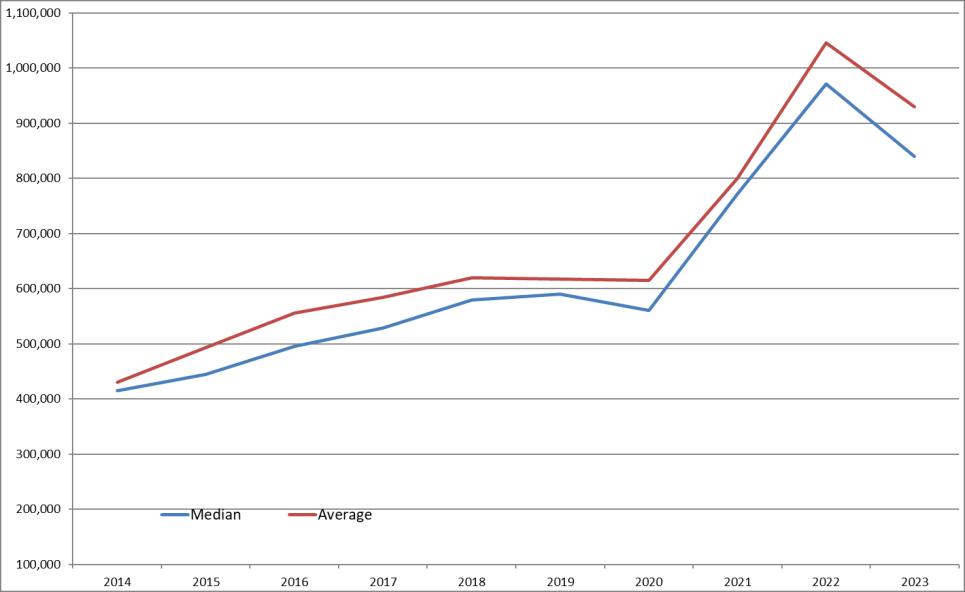
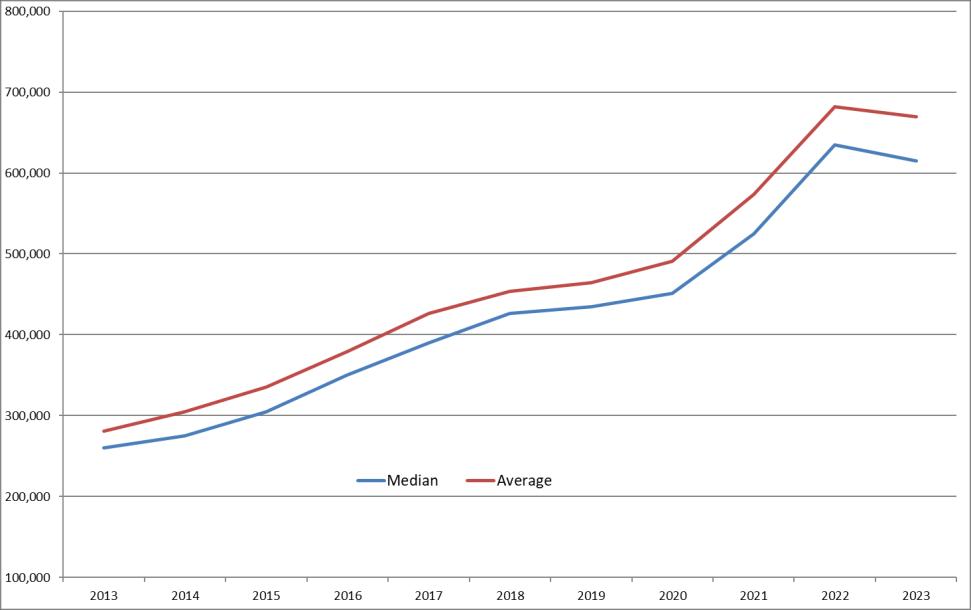
2017 2018 2019 2020 2021 2022 2023 Boulder $925,000 $977,500 $990,000 $977,500 $1,375,000 $1,500,000 $1,475,000 Louisville 661,000 689,000 660,000 675,000 850,000 1,040,000 904,500 Lafayette 528,000 580,000 590,000 560,000 771,000 971,185 840,000 Longmont 390,000 426,000 435,000 451,000 525,000 635,000 615,000 Plains 639,950 654,900 689,000 663,500 947,000 990,000 987,000 Mountains 640,000 637,350 619,000 636,000 900,000 1,185,500 940,000 Superior 625,000 646,250 652,000 644,500 935,000 973,000 958,000 Bldr County 567,500 610,000 609,900 602,921 825,500 935,000 887,675 Broomfield 516,500 532,500 522,500 577,000 676,000 730,000 693,500 Erie 473,000 498,150 530,000 550,000 685,000 820,000 731,000
Single Family
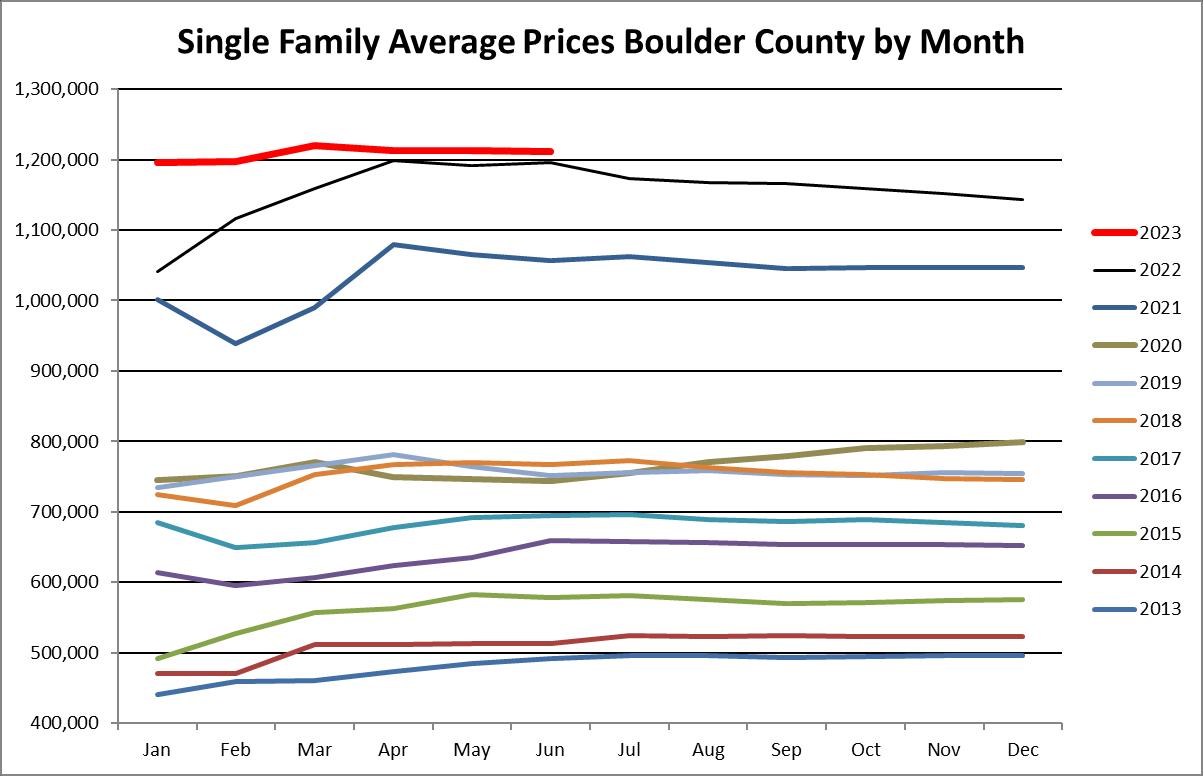
Sales Price -
2nd Quarter 2017 2018 2019 2020 2021 2022 2023 Boulder $1,117,549 $1,259,337 $1,229,760 $1,221,070 $1,636,006 $1,783,275 $1,937,949 Louisville 679,862 751,442 761,190 765,363 935,239 1,130,357 1,011,358 Lafayette 584,030 619,897 617,300 615,150 800,028 1,046,071 929,692 Longmont 426,216 453,951 464,780 490,823 573,925 681,475 669,791 Plains 795,878 847,921 842,650 858,213 1,262,471 1,391,777 1,345,570 Mountains 694,316 756,396 794,636 788,180 1,108,863 1,356,724 1,249,235 Superior 646,896 670,409 685,800 666,575 965,255 1,035,032 1,001,591 Bldr County 694,826 767,710 751,260 744,200 1,056,066 1,196,405 1,211,738 Broomfield 548,103 587,322 595,833 630,250 735,054 808,583 795,661 Erie 500,276 533,628 577,400 577,860 753,281 881,031 794,214
Average
Through
Percent of Single-Family Homes U/C - 1st Qtr 2023 2015 2016 2017 2018 2019 2020 2021 2022 2023 Boulder 58 49 43 48 39 36 58 63 33 Louisville 67 49 47 65 51 50 71 83 58 Lafayette 71 65 47 60 47 63 80 78 38 Longmont 70 70 49 69 52 66 84 87 55 Plains 46 45 44 41 38 50 74 67 35 Mountains 37 28 28 47 39 26 57 48 29 Superior 56 23 46 64 68 61 91 78 36 Boulder County 57 53 50 55 45 51 71 72 40
 This representation is based in whole or in part on data supplied by IRES MLS for the time period above
PRICE RANGE # SOLD # ON MARKET MONTHS OF INVENTORY # Listed 2nd Qtr 2023 $0 - $99,999 11 4 0 1 $100,000 - 149,999 16 13 2 6 $150,000 - 199,999 24 23 0 15 $200,000 - 249,999 46 23 0 20 $250,000 - 299,999 50 35 2 25 $300,000 - 349,999 92 30 1 20 $350,000 - 399,999 156 51 1 42 $400,000 - 449,999 311 64 1 59 $450,000 - 499,999 383 136 1 120 $500,000 - 549,999 361 157 1 132 $550,000 - 599,999 305 150 1 133 $600,000 - 649,999 239 127 2 111 $650,000 - 699,999 168 102 2 89 $700,000 - 749,999 142 73 2 62 $750,000 - 799,999 137 95 2 87 $800,000 - 849,999 98 75 2 65 $850,000 - 899,999 90 77 3 61 $900,000 - 949,999 61 50 2 39 $950,000 - 999,999 65 64 3 48 $1,000,000 - 1,099,999 72 46 2 34 $1,100,000 - 1,199,999 70 51 2 38 $1,200,000 - 1,299,999 59 47 2 41 $1,300,000 - 1,399,999 51 32 2 26 $1,400,000 - 1,499,999 35 30 3 24 $1,500,000 - 1,599,999 33 20 2 19 $1,600,000 - 1,699,999 26 26 3 20 $1,700,000 - 1,799,999 14 16 3 13 $1,800,000 - 1,899,999 16 27 5 20 $1,900,000 - 1,999,999 9 19 6 11 $2,000,000 - 84 210 8 140 TOTALS: 3224 1873 1.74 1521
Prepared by RE/MAX of Boulder, Inc. For Boulder County on July 10, 2023
Multi-Family
Boulder County Attached Dwelling Listing Inventory
Attached Dwelling Q2
Boulder County
Boulder County Year 2023 % Change Year 2022 2 yr. Change Year 2021 Total Active Listings 221 22.1% 181 15.7% 191 Median Sales Price $495,000 -3.9% $515,000 11.2% $445,000 Average Sales Price $565,387 -12.0% $642,336 5.7% $535,030 SP/LP Ratio 99.6% -3.8% 103.6% -1.2% 100.8% Average Market Time 56 14.3% 49 -5.1% 59 Number of Sales YTD 407 -24.6% 540 -41.8% 699 Expired Listings 62 47.6% 42 -38.0% 100 Months of Inventory 3.3 65.0% 2 106.3% 1.6 % Under Contract 37% -32.7% 55% -51.3% 76% 30 Year Mortgage 6.71% 21.6% 5.52% 125.2% 2.98% From IRES MLS 7/3/2023
Boulder County
City of Boulder Year 2023 % Change Year 2022 2 yr. Change Year 2021 Total Active Listings 115 -22.8% 149 -27.2% 158 Median Sales Price $550,000 -5.2% $580,000 9.8% $501,000 Average Sales Price $639,773 -16.5% $765,737 3.9% $615,957 SP/LP Ratio 99.5% -3.4% 103.0% -0.5% 100.0% Average Market Time 52 -14.8% 61 -26.8% 71 Number of Sales YTD 182 -35.7% 283 -50.1% 365 Expired Listings 29 20.8% 24 -60.3% 73 Months of Inventory 3.8 18.8% 3.2 46.2% 2.6 % Under Contract 24% -55.6% 54% -63.6% 66% 30 Year Mortgage 6.71% 21.6% 5.52% 125.2% 2.98% From IRES MLS 7/3/2022
Attached Dwelling Q2
Attached Dwelling Q2
Boulder County
City of Louisville Year 2023 % Change Year 2022 2 yr. Change Year 2021 Total Active Listings 13 85.7% 7 -43.5% 23 Median Sales Price $586,850 9.7% $535,000 37.4% $427,000 Average Sales Price $666,899 20.0% $555,972 30.1% $512,449 SP/LP Ratio 98.8% -6.9% 106.1% -1.5% 100.3% Average Market Time 49 113.0% 23 22.5% 40 Number of Sales YTD 18 -21.7% 23 -21.7% 23 Expired Listings 4 300.0% 1 --- 0 Months of Inventory 4.3 138.9% 1.8 -28.3% 6 % Under Contract 31% 6.9% 29% -62.7% 83% 30 Year Mortgage 6.71% 21.6% 5.52% 125.2% 2.98% From IRES MLS 7/3/2023
Attached Dwelling Q2
Boulder County
City of Lafayette Year 2023 % Change Year 2022 2 yr. Change Year 2021 Total Active Listings 18 -14.3% 21 -56.1% 41 Median Sales Price $492,500 -4.6% $516,065 5.9% $465,000 Average Sales Price $485,739 -4.0% $505,784 7.4% $452,433 SP/LP Ratio 100.5% -5.0% 105.8% -2.8% 103.4% Average Market Time 53 -7.0% 57 15.2% 46 Number of Sales YTD 44 -13.7% 51 -41.3% 75 Expired Listings 5 66.7% 3 150.0% 2 Months of Inventory 2.5 0.0% 2.5 -23.8% 3.28 % Under Contract 67% 40.1% 48% -24.0% 88% 30 Year Mortgage 6.71% 21.6% 5.52% 125.2% 2.98% From IRES MLS 7/3/2023
Boulder County
City of Longmont Year 2023 % Change Year 2022 2 yr. Change Year 2021 Total Active Listings 111 105.6% 54 200.0% 37 Median Sales Price $459,500 2.2% $449,500 16.4% $394,856 Average Sales Price $480,799 1.6% $473,339 17.0% $411,043 SP/LP Ratio 100.0% -4.3% 104.5% -2.7% 102.8% Average Market Time 74 196.0% 25 89.7% 39 Number of Sales YTD 96 -12.7% 110 -27.3% 132 Expired Listings 15 50.0% 10 -6.3% 16 Months of Inventory 6.9 137.9% 2.9 305.9% 1.7 % Under Contract 48% -24.3% 63% -44.9% 87% 30 Year Mortgage 6.71% 21.6% 5.52% 125.2% 2.98% From IRES MLS 7/3/2023
Attached Dwelling Q2
Attached Dwelling Q2
Boulder County
Suburban Plains Year 2023 % Change Year 2022 2 yr. Change Year 2021 Total Active Listings 11 -15.4% 13 -57.7% 26 Median Sales Price $433,000 1.1% $428,500 17.6% $368,250 Average Sales Price $446,442 -8.9% $489,892 13.3% $394,167 SP/LP Ratio 99.7% -3.8% 103.6% -1.3% 101.0% Average Market Time 33 6.5% 31 -31.3% 48 Number of Sales YTD 39 -13.3% 45 -44.3% 70 Expired Listings 5 --- 0 -16.7% 6 Months of Inventory 1.7 -32.0% 2.5 -22.7% 2.2 % Under Contract 27% -40.9% 46% -65.9% 80% 30 Year Mortgage 6.71% 21.6% 5.52% 125.2% 2.98% From IRES MLS 7/3/2023
Boulder County
Town of Superior Year 2023 % Change Year 2022 2 yr. Change Year 2021 Total Active Listings 12 -40.0% 20 -61.3% 31 Median Sales Price $610,000 3.0% $592,111 -3.7% $633,600 Average Sales Price $625,382 -3.9% $651,070 -3.7% $649,244 SP/LP Ratio 99.2% -4.7% 104.1% -1.0% 100.2% Average Market Time 73 82.5% 40 23.7% 59 Number of Sales YTD 25 0.0% 25 -21.9% 32 Expired Listings 4 0.0% 4 --- 3 Months of Inventory 2.9 -39.6% 4.8 -50.0% 5.8 % Under Contract 33% -39.5% 55% -61.8% 87% 30 Year Mortgage 6.71% 21.6% 5.52% 125.2% 2.98% From IRES MLS 7/3/2023
Attached Dwelling Q2
Boulder County
City of Broomfield Year 2023 % Change Year 2022 2 yr. Change Year 2021 Total Active Listings 70* 536.4% 11 218.2% 22 Median Sales Price $552,495 5.2% $525,250 22.8% $450,000 Average Sales Price $522,599 1.5% $514,713 19.9% $435,840 SP/LP Ratio 99.1% -4.8% 104.1% -3.5% 102.7% Average Market Time 64 120.7% 29 68.4% 38 Number of Sales YTD 122* 238.9% 36 159.6% 47 Expired Listings 13* 550.0% 2 333.3% 3 Months of Inventory 3.4* 88.9% 1.8 21.4% 2.8 % Under Contract 46% 70.4% 27% -28.1% 64% 30 Year Mortgage 6.71% 21.6% 5.52% 125.2% 2.98% RECO added to IRES MLS 7/3/2023 *
Attached Dwelling Q2
Boulder County
Town of Erie Year 2023 % Change Year 2022 2 yr. Change Year 2021 Total Active Listings 28* 250.0% 8 211.1% 9 Median Sales Price $530,000 32.5% $400,000 22.5% $432,500 Average Sales Price $510,896 8.9% $468,989 18.5% $431,052 SP/LP Ratio 98.8% -4.2% 103.1% -2.2% 101.0% Average Market Time 73 151.7% 29 97.3% 37 Number of Sales YTD 61* 258.8% 17 134.6% 26 Expired Listings 8* --- 0 --- 0 Months of Inventory 2.8* 0.0% 2.8 33.3% 2.1 % Under Contract 36% -28.0% 50% -53.8% 78% 30 Year Mortgage 6.71% 21.6% 5.52% 125.2% 2.98% RECO added to IRES MLS 7/3/2023 *
Attached Dwelling Q2
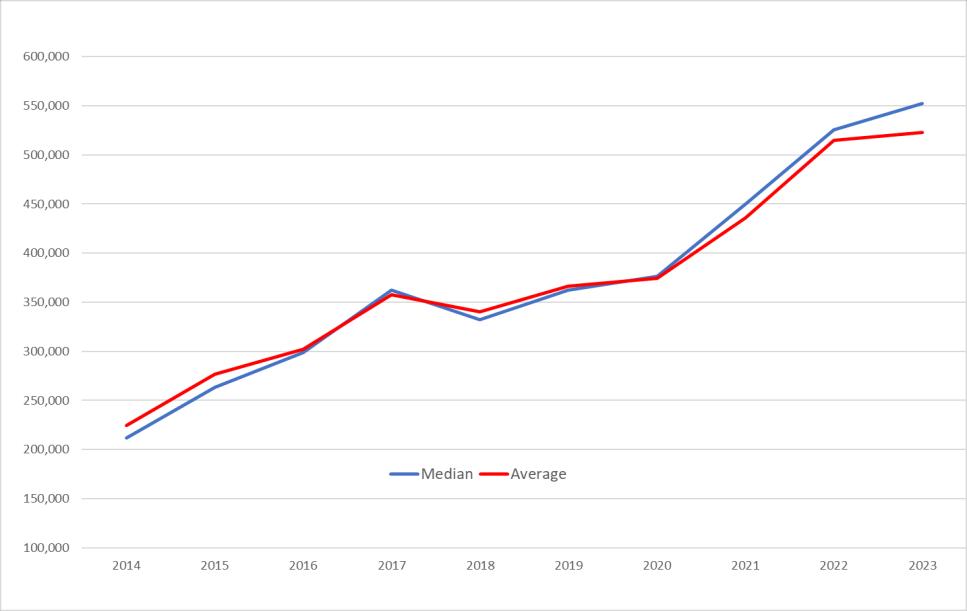
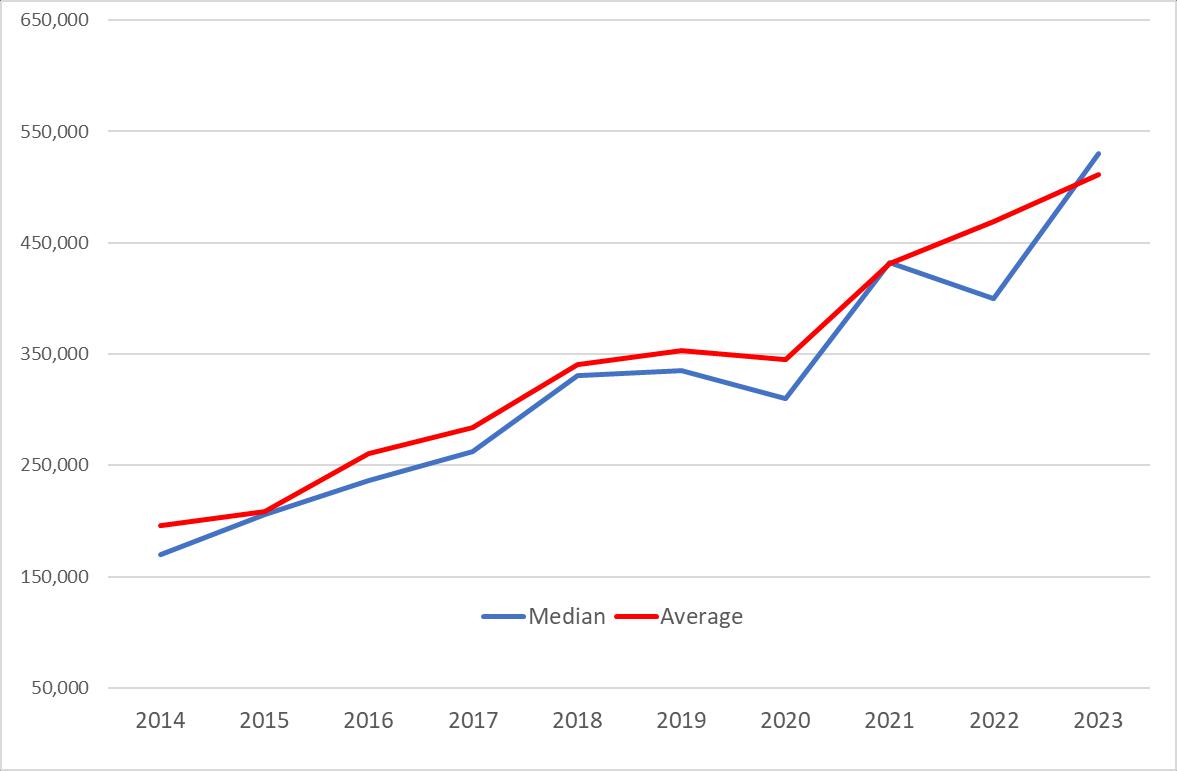
Multi-Family Recap
Attached Dwelling Sold by Area - Through 2nd Quarter 2017 2018 2019 2020 2021 2022 2023 Boulder 289 317 256 261 365 283 182 Louisville 33 33 38 41 23 23 18 Lafayette 55 65 75 57 75 51 44 Longmont 169 164 174 160 132 110 96 Plains 60 67 65 51 70 45 39 Superior 25 46 30 17 32 25 25 Bldr County 633 693 640 589 699 540 407
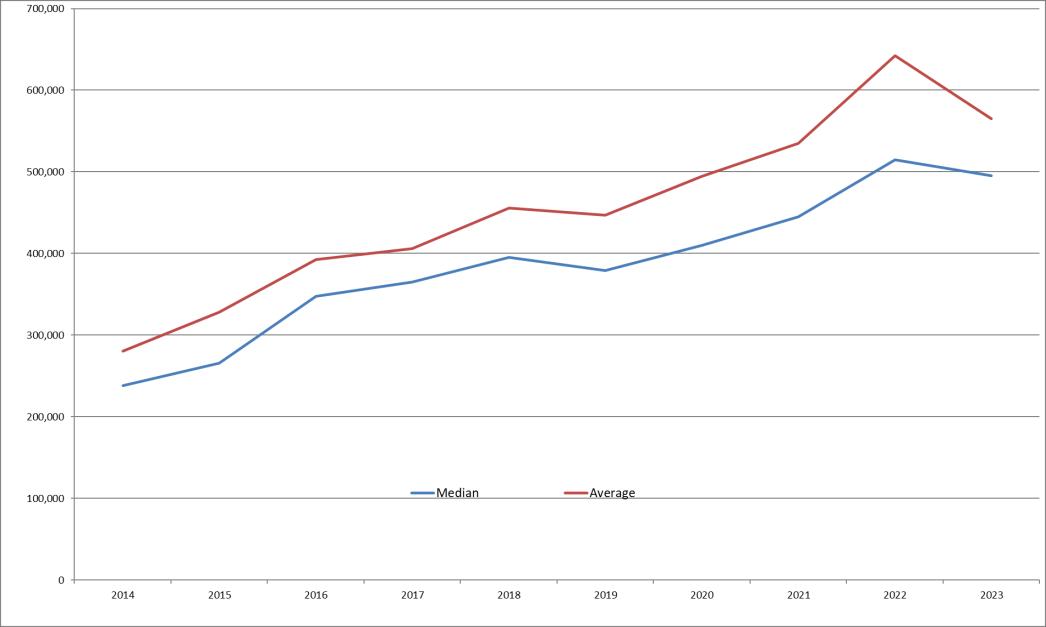
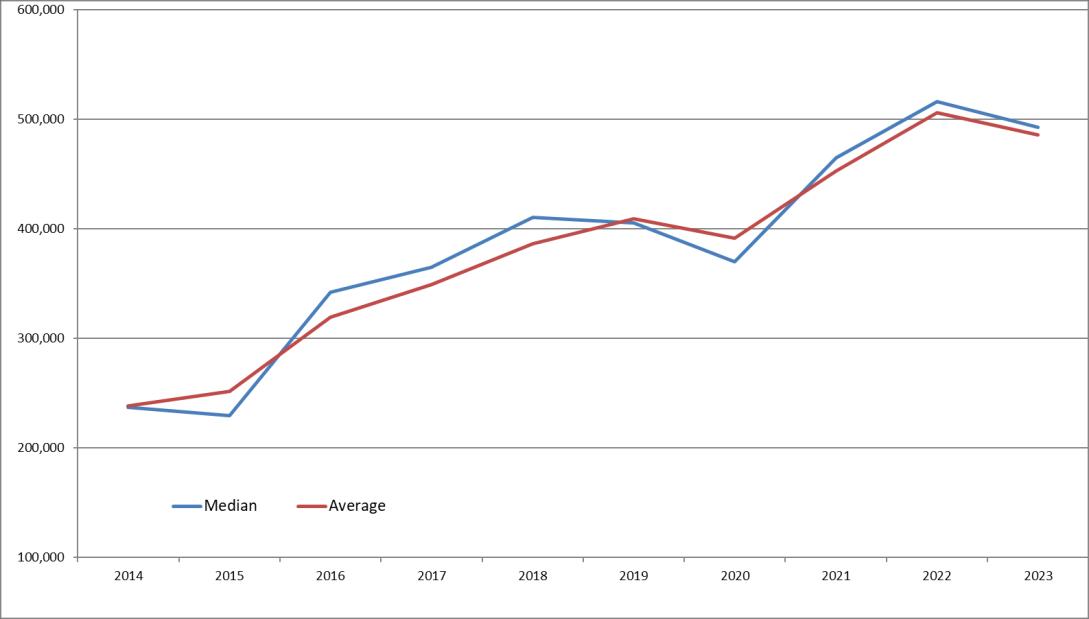
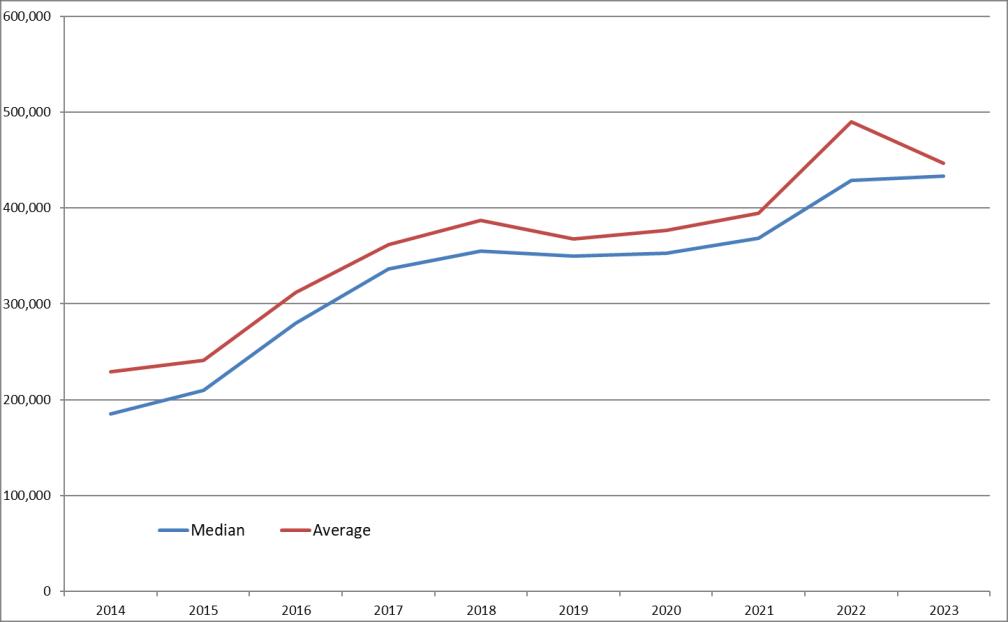
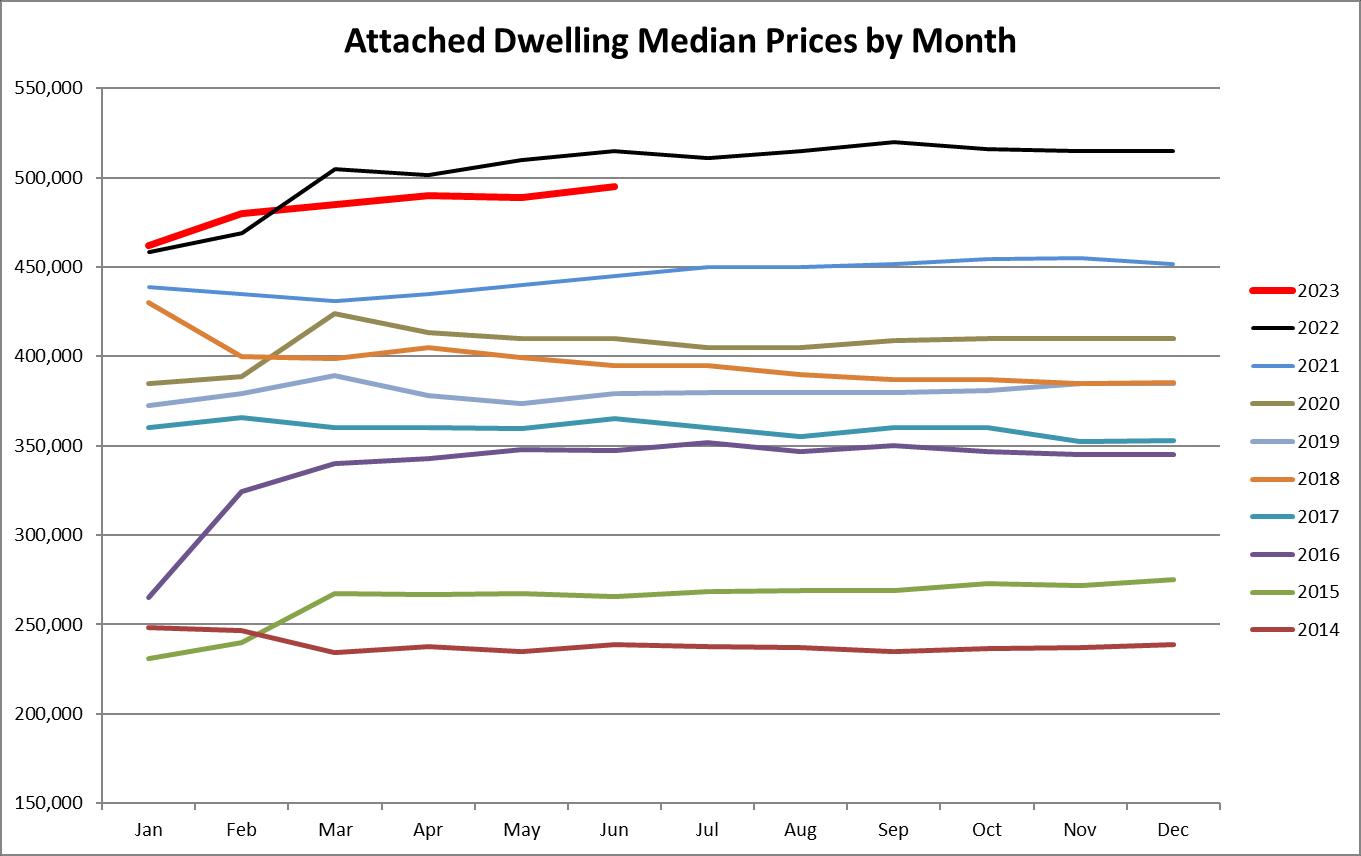
2018 2019 2020 2021 2022 2023 Boulder $471,000 $449,950 $520,000 $501,000 $580,000 $550,000 Louisville 365,000 422,750 455,000 427,000 535,000 586,850 Lafayette 410,000 405,000 370,000 465,000 516,065 492,500 Longmont 330,525 324,900 352,487 394,856 449,500 459,500 Plains 355,000 350,000 352,500 368,250 428,500 433,000 Superior 460,602 477,450 527,500 633,600 592,111 610,000 Bldr County 395,000 378,900 410,000 445,000 515,000 495,000
ATTACHED DWELLING MEDIAN SALES PRICE - THROUGH 2ND QUARTER
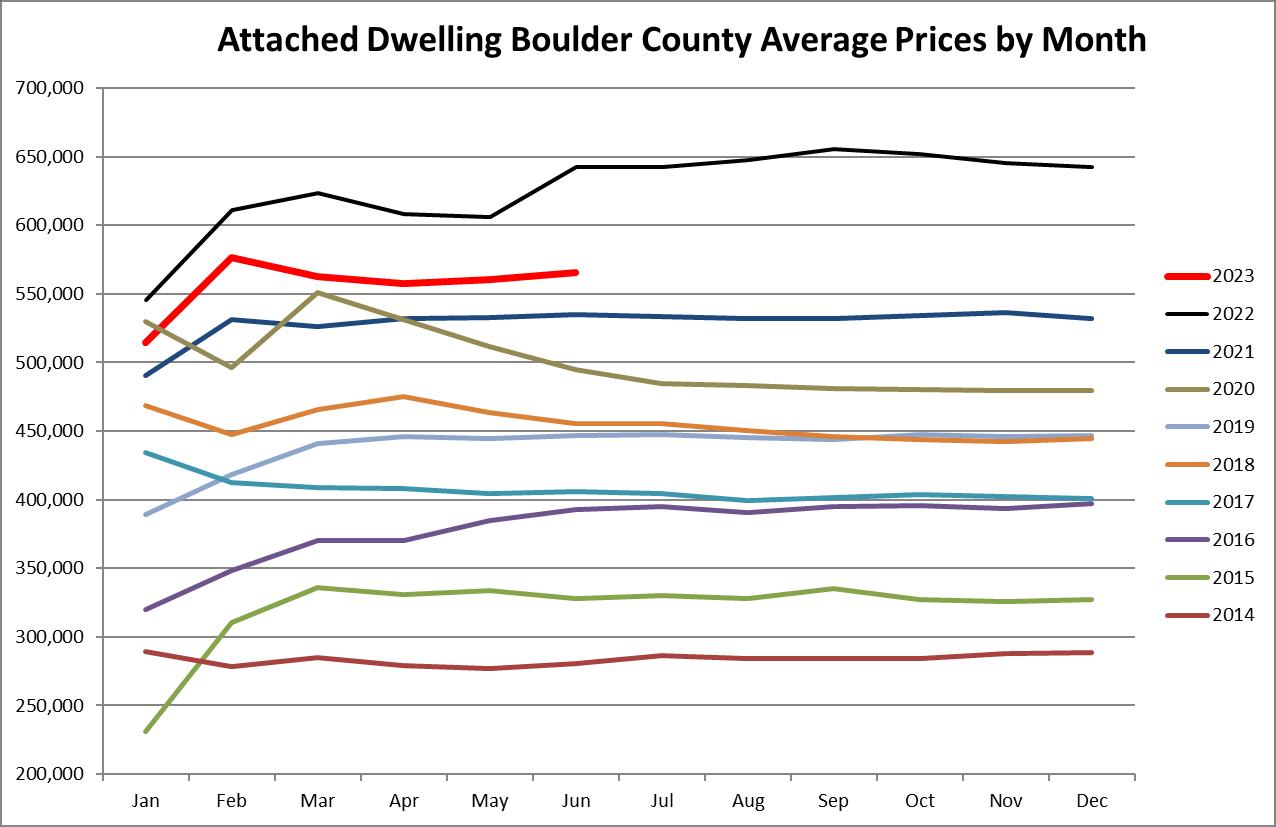
Attached Dwelling Average Sales Price - Through 2nd Quarter 2018 2019 2020 2021 2022 2023 Boulder $542,968 $541,240 $628,210 $615,957 $765,737 $639,773 Louisville 410,190 444,546 461,950 512,449 555,972 $666,899 Lafayette 386,557 409,000 391,067 452,433 505,784 $485,739 Longmont 352,575 343,260 354,157 411,043 473,339 $480,799 Plains 386,921 367,470 376,734 394,167 489,892 $446,442 Superior 450,615 509,380 496,602 649,244 651,070 $625,382 Bldr County 455,587 446,700 494,882 535,030 642,336 $565,387
Attached Dwelling % Under Contract - Through 2nd Qtr 2018 2019 2020 2021 2022 2023 Boulder 44% 37% 34% 66% 54% 24% Louisville 63% 51% 28% 83% 29% 31% Lafayette 57% 61% 40% 88% 48% 67% Longmont 67% 45% 60% 87% 63% 48% Plains 47% 53% 45% 80% 46% 27% Superior 56% 54% 45% 87% 55% 33% Bldr County 52% 44% 40% 76% 55% 37%
This representation is based in whole or in part on data supplied by IRES MLS for the time period above
June 10,
PRICE RANGE # SOLD # ON MARKET MONTHS OF INVENTORY # Listed 2nd Qtr 2023 $0 - $99,999 6 4 2 0 $100,000 - 149,999 0 4 3 $150,000 - 199,999 5 1 1 1 $200,000 - 249,999 22 4 1 4 $250,000 - 299,999 57 16 1 15 $300,000 - 349,999 106 35 1 33 $350,000 - 399,999 153 65 1 48 $400,000 - 449,999 141 69 1 47 $450,000 - 499,999 100 75 2 49 $500,000 - 549,999 69 43 2 33 $550,000 - 599,999 39 48 4 34 $600,000 - 649,999 43 29 2 20 $650,000 - 699,999 20 18 3 16 $700,000 - 749,999 16 12 2 12 $750,000 - 799,999 12 17 4 9 $800,000 - 999,999 39 33 3 24 $1,000,000 - 14 44 9 28 TOTALS: 842 517 1.84 376
Prepared by RE/MAX of Boulder, Inc. For Boulder County on
2023
Luxury Market
$1M + Boulder County
Single Family and Attached Dwelling
Through 2nd Quarter 2023
ACTIVE SOLD DOM SP/LP U/C % Sales over $1 Million 2016 277 220 103 97.50% 21.0% 8.2% 2017 338 238 85 97.60% 19.0% 10.8% 2018 272 304 76 98.20% 32.0% 13.7% 2019 421 285 82 97.90% 22.3% 12.6% 2020 394 254 90 97.16% 34.7% 12.5% 2021 293 574 72 102.1% 45.7% 25.7% 2022 386 613 51 104.1% 33.9% 34.5% 2023 424 436 67 97.90% 29% 31.30%
Single Family Through 2nd Quarter
$1,000,000 – $2,000,000
Boulder County 2017 2018 2019 2020 2021 2022 2023 Total Active Listings 229 158 214 216 % Under Contract 44.1% 51.3% 36.9% 42.60% Number Sold 197 225 217 176 407 424 296 Average Days on Mkt 80 75 68 70 57 34 52 % of Total Market Sold 12.3% 14.0% 13.3% 12.1% 26.6% 34.4% 30.10% City of Boulder 2017 2018 2019 2020 2021 2022 2023 Total Active Listings 110 63 66 70 % Under Contract 42.7% 55.6% 45.5% 44.30% Number Sold 115 118 119 101 196 173 126 Average Days on Mkt 62 56 53 62 54 31 45 % of SF Market Sold 35.3% 34.9% 37.5% 37.7% 51.3% 59.7% 49%
$2,000,000 and up
Single Family Through 2nd Quarter
Boulder County 2017 2018 2019 2020 2021 2022 2023 Total Active Listings 127 126 125 178 % Under Contract 18.1% 35.7% 21.6% 15.70% Number Sold 31 63 52 45 148 134 121 Average Days on Mkt 119 75 113 131 84 57 98 % of Total Market Sold 1.9% 3.9% 3.2% 3.1% 9.7% 10.9% 12.30% City of Boulder 2017 2018 2019 2020 2021 2022 2023 Total Active Listings 65 55 64 90 % Under Contract 18.5% 34.5% 20.3% 17.80% Number Sold 23 47 37 28 95 74 81 Average Days on Mkt 120 66 94 74 65 56 75 % of total market sold 7.1% 13.9% 11.7% 10.4% 24.9% 25.5% 31.50%
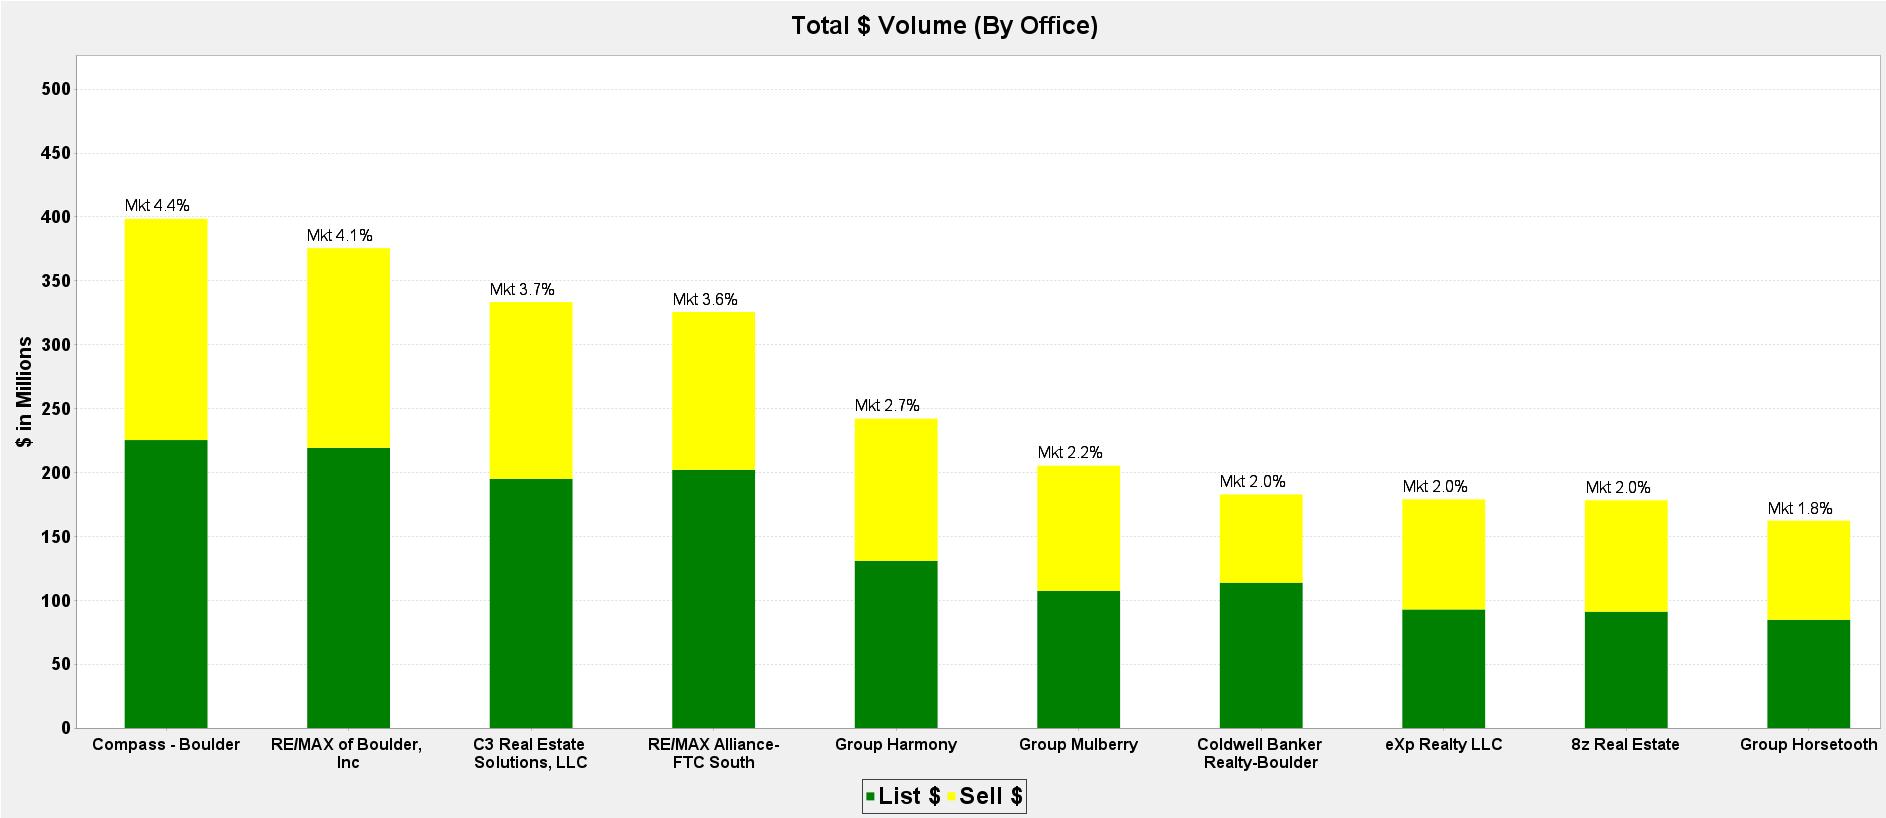
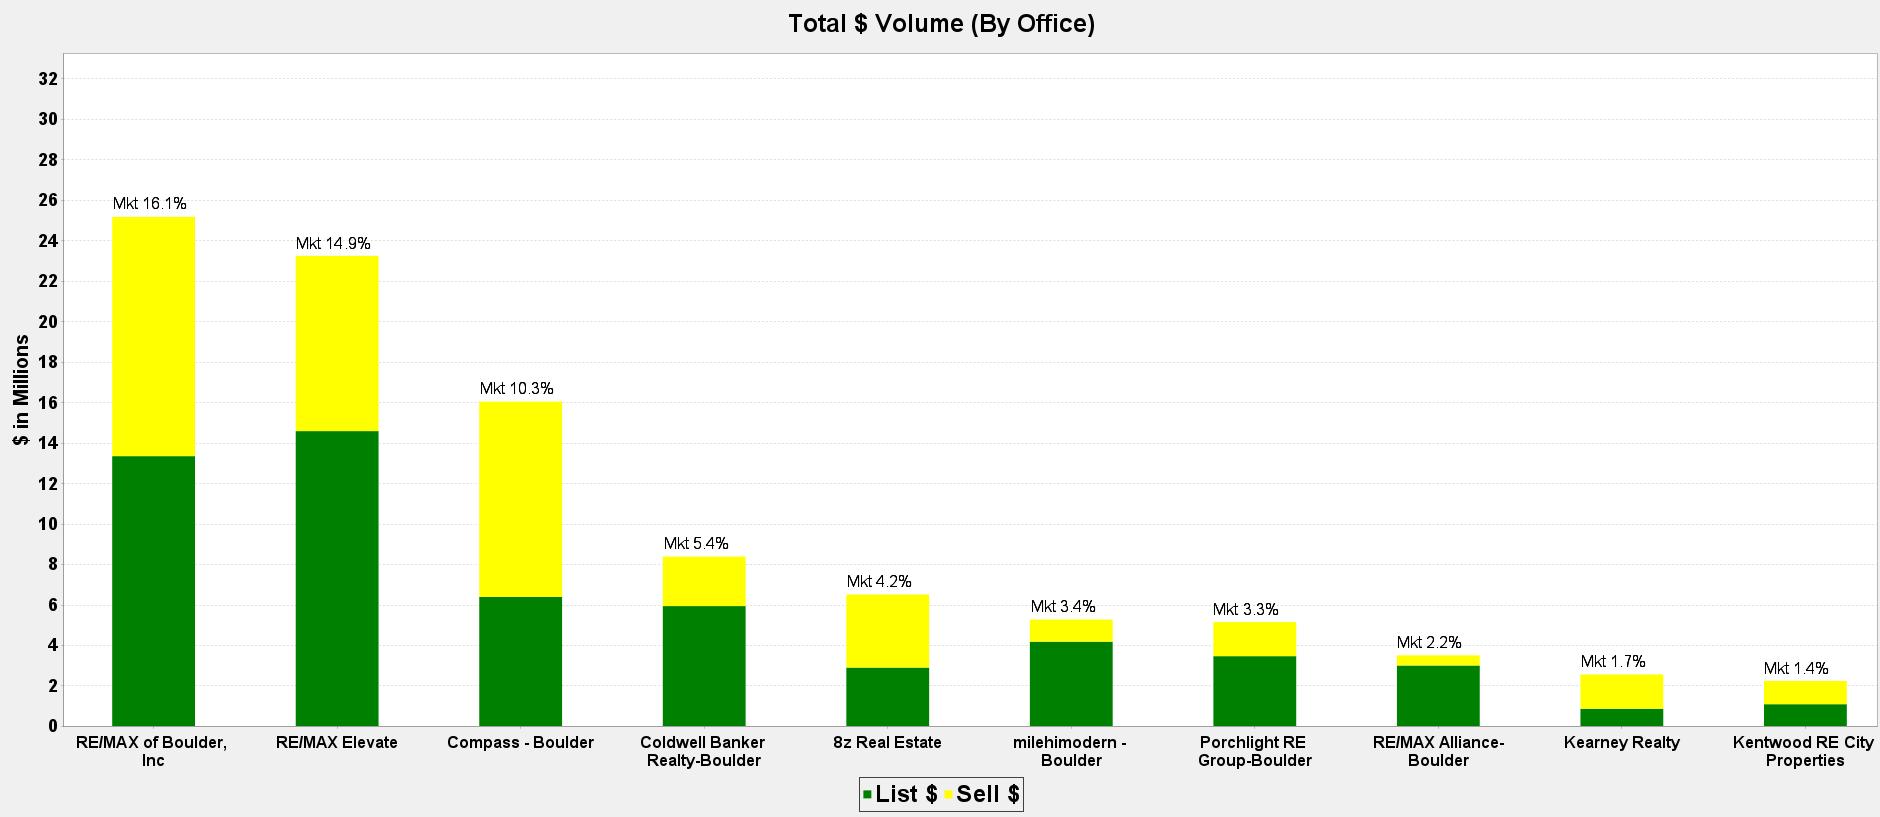
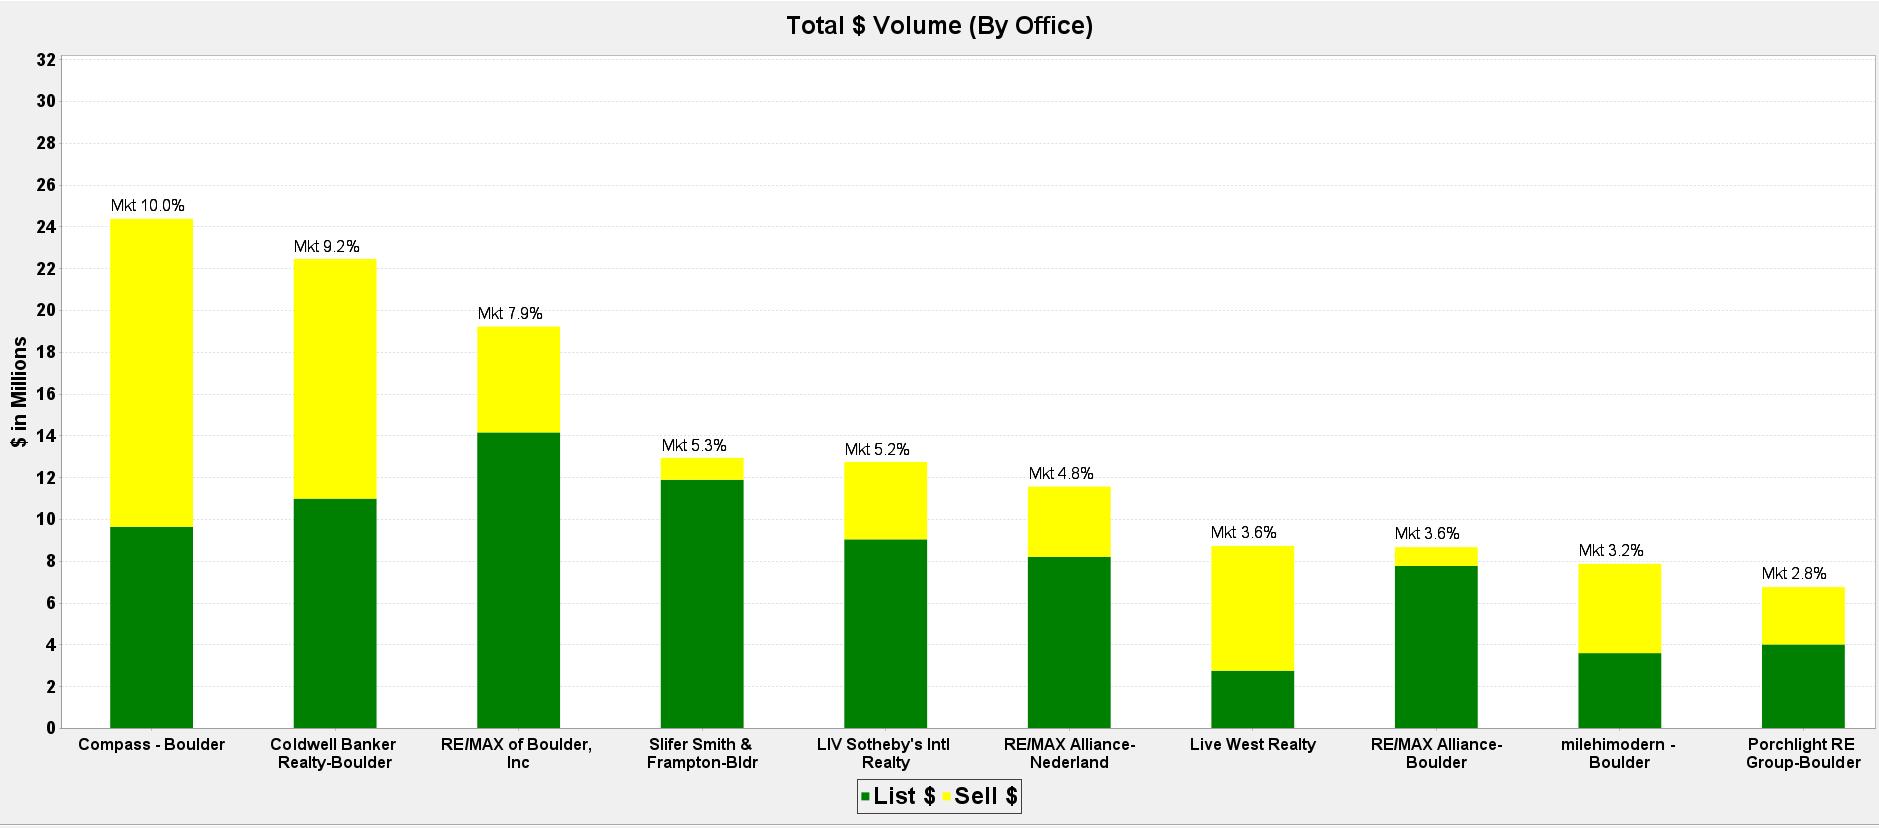
2023 Company Statistics


Office Name # of List Sides # of Buy Sides Total 1 Compass - Boulder 35 21 56 2 RE/MAX of Boulder, Inc 16 21 37 3 Slifer Smith & Frampton-Bldr 13 6 19 3 milehimodern - Boulder 10 9 19 5 Coldwell Banker Realty-Boulder 12 4 16 6 8z Real Estate 5 4 9 6 WK Real Estate 4 5 9 8 Live West Realty 3 4 7 9 LATITUDE40 Real Estate Group 5 1 6 9 RE/MAX Alliance-Boulder 4 2 6 9 LIV Sotheby's Intl Realty 3 3 6 12 Porchlight RE Group-Boulder 2 3 5 12 eXp Realty LLC 1 4 5 12 RE/MAX Elevate 1 4 5 15 Accent Properties 3 0 3 15 Slifer Smith & Frampton-Niwot 3 0 3 15 Four Star Rlty & Prop Mgmt 1 2 3 15 CCLL2 0 3 3
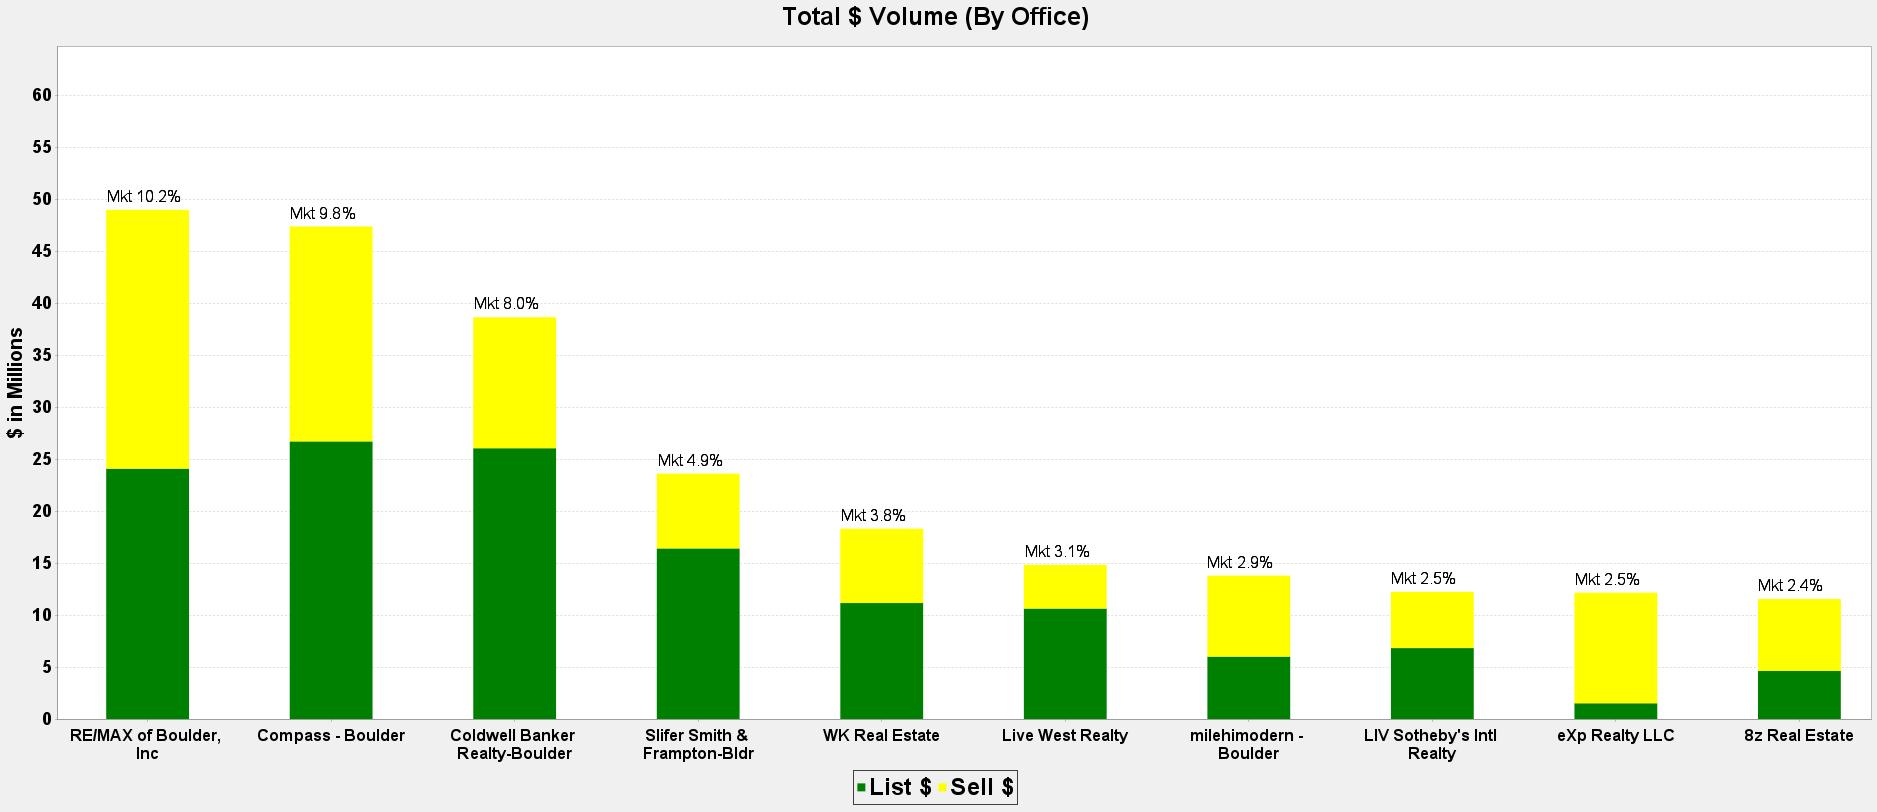
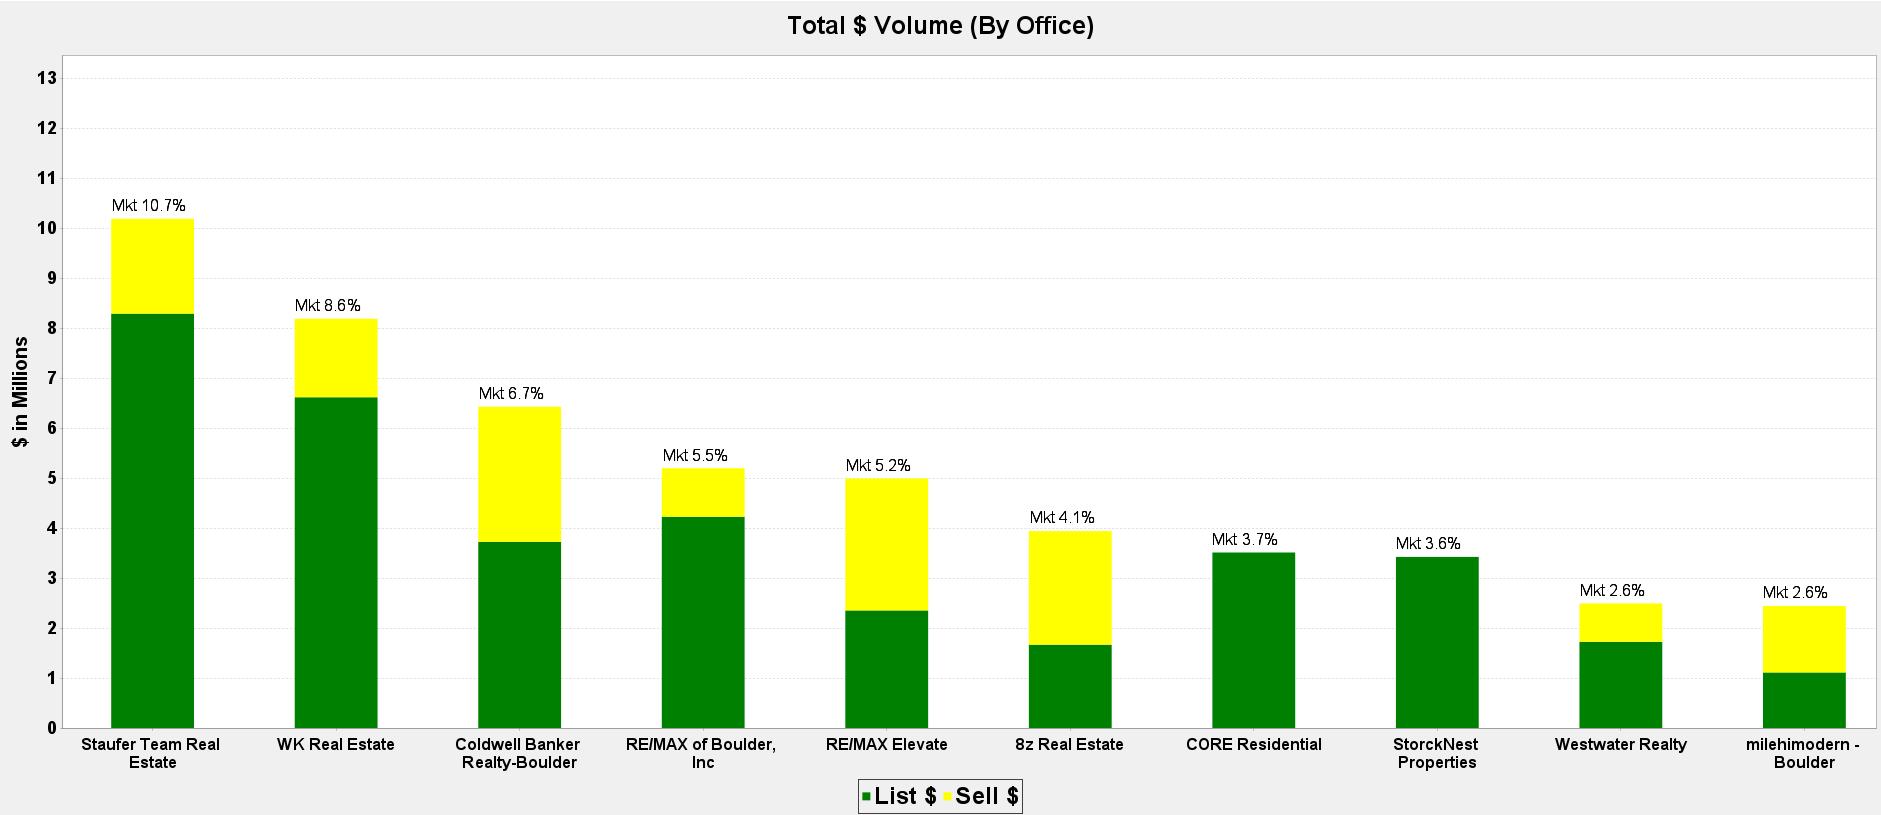
Boulder & Broomfield Counties, pulled from IRES on July 17th, 2023 2 Million Plus - Boulder & Broomfield Counties
Sorted By: Total # of Sides, # of List Sides, Alphabetically by office Million Plus - Boulder & Broomfield Counties Office Name # of List Sides # of Buy Sides Total 1 Compass - Boulder 82 59 141 2 RE/MAX of Boulder, Inc 78 49 127 3 Coldwell Banker Realty-Boulder 31 21 52 4 WK Real Estate 26 22 48 4 8z Real Estate 25 23 48 6 milehimodern - Boulder 26 21 47 7 Slifer Smith & Frampton-Bldr 21 11 32 8 LIV Sotheby's Intl Realty 13 13 26 9 RE/MAX Alliance-Boulder 10 10 20 9 RE/MAX Elevate 8 12 20 10 LATITUDE40 Real Estate Group 13 6 19 10 Live West Realty 11 8 19 13 Porchlight RE Group-Boulder 9 7 16 14 eXp Realty LLC 4 9 13
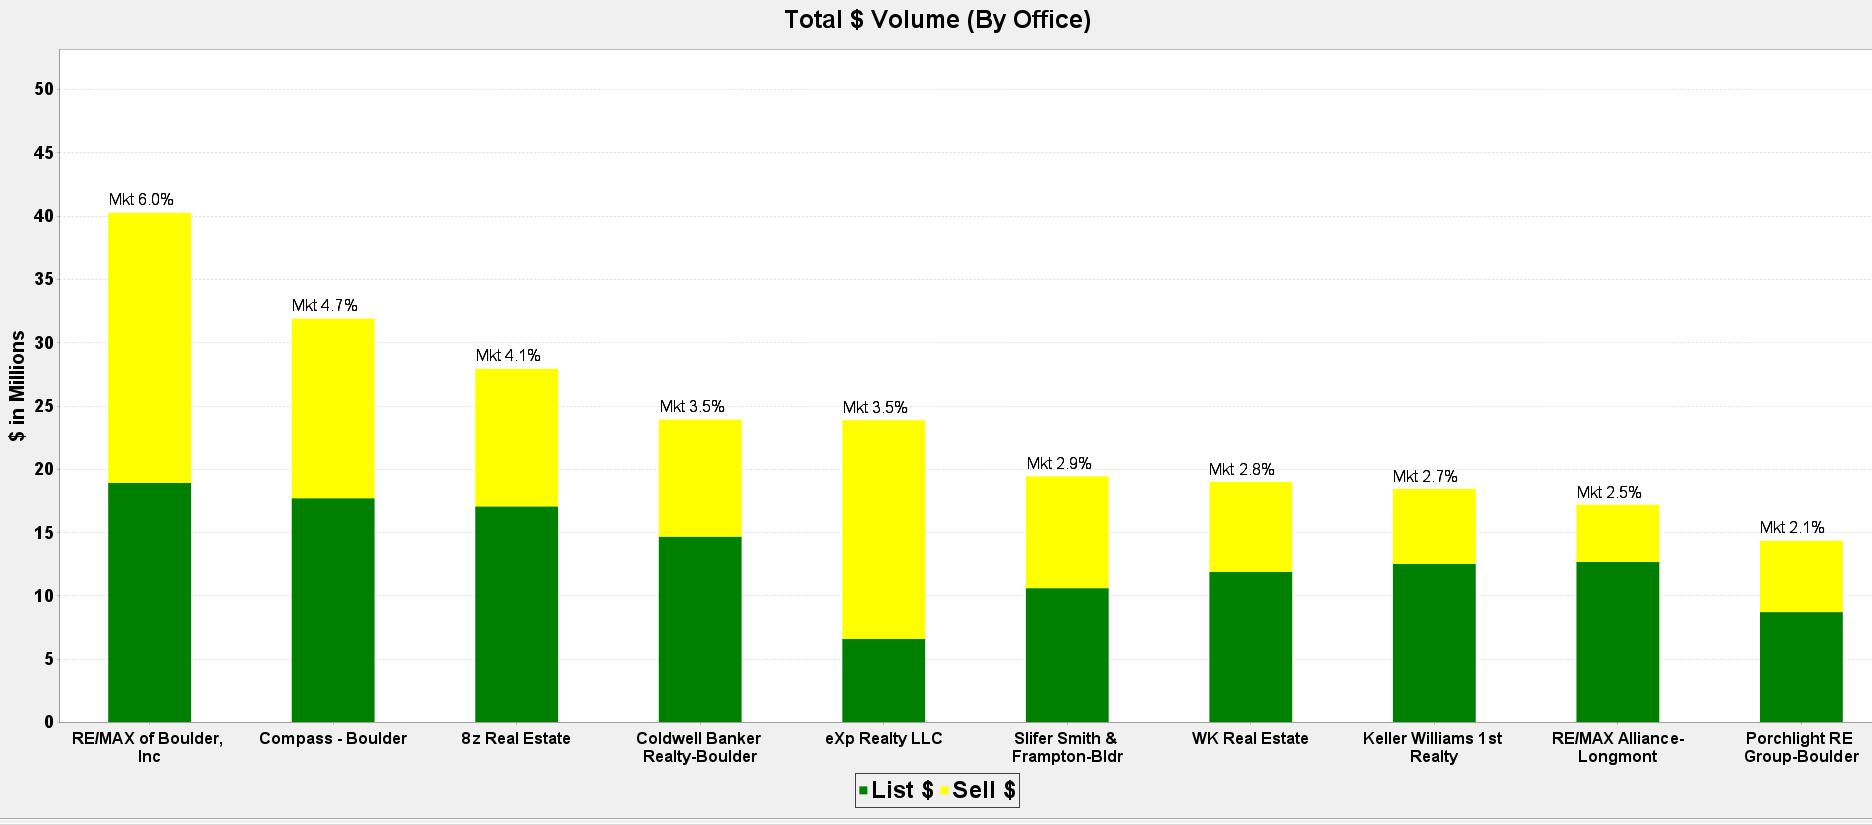
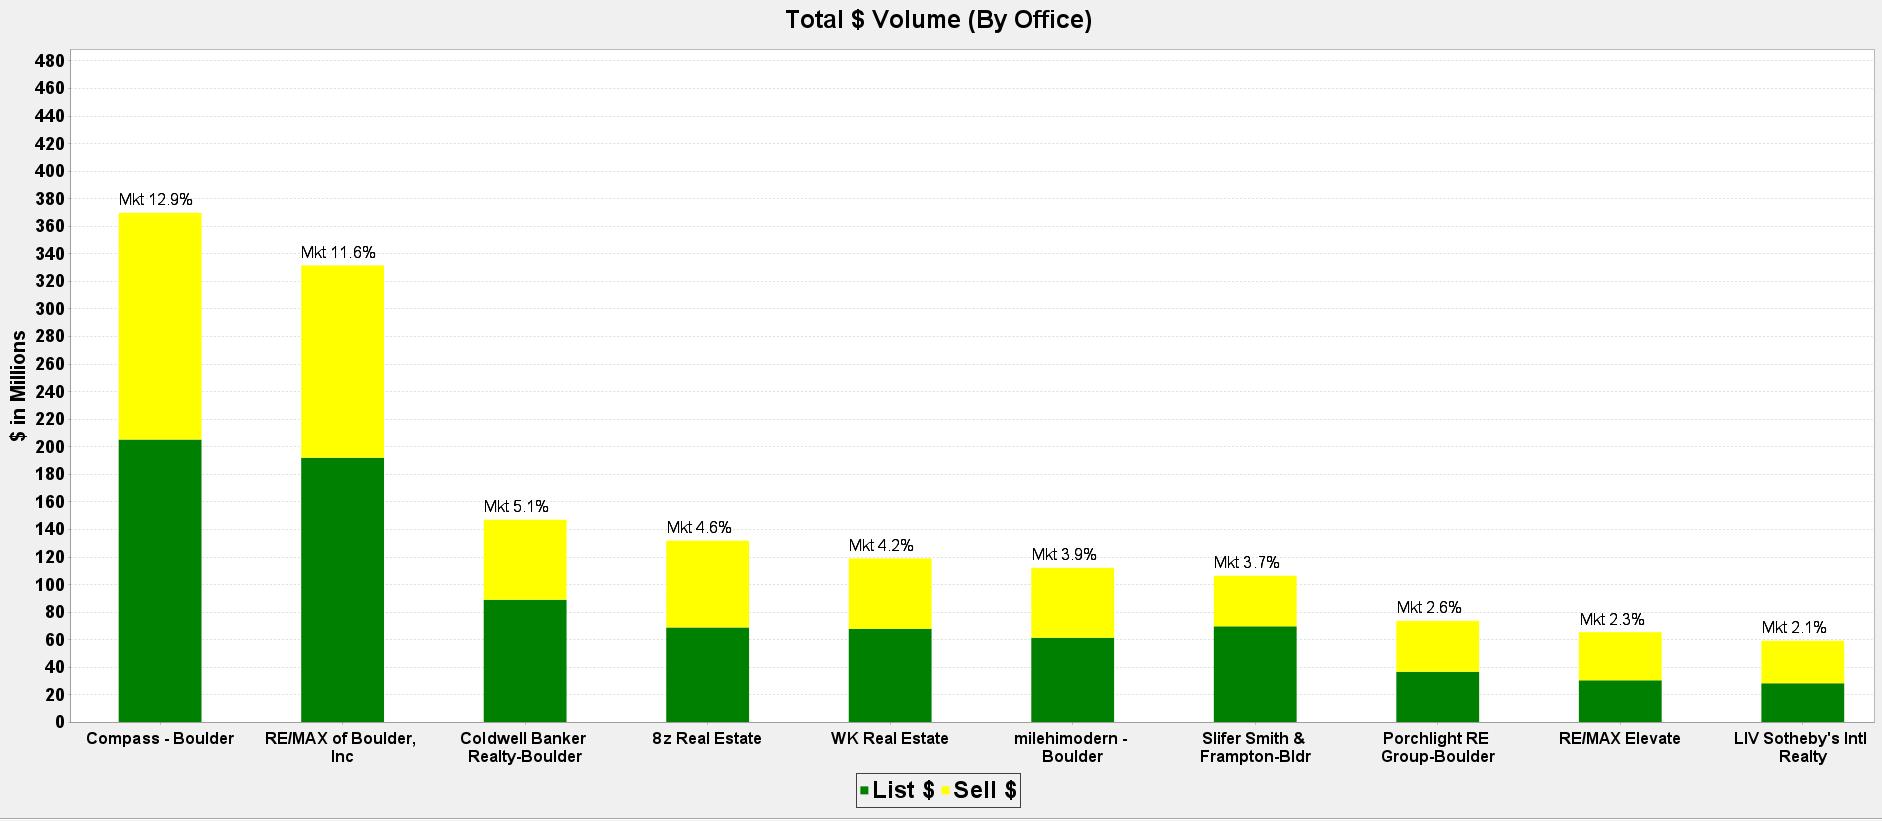
All Price Points - Boulder & Broomfield Counties OfficeName # of List Sides # of Buy Sides Total 1 RE/MAX of Boulder, Inc 199 142 341 2 Compass - Boulder 136 115 251 3 Coldwell Banker Realty-Boulder 97 56 153 4 8z Real Estate 69 68 137 5 WK Real Estate 74 58 132 6 CO-OP Non-IRES 3 106 109 7 milehimodern - Boulder 49 38 87 8 RE/MAX Elevate 41 29 70 9 LIV Sotheby's Intl Realty 34 33 67 10 RE/MAX Alliance-Boulder 39 25 64 11 Slifer Smith & Frampton-Bldr 37 26 63 12 Porchlight RE Group-Boulder 28 33 61 13 Live West Realty 30 27 57 14 eXp Realty LLC 20 32 52
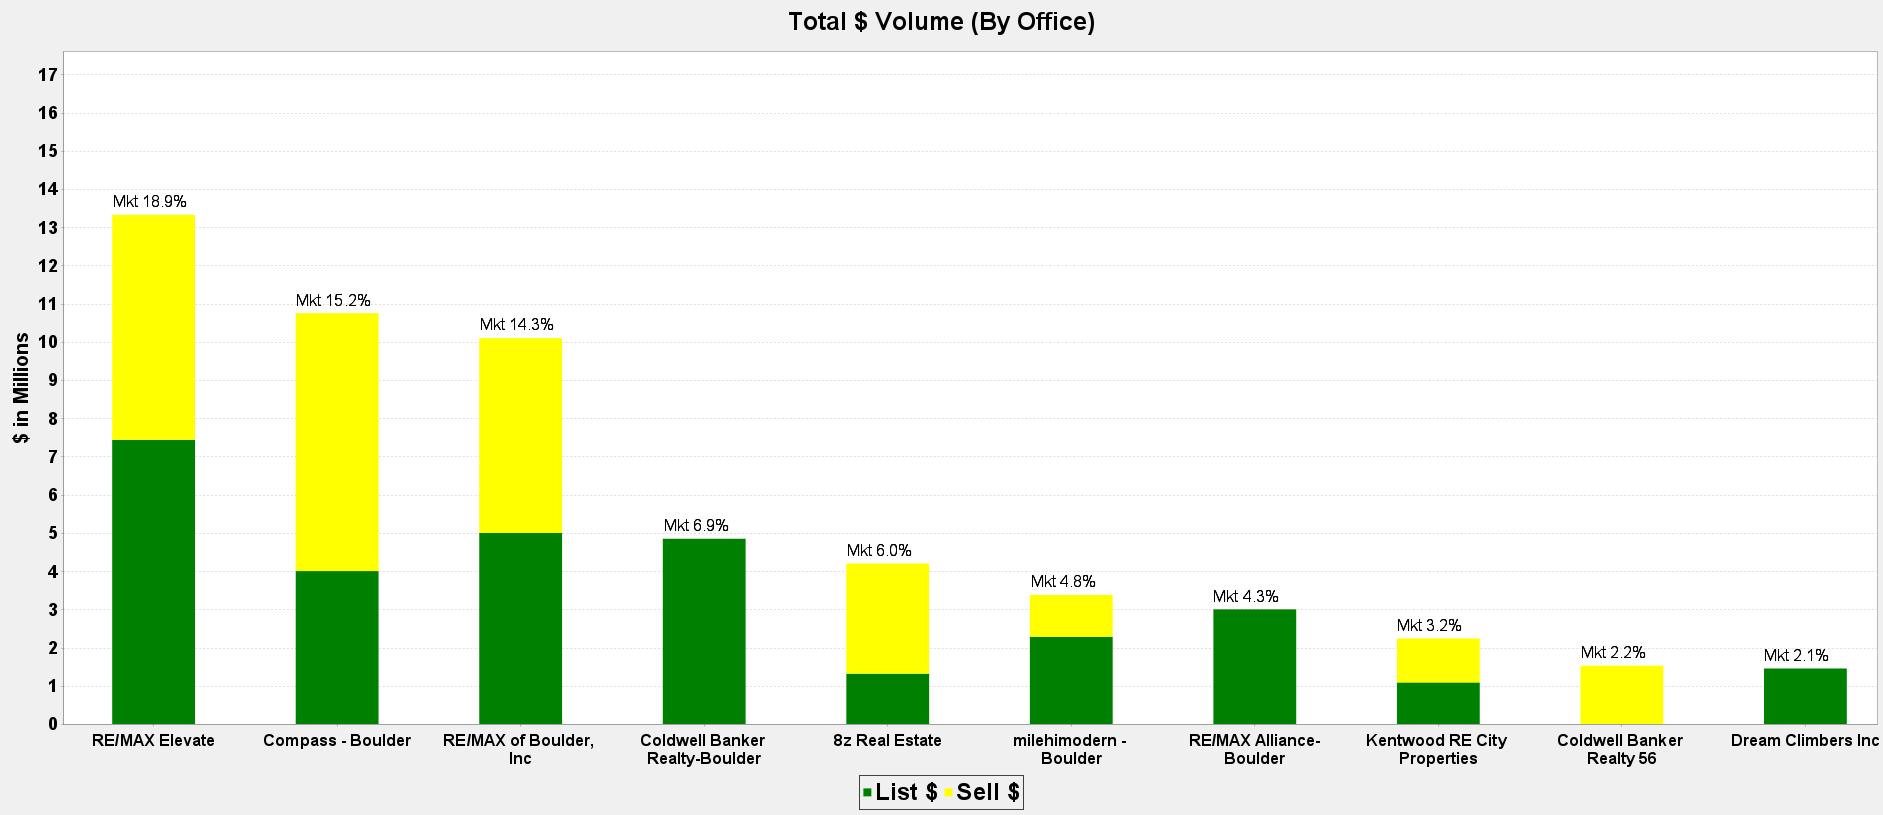
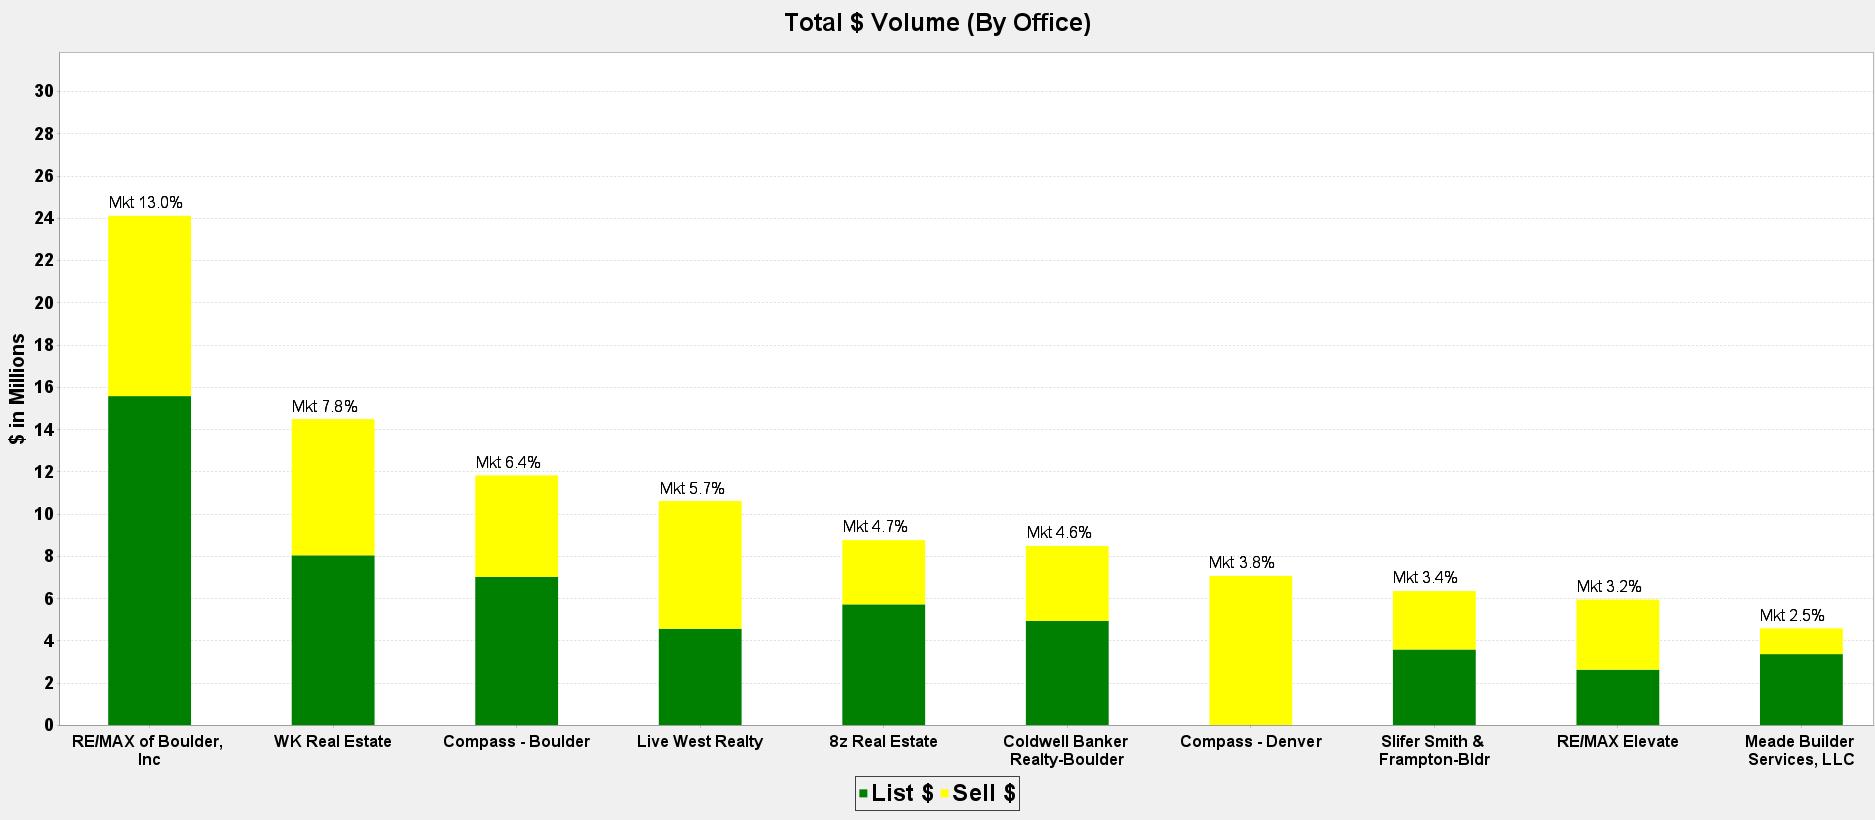
Million Plus - City of Louisville All Price Points - City of Louisville OfficeName # of List Sides # of Buy Sides Total OfficeName # of List Sides # of Buy Sides Total 1 RE/MAX Elevate 6 4 10 1 RE/MAX of Boulder, Inc 17 15 32 2 RE/MAX of Boulder, Inc 5 4 9 2 RE/MAX Elevate 22 9 31 3 Compass - Boulder 3 5 8 3 Compass - Boulder 6 9 15 4 milehimodern - Boulder 2 1 3 4 Coldwell Banker RealtyBoulder 4 3 7 4 8z Real Estate 1 2 3 5 milehimodern - Boulder 5 1 6 6 Coldwell Banker Realty-Boulder 2 0 2 5 Porchlight RE GroupBoulder 4 2 6 6 RE/MAX Alliance-Boulder 2 0 2 5 8z Real Estate 3 3 6 6 Kentwood RE City Properties 1 1 2 5 Meade Builder Services, LLC 0 6 6 9 Black & White Realty, LLC 1 0 1 9 RE/MAX Alliance-Boulder 3 1 4 9 Dan Heine Real Estate 1 0 1 9 Kearney Realty 2 2 4
City of Boulder


–
City of Boulder
Under 2M
Louisville
Louisville Over $1M
Lafayette
Longmont
Suburban Plains
Mountains
Superior
Boulder County
Entire MLS