3 minute read
JavaScript debugging
Programmers spend a lot of time diagnosing and remedying errors and omissions in their code. Debugging slows down the JavaScript execution and shows how data is modified line by line. Since JavaScript is interpreted at run time and executed inside the browser, debugging is performed with tools built in to the browser.
Errors in JavaScript
Advertisement
In JavaScript an error is detected or thrown when a program tries to perform an unexpected or forbidden action. JavaScript uses an Error object to provide information about the unexpected event. JavaScript errors can be viewed in a browser’s Developer Tools,
inside the Console tab. Every Error object has two properties, a “name” and a “message”. The name indicates the type of error, while the message provides further details about the error, such as the location in the JavaScript file where the error was thrown.
SyntaxError
An error in the way the code is written causes a syntax error. This error occurs while the JavaScript Engine is interpreting the code at run time.
TypeError
This error occurs when the wrong data type is used. For example, applying the string.substring method to a variable that is a number.
RangeError
When the code attempts to use a number that is outside the range of possible values, JavaScript detects a RangeError.
URIError Some alphanumeric characters are not allowed to be used in a url. A URIError is thrown when there is a problem encoding or decoding a URI because of the use of a reserved character.
ReferenceError
This error occurs when the code refers to a variable that either does not exist or is not in scope (see p.269) for the executing code.
EvalError
This error occurs when there is a problem with the eval() function. Newer versions of JavaScript do not throw this error.
Developer tools
All modern browsers contain a set of Developer Tools to help programmers work with HTML, CSS, and JavaScript. The Developer Tools contain functionality to debug JavaScript and view the state of HTML
The Console
Web developers can output messages to the console log to make sure their code is executing as expected. The “Console” tab contains two areas: • Console Output Log: Displays system and user messages from the JavaScript execution. • Console Command Line Interface: Accepts any JavaScript instructions and executes them immediately.
JavaScript debugger
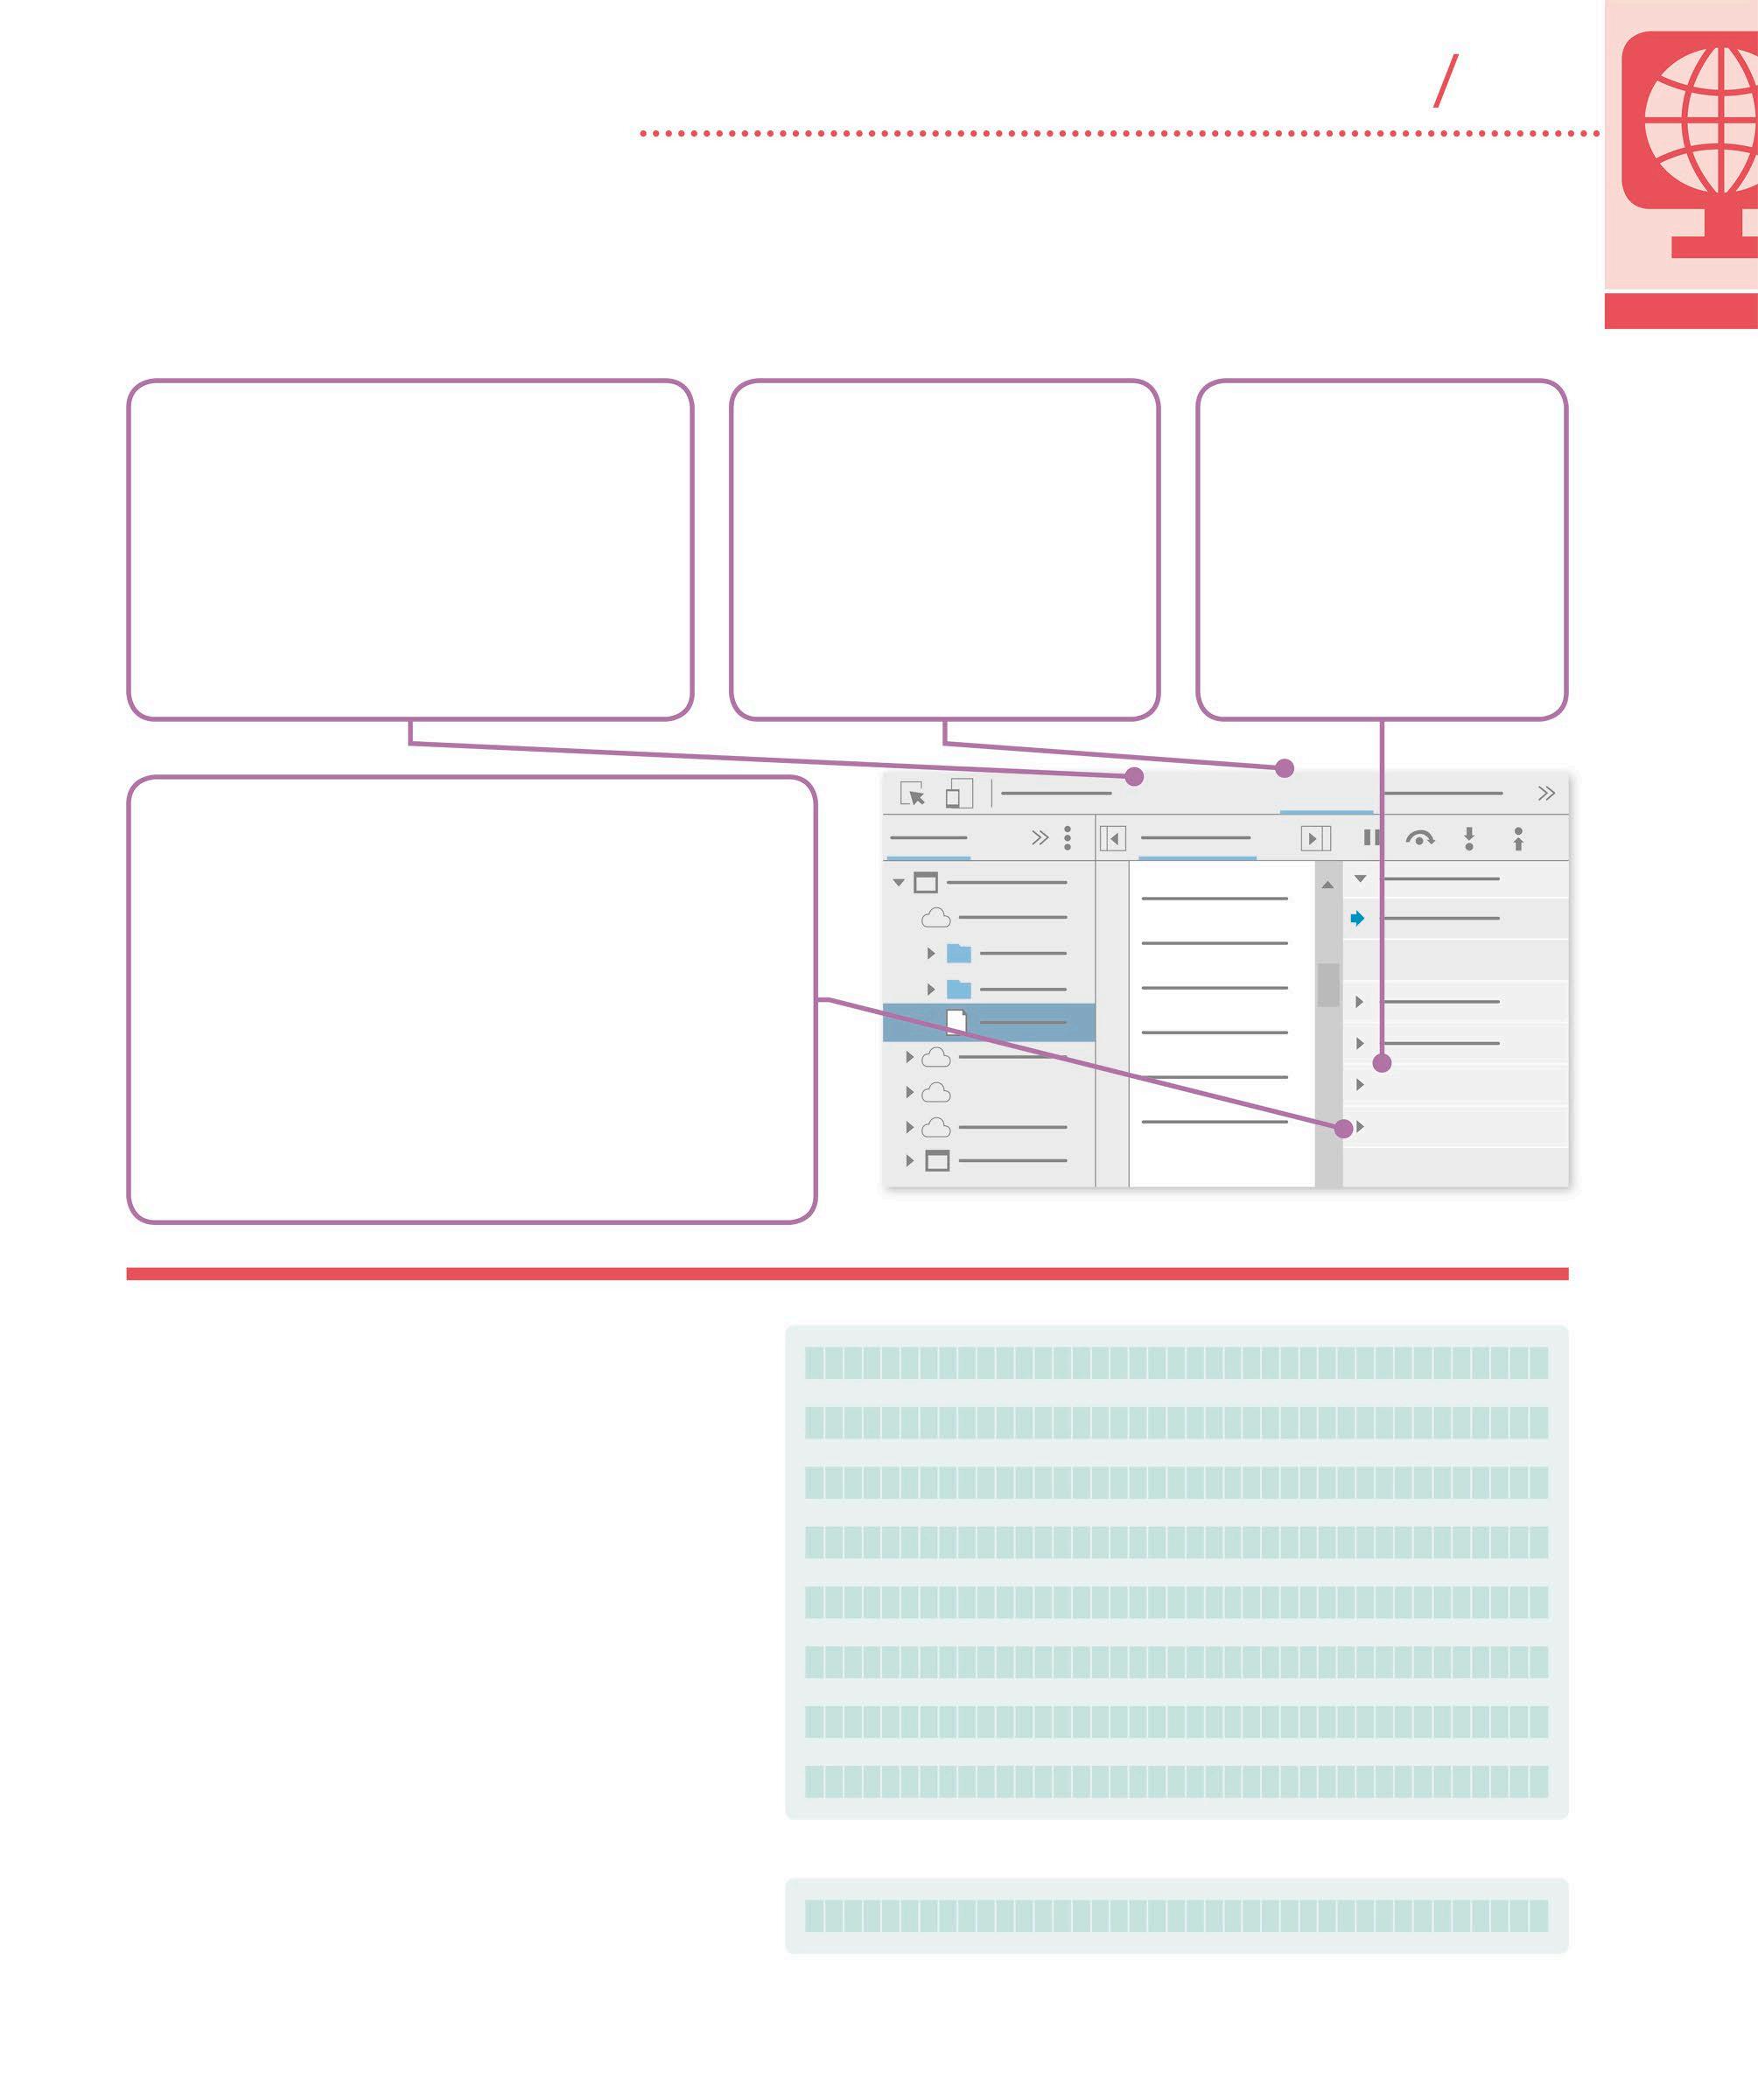
The JavaScript debugger can be found under the Sources tab. The debugger makes it possible to step through the code line by line to see what is happening to the variables as the code executes. On the left is a list of all the source files used by the HTML document. Select the file to debug from this list.
Scope
In the “Sources” tab, the window on the right contains the Scope (see p.269). The local and global sections under this show the variables that are defined in the current scope. The Scope pane is only populated with variables when the script is being debugged.
Breakpoints
The JavaScript Engine pauses the execution of code when it hits a breakpoint. This allows programmers to examine it. The execution can proceed in one of the following ways: • Resume Script Execution: Resumes execution until the program hits another breakpoint or the program ends. • Step over: Executes the next line of code in a single step and then pauses on the following line. It steps over a function without debugging the individual steps of the function. • Step into: Executes the next line of code and then pauses on the following line. It will step into a function line by line. • Step out: Executes the remaining code in the current function, and pauses when run time returns to the line of code, after the function was called. Console Sources

Scope Breakpoints
GOOGLE CHROME DEVELOPER TOOLS
Error handling
In JavaScript, the try...catch statement allows programmers to handle errors in the code. Normally program execution stops when an error is thrown by the JavaScript Engine. However, if the code is wrapped in a try block, the execution will jump to the catch block if an exception is thrown, and the program will continue as normal. It is also possible to manually raise an error using the “throw” statement. elements in the browser. To open the Developer Tools for the Google Chrome browser, press Command+Option+I (Mac) or Control+Shift+I (Windows, Linux).
The error message is displayed in the console
The throw operator generates an error
try {
noSuchCommand(); This function does not exist
}
catch (err) { The code jumps to the catch block instead of stopping the program execution


