25 minute read
Protocolo de Investigación Biológica de la Obra Simbiosis Meditativa Biological Research Protocol of the Work Meditative Symbiosis


78
79
Advertisement
PROTOCOLO DE INVESTIGACIÓN BIOLÓGICA DE LA OBRA SIMBIOSIS MEDITATIVA //
BIOLOGICAL RESEARCH PROTOCOL OF THE WORK MEDITATIVE SYMBIOSIS. // Camilo Gouet
80 A continuación se describen los objetivos, diseño, metodología y consideraciones tomadas en cuenta para la implementación y organización de la investigación biológica en la obra “Simbiosis Meditativa”. Dicha investigación fue realizada en el laboratorio FabLab de la Universidad de Chile, durante el periodo marzo-junio de 2019.
El propósito de estos procedimientos fue estudiar la factibilidad de la simbiosis planta-luz propuesta originalmente por Laffert (2012), esto es, las condiciones que hacen posible tal asociación desde un punto de vista biológico.
Si bien las relaciones funcionales entre los componentes de “Simbiosis Meditativa” están claramente especificadas, la materialización de ellas, en cuanto a que hagan suponer una simbiosis entre los sistemas biológico y electrónico debían precisarse.
Para entender el raciocinio de los protocolos descritos más abajo es importante revisar brevemente el funcionamiento original de la obra. En Laffert (2012) se propone un sistema bio-electrónico, compuesto por una planta y un foco de luz, que establecen una relación de interdependencia de tipo simbiótica.
Un punto crítico del sistema en “Simbiosis Meditativa” consiste en asumir que las variaciones en los niveles de CO2 se corresponden con la actividad fotosintética de la planta. Sin embargo, debido a que el sistema opera en conexión directa con el ambiente no corresponde atribuir tales variaciones de CO2 exclusivamente a la actividad fotosintética de la planta (pueden haber variaciones inducidas por la presencia de personas, máquinas, etc.). Por otro lado, es importante considerar que la planta y el suelo liberan CO2 al ambiente por respiración celular (Hopkins & Hüner, 2009). Existen tres posibles fuentes de CO2 en el sistema “Simbiosis Meditativa”: i) fotosíntesis: funciona como un sumidero al capturar CO2 desde aire; ii) respiración: funciona como una fuente de CO2, al liberar CO2 al aire; y iii) CO2 ambiental: puede ser una fuente o sumidero dependiendo de si aumenta o disminuye el CO2 ambiental en el tiempo.
Por lo tanto, en estas condiciones el sensor de CO2 registra un balance

The objectives, design, methodology and considerations taken into account for the implementation and organization of biological research in the work “Meditative Symbiosis” are described below. This research was carried out in the FabLab laboratory of the University of Chile, during the period March-June 2019.
The purpose of these procedures was to study the feasibility of the plantlight symbiosis originally proposed by Laffert (2012), that is, the conditions that make such an association possible from a biological point of view.
Although the functional relationships between the components of “Meditative Symbiosis” are clearly specified, the materialization of them, insofar as they suggest a symbiosis between the biological and electronic systems, had to be specified.
To understand the rationale for the protocols described below, it is important to briefly review the original operation of the work. In Laffert (2012) a bio-electronic system is proposed, composed of a plant and a light bulb, which establish a symbiotic relationship of interdependence.
A critical point of the system in “Meditative Symbiosis” consists in assuming that the variations in CO2 levels correspond to the photosynthetic activity of the plant. However, since the system operates in direct connection with the environment, it is not appropriate to attribute such CO2 variations exclusively to the photosynthetic activity of the plant (there may be variations induced by the presence of people, machines, etc.). On the other hand, it is important to consider that the plant and the soil release CO2 into the environment by cellular respiration (Hopkins & Hüner, 2009). There are three possible sources of CO2 in the “Meditative Symbiosis” system: i) photosynthesis: it works as a sink by capturing CO2 from air; ii) ii) respiration: it functions as a source of CO2, releasing CO2 into the air; and... iii) Environmental CO2: it can be a source or sink depending on whether the environmental CO2 increases or decreases over time.
Therefore, under these conditions the CO2 sensor registers a balance between these three contributions. It is important to bear in mind that the 81
82
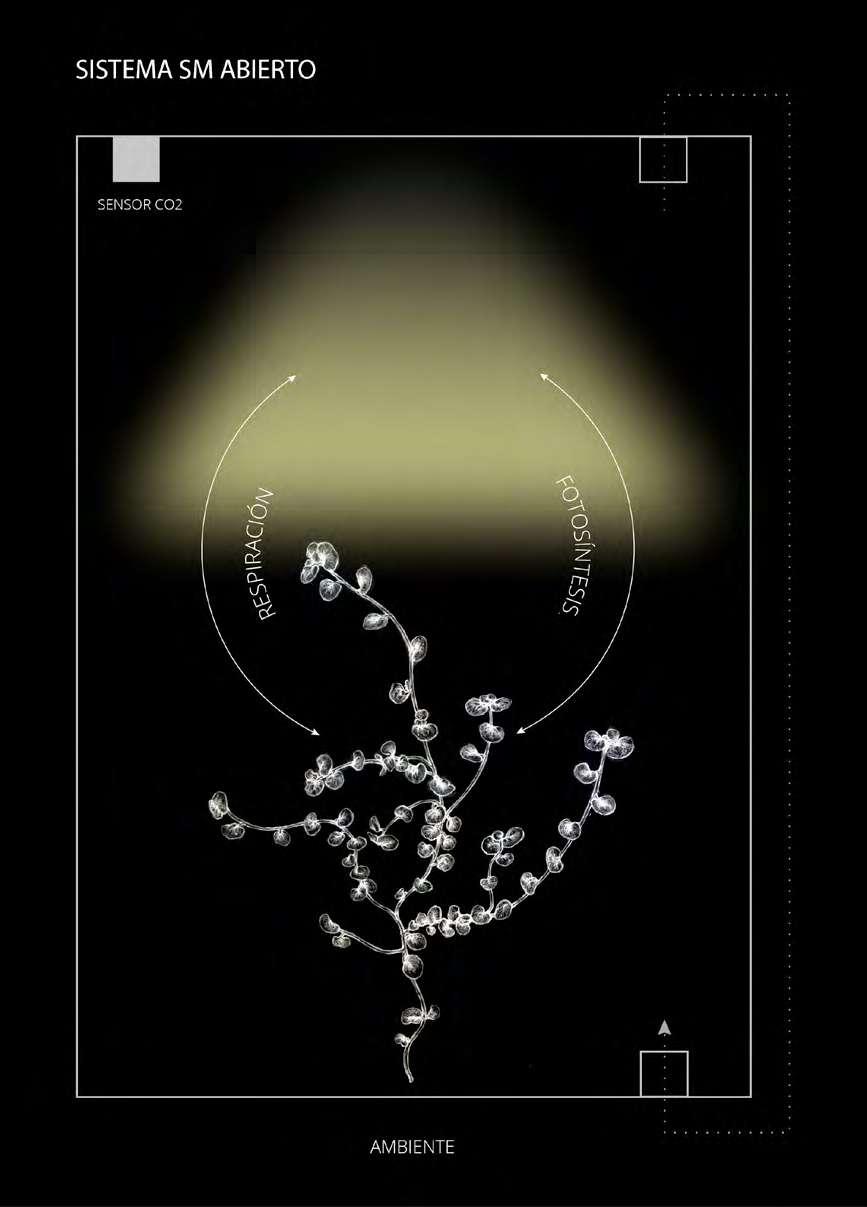
Figura 1. Modos abierto y cerrado en simbiosis meditativa. Las flechas rojas y azules corresponden a sumideros y fuentes de CO2. En A, hemos supuesto que el ambiente contribuye con CO2 al contenedor.
83
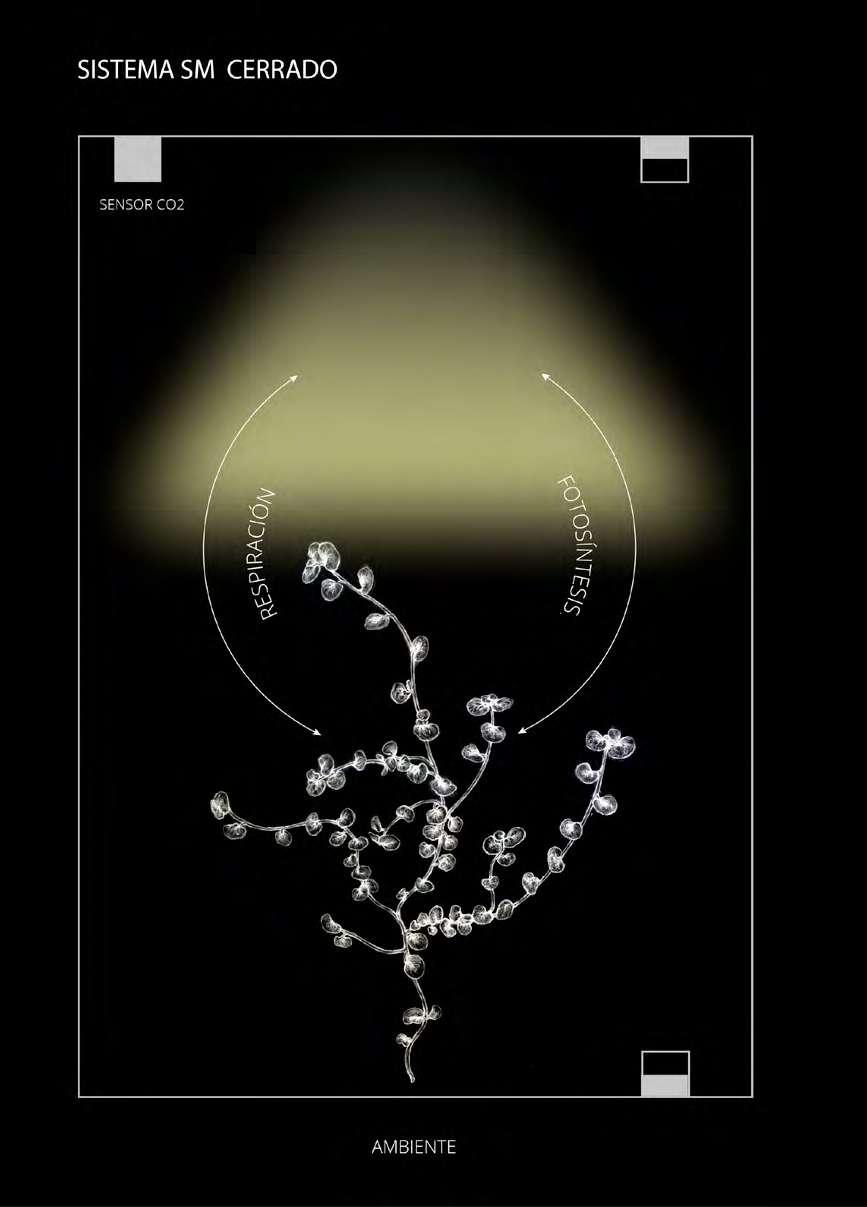
Figure 1. Open and closed modes in meditative symbiosis. The red and blue arrows correspond to sinks and sources of CO2. In A, we have assumed that the environment contributes CO2 to the container.
84 entre estas tres contribuciones. Es importante tener presente que en la literatura se describe el concepto de actividad fotosintética neta, que corresponde al balance entre fotosíntesis y respiración (Hopkins & Hüner, 2009). Este balance es el que típicamente se considera para medición de fotosíntesis con sensores de CO2. En el caso de “Simbiosis Meditativa”, como hemos visto, hay un tercer elemento contribuyendo, el CO2 del medio ambiente. Por lo tanto, el objetivo específico de los protocolos de investigación fue diseñar un sistema de medición que permitiera despejar la contribución del CO2 del ambiente, y así medir la actividad fotosintética neta.
En la literatura sobre medición de fotosíntesis, se distinguen básicamente dos modos para medir fotosíntesis a través de intercambio gaseoso: Abierto y Cerrado (ver revisiones en (Long, Farage, & Garcia, 1996; Takahashi, Ling, & Frantz, 2008). Cada modo presenta ventajas y desventajas. El modo Abierto implica continuidad material con el medio ambiente. Requiere de una medición diferencial de CO2, es decir, que haya un sensor en la entrada de la cámara donde se aloja la planta y otro en la salida, midiéndose la variación entrada-salida como medida de la fotosíntesis (uno espera que la cantidad de CO2 que salga sea menor que la que entra debido a la fijación de CO2 por la fotosíntesis). La principal ventaja de esta configuración es que la cámara no requiere de un sellado tan hermético; su mayor desventaja es que para que la medida entrada-salida de CO2 sea un fidedigno indicador de la fotosíntesis, se requiere un control fino del flujo de aire que circula por el sistema (ver Kölling, George, Künzli, Flütsch, & Zeeman, 2015).
El modo Cerrado, en tanto, implica aislar materialmente al sistema. La ventaja de esta configuración es que solo requiere de un sensor de CO2 y que las variaciones en la concentración de esta molécula son un indicador directo de la actividad fotosintética neta. Además, no requiere la implementación de un regulador de flujo de aire. Sin embargo, su principal limitación es que requiere de un buen sistema de sellado (hermetismo).
Ahora bien, para abordar el problema de la contribución del CO2 del entorno en el sistema original de “Simbiosis Meditativa” (y tener así una medida más precisa de la actividad fotosintética), optamos por configurar al sistema en modo Cerrado1 (Figura 1B) (ver por ejemplo Jung, Lee, Kang, Hwang,
1 Otra alternativa es dejarlo en modo abierto, pero agregando un sensor de CO2 en la entrada del sistema y un medidor de flujo de aire.
literature describes the concept of net photosynthetic activity, which corresponds to the balance between photosynthesis and respiration (Hopkins & Hüner, 2009). This balance is what is typically considered for measurement of photosynthesis with CO2 sensors. In the case of “Meditative Symbiosis”, as we have seen, there is a third contributing element, CO2 from the environment. Therefore, the specific objective of the research protocols was to design a measurement system that would allow to clear the contribution of CO2 from the environment, and thus measure the net photosynthetic activity.
In the literature on the measurement of photosynthesis, two modes are basically distinguished to measure photosynthesis through gas exchange: Open and Closed (see reviews in (Long, Farage, & Garcia, 1996; Takahashi, Ling, & Frantz, 2008). This mode has advantages and disadvantages. Open mode implies material continuity with the environment. It requires a differential measurement of CO2, that is, there must be a sensor at the entrance to the chamber where the plant is housed and another at the outlet, measuring input-output variation as a measure of the photosynthesis (one expects that the amount of CO2 that comes out will be less than that that enters due to the fixation of CO2 by photosynthesis). The main advantage of this configuration is that the chamber does not require such a tight seal; Its main disadvantage is that for the CO2 input-output measure to be a reliable indicator of photosynthesis, a fine control of the air flow circulating through the system is required (see Kölling, George, Künzli, Flütsch, & Zeeman, 2015 ).
The Closed mode, meanwhile, involves materially isolating the system. The advantage of this configuration is that it only requires a CO2 sensor and that variations in the concentration of this molecule are a direct indicator of net photosynthetic activity. Furthermore, it does not require the implementation of an air flow regulator. However, its main limitation is that it requires a good sealing system (hermetic).
Now, to address the problem of the contribution of CO2 from the environment in the original system of “Meditative Symbiosis” (and thus have a more precise measurement of photosynthetic activity), we opted to configure the system in Closed mode (Figure 1B) ( see for example Jung, Lee, 85
86 & Son, 2018; Wheeler, 1992). Además de las ventajas referidas más arriba, contábamos con que el contenedor debería tener un sistema automático de regado, permitiendo hacer mediciones de larga duración. Sin embargo, para garantizar una ventilación apropiada del sistema, y por otras razones que describiremos más abajo, optamos por hacer que el sistema ciclara entre un modo Cerrado y una apertura al medio similar a como estaba originalmente. Así, durante el período cerrado mediríamos la actividad fotosintética sin contribución de CO2 del ambiente, y en el abierto relajaríamos esta condición, permitiendo el flujo de aire desde el exterior. La temporalidad de apertura y cierre estaría determinada empíricamente.
Con esta configuración global de funcionamiento (ciclos cerrado y abierto), nos enfocamos en diseñar un protocolo de medición de fotosíntesis en sistema cerrado. Se realizaron dos estudios, uno utilizando un mini-contenedor y otro el contenedor de tamaño real, que se describen a continuación
Materiales y métodos
Crecimiento de plantas
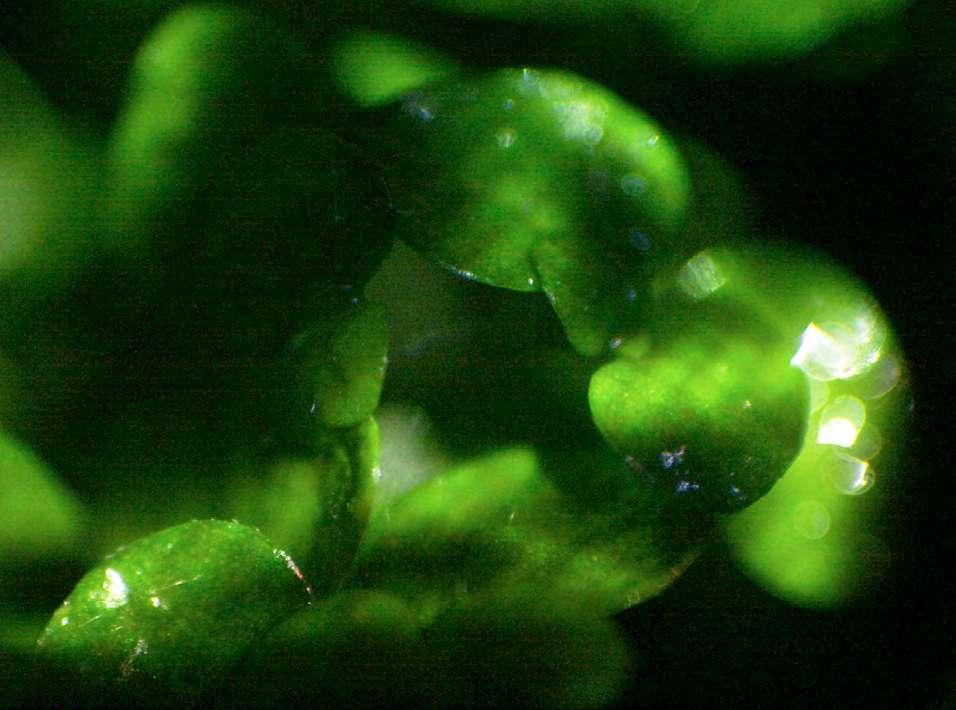
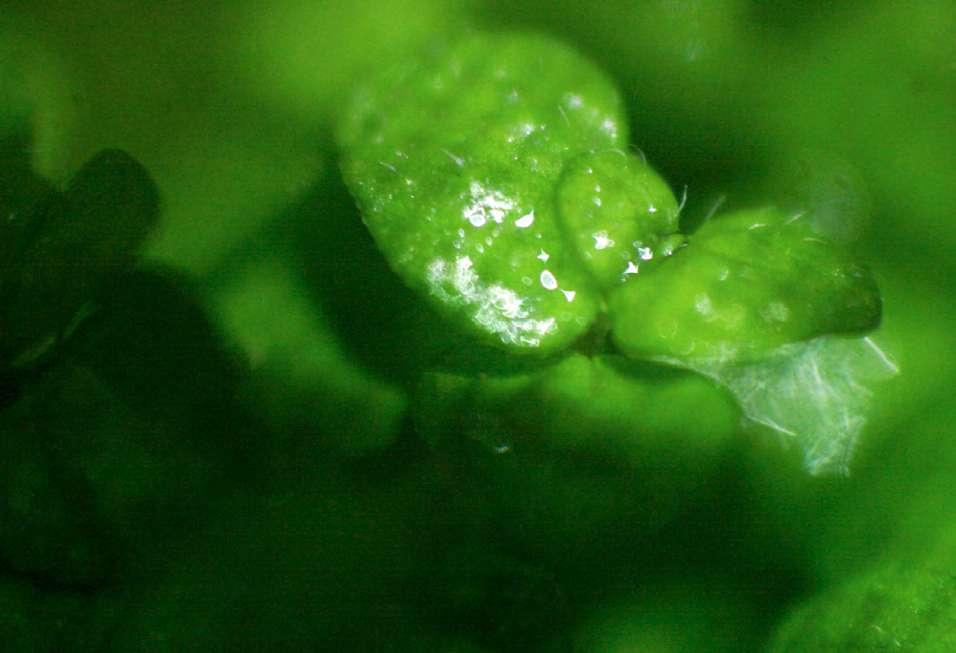
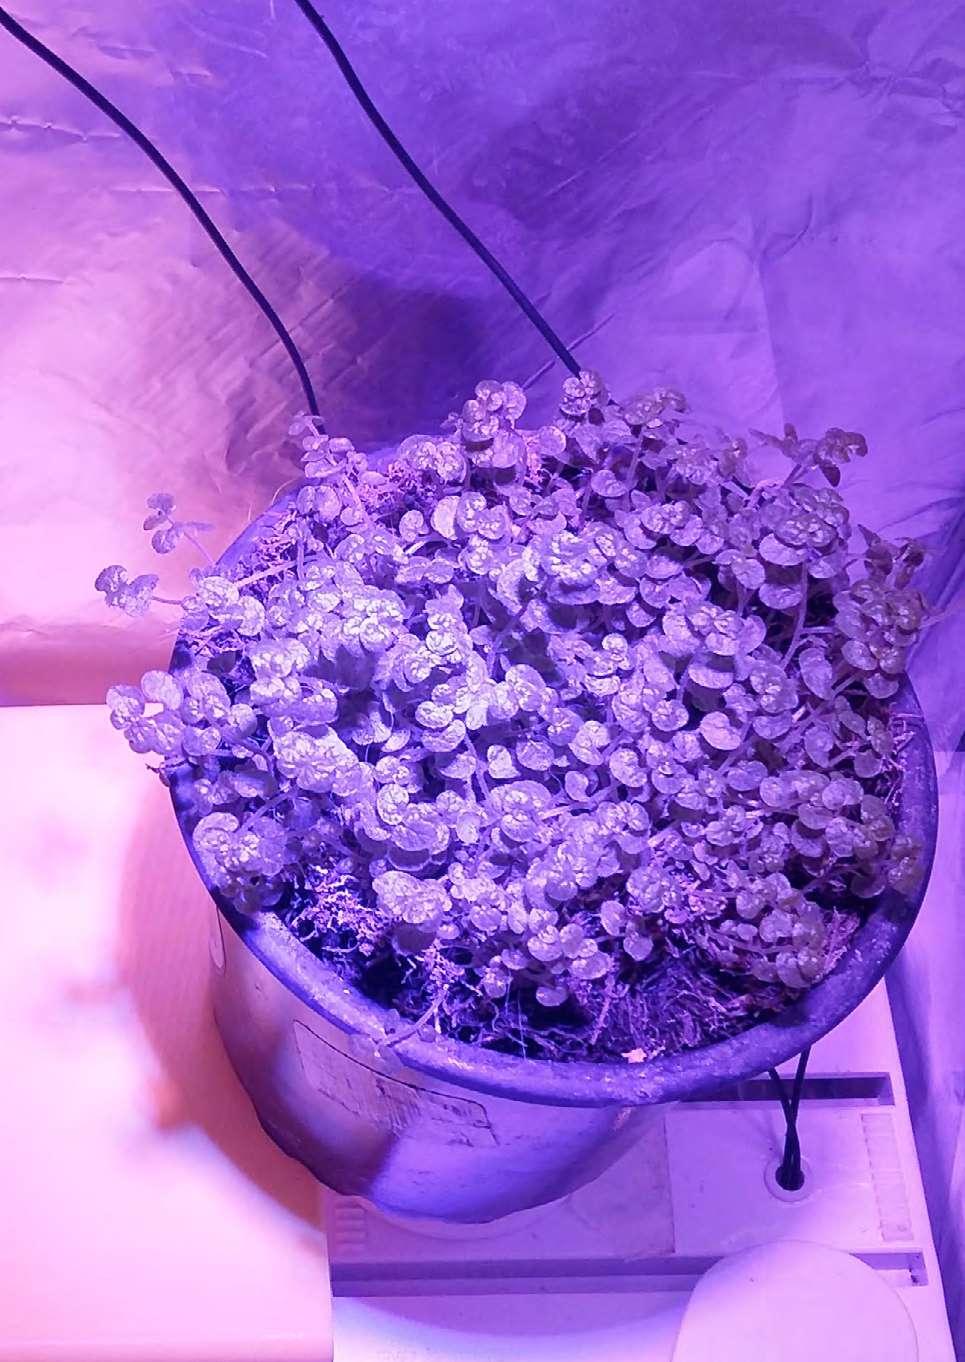
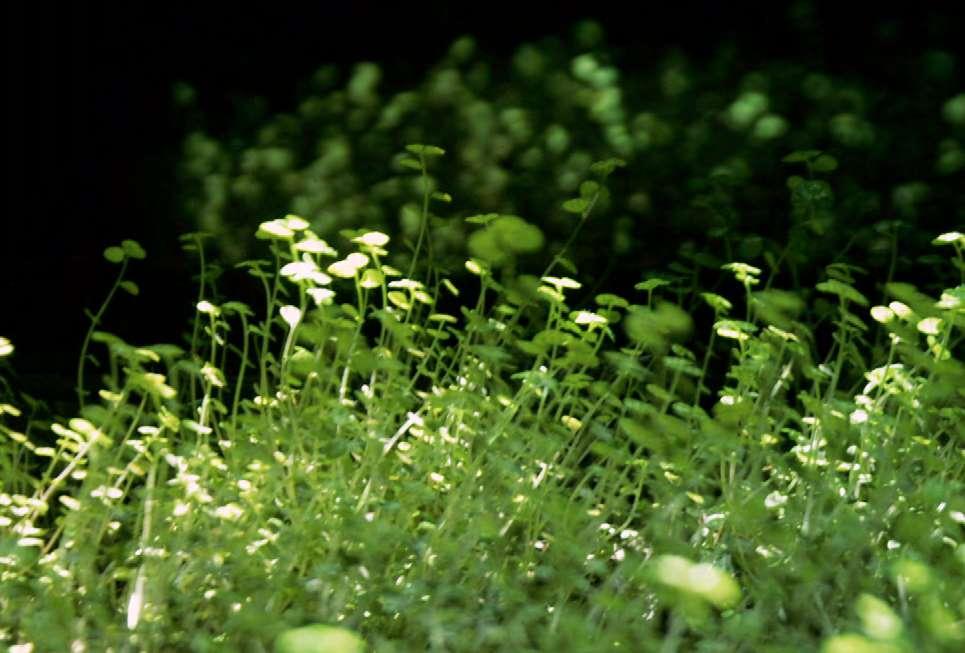
En ambos estudios se trabajó con la especie vegetal Soleirolea soleirolii. Durante el período de experimentación (aproximadamente 2 meses) las plantas fueron crecidas en pequeños maceteros, en condiciones de semi-sombra con luz natural, a temperatura ambiente 20-22°C, en dependencias del Laboratorio de Fabricación Digital (FabLab) de la Universidad de Chile. Las plantas eran regadas cada dos días.
El propósito de este estudio fue testear un protocolo para medir fotosíntesis en condiciones óptimas de iluminación descritas para S. soleirolli (Hua, 2004). Ello permitiría corroborar el buen funcionamiento de los sensores y de los sistemas de registro.
Contenedor y sistema de registros
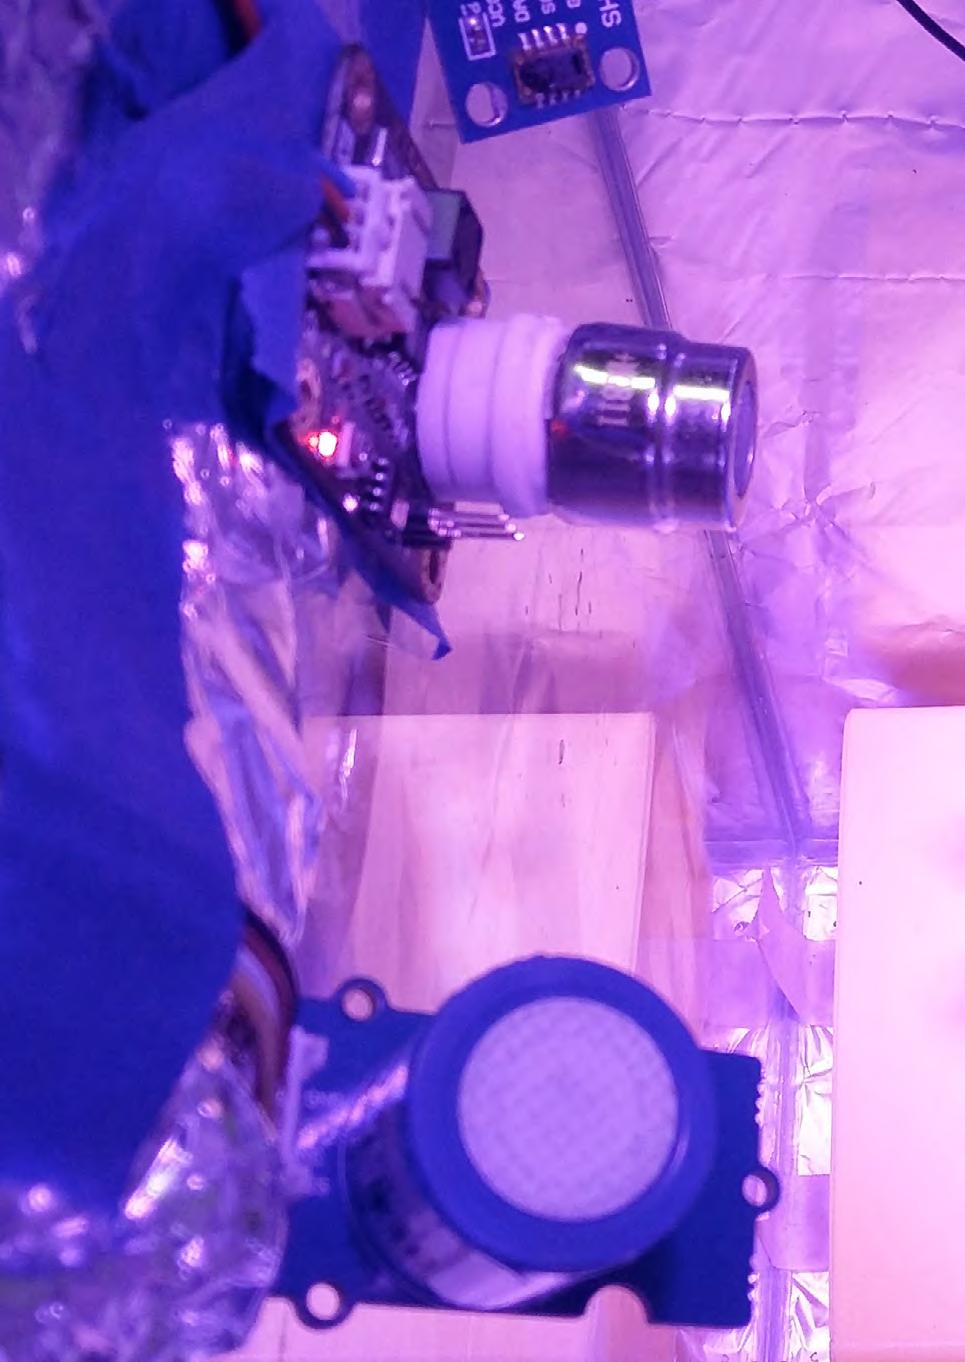
Las plantas eran situadas al interior de un recipiente de vidrio transparente de 20 x 20 x 40 cm3. El recipiente estaba cubierto por una fina lámina metálica, dejando libre un pequeño orificio en la parte superior para la entrada de luz artificial. Esto permitía tener un control sobre la luz entregada a la planta (ver más abajo). Al interior de la cámara se dispuso un sensor de CO2 infrarrojo (MH-16, Winsen). También se colocó un ventilador para favorecer la circulación de aire y el intercambio gaseoso entre la planta y el aire (Long, 1996).
Kang, Hwang, & Son, 2018; Wheeler, 1992). In addition to the advantages mentioned above, we counted on the fact that the container should have an automatic watering system, allowing long-term measurements to be made. However, to ensure proper ventilation of the system, and for other reasons described below, we opted to cycle the system between a Closed mode and an open to medium similar to how it was originally. Thus, during the closed period we would measure the photosynthetic activity without contribution of CO2 from the environment, and in the open we would relax this condition, allowing air flow from the outside. The timing of the opening and closing would be determined empirically.
With this global operating configuration (closed and open cycles), we focused on designing a closed system photosynthesis measurement protocol. Two studies were conducted, one using a mini-container and the other using the full-size container, which are described below.
Materials and methods
Plant growth
In both studies, the plant species Soleirolea soleirolii was used. During the experimentation period (approximately 2 months) the plants were grown in small pots, under semi-shaded conditions with natural light, at room temperature 20-22 ° C, in the premises of the Digital Manufacturing Laboratory (FabLab) of the University. From Chile. The plants were watered every two days.
The purpose of this study was to test a protocol to measure photosynthesis under optimal lighting conditions described for S. soleirolli (Hua, 2004). This would allow corroborating the proper functioning of the sensors and the recording systems.
Container and records system
The plants were placed inside a 20 x 20 x 40 cm3 transparent glass container. The container was covered by a thin metal foil, leaving a small hole in the upper part free for the entry of artificial light. This allowed to have control over the light delivered to the plant (see below). An infrared CO2 sensor (MH-16, Winsen) was placed inside the chamber. A fan was also placed to promote air circulation and gas exchange between the plant and the air (Long, 1996). 87
88
La luz artificial era generada por un foco led de cultivo indoor -Full Espectro De Luz- Dg5 situado en la parte superior del contenedor. La intensidad de la luz usada fue calibrada usando un sensor de Radiación Fotosintética Activa (PAR, siglas en inglés). Durante el protocolo de trabajo se estimuló a las plantas con niveles de intensidad de 200 umol/m2s-1 (unidades de actividad PAR), que de acuerdo con Hua (2004) producen máxima actividad fotosintética en S.Soleirolli.
Para la recolección de datos desde el sensor de CO2 se usó un procesador Arduino, conectado a un laptop. Para la visualización de los datos en tiempo real se uso el programa Kst.
Protocolo
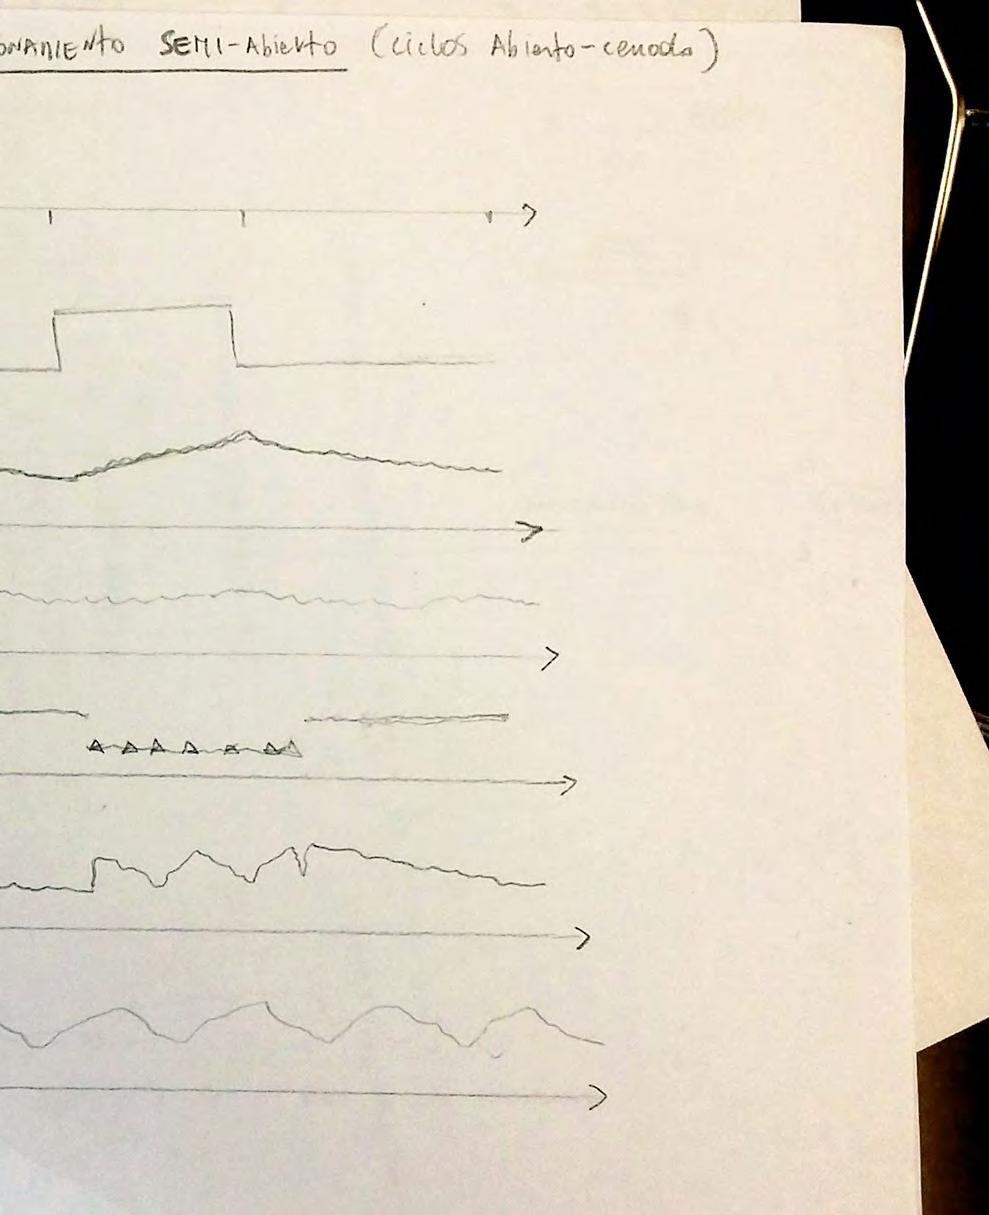
En la primera fase, las plantas eran situadas en el contenedor y adaptadas a oscuridad por treinta minutos con el contenedor abierto. Luego se cerraba el contenedor y eran adaptadas (en oscuridad) por una hora. Posteriormente se daban pulsos alternados de luz (200um) y oscuridad, de veinte minutos de duración cada uno (similar a la estructura temporal presentada por Pearcy y cols. (1985). Este protocolo simple de medición de fotosíntesis permite testear las condiciones de borde de estimulación, en este caso máxima estimulación por luz y oscuridad. Teóricamente, esperábamos observar que durante los períodos de oscuridad el CO2 aumentara (por la respiración de la planta y el suelo) y que con Luz disminuyeran (por la asimilación debida a la fotosíntesis).
Resultados y conclusiones
En la figura (x) se muestran los resultados del Estudio 1. Como se observa, durante los períodos de oscuridad se produce un aumento en los niveles de CO2, mientras que en la fase de estimulación lumínica vemos una disminución de los niveles de CO2, consistente con la asimilación inducida por la fotosíntesis.
Estos resultados muestran que nuestros dispositivos permiten medir actividad fotosintética neta en condiciones óptimas de estimulación lumínica para la especie S. Soleirolii.
El propósito principal de este estudio fue evaluar si podíamos replicar las observaciones anteriores, pero usando el contenedor final. En este caso, se imponían dos condiciones que podían limitar la medición de fotosíntesis: 1) el mayor tamaño del contenedor, que hace que las variaciones relativas en los niveles de CO2 sean más difíciles de detectar, y 2) que la estimulación
The artificial light was generated by an indoor growing LED spotlight -Full Spectrum Of Light- Dg5 located in the upper part of the container. The intensity of the light used was calibrated using an Active Photosynthetic Radiation (PAR) sensor. During the work protocol, the plants were stimulated with intensity levels of 200 umol / m2s-1 (PAR activity units), which according to Hua (2004) produce maximum photosynthetic activity in S.Soleirolli.
For data collection from the CO2 sensor an Arduino processor was used, connected to a laptop. The Kst program was used to visualize the data in real time.
Protocol
In the first phase, the plants were placed in the container and adapted to darkness for thirty minutes with the container open. Then the container was closed and they were adapted (in the dark) for one hour. Subsequently, alternating pulses of light (200um) and darkness were given, each lasting twenty minutes (similar to the temporal structure presented by Pearcy et al. (1985). This simple photosynthesis measurement protocol allows testing the border conditions of stimulation, in this case maximum stimulation by light and darkness. Theoretically, we expected to observe that during periods of darkness CO2 would increase (due to plant and soil respiration) and that with Light they would decrease (due to assimilation due to photosynthesis) .
Results and conclusions
In figure (x) the results of Study 1 are shown. As can be seen, during periods of darkness there is an increase in CO2 levels, while in the light stimulation phase we see a decrease in CO2 levels. consistent with assimilation induced by photosynthesis.
These results show that our devices allow us to measure net photosynthetic activity under optimal conditions of light stimulation for the species S. Soleirolii.
The main purpose of this study was to evaluate if we could replicate the previous observations, but using the final container. In this case, two conditions were imposed that could limit the photosynthesis measurement: 1) the larger size of the container, which makes the relative variations in CO2 levels more difficult to detect, and 2) that the light stimulation is of 89
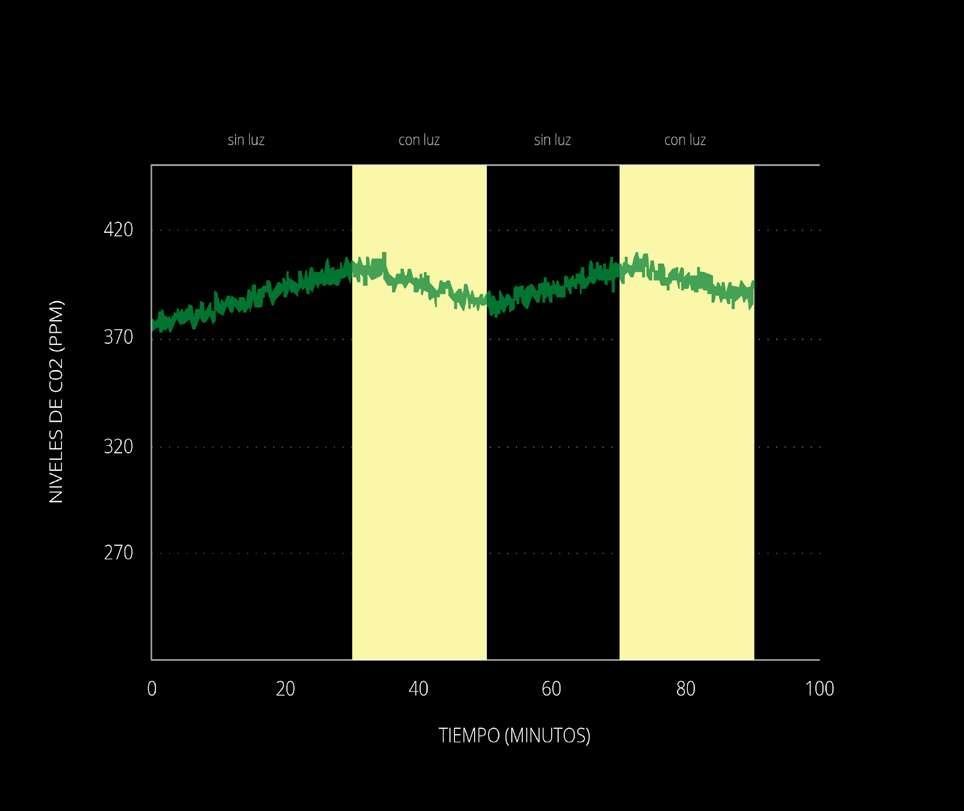
Gráfica representativa del estudio 1. Las zonas amarillas indican los momentos de estimulación lumínica. En esta gráfica se ha omitido el período de adecuación por 1 hora en oscuridad.
Representative graph of study 1. The yellow areas indicate the moments of light stimulation. In this graph, the adaptation period for 1 hour in the dark has been omitted.
30 cms C
30 cms
(cara / face)
A B
D
90 cms
40 cms 25 cms
(cara / face)
E
G
A
B
C
D
E
F
G Proyector Projector
Abastecimiento eléctrico y computador Electric supply and computer
Extractor de aire Exhaust fan
Sensores de CO2 y temperatura CO2 and temperature sensors
Planta Plant
Conducto de aire y extractor Air duct and exhaust fan
Bomba de agua y sistema de drenaje Air pump and drain system
Vista superior de la plataforma con planta Upper view to platform with plant
30 cms
B E
Contenedor
Dimensiones físicas del contenedor y componentes Container
Physical dimensions of the container and components: * (this point can be included separately)
92 lumínica es de menor intensidad. De hecho, el nivel de estimulación lumínica máxima que logramos con el proyector fue de entorno a los 40-50 (unidades de radiación fotosintética), bastante menor que el valor de 200 reportado como adecuado para obtener respuesta máxima (Hua 2004). Por lo tanto, esperábamos observar variaciones de CO2 de menor magnitud que en el estudio 1.
Luz
La intensidad lumínica del proyector a utilizar es de 3.000 Lúmenes. Según estudios preliminares el tipo de especie a tratar puede inhibir su actividad fotosintética cuando la intensidad lumínica sobrepasa los 12.900 Lux, la que equivale a 12.900 Lúmenes por metro cuadrado. El área a trabajar posee menos de 0,23 mt2, lo que nos permite calcular una intensidad de aproximadamente 2.580 Lux en la superficie de cultivo. Considerando la capacidad lumínica del proyector, este instrumento es adecuado para el proyecto.
Protocolo
La estructura del protocolo fue la misma que la usada en el estudio 1 (adaptación a oscuridad por 1 hora, seguida de pulsos de luz y oscuridad). Este protocolo nos permitiría no solo evaluar la posibilidad de medir fotosíntesis en el contenedor final, si no que evaluar la velocidad de respuesta de la planta. La observación de la respuesta de la planta en los bordes (mínima y máxima estimulación lumínica) nos permitiría construir la función que traduce los niveles de CO2 registrados en estimulación lumínica (expresado como los niveles de fractalización de la figura).
Sistemas de medición
En este estudio incorporamos sensores de humedad y de temperatura. El monitoreo de estos parámetros es importante no solo por su relevancia en los procesos de fotosíntesis sino que para el mantenimiento más global del sistema.
Todos los sensores fueron conectados a Arduino y este a un computador que permitía el almacenamiento de los datos y la visualización de los mismos en tiempo real.
less intensity. In fact, the maximum light stimulation level that we achieved with the projector was around 40-50 (photosynthetic radiation units), well below the value of 200 reported as adequate to obtain maximum response (Hua 2004). Therefore, we expected to observe variations in CO2 of lesser magnitude than in study 1.
Light
The light intensity of the projector to be used is 3,000 Lumens. According to preliminary studies, the type of species to be treated can inhibit its photosynthetic activity when the light intensity exceeds 12,900 Lux, which is equivalent to 12,900 Lumens per square meter. The area to be worked has less than 0.23 mt2, which allows us to calculate an intensity of approximately 2,580 Lux in the cultivation surface. Considering the light capacity of the projector, this instrument is suitable for the project.
Protocol
The structure of the protocol was the same as that used in study 1 (adaptation to darkness for 1 hour, followed by pulses of light and darkness). This protocol would allow us not only to evaluate the possibility of measuring photosynthesis in the final container, but also to evaluate the response speed of the plant. The observation of the response of the plant at the edges (minimum and maximum light stimulation) would allow us to construct the function that translates the CO2 levels recorded into light stimulation (expressed as the fractalization levels in the figure).
Measurement systems
In this study we incorporate humidity and temperature sensors. Monitoring these parameters is important not only for its relevance in photosynthesis processes but also for the more global maintenance of the system.
All the sensors were connected to Arduino and this to a computer that allowed the data storage and visualization in real time. 93
Resultados y conclusiones
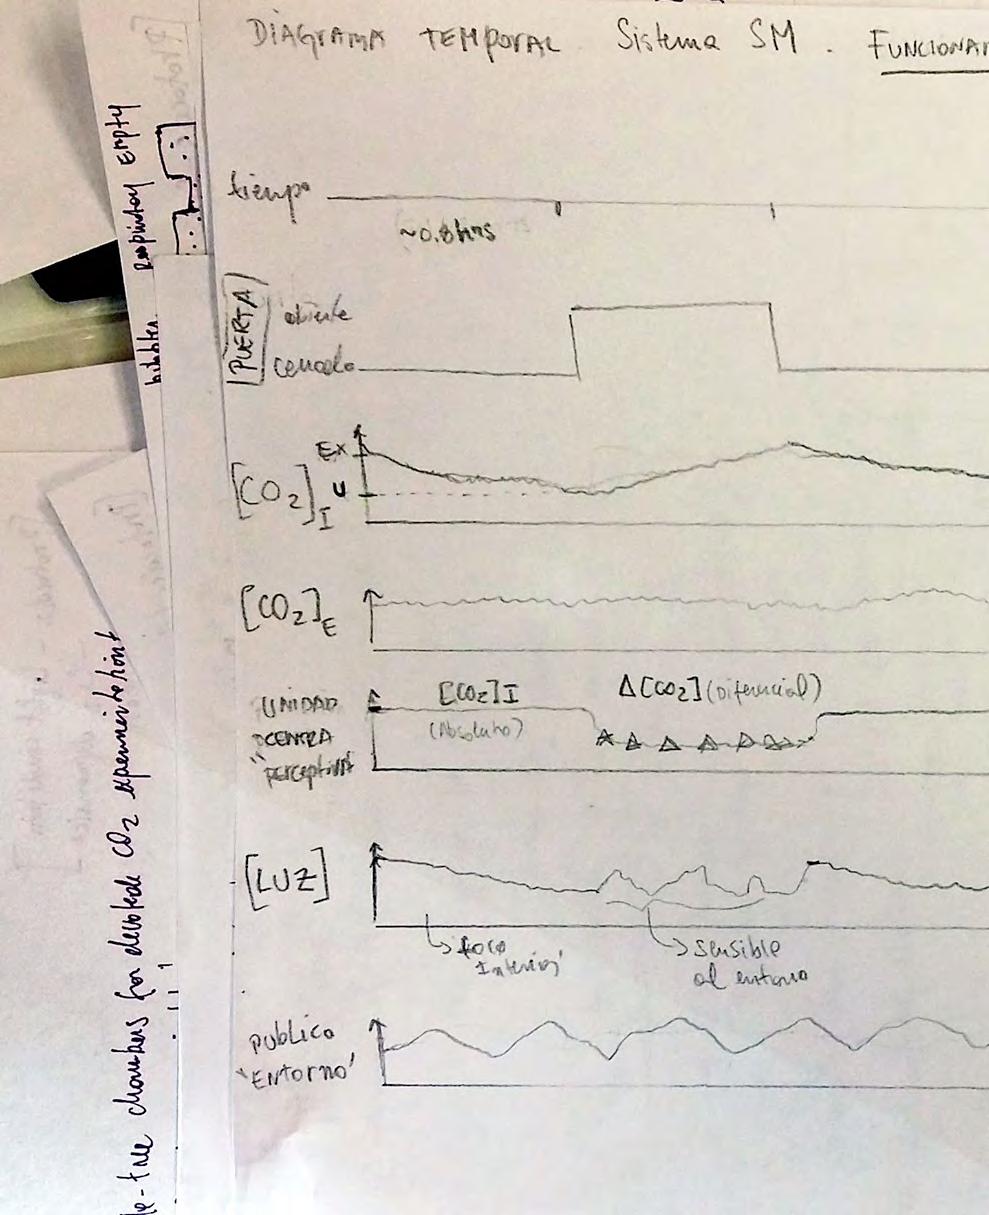
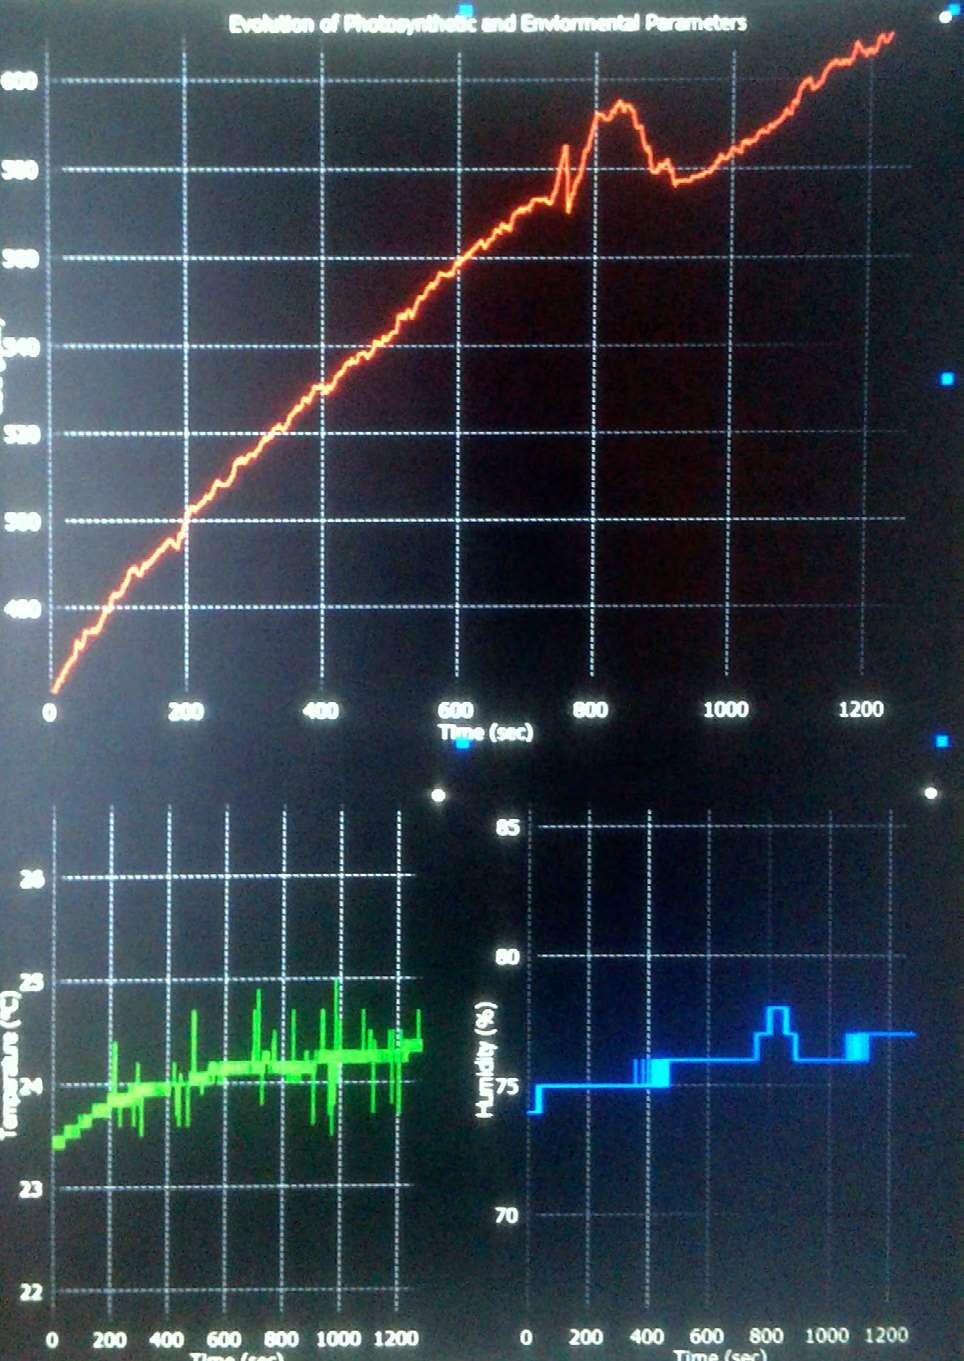
En la Figura 3 se muestra una gráfica representativa de los resultados del estudio 2. A diferencia del estudio 1 vemos que los niveles de CO2 no disminuyen con los pulsos de luz, pero sí se observa una disminución en la tasa de aumento del CO2: la pendiente de la curva durante los períodos de oscuridad es mayor que en las zonas de estimulación lumínica. Esto sugiere que, aunque el nivel de estimulación lumínica no es suficiente para contrarrestar totalmente la liberación de CO2 producida por la respiración celular, sí logra reducir esta velocidad. Esta reducción de la velocidad plausiblemente se debe a la actividad fotosintética de la planta, y puede ser ella usada como un indicador de la actividad fotosintética.
En cuanto a la temperatura, pudimos observar que se mantiene estable. La humedad ambiente aumenta con el cerrado del sistema.
94
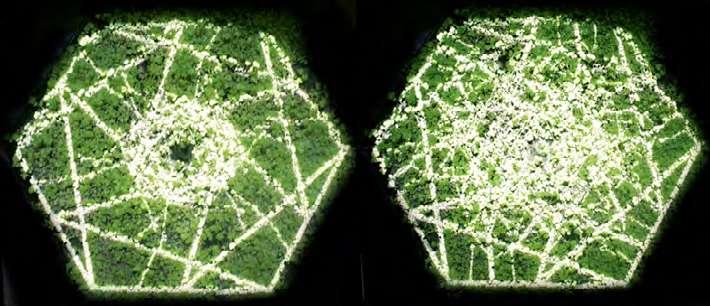
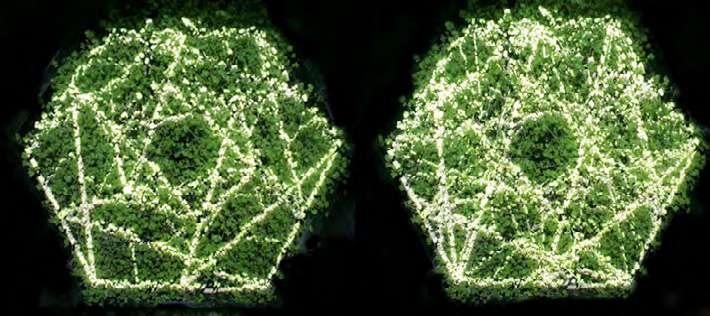
Diversas variables de intensidad lumínica que afectan a la planta debido al aumento o disminución en la ramificación del patrón fractal. Various light intensity variables that affect the plant due to the increase or decrease in the branching of the fractal pattern.
Results and conclusions
Figure 3 shows a representative graph of the results of study 2. Unlike study 1, we see that CO2 levels do not decrease with light pulses, but there is a decrease in the rate of increase of CO2: slope of the curve during dark periods is greater than in light stimulation areas. This suggests that, although the level of light stimulation is not sufficient to totally counteract the release of CO2 produced by cellular respiration, it does reduce this speed. This reduction in speed is plausibly due to the photosynthetic activity of the plant, and can be used as an indicator of photosynthetic activity.
Regarding the temperature, we could observe that it remains stable. Ambient humidity increases when the system is closed.
95
96
97
98
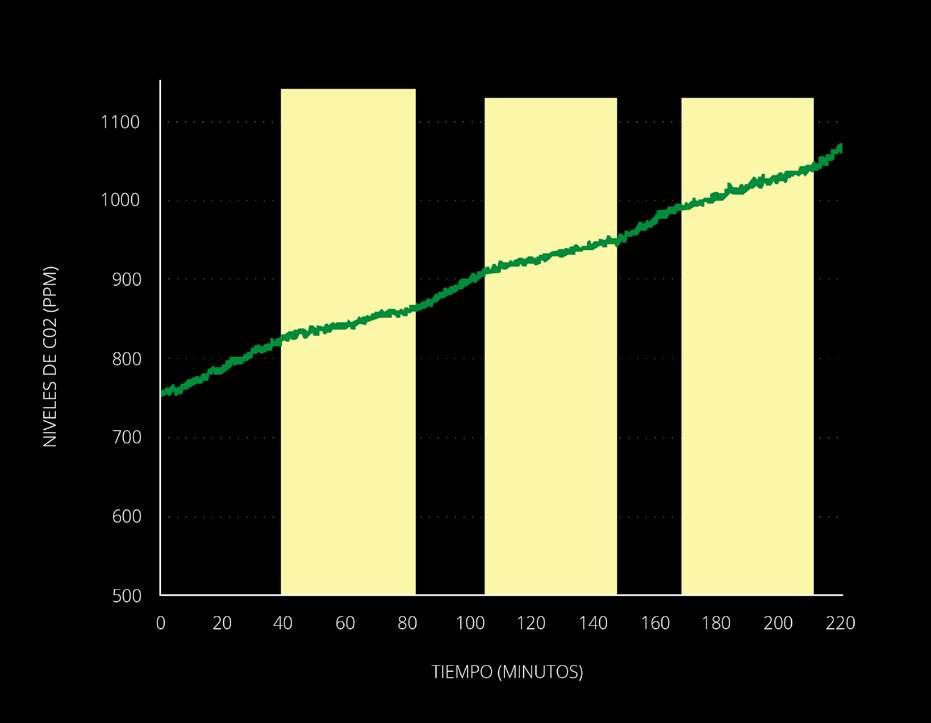
Estudio 2: medición de fotosíntesis en contenedor grande Study 2: Measurement of Large Container Photosynthesis
99
Referencias
Gonzales Valerio, M. A. (2014). Hacer la presencia. Fotografía, arte y (bio)tecnología. México, Herder.
Hopkins, W., & Hüner, N. (2009). Introduction to Plant Physiology (4th ed.). John Wiley and Sons.
100
Hua, Y. (2004). Radiation (PAR) scope of indoor grouth of Soleirolia soleirolii. Chinese Journal of Ecology, 23(3), 20–23.
Jung, D. H., Lee, J. W., Kang, W. H., Hwang, I. H., & Son, J. E. (2018). Estimation of Whole Plant Photosynthetic Rate of Irwin Mango under Artificial and Natural Lights Using a Three-Dimensional Plant Model and Ray-Tracing. International Journal of Molecular Sciences, 1–14. https://doi.org/10.3390/ijms19010152
Kölling, K., George, G. M., Künzli, R., Flütsch, P., & Zeeman, S. C. (2015). A whole - plant chamber system for parallel gas exchange measurements of Arabidopsis and other herbaceous species. Plant Methods, 1–12. https://doi.org/10.1186/s13007-015-0089-z
Long, S. P., Farage, P. K., & Garcia, R. L. (1996). Measurement of leaf and canopy photosynthetic C02 exchange in the field. Journal of Experimental Botany, 47(304), 1629–1642.
Pearcy, R. W., Osteryoung, K., & Calkin, H. W. (1985). Photosynthetic Responses to Dynamic Light Environments by Hawaiian Trees, 79, 896–902.
Takahashi, N., Ling, P., & Frantz, J. (2008). Considerations for Accurate Whole Plant Photosyntesis Measurement. Enviormental Control Biology, 46(2), 91–101.
Wheeler, R. M. (1992). Gas-exchange Measurements using a Large, Closed Plant Growth Chamber. HortScience, 27(7), 777–780.
Helder, Marjolein. (2012) Design criteria for the Plant-Microbial Fuel Cell: Electricity generation with living plants – from lab to application.
Referencias
Hopkins, W., & Hüner, N. (2009). Introduction to Plant Physiology (4th ed.). John Wiley and Sons.
Hua, Y. (2004). Radiation (PAR) scope of indoor grouth of Soleirolia soleirolii. Chinese Journal of Ecology, 23(3), 20–23.
Jung, D. H., Lee, J. W., Kang, W. H., Hwang, I. H., & Son, J. E. (2018). Estimation of Whole Plant Photosynthetic Rate of Irwin Mango under Artificial and Natural Lights Using a Three-Dimensional Plant Model and Ray-Tracing. International Journal of Molecular Sciences, 1–14. https://doi.org/10.3390/ijms19010152
Kölling, K., George, G. M., Künzli, R., Flütsch, P., & Zeeman, S. C. (2015). A whole - plant chamber system for parallel gas exchange measurements of Arabidopsis and other herbaceous species. Plant Methods, 1–12. https://doi.org/10.1186/s13007-015-0089-z
Long, S. P., Farage, P. K., & Garcia, R. L. (1996). Measurement of leaf and canopy photosynthetic C02 exchange in the field. Journal of Experimental Botany, 47(304), 1629–1642.
Pearcy, R. W., Osteryoung, K., & Calkin, H. W. (1985). Photosynthetic Responses to Dynamic Light Environments by Hawaiian Trees, 79, 896–902.
Takahashi, N., Ling, P., & Frantz, J. (2008). Considerations for Accurate Whole Plant Photosyntesis Measurement. Enviormental Control Biology, 46(2), 91–101.
Wheeler, R. M. (1992). Gas-exchange Measurements using a Large, Closed Plant Growth Chamber. HortScience, 27(7), 777–780.
Helder, Marjolein. (2012) Design criteria for the Plant-Microbial Fuel Cell: Electricity generation with living plants – from lab to application. 101
102
103
104
105
FALTA FOTO DETALLES 3
106
FALTA FOTO DETALLES 4

107

FALTA FOTO DETALLES 1
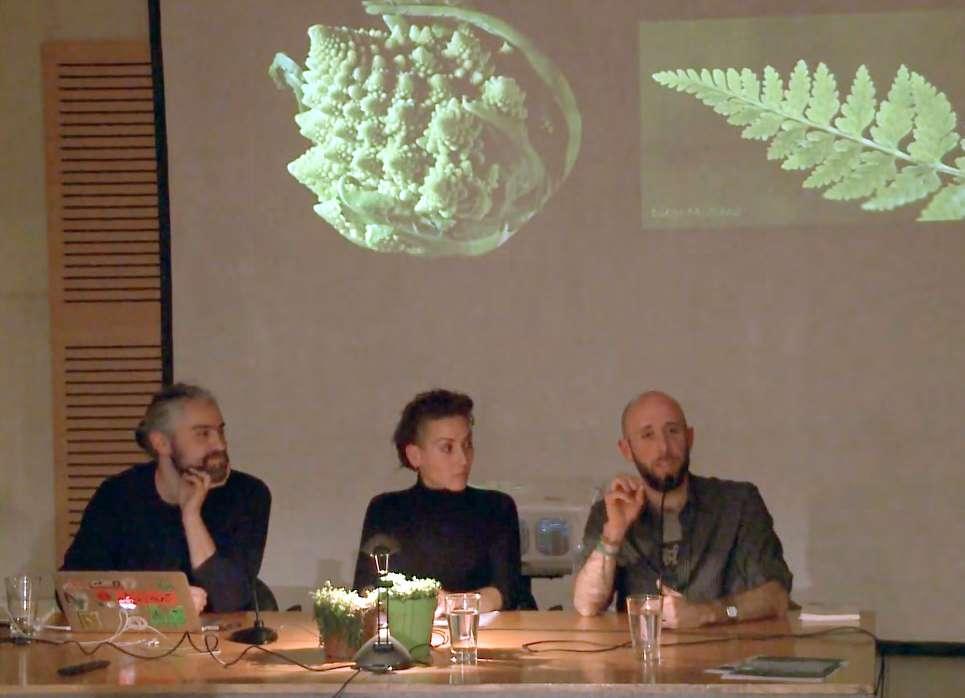
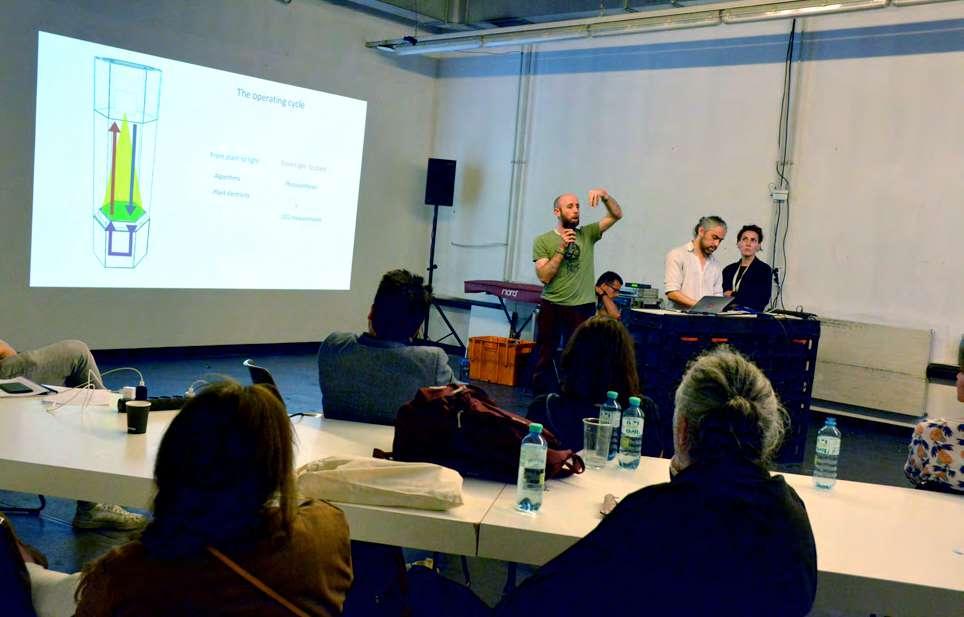
Superior: Seminario Campo Abierto MAC Santiago, 2019. CL / Above: Campo Abierto seminar at MAC Santiago 2019. CL Inferior: Charla Simbiosis Meditativa en Ars Electronica 2019. AU / Below: Talk Meditative Symbiosis at Ars Electronica 2019. AU
FALTA FOTO DETALLES 2
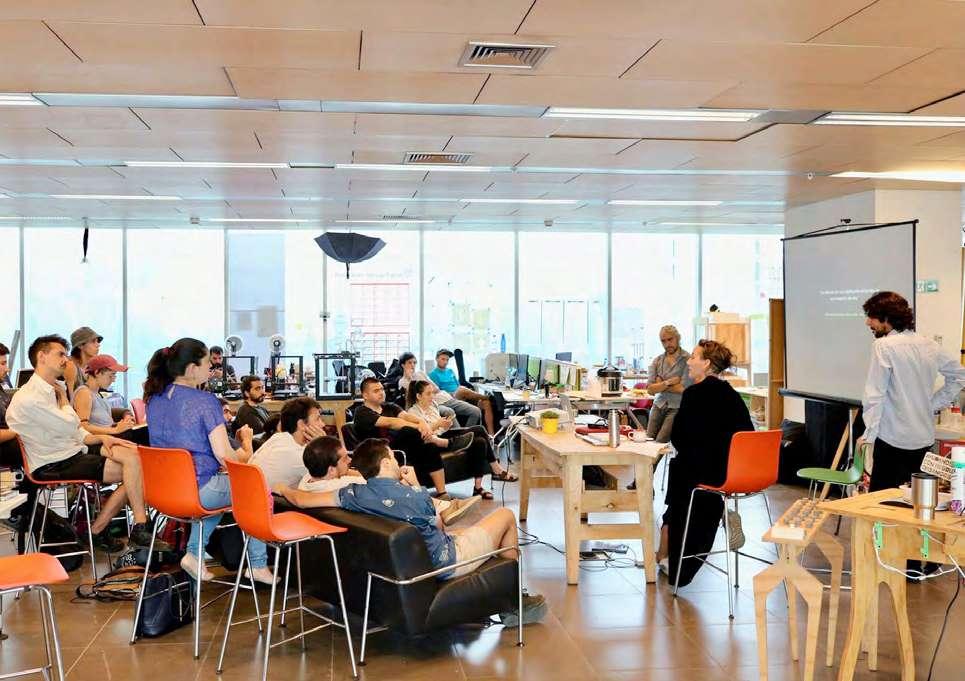
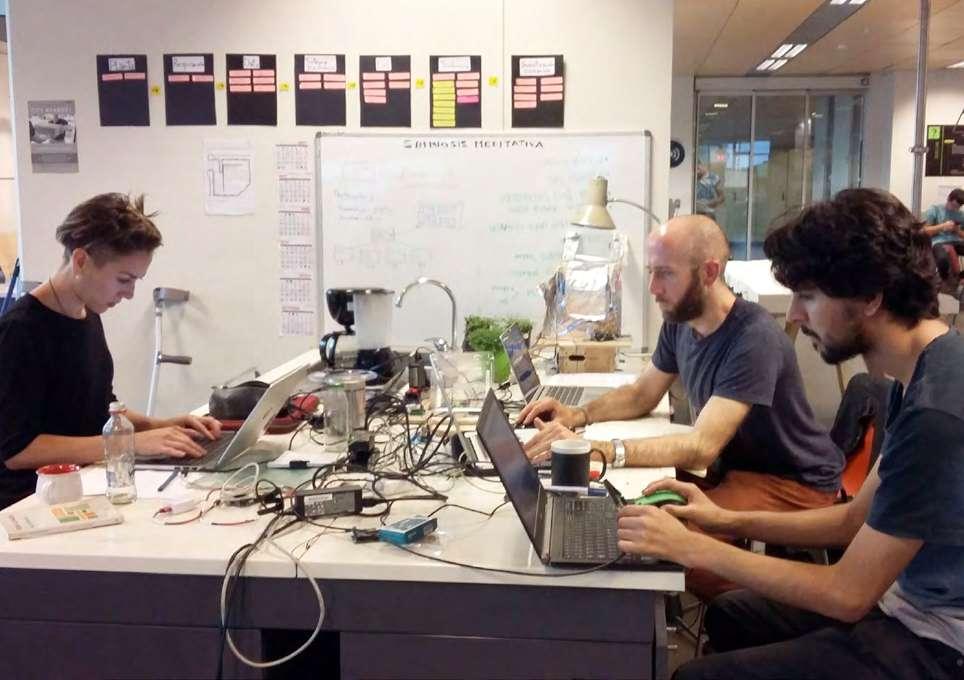
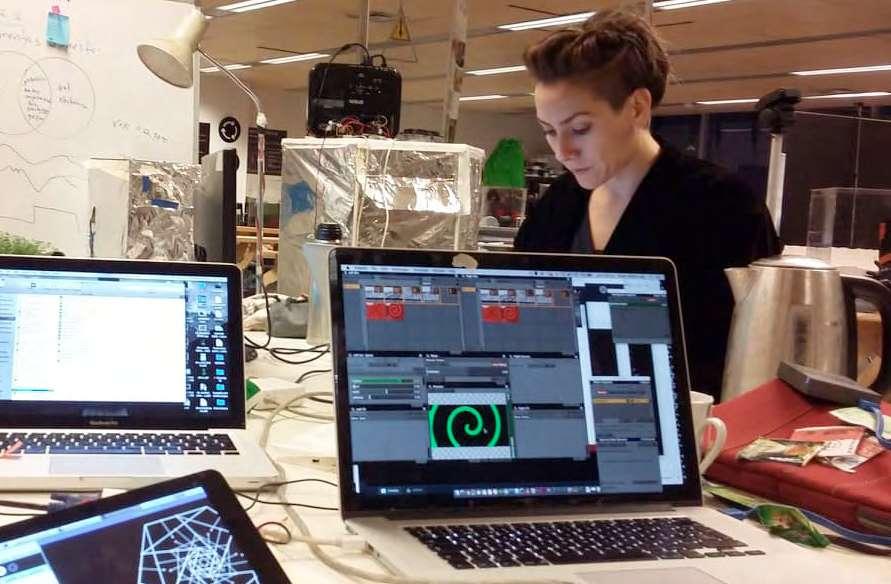
Superior: Charla Simbiosis Meditativa en Fablab U.Chile. 2019. CL / Above: Talk Meditative Symbiosis at Fablab U.Chile. 2019. CL Inferior: Charla Simbiosis Meditativa en Fablab Barcelona. 2020. ES / Below: Talk Meditative Symbiosis at Fablab BCN 2019. ES.
110
111
Agradecimientos especiales al equipo de Fablab U. De Chile:
Danisa Peric, directora ejecutiva Joaquin Rosas, coordinador Gonzalo Olave, asesor en ingeniería eléctrica Victor Contreras, asesor en fabricación Joakin Ugalde, asesor en fabricación Mercedes Valdovinos, comunicaciones
Otros títulos de Adrede Editora:
La isla [re]conocimiento Colección Catálogos Rainer Krause
Teatro de Chile Colección Investigaciones VVAA
Ciudad sísifo Colección Catálogos Matías Allende y Carol Illanes
Ciencia abierta · Open Science Colección Investigaciones Ignacio Nieto y Marcelo Velasco
Súbita política Colección Catálogos Rodolfo Andaur
Semi diurno Colección Catálogos Claudia Müller
En Marcha Colección Investigaciones Consuelo Banda y Valeska Navea
Colección Catálogos

1 Jean Danton Laffe - Karin A udillo2 3 4 5 6 7 8 9 10 11 12 13 14 15 16 17 18 19 20 21 22 23 24 25 26 27 28 29 30Simbiosis Meditativa
Habitamos la imposibilidad del silencio; coexisten() { .); //su potencialidad naturaleza(); posibilidad); }
y () { Simbiosis Meditativa,(); // una instalación de arte expandida a la investigación biológica, y .(); // Haciendo protagonista a la sencillez de una planta urticácea como la
(); // de este ser vivo, es una puesta en acción de todo un proceso de [ y los movimientos(); // casi imperceptibles del crecimiento, * //en la performance lenta de nuestros pares vegetales.


