This report is partially funded by the soybean checkoff.
Staff Credits
Bethany Baratta | Editor
Kriss Nelson | Staff Writer
Susan Langman | Creative Design Coordinator
Joclyn Bushman | Multimedia Specialist
Rosie Roberts | RCFI Technical Insights Manager
FARMER FOCUSED | DRIVEN TO DELIVER
ISA VISION
We advance the long-term competitiveness of Iowa soybean farmers.
ISA MISSION
Driven to deliver opportunities for Iowa soybean farmers to thrive.
Insights Report is published biannually by: Iowa Soybean Association 1255 SW Prairie Trail Parkway, Ankeny, Iowa 50023 (515) 251-8640 | iasoybeans.com E-mail: bbaratta@iasoybeans.com
For advertising information contact Bethany Baratta at (515) 334-1020 or bbaratta@iasoybeans.com
Comments and statewide news articles should be sent to the above address. Advertising space reservations must be made two months preceding publication. In consideration of the acceptance of the advertisement, the agency and the advertiser must, in respect of the contents of the advertisement, indemnify and save the publisher harmless against any expense arising from claims or actions against the publisher because of the publication of the content of the advertisement.
Setting the Stage
We’re eager to present to you the first edition of our Insights Report from the Iowa Soybean Association (ISA) Research Center for Farming Innovation (RCFI). Our approach is simple: we are committed to providing scientifically backed information to help farmers like you make the best decisions for your operation and the land. Within this review, you will find research and conservation projects uniquely focused on serving Iowa farmers’ needs. Our team at RCFI is driven to improve farmer productivity, profitability and sustainability by asking researchable questions to provide locallyrelevant insights and technical assistance.
The work we do at ISA is for the Iowa farmers we serve. From formulating the research questions to participating in on-farm trials to implementing the insights learned, we work by, with and through the Iowa farmer.
We are excited to share these insights with you.
Standing by to support you,
Chief Officer, Research and Conservation
Interpreting Farm Data
BY MATT CARROLL, PH.D. ISA ANALYTICS AND INSIGHTS LEAD MCARROLL@IASOYBEANS.COM
Interpreting farm data can be challenging and determining the reliability of trial results is not always simple. This article will explore some commonly used statistics in ag research, how to interpret them and follow-up questions to ask researchers and sales representatives to increase your confidence when reviewing research data.
We'll be exploring the three key principles of experimental design, the three Rs: replication, randomization and reducing noise. We’ll also dive into the relationship between statistical significance, effect size and variability of treatment responses.
Replication
Replication is achieved by placing treatments in multiple locations across the field. By doing this, researchers can assess the variability or consistency of treatment responses across the field where they are tested. Increasing the number of replications enhances our confidence in detecting real differences between treatments.
Randomization
Randomization helps account for in-field variability by randomly placing treatments across the field. Without randomization, there is a chance nonrandom features of a field, like the placement of tile lines or soil conditions, could strongly contribute to the treatment effects that a farmer observes.
Reducing noise
Reducing noise, or blocking, places all treatments in a similar area of the field. Noise is a response observed that is not attributed to the treatment being investigated, such as differences in soil organic matter. Blocking treatments allows farmers to capture micro-environmental effects better and more accurately compare treatments across all areas of a field.
The ideal experimental design combines the three Rs by randomly placing treatments within blocks and replicating these across the field. See our other publications on iasoybeans.com for more details on designing onfarm experiments.
Statistical significance
Research reports label treatment comparisons as either statistically or not statistically significant, so the average difference in yield observed differs from zero. The Iowa Soybean Association (ISA) uses a p-value, or probability value of 0.10, to declare if a difference in yield is significant. This means there is 90% confidence that if a yield difference is detected, it is because of treatment and not random chance. As p-values decrease, the mean difference needed to call a treatment significant, as well as the confidence in the measurement, increases.
Why might a trial displaying substantial average yield differences not
be statistically significant while another trial with a smaller yield difference be statistically significant?
It largely depends on two factors: the number of replications at a field site and the variability of yield response across the field.
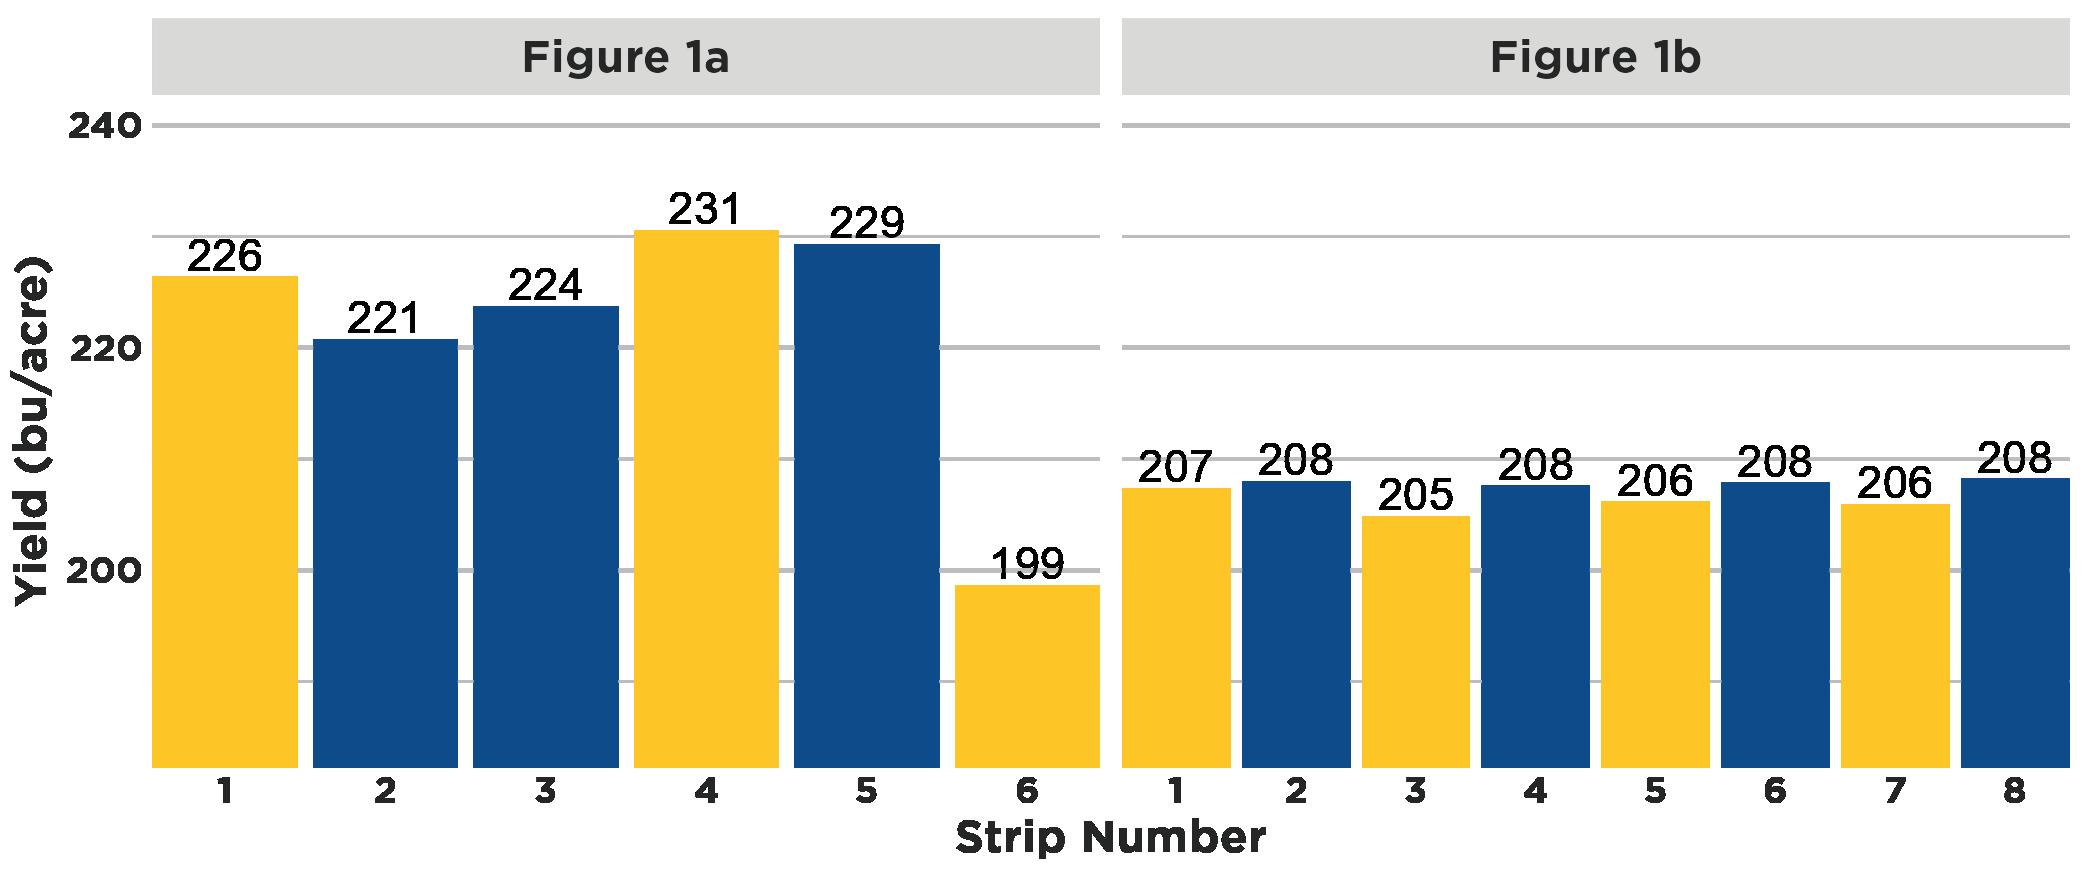
Figure 1a shows an average yield response of 6 bushels per acre (225 versus 219). The yield response of individual replications within the field shows the untreated control wins in replications one and two but loses in replication three. The yield response of 6 bushels per acre is driven by one location within the field.
This effect is not statistically significant because yield responses varied across replications, with more replicates reporting the opposite result. Additionally, this trial has low power to detect true differences in yield with only three replications.
In Figure 1b, the smaller average yield difference is statistically significant. In this trial, every treated strip won. A consistent yield response of 2 bushels per acre reduced the response variability and increased the power to detect a yield difference. However, in this example, treatments were not randomized. If there is a gradient in the field from left to right, estimating the effect separately from the treated and untreated strips will be nearly impossible. This could then overestimate the effect of the treatment observed.
The trials above are good examples of the significance of individual field trials. Single site analysis has limited ability to detect a product or management practice yield difference.
To better understand how a product or management practice is likely to perform, testing in multiple fields and years is recommended.
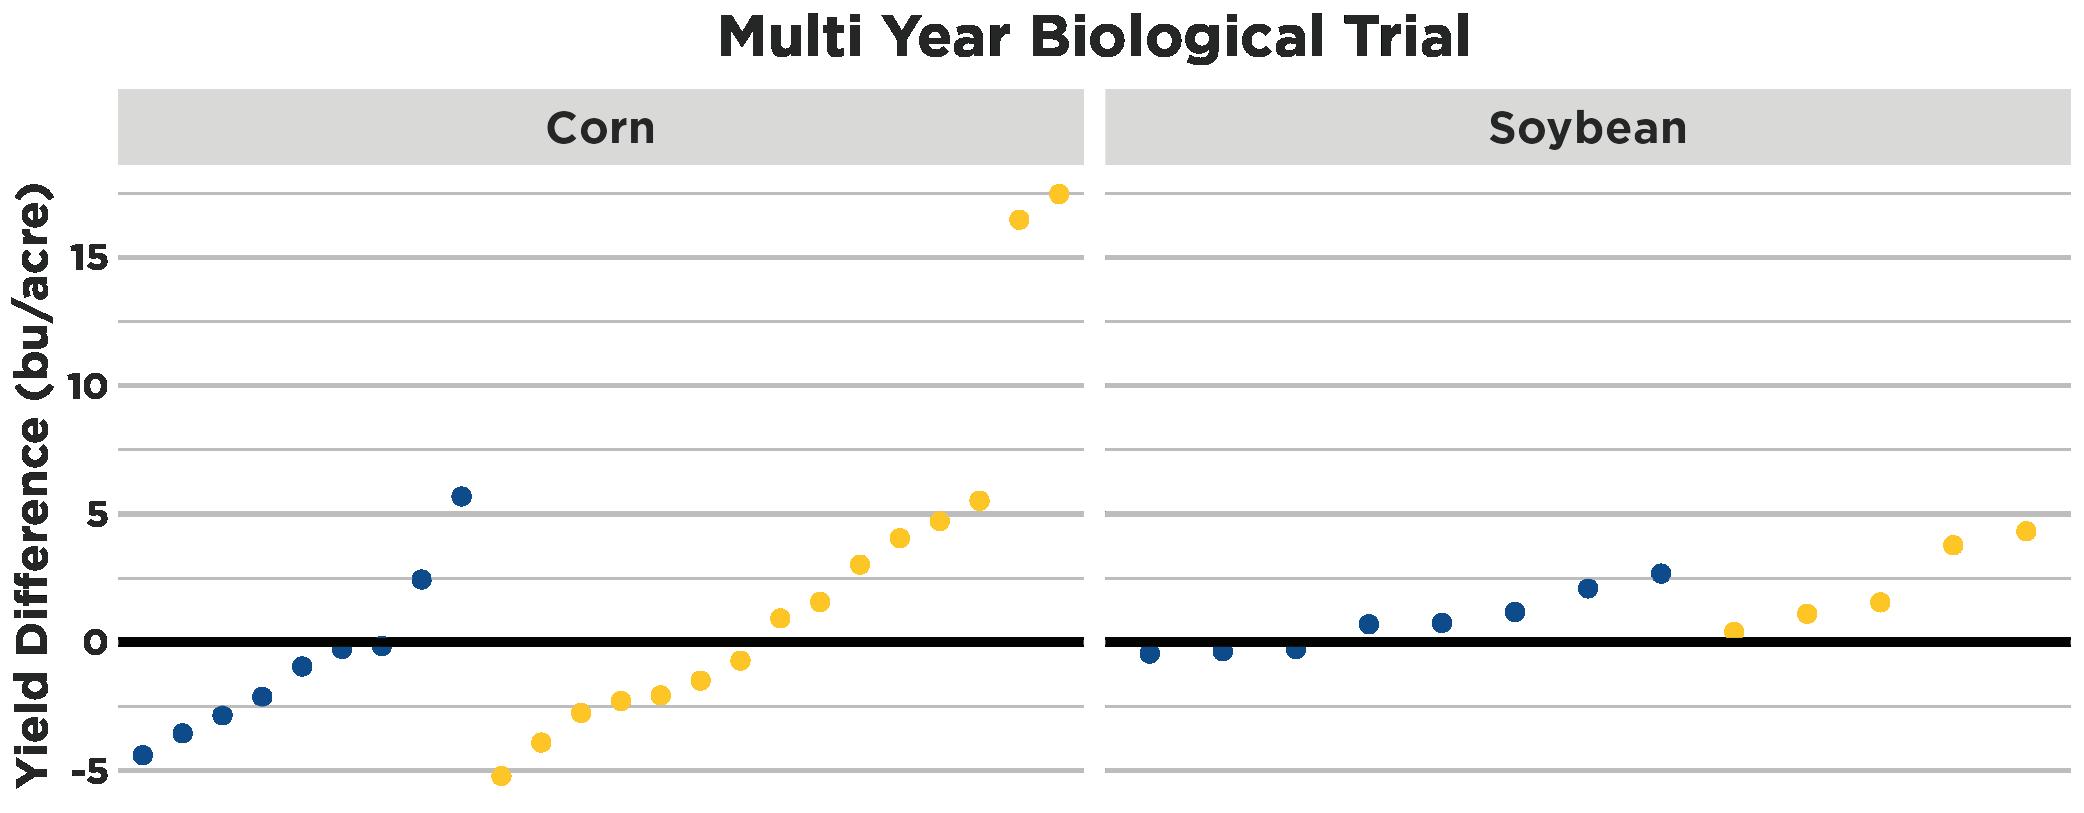
Figure 2 shows the results of a biological product tested on corn and soybeans in 2021 and 2022. Corn responses ranged from -6 to 18 bushels
per acre. Only 10 out of 24 sites had a positive yield difference, or a 42% win rate. Soybean responses ranged from -0.5 to 4.5 bushels per acre, with 10 of the 13 fields having a positive yield response and a win rate of 77%. Many of the individual sites for soybeans did not show a statistically significant yield response, but combining the data across a larger number of fields showed more confidence and the ability to detect the small yield difference from using this product.
Multiyear Biological Trial
On-farm trials are an excellent way to test new products and management practices on your farm and give you greater confidence when making decisions. This article should help you evaluate onfarm research. When reviewing products, ask the following questions:
1. How was the trial designed?
2. In how many locations was it tested?
3. What p-value was used to determine significance?
Remember, a lot of information gets hidden when only the average gets reported.
Figure 2. Results from a multiyear biological comparison of the yield difference of treated and untreated strips in corn and soybeans.
Examples of yield results and variability across the field. 1a shows a large yield response due to a single replication. 1b shows a smaller yield response that is consistent across the field.
MManaging Inputs: Seeding Rate of Soybeans
BY ALEX SCHAFFER ISA SENIOR RESEARCH AGRONOMIST ASCHAFFER@IASOYBEANS.COM
aximizing input efficiency is crucial with rising input costs affecting farm profitability and better soybean genetics available.
The Iowa Soybean Association (ISA) implemented a soybean seeding rate study comprising four different seeding rates, including 80,000, 110,000, 140,000 and 170,000 soybean seeds per acre. Using commercial equipment, researchers planted these seeding rates in randomized and replicated strips in farmers' fields, adjusting the seeding rate either by prescription or manually.
Researchers performed stand counts after emergence (around the V2 stage), and again at physiological maturity. These counts determined the targeted rate, what emerged and the number of plants contributing to yield.
Researchers collected, spatially analyzed and summarized the yield according to crop yield at the prescribed seeding rate.
In-season stand counts
The challenging 2024 planting season created an opportunity to compare soybean populations planted in April versus May.
April-planted stand counts were 15-20% below seeding rate targets, while Mayplanted stand counts were 20-25% below. This is most likely due to late wet and cool planting conditions; farmers were trying to finish planting as June approached.
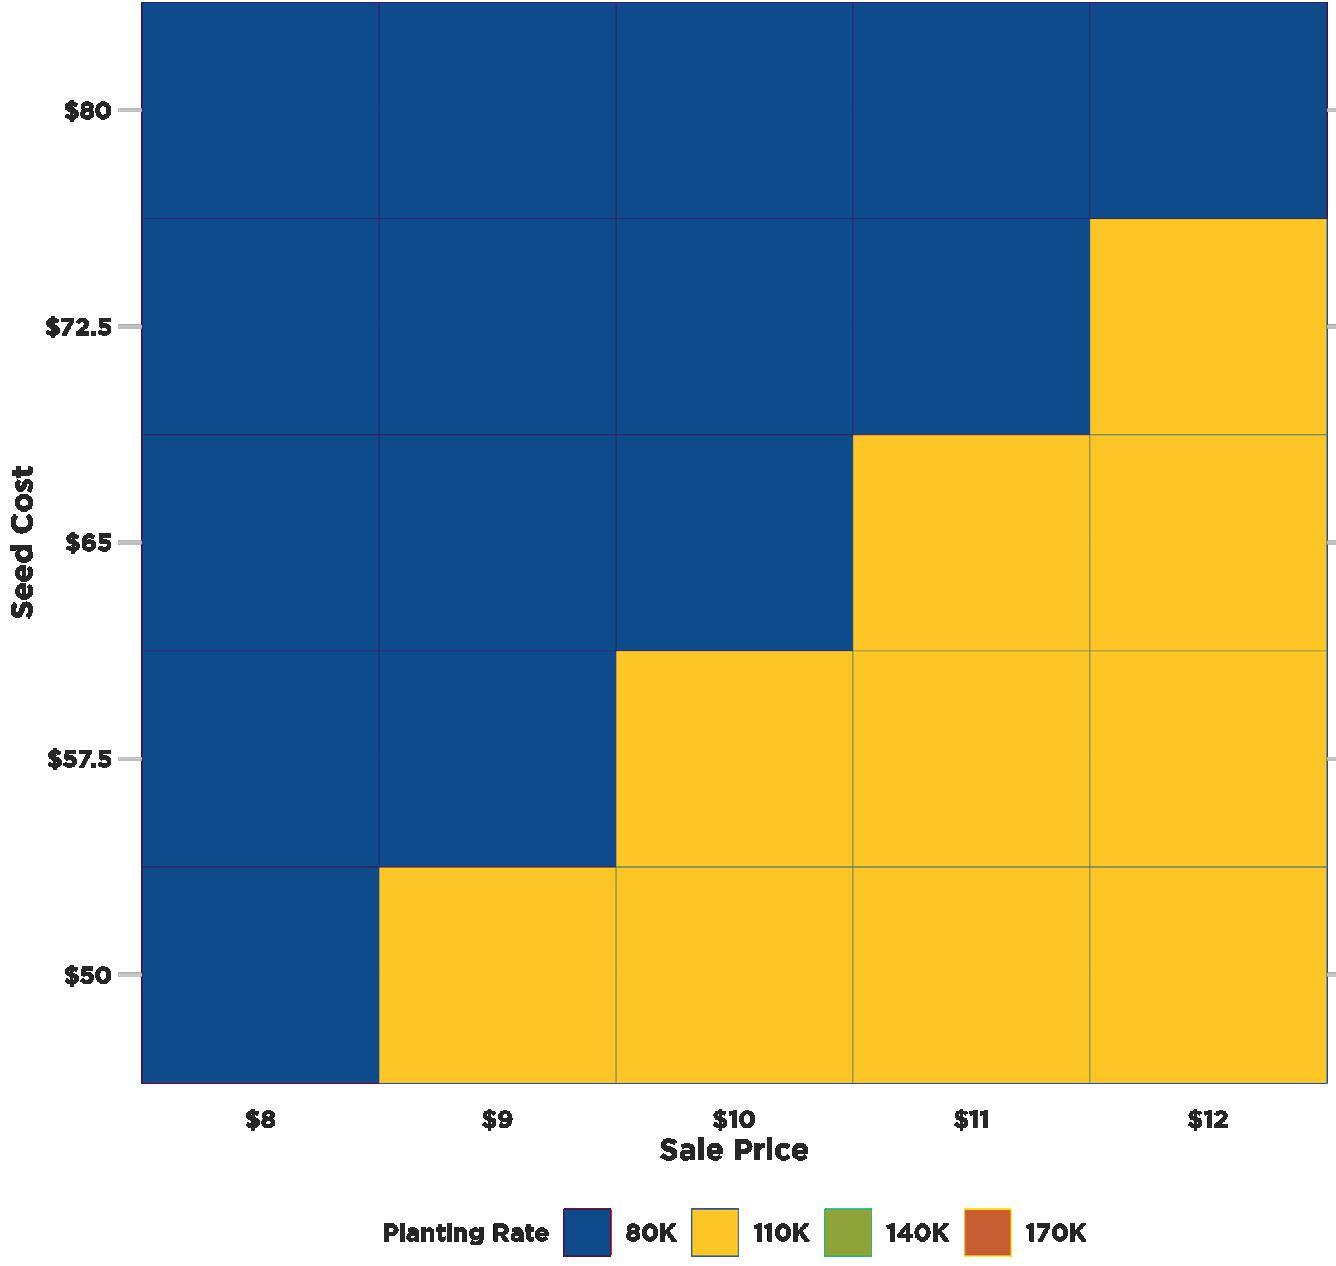
Sensitivity Analysis of Seed Cost and Sale Price
Figure 1. Optimum seeding rate analysis for 80,000 seeds per acre (80K), 110,000 (110K), 140,000 (140k) and 170,000 (170k) rates indicating the more profitable rate for a given seed cost (y-axis) and bushel sale price (x-axis) were confined to only the 80K and the 110K seeding rates. Based on yield information from 2024 seeding rate trials, there were no scenarios where 140K and 170K seeds/acre were the most profitable rates.
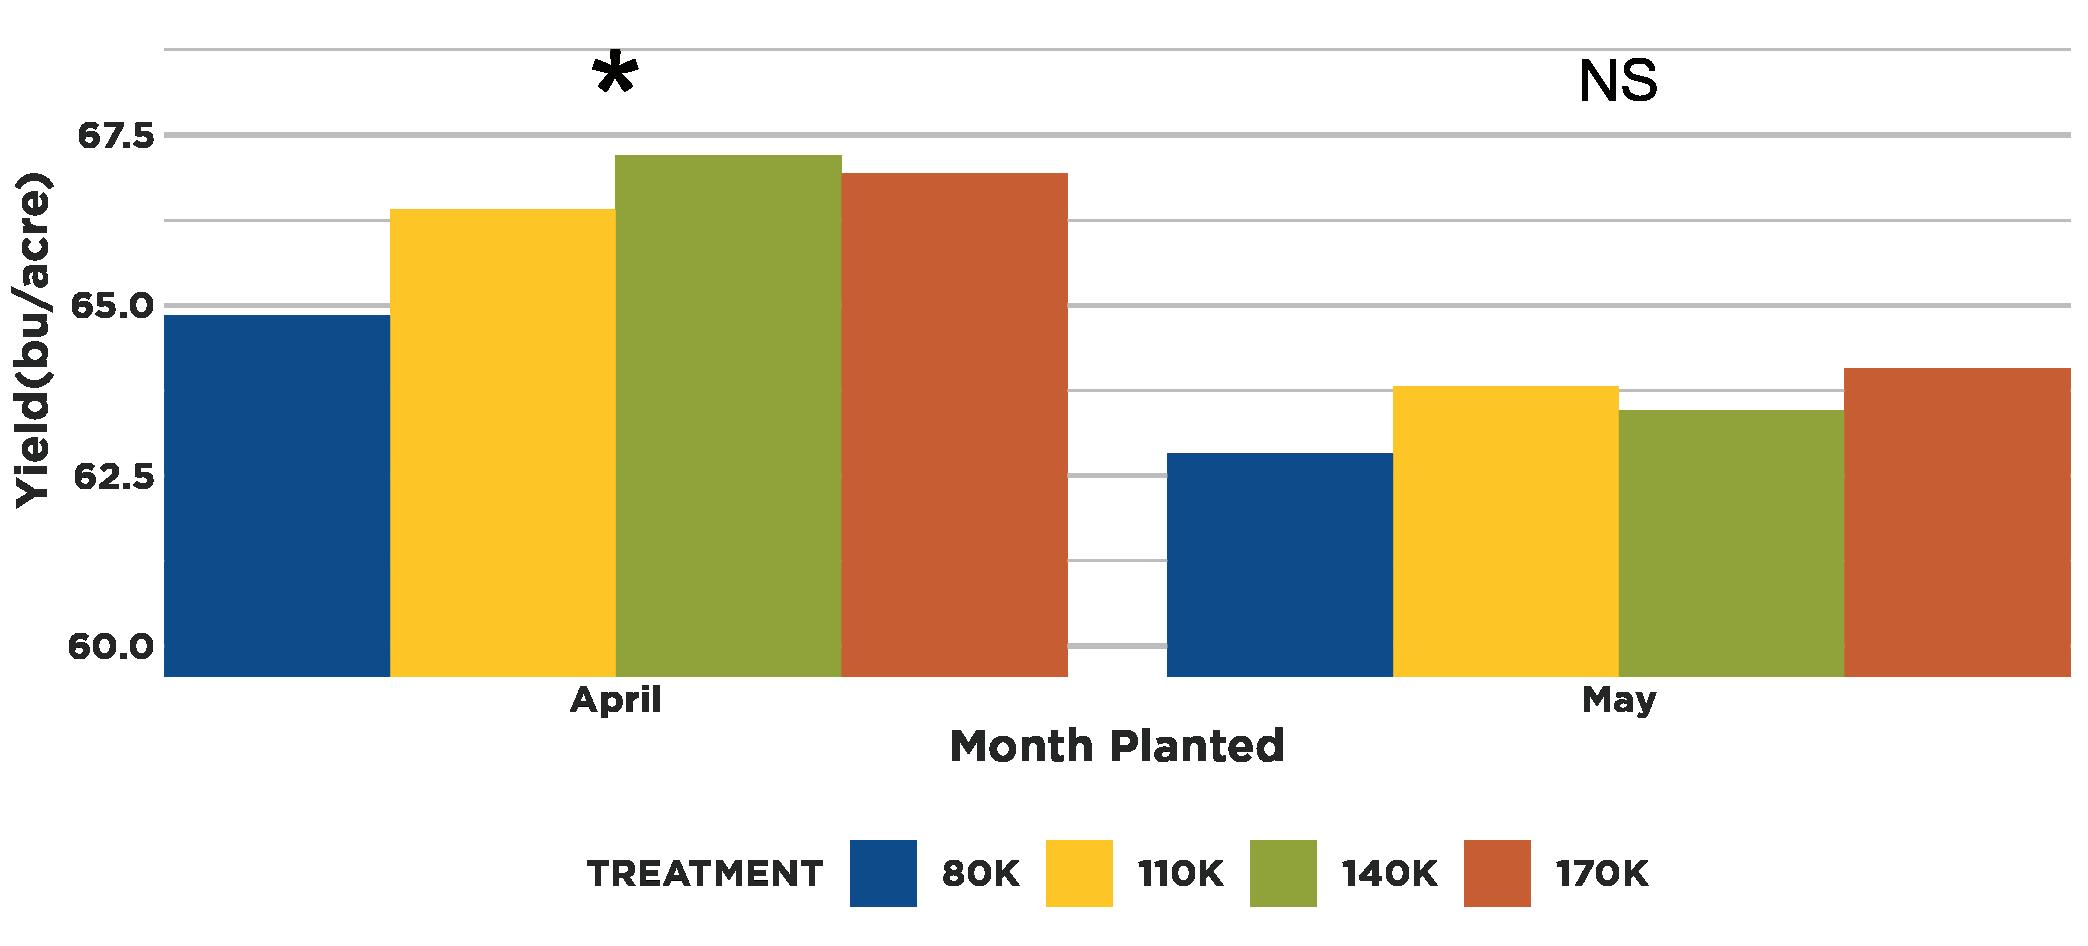
Seeding Rate Yield by Month Planted
2. Soybean yield at different seeding rates as grouped by planting month. April planted trials resulted in overall higher yields compared to May with the 140K treatment having a significantly greater yield than the 80K treatment. May planted trials showed no significant difference in yield among seeding rate treatments. *Indicates a statistically significant difference between treatments, NS indicates no significance.
The other interesting factor we observed is as seeding rates approach 170,000 seeds per acre, the actual seeding rate accuracy is reduced. This could be from too many seeds in the furrow or equipment failing to drop the target number of seeds.
This project's data shows planters are more accurate at hitting target seeding rates, unlike drills, which may overseed at low rates and underseed at high rates. Although this isn't new, it's vital when choosing a seeding rate and planning equipment upgrades.
Equipment updates and earlier planting dates
Invest in your planting equipment through upgrades and maintenance to maximize soybean yields and profits and consider planting early.
Precise planting reduces equipment expenses due to increased yields and less seed usage, making upgrades cost-effective.
It is also recommended to plant soybeans as soon as the ground is suitable in April. ISA found that early-
planted soybeans’ vegetative growth helps compensate for lower stands. This allows seed input costs to be reduced.
Seeding rate results
Results from the 2024 seeding rate study reveal low commodity prices do not justify pushing soybean populations higher. Should commodity prices continue falling and soybean seed prices not falling proportionally, reduced seeding rates may be more profitable (Figure 1).
Although other factors matter when making seed purchasing decisions, such as canopy closure and planter precision, high seed costs aren't usually justified by soybean prices at or below $10 per bushel.
Early planting proved advantageous based on this year's findings. Mayplanted soybeans faced suboptimal conditions, resulting in lower plant populations than those planted in April. Reduced early vegetative growth in the May-planted fields led to lower overall soybean yield compared to fields planted in April (Figure 2).
There is a significant difference in soybean yields between the 140,000 and 80,000 planting rate treatments (Figure 2). Considering the increased yield, the return on investment was still more favorable for 80,000 or 110,000 as the yield increase did not pay for the added seed cost.
Due to reduced emergence and reduced early season vegetative growth in the fields planted in May, stand count reduction was 5% higher than April and had a 3 bushels per acre yield loss.
The results of the 2024 seeding rate trials align with previous research completed by ISA and others, demonstrating early planting of soybeans consistently outperforms later planted soybeans regardless of population. Soybeans can tolerate some stand loss through branching and producing more pods per plant. Planting at least some soybean acres before corn can expand the window of planting while maximizing soybean yield potential and minimizing risks to the corn crop.
Figure
TLong-Term Cover Crop Nutrient Stratification and Compaction
BY ANTHONY MARTIN ISA ANALYST AMARTIN@IASOYBEANS.COM
he Iowa Soybean Association’s (ISA) Research Center for Farming Innovation (RCFI) has been working with farmers for more than five years to gain insights into how adopting and incorporating cover crops may impact field conditions over a longer period.
Farmers’ focus has primarily been on yield and soil health metrics, but additional in-field factors are recognized as impacting and benefiting the overall cropping system.
Four fields were selected from the long-term cover crop project to compare nutrient stratification and soil compaction. Fields were selected based on a history of consistent cover crop establishment; they were also going into soybean production in 2024. In fall of 2023, a blend of cereal rye, triticale and winter camelina was seeded at every site.
Early spring soil samples were collected in April at depths of 0-2, 2-4, 4-7, 7-10, 10-14, 14-18 and 18-24 inches to look at nutrient distribution and differences between treatments. Given early rains, additional soil samples were collected in June to analyze nitrogen (NO3- and NH4+) movement at the same sites at depths of 0-7 and 7-14 inches. Compaction readings were taken in May following a soaking rain at 4-inch intervals to a depth of 24 inches. This data was analyzed and summarized based on cover crop treatment, depth and location.
In-season results
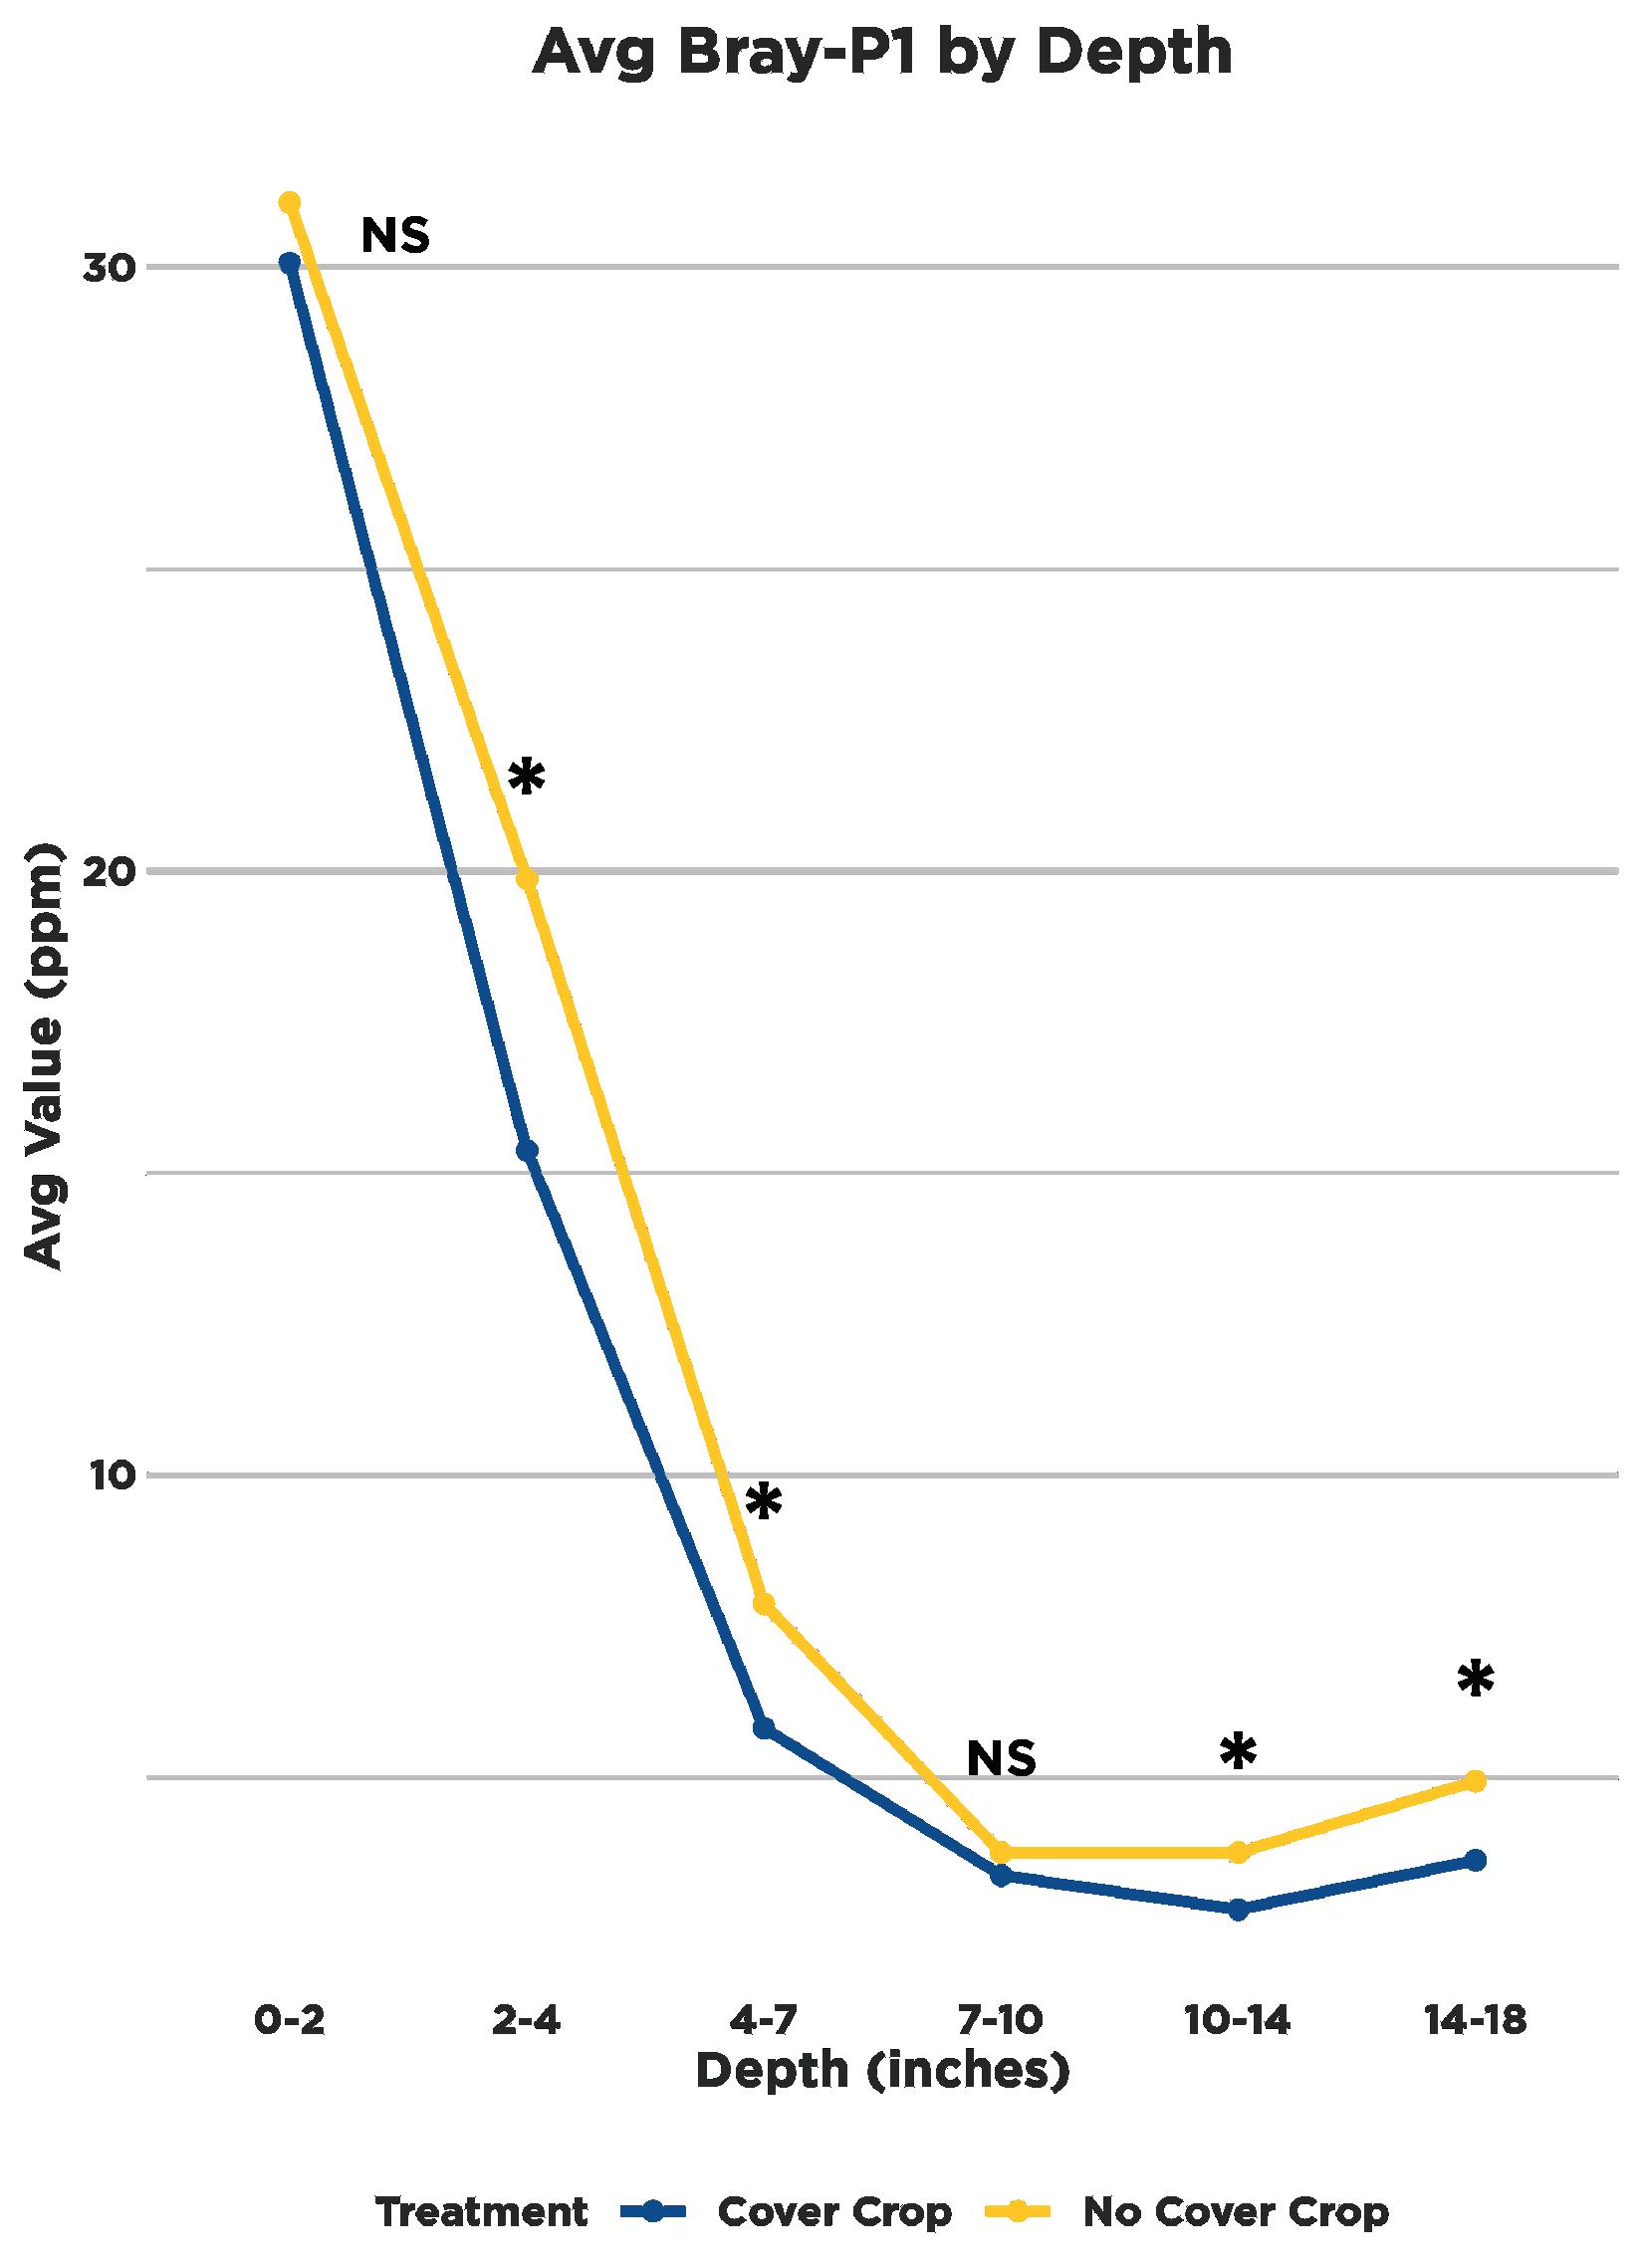
Nutrient stratification was observed at all four sites under both the cover crop and no cover crop treatments. Phosphorous (P) and potassium (K), which are both immobile nutrients that can build up at the soil surface without incorporation, showed more than 70% of the plant available P (Bray-P1) and nearly 50% of the total K was found in the top 4 inches of the soil. When looking at plant available P, a significant reduction was seen under cover crops between the 2-7 and 10-18-inch depths (Figure 1).
Figure 1. Average plant available phosphorous (Bray-P1) for cover crop and no cover crop treatments at each depth range. *Indicates a statistically significant difference between treatments, NS indicates no significance. Average Bray-P1 by Depth
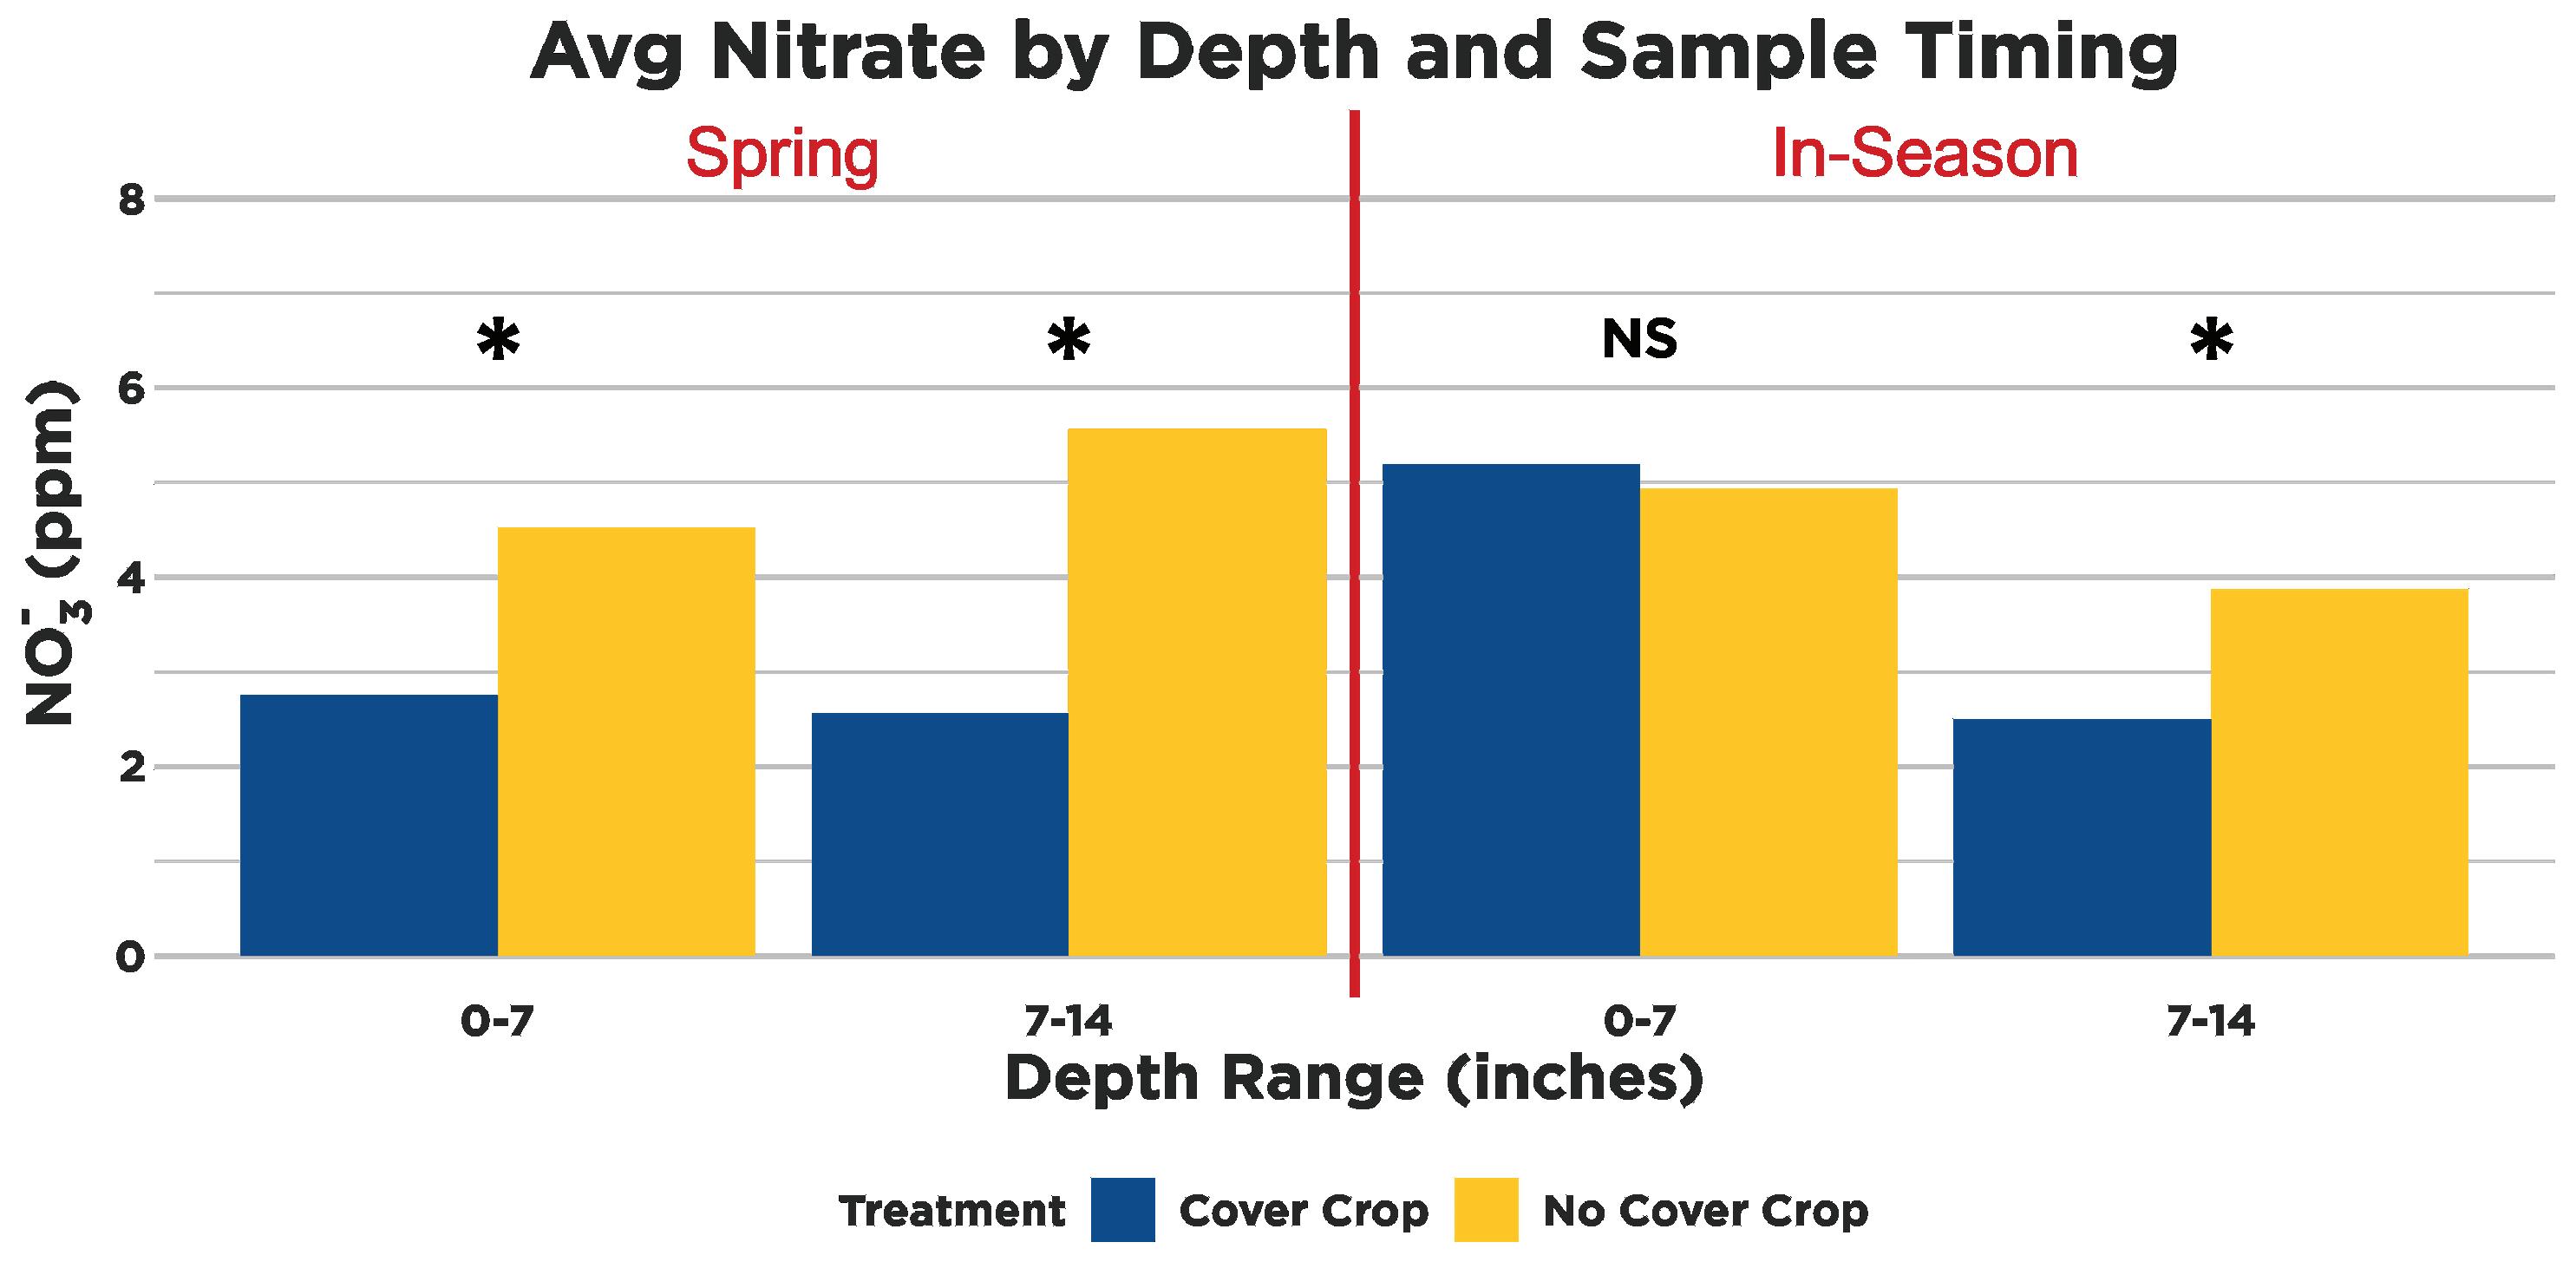
Figure 2. Average NO3 for cover crop and no cover crop treatments at each depth range and sample collection timing. *Indicates a statistically significant difference between treatments, NS indicates no significance.
This change may have been contributed by the nutrient uptake from the actively growing cover crop prior to sampling.
Additional nutrient analysis showed minimal significant changes when comparing the two treatments. In the top 2 inches of the soil, organic matter and boron were significantly higher under a cover crop. Sodium and sulfur were significantly lower under a cover crop at depths below 7 inches.
Early spring results from the cover crop strips showed there was a consistent significant reduction in soil nitrate levels compared to samples taken from the no cover strips (Figure 2).
Additional late spring sampling was done following planting and cover crop termination. These results showed there was a reduction in nitrates at the lower depths (7-14 inches) in the no cover strips indicating some leaching occurring whereas the cover crop strips did not see this same reduction.
Penetrometer readings for soil compaction showed the addition of a cover crop was able to significantly decrease compaction, but none of the testing sites showed yield-limiting compaction (>300 psi).
Late-season insights
Although nutrient stratification was observed at all four sites, the addition of a cover crop did not appear to improve the distribution of nutrients in the soil profile. Immobile nutrients like P and K, were heavily concentrated in the top 4 inches of soil under both treatments. Significant changes were observed between cover crops and no cover crop treatments, but only for a few of the tested nutrients.
Nitrate levels were significantly reduced with a cover crop at all depths in earlyspring sampling. During this period, the cover crop was still actively growing and pulling available NO3- which agrees with other research showing the effectiveness of cover crops at scavenging residual nitrogen.
Following cover crop termination, nitrate concentration in the top 7 inches under the cover crop strips increased but remained significantly lower than the nocover crop strips in the 7–14 inch depth.
Comparing early and late spring nitrate results, significant losses were observed under the no cover crop strips, which illustrate the effect cover crops can have on reducing nitrate leaching.
While the selected fields did not have yield limiting compaction (>300 psi), changes were seen between the cover crop and no cover crop treatments. Significant reductions in penetrometer readings were observed at all depths down to 12 inches. This supports the idea that cover crops are effective at reducing soil compaction which can benefit crop root growth due to lowered resistance.
More information on this project and the long-term cover crop project can be found on the ISA RCFI website.
RESEARCH CENTER FOR FARMING INNOVATION
Average Nitrate by Depth and Sample Timing
A2024 Water Monitoring Results
BY TONY SEEMAN ISA WATER LAB SERVICE MANAGER ASEEMAN@IASOYBEANS.COM
fter nearly four years of drought in some parts of Iowa, spring rains finally arrived in 2024 and restored soil moisture back to normal levels.
While it was good news for Iowa farmers and the crops they raise, we also know after an extended dry period Iowa soils can have elevated residual nitrate-N that is available to leach out into streams and rivers causing drinking water issues and large algae blooms.
Monitoring for results
The Iowa Nutrient Reduction Strategy was designed to address nitrogen and phosphorus losses by providing a menu of proven conservation practices to be implemented across the state. Through the Iowa Department of Agriculture
and Land Stewardship, several Water Quality Initiative (WQI) demonstration projects have been funded to increase implementation and show progress toward our goals.
One of these projects is the Farm to River Partnership (F2R) in the North Raccoon River, which is managed by Agriculture’s Clean Water Alliance (ACWA) and supported by the Iowa Soybean Association (ISA).
In addition to leading watershed projects, ACWA funds water monitoring across the state including the Raccoon River’s tributaries since 2000. In fact, ACWA water monitoring data identified Elk Run as a nitrate-nitrogen hotspot, which led to the formation of the F2R partnership.
Elk Run and Prairie Creek
Elk Run is a 21,000-acre watershed that straddles the Carroll-Calhoun County line and was the original WQI watershed project area.
Prairie Creek drains 18,000 acres of similar tiled agricultural land about 10 miles northwest of Elk Run. Both watersheds have been part of ACWA’s Raccoon River monitoring network since 1999.
Of the nearly 40 sites in the Raccoon monitoring network, the nitrate concentrations in the Elk Run watershed has consistently been among the highest. The Prairie Creek watershed has similar nitrate levels to most Raccoon tributaries. While the ACWA monitoring network provides multiple sites for comparison,
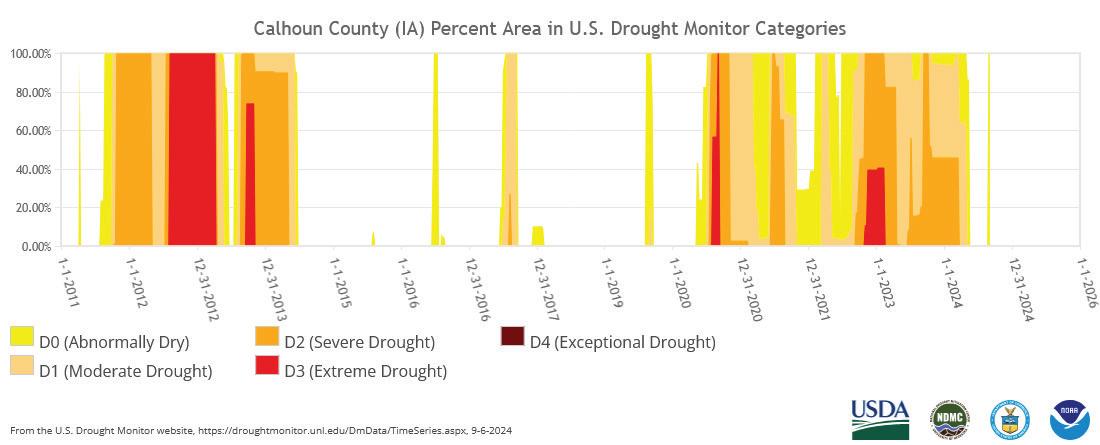
Calhoun County (IA) Percent Area in U.S. Drought Monitor Categories
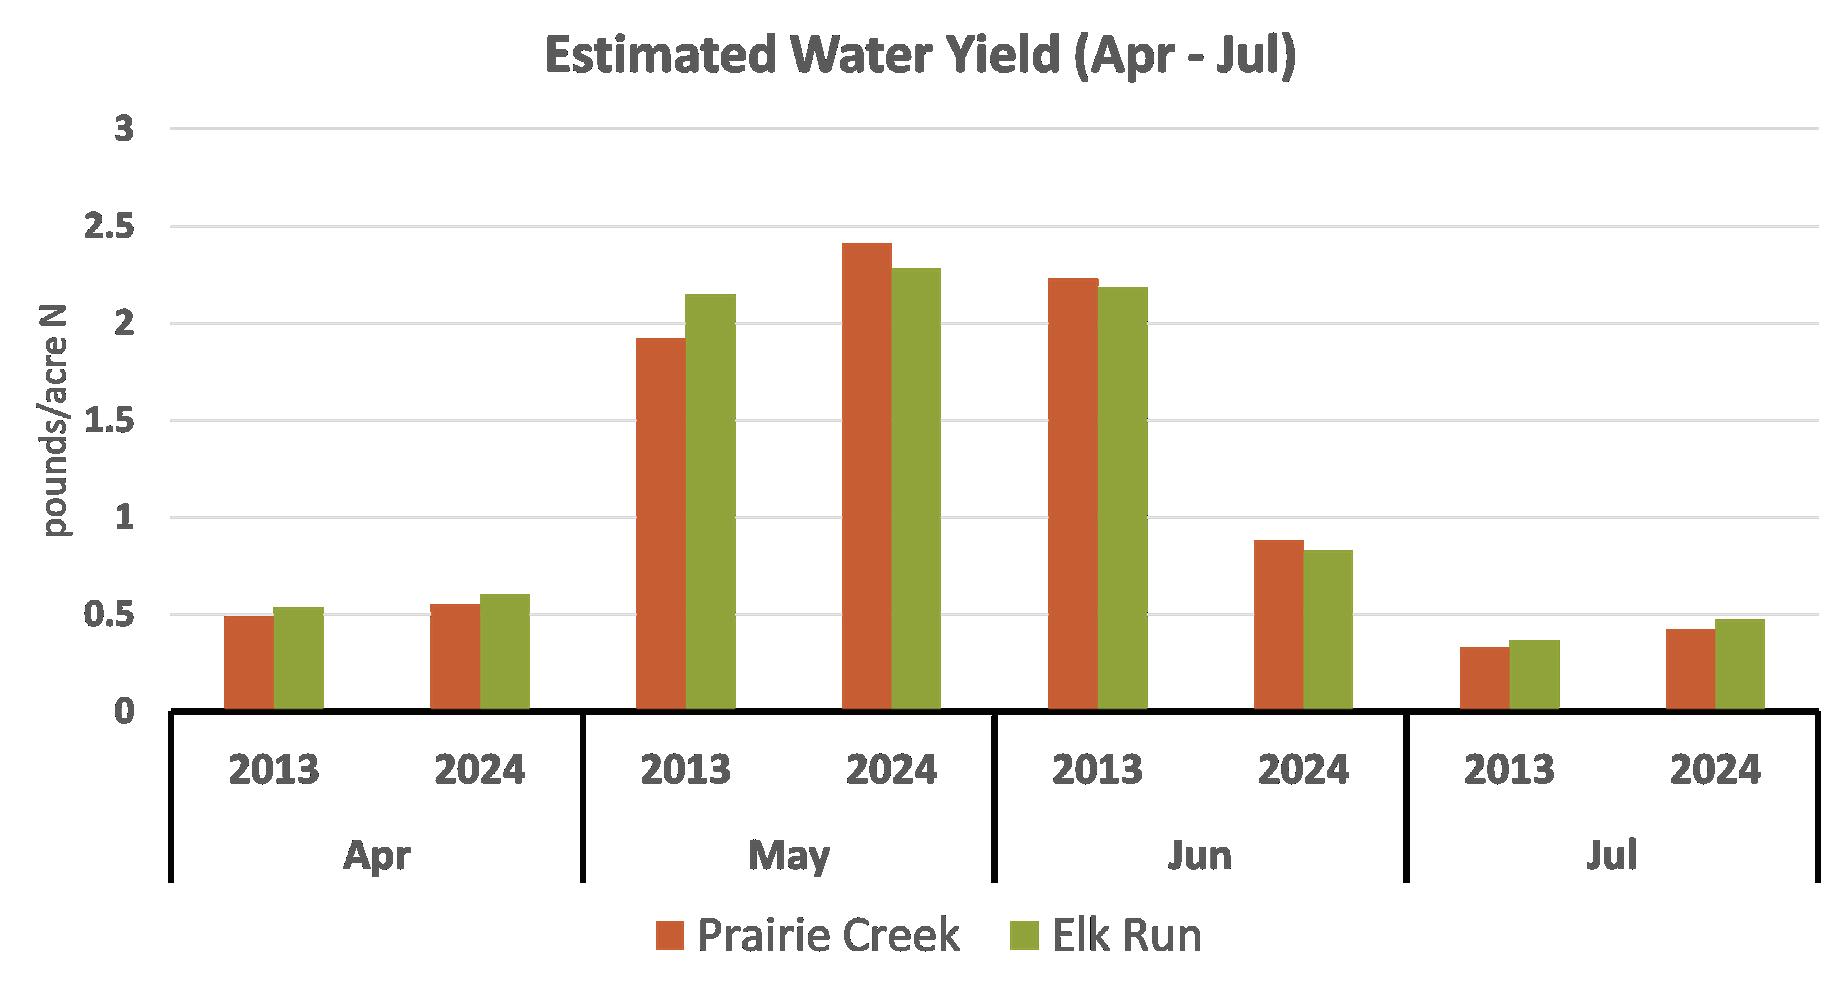
Estimated Water Yield (April-July)
Prairie Creek was chosen due to its similar size and proximity to Elk Run.
Water quality and drought
ACWA’s approach to water monitoring focuses on sampling both large rivers and the smaller watersheds that contribute to them.
Roughly 45 sites with drainage areas from 4,000 acres to 2 million acres move into the North and South Raccoon Rivers. Comparing results from these different areas as water moves downstream helps target resources to have the greatest impact and provides feedback about conditions over time.
One thing that continues to be apparent in looking at water quality results over time is the impact of weather conditions on nutrient loss. Streamflow and nitrogen loss vary widely in response to the annual excess or deficit of precipitation, similar to crop yield.
To accurately assess Iowa Nutrient Reduction Strategy progress, we must consider environmental factors and crop
yield. While both are weather-dependent, their responses differ: excessive water harms crops but exacerbates nitrate runoff. Unlike crop yields, where nutrients are exported immediately at harvest, nitrate leaching can be delayed, making it challenging to evaluate the efficacy of conservation practices. In 2024, legacy nutrients significantly impacted tile and stream nitrate levels.
Farm to River Project
Beginning in 2015, a significant number of conservation practices intended to reduce nitrogen loss were implemented in the Elk Run watershed. The project area expanded in 2019. To date, five bioreactors and two saturated buffers have been installed, annual cover crop use has increased from 300 acres the first year to more than 2,000 acres the last two years, and virtually all anhydrous applied in the watershed now has a stabilizer.
In addition, two farm conservation plans were developed, and multiple farmers took part in soil and manure
sampling to provide the data needed for improved nutrient management. Individually these practices are known to improve water quality, but their performances vary from one year to the next and across the landscape.
Water quality evaluation
Annual weather changes typically have a greater effect than any individual farming practice; therefore, long-term, repeated studies are crucial for reliable conclusions.
When evaluating real world water quality data, there isn’t one measurement or technique that confirms whether water quality is improving. Instead, we try to use multiple analyses to see if they point directionally toward improvement.
One way to overcome variability is using analog years. While the weather is never exactly the same in two years for an area, it can be cyclical, and different years can be similar. Comparing wet years to wet years and dry years to dry years gives a more realistic picture than comparing one year to the next.
Continued on Page 12
Figure 2. Monthly water yields from Elk Run and Prairie Creek are estimated by the United States Geological Survey’s Streamer tool.
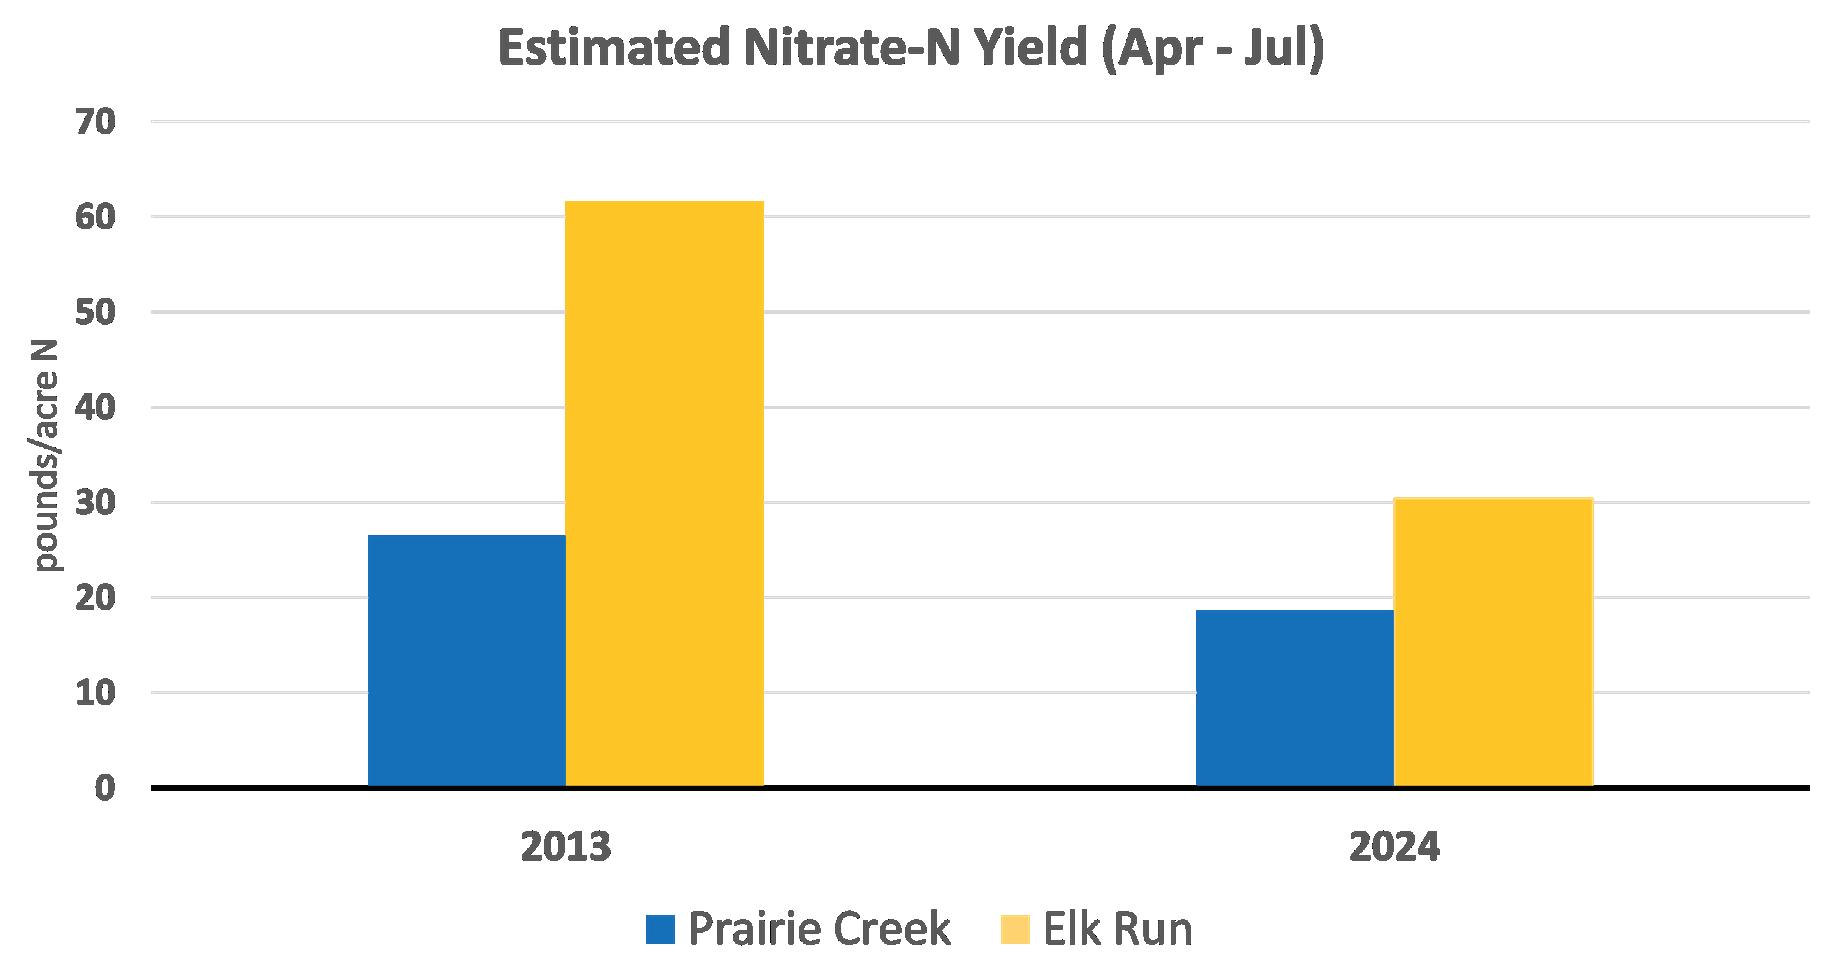
Estimated Nitrate-N Yield
Continued from Page 11
Another technique is to use a paired approach. By comparing two similar watersheds, differences can be attributed to factors beyond the overall conditions affecting both areas. For Elk Run in the F2R project, data is available to evaluate outcomes using these methods.
2012-2013 versus 2023-2024
Calhoun County had extended dry spells leading into the wetter years analyzed (Figure 1). The drought of 2011-2012 was a little shorter but more pronounced than the drought in 20222023. While a full climatic comparison is beyond the scope of this analysis, the main difference between the time periods is 2012 was quite warm and 2013 had a cool spring.
In terms of soil nitrogen being left over, 2012 had the most significant reduction in corn yield of the entire ACWA
monitoring period; 2013 also suffered from low yields. Precipitation patterns were similar in both years post drought, which is the main driver of nitrate loss through tile lines. Comparing the analog years of 2013 and 2024 by looking at post drought periods allowed ISA to analyze the impact of nitrogen reduction practices on water quality as that is when the most loss occurs.
Monitoring results
ACWA water monitoring data has shown the impact of drought conditions, with large increases in nitrate concentrations witnessed the following spring and summer. All monitoring results can be found on the ACWA website at acwaiowa.com.
Concentrations were elevated in both post-drought years, but the difference in Elk Run was much larger than in Prairie Creek. Estimated water yields were slightly
higher in 2013 (~5 inches versus 4.25 inches) with the difference coming from a drier June in 2024 (Figure 2).
Collectively, nitrate-N yields were lower in 2024 than 2013, however the difference between streams shows a greater reduction in Elk Run. Prairie Creek N loss was 29% lower in 2024. In Elk Run, the amount of N lost was 51% lower than 2013. The difference in N loss from Prairie Creek was driven by less June water flow, while Elk Run showed a larger reduction from factors beyond just the difference in discharge (Figure 3).
The data from Elk Run suggests that a targeted watershed approach can have a significant impact on nitrogen loss. As more edge-of-field practices are installed and farmers engage in continuous improvement of nutrient and field management, the levels of N loss should continue to improve.
Figure 3. Estimated N loss from Prairie Creek and Elk Run during post drought years.
(April-July)
Research Tweaks
Planting Rules of the Road to Drive Yields
1
START THE IGNITION EARLY
Much research has been devoted to planting date. The trend is to plant earlier, and research shows this can contribute to higher yields when planting into good soil conditions.
Road to Success: Studies find treating seed with fungicides may be beneficial when planting early in cold, wet soils, especially in today’s reduced and no-till fields. Newer fungicide seed treatments can help control seedling diseases that often accompany such spring conditions.
MONITOR TRAVEL CONDITIONS
Improved planter technology and seed quality have placed overseeding by 20-30% in the rearview mirror. That means farmers can count on more accurate plant populations only slightly lower than seeding rate. And that shaves input costs without sacrificing yield. While general, conventional wisdom is to plant 140,000 to 225,000 seeds per acre, studies have often shown that additional yield above 100,000 may be minimal, depending on row spacing and planting date.
Road to Success: Variable rate seeding now permits farmers to tailor soybean plant populations according to conditions within established management zones in each field.
CHANGE LANES FOR BETTER PERFORMANCE
Studies confirm switching from wide to narrow rows can boost yields 3-7 bushels per acre, depending on management practices. Using 20” versus 30” rows keeps sunlight out of the canopy where weeds develop and preserves soil moisture, especially in double-crop soybeans.
Road to Success: Newer soybean drill technology because the seed drop mechanism is controlled from the tractor cab for greater accuracy.
5
YIELD TO LOWER LIMITS
3
Moist soils mean go time for soybean planting. That’s because the seed needs to absorb 50 percent of its weight in water for germination. Good seed-to-soil contact at planting depths of 1”-1.5” inches is linked to higher yield potential. Shallower depths are best for early planting, high-residue and fine-textured soils. Plant deeper when late and in sandy, coarse-textured or dry soils.
Road to Success: Checkoff-funded work is evaluating the development and availability of new planter technologies over the last decade to understand how to properly use and setup planters equipped with downforce, for example, in various tillage systems and soil conditions.
KEEP YOUR EYES ON THE ROAD
Getting the most mileage at planting includes knowing whether a seed treatment is right for your situation. Seed treatments should be chosen based on controlling diseases, insects and nematodes prevalent in the area and for early pests scouted where economic thresholds have been met.
Road to Success: Checkoff-funded field trials show widespread prophylactic use of neonicotinoid insecticide seed treatments, for example, may not be a wise expenditure because their use does not usually overlap with economically significant insect populations.
Funded by the soybean checkoff
The Soybean Research and Information Network (SRIN) is a joint effort of the North Central Soybean Research Program and United Soybean Board. The online resource contains checkoff-funded soybean production challenge research findings with direct links to the respective underlying scientific studies housed in the National Soybean Checkoff Research Database.
TSeed Treatment to Manage Soybean Cyst Nematode
BY LUCAS DEBRUIN ISA RESEARCH AGRONOMIST LDEBRUIN@IASOYBEANS.COM
he annual damage caused by Soybean Cyst Nematode (SCN) is estimated to exceed $1 billion. The extent of yield losses is underestimated because a substantial amount of damage, possibly as high as 30% of your yield, may not have visible symptoms.
Fertility, climate and variety can all have an impact on SCN’s impact on soybeans. While SCN cannot be eliminated once it is present within the field, the goal is to manage it as effectively as possible with the tools and resources available.
Best management practices include choosing soybean varieties that have resistant traits or rotating to a non-host crop for a few years. New chemical and biological tools are becoming available to provide another mode of action to manage SCN.
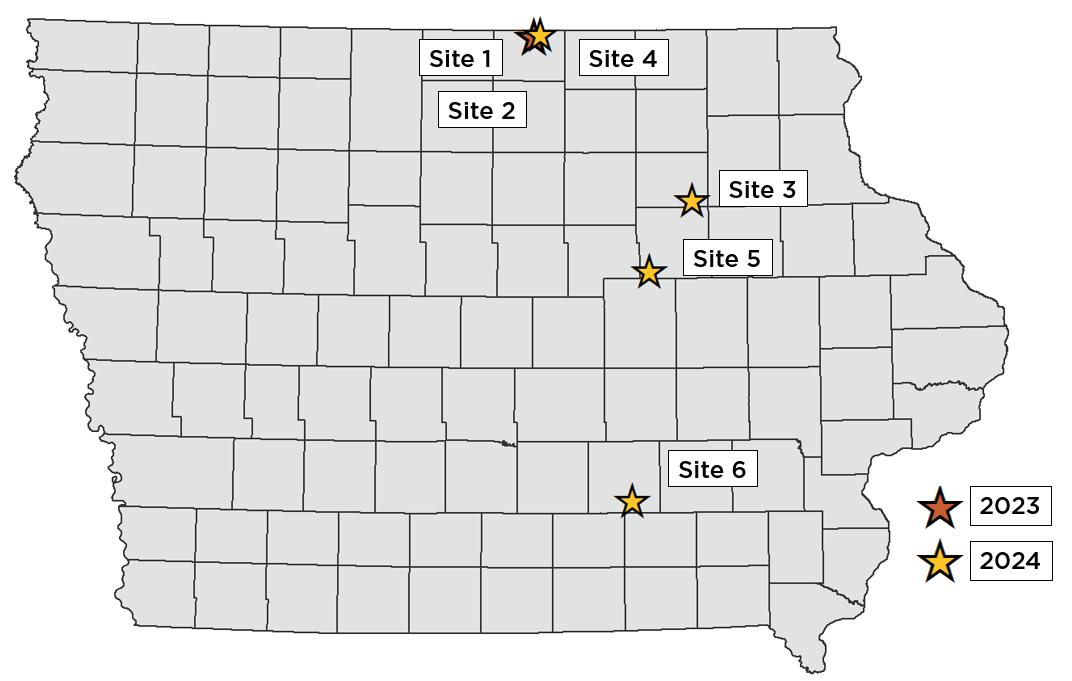
The Iowa Soybean Association (ISA) conducted six trials across the state (Figure 1) testing two products: one biological seed box additive (Indigo biotrinsic Z15) and one chemical seed treatment (BASF Ilevo), against an untreated check to compare the efficacy of the products.
Egg counts were collected at planting and post-harvest (along with yield) to understand the impact of each treatment.
In-season results
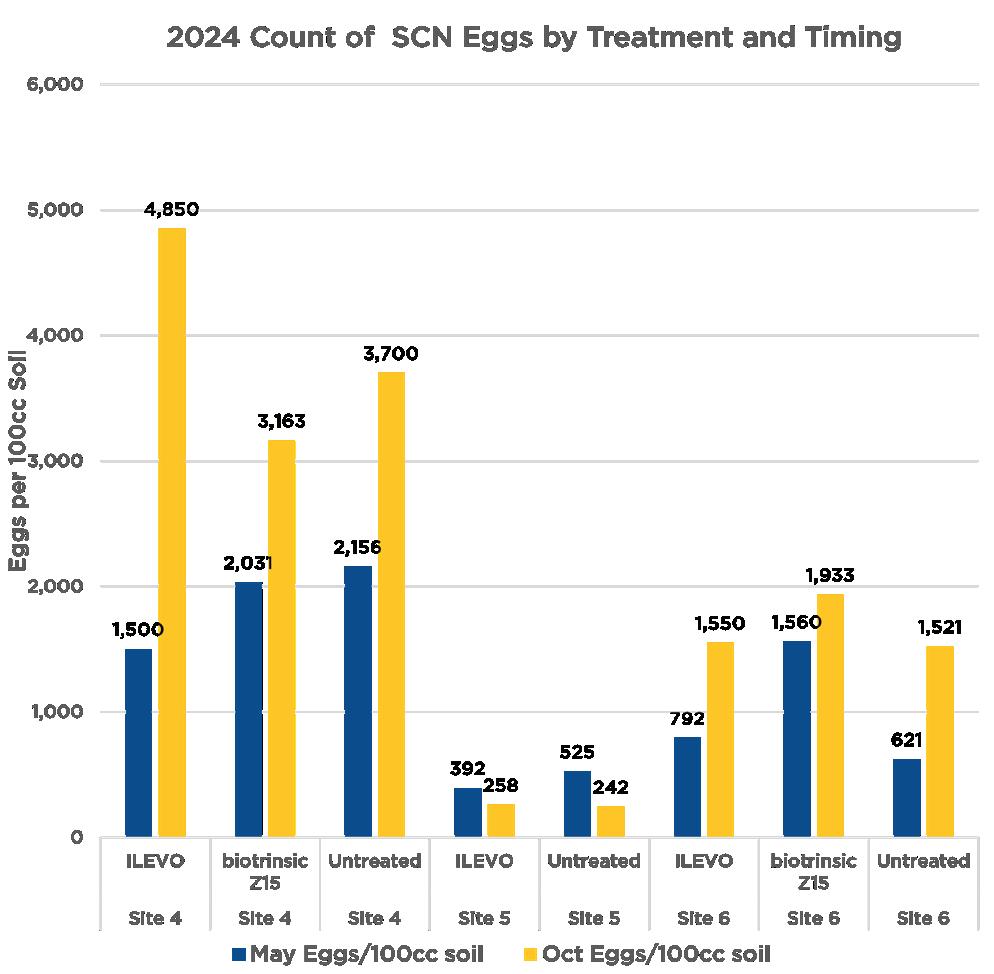
No large visual impacts from treatments versus untreated soybeans were observed. While early season sample results showed a presence of SCN, all results were in the low threshold for egg counts under 2,000 eggs/100 cubic centimeters (cc). Post-harvest soil samples will determine if there was any impact on SCN reproduction during the growing season per treatment. Figure 2 illustrates egg counts in the spring and fall.
2024 Count of SCN Eggs by Treatment and Timing
Egg counts compared between at-planting and post-harvest. Low pressure is fewer than 2,000 eggs, moderate pressure is fewer than 12,000 eggs.
Figure 2.
Figure 1. Map of soybean cyst nematode trial locations in 2023 and 2024.
Results and insights
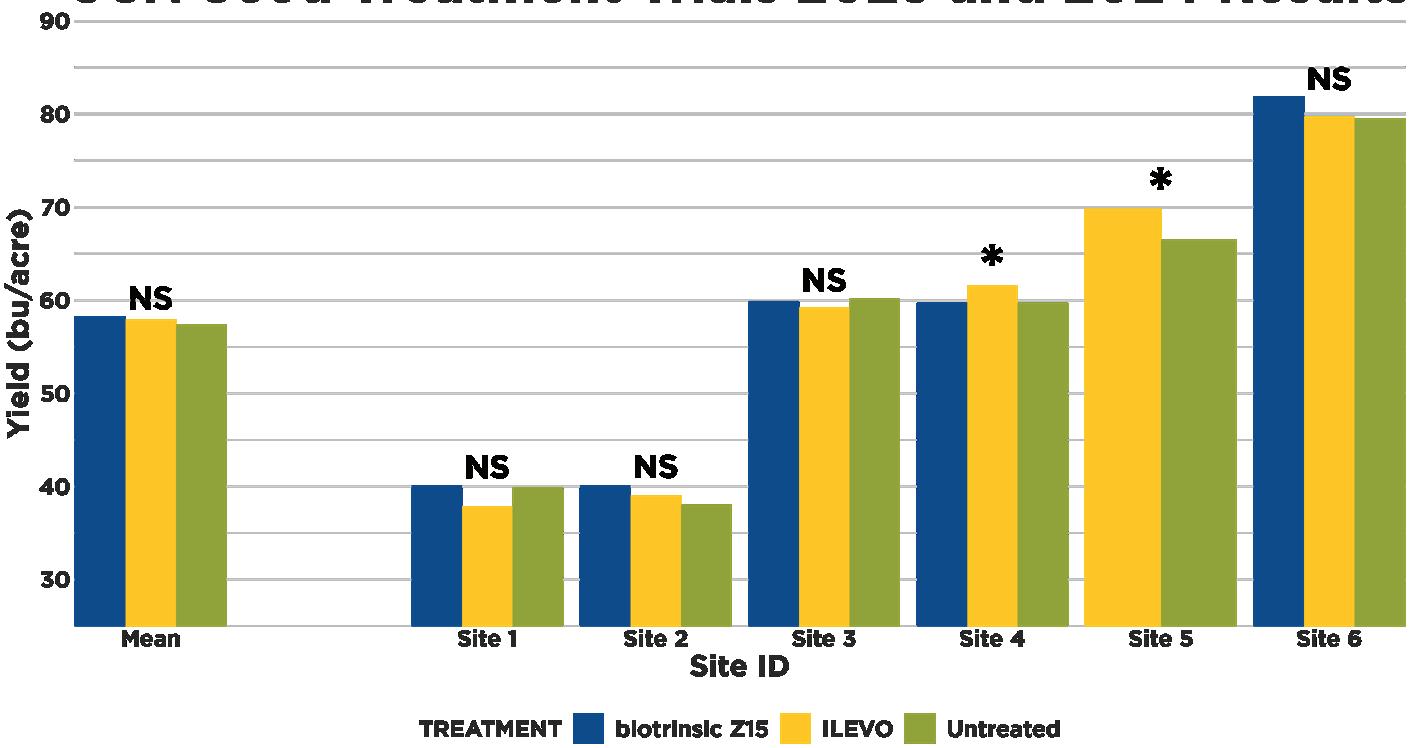
Soybean health and yields continue to be affected by SCN across Iowa and farmers are seeking additional tools to manage the problem. In this trial, there were no observed increases in yield across the state when comparing the two products, Ilevo by BASF and biotrinsic Z15 by Indigo Ag, against the untreated strips. However, yields did vary across trial locations (Figure 3). The results of the trials did not show any statistical differences in treatments versus untreated in low population fields.
Egg counts of 2,000 or fewer are considered low and 12,000 and above is considered high if you are planning to grow soybeans in that field (Table 1).
Low SCN pressure was observed in all the fields surveyed. In higher SCN populations, there may be a larger advantage to using these products as a method to manage SCN. As we did not see high pressures of SCN, it is difficult to correlate the efficacy of products’ ability.
There were yield improvements attributed to Ilevo at two locations resulting from the control on SCN and with minimal sudden death syndrome visible at the plots. If you struggle with
Infestation category Soybean not next crop to be grown
Figure 3. Soybean crop yields (bu/ac) treated with either Ilevo or biotrinsic Z15 and compared to untreated control. *Indicates a statistically significant difference between treatments. NS indicates no statistically significant difference.
SCN in your fields, these soil amendments and seed treatments are just one part of successful control.
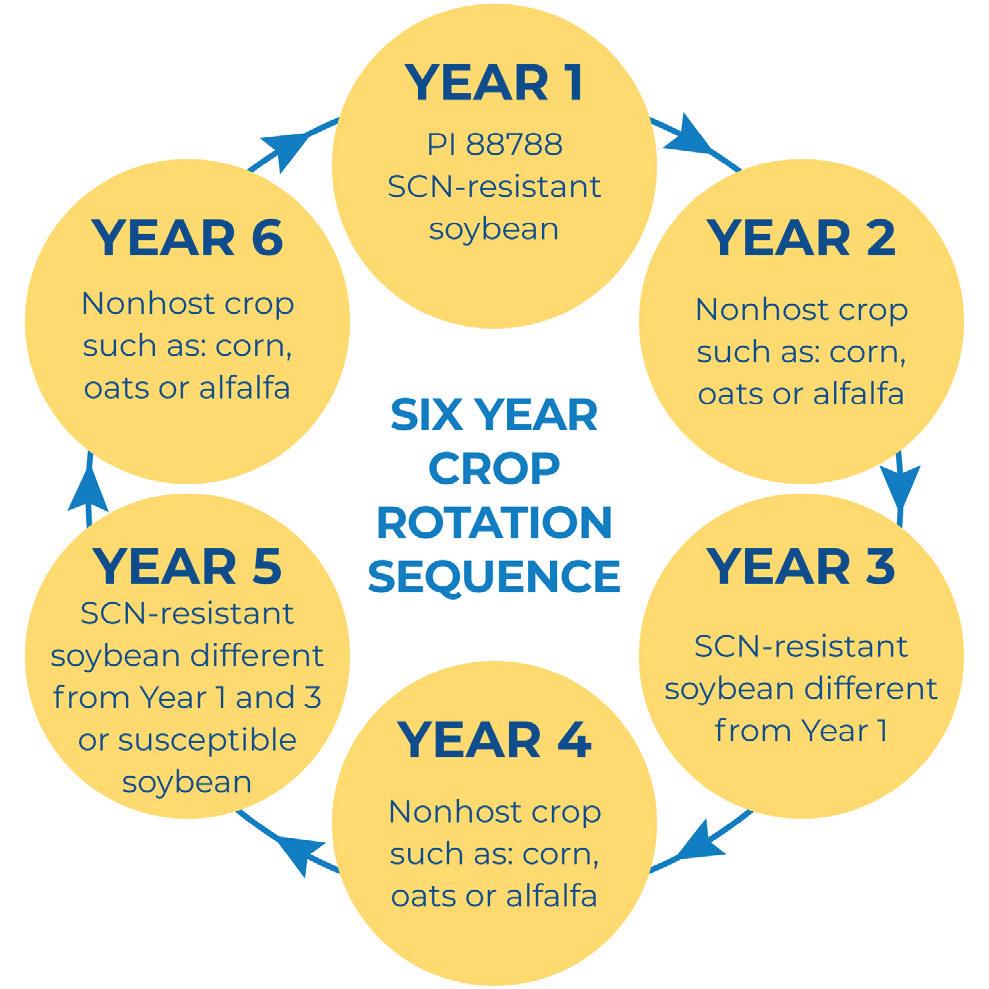
Resistant soybean varieties are available and recommended when planting into a field infested with SCN. When SCN presence is confirmed high in a field, the following rotation should be utilized: non-host crop, PI 88788 resistant
Soybean next crop to be grown Management Recommendation
No SCN eggs detected 0 0
No management strategies are necessary. However, not finding SCN in a soil sample does not prove that it is not present in the field. Follow-up sampling is recommended to check for SCN infestations in future years.
If this is first discovery of SCN, follow the rotation described on the right starting with Year 1 the next time soybeans are to be grown. If Years 1-4 of the rotation described below already have been completed, continue with Year 5 of the rotation. Moderate 4,00116,000 2,00112,000
Low 1-4,000 1-2,000
High >16,000 >12,000
Begin Year 1 of the rotation described on the right the next time soybeans are to be grown.
Grow several years of a nonhost crop and sample field again every fall to monitor decrease in SCN population densities.
Table 1. Classification of soybean cyst nematode pressure (No SCN eggs detected, low, moderate, and high) based on egg counts and soybean planting, with recommended management.
Tylka, G. (2022) Management of SCN, Soybean Cyst Nematode.
soybean, non-host crop, alternate resistant soybean such as a Peking-based resistant variety (Figure 4).
Due diligence is required to manage SCN adequately to minimize yield impact. Post harvest soil sampling is the best method to determine the SCN infestation level in a field and allows you to make plans to manage the pest properly.
Figure 4. An example six-year crop rotation sequence for managing SCN while reducing resistances.
Tylka, G. (2022) Management of SCN, Soybean Cyst Nematode.
FFungicide Efficacy in Soybeans
BY DREW CLEMMENSEN ISA RESEARCH AGRONOMIST DCLEMMENSEN@IASOYBEANS.COM
ungicides have become more common in growers’ soybean management programs in recent years. However, if they continue to be used annually on soybean fields in the absence of disease pressure, and used at rates below those stated on the label, disease resistance will continue to build to these modes of action.
For example, frogeye leaf spot has become resistant to Fungicide Resistance Action Committee (FRAC) group code 11 fungicides.
Trials conducted by the Iowa Soybean Association (ISA) evaluate the effectiveness of fungicides under varying disease pressures. They look to identify disease tolerance and resistance to the products used to understand the importance of multiple modes of action in an integrated pest management program.
In 2025, 10 trial sites were established across the state, with each trial including three fungicide products and an untreated check. The three products used in this project, including their FRAC code groups and use rates, were Miravis Neo by Syngenta (7, 3, 11) 13.7oz/acre, Delaro Complete by Bayer (3, 11, 7) 10oz/acre, and Lucento by FMC (7, 3) 7oz/acre.
These FRAC codes represent the majority of the fungicide modes of action on the row crop market today and include demethylation inhibitors (DMIs) (3), succinate dehydrogenase inhibitors
(SDHIs) (7), and Quinone outside inhibitors (QOLs) (11).
These products were applied with a drone in replicated strips at the R3-R4 stages of development. At the R6 timing, fields were scouted and evaluated for disease control. In this latest trial, three fields were planted in 30-inch rows while six fields were planted in 15-inch rows.
In-season results
In the 2024 growing season, weather patterns shifted every couple of days, never establishing the consistent weather conditions necessary for soybean disease
development. This resulted in little to no disease pressure at the trial locations.
The most common diseases that were found when scouting were frog eye leaf spot, white mold, septoria brown spot and bacterial blight (which is not controlled by fungicides).
Both the incidence and severity of frogeye leaf spot were low to very low and found throughout all treatments, including the uncontrolled check. Because low levels were found, and they were found in all treatment areas, these pathogens were not collected or tested for resistance to the applied chemistries.
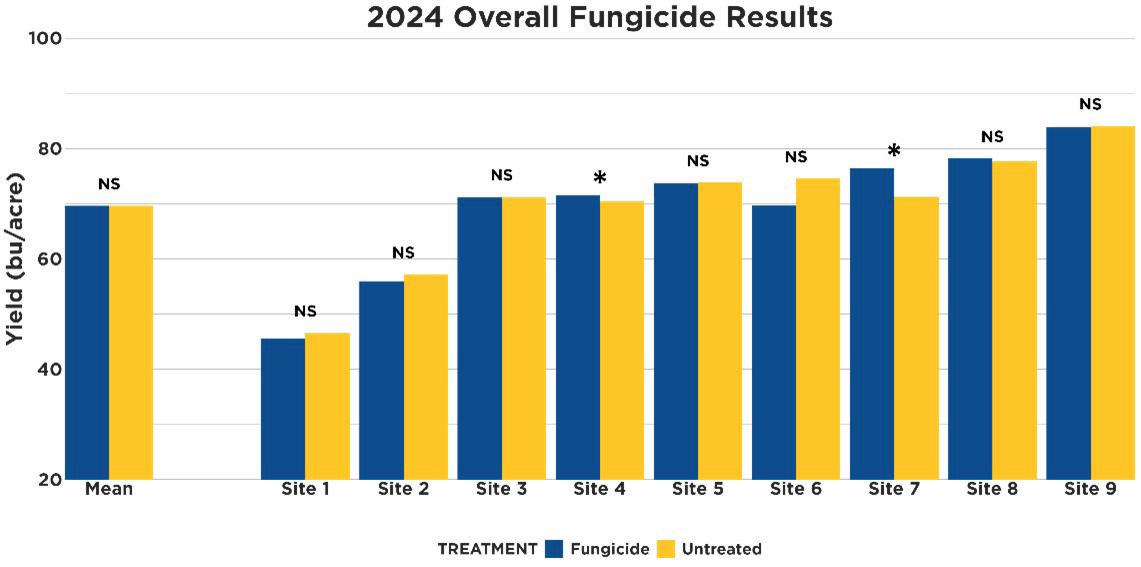
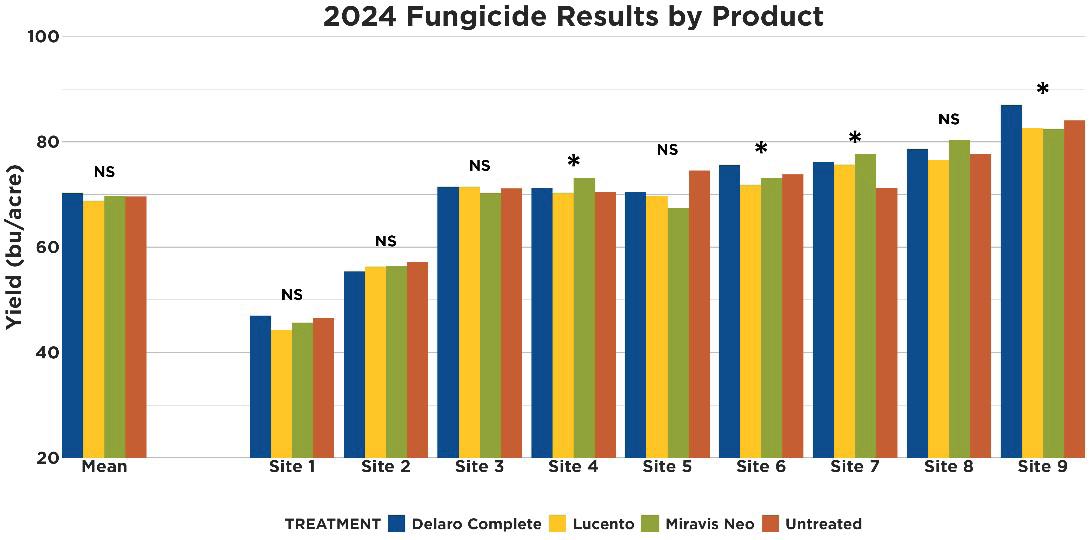
2024 Overall Fungicide Results
Figure 1. Soybean yields of fungicide-treated (blue) compared to untreated (yellow) across nine trial locations. While sites four and seven resulted in higher yields with fungicide application, mean performance of crop yields were similar across treatments. *Indicates a statistically significant difference between treatments, NS indicates no significance.
Results and insights
When looking at the treatments of untreated check versus the three fungicides applied across all locations only two trials showed a significant difference in yield with the use of a fungicide (Figure 2).
It can be concluded that overall, low disease pressure and the use of fungicides did not influence yield in our research in 2024 (Figure 1). Site four showed a significant increase of 1.0 bushel to the acre in yield from the use of a fungicide application, while site seven showed a 5.2 bushel to the acre advantage.
Two of the trials showed soybean yields treated with fungicides containing chemistries with three modes of action (Delaro Complete; Miravis Neo) significantly out yielded crops treated with fungicides with two modes of action (Lucento) (Figure 2).
At Site 4, Miravis Neo yielded 3 bushels per acre greater than Lucento, and at Site 6 Delaro Complete yielded 3.8 bushels per acre greater than Lucento. At Site 7 all three fungicides had a greater yield than the untreated control. At Site 9 Delaro Complete yielded 4.4 bushels per acre greater than Lucento and Miravis Neo.
Planter row spacing and planting population did not factor in significant disease development or yield response to a fungicide application.
White mold was identified at three locations at low incidence and severity however, because these trials were applied at R3 (beginning pod) and not at the labeled R1 (beginning flower) timing for white mold suppression. The three fungicides tested were not evaluated for white mold control.
Harvest moisture levels of the treatments versus the untreated checks were similar along with a non-significant difference in yield and demonstrated that fungicides did not influence late season plant health across our trials.
The use of fungicides did not lead to increased yields across the entire project in 2024 and did not show an “improved
plant health” benefit in a year with low disease pressure.
To avoid soybean disease pathogens from becoming resistant to the fungicide modes of action, the decision to use a fungicide should come after careful scouting and forecasting to identify conditions that promote disease development.
2024 Fungicide Results by Product
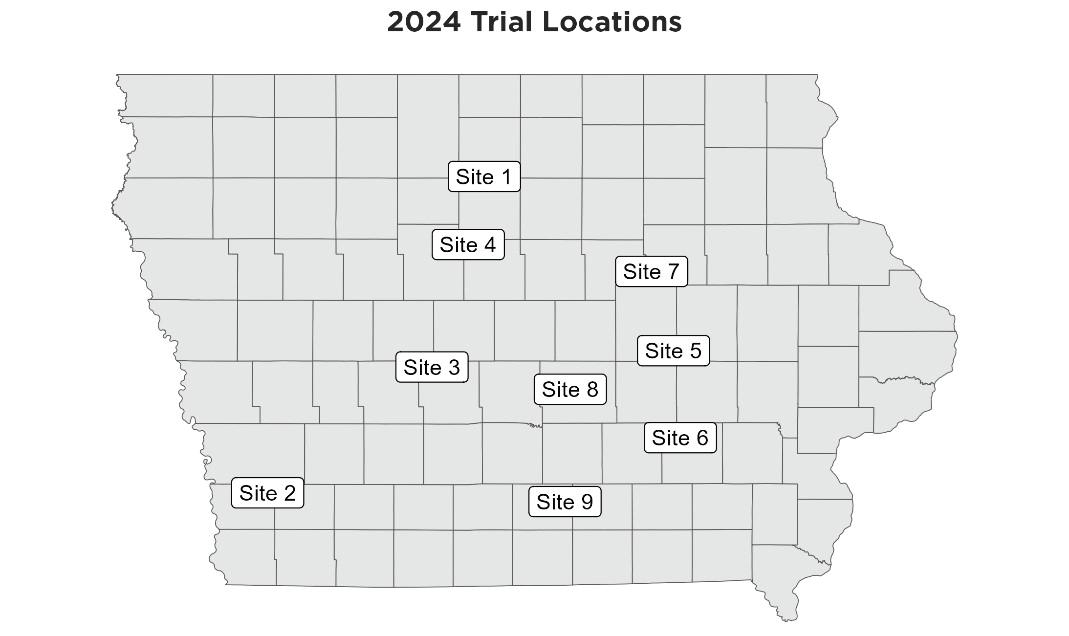
2024 Trial Locations
Figure 3. Trial locations testing fungicide effect on crop performance in the 2024 season.
Figure 2. Soybean yields of three different fungicide products compared to an untreated check across nine locations. *Indicates a statistically significant difference between treatments, NS indicates no significance.
Herbicide resistant weeds have become a major concern for Iowa soybean farmers over the last several years. Soil-applied protoporphyrinogen oxidase (PPO) inhibitors are an effective tool to help control these weeds but can cause injury to soybean seedlings. Does this injury affect yield? To answer this question, the Iowa Soybean Association (ISA) conducted a replicated strip trial. The trial consisted of two treatments, a group 15 herbicide (Zidua SC) versus a group 14 and 15 herbicide combination (Fierce EZ). Plants were evaluated for injury shortly after emergence between the VC and V1 growth stages. Yield data was collected and analyzed to determine if any injuries from the application of the Fierce EZ pre-emerge herbicide resulted in a yield decrease.
In-season findings
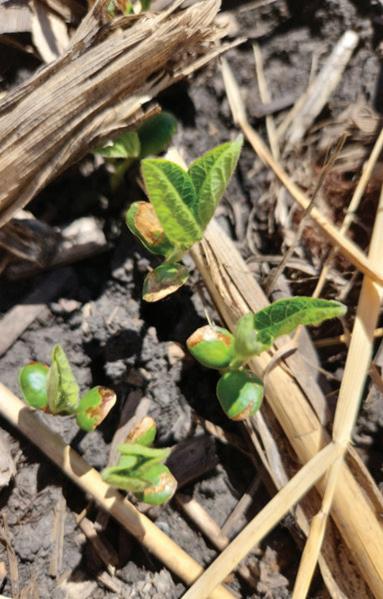
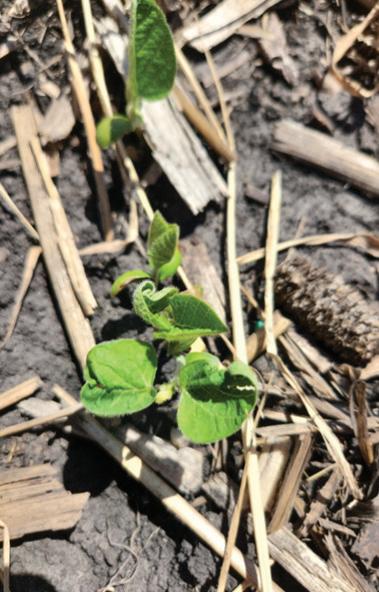
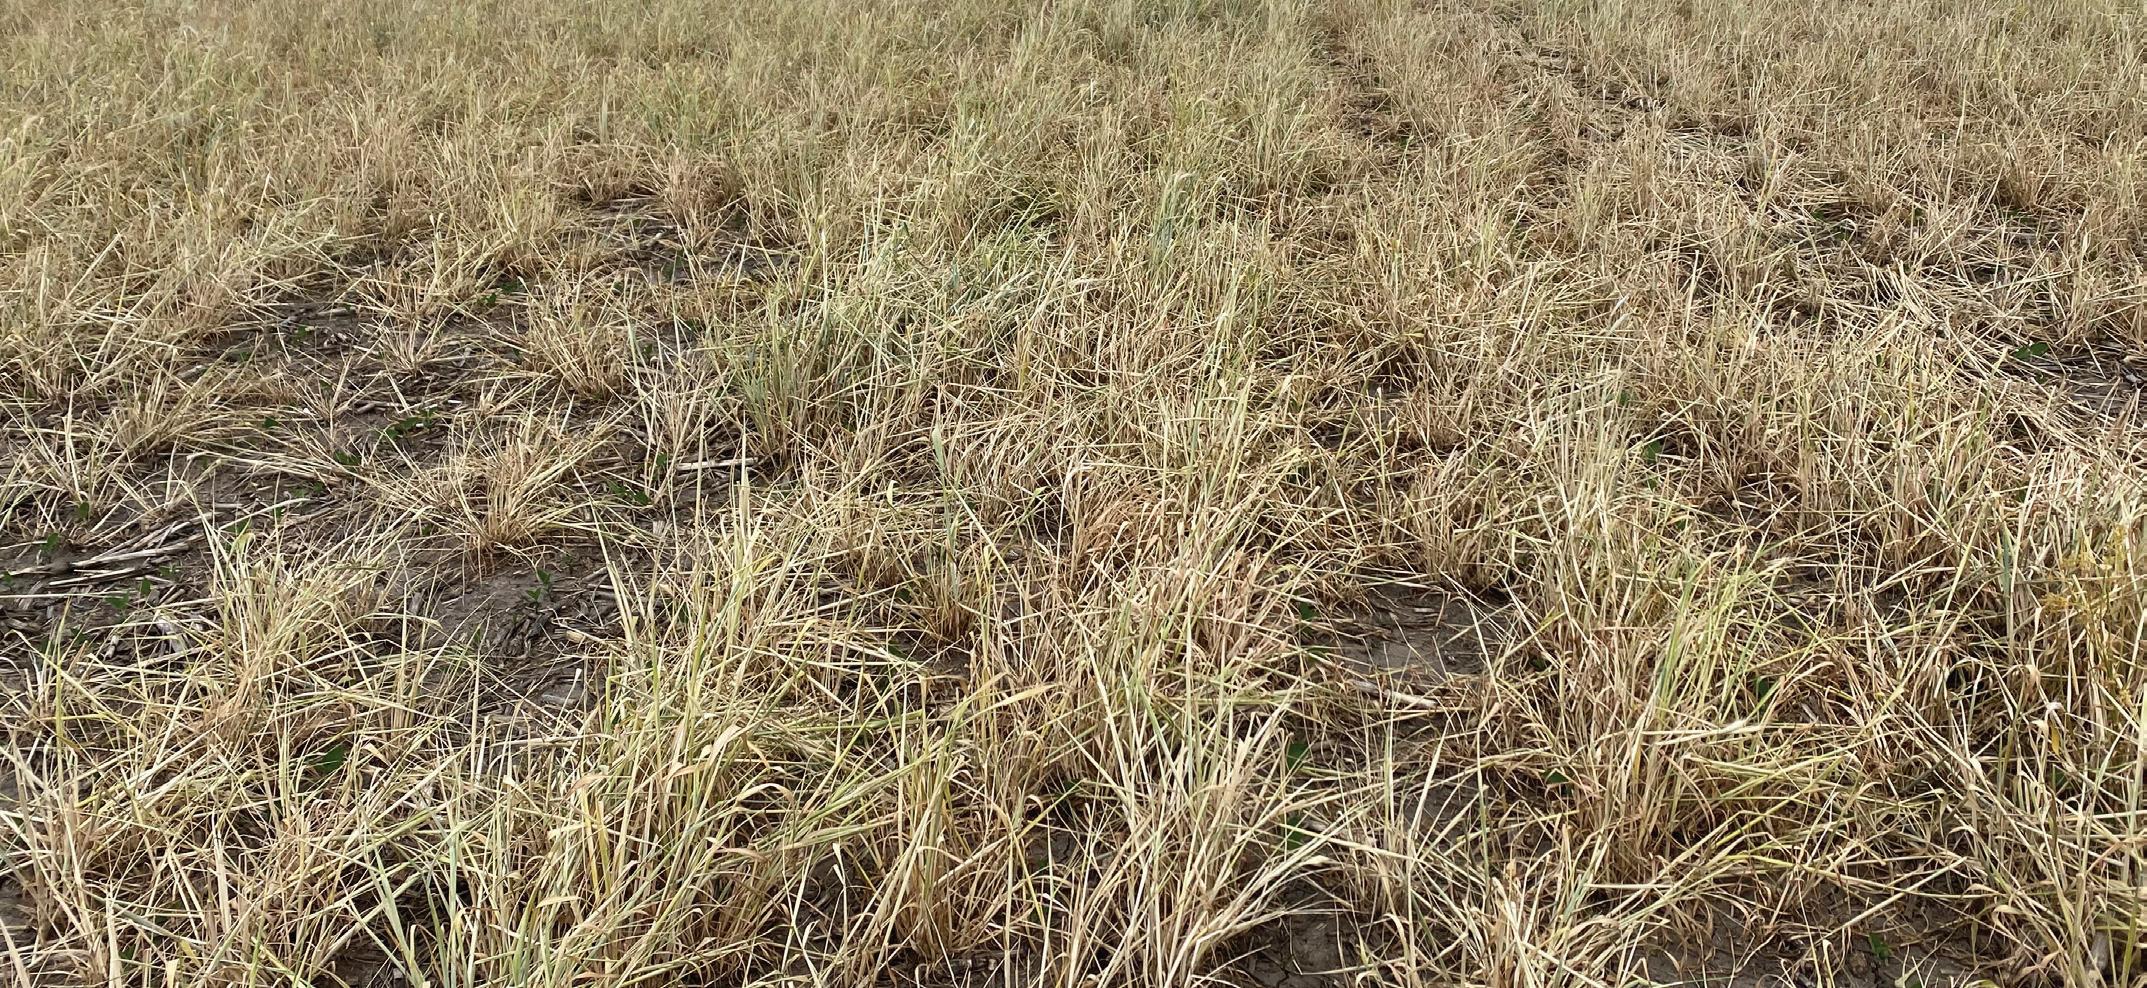
Early season damage from PPOinhibitor herbicides often presents as leaf burn, or necrotic spots on the cotyledons and hypocotyls and is more prevalent during cooler or wetter early season growing conditions (Image 1).
In 2023, wet weather caused a delay in planting which prevented the trials from being initiated early. The delay provided warmer planting conditions, enabling rapid herbicide metabolism in seedlings and minimizing damage.
Group 14 Herbicides: Does Their Injury Affect Yield?
BY SHANE BECK ISA RESEARCH AGRONOMIST SBECK@IASOYBEANS.COM
The 2024 season started warm and dry but quickly turned wet as these trials were being initiated. Early season leaf injuries were identified in both the Fierce EZ strips and the Zidua SC strips. Injury severity was rated on a scale of 1 (no injury) to 9 (completely dead) and averaged 3 for both herbicide treatments. The injury observed in the Zidua SC strips (Image 1) were leaf malformations caused by the disruption of cell membrane development. Plants quickly recovered from the early season injuries and grew normally during the remainder of the season.
Herbicide trial results and insights
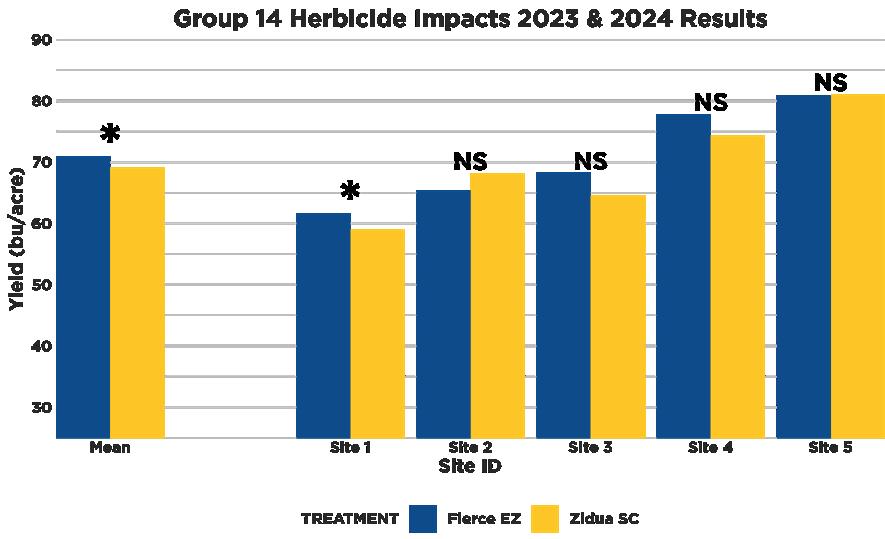
Overall, there was a slight yield increase in the average yield of Fierce EZ compared to Zidua SC, as shown in Figure 2. There was not a significant difference in yield in four out of the five sites across 2023 and 2024.
PPO inhibitor herbicides are very effective at controlling small seeded broadleaf weeds like waterhemp, making this a useful tool for farmers. Even though these herbicides can cause a small amount of injury when the conditions are cold and wet in early spring, there is not a significant yield reduction associated with that injury.
Group 14
Herbicide Impacts 2023 and 2024 Results
Figure 2: The yield data for soybeans treated with either Fierce EZ (Groups 14 and 15; blue) or Zidua SC (Group 15; yellow) in 2023 and 2024 shows an average yield increase for the Fierce EZ treatment compared to Zidua SC. This suggests that the use of a PPO inhibitor herbicide did not result in any yield loss effects due to early-season leaf burn.
Image 1: PPO Inhibitor injury on left, necrotic spots on cotyledons. Group 15 injury on right, heart-shaped malformed leaves.
(Photo: Iowa Soybean Association/Shane Beck)
What is Farmers for Soil Health?
Farmers for Soil Health is a program built by farmers for farmers with the goal of enhancing soil health and farmer profitability.
FINANCIAL INCENTIVE
To help with the start-up costs of cover crops, Farmers for Soil Health offers financial assistance over a three-year period.
Year one: $25/acre; Year two: $15/acre; Year three: $10/acre
LEARN MORE ABOUT FARMERS FOR SOIL HEALTH
For more information, visit farmersforsoilhealth.com
TECHNICAL ADVISOR
Iowa has a network of conservation agronomists, serving as technical advisors to provide research-based information and educational resources to aid in the transition of each field.
FOR MORE INFORMATION, CONTACT: Mike Gilman Conservation Agronomy Lead mgilman@iasoybeans.com 515-577-5600
Funded by the soybean checkoff.
TRestoring Habitat Benefits Landowners, Farmers and Ecosystems
BY BRANDON IDDINGS
ISA SENIOR CONSERVATION SERVICES MANAGER BIDDINGS@IASOYBEANS.COM
he Iowa Soybean Association (ISA) is partnering with farmers and landowners to implement voluntary conservation efforts on their farms, including habitat restorations.
The goal of habitat restorations is to stack benefits to improve multiple environmental and economical outcomes for each project. These benefits include nutrient reduction, increased habitat, flood mitigation, off-channel water source for cattle and increased yields from soil placement.
Benefits of habitat practices
ISA assists farmers with several habitat practices, including oxbow restorations and pollinator prairie establishments.
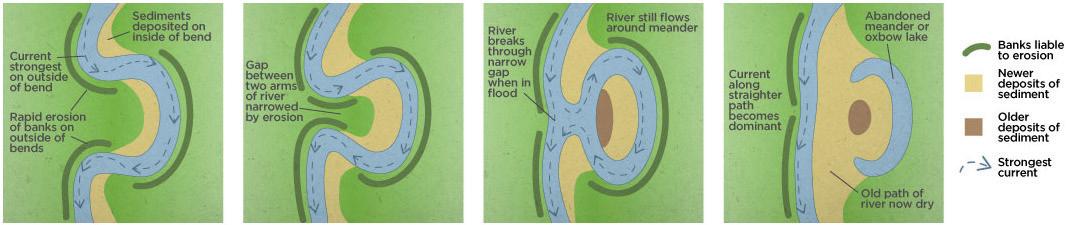
Oxbows are where old meanders of the stream are cut off from the main channel and filled with sediment over time. As these areas fill with sediment, they slowly lose their ability to provide environmental benefits.
The restoration process is to excavate the sediment out to the historic stream bed, thus restoring its benefits.
Additional habitat restoration efforts include prairie and pollinator plantings. Prairies once covered 80% of Iowa providing many benefits to soil, plants, animals and water quality. Today, Iowa has less than 0.1% of its original prairie habitats.
Establishing traditionally native forbs (flowers) and prairie grasses in targeted locations, often in unproductive or unprofitable areas of Iowa farms, supports pollinators like bees and butterflies, and improves soil and water outcomes.
Some of the stacked benefits farmers experience from multi-purpose oxbow practices include off-channel water sources for cattle and enhanced crop yields.
The historic gravel streambed and stable banks of the oxbow create safe and easy access for cattle. Additionally, the soil removed from the oxbow is usually high-quality soil that can be spread out in their crop fields and potentially increase crop yields.
Many of the benefits to the landowner are also beneficial to the ecosystem. If a landowner is concerned about in-field erosion, strategically planting deep-rooted
prairie will slow water movement which will reduce soil erosion and nutrient losses, thereby improving downstream water quality.
Both oxbow restorations and prairie plantings documented water quality benefits with 62% nitrate removal in restored oxbows and 90% nitrate removal in restored prairies.
Of the 63 oxbows restored since 2021, 25% are treating tile, removing more than 32,000 pounds of nitrate, while the others are enhancing native habitats.
Both habitats also have benefits for different plants and animals in Iowa. This includes creating fish nurseries in oxbows for the endangered Topeka shiner, and numerous bird and butterfly species benefiting from the prairie habitat.
In June 2024, ISA, in partnership with the U.S. Fish and Wildlife Service, seined 25 oxbows and the endangered Topeka shiner was found thriving in all of them.
Both practices help reduce flooding by creating additional flood water storage. Oxbow restorations can hold approximately one million gallons of
A development of an oxbow lake.
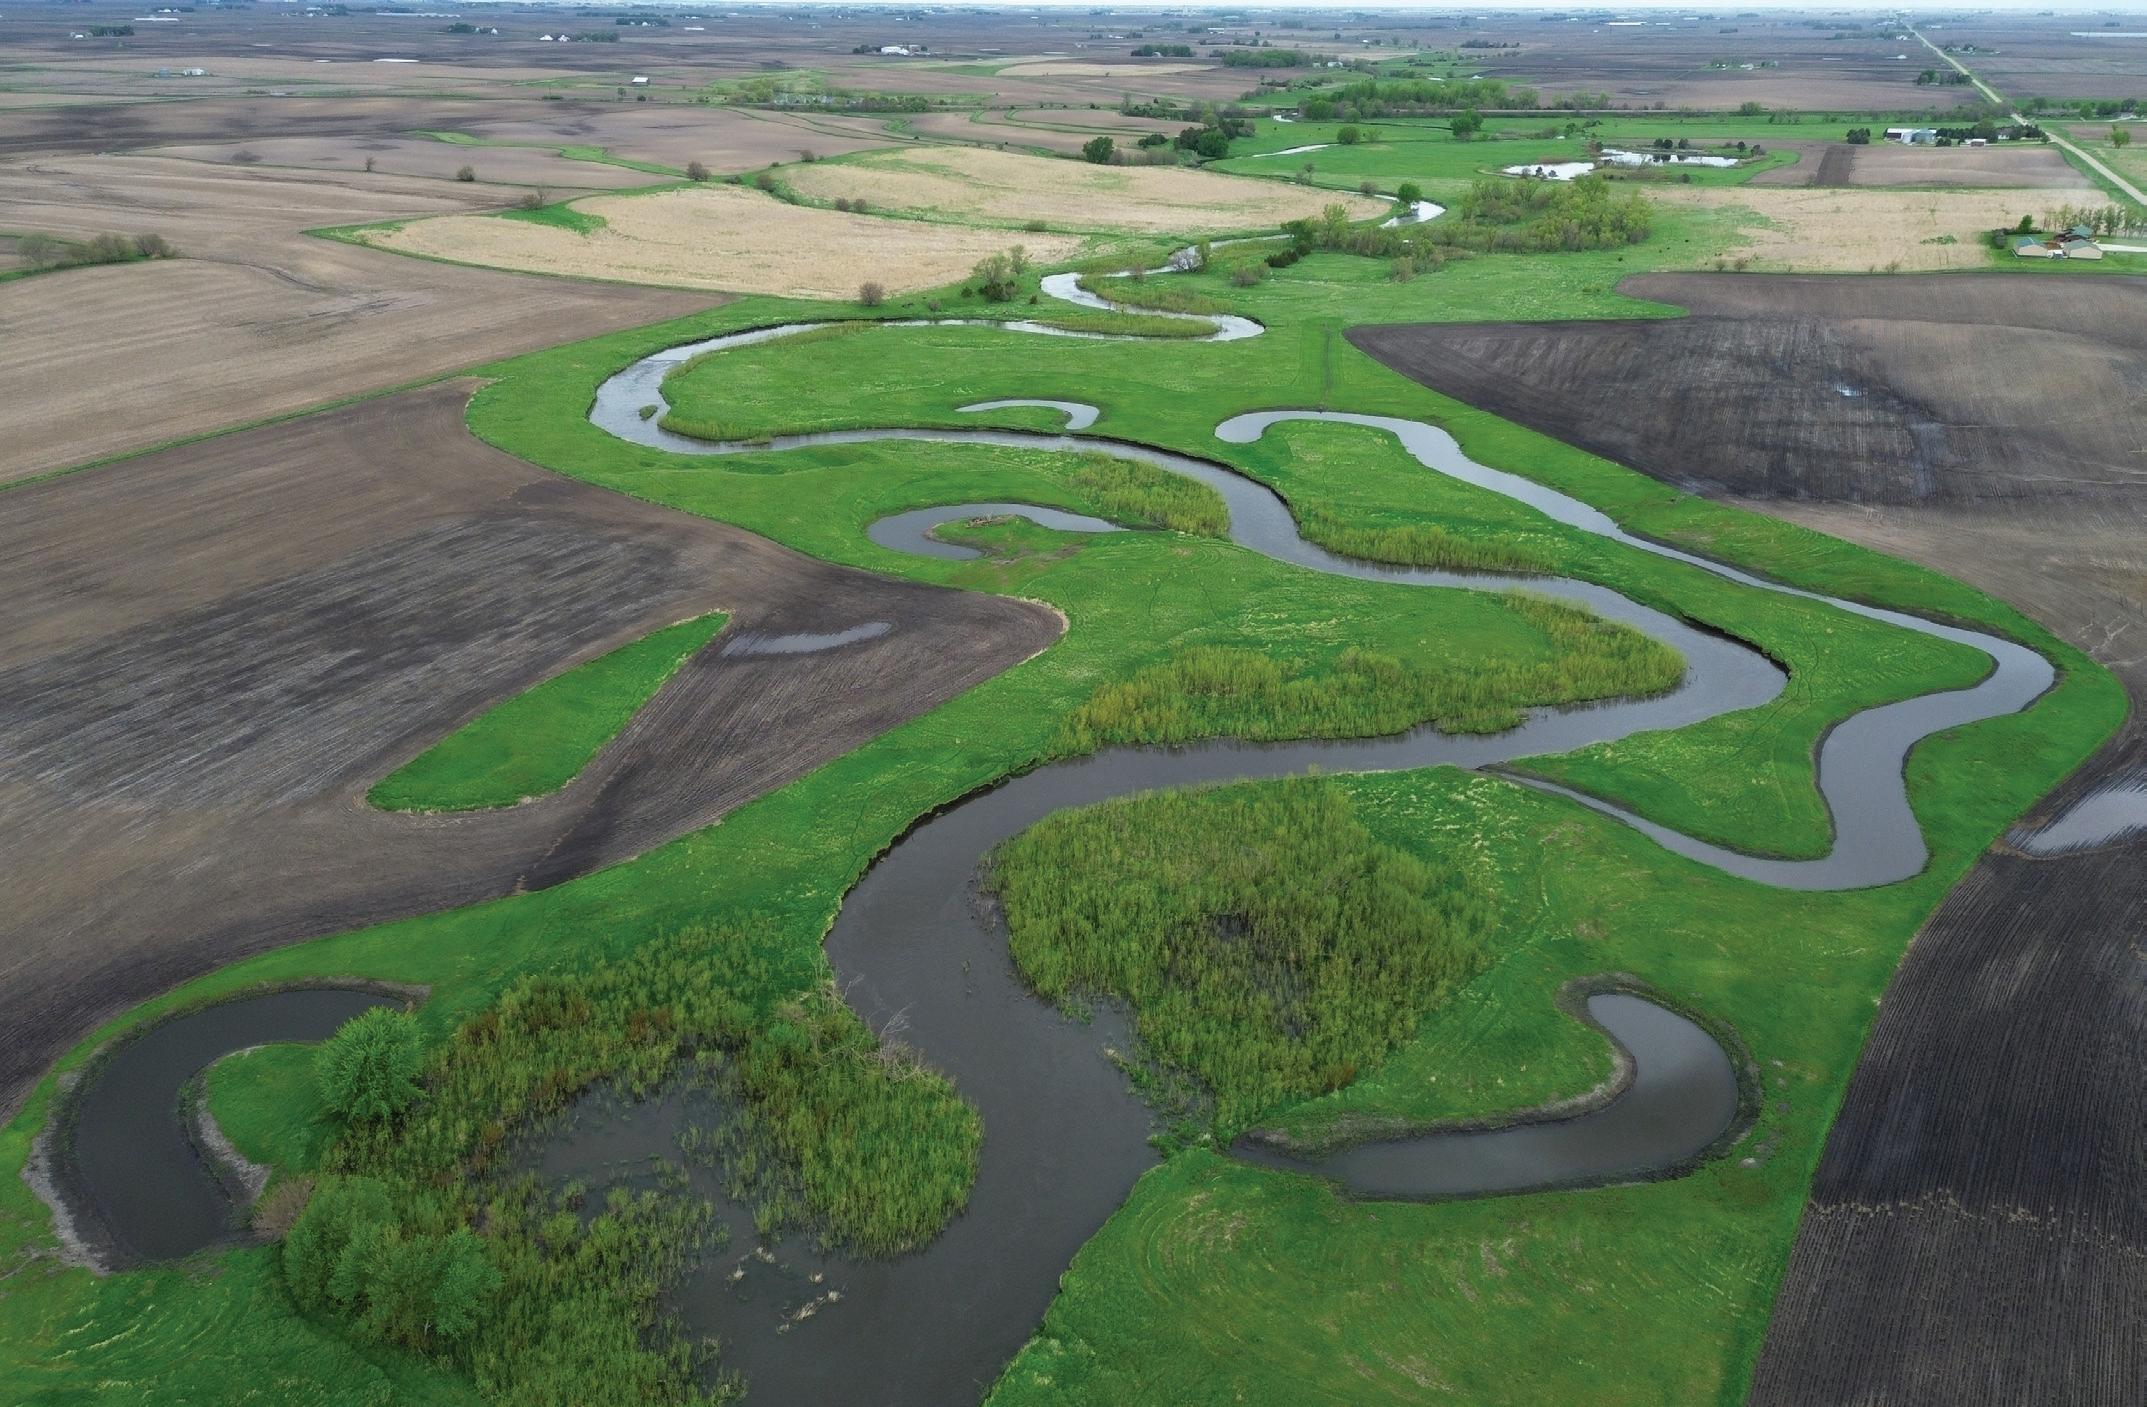
Restored oxbows offer improved water quality and create habitat restoration opportunities through reintroducing native plants.
water per acre, and prairie and pollinator habitats act like a sponge with their deep roots, helping to alleviate flooding impacts.
ISA has helped farmers and landowners restore 63 oxbows since 2021, providing flood mitigation for more than 29 million gallons of water, more than the water used to fill 44 Olympic-sized swimming pools.
A farm legacy
There are also farm legacy benefits associated with habitat restorations.
One of the landowners with a restored oxbow took their grandkids to the site and spent the day catching frogs and crawfish.
Another farmer’s son joined ISA as we seined the oxbow for fish; he commented on how great it is that his dad restored the oxbow as we surveyed hundreds of fish.
While working on a native prairie planting, a landowner remarked on how her deceased father was an avid conservationist and she was remembering his legacy by converting some of their pasture into prairie. These projects provide another way for current and future generations to connect to the land.
Making an impact
These practices demonstrate how Iowa soybean farmers have a voluntary and positive impact on conservation and the environment. ISA partners with many supporting organizations, including state, federal and private agencies to manage multiple funding sources and support farmers as they implement conservation practices across Iowa.
If you are interested in learning more about these opportunities and want ISA to survey your farm to see what conservation practices would work, contact me at biddings@iasoybeans.com.
ISA will look at aerial imagery and other resources to see what practices might work on your farm, then schedule a site visit with you on your farm to talk more about the opportunity.
Over the past three years, necessary funding has been secured to implement the practices at no out-of-pocket cost to the landowner. We will work with you every step of the way to get your project implemented, while making sure your goals are met, and the projects are completed efficiently.
SCover Crop Termination Considerations
BY JOSEPH WUEBKER ISA CONSERVATION AGRONOMIST JWUEBKER@IASOYBEANS.COM
pring in Iowa marks a critical time for farmers who utilize cover crops as part of their agricultural practices. Cover crops, such as cereal rye, clover and vetch, are planted during the off-season to provide numerous environmental benefits, including soil health improvement, erosion control and enhanced nutrient availability. However, the successful termination of these crops in the spring is essential to maximize their benefits and prepare the land for the upcoming planting season.
Cover crop termination typically occurs in April and early May, depending on the specific crop and weather conditions. Farmers often employ various methods to terminate cover crops, including mowing, rolling and chemical herbicides based on their specific needs and resources available.
Each method has its pros and cons. Mowing is a mechanical option that can reduce competition for moisture while preserving root structures that improve soil health. On the other hand, herbicides can effectively kill the cover crop but may also introduce concerns about residual chemicals affecting subsequent cash crops. This points to the importance of including all of the agronomists and suppliers in conversations about cover crop intentions to minimize potential risks.
Timing is crucial during this process. If cover crops are terminated too late, they may compete with cash crops for resources, negatively impacting yields. Conversely, terminating too early can result in reduced biomass and, consequently, diminished soil benefits. Farmers must balance these factors to
optimize the benefits of cover crops while ensuring the successful establishment of their primary crops.
Weather conditions must also be considered during termination. Cover crop death and decomposition rates are impacted by the amount of moisture and temperature. Farmers need to remain vigilant and adaptable to changing conditions, which can vary significantly from year to year.
Integrated management practices are also essential. Combining cover crop termination with other strategies, such as proper crop rotation and soil testing can enhance the overall effectiveness of the cover crop system. The goals should include (but are not limited to) improving soil structure, increasing organic matter and managing pests and diseases.
Proper
effectiveness
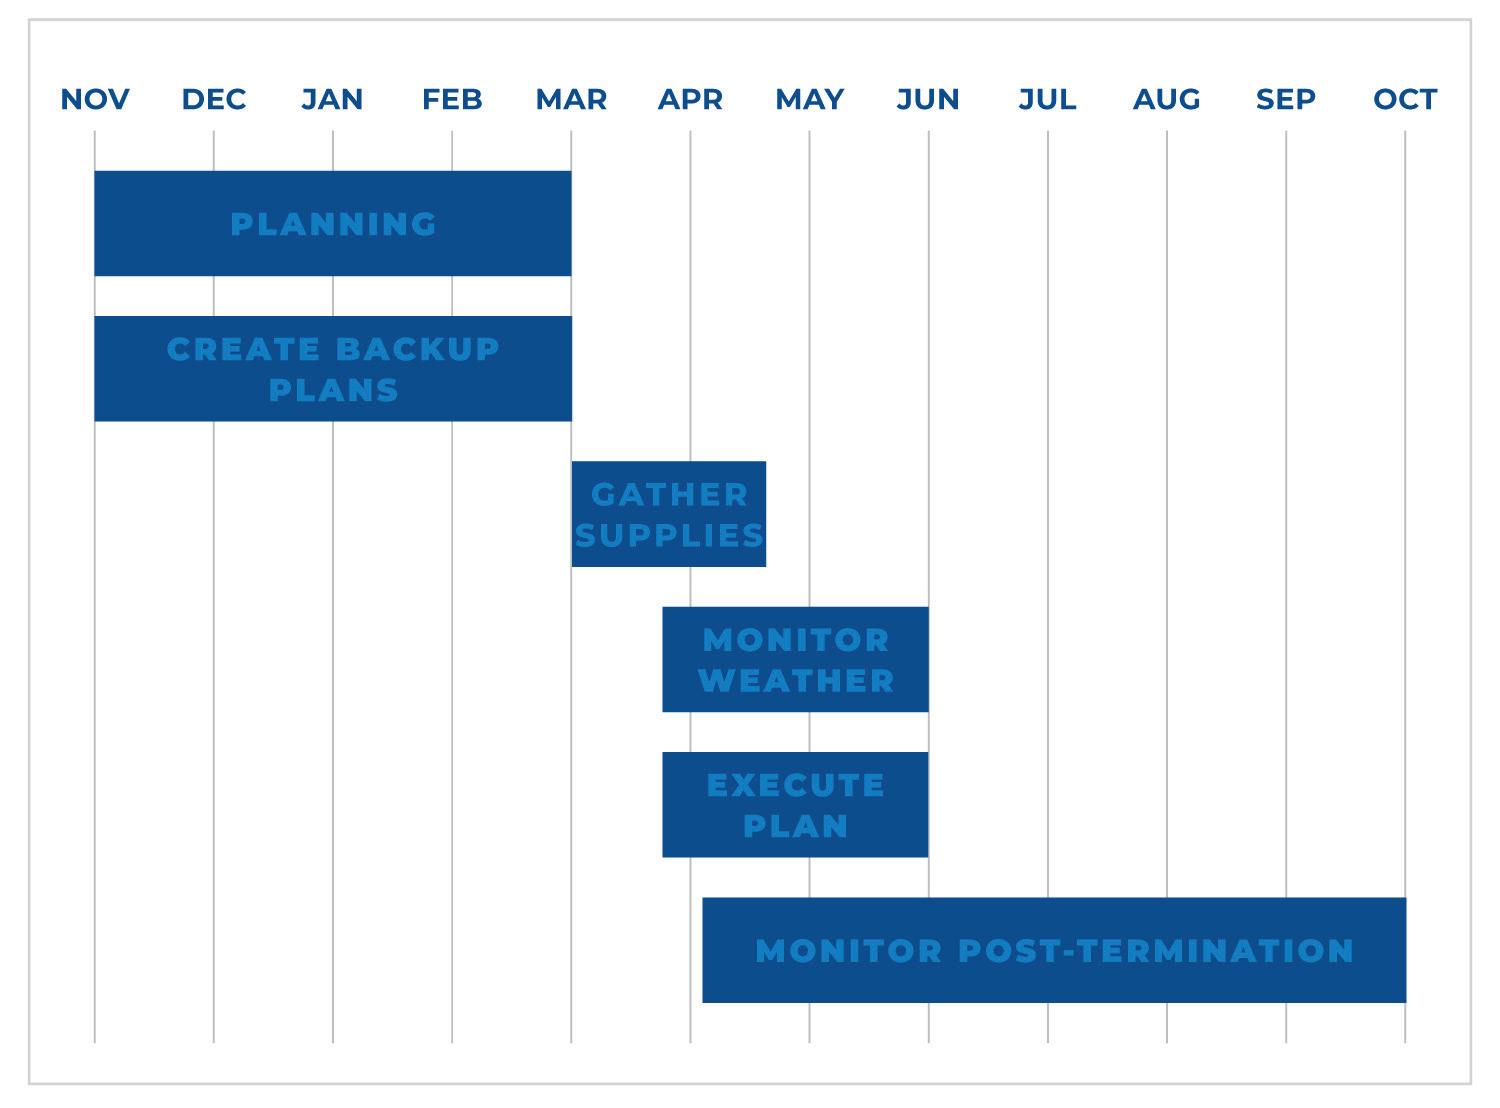
Recommendations for preparing for spring termination of cover crops
1. PLAN EARLY
Collaborate with your suppliers and agronomists to determine your preferred method of cover crop termination. Ensure that everyone involved is aware of the plan and their roles in the process.
2. PREPARE A BACKUP PLAN
Anticipate potential changes or challenges that may arise. Having an alternative plan ensures you can pivot quickly if your initial method encounters issues.
3. GATHER SUPPLIES
Early in the season, procure any necessary chemicals and prepare the
required equipment. This proactive approach will save time and ensure you are ready when the termination window opens.
4. MONITOR WEATHER PATTERNS
Stay updated on weather forecasts and changes as the termination window approaches. Understanding these patterns can help you adjust your plans accordingly and capitalize on optimal conditions for termination.
5. EXECUTE THE PLAN
When the time comes, carry out your chosen termination method as accurately and efficiently as possible. This precision is critical to achieving the best possible outcome.
6. MONITOR POST-TERMINATION
After executing your termination plan, closely observe the fields for signs of
Spring termination of cover crops in Iowa is a multifaceted process that requires careful planning and execution. By understanding the various termination methods, timing considerations and integrated management practices, farmers can optimize the benefits of cover crops and contribute to sustainable agricultural practices. As a partner in the field of all Iowa farmers and landowners, the Iowa Soybean Association has conservation agronomists, research agronomists and other professionals on staff who can assist in developing and executing a plan that fits into your operation. Cover crop timeline
success or failure. This monitoring will allow you to make necessary adjustments for future cover crop management and your current cash crop’s success.