Thank you for supporting the Climate Council. The Climate Council is an independent, crowd-funded organisation providing quality information on climate change to the Australian public.
Published by the Climate Council of Australia Limited ISBN:
978-0-9953639-8-4 (print) 978-0-9953639-9-1 (web)
© Climate Council of Australia Ltd 2016 This work is copyright the Climate Council of Australia Ltd. All material contained in this work is copyright the Climate Council of Australia Ltd except where a third party source is indicated. Climate Council of Australia Ltd copyright material is licensed under the Creative Commons Attribution 3.0 Australia License. To view a copy of this license visit http://creativecommons.org.au. You are free to copy, communicate and adapt the Climate Council of Australia Ltd copyright material so long as you attribute the Climate Council of Australia Ltd and the authors in the following manner: Land carbon: No substitute for action on fossil fuels by Will Steffen, Jacqui Fenwick and Martin Rice.
The authors contain sole responsibility for the contents of this report. — Image credit: Cover Photo: “Gum tree against cloudy sky” by Flickr User Benjamin Bicakci licensed under CC BY-NC-ND 2.0 This report is printed on 100% recycled paper.
facebook.com/climatecouncil
info@climatecouncil.org.au
twitter.com/climatecouncil
climatecouncil.org.au
CLIMATE COUNCIL
Preface Last year, Australia joined the rest of the world by committing to limit global temperature rise to well below 2°C above pre-industrial levels, and to pursue efforts to limit the temperature increase to 1.5°C. To reach this goal we need to rapidly and drastically reduce our greenhouse gas emissions. Yet Australia’s fossil fuel emissions continue to rise and we lack a robust, credible long-term plan to cut Australia’s emissions consistent with our commitments. While rapidly reducing fossil fuel emissions is essential for meeting the climate change challenge, storing carbon in land can make a useful, though secondary, contribution. This report describes the carbon cycle and how moving carbon from the atmosphere back to the land by planting trees or other means is useful but cannot offset fossil fuel emissions. We then describe how the Earth’s capacity to take up excess CO 2 from the atmosphere is being outstripped by the rate at which human activities, primarily the burning of fossil fuels (coal, oil and gas), are adding CO 2 to the atmosphere. Furthermore, current annual carbon emissions from fossil fuels are ten times greater than the annual amount of carbon that could be stored by sustainable land carbon mitigation methods. The report concludes that tackling climate change effectively can only be done by reducing fossil fuel emissions deeply and rapidly. Thanks to Climate Council staff and our research volunteers Sarah Beitel, Jacqueline King and Sally Macdonald. We are very grateful to the reviewers of the report for their thorough and constructive comments: Dr. Pep Canadell (CSIRO and Global Carbon Project), Dr. Vanessa Haverd (CSIRO), Anissa Lawrence (Tierra Mar), Associate Professor Andrew Macintosh (ANU). Responsibility for the final content of the report remains with the authors.
Professor Will Steffen Climate Councillor
Jacqui Fenwick Researcher, Climate Council
Dr Martin Rice Head of Research Climate Council
I
II
LAND CARBON: NO SUBSTITUTE FOR ACTION ON FOSSIL FUELS
Key Findings 1 2 Carbon dioxide has a significant and indisputable impact on the Earth’s climate. ›› Carbon dioxide (CO2) is the Earth’s thermostat. The more CO2 in the atmosphere, the warmer it gets at the Earth’s surface. ›› Today, the atmospheric CO2 concentration is about 400 parts per million, significantly higher than at any other time in the history of humanity. ›› This increase in CO2 , which is being driven primarily by the burning of fossil fuels, is driving a rapid increase in global temperatures.
Land systems can make an important contribution to mitigating climate change by removing carbon dioxide from the atmosphere or avoiding emissions of carbon dioxide to the atmosphere. ›› Avoiding clearing of old growth, carbon-rich vegetation and protecting regrowth vegetation are the most effective approaches to mitigating climate change using land systems. ›› Maintaining and restoring carbon-rich vegetation has many other benefits, including the protection of biodiversity, the maintenance of water quality, and the enhancement of long-term soil carbon storage. ›› Other approaches to landbased mitigation can also be useful. These include improved land management to protect soil carbon, development of sustainable bioenergy systems, and protection of carbon stored in coastal ecosystems (“blue carbon”).
3 Moving carbon from the atmosphere back to the land by planting trees or other means is useful but cannot offset fossil fuel emissions. ›› Unlike buried fossil fuels, carbon stored on land is vulnerable to being returned to the atmosphere, for example through bushfires, insect plagues and changes in land clearing policies. ›› Increasing the carbon in land systems simply means we are putting back some of the ‘active’ carbon that has been lost to the atmosphere over many years. This is not a permanent way of reducing atmospheric carbon in the long term, and therefore cannot offset emissions of carbon from the burning of fossil fuels. ›› Continuing to burn fossil fuels while assuming that these emissions are being offset by increasing land carbon is counterproductive. ›› However, sequestering carbon in land systems is still very useful. The challenge is to BOTH reduce fossil fuel emissions deeply and rapidly AND return back to the land as much as possible of the atmospheric carbon that originated from the land.
KEY FINDINGS
4
5
6
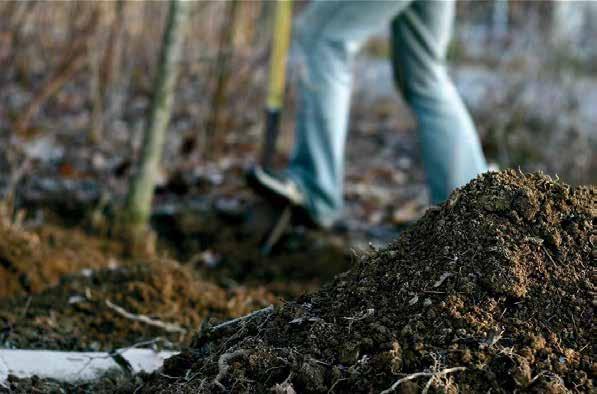
Carbon from fossil fuels has been locked away from the active carbon cycle at the Earth’s surface for millions of years.
Developing a ‘firewall’ between Australia’s fossil fuel emissions reduction policies and policies to increase carbon uptake on land would provide transparency around Australia’s emissions reduction efforts.
Tackling climate change effectively can only be done by reducing fossil fuel emissions.
›› CO2 emitted from burning fossil fuels is additional, 'new' carbon that hasn’t been part of the active land-atmosphere-ocean carbon cycle. ›› In the active carbon cycle, carbon is exchanging naturally all the time between the land and atmosphere and between the ocean and atmosphere. ›› Land clearing and other disturbances, as well as reforestation, can shift large amounts of ‘active’ carbon from the land to the atmosphere and back again.
›› There should be no offsetting of fossil fuel emissions by increasing land carbon. ›› There should be separate reporting of fossil fuel emissions and of land carbon uptake and loss. ›› Storing carbon in land can become counterproductive if policy settings allow it to delay or replace fossil fuel emission reductions.
›› The Earth’s capacity to take up excess CO2 from the atmosphere is being outstripped by the rate at which human activities, primarily the burning of fossil fuels, are adding CO2 to the atmosphere. ›› Current annual carbon emissions from fossil fuels are ten times greater than the annual amount of carbon that could be stored by sustainable land carbon mitigation methods.
climatecouncil.org.au
III
IV
LAND CARBON: NO SUBSTITUTE FOR ACTION ON FOSSIL FUELS
Contents Preface
I
Key Findings.....................................................................................................................................................................................II Introduction ......................................................................................................................................................................................1 1. Carbon Dioxide is the Climate’s Thermostat.................................................................................................................. 3 2. Biological and Fossil Carbon: A Crucial Difference...................................................................................................... 6 3. Australia’s Changing Land Carbon Budget....................................................................................................................16 4. Approaches to Land-based Carbon Sequestration...................................................................................................... 22 5. Limits to Land Carbon Storage.......................................................................................................................................... 28 5.1
Competition for Other Land Uses
29
5.2. Vulnerability of Stored Carbon
31
5.3. Problems of Scale
39
6. Implications for Climate Policy.........................................................................................................................................41
7.
6.1. Land Carbon “Offsets”
42
6.2. Policy Provisions
45
The Bottom Line ................................................................................................................................................................... 49
Glossary
51
Appendix 1: How does the Federal Government Calculate Changes in Land Carbon?
52
References 53 Image Credits
57
INTRODUCTION
Introduction Last December, Australia joined the rest of the world in pledging to do everything possible to limit global warming to no more than 2°C above pre-industrial levels, and furthermore to pursue efforts to limit the temperature increase to 1.5°C. Since then, much of the national conversation has turned to how Australia will meet its commitment to reduce its emissions by 26-28% on 2005 levels by 2030. Although this is far below what the Climate Change Authority (the Australian Government's climate change advisory body) determined in July 2015 was necessary for Australia to do its fair share to avoid the most dangerous impacts of climate change, it will still require rapidly transitioning our energy systems away from fossil fuels towards renewable energy. Yet Australia lacks a robust, credible longterm plan to cut Australia’s carbon dioxide (CO2) emissions from fossil fuel combustion. Government statistics released in May 2016 showed that Australia’s emissions rose again in 2014-2015 by 0.4% excluding land use emissions. If the latter are included, emissions rose by 1.1%. Emissions from the electricity sector, the largest source, jumped 1.8% in the 2014-15 year compared to 2013-14.
Land carbon and fossil fuel carbon should be considered very differently.
As this report describes in more detail later, land carbon and fossil fuel carbon should be considered in very different ways (Figure 1). Carbon is exchanging naturally and from human actions all the time between the land and atmosphere. So CO2 lost from the land from disturbances like deforestation is simply a transfer of already “active” carbon from the land to the atmosphere. Likewise, planting trees returns some of that active carbon from the atmosphere back to the land. In contrast, CO2 emitted from burning fossil fuels comes from carbon that has been permanently locked away from the active land-atmosphere carbon exchange for millions of years. So, moving carbon from the atmosphere back to the land by planting trees or by other means cannot “offset” fossil fuel emissions. We are simply putting back some of the carbon that was earlier transferred from the land to the atmosphere from deforestation and other land management activities. Furthermore, this land carbon isn’t permanently locked away; it is vulnerable to being returned to the atmosphere from human actions (e.g., changing land clearing laws) and natural disturbances (e.g., bushfires and insect attacks). Put simply, there is no substitute for reducing fossil fuel emissions. Many of Australia’s trading partners have already acknowledged that coal cannot play a role in their energy future and have begun to take steps towards realising a fossil fuelfree future.
1
2
LAND CARBON: NO SUBSTITUTE FOR ACTION ON FOSSIL FUELS
There is no substitute for reducing fossil fuel emissions. Leaders of the G7 nations recently agreed to phase out fossil fuel subsidies by 2025. China will close more than 1000 coal mines this year. Electricity emissions fell 18% last year in the US as the nation accelerates its renewable energy transition. Moreover, global CO2 emissions from fossil fuels and industry stalled over the past two years (2014 and 2015), despite continued economic growth. The main reason for this reduction in emissions was decreased coal use in China, together with slower global growth in petroleum and faster growth in renewables (Jackson et al. 2016). Furthermore, China recently announced that it will ban new
coal-fired power stations as part of its 13th Five Year Plan’s energy policy. South Korea plans to close 10 coal stations by 2025. India has cancelled plans for four coal stations, totalling 16GW of capacity. In addition, Canada, Mexico and the United States have jointly committed to achieving 50% clean energy by 2025 (The Climate Institute 2016). However, Australia cannot consider itself truly on the path to tackling climate change without a plan to reduce and rapidly eliminate fossil fuel emissions at the source, and effective policy settings to achieve that plan.
ATMOSPHERIC CARBON carbon dioxide (CO2) in the air
Continuous exchange between land and atmosphere by natural (and human) processes on timescales from seconds to centuries.
LAND CARBON vegetation and soils
Locked away from atmosphere for millions of years. Only emitted to the atmosphere by human mining and combustion.
FOSSIL CARBON fossil fuels buried in the ground
Figure 1: Carbon is continually exchanged between the land and the atmosphere on timescales of seconds, days, decades and centuries, whereas fossil carbon has been locked away from the atmosphere for millions of years.
CHAPTER 01 CARBON DIOXIDE IS THE CLIMATE’S THERMOSTAT
1. Carbon Dioxide is the Climate’s Thermostat Carbon is one of the most important elements on Earth. Not only is it a fundamental building block for life, it is also an important regulator of the temperature at the Earth’s surface. Just as the thermostat at your home can be turned up or down to regulate the temperature inside, increases or decreases in the concentration of carbon dioxide (CO2) in the atmosphere cause increases or decreases in the Earth’s surface temperature (Pierrehumbert 2011; Figure 2). To understand how the greenhouse effect works, we need to understand the “energy balance” at the Earth’s surface (IPCC 2007). Figure 3 shows how CO2 and other greenhouse gases in the Earth’s lower atmosphere trap heat and influence the temperature at the surface. In this way, CO2 acts as a planetary thermostat. It’s like a large blanket over the surface of the Earth. More CO2 in the atmosphere - a thicker blanket traps more heat at the Earth’s surface, while less CO2 in the atmosphere - a thinner blanket - traps less heat, cooling the Earth’s surface.
CO2 Figure 2: CO2 acts as a controller of global temperature because it is a heat-trapping (“greenhouse”) gas. The more CO2 in the atmosphere, the warmer it gets at the Earth’s surface, and vice versa.
CO2 acts like a global thermostat.
3
LAND CARBON: NO SUBSTITUTE FOR ACTION ON FOSSIL FUELS
NATURAL GREENHOUSE EFFECT
Heat emitted from Earth’s surface
Solar Radiation
ENHANCED GREENHOUSE EFFECT
Heat emitted from Earth’s surface
Solar Radiation
er e sph mo At
Atmo sph er e
4
Figure 3: The influence of increased concentrations of CO2 and other greenhouse gases in the atmosphere on the Earth’s surface temperature.
crowd-funded science information
BOX 1: GREENHOUSE GASES There are a number of gases that contribute to the greenhouse effect. CO2 is the most wellknown, but other major greenhouse gases include methane (CH4), nitrous oxide (N2O), ozone (O3) and a number of more complex gases
(PFCs, HFCs, CFCs, and others). Of the long-lived greenhouse gases, CO2 is the most important because of its high concentration and its long lifetime in the atmosphere.
CHAPTER 01 CARBON DIOXIDE IS THE CLIMATE’S THERMOSTAT
Today, the atmospheric CO2 concentration is about 400 ppm, significantly higher than at any other time in the history of humanity. The role of CO2 as a global thermostat controlling Earth’s surface temperature is evident in Earth’s long history. Since the much warmer times when dinosaurs roamed the Earth from 65 million years ago, the climate has slowly cooled as the atmospheric CO2 concentration has gently dropped from very high levels, making the planet more habitable for large mammals like humans (Summerhayes 2015). Over the past 800,000 years, which encompasses the entire period that humans have been on Earth, the climate has cycled between long, cold ice ages with low CO2 levels of about 180 parts per million (ppm) – periods when northern Europe and northern North America were covered in ice and sabre-toothed tigers and woolly mammoths roamed northern Asia – and shorter warm periods with higher CO2 levels of about 280 ppm (Petit et al. 1999; EPICA 2004).
However, since the industrial revolution, and especially since 1950, human activities have rapidly driven up atmospheric CO2 levels to a concentration today of more than 400 ppm (Figure 4), significantly higher than at any other time in the history of humanity. The last time the CO2 concentration was at a similar level was about four to five million years ago (Haywood et al. 2011), at which time the longterm, equilibrium climate was 2-3°C warmer than pre-industrial levels, and the sea level was 10-20 metres higher than today (Naish and Zwartz 2012; Miller et al. 2012). Because CO2 is so fundamentally important for the climate, we need to know more about how the carbon cycle works, how we are changing the carbon cycle, and the most appropriate strategies and actions to reduce and eventually eliminate our disruption of the carbon cycle and the climate.
CO2 (parts per million)
CO2 400.63 (PPM) - JUNE 2016 400.0 390.0 380.0 370.0 360.0 350.0 340.0 330.0 1980
1990
2000
2010
Figure 4: At Cape Grim, an atmospheric monitoring station on the remote northwestern tip of Tasmania, a CO2 concentration above 400 ppm has been recorded for the first time. Adapted from CSIRO (2016).
5
6
LAND CARBON: NO SUBSTITUTE FOR ACTION ON FOSSIL FUELS
2. Biological and Fossil Carbon: A Crucial Difference Carbon is stored in and on land (vegetation and soils), throughout the ocean and in the atmosphere. Carbon is also stored in a fossilised form under the land and the ocean, where it has been locked away from contact with the atmosphere for millions of years.
Figure 5: Vegetation and soils store carbon (the land carbon ‘stock’) that is absorbed from the atmosphere and can be released back to it.
CHAPTER 02 BIOLOGICAL AND FOSSIL CARBON: A CRUCIAL DIFFERENCE
BOX 2: THE CARBON CYCLE – SOME DEFINITIONS Carbon is stored in the atmosphere, the land, the ocean and in fossil deposits. These are often called “stores” or “stocks” of carbon and are usually measured in billions of tonnes of carbon. Significant amounts of carbon in the land and ocean are stored in living organisms (e.g., trees on land and phytoplankton in oceans). Carbon is always being transferred between the land, ocean and atmosphere stocks, and these transfers of carbon are usually measured in billions of tonnes per year and are often called “fluxes” of carbon. The only flux of carbon from fossil deposits to the atmosphere is from human mining and combustion of fossil fuels (e.g. coal), and currently is about nine billion tonnes of carbon per year.
The global carbon cycle is naturally dynamic, with carbon continuously and rapidly being transferred between the land and the atmosphere and between the upper ocean and atmosphere (Mackey et al. 2013). Important fluxes between the land and the atmosphere include the uptake of CO2 from the atmosphere by plants via photosynthesis (a sink), and the return of CO2 to the atmosphere by the action of microbial processes in soil and by periodic disturbances such as bushfires (sources).
When the flux of carbon is in the direction from the atmosphere to either the land or the ocean, it is often called a “sink” of carbon and is measured in billion of tonnes per year. When the flux is in the opposite direction, from the land or ocean up to the atmosphere, it is often called a “source” of carbon and, again, is measured in billions of tonnes per year. Human mining and combustion of fossil fuels also results in a “source” of carbon to the atmosphere.
Fluxes between the atmosphere and upper ocean include the dissolution of CO2 into ocean waters where it is taken up by small organisms called phytoplankton (a sink), and the release of dissolved CO2 back to the atmosphere (a source). A smaller amount of carbon is transferred from the land to ocean via transport of organic matter in rivers. Some carbon is also transferred from the upper to the deep ocean. A detailed analysis of the global cycle, including human modifications to the cycle, is given in Box 3.
7
8
LAND CARBON: NO SUBSTITUTE FOR ACTION ON FOSSIL FUELS
BOX 3: HUMAN-DRIVEN CHANGES TO THE GLOBAL CARBON CYCLE
A
THE CARBON CYCLE IN BALANCE
B
EARLY AGRICULTURE AND THE CARBON CYCLE
Atmosphere (597)
Surface Ocean (900)
Land (2,700) Fossil Fuels (3,700)
C
Atmosphere (+23)
Deep Ocean (37,100)
Land (-114) (+23) Fossil Fuels (0)
Surface Ocean (+68)
Deep Ocean (37,100)
THE CARBON CYCLE IN THE FOSSIL FUEL ERA Atmosphere (+64) (+159)
Land (-148) (+42) (+105)
Fossil Fuels (-370)
Surface Ocean (+42) (+105)
Deep Ocean (37,100)
Figure 6: Human-driven changes to the global carbon cycle, from the beginning of agriculture to the present. Adapted from Mackey et al. 2013. In Part A, the numbers in brackets are the amounts of carbon stored in each compartment in billions of tonnes. In Parts B and C, the numbers in brackets for atmosphere, land, fossil fuels and surface ocean are changes in the amounts of carbon stored in these compartments, measured in billions of tonnes.
CHAPTER 02 BIOLOGICAL AND FOSSIL CARBON: A CRUCIAL DIFFERENCE
BOX 3: CONTINUED Part A. Before the development of agriculture, the global carbon balance was in balance (Part A of Figure 6). Carbon was continuously being exchanged between the land and the atmosphere and between the ocean and the atmosphere, with a small amount being transferred via rivers from the land to the ocean. In the figure the amount of carbon stored in each of the three compartments - land, ocean and atmosphere – is given in billions of tonnes of carbon. Part B. Shows the cumulative changes to the global carbon cycle because of early agriculture, beginning around 6000 BC and continuing to the beginning of the industrial revolution about 200 years ago. Early agricultural activities released about 114 billion tonnes (Gt) of carbon to the atmosphere during that period. However, not all of this carbon remained in the atmosphere. About 68 Gt was absorbed by the ocean, and another 23 Gt was taken up by land systems in areas not affected by agriculture. That left 23 Gt remaining in the atmosphere. Note in part B of the figure that the fossil fuel carbon buried under the land remains untouched by early agricultural activities; there is no transfer of fossil carbon to the atmosphere. So the changes in the amounts of carbon stored in the land (net of -91 Gt), ocean (+68 Gt) and atmosphere (+23 Gt) represent a redistribution of the existing stocks of carbon amongst these three components of the carbon cycle. The changes in the three components add up to 0; there was no new carbon added to the system.
Part C. Shows the changes to the global carbon cycle from the beginning of the industrial revolution to the present. Due to the spread and intensification of agriculture, even more carbon was lost from the land (-148 Gt) and, again, redistributed amongst the three components – land (+42), ocean (+42) and atmosphere (+64). However, there is now an enormous amount (370 Gt) of NEW, ADDITIONAL carbon added to the active cycle from the mining and burning of fossil fuels. This new carbon is also distributed among the three components – land (+105 Gt), ocean (+105 Gt) and atmosphere (+159 Gt C). Note that the amount of additional carbon remaining in the atmosphere from the burning of fossil fuels (+159 Gt), mainly since 1950, is nearly double the amount of carbon in the atmosphere from agriculture from its beginnings about 6000 years ago all the way up to the present. The current amount of carbon in the atmosphere (843 Gt) is about 35% greater than the preindustrial amount in the atmosphere (620 Gt). It this additional carbon, primarily from the burning of fossil fuels, that is driving the changes in the climate that we are experiencing today.
9
Figure 7: Various human land use practices (eg., cultivating soils for agriculture) have all changed the fluxes of carbon between the land and the atmosphere.
When the climate is stable and there is no human interference, the global carbon cycle is in balance. Although there can be large and rapid short-term fluxes – billions of tonnes of carbon per year – between the land, atmosphere and ocean, they are in balance when averaged over centuries and millennia, and there is very little change in the stocks of carbon stored in each. This is a crucial point as it is the amount of carbon in the atmosphere that control’s Earth’s surface temperature. Humans have affected the carbon cycle for a long time, by redistributing carbon between landscapes and the atmosphere. Activities such as the burning and cutting of trees to clear land, cultivating of soil, and – conversely - the planting of new trees, have all changed the fluxes of carbon between the land and the atmosphere. The result has been a redistribution of some of the additional carbon in the atmosphere to the upper ocean and back into the land.
Although these activities redistributed carbon among the land, atmosphere and ocean stocks of the active carbon cycle, they did not introduce any new carbon to the cycle. Furthermore, these early human activities did not disturb the natural balance of the carbon cycle very much, and did not have a significant effect on the global climate. The nature of human disturbance of the carbon cycle changed fundamentally with the industrial revolution. From then, the rate of deforestation rose sharply so that the redistribution of land carbon to the atmosphere alone would have had a global impact on the climate. But even more importantly, since the industrial revolution we have increasingly accessed a large, new source of carbon – fossil fuels such as coal, oil and gas – at increasing rates, with an even more profound impact on the global climate. These are carbon stocks that were formed millions of years ago and that have taken no part in the active land-atmosphere-ocean
Prior to the industrial revolution human activities did not add new carbon to the atmosphere.
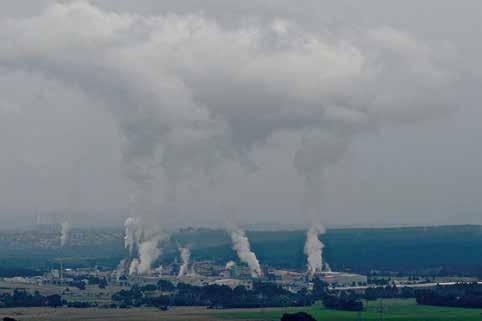
Figure 8: Combustion of fossil fuels, such as coal, emits huge volumes of greenhouse gases, mainly CO2, to the atmosphere.
carbon cycle since then. Burning fossil fuels and releasing CO2 to the atmosphere thus introduces NEW, ADDITIONAL carbon into the land-atmosphere-ocean cycle; it does not simply redistribute existing carbon in the cycle. Burning fossil fuels is therefore fundamentally different from clearing forests or tilling soils (See Box 3). So what happens to all of this new carbon that is being added to the active carbon cycle? Some of the additional carbon added to the atmosphere is absorbed by the ocean and the land (Figure 6c). In fact, just over half of the additional carbon from fossil fuel combustion is removed from the atmosphere, roughly equally, by the land and the ocean (Canadell
et al. 2007; Le Quéré et al. 2014; Le Quéré et al. 2015; Figure 9). However, this leaves almost half of the CO2 in the atmosphere, enhancing the greenhouse effect and heating the planet. Furthermore, the more rapidly we pour CO2 from fossil fuels into the atmosphere, the less efficient are the processes that can transfer some of this additional CO2 into the land and the ocean. That is, the rate that humans are emitting carbon into the atmosphere is faster than the rate Earth can absorb carbon. The result is that the fraction of human emissions that remain in the atmosphere is greater now than it was 50 years ago. In short: we’ve got a big problem.
Burning fossil fuels adds new, additional carbon to atmosphere.
LAND CARBON: NO SUBSTITUTE FOR ACTION ON FOSSIL FUELS
CHANGES IN THE GLOBAL CARBON CYCLE FROM 1850 TO 2014
Fossil fuels and industry Land-use change Land sink Atmosphere Ocean sink
40
30
20
CO2 flux (Gt CO2/yr)
12
10
0
-10
-20
-30
-40 1880
1900
1920
1940
1960
1980
2000
2014
Time (yr)
Figure 9: Changes in the global carbon cycle from 1850 to 2014. Positive changes (above the horizontal zero line) show carbon added to the atmosphere and negative changes (below the line) show how this carbon is then distributed between the ocean, land and atmosphere. “Gt C” is gigatonnes of carbon equivalent, where a gigatonne is a billion tonnes. Adapted from Le Quéré et al. 2015, data from CDIAC/NOAA-ESRL/GCP/Joos et al. 2013/Khatiwala et al. 2013.
CHAPTER 02 BIOLOGICAL AND FOSSIL CARBON: A CRUCIAL DIFFERENCE
Global fossil fuel emissions are 10 times those from land-use change. Figure 9 shows the changes in the global carbon cycle from 1850 to 2014. Above the zero line shows increasing carbon being emitted as a result of human activity – a rapidly rising amount, dominated by fossil fuel emissions. Global fossil fuel emissions are now, in absolute terms, tenfold higher than those from land-use change. Note that the land-use change emissions include emissions from deforestation minus deliberate sequestration from reforestation and other human activities (see glossary for definition of key terms). Below the zero line shows the amount of carbon being added to the atmosphere, land and oceans each year. The wild swings from year-toyear in land carbon uptake (green wedge) reflects vulnerability of land carbon stocks to a number of processes, and is discussed further in Section 5.2. (Le Quéré et al. 2015; Morton 2016). What does all of this mean for policies that aim to solve the climate change problem by storing carbon in land?
It is clear that we can’t rely on land carbon storage policies to solve the climate change problem. Here is why: Storing carbon in landscapes (e.g. planting trees, improving soil management, etc.) is best conceptualised as returning carbon that was earlier emitted from land systems (deforestation, tillage). This approach can be useful for climate mitigation and has other benefits (e.g. enhanced soil fertility); however, it does not lock the carbon away from a rapid return to the atmosphere from bushfires and other disturbances, increasing soil respiration, and changes in land clearing policies (see Section 5.2 for more details). It is a not a permanent carbon store. So, while it is extremely important to return some of this carbon to the land, this carbon cannot “offset” emissions from fossil fuel combustion, unless it is stored safely away from the atmosphere for a very long time - thousands or even millions of years.
Land systems cannot permanently store carbon and so cannot “offset” emissions from fossil fuels.
13
14
LAND CARBON: NO SUBSTITUTE FOR ACTION ON FOSSIL FUELS
BOX 4: LET’S IMAGINE A SOLUTION BASED ON CARBON OFFSETS…
Figure 10: Carbon stored in vegetation and soils is vulnerable to disturbances, such as land clearing and fires, which can return the carbon to the atmosphere.
Using land storage of carbon to “offset” fossil fuel emissions can be a very dangerous policy. Using land storage of carbon to “offset” fossil fuel emissions can be a very dangerous policy. Imagine that we decide to burn an additional amount of fossil fuels and at the same time we “offset” the resulting emissions by increasing carbon uptake into land systems by an equal amount of carbon. As a result, there is no change in the total amount of carbon in the atmosphere (additional fossil carbon emitted = carbon sequestered in land). The strategy appears to be effective; we have generated energy without a net emission of carbon to the atmosphere. However, the carbon that has been stored in the land stock is vulnerable. As soon as a bushfire, drought, change to land-use policy, or other disturbance occurs (and the risk of some of these disturbances is increasing as the climate warms), some or most of this carbon will be returned back to the
atmosphere. The atmospheric carbon stock will have increased, making the “offsets” ineffective, and the climate will warm further. Now imagine that the additional amount of fossil fuels had not been burned in the first place (e.g., the energy was generated from renewables like solar or wind, or was not needed because of increases in end-use efficiency). The emissions would not have occurred, and there was no need for an “offset”. There would be no possibility of the avoided carbon emissions being returned to the atmosphere because they are still embodied in the fossil fuel stocks left in the ground. Now, if we increase land carbon storage as well, that’s a bonus. To the extent that the carbon stored in the land can be retained over long periods of time (e.g., millennia), there will be an additional climate benefit (see Figure 1).
CHAPTER 02 BIOLOGICAL AND FOSSIL CARBON: A CRUCIAL DIFFERENCE
A basic analysis of the dynamics of the carbon cycle leads to a very clear bottom line for policy: To transform to an economy that generates no net carbon emissions we must eliminate nearly all of the fossil fuel emissions. Those emissions that remain must be removed by land (or ocean) uptake and stored in forms that are not vulnerable to return to the atmosphere. Fossil fuel emissions cannot be safely “offset� by storing carbon on land that is then left in a vulnerable state. Rather, the challenge is to BOTH reduce fossil fuel emissions deeply and rapidly AND return back to the land as much as possible of the atmospheric carbon that originated from the land (see Box 3).
Carbon stored in land is vulnerable. A bushfire or drought can return it to the atmosphere.
15
16
LAND CARBON: NO SUBSTITUTE FOR ACTION ON FOSSIL FUELS
3. Australia’s Changing Land Carbon Budget As discussed in the previous section, land carbon cannot be used to “offset” fossil fuel emissions. Nevertheless, it is important as a means of returning some ‘legacy carbon’ back to the land carbon stock (eg., “offsetting” previous deforestation emissions). Monitoring how much land-based CO2 we’re emitting and sequestering is very important for keeping track of total greenhouse gas emissions. For these reasons it is useful to understand Australia’s land carbon budget, and how it has changed.
A thorough analysis of Australia’s land carbon budget shows significant changes in many components of our land carbon cycle (Haverd et al. 2013; Box 3). The most important aspects of the cycle are: (i) the changes in plant growth due to climate variability, global warming and the additional CO2 in the atmosphere; (ii) the net loss of carbon to the atmosphere due to changes in bushfire regimes; and (iii) the net loss or gain of carbon from human land use, mainly deforestation (which emits CO2 to the atmosphere) and reforestation and afforestation (which draw down CO2 from the atmosphere).
Figure 11: Key components of Australia’s land carbon cycle have changed in recent decades, including bushfire regimes, plant growth and human land use.
CHAPTER 03 AUSTRALIA’S CHANGING LAND CARBON BUDGET
(i) Over the 1990-2011 period, increasing growth of Australia’s vegetation resulted in an increase in uptake of carbon per year. Most of this growth, which is not due to deliberate human actions, is the indirect result of rising atmospheric CO2 concentration, which acts as a fertiliser for plants and encourages growth (Haverd et al. 2013; Zhu et al. 2016). Additional uptake results from changes in the climate, both variability and long-term trends (Haverd et al. 2013). For example, northern Australia has experienced an increase in rainfall over the past two decades (CSIRO and BoM 2015), which would stimulate growth in the broad swath of savanna ecosystems across northern Australia. (ii) In Australia, climate change is driving up the likelihood of high fire danger weather (Clarke et al. 2011; Bradstock et al. 2014; Climate Council 2015a), particularly in the southeast, and long fire seasons have become more frequent (Jolly et al. 2015). In terms of observed changes in fire activity in Australia, few datasets
spanning multiple decades are available (Cary et al. 2012). However, at a regional level, analysis of a 35-year dataset (19732009) for 32 bioregions in southeast Australia shows that for seven of the eight forest regions examined, the area burned has increased significantly (Bradstock et al. 2014).
The increasing carbon sequestration due to increased growth, minus the increasing emissions due to fire, provide Australia’s contribution to the global land sink, the green wedge labelled “land” in Figure 9. The global land sink averaged about 3,000 Mt C (million tonnes of carbon) per year for the 2000-2008 period but there was very high variability from year-to-year (Le Quéré et al. 2013). Australia’s contribution of roughly 77 Mt C per year (Haverd et al. 2015) amounts to about 2.5% of the global land sink, by far the least of any of the six continents (Antarctica does not have significant areas of terrestrial ecosystems) (Sitch et al. 2015).
Figure 12: The annual bushfire regime is changing in some regions of Australia, having an impact on the exchange of carbon between land and the atmosphere.
17
18
LAND CARBON: NO SUBSTITUTE FOR ACTION ON FOSSIL FUELS
(iii) Direct human activities also affect carbon storage on Australian landscapes. Figure 14 shows the annual net emissions across Australia from forests converted to other uses (deforestation) (Department of the Environment 2016a). There has been an overall decrease in deforestation in Australia since 1990, with some year-toyear variability, mainly in response to land management policies and changing economic conditions (Garnaut 2008; Macintosh 2010). Much of the clearing has occurred in Queensland and New South Wales, and periods of increased deforestation correspond, in part, to changes in policy settings in these states (Bradshaw 2012; Evans 2016).
Net emissions from land-use change (deforestation minus reforestation and afforestation) in Australia, on average, constitute a small contribution to global deforestation emissions, which are dominated by deforestation in the tropics (see glossary of key terms). Yet land-use/ cover change emissions are a significant component of Australia’s carbon budget, and land carbon is often relied upon to play a major role in meeting Australia’s emission reduction targets. Importantly, the year-to-year variability in emissions from deforestation in Australia, and fluctuations in these emissions with policy changes in the past, demonstrate the ease with which carbon stored in land systems can be re-emitted and thus influence our ability to meet our targets.
Figure 13: Human activities such as the clearing of forests to expand agricultural land make a significant contribution to carbon emissions from the land in Australia.
CHAPTER 03 AUSTRALIA’S CHANGING LAND CARBON BUDGET
EMISSIONS FROM FORESTS BEING CONVERTED TO OTHER USES 160
Emissions (Mt CO2e)
140
Forest converted to other uses
120 100 80 60 40 20 0 -20 -40
19
90 19 91 19 92 19 93 19 94 19 95 19 96 19 97 19 98 19 99 20 00 20 01 20 02 20 03 20 04 20 05 20 06 20 07 20 08 20 09 20 10 20 11 20 12 20 13 20 14 20 15
-60
Figure 14: Line graph showing emissions from forests being converted to other uses. Based on the Department of Environment 2016a.
BOX 5: BACK-OF-THE-ENVELOPE 22-YEAR LAND CARBON BUDGET (1990-2011; HAVERD ET AL. 2013) (i)
- 80 million tonnes (Mt) of C per year (increased absorption by plants)
(ii)
+ 3 Mt C per year (increased emissions from fire)
(iii)
+ 18 Mt C per year (land use change)
Total: - 59 Mt C per year (total net land carbon sink in Australia)
By comparison, in 2014 fossil fuel emissions from Australia’s electricity sector alone were about 74 Mt C (http://ageis.climatechange. gov.au/#), higher than the net land carbon sink across the continent (59 Mt C) and very much larger than carbon emissions due to changes in land use driven by direct human management practices (18 Mt C).
19
LAND CARBON: NO SUBSTITUTE FOR ACTION ON FOSSIL FUELS
The net emissions from land-use change, when combined with the changes in land carbon due to changing climate, changing fire dynamics in some regions (Bradstock et al. 2014), and elevated atmospheric CO2 concentration, results in a net uptake of carbon by the Australian landscape since 1990 (Haverd et al. 2013). Fossil fuelgenerated emissions are about 2.6 times greater than the net uptake of carbon by Australian landscapes over the same period (Haverd et al. 2013). Emissions from our exported fossil fuels are even higher than domestic emissions and have been rising
sharply through the 1990-2011 period. Carbon embodied in exported fossil fuels was 2.5 times greater than domestic fossil fuel emissions in 2009-2010, and the combined emissions from our domestic and exported fossil fuels were about 6.5 times greater than the net uptake by Australian landscapes over the 1990-2011 period (Haverd et al. 2013). Furthermore, the net uptake by landscapes was not due to human policies or management, but was primarily driven by the fertilisation effect of the rising concentration of CO2 in the atmosphere.
LAND CARBON SINK VERSUS FOSSIL FUEL EMISSIONS IN AUSTRALIA (1990-2011)
7
6
Relative Magnitude
20
5
4
3
2
1
0 Land carbon sink
Domestic and exported fossil fuel emissions
Figure 15: Land carbon sink versus fossil fuel emissions (1990-2011). Emissions from domestic and exported fossil fuels were about 6.5 times greater than the net uptake by Australian landscapes.
Figure 16: Carbon dioxide emissions from the burning of coal and other fossil fuels are considerably greater than the net uptake of carbon by Australian landscapes.
The bottom line is that, although Australia’s land sector has been a net sink for carbon (net flux of carbon from the atmosphere to the land) over the past decade or two, this climate benefit has been overshadowed by our fossil fuel domestic emissions and exports. Furthermore, much of the carbon that has been taken up by land systems is vulnerable to return to the atmosphere by natural and human changes.
22
LAND CARBON: NO SUBSTITUTE FOR ACTION ON FOSSIL FUELS
4. Approaches to Land-based Carbon Sequestration Through the use of improved land management practices, many of Australia’s landscapes have the potential to store more carbon than they currently hold (CSIRO 2009; Wentworth Group 2009; Nous Group 2010). The same is true globally.
There are many possible approaches to increasing the land-based uptake of carbon from the atmosphere. These approaches range from the more traditional tree planting methods to new biofuel technologies and beyond. This section gives an overview of the most commonly proposed approaches, the risks and limitations of which will be discussed in Section 5.
Figure 17: Avoided land clearing can sustain existing carbon stores, prevent greenhouse gas emissions from land clearing, and enable the ongoing sequestration of carbon by vegetation and soil.
›› Avoided land clearing is the conservation of vegetation (and therefore existing carbon stocks) that would otherwise be cleared (IPCC 2014, often called “avoided deforestation”). Avoided land clearing, particularly the clearing of “mature” vegetation, can sustain existing carbon stores, prevent greenhouse gas emissions from land clearing, and enable the ongoing sequestration of carbon by vegetation and soil (Keith et al. 2009; Nous Group 2010). Analyses of the avoided land clearing potential of eucalypt forests in southeastern Australia, some areas of which have the highest known biomass density in the world (Keith et al. 2009), have estimated that the effect of retaining
the current carbon stock is equivalent to avoided emissions of 460 Mt of CO2 per year for the next 100 years (Mackey et al. 2008). If, however, all the carbon stored in the eucalypt forests was released into the atmosphere, it would raise the atmospheric concentration of CO2 by 3.3 ppm – a substantial contribution (Mackay et al. 2008). To be considered an active, additional, carbon removal approach, it needs to be clear that land clearing (and associated emissions and loss of sequestration) would otherwise have occurred. This can be difficult to prove in practice, creating a major challenge to implementing this approach (see Section 5.3).
24
LAND CARBON: NO SUBSTITUTE FOR ACTION ON FOSSIL FUELS
›› Vegetation growth or regrowth is the regrowth of native vegetation on land previously cleared of mature native vegetation (“reforestation”), or growth of vegetation in previously un-vegetated or less-vegetated areas (“afforestation”), thereby sequestering carbon from the atmosphere (Nous Group 2010; IPCC 2014). The afforestation of degraded agricultural land has been used to increase carbon sinks in North America, Europe and China, for example (Houghton et al. 1999; Wang et al. 2007; Bellassen et al. 2011; Canadell and Schulze 2014). From a carbon storage perspective, regrowth is most valuable in environments that have the right climatic and soil conditions to support high biomass vegetation types, such as tall trees (Nous Group 2010; Canadell and Schulze 2014). This approach has the potential to enhance the carbon stored in above(trunks, branches) and below-ground (roots) biomass as well as in soils. ›› Forest management is defined as “a system of practices for stewardship and use of forest land aimed at fulfilling relevant ecological (including biological diversity), economic and social functions
of the forest in a sustainable manner” (UNFCCC 2001, Marrakesh Accords). Both natural forests and plantations are included. Examples of forest management practices include site preparation, planting, thinning, fertilization and harvesting. Depending on how these practices are carried out, greater or lesser amounts of carbon can be emitted to or taken up from the atmosphere (IPCC 2006). ›› Enhanced soil carbon storage has the potential to sequester significant amounts of atmospheric carbon across the Australian landscape, including on land used for agriculture (Wentworth Group 2009; Luo et al. 2010). It has been estimated that, globally, by adopting improved land management practices, agricultural soils have the potential to sequester 400-800 Mt C per year (Lam et al. 2013). There are a large number of methods which can be used to enhance soil carbon, including the use of improved agricultural land management methods, strategic grazing management, feral animal management and the use of biochar (Nous Group 2010).
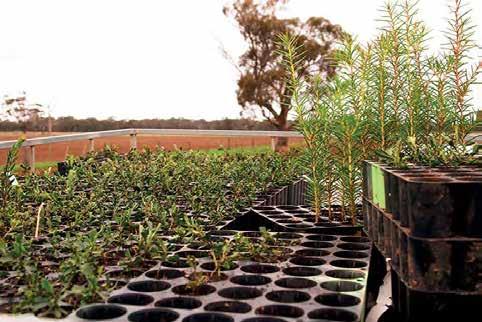
Figure 18: Afforestation and reforestation can increase CO2 uptake in vegetation and soils.
CHAPTER 04 APPROACHES TO LAND-BASED CARBON SEQUESTRATION
BOX 6: BIOCHAR
Figure 19: Biochar is a carbon rich material similar to charcoal which is relatively stable over time and is therefore quite effective at storing carbon in the long-term.
Biochar is a carbon-rich material, essentially charcoal, produced by heating biological material such as plant matter in the absence of oxygen (Ennis et al. 2012; IPCC 2014). Unlike plant matter, biochar is relatively stable over time and won’t decompose in the way that plant waste can (plant decomposition releases CO2 into the atmosphere). This means that much
of the carbon held in biochar will be stored in the long term (Woolf et al. 2010; Ennis et al. 2012). Furthermore, when added to soil, biochar can increase soil fertility, raise agricultural productivity and reduce pressure on old growth forests, all of which can enhance carbon sequestration (Ennis et al. 2012; NSW DPI 2016).
25
26
LAND CARBON: NO SUBSTITUTE FOR ACTION ON FOSSIL FUELS
›› Bioenergy is energy produced from biological sources, which can be used as a solid, liquid or gas fuel (IPCC 2014). The sustainable production of biological material, which sequesters carbon from the atmosphere, and its use for energy production can result in a net benefit for the climate if it replaces fossil fuels and thereby avoids the emissions that would have occurred had fossil fuels been burned (Canadell and Schulze 2014). The net carbon benefit is often lost, however, if the planting of biofuel crops requires the clearing of native ecosystems (Fargione et al. 2008; Field et al. 2008; Canadell and Schulze 2014; Transport and Energy 2016) or the use of significant amounts
of fertilisers (Crutzen et al. 2008). Biofuel production and use needs to be carefully and ethically balanced with other land and resources uses, but has potential to contribute to the sequestration of carbon and reduction in emissions from fossil fuel combustion (IPCC 2014). Due to the diversity of environments and ecosystems, the range of factors that affect carbon uptake and storage, and ongoing research and development in the field, there is a large and growing list of land carbon sequestration options beyond those listed in this report. At present, the options described above are among the most common.
Figure 20: When carefully and ethically balanced with other land and resources uses, biofuels have the potential to contribute to the sequestration of carbon and the reduction in emissions from fossil fuel combustion.
CHAPTER 04 APPROACHES TO LAND-BASED CARBON SEQUESTRATION
BOX 7: BLUE CARBON
Figure 21: Despite not growing on dry land, mangrove ecosystems form an important component of Australia’s biological carbon stock – often called ‘blue carbon’.
‘Blue carbon’ is carbon stored in the vegetation and sediments of aquatic ecosystems, such as saltmarshes, mangroves, and seagrass beds (Pendleton et al. 2012; NOAA 2016). Despite not occurring on dry land, ‘blue carbon’ is an important aspect of the ‘land carbon’ stock and has large potential to remove and store carbon from the atmosphere and oceans. These aquatic ecosystems absorb large quantities of carbon and are known to store carbon accumulated over hundreds to thousands of years in deep, organicrich sediments (World Bank 2010; Lawrence 2012; Pendleton et al. 2012; NOAA 2016). Seagrass beds, mangroves and saltmarshes, combined, cover approximately 49 million hectares globally (Pendleton et al. 2012). It is estimated that mangroves and coastal wetlands absorb carbon at a rate two to four times greater than mature tropical forests (McLeod et al. 2011), and store three to five times more carbon than tropical forests covering the same area (Donato et al. 2011; Pendleton et al. 2012; NOAA 2016). Even
a hectare of seagrass may hold as much nearsurface carbon (top metre sediment and biomass) as a hectare of tropical forest (Fourqurean 2012; Pendleton et al. 2012). Despite the importance of blue carbon for removing and storing atmospheric carbon, these aquatic ecosystems are being lost, globally, at rates of up to four times higher than (dry) forests (McLeod et al. 2011; Pendleton et al. 2012). Annual carbon emissions due to blue carbon loss are estimated to be similar to the annual fossil fuel emissions of the UK (Pendleton et al. 2012). At the current rate of decline, 30–40% of tidal marshes and seagrasses and nearly 100% of mangroves could be lost in the next 100 years (Pendleton et al. 2012). Protecting existing blue carbon and developing approaches to enhance blue carbon can be part of a broader approach to adapting to and mitigating against climate change.
27
28
LAND CARBON: NO SUBSTITUTE FOR ACTION ON FOSSIL FUELS
5. Limits to Land Carbon Storage The rate, magnitude and spatial scale of human-induced changes to the land surface in recent decades are unprecedented (Lambin et al. 2001).
Restoring land carbon stocks, which have been depleted through land-use change and land degradation, has many benefits for carbon uptake and for the environment and society more broadly. However, approaches to increasing the land carbon storage have their limitations. In particular, most approaches carry a risk of reversal – a potential to release sequestered carbon back to the atmosphere – and should be undertaken with caution (Murray and Kasibhatia 2013; Canadell and Schulze 2014 – see section 5.2 below).
Restoring land carbon stocks can have many benefits, but must be approached with caution.
CHAPTER 05 LIMITS TO LAND CARBON STORAGE
5.1 Competition for Other Land Uses Due to the finite area of land available and natural limits to biological productivity, land carbon projects must be balanced with competing land uses (Mackey et al. 2013; Canadell and Schulze 2014; Bryan et al. 2016).
Without strategic and sustainable land use policies and complementary management of water resources, the use of land for carbon storage risks displacing land for food production, energy generation or conservation (Canadell and Schulze 2014; CMW 2015).
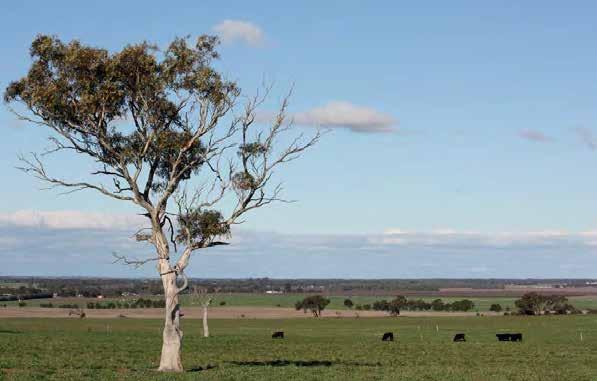
Figure 22: Competition for other land uses, such as land for cattle grazing, is an ongoing limitation to the amount of carbon that can be stored in vegetation and soil.
29
30
LAND CARBON: NO SUBSTITUTE FOR ACTION ON FOSSIL FUELS
Land use for carbon sequestration may also have social and economic implications, affecting local or regional jobs and economies, and even destabilising the global food system. For example, the switch of some North American food crop areas to biofuel production in the 2000-2009 decade is likely to have contributed to the 2008-2009 global food crisis (Homer-Dixon et al. 2015). Competition with other land uses can also lead to carbon ‘leakage’, whereby the avoided emissions or sequestration of carbon in one place causes a change in emissions elsewhere (IPCC 2000; IPCC 2001; Downie 2007; Canadell and Schulze 2014). For example, if 100 hectares of grazing land were set aside for carbon forests in one location, 100 hectares of forest might be cleared to make new grazing land elsewhere, as a result. The resulting displacement, rather than reduction, of emissions reduces or eliminates any benefit for the environment or climate (IPCC 2014).
CHAPTER 05 LIMITS TO LAND CARBON STORAGE
5.2. Vulnerability of Stored Carbon Biological carbon stored in land systems is vulnerable to disturbances, policy shifts, and a warming climate. It can be intentionally or unintentionally returned to the atmosphere, reversing the benefits of carbon sequestration efforts and adding to the atmospheric load of CO2 (Galik and Jackson 2009).
Increasing frequency of extreme heat, fire and drought due to climate change could reduce the efficacy of land carbon storage.
›› Natural disturbances, such as bushfires, droughts, insect attacks, and heatwaves, can degrade the quality of land carbon stocks, returning stored carbon back to the atmosphere or reducing the rate of carbon uptake (Heimann and Reichstein 2008; Galik and Jackson 2009; Peltzer et al. 2010; Mackey et al. 2013; Thom and Seidi 2016). Natural disturbance events vary in severity, frequency and duration (Galik and Jackson 2009). The inherent unpredictability and potential scale of natural disturbances makes them the greatest challenge to the robustness of land carbon (Galik and Jackson 2009). A small shift in the frequency or severity of climate extremes, for example due to climate change, could substantially reduce the efficacy of land carbon storage (Reichstein et al. 2013). Even under the most robust policy measures and regulatory arrangements, carbon storage in biological systems and soil is vulnerable to loss through natural disturbances, many of which are being worsened by climate change (Climate Council 2015b). ›› Blue carbon (see Box 7) is also vulnerable to disturbance events. In early 2016, for example, extensive areas of mangrove ecosystems in the Gulf of Carpentaria, which store large quantities of carbon, died off (JCU 2016). Scientists are currently investigating the event; disturbances such as extremely high water temperatures and abnormally warm and dry weather, very likely exacerbated by climate change, have been proposed as the cause.
31
32
LAND CARBON: NO SUBSTITUTE FOR ACTION ON FOSSIL FUELS
›› Policy changes and economic conditions have a notable impact on land use and land carbon storage. Carbon retained or taken up in land systems through avoidance of land clearing or reforestation to “offset” fossil fuel emissions can be returned to the atmosphere with a change of policy or economic conditions. In Australia, changes in land clearing rates have historically aligned closely with
changes in the Farmer’s Terms of Trade (ratio of prices received to prices paid) (DCCEE 2010a). More recently, changes in land clearing laws, particularly in Queensland (see Box 8), have likely influenced the observed increase in the rate of land clearing, with implications for the storage of carbon in the landscape (DCCEE 2010a; CO2 Australia 2016).
Figure 23: Natural disturbances such as bushfires can return the carbon stored in soil and vegetation back to the atmosphere.
CHAPTER 05 LIMITS TO LAND CARBON STORAGE
BOX 8: LAND CLEARING POLICY AND CARBON DYNAMICS: THE QUEENSLAND CASE
Figure 24: Policy changes in Queensland have a direct influence on land clearing rates.
Successive changes to Queensland’s land clearing policies and laws over the past decade have clearly had an influence on clearing rates, but the implications of these clearing trends for land carbon dynamics are more complex than might seem at first glance. A comparison of two systems that monitor land cover change – Queensland’s Statewide Landcover and Trees Study (SLATs) and the Commonwealth Government’s National Greenhouse Accounts, or National Inventory (NI) for short – show the complexities that arise in trying to monitor changes in area of vegetation cleared. The two systems were established for different purposes, so comparing them directly is like comparing apples and oranges. SLATs is designed to monitor compliance with the Queensland Vegetation Management Act – that is, vegetation
losses – and its data are reported in hectares of land cleared. The NI was built to support Australia’s carbon reporting requirements for the UNFCCC/Kyoto Protocol and reports in both units of Mt (millions of tonnes) of carbon emitted to or taken up from the atmosphere and in ha of land cleared. It follows international methodologies and definitions for carbon accounting. Collaboration between the two systems is making progress towards reconciling earlier apparent differences in tracking land carbon changes in Queensland. The original NI system used the protocol for the first Kyoto Protocol period (2008-2012) in which the emphasis was on direct, human-induced, permanent deforestation, where a forest was defined as having a minimum of 20% of the land area covered by the canopies of woody vegetation of at least 2 m in height.
33
34
LAND CARBON: NO SUBSTITUTE FOR ACTION ON FOSSIL FUELS
BOX 8: CONTINUED However, the methodologies and protocols for the second Kyoto Protocol period (2013-2020) have been broadened to include not only permanent deforestation but also forest management (e.g., thinning); grazing management (e.g., loss of sparse woody vegetation) and crop management. This broadening of the NI approach has brought it much closer to matching the SLATs approach, and indeed the two approaches are converging on the amount of land area cleared and the type of vegetation (e.g., forest, sparse woody vegetation) that has been cleared. Although many factors influence land clearing rates, policy changes are likely to be a significant factor in the trends shown in the SLATs data of Figure 25, where there is an increase in land clearing following the change of the Queensland state government in 2012. The earlier decrease in land clearing from 2005-06 with the introduction of a ban on broadscale vegetation clearing is also consistent with a significant influence of earlier policy changes. The NI data on the gain or loss of vegetation over the same period (Figure 26) show the same general trends as the SLATs data. In Figure 25 the SLATs estimate of the amount of woody vegetation cleared is divided into “remnant” and “non-remnant”, which are not the same definitions as the NI must use to adhere to international reporting protocols. More specifically, SLATs defines “woody vegetation” as open woodland/shrubland and denser woody vegetation, comprising land with approximately 10% or greater woody foliage cover. The definition of “remnant” woody vegetation is complex, but in general it is vegetation that is denser, less disturbed and of higher value as an ecosystem (e.g., an endangered regional ecosystem). In terms of carbon, remnant woody vegetation tends to have higher biomass (more carbon) than non-remnant woody vegetation.
The SLATs data confirm significant clearing in areas where predominant vegetation is nonremnant woody vegetation. From 2010-2011 onwards, when overall clearing rates began to increase, about two-thirds or more of the area cleared was non-remnant woody vegetation, land with vegetation cover of low biomass. Again, the NI system shows the same general trends as the SLATs data, as shown by the loss data of Figure 27 where land with vegetation cover of low biomass is called “sparse woody vegetation”. Translating hectares of land cleared (or vegetation gained) into Mt of carbon emitted (or absorbed), as carried out by the NI in accordance with IPCC guidelines, is a complex process and depends on the clearing history over long time periods. For example, first-time clearing of mature forest emits far more carbon than reclearing of regrowth forest or clearing of shrubland. This means that clearing of regrowth where there is low biomass, which is estimated to be the case for about half of the increased clearing in Queensland since 2010-11, results in negligible carbon emissions. This is not to say that clearing low-biomass vegetation is not important for the carbon cycle in the long term. Clearing of such regrowth does have implications for land carbon because it removes the potential for sequestration of significant amounts of carbon if the regrowth vegetation had been allowed to continue to grow towards maturity. The bottom line is that changes in policy can indeed influence rates of loss or gain of vegetation, but converting these changes into carbon emissions or uptake is complex and must be carried out with care and with a long-term perspective.
CHAPTER 05 LIMITS TO LAND CARBON STORAGE
BOX 8: CONTINUED
ANNUAL WOODY VEGETATION CLEARING RATE IN QUEENSLAND (1988-2015)
Remnant woody vegetation Non-remnant woody vegetation
2006: Ban on broadside vegetation clearing 2009: Clearing of high -value regrowth regulated
Clearing Rate (,000 ha/yr)
700
2012: Change of government, investigations and penalties suspended
2013: Weakening of 2006 and 2009 regulations
600
500
400
300
200
100
01 -A 01 ug -A -8 8 01 ug -A -8 9 01 ug-A 90 01 ug -A -9 1 01 ug -A -9 2 u 01 g -A -9 3 01 ug -A -9 4 01 ug -A -9 5 u 01 g -A -9 6 01 ug -A -9 7 01 ug -A -9 8 01 ug -A -9 9 01 ug -A -0 0 01 ug -A -0 1 01 ug -A -0 2 u 01 g -A -0 3 01 ug -A -0 4 01 ug -A -0 5 u 01 g -A -0 6 01 ug -A -0 7 01 ug -A -0 8 01 ug-A 09 01 ug-A 10 01 ug -A -1 1 01 ug -A -12 01 ug -A -13 01 ug -A -14 ug -1 5
0
Figure 25: History of vegetation clearing in Queensland showing recently-reported increased clearing rates in blue. Adapted from Maron et al. (2015) and Queensland DSITI (2016).
35
LAND CARBON: NO SUBSTITUTE FOR ACTION ON FOSSIL FUELS
BOX 8: CONTINUED
AGGREGATE-LEVEL COMPARISONS FOR DEFORESTATION FOR SLATS AND FOR THE NI
600,000
500,000
400,000
Hectares
300,000
200,000
100,000
0 -9 1 19 91 -9 2 19 92 -9 3 19 93 -9 4 19 94 -9 5 19 95 -9 6 19 96 -9 7 19 97 -9 8 19 98 -9 19 9 99 -2 00 0 20 00 20 01 01 20 02 02 20 03 03 20 04 04 20 05 05 20 06 06 20 07 07 20 08 08 20 09 09 -10 20 10 20 11 1120 12 12 20 13 13 -14 19
90
-9
89
19
88
-8
9
0
19
36
Qld DSITI - clearing and re-clearing activity on UNFCCC forest lands National Inventory - forest conversion and re-clearing activity
Figure 26: Aggregate-level comparisons for deforestation for SLATs and for the NI, showing strong agreement between the two systems. Adapted from Department of Environment (2016b).
CHAPTER 05 LIMITS TO LAND CARBON STORAGE
BOX 8: CONTINUED
NATIONAL INVENTORY DATA SHOWING SPARSE WOODY VEGETATION GAINS AND LOSSES IN QUEENSLAND
2,000 1,500
1000 ha
1,000 500 0 -500 -1,000 -1,500
99
00 20 01 20 02 20 03 20 04 20 05 20 06 20 07 20 08 20 09 20 10 20 11 20 12 20 13
20
98
19
97
Qld sparse vegetation losses
19
96
95
19
19
94
93
19
19
91
92
19
19
19
19
90
-2,000
Qld sparse vegetation gains
Figure 27: National Inventory resubmission showing sparse woody vegetation gains and losses in Queensland. Source: Department of Environment, Commonwealth Government. A comparison of the net loss/gain in, for example, 2013 is consistent with the data in Figure 25, that is, a net loss of ca. 100-150 kha in sparse vegetation. Adapted from Department of Environment (2016b).
Recent policy changes in Queensland have likely contributed to observed increases in land clearing.
37
Figure 28: Changes in policy can have a significant influence on land clearing rates, with implications for the loss or uptake of carbon.
›› Rising temperatures can increase soil respiration – the production of CO2 by the action of microbes on soil carbon and its release to the atmosphere (Schlesinger and Andrews 2000). An increase in air temperature has been found to result in an increase in soil respiration in most ecosystems, particularly in high latitudes (Raich and Schlesinger 1992; Schlesinger and Andrews 2000). Due to the enormous amount of soil carbon around the globe,
even a small change in respiration rates can have a large effect on the emission of carbon to the atmosphere (Etheridge et al. 1996; Schlesinger and Andrews 2000). This effect could become increasingly important as climate change drives higher temperatures, particularly in the northern high latitudes where the surface temperature is rising at a significantly higher rate than the global average (Hartmann et al. 2013).
CHAPTER 05 LIMITS TO LAND CARBON STORAGE
5.3. Problems of Scale Land carbon mitigation methods could save (through avoided emissions and emissions reductions) up to 38 billion tonnes of carbon globally by 2050 if undertaken with sustainable and integrated land management practices (Canadell and Schulze 2014).
By comparison, global carbon emissions from fossil fuel combustion are currently around 10 billion tonnes per year (Le QuĂŠrĂŠ et al. 2013). If this rate is continued, total fossil fuel emissions from 2015 to 2050 will be about 360 billion tonnes, nearly 10 times larger than the maximum estimated biological carbon sequestration of 38 billion tonnes over the same period.
Figure 29: The scale of CO2 uptake on the land which would be required to match the CO2 emissions from fossil fuel combustion (e.g., from the burning of coal for electricity) present enormous practical challenges. Even under the most optimistic assumptions, annual sequestration of carbon into land systems by deliberate land management practices can only amount to about 10% of current annual fossil fuel emissions. Thus, there is no substitute for rapid, deep reductions in the emissions from fossil fuel combustion.
39
40
LAND CARBON: NO SUBSTITUTE FOR ACTION ON FOSSIL FUELS
Land systems have a role to play in tackling climate change, but it is relatively small compared to fossil fuels. Furthermore, the projected maximum rate of land carbon uptake from deliberate human mitigation activities of about 1 billion tonnes per year (Canadell and Schulze 2014) is considerably less than the 3 billion tonnes per year on average (2000-2008) that land systems have taken up by non-human processes in response to rising atmospheric CO2 levels and changing climate, the socalled terrestrial carbon sink (green wedge of Figure 9 and accompanying discussion). Although models suggest that this nonhuman sink will continue to grow for a least a few more decades, its relative size compared to the amount of human emissions is likely to decrease (Friedlingstein et al. 2006). Indeed, observations over the last 50 years already show a relative weakening of these sinks (Raupach et al 2013).
In summary, carbon stored in land systems has a role to play in climate mitigation and should be encouraged, but it is a relatively small player in a much bigger game. Fossil fuel combustion is driving rapid and significant changes to the atmospheric concentration of CO2 and to climate, and current annual carbon emissions from fossil fuels are ten times greater than the annual maximum amount of carbon that could be deliberately sequestered in land systems through sustainable land management practices.
The amount of carbon emitted each year from burning coal, oil and gas, is 10 times what can be stored by sustainable land carbon mitigation approaches.
CHAPTER 06 IMPLICATIONS FOR CLIMATE POLICY
6. Implications for Climate Policy Effective climate change policy is important to rapidly and deeply reduce greenhouse gas emissions, stabilise the level of greenhouse gases in the atmosphere and, ultimately, halt changes in the Earth’s climate.
First and foremost, it is imperative that policies ensure a substantial reduction in greenhouse gas emissions from the combustion of fossil fuels. In particular, to have any chance of meeting the Paris targets, the global energy system must be fully decarbonized by mid-century at the latest, and earlier in developed countries like Australia. In addition, there is scope for climate change policy that supports the increase of land carbon stocks.
41
42
LAND CARBON: NO SUBSTITUTE FOR ACTION ON FOSSIL FUELS
6.1. Land Carbon “Offsets” Current climate change policies and practices in Australia allow for the use of land carbon “offsets” – that is, carbon that is taken up by land systems can be used to offset or subtract from fossil fuel emissions. There are two primary ways in which an offset concept is being used: (i) in the reporting of emissions and (ii) within mitigation strategy. ›› Offsets in reporting: A country’s overall greenhouse gas emission reductions are calculated as emissions from all sectors (primarily from fossil fuels) minus the deliberate human-induced uptake of carbon in the land sector. The reporting of this total emissions number can mask the actual trends of fossil fuel emissions. Fossil fuel emissions may, for example, be increasing substantially year-by-year but growth of non-permanent land carbon stocks through mitigation actions means that the reporting of total emissions hides the increase in fossil fuel emissions. This problem is easily overcome by reporting land carbon emissions and uptake separately from fossil fuel emissions.
›› Offsets in mitigation action: The use of emissions trading schemes, or ‘polluter pays’ mitigation strategies, often requires major greenhouse gas emitters to reduce their emissions or, alternatively, to purchase ‘offsets’ equivalent to the required reduction. The inclusion of land carbon-based credits implies that sequestration of carbon in land carbon stocks is equivalent to reducing fossil fuel emissions, a fundamentally flawed assumption as described earlier. The option to continue to emit greenhouse gases and pay for land carbon is not a sustainable, long-term, solution to climate change, and can indeed be counterproductive in some circumstances (see Box 4).
CHAPTER 06 IMPLICATIONS FOR CLIMATE POLICY
Land carbon cannot be used to offset fossil fuel emissions. The more appropriate policy approach is simple: land carbon cannot be used to offset fossil fuel emissions. However, it can play an important role in offsetting emissions from land clearing and land management
practices. It’s better, conceptually, to view land storage as returning atmospheric carbon back to the land from earlier emissions from land, as noted earlier.
Figure 30: Climate change policies that increase carbon uptake in vegetation must sit alongside, not replace, policies that substantially and urgently reduce greenhouse gas emissions from fossil fuels.
43
44
LAND CARBON: NO SUBSTITUTE FOR ACTION ON FOSSIL FUELS
BOX 9: AUSTRALIA’S EMISSIONS REDUCTION FUND The Emissions Reduction Fund (ERF) is a federal government scheme that provides financial incentives for organisations or individuals to adopt new practices or technologies that reduce or sequester greenhouse gas emissions. Participants looking to undertake an eligible activity can bid for the financial incentives through an auction process. The government asserts that it encourages and accepts the bids that achieve the greatest emissions reductions for the lowest cost.
Currently, vegetation (land system) projects are accepted under the ERF. As of 5 May 2016, 348 projects were contracted nationwide, of which 185 were vegetation projects; the majority of these are in Queensland and NSW (CER 2016).
Table 1: Cumulative number of Emissions Reduction Fund projects categorised as vegetation projects, and the total number of projects, registered in different regions of Australia as of 31 March 2016. Based on CER 2016. Number of contracted vegetation projects*
Contracted abatement via vegetation projects
Total number of contracted projects
Contracted abatement+
NSW
120
No Data
164
No Data
VIC
3
20
QLD
54
112
SA
1
5
WA
5
16
TAS
1
5
ACT
1
0
NT
0
13
Multi-state
0
8
National
0
5
TOTAL
185
98.5 MtC
348
143 Mt CO2 -e
Notes: + data from auction results (http://www.cleanenergyregulator.gov.au/ERF/Auctions-results/april-2016) *Data from EDF project map (10 August 2016) (http://www.cleanenergyregulator.gov.au/maps/Pages/erf-projects/ index.html)
CHAPTER 06 IMPLICATIONS FOR CLIMATE POLICY
6.2. Policy Provisions Challenges to developing robust land carbon policy are numerous. Where offsets from land carbon projects are to be incorporated into mitigation schemes, as discussed in Section 6.1, these challenges need to be addressed.
Various strategies have been trialled to deal with these challenges (Galik and Jackson 2009; Thamo and Pannell 2015).
Figure 31: To deliver a net benefit to the atmosphere, carbon sequestration projects such as planting trees must be additional to what would have occurred in the absence of the project.
45
46
LAND CARBON: NO SUBSTITUTE FOR ACTION ON FOSSIL FUELS
A major consideration in land carbon policies is to determine that sequestration or emissions reductions are additional, permanent, and not resulting in emissions leakage (Macintosh 2012; Thamo and Pannell 2015). ›› Additional: In order for a change in emissions or sequestration to be attributed to the success of a particular policy, it needs to be additional to what would have otherwise occurred (DCCEE 2010b; Woodhams et al. 2012; Thamo and Pannell 2015). It must go beyond business-asusual. For example, if a particular forest was never going to be cut down, then avoided deforestation due to a new policy in that forest is not additional. Proving that a particular action is additional, and beyond the scope of common practice within a given community at a given time, can be extremely challenging (Downie 2007; Thamo and Pannell 2015). ›› Permanent: As outlined earlier in this report, land carbon stocks can be emitted back into the atmosphere and cannot be considered as a means of truly permanent carbon storage. Policy mechanisms need to account for this, particularly when proposing land carbon as an ‘offset’ generating mechanism. A number of mechanisms have been adopted to address the permanence challenge. For example, some policies have adopted a superficial ‘permanence’ time period. In Australia, for instance, the sequestration of carbon for 100 years in land carbon projects is considered permanent (DCCEE 2010b; Murray and Kasibhatia 2013). However, the time periods chosen are often tied to practical limitations rather than scientific rationale, and essentially serve to delay emissions and ‘buy time’ for the development of alternative solutions (Thamo and Pannell 2015). Buffer requirements are also implemented to
address non-permanence risk. Projects are credited for less than the total amount of carbon that they’re actually expected to sequester, and the additional buffer credits are set aside (often pooled, between projects) as insurance for carbon reversal events (Murray and Kasibhatia 2013). The issuance of (cheaper) temporary credits, which require replacement after a certain period of time, has been used in some policy mechanisms (IPCC 2001). The issuance of ton-year credits has also been used, which involves issuing a fraction of the total anticipated sequestration credits each year, rather than, for example, issuing 100 years’ worth of sequestration credits in the first year and none thereafter (Marland et al. 2001; Murray and Kasibhatia 2013). This approach essentially credits the delaying of carbon release to the atmosphere regardless of the long-term fate of the carbon (Marland et al. 2001). All of these mechanisms avoid the scientific definition of permanence, which requires that sequestered carbon be stored safely away from the atmosphere for thousands of years, comparable to the lifetime of significant amounts of CO2 in the atmosphere (Solomon et al. 2009). By contrast, the permanence issue is dealt with in a scientifically credible way, in principle, in the IPCC’s lowest emission Representative Concentration Pathway (RCP2.6), in which “Negative Emission Technologies” are invoked (Ciais et al. 2013). These technologies include, for example, the burning of biomass to produce electricity, the capture of CO2 from the smokestack, and the storage of the captured CO2 in secure, underground geological formations (eg., Smith et al. 2016). This approach effectively locks away the carbon from return to the atmosphere, equivalent to leaving fossil fuels in the ground. Such
CHAPTER 06 IMPLICATIONS FOR CLIMATE POLICY
Negative Emission Technologies involving land carbon may remain important even after the global energy system is fully decarbonized to continue to remove CO2 from the atmosphere. In fact, to meet the Paris 1.5°C aspirational target (and probably to meet the 2°C target), it is virtually certain that the carbon budget will be exceeded, requiring the use of Negative Emission Technologies on an ongoing basis through the second half of the century, as per the IPCC RCP2.6 pathway. However, no proposed Negative Emission Technology has yet been proven to be feasible technologically at large scale and at reasonable cost, so that this approach remains an in-principle approach only. For effective climate action, the emphasis must remain on the reduction of emissions from fossil fuel combustion.
›› Not resulting in emissions leakage: Land carbon policy must cause a reduction in total atmospheric carbon, rather than just displacing the emissions to another place, time or sector. Where leakage occurs, the system will fail to provide a true assessment of changes (IPCC 2000). This is particularly difficult to determine, and likewise particularly important, when leakage transcends national borders and in the absence of comprehensive global carbon reporting coverage (IPCC 2001).
Figure 32: Australian Eucalyptus forests store large volumes of carbon, but are vulnerable to bushfires and other disturbances which return some of this carbon to the atmosphere.
47
48
LAND CARBON: NO SUBSTITUTE FOR ACTION ON FOSSIL FUELS
Applying carbon science considerations to the approaches to land sequestration described in Section 4 and their limitations summarised in Section 5 leads to a few further simple rules-of-thumb: ›› Using land carbon for bioenergy systems (eg., biofuels) that displace fossil fuel usage is a sound approach if the bioenergy system is designed and implemented sustainably; that is, if the operation of the system does not itself emit significant amounts of greenhouse gases through land clearing, use of fertilisers or poor forest management. Furthermore, it should not displace and/or compete with other important land uses including food production and conservation. ›› Application of full carbon accounting through time suggests that protecting existing native forests and woody vegetation (e.g., in savannas) as well as conserving secondary regrowth of native forests and savannas is better than a carbon farming “plant and leave” approach (e.g., “balancing” clearing of native forest in one area by replanting trees in another area). ›› Types of carbon storage that are intrinsically more resistant to the return of carbon to the atmosphere, such as biochar or storage of blue carbon in deep coastal sediments, yield more reliable, long-term climate benefits.
The difficulty in developing and implementing policy provisions that properly address these challenges supports the exclusion of land-based offsets for fossil fuel emissions (Downie 2007). To date, there has been limited inclusion of land carbon-based offsets into international carbon markets due to concerns around the practicality of these credits, and subsequent reluctance of buyers (CMW 2015).
CHAPTER 07 THE BOTTOM LINE
7. The Bottom Line Effective climate change policy must focus on rapid and deep reductions in fossil fuel usage. The emissions from burning fossil fuels are by far the most dominant driver of the rapid increase in CO2 in the atmosphere, now over 400 parts per million.
This human-driven CO2 increase is warming the climate, in turn leading to more frequent and severe heatwaves, escalating the threat of bushfires, increasing both intense rainfall and drought, and driving higher sea levels. Storing carbon on land is also a useful action to combat climate change but it is fundamentally different from, and much less important than, reducing fossil fuel emissions. Land carbon is part of the active carbon cycle at the Earth’s surface, in which carbon is continually exchanging between
Figure 33: Wind farm near Millicent, South Australia. For effective action on climate change, we must transition to renewable energy, and away from fossil fuels, to reduce greenhouse gas emissions. In addition, land carbon policies can play a role but the deep reduction and eventual elimination of fossil fuel emissions must be the central policy aim.
49
50
LAND CARBON: NO SUBSTITUTE FOR ACTION ON FOSSIL FUELS
the land, ocean and atmosphere. In contrast, carbon in fossil fuels has been locked away from the active carbon cycle for millions of years. Carbon stored on land is vulnerable to being returned to the atmosphere. Natural disturbances such as bushfires, droughts, insect attacks and heatwaves, many of which are being made worse by climate change, can trigger the release of significant amounts of land carbon back to the atmosphere. Changes in land management policies, for example, the relaxation of land clearing laws, can also affect the capability of land systems to store carbon. Thus, storing carbon on land is not a permanent way of removing carbon from the atmosphere. In contrast, carbon in fossil fuels left in the ground undisturbed cannot be returned to the atmosphere. The challenge to climate policy is to respect this fundamental difference between fossil and land carbon by building a firewall between policies to reduce fossil fuel emissions and policies to increase
carbon uptake on land. This means that there should be no offsetting of fossil fuel emissions by increasing land carbon, and that there should be separate reporting of fossil fuel emissions and of land carbon uptake and loss. Storing carbon in land can become counterproductive if policy settings allow it to delay or replace fossil fuel emission reductions. In summary, while storing carbon on land can be useful, it must be ADDITIONAL TO, and not instead of, effective action on fossil fuel emission reductions. The bottom line is clear. The Earth’s natural capacity to take up excess CO2 from the atmosphere is being outstripped by the rate at which the burning of fossil fuels is adding CO2 to the atmosphere. Current annual CO2 emissions from fossil fuel combustion are 10 times greater than the amount of carbon that can be stored in land each year by sustainable mitigation methods. Tackling climate change effectively can only be done by reducing fossil fuel emissions.
Tackling climate change effectively can only be done by reducing fossil fuel emissions.
GLOSSARY
Glossary Afforestation:
The planting of forests on land that has, historically, not contained forest (usually based on a period of at least 50 years) (IPCC 2000; UNFCCC 2013).
Deforestation:
The long-term removal of forest cover and conversion of land to a nonforest land use (IPCC 2000).
Reforestation:
Replanting or regeneration of forests which have previously been damaged or destroyed.
Fluxes:
The transfer of carbon between the land, ocean and atmosphere stocks. These transfers of carbon are usually measured in millions or billions of tonnes per year.
Forest:
For the purposes of carbon reporting and accounting in Australia, forest land is defined as all land of at least 0.2 hectares with a tree height of at least 2 metres and crown canopy cover of 20% or more.
Legacy Carbon: Carbon in the atmosphere that has originated from land-use change in the past. Sequestration:
The process of removing carbon from the atmosphere and increasing the carbon content of an alternative reservoir (UNFCCC 2014).
Sink:
When the flux of carbon is in the direction from the atmosphere to either the land or the ocean, it is often called a “sink” of carbon and is measured in billion of tonnes per year.
Source:
When the flux is in the direction from the land, ocean or fossil deposits (combustion of coal, oil, gas) up to the atmosphere, it is often called a “source” of carbon and is measured in billions of tonnes per year.
Stores or stocks: Carbon is stored in the atmosphere, the land, the ocean and in fossil deposits. These are often called “stores” or “stocks” of carbon and are usually measured in billions of tonnes of carbon.
51
52
LAND CARBON: NO SUBSTITUTE FOR ACTION ON FOSSIL FUELS
Appendix 1: How does the Federal Government Calculate Changes in Land Carbon? In a nutshell: Satellite images from the Landsat remote sensing satellite are processed each year to monitor Australiawide land cover change at a resolution of 25 metres. Images that are most suitable for distinguishing different land uses are selected (e.g. without clouds, with appropriate lighting), and these are spatially aligned and spectrally calibrated with those from previous years so that they are comparable and changes from one year to the next can be identified. Each image is classified as a land-use type (eg., forest, cropland) using image analysis software and based on internationally agreed categories and definitions. The accuracy of this classification is checked back against detailed aerial photographs and ground data (DCCEE 2010c).
Changes in land cover from one year to the next are identified, and maps are produced showing land use types and changes compared to the previous year. The records of land use types and changes are input into a carbon accounting model (FullCAM) that estimates the carbon stored in above- and below ground vegetation and soil, and the emissions resulting from land management and changes in land use (DCCEE 2010c). Challenges remain. For example, accounting for losses and gains in sparse woody vegetation, which doesn’t meet the definition of a forest, has presented challenges to the existing methodology. This, as well as definitional differences, is understood to be one of the primary reasons for differences between the federal government records and others (Macintosh 2007). Mechanisms for better accounting for this vegetation type are currently being explored (Department of Environment 2016a).
REFERENCES
References Bellassen V, Viovy N, Luyssaert S, Le Maire G, Schelhaas M and Ciais P (2011) Reconstruction and attribution of the carbon sink of European forests between 1950 and 2000. Global Change Biology. 17: 3274–3292.
Climate Council (2015a) The Burning Issue: Climate Change and the Australian Bushfire Threat. Hughes L and Fenwick J. Accessed at: https://www.climatecouncil.org.au/ burningissuereport2015.
Bradshaw C (2012) Little left to lose: deforestation and forest degradation in Australia since European colonization. Journal of Plant Ecology. 5: 109–120.
Climate Council (2015b) Climate Change 2015: Growing Risks, Critical Choices. Steffen W, Hughes L and Pearce A. Accessed at https://www.climatecouncil.org.au/climatechange-2015-growing-risks-critical-choices.
Bradstock R, Penman T, Boer M, Price O and Clarke H (2014) Divergent responses of fire to recent warming and drying across south-eastern Australia, Global Change Biology. 20: 1412–1428. Bryan B, Nolan M, McKellar L, Connor J, Newth D, Harwood T, King D, Navarro J, Cai Y, Gao L, Grundy M, Graham P, Ernst A, Dunstall S, Stock F, Brinsmead T, Harman I, Grigg N, Battaglia M, Keating B, Wonhas A and Hatfield-Dodds S (2016) Land-use and sustainability under intersecting global change and domestic policy scenarios: Trajectories for Australia to 2050. Global Environmental Change, 38: 130-152. Ciais, P., C. Sabine, G. Bala, L. Bopp, V. Brovkin, J. Canadell, A. Chhabra, R. DeFries, J. Galloway, M. Heimann, C. Jones, C. Le Quéré, R.B. Myneni, S. Piao and P. Thornton (2013) Carbon and Other Biogeochemical Cycles. In: Climate Change 2013: The Physical Science Basis. Contribution of Working Group I to the Fifth Assessment Report of the Intergovernmental Panel on Climate Change [Stocker, T.F., D. Qin, G.-K. Plattner, M. Tignor, S.K. Allen, J. Boschung, A. Nauels, Y. Xia, V. Bex and P.M. Midgley (eds.)]. Cambridge University Press, Cambridge, United Kingdom and New York, NY, USA. Canadell J, Le Quéré C, Raupach M, Field C, Buitenhuis E, Ciais P, Conway T, Gillett N, Houghton R and Marland G (2007) Contributions to accelerating atmospheric CO2 growth from economic activity, carbon intensity, and efficiency of natural sinks. Proceedings of the National Academy of Science. 104: 18866–18870. Canadell J and Schulze D (2014) Global potential of biospheric carbon management for climate mitigation. Nature: Communications. 5: 5282. Cary GJ, Bradstock RA, Gill AM, Williams RJ (2012) Global change and fire regimes in Australia pp149-170 in Flammable Australia: Fire regimes, biodiversity and ecosystems in a changing world. (Eds Bradstock RA, Gill AM, Williams RJ). CSIRO Publishing, Collingwood, VIC. CER (Clean Energy Regulator) (2016) Combined results for auctions 1, 2 and 3: Emissions Reduction Fund, released 5 May 2016. Accessed at http://www.cleanenergyregulator. gov.au/ERF/Auctions-results/april-2016. Clarke H, Smith P and Pitman A (2011) Regional signatures of future fire weather over eastern Australia from global climate models. International Journal of Wildland Fire. 20: 550-562.
CMW (Carbon Market Watch) (2015) Policy Brief: Fossil and biological carbon: a tonne is not a tonne. Accessed at: http://carbonmarketwatch.org/policy-brief-fossil-andbiological-carbon-a-tonne-is-not-a-tonne/. CO2 Australia (2016) Tree clearing in Australia: It’s contribution to Climate Change. Accessed at: https://www. wilderness.org.au/sites/default/files/PDFS/CO2%20Lead%20 Report.pdf. Crutzen P, Mosier A, Smith K and Winiwarter W (2008) N2O release from agro-biofuel production negates global warming reduction by replacing fossil fuels. Atmospheric Chemistry and Physics. 8: 389-395. CSIRO (Commonwealth Scientific and Industrial Research Organisation) (2009) An Analysis of Greenhouse Gas Mitigation and Carbon Sequestration Opportunities from Rural Land Use. Eady S, Grundy M, Battaglia M and Keating B (eds.). CSIRO. St Lucia. Queensland. DCCEE (Department of Climate Change and Energy Efficiency) (2010a) Drivers of land clearing in Australia. Accessed at http://www.environment.gov.au/system/files/ pages/63b569ff-ae63-4d7b-be54-16f2e79900e0/files/ngafactsheet3.pdf. DCCEE (2010b) Design of the carbon farming initiative (Consultation paper). Accessed at: http://www. cabinet.qld.gov.au/documents/2011/jan/carbon%20 farming%20initiative/Attachments/Commonwealth%20 consultation%20paper.pdf. DCCEE (2010c) The land sector in the national inventory – overview. Accessed at: http://www.environment. gov.au/system/files/pages/63b569ff-ae63-4d7b-be5416f2e79900e0/files/nga-factsheet2.pdf Department of the Environment (2016a) Quarterly Update of Australia’s National Greenhouse Gas Inventory: May 2016. Accessed at http://www.environment.gov.au/system/ files/resources/7c0b18b4-f230-444a-8ccd-162c8545daa6/ files/nggi-quarterly-update-dec-2015.pdf. Department of the Environment and Energy (2016b), National Inventory Report 2014 (revised), Volume 2, Commonwealth of Australia 2016. Donato D, Kauffman J, Murdiyarso D, Kurnianto S, Stidham M, Kanninen M (2011) Mangroves among the most carbonrich forests in the tropics. Nature Geoscience. 4: 293-297. Downie C (2007) Carbon Offsets: Saviour or cop-out?. The Australia Institute. Research paper 48.
53
54
LAND CARBON: NO SUBSTITUTE FOR ACTION ON FOSSIL FUELS
Ennis C, Evans A, Islam M, Ralebitso-Senior T and Senior E (2012) Biochar: Carbon Sequestration, Land Remediation, and Impacts on Soil Microbiology. Critical Reviews in Environmental Science and Technology. 42 2311-2364.
Homer-Dixon T, Walker B, Biggs R, Crépin A, Folke C, Lambin E, Peterson G, Rockström J, Scheffer M, Steffen W and Troell M (2015) Synchronous failure: the emerging causal architecture of global crisis. Ecology and Society. 20.
Etheridge D, Steele L, Langenfelds R, Francey R, Barnola J and Morgan V (1996) Natural and anthropogenic changes in atmospheric CO2 over the last 1000 years from air in Antarctic ice and firn. Journal of Geophysical Research. 101: 4115–4128.
Houghton R, Hackler J and Lawrence K (1999) The U.S. carbon budget: contributions from land-use change. Science. 285: 574–578.
Fargione J, Hill J, Tilman D, Polasky S and Hawthorne P (2008) Land clearing and the biofuel carbon debt. Science 319: 1235–1238. Field C, Campbell J and Lobell D (2008) Biomass energy: the scale of the potential resource. Trends in Ecology and Evolution. 23: 65–72. Fourqurean J, Duarte C, Kennedy H, Marba N, Holmer M, Mateo M, Apostolaki E, Kendrick G, Krause-Jensen D, McGlathery K and Serrano O (2012) Seagrass ecosystems as a globally significant carbon stock. Nature Geoscience. 5: 505–509. Friedlingstein P, Cox P, Betts R, Bopp L, von Bloh W, Brovkin V, Cadule P, Doney S, Eby M, Fung I, Bala G, John J, Jones C, Joos F, Kato T, Kawamiya M, Knorr W, Lindsay K, Matthews H, Raddatz T, Rayner P, Reick C, Roeckner E, Schnitzler K, Schnur R, Strassmann K, Weaver A, Yoshikawa C and Zeng N (2006) Climate-carbon cycle feedback analysis: Results from the C4MIP model intercomparison. Journal of Climate. 19: 3337–3353. Galik C and Jackson R (2009) Risks to forest carbon offset projects in a changing climate. Forest Ecology and Management. 257: 2209–2216. Garnaut R (2008) The Garnaut Climate Change Review. Cambridge University Press. Cambridge. UK. Hartmann, D.L., A.M.G. Klein Tank, M. Rusticucci, L.V. Alexander, S. Brönnimann, Y. Charabi, F.J. Dentener, E.J. Dlugokencky, D.R. Easterling, A. Kaplan, B.J. Soden, P.W. Thorne, M. Wild and P.M. Zhai (2013) Observations: Atmosphere and Surface. In: Climate Change 2013: The Physical Science Basis. Contribution of Working Group I to the Fifth Assessment Report of the Intergovernmental Panel on Climate Change [Stocker, T.F., D. Qin, G.-K. Plattner, M. Tignor, S.K. Allen, J. Boschung, A. Nauels, Y. Xia, V. Bex and P.M. Midgley (eds.)]. Cambridge University Press, Cambridge, United Kingdom and New York, NY, USA.
IPCC (Intergovernmental Panel on Climate Change) (2000) Land Use, Land-Use Change, and Forestry. Watson R, Noble I, Bolin B, Ravindranath N, Verardo D and Dokken D (Eds). Cambridge Univeristy Press, UK. IPCC (2001) Climate Change: Mitigation. Contribution of Working Group III to the Third Assessment Report of the IPCC. Metz B, Davidson O, Swart R and Pan J (Eds.). Cambridge University Press, Cambridge, UK. IPCC (2006) Guidelines for National Greenhouse Gas Inventories. Volume 4: Agriculture, Forestry and Other Land Use. IPCC (2007) Climate Change 2007: The Physical Science Basis. Contribution of Working Group I to the Fourth Assessment Report of the IPCC. Solomon S, Qin D, Manning M, Chen Z, Marquis M, Averyt K, Tignor M and Miller H. (eds.). Cambridge University Press, Cambridge, United Kingdom and New York, NY, USA. IPCC (2014) Smith P, Bustamante M, Ahammad H, Clark H, Dong H, Elsiddig E, Haberl H, Harper R, House J, Jafari M, Masera O, Mbow C, Ravindranath N, Rice C, Robledo Abad C, Romanovskaya A, Sperling F and Tubiello F. 2014. Agriculture, Forestry and Other Land Use (AFOLU). In: Climate Change 2014: Mitigation of Climate Change. Contribution of Working Group III to the Fifth Assessment Report of the IPCC. Edenhofer O, Pichs-Madruga R, Sokona Y, Farahani E, Kadner S, Seyboth K, Adler A, Baum I, Brunner S, Eickemeier P, Kriemann B, Savolainen J, Schlömer S, von Stechow C, Zwickel T and Minx J (eds.). Cambridge University Press, Cambridge, United Kingdom and New York, NY, USA. Jackson, RB, Canadell JG, Le Quere C, Andrew RM, Korsbakken JI, Peters GP and Nakicenovic N (2016) Reaching peak emissions. Nature Climate Change 6(1): 7-10. JCU (James Cook University) (2016) Large-scale mangrove dieback “unprecedented”. Accessed at: https://research.jcu. edu.au/tropwater/news-and-events/large-scale-mangrovedieback-unprecedented.
Haverd V, Raupach M, Briggs P, Canadell J, Davis S, Law R, Meyer C, Peters G, Pickett-Heaps C and Sherman B (2013) The Australian terrestrial carbon budget. Biogeosciences. 10: 851–869.
Jolly M, Cochrane M, Freeborn P, Holden Z, Brown T, Williamson G and Bowman D (2015) Climate-induced variations in global wildfire danger from 1979 to 2013, Nature Communications. 6: 7537.
Haywood A, Ridgwell A, Lunt D, Hill D, Pound M, Dowsett H, Dolan A, Francis J and Williams M (2011) Are there preQuaternary geological analogues for a future greenhouse gas-induced global warming?. Philosophical Transactions of the Royal Society of London. 369: 933-956.
Keith H, Mackey B and Lindenmayer D (2009) Reevaluation of forest biomass carbon stocks and lessons from the world’s most carbon-dense forests. Proceedings of the National Academy of Science. 106: 11635–11640.
Heimann M and Reichstein M (2008) Terrestrial ecosystem carbon dynamics and climate feedbacks. Nature. 451.
Lam S, Chen D, Mosier A and Roush R (2013) The potential for carbon sequestration in Australian agricultural soils is technically and economically limited. Scientific Reports. 3.
REFERENCES
Lambin E, Turner B, Geist H, Agbola S, Angelsen A, Bruce J, Coomes O, Dirzo R, Fischer G, Folke C, George P, Homewood K, Imbernon J, Leemans R, Li X, Moran E, Mortimore M, Ramakrishnan P, Richards J, Skånes H, Steffen W, Stone G, Svedin U, Veldkamp T, Vogel C and Xu J (2001) The causes of land-use and land-cover change: moving beyond the myths. Global Environmental Change. 11: 261-269. Lawrence A (2012) Blue Carbon: A new concept for reducing the impacts of climate change by conserving coastal ecosystems in the Coral Triangle. World Wildlife Fund – Australia. Accessed at: http://bluecarbonportal.org/ wp-content/uploads/downloads/2012/09/Lawrence_WWF_ Blue-Carbon_2012.pdf. Le Quéré C, Peters P, Andres R, Andrew R, Boden T, Ciais P, Friedlingstein P, Houghton R, Marland G, Moriarty R, Sitch S, Tans P, Arneth A, Arvanitis A, Bakker D, Bopp L, Canadell J, Chini L, Doney S, Harper A, Harris I, House J, Jain A, Jones S, Kato E, Keeling R, Klein Goldewijk K, Körtzinger A, Koven C, Lefèvre N, Omar A, Ono T, Park G, Pfeil B, Poulter B, Raupach M, Regnier P, Rödenbeck C, Saito S, Schwinger J, Segschneider J, Stocker B, Tilbrook B, van Heuven S, Viovy N, Wanninkhof R, Wiltshire A, Zaehle S and Yue C (2014) Global Carbon Budget 2013. Earth System Science Data, 6: 235–263. Le Quéré C, Moriarty R, Andrew R, Canadell J, Sitch S, Korsbakken J, Friedlingstein P, Peters G, Andres R, Boden T, Houghton R, House J, Keeling R, Tans P, Arneth A, Bakker D, Barbero L, Bopp L, Chang J, Chevallier F, Chini L, Ciais P, Fader M, Feely R, Gkritzalis T, Harris I, Hauck J, Ilyina T, Jain A, Kato E, Kitidis V, Klein Goldewijk K, Koven C, Landschützer P, Lauvset S, Lefèvre N, Lenton A, Lima I, Metzl N, Millero F, Munro D, Murata A, Nabel J, Nakaoka S, Nojiri Y, O'Brien K, Olsen A, Ono T, Pérez F, Pfeil B, Pierrot D, Poulter B, Rehder G, Rödenbeck C, Saito S, Schuster U, Schwinger J, Séférian R, Steinhoff T, Stocker B, Sutton A, Takahashi T, Tilbrook B, van der Laan-Luijkx I, van der Werf G, van Heuven S, Vandemark D, Viovy N, Wiltshire A, Zaehle S and Zeng N (2015) Global Carbon Budget 2015. Earth System Science Data, 7: 349-396. Luo Z, Wang E and Sun O (2010) Soil carbon change and its responses to agricultural practices in Australian agroecosystems: A review and synthesis. Geoderma. 155: 211223. Macintosh A (2007) The National Greenhouse Accounts and Land Clearing: How do the numbers stack up? The Australia Institute. Research Paper 38. Macintosh A (2010) Reducing Emissions from Deforestation and Forest Degradation in Developing Countries: A Cautionary Tale from Australia. The Australia Institute. Policy Brief 12. Macintosh A (2012) The Carbon Farming Initiative: removing the obstacles to its success. CCLP Working Paper Series 2012/3. Mackey B, Keith H, Berry S and Lindenmayer D (2008) Green Carbon: The Role of Natural Forests in Carbon Storage. Australian National Univerity. Canberra.
Mackey B, Prentice I, Steffen W, House J, Lindenmayer D, Keith H and Berry S (2013) Untangling the confusion around land carbon science and climate change mitigation policy. Nature Climate Change. 3: 552–557 Marland G, Fruit K and Sedjo R (2001) Accounting for sequestered carbon: the question of permanence. Environmental Science and Policy. 4: 259-268. Maron M, Laurance B, Pressey B, Catterall CP, Watson J and Rhodes J (2015) Land clearing in Queensland triples after policy ping pong. The Conversation, 18 March. Accessed at https://theconversation.com/land-clearing-in-queenslandtriples-after-policy-ping-pong-38279. McLeod, E. et al. A (2011) Blueprint for blue carbon: Towards an improved understanding of the role of vegetated coastal habitats in sequestering CO2 . Frontiers in Ecology and the Environment, 9: 552–560. Miller K, Wright J, Browning J, Kulpecz A, Kominz M, Naish T, Cramer B, Rosenthal Y, Peltier W and Sosdian S (2012) High tide of the warm Pliocene: Implications of global sea level for Antarctic deglaciation. Geology. 40(5), 407-410. Morton D (2016) A Satellite Perspective. Nature Climate Change. 6: 346-348. Murray B and Kasibhatia P (2013) Equating Permanence of Emission Reductions and carbon Sequestration: Scientific and Economic Foundations for Policy Options. Duke Environmental and Energy Economics Working Paper Series. EE 13-08. Naish T and Zwart D (2012) Palaeoclimate: Looking back to the future. Nature Climate Change. 2: 317–318. NOAA (National Oceanic and Atmospheric Administration) (2016) Coastal Blue Carbon. Accessed at http://www.habitat. noaa.gov/coastalbluecarbon.html. Nous Group (2010) Outback carbon: an assessment of carbon storage, sequestration and greenhouse gas emissions in remote Australia. Report to The Pew Environment Group-Australia and The Nature Conservancy. Accessed at http://www.issuelab.org/ resource/outback_carbon_an_assessment_of_carbon_ storage_sequestration_and_greenhouse_gas_emissions_ in_remote_australia. NSW DPI (Department of Primary Industries) (2016) Biochar. Accessed at http://www.dpi.nsw.gov.au/research/ topics/biochar. Peltzer D, Allen R, Lovett G, Whitehead D and Warde D (2010) Effects of biological invasion on forest carbon sequestration. Global Change Biology. 16: 732-746. Pendleton L, Donato D, Murray B, Crooks S, Jenkins W, Sifleet S, Craft C, Fourqurean J, Kauffman J, Marbà N, Megonigal P, Pidgeon E, Herr D, Gordon D, and Baldera A (2012) Estimating Global “Blue Carbon” Emissions from Conversion and Degradation of Vegetated Coastal Ecosystems. PLoS one. 7.9: e43542.
55
56
LAND CARBON: NO SUBSTITUTE FOR ACTION ON FOSSIL FUELS
Petit J, Jouzel J, Raynaud D, Barkov N, Barnola J, Basile I, Bender M, Chappellaz J, Davisk M, Delaygue G, Delmotte M, Kotlyakov V, Legrand M, Lipenkov V, Lorius C, Pepin L, Ritz C, Saltzmank E and Stievenard M (1999) Climate and atmospheric history of the past 420,000 years from the Vostok ice core, Antarctica. Nature. 399: 429-436.
UNFCCC (2013) Afforestation and Reforestation Projects under the Clean Development Mechanism: A Reference Manual. Viewed on 5 April 2016, accessed at http://unfccc. int/resource/docs/publications/cdm_afforestation_bro_ web.pdf.
Pierrehumbert R (2011) Infrared radiation and planetary temperature. Physics Today. 64: 33-38.
UNFCCC (2014) Glossary of climate change acronyms. Viewed 5 April 2016, accessed at http://unfccc.int/essential_ background/glossary/items/3666.php#C.
Queensland Department of Science, Information Technology and Innovation (DSITI) (2016) Land cover change in Queensland 2014–15: a Statewide Landcover and Trees Study (SLATS) report. DSITI, Brisbane.
Wang S, Chen J, Ju W, Feng X, Chen M, Chen P, and Yu G (2007) Carbon sinks and sources in China's forests during 1901–2001. Journal of Environmental Management. 85: 524–537.
Raich J and Schlesinger W (1992) The global carbon dioxide flux in soil respiration and its relationship to vegetation and climate. Tellus. 44B: 81-99.
Wentworth Group (Wentworth Group of Concerned Scientists) (2009) Optimising Carbon in the Australian Landscape. Accessed at: http://wentworthgroup.org/ wp-content/uploads/2013/10/Optimising-Carbon-in-theAustralian-Landscape.pdf.
Raupach M, Gloor M, Sarmiento J, Canadell J, Frolicher T, Grasser T, Houghton R, Le Quéré C and Trudinger M (2013) The declining uptake of atmospheric CO2 by land and ocean sinks. Biogeosciences. 11: 3453-3475. Reichstein M, Bahn M, Ciais P, Frank D, Mahecha M, Seneviratne S, Zscheischler J, Beer C, Buchmann N, Frank D, Papale D, Rammig A, Smith P, Thonicke K, Van der Velde M,Vicca S, Walz A and Wattenbach M (2013) Climate extremes and the carbon cycle. Nature. 500: 287-295. Schlesinger W and Andrews J (2000) Soil respiration and the global carbon cycle. Biogeochemistry. 48: 7-20. Sitch S, Friedlingstein P, Gruber N, Jones SD, MurrayTortarolo G, Ahlström A et al. (2015) Recent trends and drivers of regional sources and sinks of carbon dioxide. Biogeosciences, 12(3), 653-679. doi:10.5194/bg-12-653-2015. Smith, P., Davis SJ, Creutzig, F, Fuss S, Rogelj J, McCollum D, Krey V, Grubler A et al. (2016) Biophysical and economic limits to negative CO2 emissions. Nature Climate Change, 6: 42-50. Solomon S, Plattner G. Knutti R. and Friedlingstein P (2009) Irreversible climate change due to carbon dioxide emissions. Proceedings of the National Academy of Sciences (USA) 106: 1704-1709. Thamo T and Pannell D (2015) Challenges in developing effective policy for soil carbon sequestration: perspectives on additionality, leakage and permanence. Climate Policy, pp. 1-20. The Climate Institute (2016) Research Brief: Global climate action – August update: Post-Paris momentum continues. August 2016. Accessed at http://www.climateinstitute.org. au/verve/_resources/TCI_Global_Update_August_2016.pdf. Thom D and Seidl R (2016) Natural disturbance impacts on ecosystem services and biodiversity in temperate and boreal forests. Biological Reviews. 91: 760–781, doi: 10.1111/ brv.12193. Transport and Energy (2016) Globiom: the basis for biofuel policy post-2020. UNFCCC (United Nations Framework Convention on Climate Change) (2001) LULUCF - Developments at past COP and SB sessions. Marrakesh Accords and COP 7. Accessed at http://unfccc.int/land_use_and_climate_ change/lulucf/items/3063.php.
Woodhams F, Southwell D, Bruce S, Barnes B, Appleton H, Rickards J, Walcott J, Hug B, Whittle L, Ahammad H and Ahammad F (2012) The Carbon Farming Initiative: A proposed common practice framework for assessing additionality (Technical Report 12.2). Canberra: ABARES. Woolf D, Amonette J, Street-Perrott F, Lehmann J, and Joseph S (2010) Sustainable biochar to mitigate global climate change. Nature Communications. 1: 56. World Bank (2010) Capturing and conserving natural coastal carbon: building mitigation, advancing adaptation. Washington DC: World Bank. Accessed at: http:// siteresources.worldbank.org/EXTCMM/Resources/coastal_ booklet_final_nospread11-23-10.pdf. Zhu Z, Piao S, Myneni R, Huang M, Zeng Z, Canadell J, Ciais P, Sitch S, Friedlingstein P, Arneth A, Cao C, Cheng L, Kato E, Koven C, Li Y, Lian X, Liu Y, Liu R, Mao J, Pan Y, Peng S, Peñuelas J, Poulter B, Pugh T, Stocker B, Viovy N, Wang X, Wang Y, Xiao Z, Yang H, Zaehle S and Zeng N (2016) Greening of the Earth and its drivers. Nature Climate Change. 6: 791–795, doi:10.1038/nclimate3004.
IMAGE CREDITS
Image Credits Cover Photo: “Gum tree against cloudy sky” by Flickr User Benjamin Bicakci licensed under CC BY-NC-ND 2.0
Page 43: Figure 30 " Seedlings" by Flickr User Greenfleet Australia licensed under CC BY-NC-ND 2.0
Page 6: Figure 5 “Blue Mountains” by Flickr User Alex Healing licensed under CC BY 2.0
Page 45: Figure 31 "Digging in the Garden" by Flickr User Susy Morris licensed under CC BY-NC 2.0
Page 10: Figure 7 “growing up” by Flickr User shuttergirl3 licensed under CC BY-NC-ND 2.0
Page 47: Figure 32 “Eucalyptus Forest - 362/365” by Flickr User Barney Moss licensed under CC BY-NC 2.0
Page 11: Figure 8 “Kooragang Island” by Flickr User david_a_l licensed under CC BY-NC 2.0
Page 49: Figure 33 “20130321_01c_Melrose” by Flickr User David Clarke licensed under CC BY-NC-ND 2.0 https:// www.flickr.com/photos/daveclarkecb/8597842581/in/ photolist-e6Lc4c
Page 14: Figure 10 “IMG_6994” by Flickr User Luca Penati licensed under CC BY-NC-ND 2.0 Page 16: Figure 11 “australia__193” by Flickr User Lcyril chermin licensed under CC BY 2.0 Page 17: Figure 12 “Burnt Scrub” by Flickr User Tan Cheng Joo licensed under CC BY-ND 2.0 Page 18: Figure 13 “Aerial shots taken just after sowing, July 2009” by Flickr User Greenfleet Australia licensed under (CC BY-NC-ND 2.0 Page 21: Figure 16 “Open cut coal mine – Hunter” by Flickr User Jeremy Buckingham licensed under CC BY-NC 2.0 Page 23: Figure 17 “Tree fern” by Flickr User CameliaTWU licensed under CC BY-NC-ND 2.0 Page 24: Figure 18 “After revegetation” by Flickr User Brisbane City Council licensed under CC BY 2.0 Page 25: Figure 19 “black is new black” by Flickr User Oregon Department of Forestry licensed under CC BY 2.0 Page 26: Figure 20 “Bioenergy sorghum” by Flickr User AgriLife Today licensed under CC BY-NC-ND 2.0 Page 27: Figure 21 “Mangroves -- Australia” by Flickr User rebeccah49 licensed under CC BY-NC 2.0 Page 29: Figure 22 “Farm View” by Flickr User Heather licensed under CC BY-NC 2.0 Page 32: Figure 23 “Burnt to a crisp” by Flickr User Mick Stanic licensed under CC BY-NC 2.0 Page 33: Figure 24 Copyright from Bill Laurance, Centre for Tropical Environmental and Sustainability Science. Page 38: Figure 28 Copyright from Bill Laurance, Centre for Tropical Environmental and Sustainability Science. Page 39: Figure 29 " latrobe valley - making clouds" by Flickr User Brian Yap licensed under CC BY-NC 2.0
57
Thank you for supporting the Climate Council. The Climate Council is an independent, crowd-funded organisation providing quality information on climate change to the Australian public.
CLIMATE COUNCIL facebook.com/climatecouncil twitter.com/climatecouncil info@climatecouncil.org.au climatecouncil.org.au
The Climate Council is a not-for-profit organisation and does not receive any money from the Federal Government. We rely upon donations from the public. We really appreciate your contributions.
DONATE
climatecouncil.org.au/donate