
Published by SET Publisher
Journal of Basic & Applied Sciences

ISSN (online): 1927-5129
Earth’s Temperature Versus the Sun, Water Vapor and CO2
H. Douglas Lightfoot *
The Lightfoot Institute, Canada
Article Info:
Keywords: Carbon dioxide, methane, nitrous oxide, specific humidity, Sun, water vapor.
Timeline:
Received: April 28, 2021
Accepted: May 18, 2021
Published: June 02, 2021
Citation: Lightfoot HD. Earth’s Temperature Versus the Sun, Water Vapor and CO 2 J Basic Appl Sci 2021; 17: 44-53.
DOI: https://doi.org/10.29169/1927-5129.2021.17.05
Abstract:
The IPCC report Climate Change 2013: The Physical Science Basis (AR5) has two opposing claims as causes for an increase in the Earth’s temperature in the decades leading up to 2011. In one claim, the cause is an increase in the level of CO2 in the atmosphere. In the second claim, it is an increase in water vapor measured as specific humidity. The purpose of this study is to determine which claim is correct. Several published studies are brought together to form a coherent picture of the interaction between the Sun, water vapor, and the non-condensing greenhouse gases (GHGs), such as carbon dioxide, methane, and nitrous oxide. Back radiation is the sum of radiation back to the Earth from all GHGs. Warming by water vapor measured as specific humidity is approximately 85.5% to 96.5% of the warming by back radiation. The Sun controls Earth’s temperature through specific humidity. The relationship between air temperature and specific humidity is presented in terms of numerical values. Thus, the portion of a temperature caused by specific humidity can be readily estimated.
*Corresponding Author
E-mail: dlightfo@aei.ca, contact@thelightfootinstitute.ca
© 2021 H. Douglas Lightfoot; Licensee SET Publisher. This is an open access article licensed under the terms of the Creative Commons Attribution Non-Commercial License (http://creativecommons.org/licenses/by-nc/3.0/) which permits unrestricted, non-commercial use, distribution and reproduction in any medium, provided the work is properly cited.
1. INTRODUCTION
The Intergovernmental Panel on Climate Change (IPCC) report Climate Change 2013: The Physical Science Basis (AR5) [1] indicates on pages 13 and 14 the several greenhouse gases (GHGs) claimed to be the drivers of climate. The data culminates in Figure SPM.5 where the total radiative forcing (RF) of all GHGs is given as 2.29 Watts per square meter (W m-2) (1.33 to 3.33 W m-2). The carbon dioxide (CO2) contribution is 1.68 W m-2 (1.33 to 2.03 W m-2). Page 17 implies the RF of 1.33 to 3.33 W m-2 caused the Earth’s temperature to increase by 0.6oC to 0.7oC over the period 1750 to 2011.
Page 38 of AR5 indicates that specific humidity is strongly correlated with the Earth’s temperature. Page 42 indicates the specific humidity increased by 3.5% over the period from the early 1970s to 2011 and increased the Earth ’s temperature by 0.5oC.
Both causes for the warming that occurred for several decades before 2011 cannot be correct. The purpose of this study is to determine which is correct; an increase in greenhouse gases and an increase in RF, or an increase in water vapor measured as specific humidity. This study is built on mostly empirical information from existing published papers, which when brought together generate new and unpublished information. It presents a coherent picture of how the non-condensing GHGs, such as CO2, methane, and nitrous oxide, interact with water vapor and the Sun to determine the temperature of the Earth
A total of 52 non-condensing greenhouse gases (GHGs) are identified in Table 2.14 of the IPCC report Climate Change 2007: The Physical Science Basis (AR4) [2]. Included are such gases as carbon dioxide (CO2), methane and nitrous oxide. These gases are always in the vapor phase under the conditions of temperature and pressure normally found on Earth and, therefore, act as “ideal gases”. Thus, they are subject to the Gas Laws of Boyle and Charles/GayLussac.
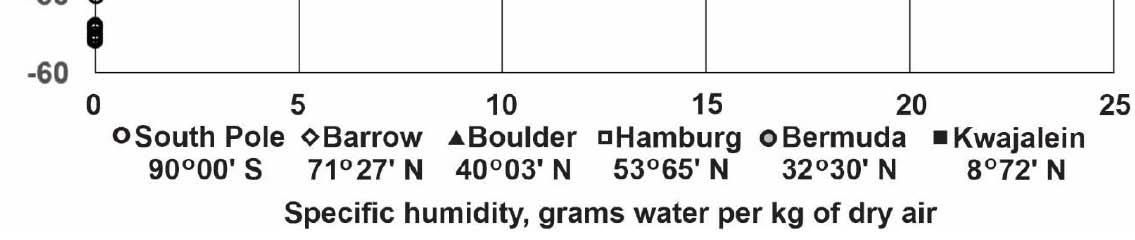
The part of the IPCC report about specific humidity and temperature is based on papers by K. Willett et al . The area of the Earth studied is quasi complete from 60oN to 40oS [3]. This study covers representative locations over the area from 72o 42’ N to 77o 50’ S, which covers more than 80% of the Earth’s surface. This study uses AccuWeather on a cellphone to record temperature and relative humidity (RH) in sets of twenty
representative locations on the Earth. These range from the Arctic and Antarctic to the Equator, at midlatitudes north and south and equally east and west longitude as in Table 1 [4]. AccuWeather has the potential to access over three and a half million weather station locations worldwide [5].
The temperature and RH are inserted into a Humidair [6] psychrometric program to calculate the specific humidity. The Humidair program includes a correction for elevation and gives the amount of water in the atmosphere as kilograms (kg) of water per kg of dry air. This value is then converted mathematically to specific humidity as grams of water per kg of dry air. An ASHRAE Chart No. 1 (SI) [7] does not correct for elevation and gives specific humidity for temperatures down to 0oC. The specific humidity using an ASHRAE chart will be in error an average of 1.1%, maximum of 6.2%, for the set of locations used in this study.
This study starts with a comparison of temperature with specific humidity then moves to a figure of back radiation versus specific humidity. Included in the figure for comparison is the warming by the non-condensing GHGs, such as CO2, methane, and nitrous oxide hereafter referred to as the "non-condensing” GHGs. From this point, the relationship between specific humid ity and the Earth’s temperature is developed.
2. THE INFLUENCE OF WATER VAPOR ON TEMPERATURE
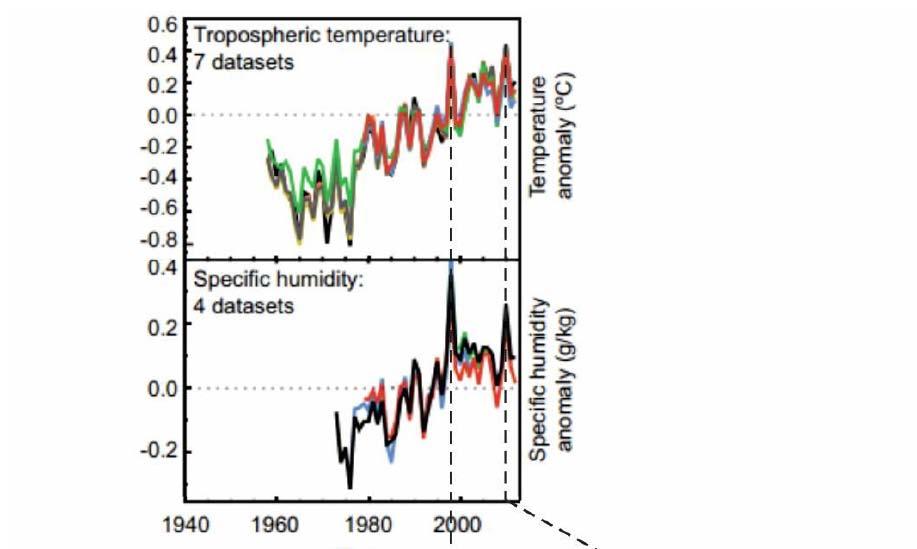
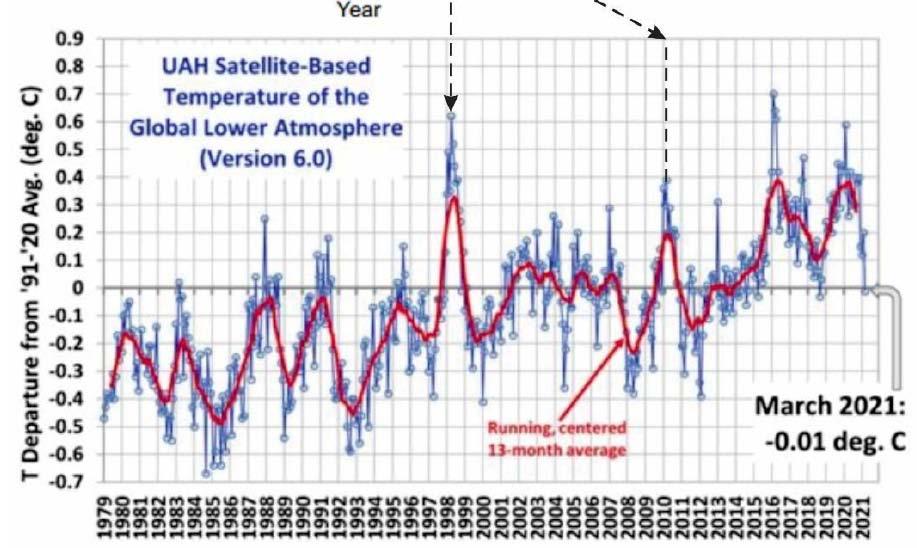
In the IPCC report AR5, are two graphs of interest on page 38 in Figure TS.1 that are included in Figure 1 of this study. The upper two subgraphs are the Earth’s temperature from seven data sets and specific humidity from four data sets. The lower subgraph is the University of Alabama at Huntsville (UAH) satellite temperature record from 1979 to March 2021. The charts in AR5 are the result of work by Kate Willett an d colleagues. Their papers where this data is reported are in References [3, 8] and [9].
The results are summarized in this paragraph from “TFE.1 Water Cycle Change” of the IPCC report, page 42:
“Observations of Water Cycle Change
Because the saturation vapor pressure of air increases with temperature, it is expected that the amount of water vapor in the air will increase with a warming climate. Observations from surface
stations, radiosondes, global positioning systems, and satellite measurements indicate increases in tropospheric water vapor at large spatial scales (TFE.1, Figure 1). Tropospheric specific humidity has most likely increased since the 1970s. The magnitude of the observed global change in tropospheric water vapor of about 3.5% in the past 40 years is consistent with the observed temperature change of about 0.5°C during the same period, and the relative humidity has stayed approximately constant. The water vapor change can be attributed to human influence with medium confidence."
In short, for this paragraph specific humidity is defined as the ratio of the weight of water in a volume of air to the weight of the dry air alone, expressed as grams of
water per kg of dry air [10]. This ratio increased by 3.5% over the 40 years before 2011 and is consistent with an observed increase in the Earth’s temperature of 0.5oC over the same period. Relative humidity, which is the percentage of the actual amount of water in the atmosphere compared to the maximum possible at a given temperature, remained approximately constant over the same period.
Figure 1 shows the remarkable correlation between the two temperature plots and the specific humidity plot. It appears water vapor has a profound influence on the Earth’s temperature based on the empirical evidence presented.
The specific humidity changes are unlikely the result of human influence as claimed in the AR5 report. This is because only the Sun can provide sufficient energy to evaporate enough water to increase the specific
humidity and, hence, the temperature. On average, approximately one-quarter of the Sun's energy directed towards Earth evaporates water to water vapor as shown in Figure 2 . The amount of water evaporated depends on the Sun angle. It is higher when the Sun angle is higher and lower when the Sun angle is lower.
at 101% is slightly more than the 100% energy input to the Earth. Average back radiation is 345.6 W m-2 on the original figure by Stephens et al . (2012). This is consistent with the measured back radiation as in Figure 3
3. BACK RADIATION AND NON-CONDENSING GHGs
In Table 2.4 of AR4, 52 GHGs are identified. All these GHGs have curves like that of water vapor in Figure 3, i.e., the curve starts at zero and continues to rise to an asymptote [11]. The physics of the curve shape derives from the fact that it must start at zero because zero concentration does not affect temperature. The curve continues to an asymptote because there is a limited amount of radiation to be absorbed and less and less is available for additional molecules to absorb.
Percentages are used in Figure 2 for ease of comparison by the reader. Recycle is added to balance the energy flows. From Figure 2, the back radiation, which is the radiation back to the Earth by the GHGs,
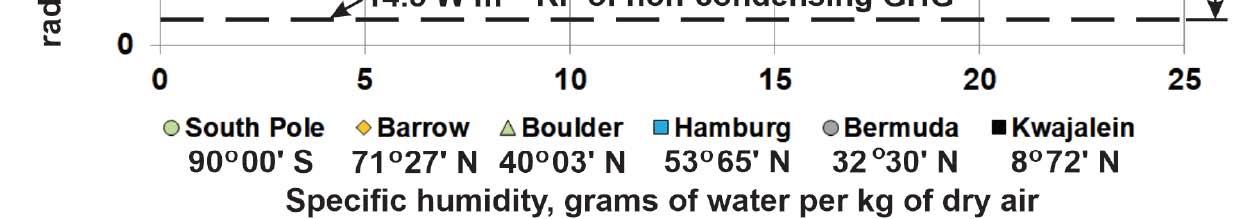
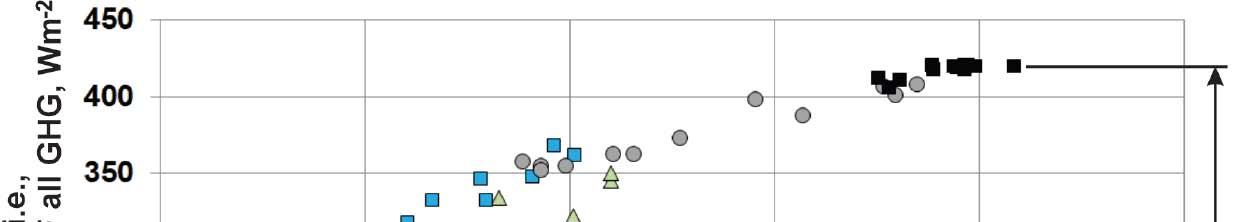
The measured values of back radiation [12] for the six locations used in this study are from Wild et al . (2001) [13]. The values are from Table 4, page 3234, that gives curves of the average back radiation over the course of a year for twelve locations. It is relatively simple to put a grid over the relevant curves and estimate the average monthly values for back radiation and plot them as in Figure 3 . The relative humidity used to calculate specific humidity is from a section of the WeatherSpark website [14] that is no longer available.

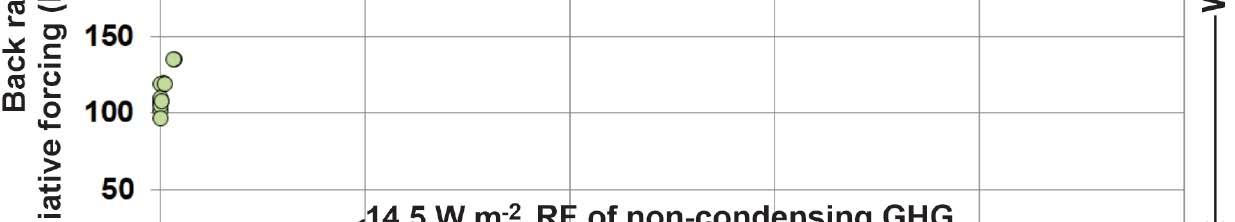
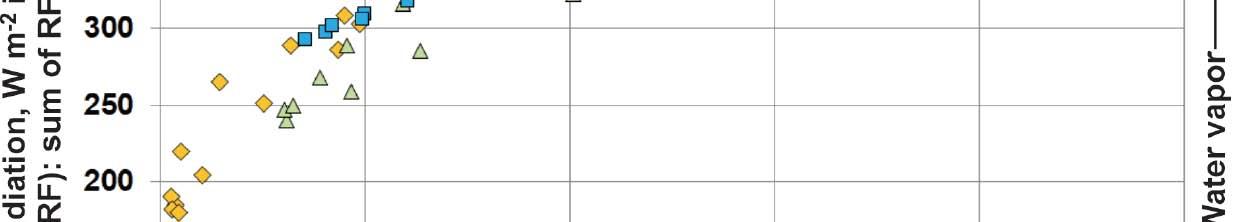
Figure 3 is Figure 1 from Reference [15] with the horizonta l axis modified from parts per million by volume (ppmv) to specific humidity. A line is added showing maximum warming by CO2, as in Figure 4 , plus warming by methane, nitrous oxide, and the remaining GHGs at current levels. When the level of CO2 reaches the asymptote of 655 ppm, warming by CO2 is constant at approximately 10.5 W m-2 and the line is horizontal. Figure 4 shows the estimated CO 2 level at any concentration and the maximum allows a useful comparison with the warming by back radiation. Currently, the curve in Figure 4 appears to be the best estimate available for the actual warming effect of CO2
1750 to 2011 is 1.13 to 3.33 W m-2. The amounts of CO2, methane, and nitrous oxide are included in the line at 13.0 W m-2
The line in Figure 3 is shown as horizontal. However, because of the reduction in warming as methane, nitrous oxide, and the remaining GHGs warm and expand towards the equator, the line is slightly canted downwards.
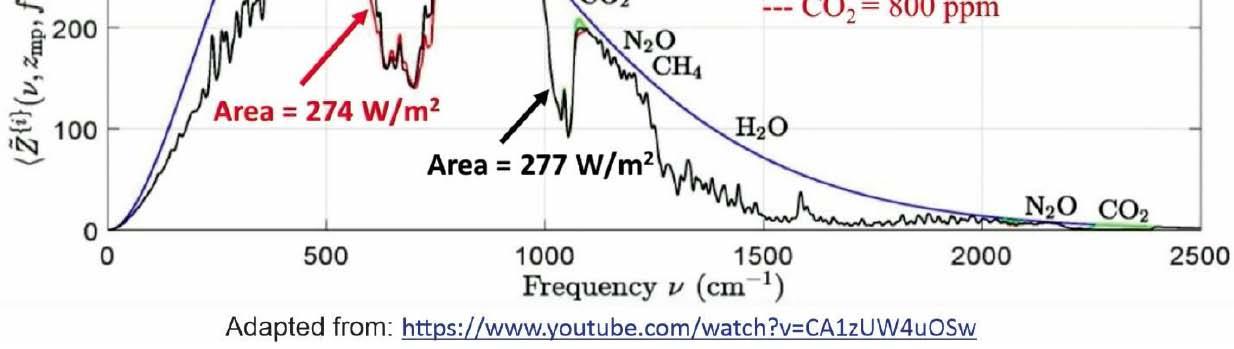
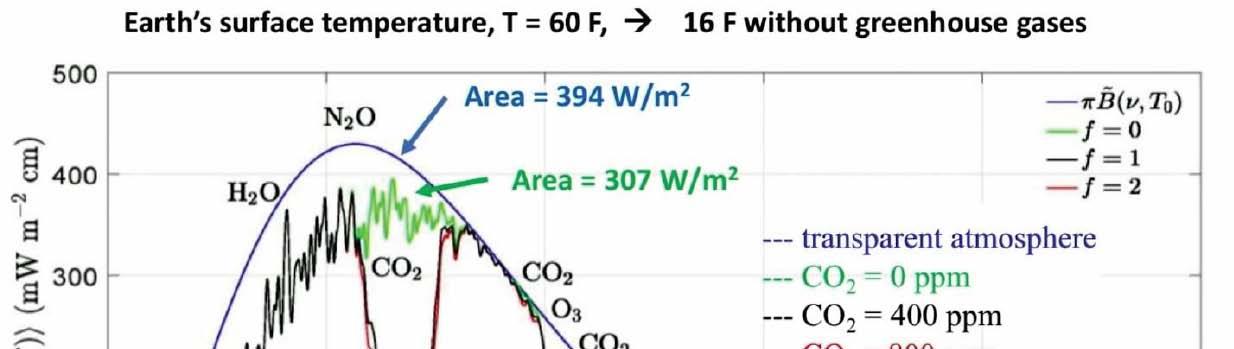
The increase in radiative forcing from 400 to 800 ppm in Figure 4 is approximately 1.5 W m-2. This is consistent with Figure 5 from Reference [19] where the increase in CO2 from 400 to 800 ppm causes a forcing increase of 3.0 W m 2. In Figure 5 the spectral flux from a surface at 288.7 K is the smooth blue line. The green line is all GHGs but with CO2 at zero ppm. The black and red lines are the same but with CO2 at 400 and 800 ppm, respectively. These differences between the two sources of 1.5 and 3.0 W m-2 are very small compared to warming by back radiation of 97 to 420 W m-2. At current levels, absorption by CO2 is close to saturation and it cannot absorb a significant amount of additional infrared radiation. For practical purposes, it is at the upper limit.
The horizontal line at 14.5 W m-2 in Figure 3 was constructed by adding the current RF of methane and nitrous oxide to the maximum RF of 10.5 W m-2 for CO2 from Figure 4 . Then including an allowance of 0.9 W m-2 for the remaining GHGs other than methane and nitrous oxide in Figure SPM.5 of AR5. The current concentration of methane is approximately 1.86 ppmv [16]. Its global warming potential is 28 to 36 times that of CO2 [17], which means it is equivalent to (1.86 x 28) = 52 ppm to (1.86 x 36) = 67 ppm of CO2. Increasing the current level of CO2 of approximately 416 ppmv by 67 ppmv to 483 ppmv would increase the RF of CO2 by 0.67 W m-2 from Figure 4
Nitrous oxide has 265 to 298 times the warming effect of CO2 [18] and its current concentration is 0.334 ppm. This is equivalent to 88.5 to 99.2 ppm of CO2. Increasing the current level of CO2 of approximately 416 ppmv by 99.2 ppmv to 515.5 ppmv would increase the RF of CO2 by 0.92 W m-2 from Figure 4. Adding (0.67 + 0.92 + 0.9 + 10.5) = 13.0 W m-2.
Figure SPM.5 in the Summary for Policymakers of AR5 indicates the increase in warming by all the GHGs from
The difference of 1.5 W m-2 between Figures 4 and 5 is added to the horizontal line in Figure 3 ; the RF of the non-condensing GHGs is 13.0 + 1.5 = 14.5 W m-2. Thus, the non-condensing gases contribute an estimated (14.5/97) = 14.9% to (14.5/420) = 3.5% of back radiation. Water vapor is 85.1% to 96.5% of back radiation and is much more important than the sum of all the other GHGs. The warming effect of the noncondensing GHGs is simply overwhelmed by water vapor. Thus, from Figure 3 , since 1750 and before, warming by water vapor has always made up most of the warming by back radiation.
The level of the horizontal line representing the sum of warming by all non-condensing GHGs does not change over time. There might be small changes in the warming by methane and nitrous oxide, but their effect will be small and imperceptible. In other words, the non-condensing GHGs are passive and do not affect Earth’s temperature because they are always rendered ineffective by the much larger warming by water vapor.
4. AIR TEMPERATURE VERSUS SPECIFIC HUMIDITY
It is known from Reference [20] that the Tropics are always warmer than the Poles of the Earth. This means
by moving from the Poles to the Tropics the level of CO2 and its warming effect falls as the air warms and expands. In contrast, from the Poles to the Equator, the level of water vapor and its warming effect increases. This can be checked using the temperature and relative humidity accessed at the same time in the Arctic and Antarctic and the Equator by AccuWeather. Using the Humidair psychrometric program, the RH can be converted to the actual specific humidity for each
location. The reduction in the level of CO2, i.e., the number of molecules per cubic metre, is calculated using the Gas Laws of Charles/Gay-Lussac and Boyle. In other words, it is important to note that warming by water vapor and the non-condensing GHGs move in opposite directions from the Poles to the Tropics.
The data used to generate back radiation in Figure 3 is plotted in Figure 6 as temperature versus specific
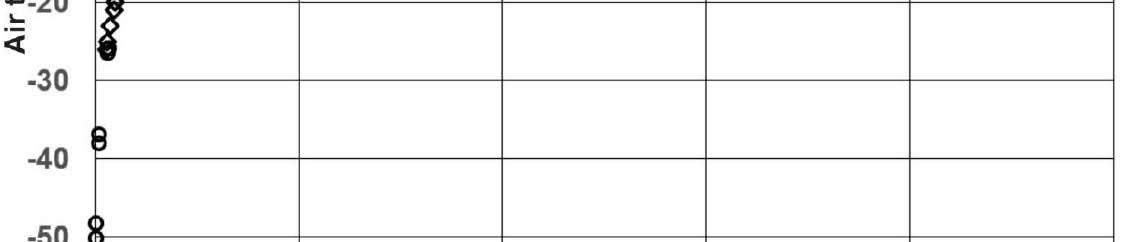
humidity over the temperature range of -56oC to 30oC, the asymptote. This is strong evidence that specific humidity drives the local Earth’s temperature.
It is not surprising that the curves for back radiation and specific humidity are almos t identical because, from Figure 3 , specific humidity contributes approximately 85.5% to 96.5% of back radiation. Note the CO2 curve in Figure 4 and that of specific humidity in Figure 6 are similar in shape.
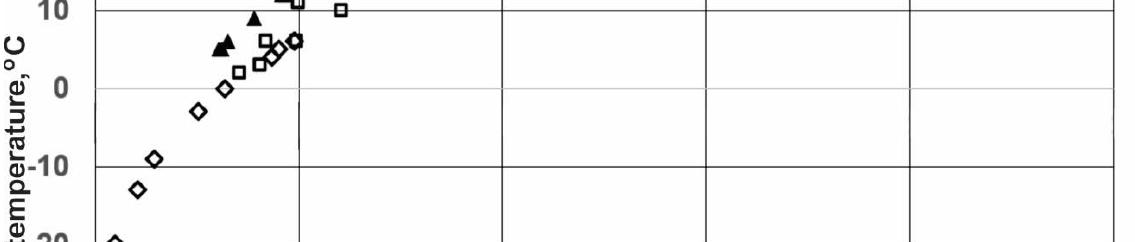
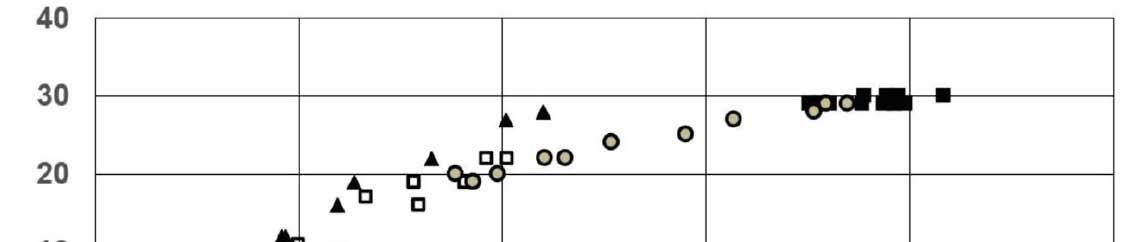
In the Appendix of Reference [4] is data for 160 realtime measurements of temperature and specific humidity recorded by AccuWeather. Since then, 40 additional points are included for a total of 200. These are plotted in Figure 7. The measurements are for the equinoxes and the solstices from September 2018 to March 2021 and the time of day is random. The plot in Figure 7 is more useful than the plot in Figure 6 because it is actual temperatures and specific humidity rather than averages as in Figure 6 .

Figure 7 shows specific humidity increases with air temperature. This is consistent with Table 1 that shows increasing Sun angle from the Arctic and Antarctic to the Equator.
The plot of Figure 7 is clear evidence the Earth’s temperature is caused by specific humidity as
mentioned in the papers by Willett et al. The space below the contour line of Figure 7 represents water vapor. The portion of a specific temperature below the contour line is caused by water vapor. The portion above the contour line is caused by something else not yet identified.
The upper end of the plot ends at approximately 30oC, which is consistent with that of Figure 6 . It is also consistent with actual temperature measurements at the Equator, such as at Libreville, Gabon [21], or Mogadishu, Somalia [22], two of the twenty locations used for Figure 7 . Libreville has an annual high daily temperature ranging from 27oC to 30oC whereas for Mogadishu the range is 28oC to 32oC. The most temperature variation above the contour line occurs in the central part of the plot. The temperature in the Tropics is less variable because of the higher average level of water vapor.
There are five outlier points between -20oC and -40oC and specific humidity of 2.0. It appears there was a problem with the measurements of relative humidity.
Specific humidity, i.e., water vapor, dilutes the level of all the non-condensing GHGs as well as their warming effects. Consider CO2 at a level of 413 molecules per million molecules of dry air, i.e., zero molecules of
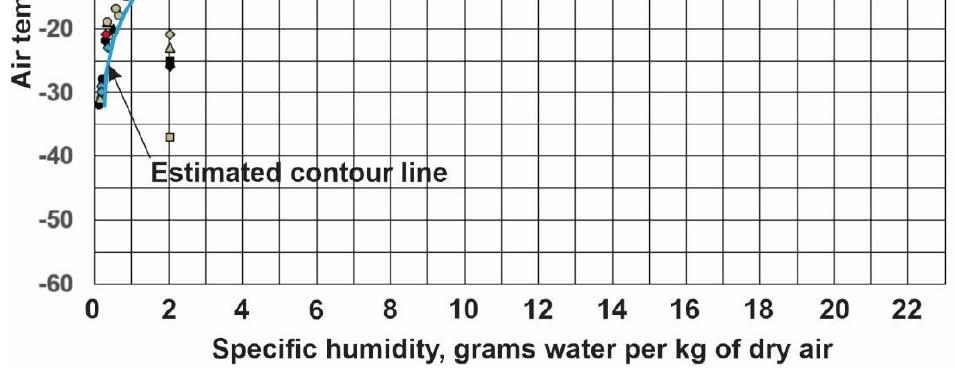
Table 1: Of these 23 Weather Stations, 20 were used for each Set of Measurements in Figure 7
Above Arctic Circle
water vapor. Then, if the level of water vapor increases to 30,000 molecules of water vapor (3%), the level of CO2 drops by 3% to 400.6 molecules per million molecules [23]. According to Figure 4 , the warming effect of CO2 falls by 0.15 W m-2
Now, the plot of Figure 7 provides a method to estimate the amount of an individual temperature that is caused by water vapor. It is a step closer to a better understanding of climate science. For example, at Libreville, Gabon, at 9:30 local time on March 20, 2021,
the temperature was 27oC and RH was 83%. This leads to a specific humidity of 18.9 grams water per kg of dry air. From Figure 7 , the portion of the temperature caused by water vapor to the contour line is approximately 24oC. The cause of the additional 3oC is unidentified.
5. SUMMARY AND CONCLUSIONS:
The IPCC report Climate Change 2013: The Physical Science Basis (AR5) has two opposing claims as to the
cause of the increase in the Earth's temperature over the period from the mid-1970s to 2011. One claim is that it is the increase in carbon dioxide (CO2) since 1750 and the other is an increase in water vapor measured as specific humidity in units of grams of water per kg of dry air. The purp ose of this study is to determine which concept is correct.
The purpose is achieved. The increase in temperature over the decades mid-1970s to 2011 was caused by an increase in water vapor and not by an increase in CO2. The question is answered about the cause of the strong correlation between temperature and specific humidity; it is the physical relationship between temperature and specific humidity as in Figure 7 Carbon dioxide and the other non-condensing greenhouse gases (GHGs) as in Figure 3 are small, passive, and have no effect on the Earth's temperature.
Back radiation is a measured value of the sum of energy transmitted back to Earth by the greenhouse gases (GHGs) and increases from the poles to the Tropics. The level of warming by the non-condensing GHGs, such as CO2, methane, and nitrous oxide, is plotted on the same figure for ease of comparison with back radiation. Warming by back radiation is many times larger than that of the non-condensing GHGs and renders their warming ineffective.
Warming by CO2 is within 3.0 W m-2 of its upper limit for warming the air. This is very small when compared to back radiation of 97 to 420 W m-2 and is negligible. The 3.0 W m-2 comes from a study that shows it is the difference in radiative forcing between 400 an d 800 ppm of CO 2. In other words, doubling the CO2 level has a negligible effect on the Earth’s temperature.
The same data used to plot the back radiation curve is used to plot average temperature versus average specific humidity, i.e., grams of water per kg of dry air. The curve is smooth and becomes an asymptote at 30oC.
To confirm this plot, real-time measurements of temperature and relative humidity were recorded using AccuWeather. The RH is converted to specific humidity by the Humidair psychrometric program. The plot data is made up of ten sets of twenty measurements at representative locations on the Earth. The record starts at the Autumn equinox in 2018 and continues through equinoxes and solstices to include the Spring equinox of 2021. The space under the contour line of the plot in Figure 7 is the specific humidity part of the
temperature. The temperature above the contour line is caused by something else not yet identified. The points above the curve are considerably variable. Figure 7 is new and u npublished information that is vital to understanding the fact that water vapor controls the Earth’s temperature.
The dynamic nature of water vapor under the influence of the Sun is important to the daily weather conditions on Earth. The phase change between water vapor and rain or snow is used by weather to move heat from where there is more to where there is less [24]. The Sun and water vapor are continually changing temperatures everywhere around the Earth.
It is concluded that:
1. The Sun is the primary energy source and controls the Earth’s local temperatures through the Sun angle and specific humidity.
2. Empirical evidence shows specific humidity in the atmosphere is the main driver of the local temperature on Earth.
3. Water vapor is the largest and most important of the GHGs and provides 85.5% to 96.5% of back radiation, which is radiation back to Earth from all GHGs.
4. Maximum warming by the non-condensing GHGs, such as CO2, methane, and nitrous oxide, is an estimated 14.5 W m-2, which is 14.9% to 3.5% of warming by back radiation. Or warming by back radiation is 6.7 to 29.0 times greater than that of the non-condensing GHGs.
5. Warming by water vapor overwhelms that of CO2 and the other non-condensing GHGs and renders their warming ineffective.
6. For practical purposes, the level of carbon dioxide in the atmosphere is at its upper limit for warming the air of the Earth. No additional amount of CO2 can affect the air temperature.
CONFLICT OF INTEREST
There is no conflict of interest.
REFERENCES
[1] IPCC, 2013: Climate Change 2013: The Physical Science Basis. Contribution of Working Group I to the Fifth Assessment Report of the Intergovernmental Panel on Climate Change [Stocker, T.F., D. Qin, G.-K. Plattner, M.
Tignor, S.K. Allen, J. Boschung, A. Nauels, Y. Xia, V. Bex and P.M. Midgley (eds.)]. Cambridge University Press, Cambridge, United Kingdom, New York, NY, USA, 1535.
[2] IPCC, 2007: Climate Change 2007: The Physical Science Basis. Contribution of Working Group I to the Fourth Assessment Report of the Intergovernmental Panel on Climate Change [Solomon, S., D. Qin, M. Manning, Z. Chen, M. Marquis, K.B. Averyt, M. Tignor and H.L. Miller (eds.)]. Cambridge University Press, Cambridge, United Kingdom, and New York, NY, USA, 996 pp
[3] Willett, K. M., P. D. Jones, N. P. Gillett, and P. W. Thorne, 2008: Recent Changes in Surface Humidity: Development of the HadCRUH dataset. J. Clim., 21, 5364–5383.
[4] Lightfoot H. D.: The IPCC Made Three Fatal Errors in Assumptions about CO2, Set Publisher, Journal of Basic & Applied Sciences, 2020, 16, 94-104. See Figure 4.
[5] AccuWeather, About us. Available from: https://corporate.accuweather.com/company/about-us/
[6] MegaWatSoft Psychrometric Calculator, HumidAir Excel Add-In v3.1. This program is available for purchase or rental, www.megawatsoft.com
[7] American Society of Heating, Refrigerating and AirConditioning Engineers (ASHRAE). Psychrometric chart No. 1 (SI). Available from: https://www.ashrae.org/File% 20Library/Technical%20Resources/Bookstore/UP3/SI-1.pdf
[8] Willett, K. M., P. D. Jones, P. W. Thorne, and N. P. Gillett, 2010: A comparison of largescale changes in surface humidity over land in observations and CMIP3 general circulation models. Environ. Res.Lett., 5.
[9] Willett, K. M., Williams Jr., C. N., Dunn, R. J. H., Thorne, P. W., Bell, S., de Podesta, M., Jones, P. D., and Parker, D. E.: HadI S. D. H.: An updateable land surface specific humidity product for climate monitoring, Clim. Past, 9, 657–677, https://doi.org/10.5194/cp-9-657-2013, 2013.
[10] The free dictionary by Farlex. Available from: https://www.thefreedictionary.com/specific+humidity
[11] Rasool S. I., Schneider S. H.: Atmospheric Carbon Dioxide and Aerosols: Effects of Large Increases on Global Climate, 1971, Science Vol. 173 pp. 138-141. Figure 1 and page 139.
[12] The Science of Doom,The Amazing Case of "Back Radiation", parts one, two, and three. Available from: https://scienceofdoom.com/roadmap/back-radiation/
[13] Wild M., et al.: Evaluation of downward longwave radiation in general circulation models. J Climate Am Meteorol Soc 2001; 14: 3227–3239 (Table 4, p.3233).
[14] WeatherSpark.com. Available from: https://weatherspark. com/
[15] Lightfoot H. D., Mamer O. A.: Back radiation versus CO2 as the cause of climate change, Energy & Environment, July 28, 2017, Sage publications the UK. https://doi.org/10.1177/0958305X17722790
[16] National Oceanic & Atmospheric Administration, Earth System Research Laboratory, Global Monitoring Division, NOAA Annual Greenhouse Gas Index (AGGI). Available from: https://www.esrl.noaa.gov/gmd/aggi/aggi.html, Figure 2.
[17] The United States Environmental Protection Agency, Greenhouse Gas Emissions, Understanding Global Warming Potentials. Available from: https://www.epa.gov/ ghgemissions/understanding-global-warming-potentials
[18] The United States Environmental Protection Agency. Available from: https://www.epa.gov/ghgemissions/ understanding-global-warming-potentials
[19] W. A. van Wijngaarden W A, Happer W, Dependence of Earth’s Thermal Radiation on Five Most Abundant Greenhouse Gases, Cornell University, Physics Atmospheric and Oceanic Physics, June 8, 2020. See Figure 4. Available from: https://arxiv.org/pdf/2006.03098.pdf. Also available from the video: https://www.youtube.com/ watch?v=CA1zUW4uOSw
[20] Lightfoot H. D.: The IPCC Made Three Fatal Errors in Assumptions about CO2, Set Publisher, Journal of Basic & Applied Sciences, 2020, 16, 94-104. See Sections 3 and 4.
[21] WeatherSpark, Libreville, Gabon. Available from: https://weatherspark.com/y/61793/Average-Weather-inLibreville-Gabon-Year-Round
[22] WeatherSpark, Mogadishu, Somalia. Available from: https://weatherspark.com/y/103661/Average-Weather-inMogadishu-Somalia-Year-Round
[23] Tans P and Thoning K, How we measure background CO2 levels on Mauna Loa, NOAA Global Monitoring Laboratory, Boulder, Colorado, September 2020
[24] Spencer R. W., Climate Confusion, Encounter Books, New York, 2008. Page 55.