
Discussion on climate and carbon dioxide by Douglas Lightfoot in Canada and Ferdinand Engelbeen in Belgium.
January 2, 2023
Douglas Lightfoot1. CO2 is not a warming gas
Many people have seen the numbers in the following paragraph and the calculations. Not a single person has questioned or found a problem with any of them.
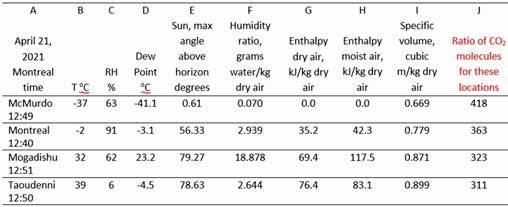
In February 2022, there were 418 molecules of CO2 per million molecules dry air. This measurement is the mole fraction, 0.000418, which converts to 0.0184 grams of CO2 per kg of dry air. If 0.0184 is the level at McMurdo, then using the specific volume from psychrometric data, the level of CO2 at Mogadishu is (0.0184 x (323/418)) = 0.0142 grams. The enthalpy difference caused by CO2 between McMurdo and Mogadishu is the weight of CO2 multiplied by the specific heat and that multiplied by the temperature difference, i.e., 0.0000142kg x 0.833KJ/kgK x 69K = 0.000816 kJ. Thus, out of the 117.5 kJ of enthalpy difference between McMurdo and Mogadishu, CO2 contributes 0.000816 kJ or 0.00016%. This amount means the warming effect of CO2 is too small to measure—it is zero for practical purposes.
You have likely not seen these calculations in detail before because they were only published just over a month ago. I suggest you check them. The method of developing the numbers and the conclusion is new and is solid science. The first time this concept appears is in our paper published in November 2022. All of our calculations are in the Supplementary Information in Excel spreadsheets or in the text of the paper. Both are available at: https://setpublisher.com/pms/index.php/jbas/article/view/2425
Nobody has punched a hole in the message that the warming effect of CO2 is zero for practical purposes. The process is straightforward, so there does not appear to be any risk of anyone doing so.
See Appendix A for examples of the robustness of the calculations.
2. Relevant information for the lawyers
My experience with lawyers is that they are continually looking for relevant information that can make them successful. The science in our paper was only published in November 2022, and was not available when the lawyers prepared their documents. Thus, they need to know that new and relevant information is now available. It is up to the lawyers to determine whether or not it is useful.
I strongly recommend that you give them our paper and the explanations in this document.
We changed the title of Column J in Table 2 of the paper to avoid confusion. The revised Table 2 is below and should be given along with the paper.
Appendix 1: The robustness of our calculations
Table A records the date, Montreal time, temperature, and relative humidity on January1, 2023 for five locations. The data were taken over four minutes. The lowest temperature is at Pond Inlet. It is the baseline for calculations of CO2 enthalpy in Table B.
Table A Locall Temp. Relative Date Time oC humidity
Pond Inlet, Canada
Montreal, Canada
Libreville, Gabon
1-Jan 11:16 -36 67
1-Jan 11:13 4 96
1-Jan 17:17 28 78
Mogadishu, Somalia
1-Jan 19:15 28 73
McMurdo Station, Antarctica 2-Jan 5:17 -6 92
Table B
Δ Enth. CO2 Enth. pp m volu me dry air heat Δ T Enth. kJ kJ % total
Speci fic gra ms Spec ific Δ CO2
Pond Inlet, Canada 41 9 0.674 0.01 84 0.83 3 0 0.00 000 0 0.000 0%
Montreal, Canada 35 7 0.791 0.01 57 0.83 3 4 0 0.00 052 52.3 0.0010 %
Libreville, Gabon 33 0 0.85 6 0.01 45 0.83 3 6 4 0.00 077 112.1 0.000 7%
Mogadishu, Somalia 32 9 0.85 9 0.01 45 0.83 3 6 4 0.00 077 109.2 0.000 7%
McMurdo Station, Antarctica 37 3 0.757 0.01 64 0.83 3 3 0 0.00 041 35.2 0.0012 %
The number of molecules at Montreal is 419 ppm x (0.674/0.791) = 357 ppm. The ratio also calculates the grams of CO2 air from 0.0184 grams. For the calculation of enthalpy, the grams of CO2 in dry air are converted to kilograms.
As the enthalpy difference between two locations becomes smaller the CO2 enthalpy becomes a larger percentage of the total. This does not change the conclusion that warming by CO2 is too small to measure and confirms the robustness of the calculations. All five of the CO2 enthalpies are consistent with the 0.00016 kJ in Section 1.
2 Enthalpy
There appears to be some confusion about enthalpy—it is simply the heat content of the air in kilo Joules (kJ) between two locations. For example, the change in temperature and water vapor content between McMurdo and Mogadishu requires the addition of 117.5 kJ of heat. Enthalpy is part of the thermodynamics of the Earth's atmosphere. The enthalpy at Mogadishu, for example, is made up of the air's enthalpy and water vapor's enthalpy. The enthalpy of CO2 is part of the total enthalpy. However, it is too small to measure and never appears.
Appendix 3. The psychrometric model of the Earth’s atmosphere
The concept that increasing CO2 in the atmosphere warms it appears in a paper linking CO2 and global warming by Eunice Newton Foote in 1856. She did experiments with various gases in glass tubes exposed to the Sun, including CO2. She reported, "An atmosphere of that gas (CO2) would give our Earth a high temperature". She interpreted the results of her "laboratory tests" as if they were applied to the atmosphere, assuming that increased CO2 would warm it.
Later, other researchers did additional laboratory experiments, applied the results to the atmosphere, and concluded that as CO2 increases, the atmosphere retains more heat, and the global warming effect increases. The absorption of infrared radiation (IR) by CO2 that warms the air became accepted and promoted by the Intergovernmental Panel on Climate Change (IPCC).
Shortly after Eunice Foote did her work, a group of scientists began pursuing the properties of the Earth’s atmosphere. They put together psychrometric data that describes the Earth’s atmosphere. The data was difficult to use until, in 1904, Willis Carrier constructed it as a psychrometric chart. The chart was the first mathematical model of the Earth’s atmosphere. This model has stood the test of time and is now available as a computer program—Humidair. It has successfully given “the correct answer” around the World for more than a century. It has proven valid and valuable in designing heating, ventilating, and air conditioning systems or where there are moisture problems. Psychrometric data is sometimes referred to as “the thermodynamics of humid air”.
The psychrometric mathematical model of the Earth’s atmosphere is the only valid and tested model of the Earth’s atmosphere—it works and has done so for 118 years. However, it does not appear to be well-known in the scientific community.
The psychrometric mathematical model does not include a warming effect of CO2 because it is too small to measure. Most models produced by climate modelers try to show that CO2 is a warming gas.
Appendix 4. Thermodynamics and the Earth’s temperature
The thermodynamic approach to defining the role of CO2 in the atmosphere estimates Earth’s temperature using precise measurements of the daily weight of CO2 in the atmosphere initiated by Charles Keeling. The thermodynamic approach makes sense. It is thermodynamics that begins the Ice Ages and ends them.
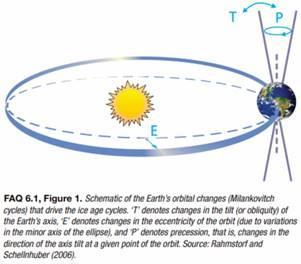
Figure FAQ 6.1, Figure 1 below is from IPCC AR4 Climate Change 2007: The Physical Science Basis Chapter 6, page 449.
As the Earth’s orbit becomes more elliptical and the northern latitudes tip away, the strength of the Sun’s energy diminishes. Snow does not melt from one season to the following. Ice sheets build up and bring an Ice Age. The cause is a change in thermodynamics—a reduction in the amount of the Sun’s energy reaching Earth.
Also, solar maxima and minima result from changes in the Sun’s energy output that cause temperature changes on the Earth. The Sun’s energy is also the primary control of Earth’s daily temperature, Lightfoot and Ratzer (2022).
Thermodynamics was also promoted in the1960s by Syukuro Manabe and others, that said: "the Earth operates essentially as a thermodynamic machine, utilizing evaporation, condensation, and precipitation (Latent Heat), and convection and advection (Sensible Heat, SH)."
5. Appendix. General comments
I read the “Lindzen, Happer & CO2 Coalition file amicus brief in 5th Circuit Court “. It is comprehensive and full of interesting and useful information.
How does it deal with questions the lawyers on the other side might ask, such as:
1. You admit that increasing CO2 warms the atmosphere. Explain why it will not increase the temperature to 1.5oC above preindustrial levels.
2. Explain the significance of 1.5 degrees C?
3. Why do you discount climate experts like Michael Mann? He is well known, supported by his university, and has won several awards.
4. The Biden Administration is spending billions of dollars on wind and solar energy, electric cars and batteries, and creating thousands of good-paying jobs to reduce CO2 emissions. How can that be bad?
There is much at stake for JOSEPH R. BIDEN, JR. et al. if they lose. However, people do not like being shown up as being wrong, primarily since they have worked so long and hard to have CO2 accepted as dangerous. They will oppose vigorously and with all sorts of misleading information.
Your message about peer review of climate-related papers is consistent with my experience. I am an energy expert and have reviewed over 250 documents submitted for publication in energy journals since 2009. I try to ensure that if a paper I review is published that no one will be able to find fault with any part of it. I have seen hundreds of peer reviews from scientists that are, to be kind, not useful.
The justices of the Supreme Court of Canada appear to accept the CO2 mantra. The judge, in this case, might hold similar views and have to be educated to a different perspective.
Best wishes to all for a healthy, happy, and successful New Year in 2023!
H. Douglas Lightfoot
From: Douglas Lightfoot <dlightfo@aei.ca>
Sent: Thursday, December 29, 2022 2:08 PM
To: 'Ferdinand Engelbeen'
Subject: Comments from a discussion with John Shanahan
Dear Ferdinand and all:
Thank you for your reply. I read all of your comments.
This discussion has been helpful to me because now I can summarize our work better. “In 1904, Willis Carrier published a psychrometric chart, a mathematical model of the Earth’s atmosphere. In 1959, Charles Keeling published the carbon dioxide (CO2) in the atmosphere as the number of CO2 molecules per kilogram of dry air. In 2022, Lightfoot and Ratzer published a study building on the work of Carrier and Keeling to show the warming by CO2 on the atmosphere is immeasurably tiny, currently less than 0.0005oC. And the Sun is the primary control of Earth’s temperature.”
Best wishes for a good New Year in 2023!
Best regards, Doug
From: Ferdinand Engelbeen <ferdinand.engelbeen@telenet.be>
Sent: Thursday, December 29, 2022 9:40 AM
To: Douglas Lightfoot
Subject: Comments from a discussion with John Shanahan
Dear Douglas and all, Comments in red...
Best regards, Ferdinand Engelbeen
Op 12/29/2022 om 4:16 AM schreef Douglas Lightfoot: Dear Ferdinand and all,
Thank you for your reply.
I suggest that you changed the subject and did not deal with the issue. If you do not like the results that show the warming by CO2 is too small to measure, then show us where there is a mistake in the calculation that makes a significant difference.
I am responding in green below each of your comments.
From: Ferdinand Engelbeen <ferdinand.engelbeen@telenet.be>
Sent: Wednesday, December 28, 2022 9:32 AM
To: Douglas Lightfoot
Subject: Re: Comments from a discussion with John Shanahan
Dear Douglas and all,
As discussed before, there is no measurable effect of CO2 in the psychrometric data, because that has nothing to do with the so called greenhouse effect of CO2 or other greenhouse gases (GHGs).
The psychrometric model of the Earth's atmosphere uses temperature and relative humidity to determine the air's enthalpy (heat content). This temperature includes the heat content from the greenhouse effect of all of the greenhouse gases. If the impact of all the greenhouse gases does not show up in temperature measurements, where does it show up?
It mainly shows up in the earth's surface temperature (not a part of the atmosphere!) and partly in the air temperature by collisions between excited CO2 molecules and other "inert" N2 and O2 molecules.
That has nothing to do with the specific heat content of the air but with the specific wavelengths of near infrared (= energy) that is absorbed by greenhouse gases. That energy is either redistributed between all molecules present at that moment, by collisions, or re-emitted in all directions, including back to the surface.
The amount of energy reaching the surface is calculated as about 3 W/m2 for a CO2 doubling.
How much that heats the atmosphere above the surface depends on many factors, including the air's enthalpy.
The greenhouse effect is about the quantity and cause of the extra energy retained in the surface and atmosphere, while the psychrometric data are telling something about the effect of the energy retained in the atmosphere on temperature. The second is the result of the first, not about what causes the first...
The psychrometric effect is about the effect of any energy supply (whatever the source) on a volume of air, which depends on the specific heat of that volume, which mainly depends on its local pressure and water vapor content.
The temperature at any location results from all the factors that affect it. These include "energy supply (whatever the source)". These also have all the local physical effects from latitude, elevation, Sun angle, Sun's variability, proximity to oceans and lakes, clouds, any recent volcanic action, as well as the interaction of the 99% non-GHG gases N2, O2, and Ar, as well as the water vapor. You forget to include the greenhouse effect that adds to the energy supply. For all other items deemed constant, the total greenhouse effect is good for some 30 K extra warming...
This temperature is input to the Humidair model of the Earth’s atmosphere. You can find the Supplementary Information that has the spreadsheet calculations of Humidair at: https://setpublisher.com/pms/index.php/jbas/article/view/2425
Suppose you examine the Excel spreadsheet for March 2021. In that case, you will see the temperature and relative humidity (RH) in Columns I and J. The pressure in units of bar for each location is Column N, and the code “W” is in column O. Code W tells Humidair to give the results as kg of water per kg of dry air. Column Q gives the result in grams of water per kg dry air. Column S in blue is a copy of Column Q in case the column Q figures disappear because you do not have the Humidair program on your computer.
The enthalpy (heat content in kJ) is in Columns AC, AD, AH, and AI. The specific volume (cubic metres per kg of dry air) is in Columns AL and AM. At
each location, the Humidair program calculates specific volumes by accounting for temperature, water vapor content, and pressure.
The point is that the Humidair psychrometric program considers the heat from all sources because it uses heat from all sources accumulated in the temperature measurement.
The "heat (energy is more accurate) of all sources" includes the greenhouse effect of CO2, water and any other GHG... You are looking at the end result, I am looking at the causes...
The greenhouse effect is about how much outgoing IR radiant energy a certain amount of a greenhouse gas effectively captures and resends back to the earth's surface.
If the amount of IR sent back to Earth changes its temperature, the temperature measurement captures it.
You are looking at air temperatures, but the main effect of CO2 and other GHGs is at the solid surface. That will affect the air column above it, but the main effect is that more IR is leaving the surface...
Two completely different items... They are connected through temperature measurement and are the same, not two different items.
Again, you are looking at the effect, influenced by a lot of different items, I am looking at the cause, specific to CO2 and nothing else.
Thus one can't deduce anything about the greenhouse effect of CO2 or any other GHG by looking at the psychrometric effect of an air column.
Some graph titles are in the gray bar along the bottom of the spreadsheet data. Click on "Temp vs. Ent dry" and "Temp vs. Ent wet". These are plots of the results of the 240 temperature points. They show the heat content rises from the Poles to the Equator. The heat content of the air containing water vapor is much higher than that of dry air. Thus water vapor is an effective greenhouse gas.
I think that is the main difference between our opinions:
The greenhouse gas effect has nothing to do with the heat content of any gas or vapor, really nothing.
The greenhouse effect is about the capturing and resending IR of specific wavelengths in all directions, including back to the surface. That is how the sun's energy is "recycled", not how the recycled energy leads to warming...
For some basics see: https://scied.ucar.edu/learning-zone/how-climate-works/greenhouse-effect
The enthalpy contribution of CO2 between McMurdo and Mogadishu is 0.000816 kJ or 0.00016% of the total wet air enthalpy. This value is good evidence that the warming effect of CO2 is too small to measure.
The warming effect of CO2 as part of the heat content in an air mixture is too small to measure, but that has nothing to do with how CO2 captures IR in specific wavelengths...
The theoretical effect of a CO2 doubling, based extreme detailed line by line spectra, according to Dr. Happer and Dr. Van Weingaerden is about 3.0 W/m2 extra reaching the earth's surface. That is extra energy and the surface must heat up to get rid of that extra energy at the top of the atmosphere to restore the earth's energy balance.
The 3.0 W/m2 is the increase in CO2 from 400 to 800 ppm. The temperature measurements take the 3.0 W/m2 into account. The point is that if there is a temperature increase, it has to show up in the temperature measurements. Where does it appear if it does not show up in the temperature measurements?
It is included in the measured temperature: without GHGs, the temperature of the surface for average 210 W/m2 insolation would be much lower (over 30 K cooler, snowball earth...).
That is completely independent of what happens with the column of air above the earth's surface or its composition...
It appears you are trying to say that CO2 is not part of the column of air. The reality is that CO2 cannot be separated and treated differently.
CO2 is part of the air column, but you are looking at the result, not the cause...
Moreover, the real effect of the CO2 increase on back radiation was measured at two stations in the US in the period 2000-2010:
https://escholarship.org/content/qt3428v1r6/qt3428v1r6.pdf
About 0.2 W/m2 for a 22 ppmv CO2 increase.
We saw this paper when it was published. It is good work. But if this difference in W/m2 warms the Earth, it appears in the temperature measurements.
It does appear in the temperature measurements: there is a temperature increase at all latitudes with increasing CO2 levels, which doesn't mean that CO2 is the only contributor, but what is measured must give a difference in surface temperature to get the earth's energy balance back to equilibrium...
Here for the UAH temperature measurements:
https://www.woodfortrees.org/plot/uah6/plot/uah6/trend
How much that will affect the temperature of the air column above the surface is a matter of many other factors, but the greenhouse effect of CO2 is real and measured...
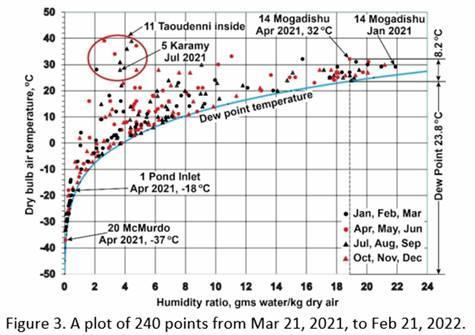
The greenhouse effect is real and measured. It is caused entirely by water vapor. Figure 3 below shows 240 temperatures taken on the 21st of each month for 12 months. The Sun provides water vapor up to the dew point temperature and natural radiation above it. The data in this figure is the result of using the Humidair model.
The GHG effect is measured and composed of all GHGs, not only water vapor. CO2 is active in frequencies where water is less/not active, the effect of CO2 thus is additional to what water vapor does.
Again, it is about the cause of the extra energy, not the result of that extra energy...
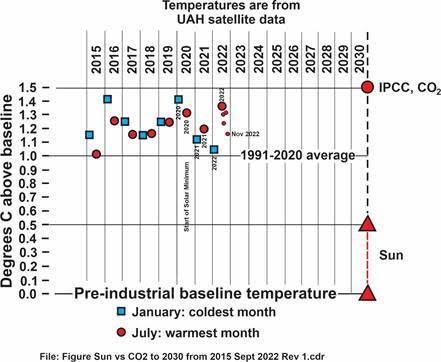
The Sun is in a solar minimum as of mid-2020, and the Earth’s temperature is falling. Below is a figure based on Figure 1 of our paper at:
https://setpublisher.com/pms/index.php/jbas/article/view/2350/2165
Note that January's 2021 and 2022 blue squares tend towards the Sun temperature projection and not that of CO2. With cold records currently being shattered in the Northern Hemisphere, the January 2023 temperature might be lower than the previous two. The northern hemisphere contains 2/3 of the Earth's land and dominates the Earth's temperature. This figure appears to be further evidence that CO2 has no significant warming effect on the Earth.
The psychrometric model is the only validated mathematical model of the Earth's atmosphere. Experience over 118 years from 1904 has proven its success.
I have a lot of experience in using the psychrometric model. I rented Humidair twice—it was $30 US for five months. I finally bought it for between $200 and $300 US. It is now about $150 US. You might try using it to understand better how it works. After all, it appears to be the only accurate model of the Earth’s atmosphere.
Best regards,
H. Douglas Lightfoot
The psychrometric model may be unique in describing the real atmosphere, but has nothing to do with the GHG effect, only describes the net result of all influences, including the GHG effect on atmospheric temperatures...
Best regards, Ferdinand Engelbeen