Laws of Physics define the insignificant warming of Earth by CO2
H. Douglas Lightfoot and Gerald RatzerSlide 1: Laws of Physics define the insignificant warming of Earth by CO2. A presentation of the scientific evidence that supports the title.
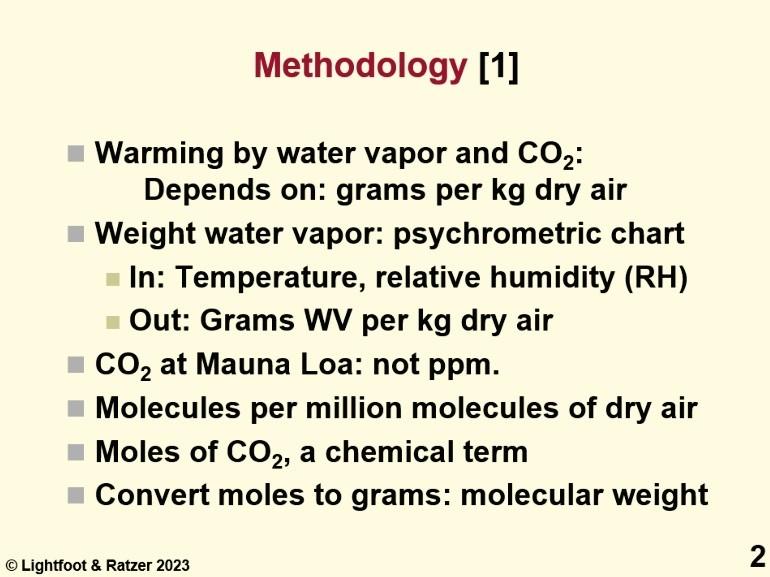
Slide 2: Methodology. Grams of water vapor compare with grams of CO2 per kg of dry air [1]. Temperature and relative humidity measurements are input to a psychrometric program, Humidair. Output is the grams of water vapor per kilogram (kg) of dry air. Daily measurements at of CO2 at Mauna Loa are reported as ppm. It really is CO2 molecules per million molecules of dry air. The mole fraction; convert to grams of CO2 per kg of dry air.
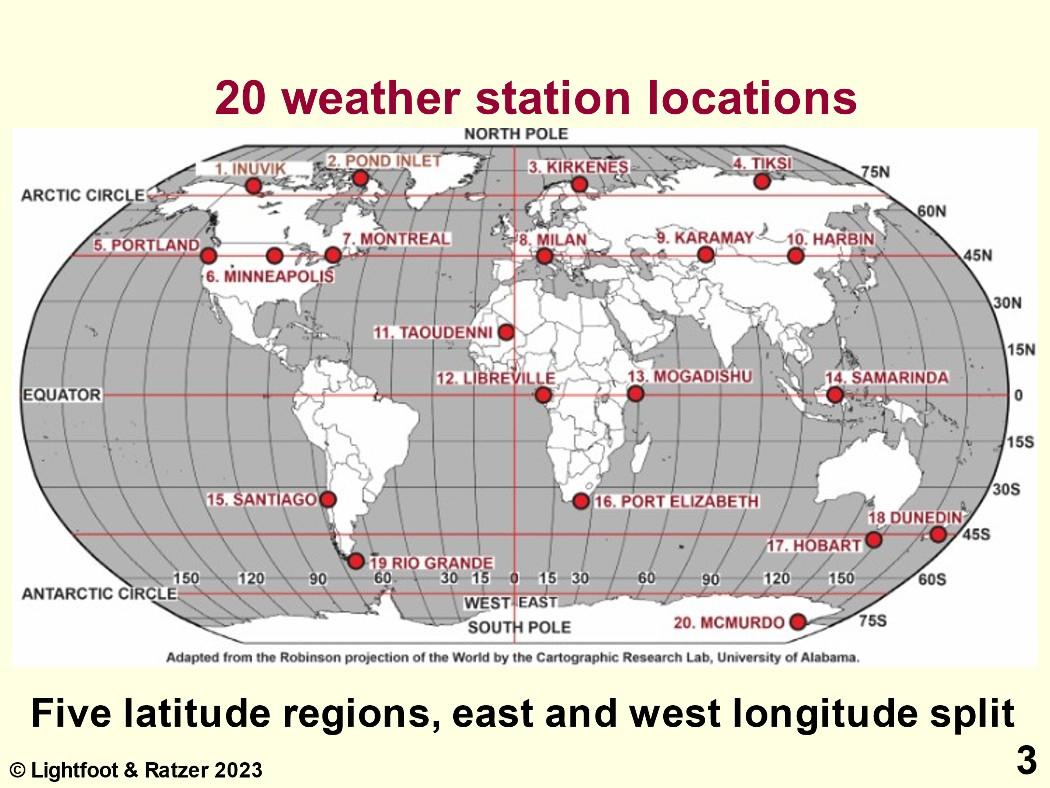
Slide 3: 20 weather stations. We selected twenty weather stations as representative of the various Earth regions to obtain temperature and relative humidity values. There are five latitude regions and east and west longitude regions. There is one point in the Sahara Desert to get the extremes. We sampled the temperature and relative humidity (RH) on the 21st of the month for twelve months— 240 points—March 2021 to February 2022.
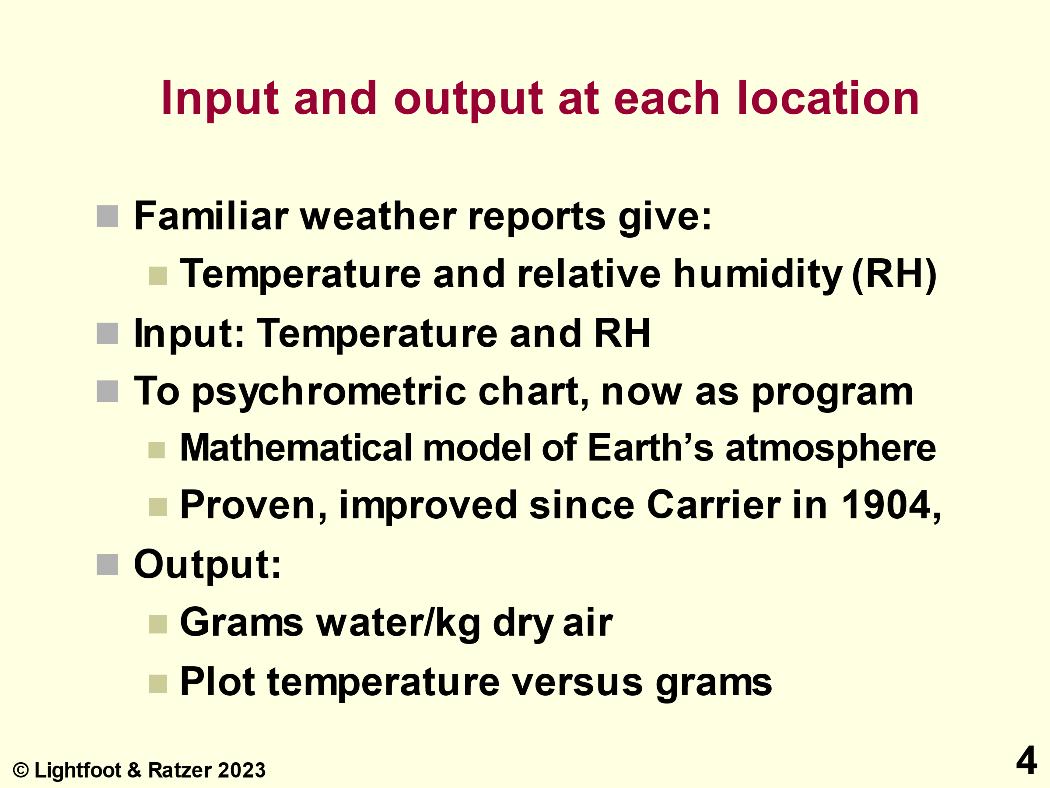
Slide 4: Input and output at each location. Input into the psychrometric program is temperature and relative humidity (RH). Output is the humidity ratio, measured as grams of water vapor per kg of dry air, by the psychrometric program, Humidair [2]. A psychrometric chart is a mathematical model of the atmosphere, invented in 1904 by Willis Carrier,
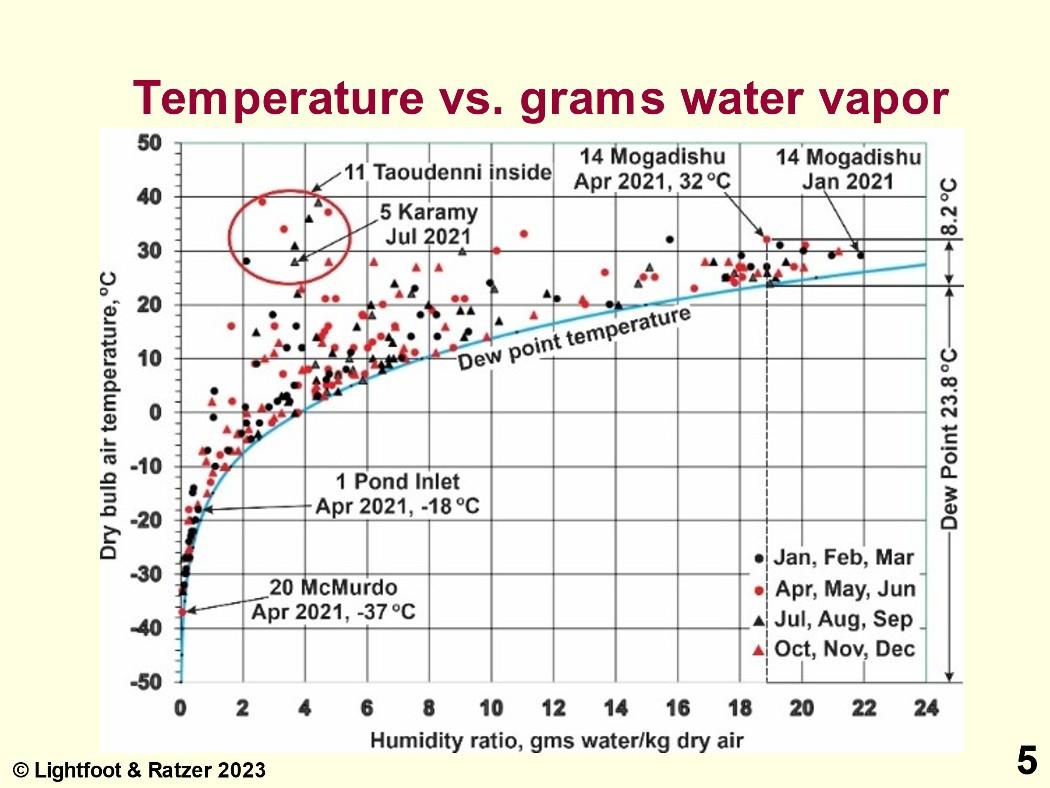
Slide 5: Temperature vs. grams of water vapor. The area below the blue dew point curve is caused by water vapor, provided by the Sun. At Mogadishu the dew point in April 2021 was 23.8oC, as shown on the right. The 8.2oC is the direct radiation. The temperature in Taoudenni in the Sahara Desert is mostly from direct radiation by the Sun because water vapor is very low. Direct radiation from the Sun causes the area above the dew point line. It is the Sun that controls Earth’s temperature indirectly through water vapor and directly by radiation.
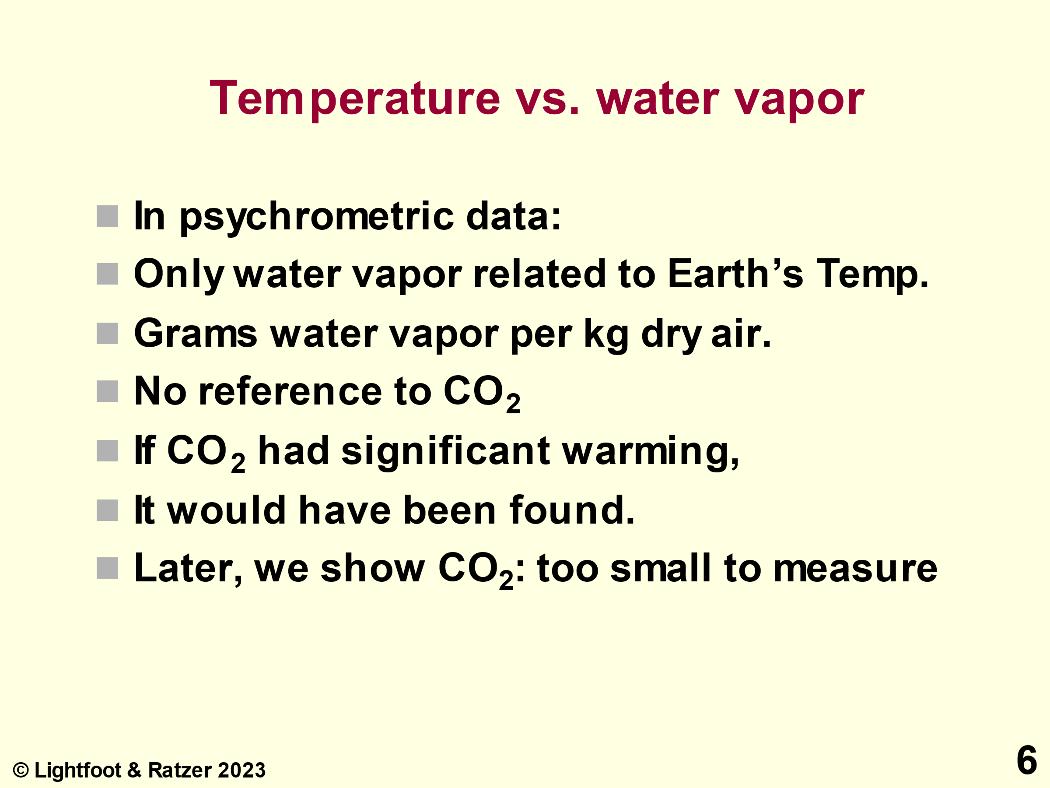
Slide 6: Temperature vs. water vapor. A psychrometric chart is a mathematical model of the Earth’s atmosphere. Only water vapor is related to the Earth’s temperature as grams of water per kilogram (kg) of dry air. There is no reference to carbon dioxide (CO2). If CO2 caused significant warming, the people who developed the science basis for the psychrometric model would have found it. Later, we show warming by CO2 is too small to measure.
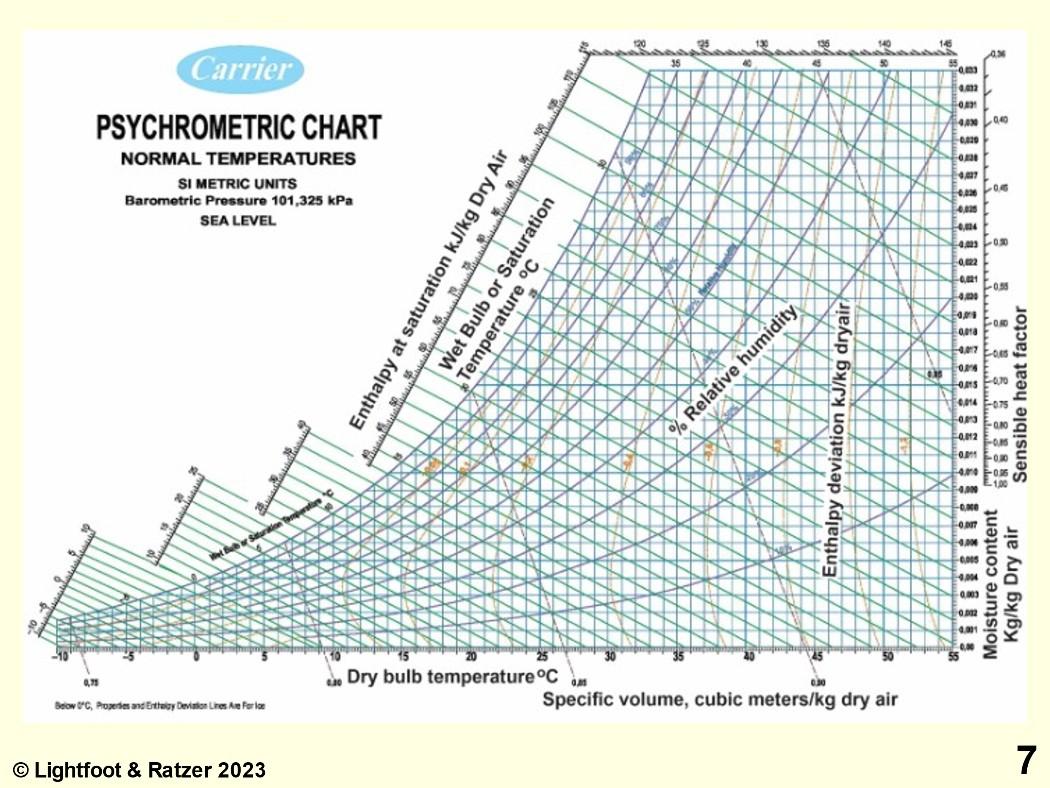
Slide 7: Psychrometric chart. This chart has all the properties that appear in the Humidair computer program. If you measure 20oC dry bulb temperature and 50% relative humidity, the humidity ratio is 7.3 grams of water per kg of dry air. The atmospheric pressure is 131.325 kilo pascals.
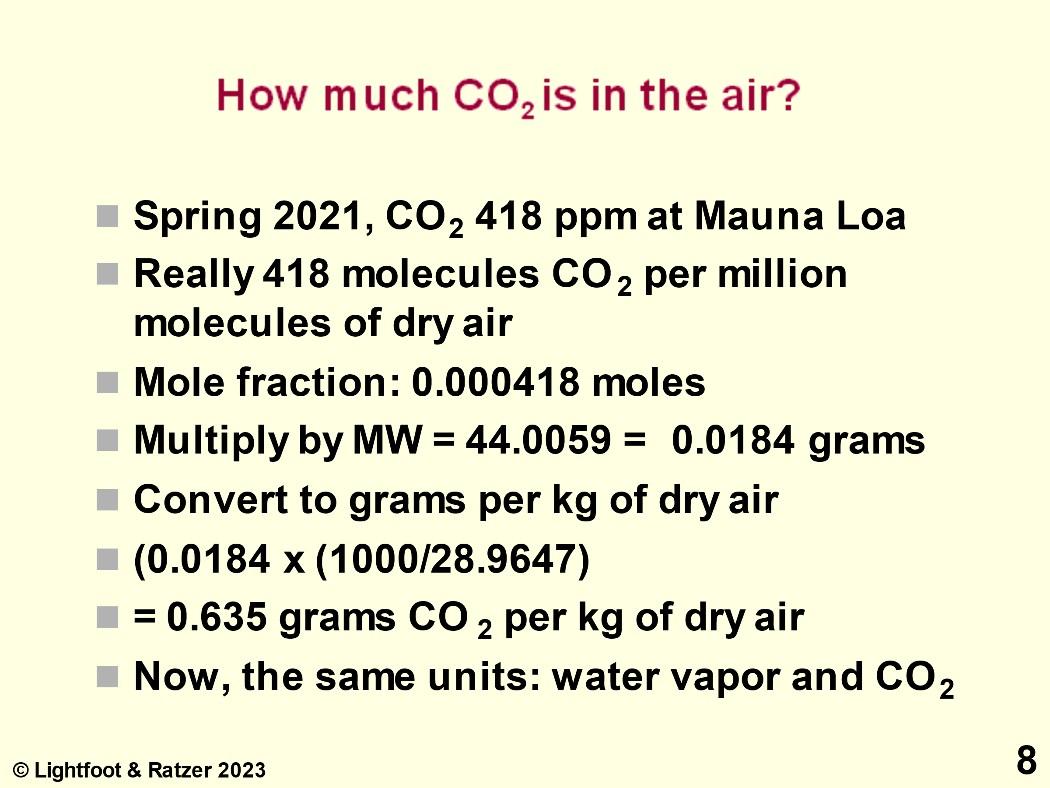
Slide 8: How much CO2 is in the air? In April 2021, CO2 was 418 molecules of CO2 per million molecules of dry air. Multiply the mole fraction, 0.000418, by the molecular weight, 44.0059, to obtain the grams of CO2 per mole of dry air. To convert to grams of CO2 per kg of dry air, multiply by (1000/28.9647) = 34.525. The molecular weight of air is 28.9647. The result is 0.635 grams of CO2 per kg of dry air at McMurdo. Now with water vapor and CO2 in the same units, we can compare them.
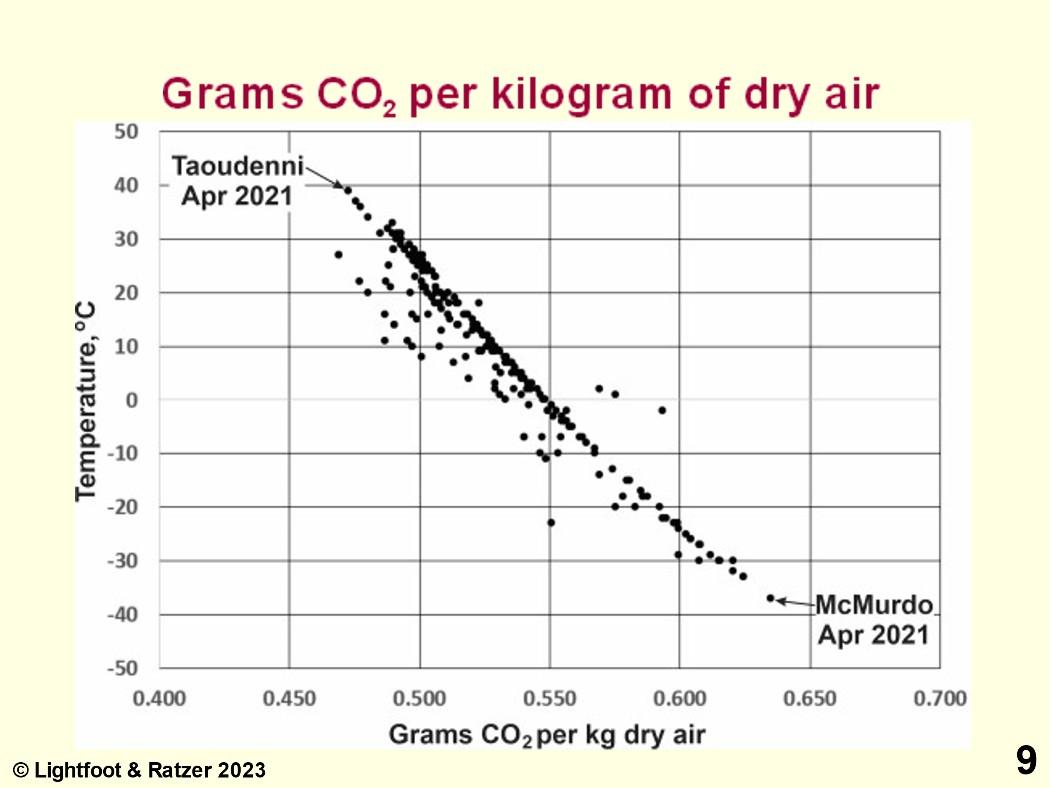
Slide 9: Grams CO2 per kg of dry air. Compare this plot of the grams of CO2 with Slide 5, the water vapor per kg of dry air. As the temperature goes up, the grams of CO2 fall by dilution. In contrast, as temperature goes up, water vapor goes up, and CO2 falls by dilution
Slide 10: How do CO2 and water vapor interact?
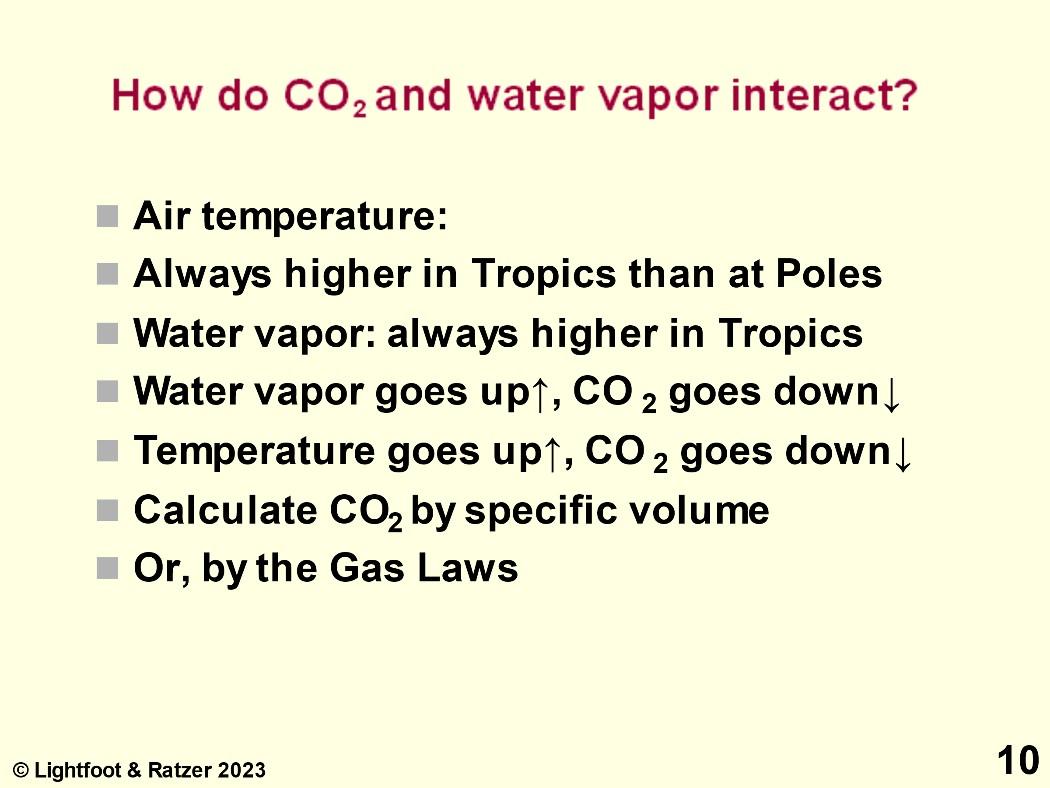
The air temperature is always higher in the Tropics than at the Poles by observation. Because the temperature is higher, the water vapor is higher, as in Slide 5. Both affect the number of molecules of CO2 per cubic meter. As water vapor and temperature go up, the number of molecules of CO2 goes down. Calculate the actual change in CO2 from specific volumes or the gas laws.
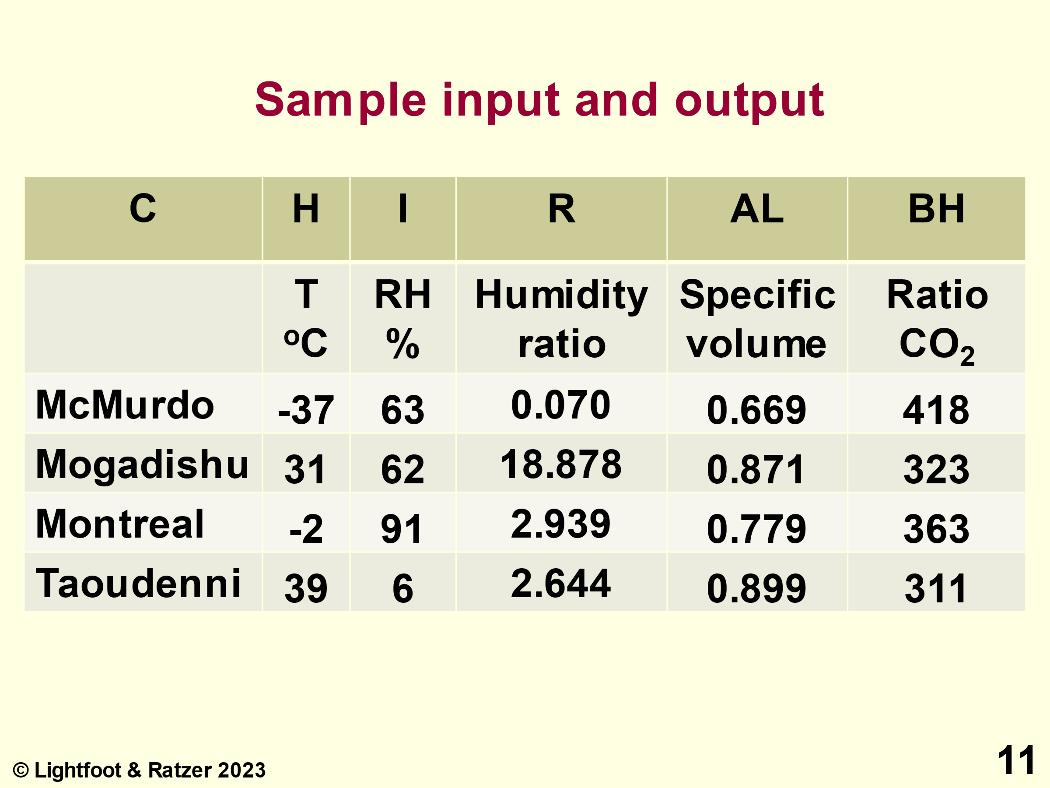
Slide 11: Sample of input and output. Columns C, H and I are input to the Humidair psychrometric program. Columns R, AL, and BH are output. With McMurdo as the base, Mogadishu's molecules per cubic meter are (418 x (0.669/0.871) = 323, as calculated from the specific volume. The difference in the weight of CO2 molecules is necessary for calculating the difference in heat content (enthalpy) and, hence, the temperature difference between the 240 points.
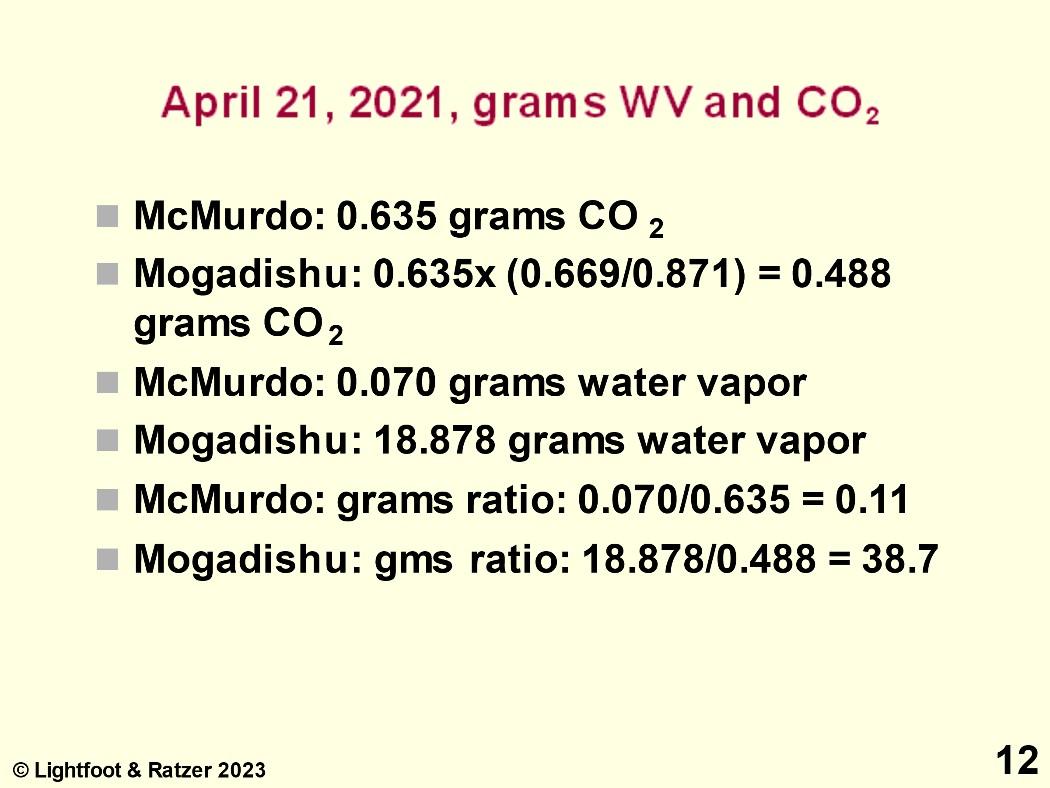
Slide 12: April 21, 2021, grams WV and CO2. Using the specific volume from the previous slide, CO2 at Mogadishu is ((0.635 x (0.669/0.871)) = 0.488 grams per kg of dry air. The ratio of grams of water vapor to grams of CO2 at McMurdo in Antarctica is (0.070/0.635) = 0.11. In Mogadishu on the Equator, the ratio is (18.878/0.488) = 38.7 grams of water vapor per kg of dry air.
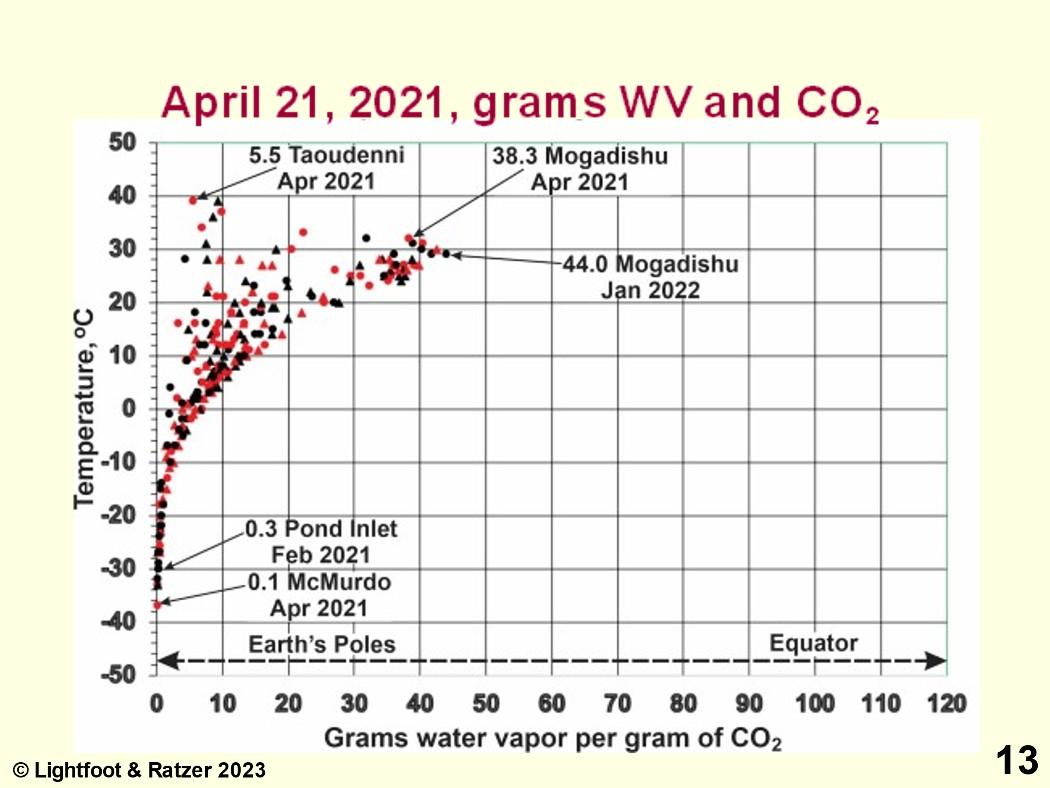
Slide 13: April 21, 2021, grams WV and CO2. We plot the grams of water vapor per gram of CO2 for 240 measurements. They range from 0.1 to 44.0.
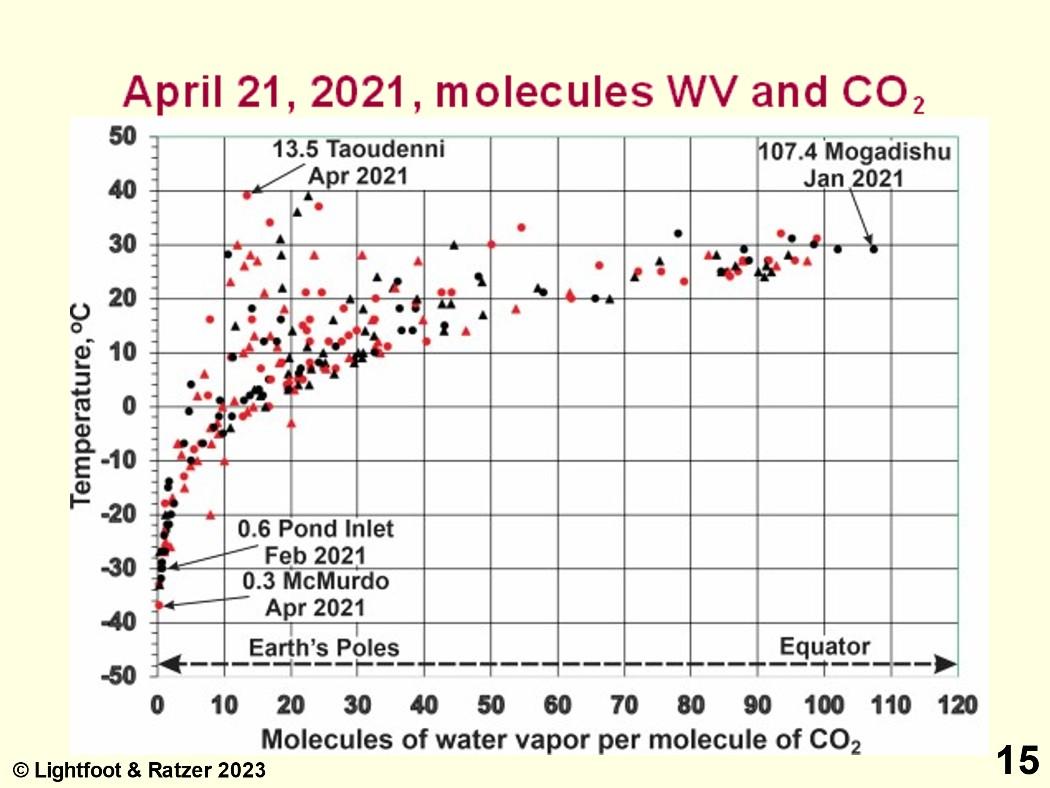
Slide 15: April 21, 2021, molecules WV and CO2. Here is the plot of molecules. It is from 0.3 to 107.4 molecules of water vapor per molecule of CO2 Except sometimes in the wintertime at the Poles, the number of water vapor molecules always overwhelms the number of CO2 molecules.
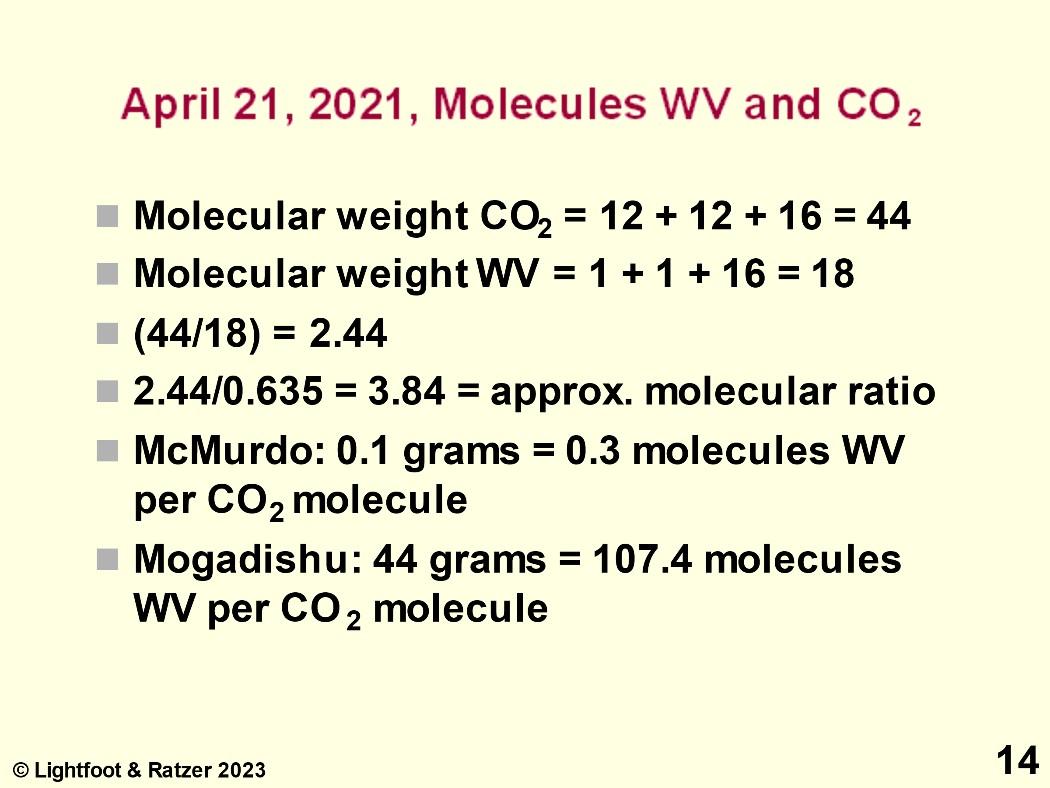
Slide 14: April 21, 2021, grams WV and CO2. We convert the grams to molecules by the ratio of the molecular weights because it is molecules that are of interest. The molecular weight of CO2 is 44, and that of water is 18. The ratio is 2.44. Therefore, multiply 0.1 grams of water per kg of dry air by 2.44 to obtain 0.3 molecules per kg of dry air in McMurdo. Similarly, get 107.4 molecules per kg of dry air at Mogadishu.
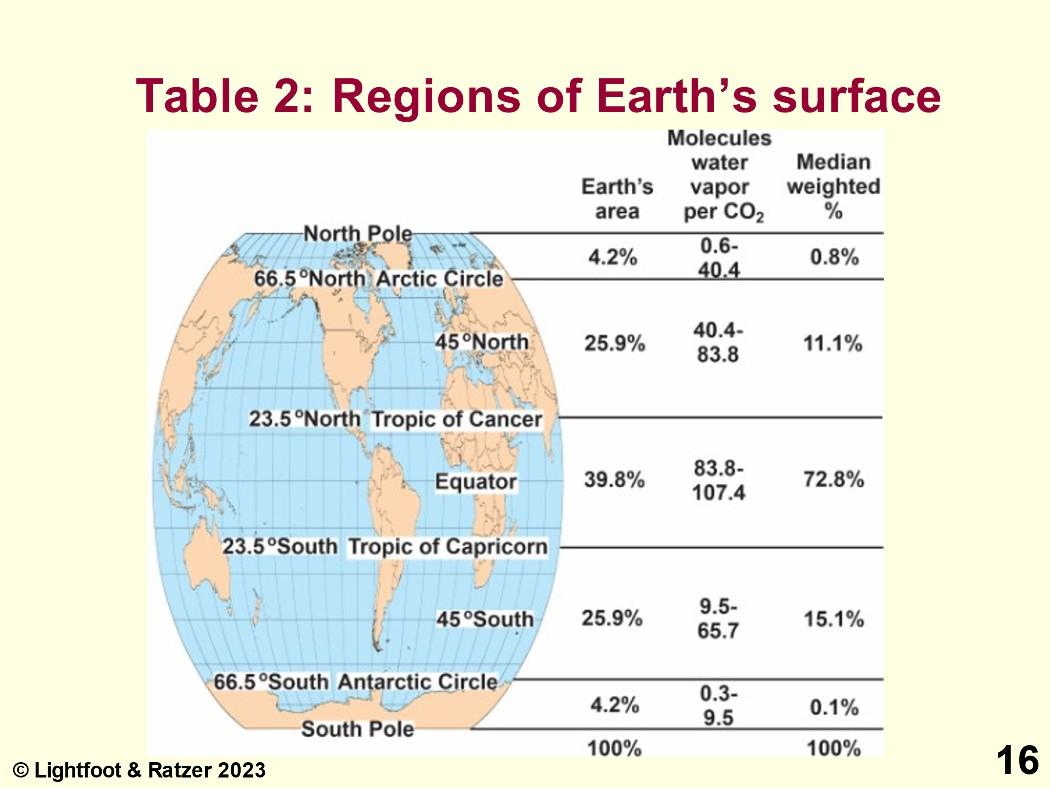
Slide 16: Table 2: Regions of Earth’s surface. The regions of the Earth figure shows that about threequarters of the Earth’s water vapor is in the 39.8% of the Earth’s area represented by the Tropics. Less than 1% is in the Polar regions. The remaining half of the site has one-quarter of the water vapor.
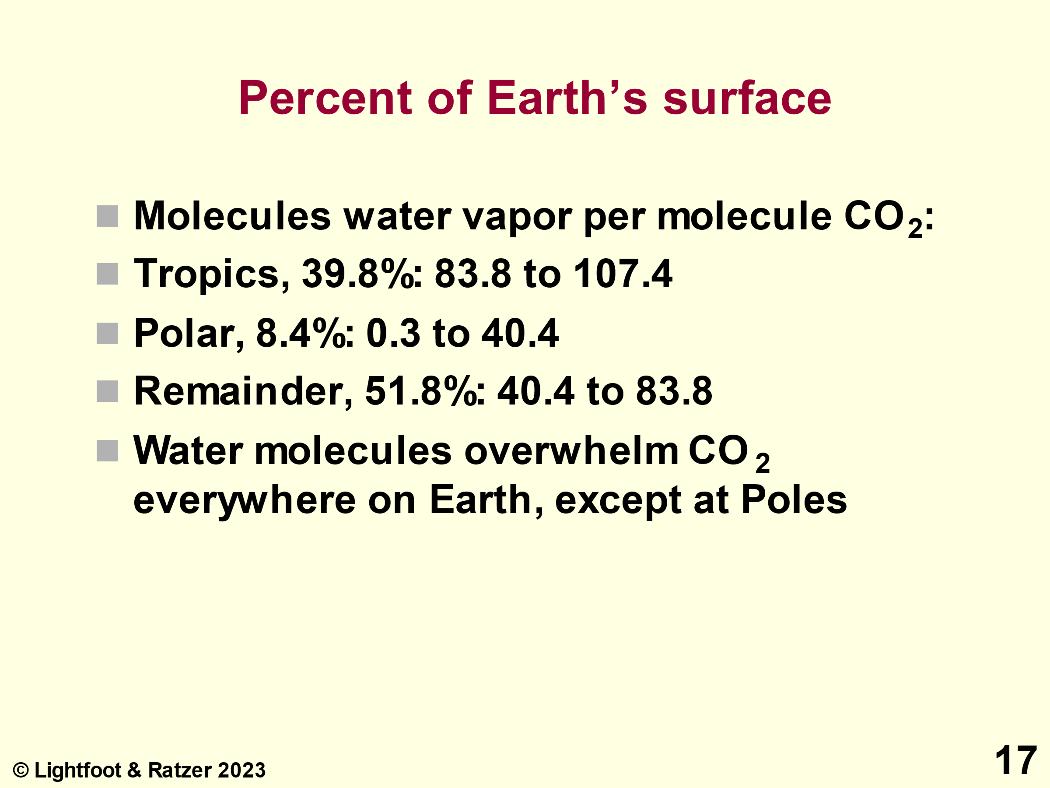
Slide 17: Percent of Earth’s surface. The text on the previous slide is small. Here is an easier-to-read version. The tropics are warm because there is always much more water vapor.
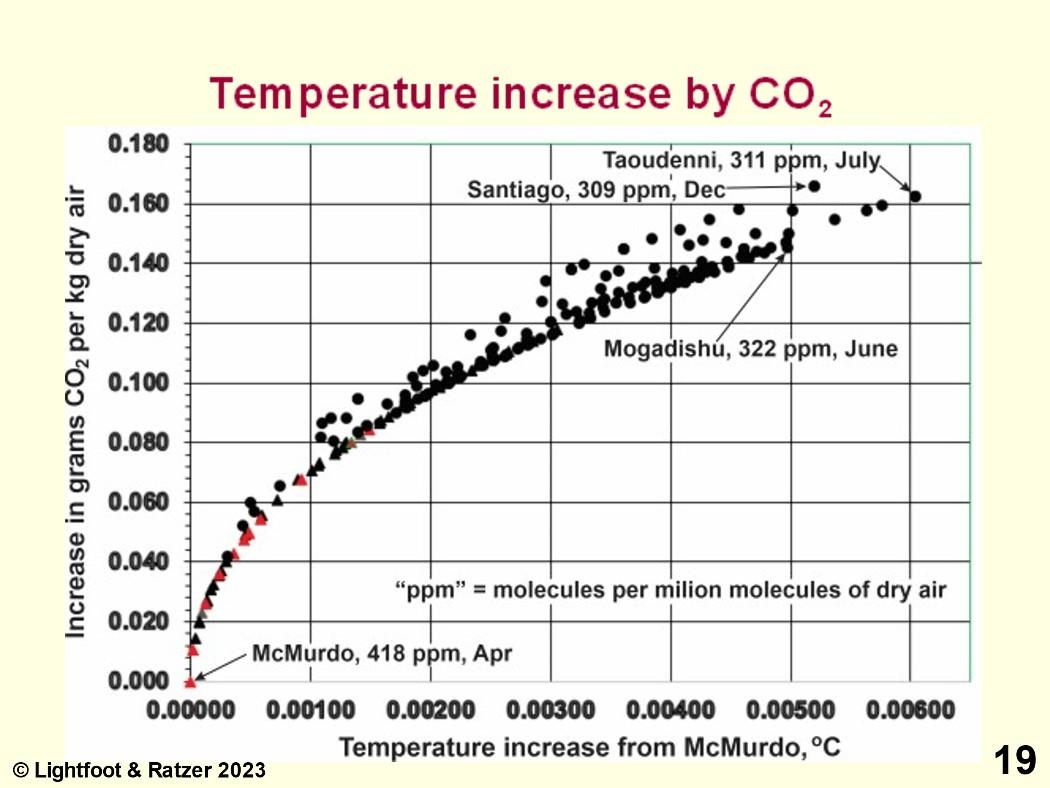
Slide 19: Temperature increase by CO2. The minor temperature increase by CO2 is in the Polar regions —black and red triangles. The maximum temperature rise by CO2 is 0.006oC in Taoudenni in the Sahara Desert. It is too small to measure.
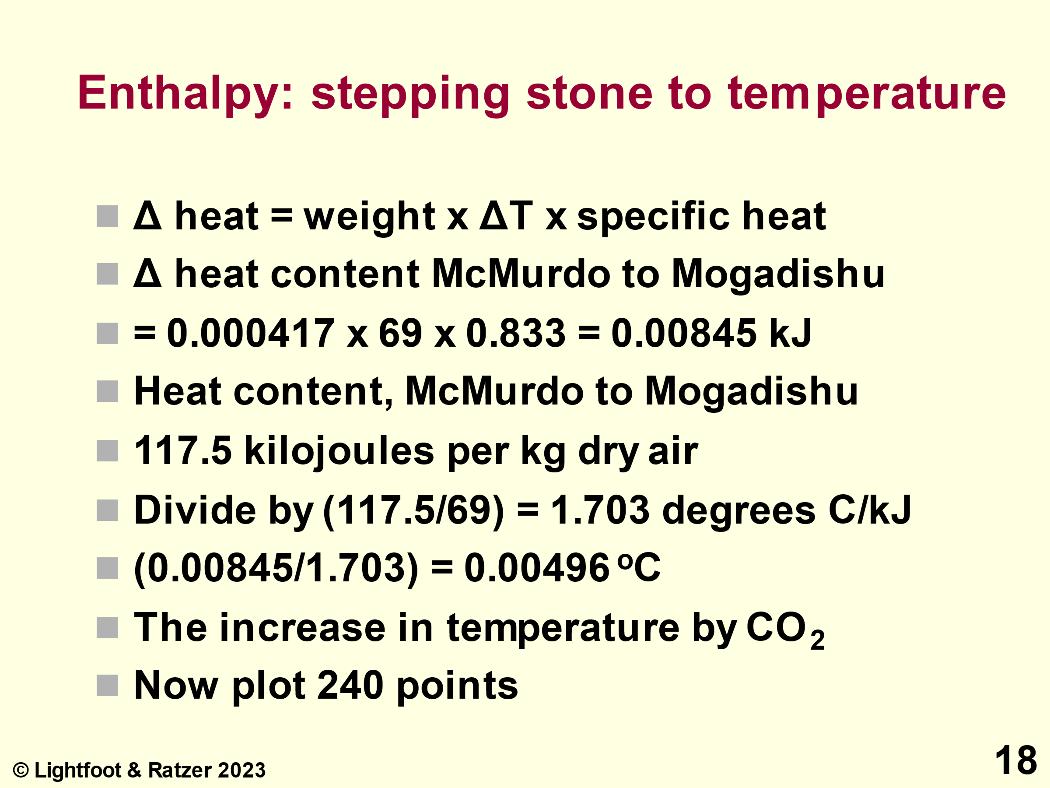
Slide 18: Enthalpy: stepping stone to temperature. Enthalpy is the heat content measured in kilojoules (kJ). If we know the weight of CO2, the temperature change, and the specific heat, we can calculate the change in heat content, 0.00845 kJ. The difference in heat content between McMurdo and Mogadishu is 117.5 kJ, which causes 69oC, or 1.703 kJ per degree C. The temperature increase is (0.008451/1.703) =0.00496oC. This value is too small to measure. Now we plot 240 points over a year.
Slide 20: Conclusions. A rise in CO2 from 311 to 418 molecules of CO2 per million molecules of dry air raises Earth’s temperature by a maximum of 0.006oC, an amount too small to measure. IPCC climate models rely on warming by CO2 and thereby give erroneous results. Water vapor overwhelms CO2 everywhere except sometimes In the Polar regions in wintertime.
Slide 21: Discussion. The fear of rising levels of CO2 in the atmosphere promoted by the IPCC is a mistake by their scientists. The IPCC needs to correct the error and fix it. Their mistake is hurting people.
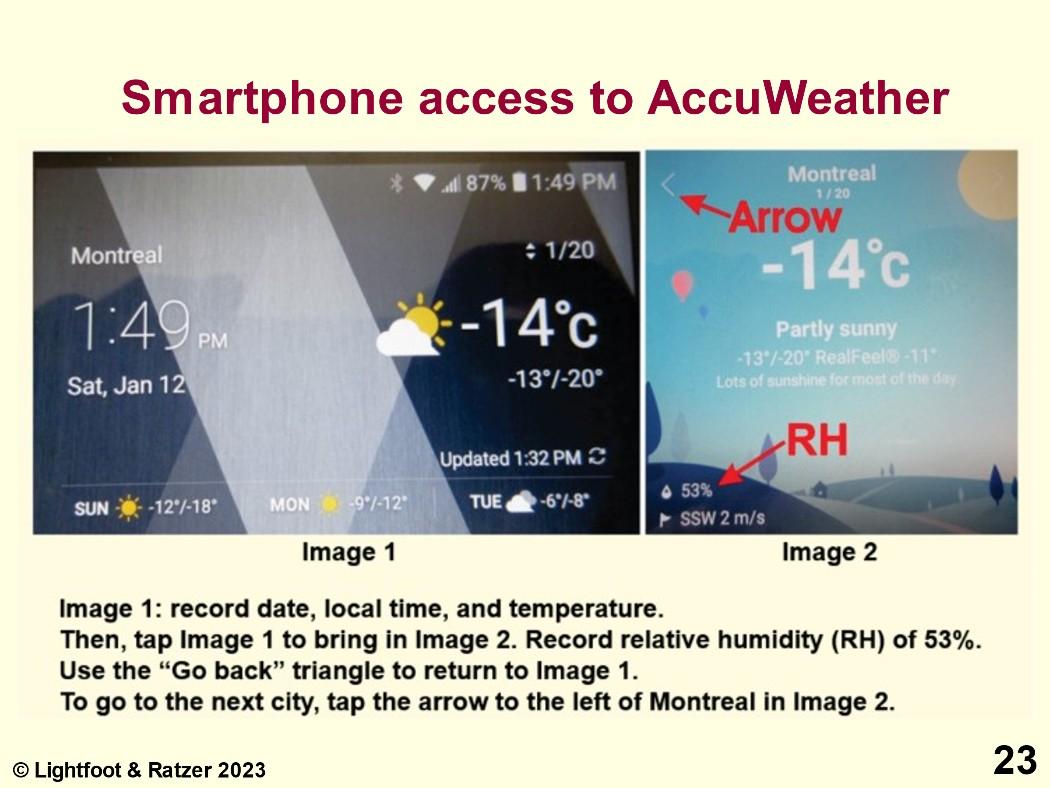
Slide 23: Smartphone access to AccuWeather. Follow the instructions below the figure.
Slide 22: Excel calculations. The Excel calculations are separate supplementary information and have the details.

Slide 24: References. The basis for this presentation is Reference [1]: Back radiation versus CO2 as the cause of climate change. It extends the study and presents new information.