
Link:
https://en.wikipedia.org/wiki/U.S._state_and_territory_temperature_ext remes
Please see link above for source text
U.S. state and territory temperature extremes
From Wikipedia, the free encyclopedia
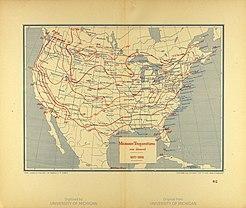
Minimum temperature map of the United States from 1871–1888
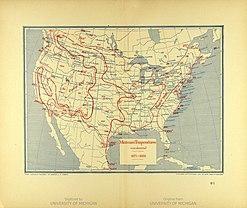
Maximum temperature map of the United States from 1871–1888
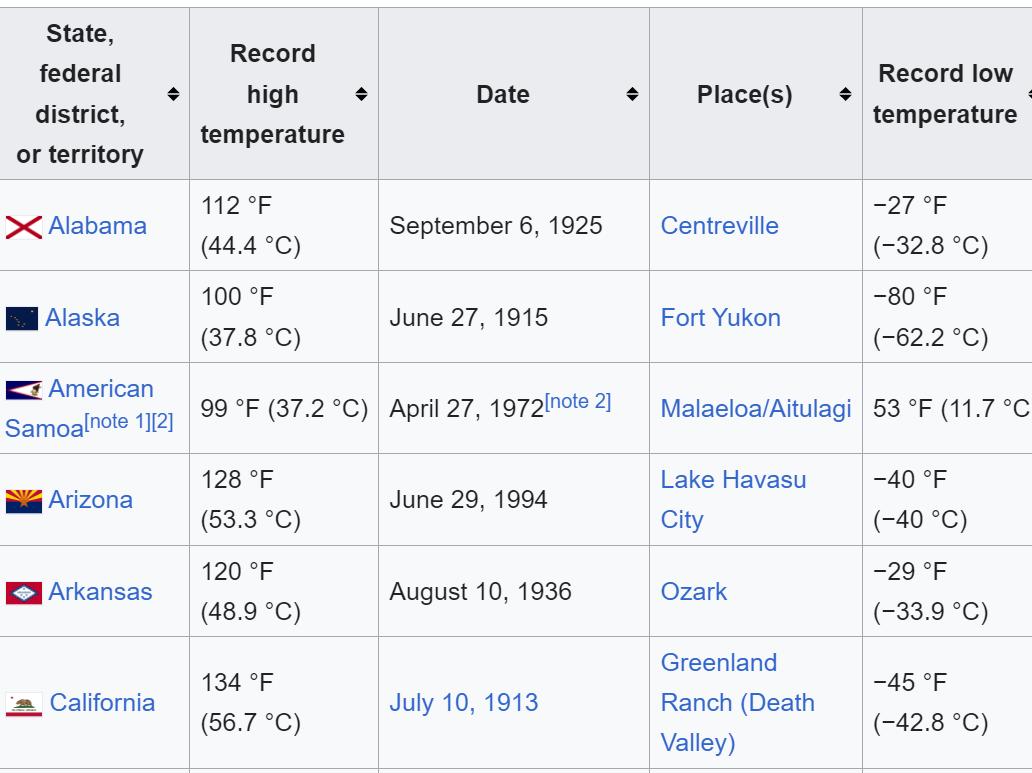
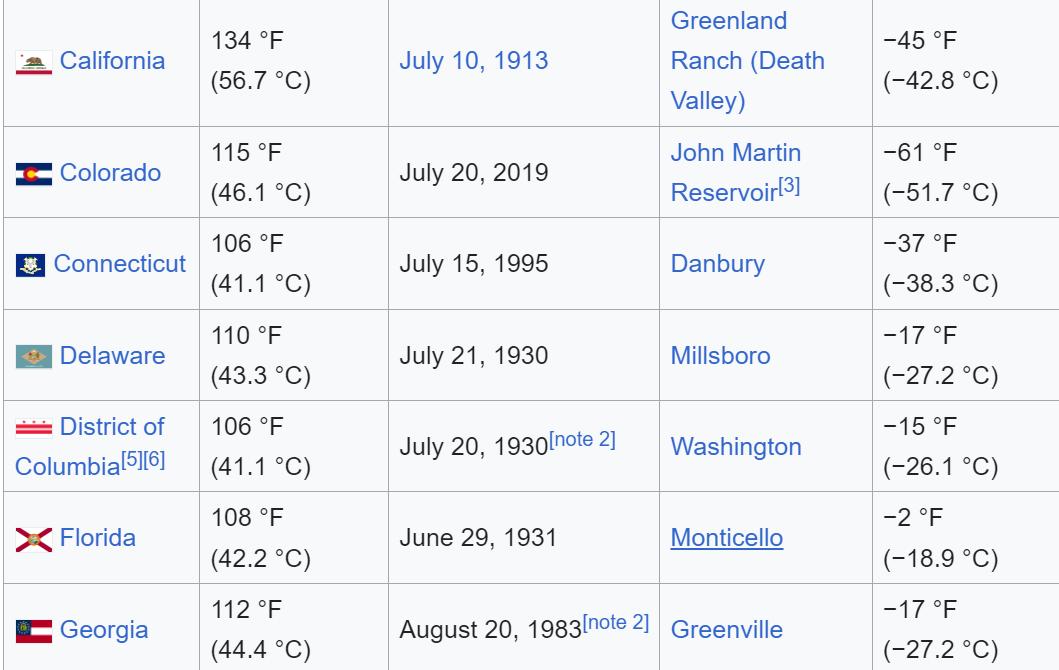
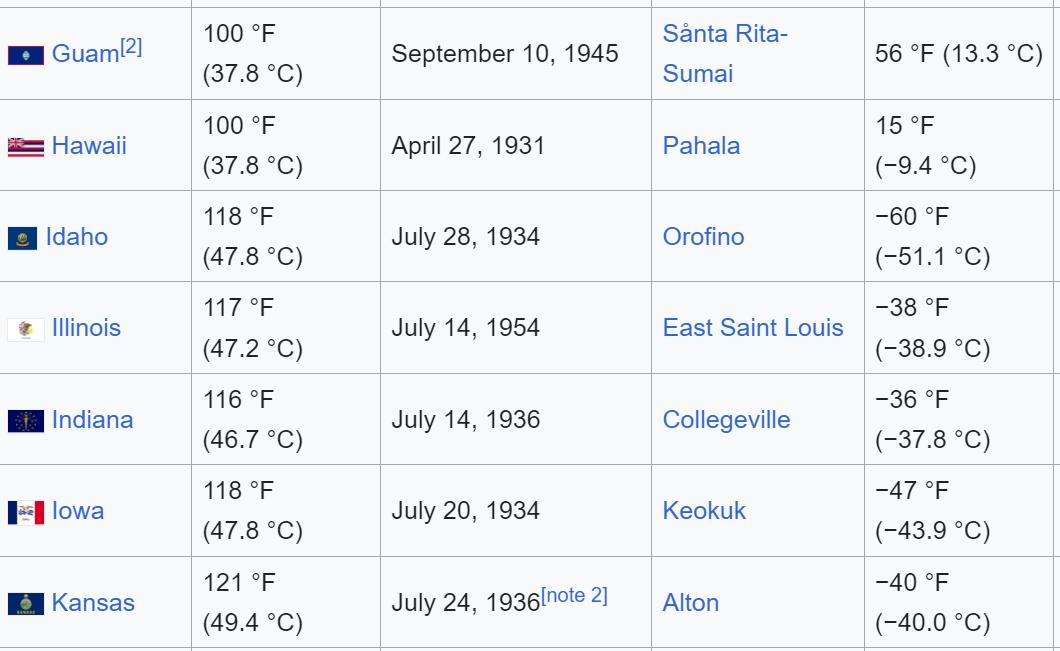
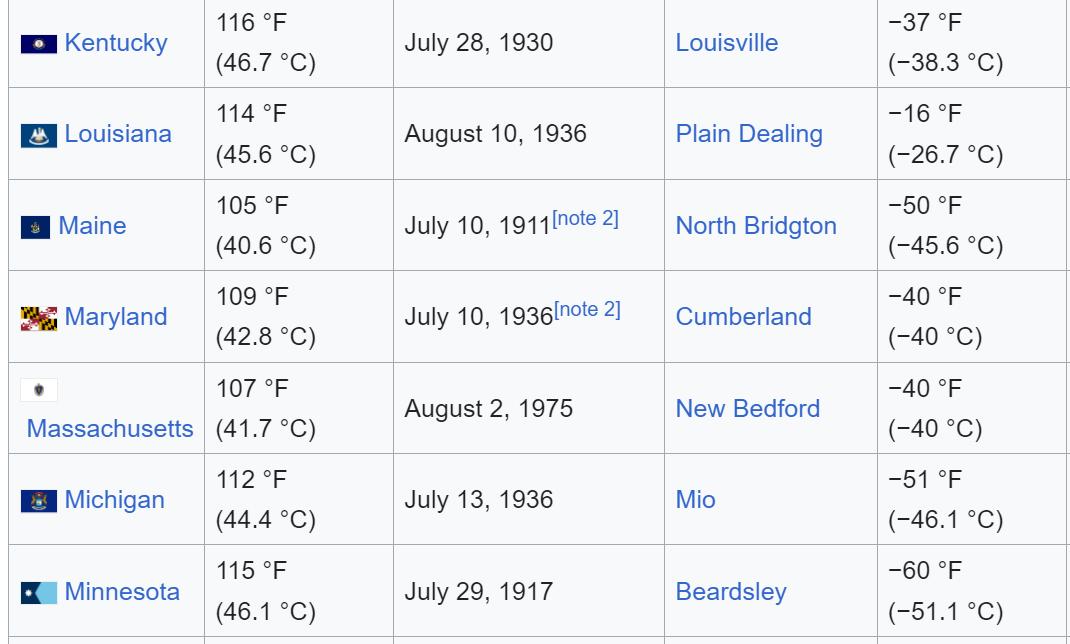
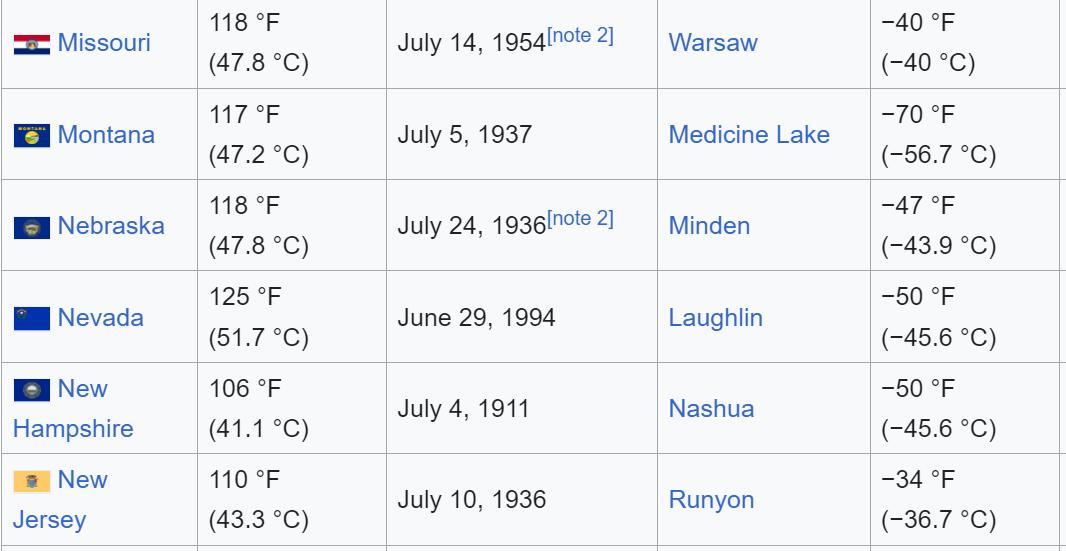
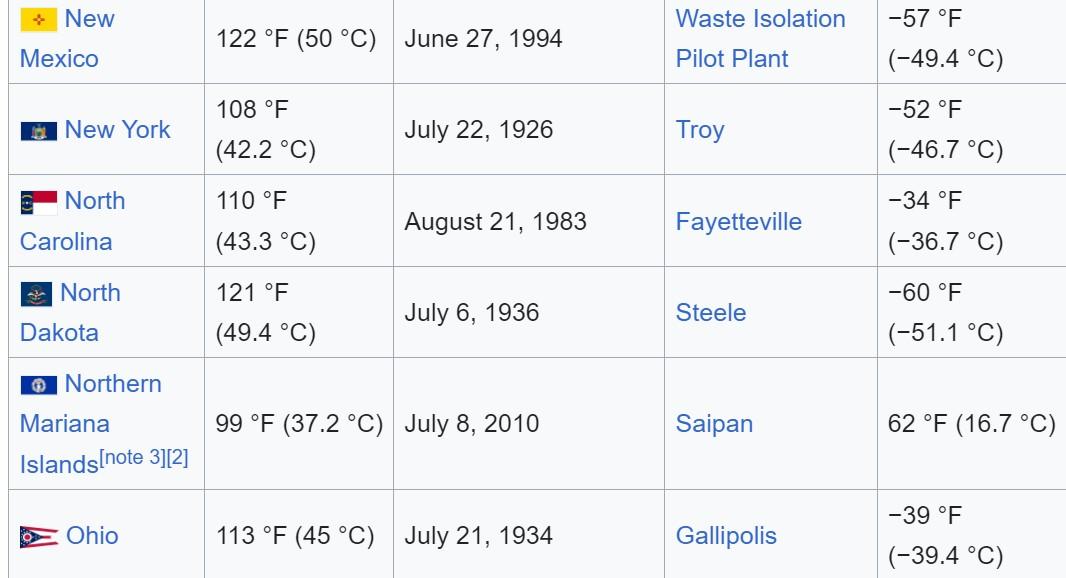
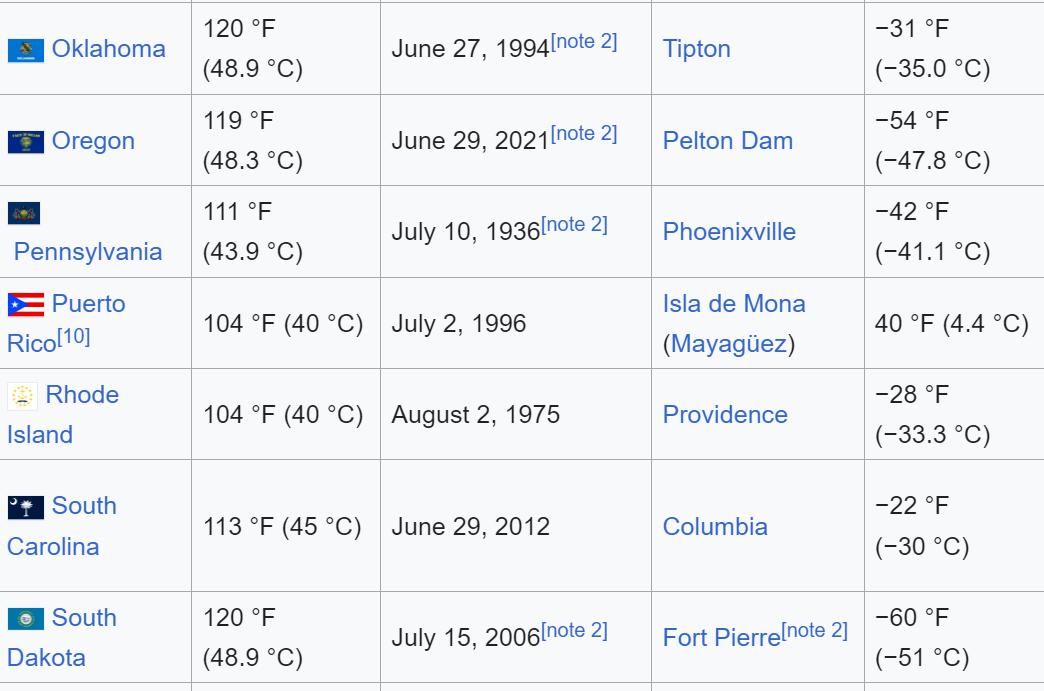
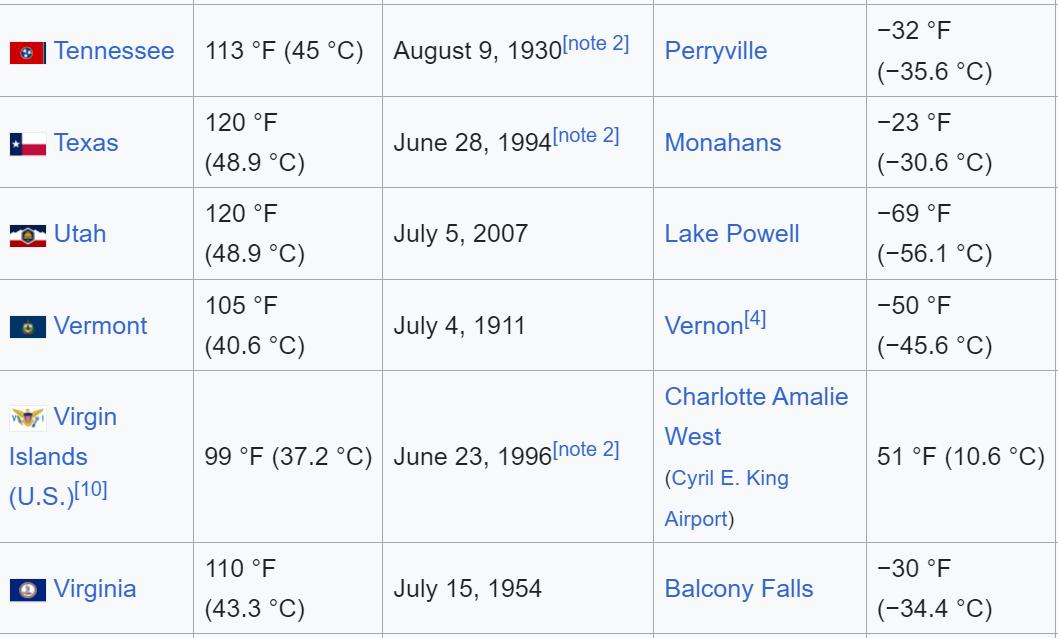
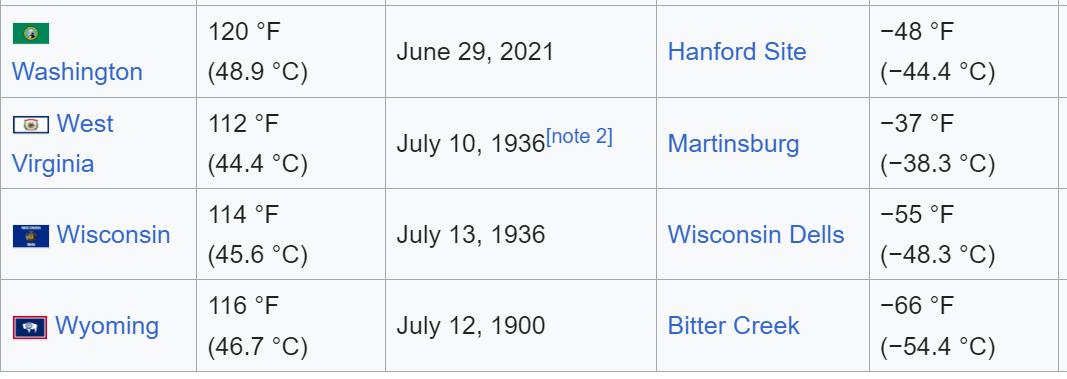
The following table lists the highest and lowest temperatures recorded in the 50 U.S. states, the District of Columbia, and the 5 inhabited U.S. territories during the past two centuries, in both Fahrenheit and Celsius.[1] If two dates have the same temperature record (e.g. record low of 40 °F or 4.4 °C in 1911 in Aibonito and 1966 in San Sebastian in Puerto Rico), only the most recent date is shown.
Extreme temperatures for each U.S. state and territory[edit]
Unreferenced data assumed to be from NOAA
See also[edit]
● Canadian provincial and territorial temperature extremes
● February 2023 North American cold wave — Mount Washington in New Hampshire experienced a record breaking wind chill of −108 °F (−78 °C).[12]
Notes[edit]
● ^ These are the temperature extremes for Tutuila Island. Temperature extremes for other parts of American Samoa, such as the Manua Islands ʻ , are unavailable.
● ^
● Jump up to:
●
u v w Also on earlier date or dates in that state or territory
● ^ These are the temeperature extremes for Saipan, Tinian and Rota. Temperature extremes for the Northern Islands Municipality are unavailable.
References[edit]
● ^ National Climatic Data Center. "State Climate Extremes Committee (SCsEC)". Retrieved February 14, 2015.
● ^
● Jump up to:
● a b c http://scacis.rcc-acis.org/ SC ACIS (Applied Climate Information System). NOAA Regional Climate Centers. Retrieved September 5, 2019.
● ^ Sakas, Michael (October 4, 2019). "It's Official, Colorado's 'Wild Weather Year' Sets New High Temp And Hailstone Records". Retrieved October 5, 2019.
● ^
● Jump up to:
● a b c d e Christopher C. Burt. "Some Errors in the NCDC U.S.A. State Weather Extreme Records Data: Part 2". wunderground.com. Archived from the original on October 12, 2015.
● ^ Samenow, Jason (June 29, 2012). "Washington, D.C. shatters all-time June record high, sizzles to 104". The Washington Post. Archived from the original on March 26, 2023.
● ^ https://web.archive.org/web/20101231041158/http://www.erh .noaa.gov/lwx/winter/DC-Winters.htm Watson, Barbara
●
●
McNaught (November 17, 1999). "Washington Area Winters". National Weather Service. Archived from the original on December 31, 2010.
^ Christopher C. Burt. "Some Errors in the NCDC U.S.A. State Weather Extreme Records Data: Part 1". wunderground.com. Archived from the original on October 12, 2015.
^ "Memorandum — Illinois State Record Minimum Temperature at Mt. Carroll" (PDF). NCDC. Retrieved March 7, 2019.
●
^ "UNITED STATES EXTREME RECORD TEMPERATURES & DIFFERENCES. Golden Gate Weather Services. Published 2014. Accessed 19 February 2019".
● ^
● Jump up to:
● a b https://www.weather.gov/sju/climo_extremes NOAA. National Weather Service. All Time Extremes for PR and VI. Retrieved September 5, 2019.
● ^ "Peter Sinks Temperature Monitoring". Utah Climate Center. Retrieved February 20, 2018.
● ^ Cappucci, Matthew (February 4, 2023). "'Historic Arctic outbreak' crushes records in New England". The Washington Post. Archived from the original on March 30, 2023.
External links[edit]
● NOAA Satellite and Information Service, National Climatic Data Center
● NOAA Website — Weather Extremes
● NOAA Website — Record Highest/Lowest Temperatures by State show
● V
● T
● E
United States state-related lists show