Energy and the Environment
James A. FayOXFORD UNIVERSITY PRESS
Dan S. Golomb

MIT-PAPPALARDO SERIESIN MECHANICAL ENGINEERING
SeriesEditors:ROHAN C.ABEYARATNEAND NAM P.SUH
ENERGYANDTHE ENVIRONMENT
JamesA.FayandDanS.Golomb
AXIOMATIC DESIGN:ADVANCESAND APPLICATIONS
NamP.Suh
JamesA.Fay
DepartmentofMechanicalEngineering MassachusettsInstituteofTechnology
DanS.Golomb
DepartmentofEnvironmental,Earth,andAtmosphericSciences UniversityofMassachusettsLowell
OxfordUniversityPress
OxfordNewYork
AthensAucklandBangkokBogot´aBuenosAiresCapeTown ChennaiDaresSalaamDelhiFlorenceHongKongIstanbulKarachi KolkataKualaLumpurMadridMelbourneMexicoCityMumbaiNairobi
ParisS˜aoPauloShanghaiSingaporeTaipeiTokyoTorontoWarsaw
andassociatedcompaniesin
BerlinIbadan
Copyright©2002MIT
PublishedbyOxfordUniversityPress,Inc.
198MadisonAvenue,NewYork,NewYork,10016
http://www.oup-usa.org
OxfordisaregisteredtrademarkofOxfordUniversityPress
Allrightsreserved.Nopartofthispublicationmaybereproduced, storedinaretrievalsystem,ortransmitted,inanyformorbyanymeans, electronic,mechanical,photocopying,recording,orotherwise, withoutthepriorpermissionofOxfordUniversityPress.
Fay,JamesA.
Energyandtheenvironment/JamesA.Fay,DanS.Golomb. p.cm.—(TheMIT-PappalardoSeriesinMechanicalEngineering) Includesbibliographicalreferencesandindex.
ISBN0-19-515092-9
1.Powerresources—Environmentalaspects.I.Golomb,D.II.Title.III.Series. TD195.E49F392002
333.79′14–dc21
2001036249
Printingnumber:987654321
PrintedintheUnitedStatesofAmerica onacid-freepaper
This page intentionally left blank
In1996,theMITDepartmentofMechanicalEngineeringadoptedanewundergraduatecurriculumtoenhancethelearningprocessofitsstudents.Inthisnewcurriculum,keyconceptsof engineeringaretaughtinfourintegratedsequences:thethermodynamics/heattransfer/fluidmechanicssequence,themechanics/materialssequence,thedesign/manufacturingsequence,andthe systems/dynamics/controlsequence.Ineachoneofthefoursequences,thebasicprinciplesare presentedinthecontextofrealengineeringproblemsthatrequiresimultaneoususeofallbasic principlestosolveengineeringtasksrangingfromsynthesistoanalysis.Activelearning,including hands-onexperience,isakeyelementofthisnewcurriculum.
Tosupportnewinstructionalparadigmsofthecurriculum,thefacultybeganthedevelopment ofteachingmaterialssuchasbooks,softwareforweb-basededucation,andlaboratoryexperiments. ThiseffortatMITispartiallyfundedbytheNeilandJanePappalardofund,agenerousendowment createdatMITinsupportofthisprojectbythePappalardos.Mr.NeilPappalardo,analumnusof MIT,isthefounderandCEOofMedicalTechnologyInformation,Inc.,andMrs.JanePappalardo isagraduateofBostonUniversity,activeinmanycivicfunctionsofMassachusetts.
OxfordUniversityPressandMIThavecreatedtheMIT-PappalardoSeriesinMechanical EngineeringtopublishbooksauthoredbyitsfacultyunderthesponsorshipofthePappalardo fund.Allthetextbookswrittenforthecoresequences,aswellasotherprofessionalbooks,willbe publishedunderthisseries.
Thisvolume, EnergyandtheEnvironment byJamesA.FayandDanS.Golomb,differsfrom theothersinthatitisnotitselfasubjectinthecorecurriculum.Instead,itisanupper-level subjectthatdrawsuponthedynamics,fluidmechanics,thermodynamics,heattransfer,andrelated sciencesofthecorecurriculum.Whileexposingthestudenttoasocietalproblemofgreatcurrent concern—namely,theuseofenergyandthelocal,regional,andglobalenvironmentaleffectsthat useengenders—itutilizescorecurriculumskillsindescribingandanalyzingthemoderntechnology beingusedtoamelioratetheseadverseenvironmentaleffects.Itenablesthestudenttointegrate thisunderstandingintoanappreciationofboththetechnologyandsciencethatmustbeemployed bynationstomaintainalivableenvironmentwhileprovidingimprovedeconomiccircumstances fortheirpopulations.
EnergyandtheEnvironment providesmanyprovocativeexamplesofadvancingastudent’s skillsinengineeringfundamentals.Calculatinghowmuchpowerisneededtopropelanautomobile, howmechanicalpowercanbeextractedfromthedynamicalmotionofthewindoroceanwavesand thepullofgravityonriverflowsandtidalmotions,howfuelcellsandbatteriesgenerateelectric powerfromchemicalreactions,howpowercanbegeneratedbythecombustionoffossilfuels inconventionalpowerplants,andhowgaseousatmosphericcontaminantscanchangetheearth’s
temperaturerequiresintegrationoftheunderstandingachievedincorestudies.Equallyimportant isthequantitativeunderstandingofthecontaminationoftheatmosphereandsurfacewatersbythe toxicbyproductsofenergyuse,theireffectsuponhumanhealthandnaturalecologicalsystems, andhowtheseeffectscanbeamelioratedbyimprovementsinthetechnologyofenergyuse. Weexpectthattheadditionofthisvolumetotheothersofthisserieswillexpandthestudent’s understandingoftheroleofmechanicalengineeringinmodernsocieties.
RohanC.Abeyaratne
NamP.Suh
Editors
MIT-PappalardoSeries
Theimpetusforcreatingthisbookwasprovokedbyoneofus(DSG)asaconsequenceoflecturingon thesubjectofenergyandtheenvironmentforthepast10yearsattheUniversityofMassachusetts LowelltostudentsintheCollegesofEngineeringandArtsandSciences.Inallthoseyearsa diligentsearchdidnotunearthasuitabletextbooktomatchthesyllabusofthatcourse.Tobe sure,numeroustextsexistonthesubjectsofenergy,energysystems,energyconversion,energy resources,andfossil,nuclear,andrenewableenergy.Also,therearetextsonairpollutionandits control,effluentsandsolidwastefromenergyminingandusage,thegreenhouseeffect,andsoon. However,wewereunabletofindacontemporarytextthatdiscussesonadeepertechnicallevelthe relationshipbetweenenergyusageandenvironmentaldegradationorthatdiscussesthemeansand waysthatefficiencyimprovements,conservation,andshiftstolesspollutingenergysourcescould leadtoahealthierandsaferenvironment.
Ourbookisintendedforupper-levelundergraduateandgraduatestudentsandforinformed readerswhohavehadasoliddoseofscienceandmathematics.Whilewedotrytorefreshthe student’sandreader’smemoryonsomefundamentalaspectsofphysics,chemistry,engineeringandgeophysicalsciences,wearenotbashfulaboutusingsomeadvancedconcepts,theappropriatemathematicallanguage,andchemicalequations.Eachchapterisaccompaniedbya setofnumericalandconceptualproblemsdesignedtostimulatecreativethinkingandproblem solving.
Chapter1isageneralintroductiontothesubjectofenergy,itsuse,anditsenvironmental effects.Itisapreviewofthesubsequentchaptersandsetsthecontextoftheirdevelopment.
InChapter2wesurveytheworld’senergyreservesandresources.Wereviewhistorictrends ofenergyusageandestimatesoffuturesupplyanddemand.Thisisdoneglobally,bycontinentand country,byenergyusesector,andbyproportiontopopulationandgrossdomesticproduct.The inequalitiesofglobalenergysupplyandconsumptionarediscussed.
Chapter3isarefresherofthermodynamics.Itreviewsthelawsthatgoverntheconversionof energyfromoneformtoanother—thatis,thefirstandsecondlawsofthermodynamicsandthe conceptsofwork,heat,internalenergy,freeenergy,andentropy.Specialattentionisgiventothe combustionoffossilfuels.Variousidealthermodynamiccyclesthatinvolveheatorcombustion enginesarediscussed—forexample,theCarnot,Rankine,Brayton,andOttocycles.Also,advanced andcombinedcyclesaredescribed,aswellasnonheatenginessuchasthefuelcell.Theprinciples oftheproductionofsyntheticfuelsfromfossilfuelsaretreated.
Thegenerationandtransmissionofelectricalpower,aswellasthestorageofmechanicaland electricalenergy,arecoveredinChapter4.Electrostatic,magnetic,andelectrochemicalstorageof electricalenergyistreated,alongwithvariousmechanicalenergystoragesystems.
Thegenerationofelectricityinfossil-fueledpowerplantsisthoroughlydiscussedinChapter 5.Thecompleteworkingsofafossil-fueledpowerplantaredescribed,includingfuelstorage andpreparation,burners,boilers,turbines,condensers,andgenerators.Specialemphasisisplaced onemissioncontroltechniques,suchasparticulatemattercontrolwithelectrostaticprecipitators, sulfuroxidecontrolwithscrubbers,andnitricoxidecontrolwithlow-NOx burnersandfluegas denitrification.Alternativecoal-firedpowerplantsarediscussed,suchasfluidizedbedcombustion andcoalgasificationcombinedcycle.
InChapter6wedescribeelectricitygenerationinnuclear-fueledpowerplants.Herewereviewthefundamentalsofnuclearenergy:atoms,isotopes,thenucleusandelectrons,protonsand neutrons,radioactivity,nuclearstability,fission,andfusion.Thenuclearfuelcycleisdescribed, includingmining,purification,enrichment,fuelrodpreparation,andspentfuel(radioactivewaste) disposal.Theworkingsofnuclearreactorsarediscussed,includingcontrolrods,moderators,and neutroneconomy,aswellasthedifferentreactortypes:boilingwater,pressurizedwater,andbreeder reactors.
TheprinciplesofrenewableenergyutilizationareexplainedinChapter7.Thisincludeshydropower,biomass,geothermal,solarthermalandphotovoltaic,wind,tidal,oceanwave,and oceanthermalpowerproduction.Attentionisgiventothecapacityfactorandcapitalcostofthese systems.
Chapter8isdevotedprincipallytotheautomobile,becauseroadvehiclesconsumeroughly one-thirdofallprimaryenergyandalsobecausethetransportationofpeopleandgoodsisso dependentuponthem.Thecharacteristicsoftheinternalcombustionenginearedescribed,forboth gasolineanddieselengines.Theimportanceofvehiclecharacteristicsforvehiclefuelefficiency isstressed.Electricdrivevehiclesaredescribed,includingbattery-poweredandhybridvehicles. Vehicleemissionsareexplained,andthetechnologyforreducingthemisdescribed.
AsurveyoftheenvironmentaleffectsoffossilfuelusagebeginsinChapter9.Inthischapter wediscussurbanandregionalairpollution,thetransportanddispersionofparticulatematter,sulfur oxides,nitrogenoxides,carbonmonoxide,andothertoxicpollutantsfromfossilfuelcombustion, andtheeffectsofthesepollutantsonhumanhealth,biota,materials,andaesthetics.Thephenomena ofphotochemicalsmog,aciddepositionandregionalhazearealsodescribed.Alsotreatedarethe impactsofenergyusageonwaterandland.
Chapter10continuesthesurveyofenvironmentaleffectsoffossilfuelcombustionwithparticularreferencetoglobalclimatechangeresultingfromanthropogenicenhancementofthegreenhouse effect.Herewediscussthecarbondioxideemissiontrendsandforecast,theglobalcarboncycle, andtheuptakeofCO2 bytheoceansandbiota.Thephysicsofthegreenhouseeffectisdescribedin somedetail,aswellasthepredictedconsequencestotheplanetanditsinhabitantsifCO2 emissions continueunabated.
WeconcludewithChapter11,areemphasisoftheimportantrelationshipsamongthescience, technology,andeconomicsofenergyusageanditsenvironmentaleffects.Wenotethelimited successofregulationofurbanandregionalairpollutioninindustrializednations,andwealsonote thegreatchallengethatliesaheadindealingwithglobalclimatechange.
Finally,weincludeAppendixA,anexplanationofthescientificandengineeringunitsthatare commonlyusedinenergystudies,easingthetranslationfromonesettoanother.
Theauthorswishtoexpresstheirappreciationtocolleagueswhoaidedinthereviewofthe manuscript:JohnHeywood,WaiK.Cheng,andJasonMark.Ofcourse,theauthorsbearcomplete responsibilityfortheaccuracyofthistext.WealsothankGeorgeFisherforpreparingmanyofthe tablesandfigures.
JamesA.Fay
MassachusettsInstituteofTechnology
DanS.Golomb UniversityofMassachusettsLowell
This page intentionally left blank
Modernsocietiesarecharacterizedbyasubstantialconsumptionoffossilandnuclearfuelsneeded toprovidefortheoperationofthephysicalinfrastructureuponwhichthesesocietiesdepend:the productionoffoodandwater,clothing,shelter,transportation,communication,andotheressentialhumanservices.Theamountofthisenergyuseanditsconcentrationintheurbanareasof industrializednationshascausedtheenvironmentaldegradationofair-,water-andland-dependent ecosystemsonalocalandregionalscale,aswellasadversehealtheffectsinhumanpopulations. Recentscientificstudieshaveforecastpotentiallyadverseglobalclimatechangesthatwouldresult fromtheaccumulationofgaseousemissionstotheatmosphere,principallycarbondioxidefrom energyrelatedsources.Thisaccumulationisaggravatedbyanexpectedexpandingconsumption ofenergybothbyindustrializednationsandbydevelopingnationsseekingtoimprovetheliving standardsoftheirgrowingpopulations.Thenationsoftheworld,individuallyandcollectively,are undertakingtolimitthedamagetohumanhealthandnaturalecosystemsthatattendthesecurrent problemsandtoforestallthedevelopmentofevenmoresevereonesinthefuture.Butbecause thesourceoftheproblem,energyusage,issointimatelyinvolvedinnations’andtheworld’s economies,itwillbedifficulttoamelioratethisenvironmentaldegradationwithoutsomeadverse effectsonthesocialandeconomiccircumstancesofnationalpopulations.
Tocomprehendthemagnitudeofintensityofhumanuseofenergyincurrentnations,wemight compareitwiththeminimumenergyneededtosustainanindividualhumanlife,thatofthecaloric valueoffoodneededforahealthydiet.IntheUnitedStates,whichisamongthemostintensive usersofenergy,theaveragedailyfossilfuelusepercapitaamountsto56timesthenecessarydaily foodenergyintake.Ontheotherhand,inIndia,adevelopingnation,theenergyusedisonly3times thedailyfoodcalorieintake.U.S.nationalsexpend20timestheenergyusedbyIndiannationals, andtheirpercapitashareofthenationalgrossdomesticproductis50timesgreater.Evidently,the economicwell-beingofpopulationsiscloselytiedtotheirenergyconsumption.
Whenagriculturaltechnologybegantodisplacethatofthehunter–gatherersocietiesabout 10,000yearsago,activitiesotherthanacquiringfoodbecamepossible.Eventuallyothersources ofmechanicalenergy—thatofanimals,wind,andwaterstreams—weredeveloped,augmenting humanlaborandfurtherenhancingbothagriculturalandnonagriculturalpursuits.Asworldpopulationincreased,theamountofcropandpasturelandincreasedinproportion,permanentlyreplacing naturalforestandgrasslandecosystemsbylessdiverseones.Untilthebeginningoftheindustrial revolutionseveralcenturiesago,thiswasthemajorenvironmentalimpactofhumanactivities. Today,weareapproachingthelimitofavailablelandforagriculturalpurposes,andonlymore intensiveuseofitcanprovidefoodforfutureincreasesofworldpopulation.
Theindustrialrevolutiondrasticallychangedtheconditionsofhumansocietiesbymaking availablelargeamountsofenergyfromcoal(andlateroil,gas,andnuclearfuel)farexceedingthat availablefromthebiofuel,wood.Someofthisenergywasdirectedtoincreasingtheproductivity ofagriculture,freeingupalargesegmentofthepopulationforotherbeneficialactivities.Urban populationsgrewrapidlyasenergy-usingactivities,suchasmanufacturingandcommerce,concentratedthemselvesinurbanareas.Urbanpopulationandpopulationdensityincreased,whilethose ofruralareasdecreased.
Bythemiddleofthetwentiethcentury,nearlyallmajorcitiesoftheindustrializedworld experiencedhealth-threateningepisodesofairpollution,andtodaythistypeofdegradationhas spreadtotheurbanareasofdevelopingcountriesasaconsequenceofthegrowingindustrialization oftheireconomies.Predominantly,urbanairpollutionisaconsequenceoftheburningoffossilfuels withinandbeyondtheurbanregionitself.Thispollutioncanextendinsignificantconcentrations toruralareasatsomedistancefromthepollutantsourcessothatpollutedregionsofcontinental dimensionsevenincludelocationswherethereisanabsenceoflocalenergyuse.
Despitetheseverityofurbanpollution,itistechnicallypossibletoreduceittoharmlesslevels bylimitingtheemissionofthosechemicalspeciesthatcausetheatmosphericdegradation.The principalpollutantscompriseonlyaverysmallfractionofthematerialsprocessedandcanbemade evensmaller,albeitatsomeeconomiccost.Inindustrializedcountries,thecostofabatingurban airpollutionisbutaminorsliceofanation’seconomicpie.
Whiletheindustrializednationsgrapplewithurbanandregionalairpollution,withsome success,anddevelopingnationslosegroundtotheintensifyinglevelsofharmfulurbanaircontamination,theglobalatmosphereexperiencesanuntemperedincreaseingreenhousegases,those pollutantsthatarethoughttocausetheaveragesurfaceairtemperaturetoriseandclimatetobe modified.Unliketheurbanpollutants,mostofwhichareprecipitatedfromtheatmospherewithin afewdaysoftheiremission,greenhousegasesaccumulateintheatmosphereforyears,evencenturies.Themostcommongreenhousegasiscarbondioxide,whichisreleasedwhenfossilfuels areburned.Asitisnotpossibletoutilizethefullenergyoffossilfuelswithoutformingcarbon dioxide,itwillbeverydifficulttoreducetheglobalemissionsofcarbondioxidewhilestillprovidingenoughenergytotheworld’snationsfortheimprovementoftheireconomies.Whilethereis technologyavailableorbeingdevelopedthatwouldmakepossiblesubstantialreductionsinglobal carbondioxideemissions,thecostofimplementationofsuchcontrolprogramswillbemuchlarger thanthatforcurbingurbanairpollution.
Thisbookdescribesthetechnologyandscientificunderstandingbywhichtheworld’snationscould amelioratethegrowingurban,regional,andglobalenvironmentalproblemsassociatedwithenergy usewhilestillprovidingsufficientenergytomeettheneedsofpopulationsforahumaneexistence. Itfocusesonthetechnologyandscience,thebaseonwhichanyeffectiveenvironmentalcontrol programmustbebuilt.Itdoesnotprescribecontrolprograms,becausetheymustincludesocial, economic,andpoliticalfactorsthatlieoutsidethescopeofthisbook.Wedonotdelvedeeplyinto thescienceandtechnology,butdoprovideanadequatedescriptionofthefundamentalprinciples andtheirconsequencestothetopicathand.Wepresentabibliographyineachchapterfortheuse ofthereaderwhowantstopursuesomeaspectsatgreaterdepth.
Themajorsourcesofenergyformodernnationsarefossilfuels,nuclearfuels,andhydropower. Non-hydrorenewableenergysources,suchasbiomass,wind,geothermal,solarthermal,and
photovoltaicpower,accountforonlyasmallportionofcurrentenergyproduction.Likeother mineraldeposits,fossilfuelsarenotdistributeduniformlyaroundtheglobe,butarefoundon continentsandtheirmarginsthatwereoncelocationsofgreatbiomassproduction.Theyneedtobe discoveredandremoved,andoftenprocessed,beforetheycanbeavailableforenergyproduction. Currentandexpecteddepositswouldappeartolastforafewcenturiesatcurrentconsumptionrates. Withinthetimehorizonofmostnationalplanning,thereisnoimpendingshortageoffossilfuel despitethecontinualdepletionofwhatisafiniteresource.Incontrast,renewableenergysourcesare notdepletable,beingsuppliedultimatelybythefluxofsolarinsolationthatimpingesontheearth.
Likefood,energyneedstobestoredandtransportedfromthetimeandplacewhereitbecomes availabletothatwhereitistobeused.Fossilandnuclearfuels,whichstoretheirenergyinchemical ornuclearformindefinitely,areoverwhelminglythepreferredformforstoringandtransporting energy.Electricalenergyiseasilytransmittedfromsourcetouser,butthereisnoelectricalstorage capabilityinthissystem.Hydropowersystemsstoreenergyforperiodsofdaystoyearsintheir reservoirs.Formostrenewableenergysources,thereisnoinherentstoragecapabilitysothey mustbeintegratedintotheelectricalnetwork.Manyformsofmechanicalandelectricalenergy storagearebeingdevelopedtoprovideforspecialapplicationswherestorageinchemicalformis notsuitable.Efficienttransformationofenergyfrommechanicaltoelectricalformisanessential factorofmodernenergysystems.
Althoughfossilfuelsmaybereadilyburnedtoprovideheatforspaceheating,cooking,orindustrialandcommercialuse,producingmechanicalorelectricalpowerfromburningfuelsrequired theinventionofpowerproducingmachines,beginningwiththesteamengineandsubsequently expandingtothegasolineengine,dieselengine,gasturbine,andfuelcell.Thescienceofthermodynamicsprescribesthephysicochemicalrulesthatgovernhowmuchofafuel’senergycanbe transformedtomechanicalpower.Whileperfectmachinescanconvertmuchofthefuel’senergy towork,practicalandeconomiconesonlyreturnbetweenaquarterandahalfofthefuelenergy. Nevertheless,thetechnologyisrichandcapableofbeingimprovedthroughfurtherresearchanddevelopment,butlargeincreasesinfuelefficiencyarenotlikelytobereachedwithoutaconsiderable costpenalty.
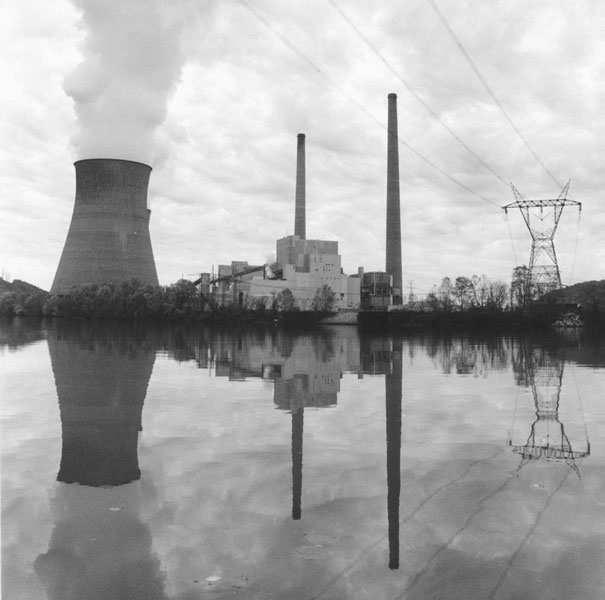
Initially,steamengineswereusedtopumpwaterfrommines,topowerknittingmills,and topropeltrainsandships.Startinginthelatenineteenthcentury,electricalpowerproducedby steamenginesbecamethepreferredmethodfordistributingmachinepowertodistantend-users. Bythetimeelectricitydistributionhadbecomeuniversal(supplyingmechanicalpower,light,and communicationsignals),thegenerationofelectricalpowerinsteampowerplantshadbecomethe largestsegmentofenergyuse.Currently,55%ofworldfossilfuelisconsumedinelectricpower plants.
Themodernfossil-fueledsteampowerplantisquitecomplex(seeFigure1.1).Itsprincipal components—theboiler,theturbine,andthecondenser—aredesignedtoachievemaximumthermal efficiency.Butthecombustionofthefuelproducesgaseousandsolidpollutants,amongwhichare thefollowing:oxidesofcarbon,sulfur,andnitrogen;soot;toxicmetalvapors;andash.Removing thesepollutantsfromthefluegasesrequirescomplexmachinery,suchasscrubbersandelectrostatic precipitators,thatincreasestheoperatingandcapitalcostofthepowerplantandconsumesasmall percentageofitselectricaloutput.Theremovedmaterialmustbedisposedsafelyinalandfill.But becauseofthesizeandtechnicalsophisticationoftheseplants,theyprovideamorecertainavenue ofimprovementincontrolthanwouldmanythousandsofsmallpowerplantsofequaltotalpower.
Nuclearpowerplantsutilizeasteamcycletoproducemechanicalpower,butsteamforthe turbineisgeneratedbyheattransferfromahotfluidthatpassesthroughthenuclearreactor,orby
directcontactwiththereactorfuelelements.Themaindisadvantageofanuclearpowerplant,which doesnotreleaseanyordinarypollutantstotheair,isthedifficultyofassuringthattheimmense radioactivityofitsfuelisneverallowedtoescapebyaccident.Nuclearpowerplanttechnologyis technicallyquitecomplexandexpensive.Theenvironmentalproblemsassociatedwithpreparing thenuclearfuelandsequesteringthespentfuelhavebecomeverydifficultandexpensivetomanage. IntheUnitedStates,alloftheseproblemsmakenewnuclearpowerplantsmoreexpensivethan newfossilfuelpowerplants.
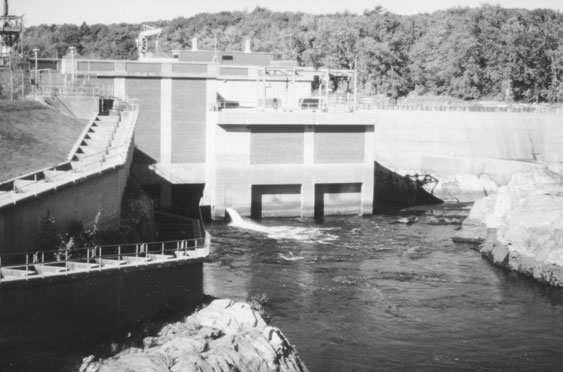
Renewableenergysourcesareofseveralkinds.Windturbinesandoceanwaveenergysystems converttheenergyofthewindandoceanwavesthatstreampastthepowerplanttoelectricalpower. Hydropowerandoceantidalpowerplantsconvertthegravitationalenergyofdammedupwaterto electricalpower(seeFigure1.2).Geothermalandoceanthermalpowerplantsmakeuseofastream ofhotorcoldfluidtogenerateelectricpowerinasteampowerplant.Asolarthermalpowerplant absorbssunlighttoheatsteaminapowercycle.Photovoltaicsystemscreateelectricitybydirect absorptionofsolarradiationonasemiconductorsurface.Biomass-fueledpowerplantsdirectly burnbiomassinasteamboilerorutilizeasyntheticfuelmadefrombiomass.Mostoftheseenergy systemsexperiencelow-energyfluxintensity,sothatlargestructuresarerequiredperunitofpower
output,comparedtofossil-fueledplants.Ontheotherhand,theyemitnoorfewpollutants,while contributingnonetcarbondioxideemissionstotheatmosphere.Theircapitalcostperunitofpower outputishigherthanthatoffossilplants,sothatrenewableplantsmaynotbecomeeconomical untilfossilfuelpricesrise.
Transportationenergyisamajorsectoroftheenergymarketinbothindustrializedanddevelopingnations.Automobilesareamajorconsumeroftransportationenergyandemitterofurbanair pollutants.Thetechnologyofautomobileshasadvancedconsiderablyinthelastseveraldecades underregulationbygovernmentstoreducepollutantemissionsandimproveenergyefficiency.Currentautomobilesemitmuchsmalleramountsofpollutantsthantheiruncontrolledpredecessorsas aconsequenceofcomplexcontrolsystems.Considerablegainsinenergyefficiencyseempossible byintroductionoflightweightbodydesignsandelectricdrivesystemspoweredbyelectricstorage systemsoronboardengine-drivenelectricgenerators,orcombinationsofthese.
Airpollutantsemittedintotheurbanatmospherebyfossilfuelusersandothersourcescan reachlevelsharmfultopublichealth.Someofthesepollutantscanreactintheatmosphereby absorbingsunlightsoastoformevenmoreharmfultoxicproducts.Thissoupofdirectandindirect pollutantsistermed smog.Onecomponentofsmogisthetoxicoxidantozone,whichisnotdirectly emittedbyanysource.Becauseofthechemicalcomplexityofthesephotochemicalatmospheric reactions,greateffortisrequiredtolimitalltheprecursorsofphotochemicalsmogifitistobe reducedtolowlevels.
Carbondioxideandothergreenhousegaseswarmtheloweratmospherebyimpedingthe radiativetransferofheatfromtheearthtoouterspace.Limitingthegrowthrateofatmospheric carbondioxiderequireseither(a)reducingtheamountoffossilfuelburnedor(b)sequestering thecarbondioxidebelowtheearth’sorocean’ssurface.Tomaintainorincreasetheavailability ofenergywhilefossilfuelconsumptionislowered,renewableornuclearenergymustbeused.Of course,improvingtheuseefficiencyofenergycanresultintheloweringoffossilfuelusewhile
notreducingthesocialutilityofenergyavailability.Bycombinationofallthesemethods,therate ofriseofatmosphericcarbondioxidecanbeamelioratedataneconomicandsocialcostthatmay beacceptable.
Theameliorationofenvironmentaldegradationcausedbyenergyuseisaresponsibilityof nationalgovernments.Byregulationandbyprovidingeconomicincentives,governmentsinduce energyuserstoreducepollutantemissionsbychangesintechnologyorusepractices.Bilateral orglobaltreatiescanbringaboutcoordinatedmultinationalactionstoreduceregionalorglobal environmentalproblems,suchasaciddeposition,ozonedestruction,andclimatechange.Therole oftechnologyistoprovidethenecessaryreductioninemissionswhilestillmakingavailableenergy attheminimumincreaseincostneededtoattainthatend.
Thereisaminimumamountofenergyneededtosustainhumanlife.Theenergyvalueoffoodisthe majorcomponent,butfuelenergyisneededforcookingand,insomeclimates,forheatinghuman shelter.Inanagriculturalsociety,additionalenergyisexpendedingrowing,reaping,andstoring food,makingclothing,andconstructingshelters.Inmodernindustrialsocieties,muchmoreenergy thanthisminimumisconsumedinprovidingfood,clothing,shelter,transportation,communication, lighting,materials,andnumerousservicesfortheentirepopulation.
Itisabasicprincipleofphysicsthatenergycannotbedestroyed,butcanbetransformedfrom oneformtoanother.Whenafuelisburnedinair,thechemicalenergyreleasedbytherearrangement offuelandoxygenatomstoformcombustionproductsistransformedtotherandomenergyof thehotcombustionproductmolecules.Whenfoodisdigestedinthehumandigestivetract,some ofthefoodenergyisconvertedtoenergyofnutrientmoleculesandsomewarmsthebody.When humansocieties“consume”energy,theytransformitfromoneusefulformtoalessusefulform, intheprocessprovidingagoodorservicethatisneededtomaintainhumanlifeandsocieties.
Aquantitativemeasureoftheongoinggoodthatenergy“consumption”providestosocietyis thetimerateoftransformationoftheusefulenergycontentofenergy-richmaterials,suchasfossil andnuclearfuels.In1995,thisworldwideconsumptionrateamountedto12.1terawatts(TW)1 , orabout2kilowatts(kW)percapita.2 Ofthisworldtotal,theUnitedStatesconsumed2.9TW,or about13kWpercapita,whichisthelargestofanynation.Howeverunevenlydistributedamong theworld’spopulation,theworldenergyconsumptionratefarexceedstheminimumrequiredto sustainhumanlife.
Thecapacitytoconsumeenergyatthisrateisaconsequenceofthetechnologydevelopedin industrializednationstopermittheefficientextractionandutilizationofthesefuelsbyonlyasmall fractionofthepopulation.3 Buttheearth’sfossilandnuclearfuelresourcesarebeingdepletedat aratethatwillrenderthemveryscarceinfuturecenturies,eveniftheyareusedmoreefficiently thaninthepast.Thecurrentcostofthesefuels,however,hasremainedlowfordecadesasrecovery technologyhasimprovedenoughtooffsetthedistantthreatofscarcity.
Thereareother,lessenergy-richsourcesofenergywhicharenotdepletable.Thesearethe so-calledrenewableenergies,suchasthoseofsolarinsolation,wind,flowingrivercurrents,tidal flows,andbiomassfuels.Infact,thesearetheenergiesthatweredevelopedonasmallscalein preindustrialsocieties,providingforoceantransportation,cooking,sawingoflumber,andmilling ofgrain.Industrialagetechnologieshavemadeitpossibletodevelopthesesourcestodayonamuch largerscale,yetinaggregatetheyconstitutelessthan8%ofcurrentworldenergyconsumption. Renewableenergyiscurrentlymorecostlythanfossilenergy,butnotgreatlyso,andmayyetbecome moreeconomicalwhenpollutionabatementcostsoffossilandnuclearenergyarefactoredin.
Howisenergyused?Itiscustomarytodivideenergyusageamongfoursectorsofeconomic activity:industrial(manufacturing,materialproduction,agriculture,resourcerecovery),transportation(cars,trucks,trains,airplanes,pipelinesandships),commercial(services),andresidential (homes).IntheUnitedStatesin1996,thesecategoriesconsumed,respectively,36%,27%,16%, and21%ofthetotalenergy.Consideredalltogether,energyisconsumedinamyriadofindividual ways,eachofwhichisanimportantcontributortothefunctioningofthesesectorsofthenational economy.
Oneprominentuseofenergy,principallywithintheindustrialandcommercialsectors,is thegenerationofelectricpower.Thisuseofenergynowconstitutes36%ofthetotalenergyuse worldwide,but44%intheUnitedStates.Combinedwiththetransportationsector,thesetwo usescomprise70%ofthetotalU.S.energyuse.Forthisreason,electricpowerproductionand transportationformthecoreenergyusesdiscussedinthistext.
Howisenergysupplied?Exceptforrenewableenergysources(includinghydropower),the mainsourcesofenergyarefossilandnuclearfuels,whicharedepletablemineralsthatmust beextractedfromtheearth,refinedasnecessary,andtransportedtotheend-userinamounts neededfortheparticularuses.Giventhestructureofmodernindustrializedeconomies,supplying energyisayear-roundactivityinwhichtheenergyisconsumedwithinmonthsofbeingextracted fromitssource.
4 Whiletherearereservesoffossilandnuclearfuelsthatwilllastdecadesto centuriesatcurrentconsumptionrates,thesearenotextracteduntiltheyareneededforcurrent consumption.
5 Becausefossilandnuclearfuelreservesarenotuniformlydistributedwithinor amongthecontinents,somenationsarefuelpoorandothersfuelrich.Thequantitiesoffueltraded amongnationsisasignificantfractionofoverallenergyproduction.
Onehallmarkofindustrializationinthetwentiethcenturyhasbeenthegrowthoftheelectricpower sector,whichtodayconsumesabout36%oftheworld’senergyintheproductionofanannual averageof1.4TWofelectricpower.IntheUnitedStates,44%oftotalenergyisusedtogenerate anannualaverageof0.4TWofelectricalpower.Nearlyallofthiselectricpowerisproducedin largeutilityplants,eachgeneratingintherangeof100to1000megawatts(MW).Fossilandnuclear fuelssupply63%and17%,respectively,ofthetotalelectricpower,theremainderbeinggenerated
4
5Incontrast,foodcropsareproducedmostlyonanannualbasis,requiringstorageoffoodavailablefor marketingforthebetterpartofayear.
inrenewableenergyplants,ofwhichhydropower(19%)istheoverwhelmingcontributor.6 The generationanddistributionofelectricpowertonumerousindustrial,commercial,andresidential consumersisconsideredtodaytobearequirementforbothadvancedanddevelopingeconomies.
Theelectricenergyproducedinpowerplantsisveryquicklytransmittedtothecustomer,where itisinstantaneouslyconsumedforamultitudeofpurposes:providinglight,generatingmechanical powerinelectricmotors,heatingspaceandmaterials,poweringcommunicationequipment,and soon.Thereispracticallynoaccumulationofenergyinthissystem,incontrastwiththestorageof fuels(orwaterinhydrosystems)atpowerplants,sothatelectricenergyisproducedandconsumed nearlysimultaneously.7 Electricpowerplantsmustbeoperatedsoastomaintaintheflowofelectric powerinresponsetotheinstantaneousaggregatedemandofconsumers.Thisisaccomplishedby networkingtogethertheelectricpowerproducedbymanyplantssothatasuddeninterruptionin theoutputofoneplantcanbereplacedbytheothers.
Transportationofgoodsandpeopleamonghomes,factories,offices,andstoresisastapleingredient ofindustrializedeconomies.Ground,air,andmarinevehiclespoweredbyfossil-fueledcombustion enginesaretheprincipalmeansforprovidingthistransportationfunction.8 Transportationsystems requirebothvehicleandinfrastructure:car,truck,andhighway;trainandrailway;airplaneand airport;shipandmarineterminal.Ownership,financing,andconstructionoftheinfrastructureis oftendistinctfromthatofthevehicle,withpublicownershipoftheinfrastructureandprivate ownershipofthevehiclebeingmostcommon.
Ineconomicterms,thelargesttransportationsectoristhatofhighwaysandhighwayvehicles. Worldwide,highwayvehiclesnownumberabout600million,200millionofthemintheUnited States.IntheUnitedStates,96%oftheroadvehiclesarepassengerautomobilesandlight-duty trucks.TheworldandU.S.vehiclepopulationsaregrowingatannualratesof2.2%and1.7%, respectively.Onaverage,U.S.vehiclesarereplacedevery13yearsorso,providinganopportunity toimplementrelativelyquicklyimprovementsinvehicletechnology.9
Transportationfuelsarenearlyallpetroleum-derived.IntheUnitedStates,transportation consumes70%ofthepetroleumsupply,or32%ofallfossilfuelenergy.Highwayvehiclesaccount for46%ofpetroleumconsumption,or21%ofallfossilfuelenergy.Transportationsystemsare especiallyvulnerabletointerruptionsinthesupplyofimportedoil,whichnowexceedsthesupply fromdomesticproduction.Unlikesomestationaryusersofoil,transportationvehiclescannot substitutecoalorgasforoilintimesofscarcity.
Whilesubstantialreductioninhighwayvehicleairpollutantemissionshasbeenachievedinthe UnitedStatessince1970,andmorereductionsarescheduledforthefirstdecadeofthetwenty-first century,thefocusofvehicletechnologyhasshiftedtoimprovingvehiclefueleconomy.Doubling currentfuelefficiencieswithoutpenalizingvehicleperformanceistechnicallypossible,atavehicle
6Whencomparingtheamountofhydropowerenergywiththatoffossilandnuclear,theformerisevaluated onthebasisoffuelenergyneededtogeneratethehydroelectricpoweroutputoftheseplants.
7Insomerenewableenergyelectricpowersystems,suchaswindandphotovoltaicpowersystems,thereis usuallynoenergystorage;thesesystemscancompriseonlyapartofareliableelectricenergysystem.
8Indevelopingcountries,human-poweredbicyclesmaybeimportantcomponentsofgroundtransportation.
manufacturingcostpenaltythatwillbeoffsetinpartbyfuelcostsavings.Automobilespromiseto beoneofthemorecost-effectivewaysforreducingoilconsumptionandcarbonemissions.
Becauseoftheubiquitousneedforenergy,combinedwiththeabilitytostoreandutilizeitin manyforms,energyismarketedasacommodityandtradedinternationallyatmoreorlesswell establishedprices.Forexample,inrecentyearstheworldcrudeoilpricehasrangedfromabout 15–35$/barrel,orabout2–5$/GJ.10 Coalisgenerallycheaperthanoil,whereasnaturalgasismore expensive.Thedifferenceinpricereflectsthedifferentcostsofrecovery,storage,andtransport. Nuclearfuelrefinedforuseinnuclearelectricpowerplantsislessexpensivethanfossilfuels,per unitofheatingvalue.
Coalisthecheapestfueltoextract,especiallywhenminedneartheearth’ssurface.Itisalso inexpensivetostoreandtransport,bothwithinandbetweencontinents.Butitisdifficulttouse efficientlyandcleanly,andintheUnitedStatesitisusedmainlyasanelectricutilityfuel.Oil ismoreexpensivethancoaltorecover,beingmoredispersedwithingeologicstructures,butis moreeasilytransportedbypipelineandintercontinentallybysupertanker.Itisalmostexclusively thefueloftransportationvehicles,anditisalsothefuelofchoiceforindustrial,commercial,and residentialuseinplaceofcoal.Likeoil,naturalgasisrecoveredfromwells,butisnoteasilystored orshippedacrossoceans.Itcommandsthehighestpricebecauseofthegreatercostofrecovery,but iswidelyusedinindustry,commerce,andresidencesbecauseofitsease,efficiency,andcleanliness ofcombustion.
Incontrastwithfossilandnuclearfuels,renewableenergyisnottransportable(exceptin theformofelectricpower)orstorable(exceptinhydropowerandbiomasssystems).Renewable hydropowerelectricityisasignificantpartoftheworldelectricpowersupplyandissoldasa commodityintra-andinternationally.
Syntheticfuels,suchashydrogen,ethanol,andproducergas,aremanufacturedfromother fossilfuels.Bytransformingthemolecularstructureofanaturalfossilfueltoasyntheticform whilepreservingmostoftheheatingvalue,thesecondaryfuelmaybestoredorutilizedmore easily,orprovidesuperiorcombustioncharacteristics,butisinevitablymoreexpensivethanits parentfuel.11
Onthetimescaleofcenturies,thesuppliesoffossilandnuclearfuelswillbeseverelydepleted, leavingonlydepositsthataredifficultandexpensivetoextract.Theonlysourcesthatcouldsupply energyindefinitelybeyondthattimehorizonarenuclearfusionandrenewableenergy.Theseare bothcapital-intensivetechnologies.Theirenergycostswillinevitablybecompetitivewithfossil andfissionfuelswhenthelatterbecomescarceenough.12
10Abarrelofcrudeoilcontainsabout6GJ(6MBtu)offuelheatingvalue.
11Plutonium-239,afissionablenuclearfuel,isformedfromuranium-238,anonfissionablenaturalmineral,in nuclearreactors.Inthissenseitisasyntheticnuclearfuel,whichcanproducemoreenergythanisconsumed initsformation,unlikefossilfuel-basedsyntheticfuels.
12Iffusionpowerplantswillbenomoreexpensivethancurrentfissionplants,atabout0.3–1dollarperthermal wattofheatinput,thenthecapitalcostofsupplyingthecurrentU.S.energyconsumptionofabout3TW wouldbe1–3trilliondollars(T$).Thecostofthisenergywouldbeseveraltimescurrentcosts.
Thetwentiethcentury,duringwhichindustrializationproceededevenfasterthanpopulationgrowth, markedthebeginningofanunderstanding,bothpopularandscientific,thathumanactivitywas havingdeleteriouseffectsuponthenaturalworld,includinghumanhealthandwelfare.These effectsincludedincreasingpollutionofair,water,andlandbythebyproductsofindustrialactivity, permanentlossofnaturalspeciesofplantsandanimalsbychangesinlandandwaterusageand humanpredation,and,morerecently,growingindicationsthattheglobalclimatewaschanging becauseoftheanthropogenicemissionsofso-calledgreenhousegases.
Atfirst,attentionwasfocusedonrecurringepisodesofhighlevelsofairpollutioninareas surroundingindustrialfacilities,suchascoalburningpowerplants,steelmills,andmineralrefineries.Thesepollutionepisodeswereaccompaniedbyacutehumansicknessandtheexacerbation ofchronicillnesses.Aftermid-century,whenindustrializednations’economiesrecoveredrapidly fromWorldWarIIandexpandedgreatlyabovetheirprewarlevels,manyurbanregionswithout heavyindustrialfacilitiesbegantoexperiencepersistent,chronic,andharmfullevelsofphotochemicalsmog,asecondarypollutantcreatedintheatmospherefrominvisiblevolatileorganic compoundsandnitrogenoxidesproducedbyburningfuelsandthewidespreaduseofmanufacturedorganicmaterials.Concurrently,theoverloadingofrivers,lakes,andestuarieswithindustrial andmunicipalwastesthreatenedbothhumanhealthandtheecologicalintegrityofthesenatural systems.Thecarelessdisposalonlandofmining,industrial,andmunicipalsolidwastesdespoiled thepurityofsurfaceandsubsurfacewatersupplies.
Asthelevelofenvironmentaldamagegrewinproportiontotherateofemissionofairand waterpollutants,whichthemselvesreflectedtheincreasinglevelofindustrialactivity,national governmentsundertooktolimittherateoftheseemissionsbyrequiringtechnologicalimprovements topollutantsources.Asaconsequence,bythecentury’sendambientairandwaterpollutionlevels weredecreasinggraduallyinthemostadvancedindustrializednations,eventhoughenergyand materialconsumptionwasincreasing.Nevertheless,troublingevidenceofthecumulativeeffects ofindustrialwastedisposalbecameevident,suchasacidificationofforestsoils,contaminationof marinesedimentswithmunicipalwastesludge,andpoisoningofaquiferswithdrainagefromtoxic wastedumps.Nottheleastoftheimpendingcumulativewasteproblemsisthedisposalofused nuclearpowerplantfuelanditsreprocessingwastes.
Environmentaldegradationisnotconfinedtourbanregions.Inpreindustrialtimes,largeareas offorestandgrasslandecosystemswerereplacedbymuchlessdiversecropland.Subsequently, industrializedagriculturehasexpandedthepredominanceofmonoculturedcropsandintensified productionbycopiousapplicationsofpesticides,herbicides,andinorganicfertilizers.Valuable topsoilhaserodedatratesabovereplacementlevels.Forestsmanagedforpulpandlumberproductionarelessdiversethantheirnaturalpredecessors,thetreecropbeingoptimizedbyuseof herbicidesandpesticides.IntheUnitedStates,factoryproductionofpoultryandporkhavecreated severelocalanimalwastecontrolproblems.
Themostthreatened,andmostdiverse,naturalecosystemsoneartharethetropicalrain forests.Tropicalforestdestructionforagriculturalorsilviculturalusesdestroysecosystemsofgreat complexityanddiversity,extinguishingirreversiblyanevolutionarynaturaltreasure.Italsoadds totheburdenofatmosphericcarbondioxideinexcessofwhatcanberecoveredbyreforestation. Themostsoberingenvironmentalchangesareglobalones.Therecentappearanceofstratosphericozonedepletioninpolarregions,whichcouldincreaseharmfulultravioletradiationat theearth’ssurfaceinmid-latitudesshoulditincreaseinintensity,wasclearlyshownbyscientific
researchtobeaconsequenceoftheindustrialproductionofchlorofluorocarbons.(Byinternational treaty,thesechemicalsarebeingreplacedbylessharmfulones,andthestratosphericozonedestructionwilleventuallybereduced.)Butthemoreominousglobalpollutantsareinfrared-absorbing molecules,principallycarbondioxidebutincludingnitrousoxideandmethane,thatareinexorably accumulatingintheatmosphereandpromisingtodisturbtheearth’sthermalradiationequilibrium withthesunandouterspace.Itiscurrentlybelievedbymostscientiststhatthisdisequilibrium willcausetheaverageatmosphericsurfacetemperaturetorise,withprobableadverseclimatic consequences.Becausecarbondioxideisformedineluctiblyinthecombustionoffossilfuelsthat producemuchofcurrentandexpectedfutureenergyuse,andisknowntoaccumulateintheatmosphereforcenturies,itscontinuedemissionintotheatmospherepresentsaproblemthatcannotbe managedexceptonaglobalscale.Itisaproblemwhosecontrolwouldgreatlyaffectthefuture courseofenergyuseforcenturiestocome.
Toaddresstheproblemofadeterioratingenvironment,industrializednationshaveundertaken toregulatetheemissionofpollutantsintothenaturalenvironment,whetheritbeair,water,or land.Theconceptthatunderliesgovernmentcontrolisthattheconcentrationofpollutantsinthe environmentmustbekeptbelowalevelthatwillassurenoharmfuleffectsinhumansorecological systems.Thiscanbeachievedbylimitingthemassrateofpollutantemissionsfromaparticular sourcesothat,whenmixedwithsurroundingcleanairorwater,theconcentrationissufficiently lowtomeetthecriterionofharmlessness.13
Inthecaseofmultiplesourceslocatedneartoeachother,suchasautomobilesonahighway ormanyfactoriescrowdedtogetherinanurbanarea,theadditiveeffectsrequiregreaterreduction persourcethanwouldbeneededifonlyoneisolatedsourceexisted.Inindustrializedcountries andregions,thecumulativeeffectsofemissionsintolimitedvolumesofairorwaterresultin widespreadcontamination,withbothlocalanddistantsourcescontributingtolocallevels.
Theultimateexampleofcumulativeeffectsisthegradualincreaseintheglobalannualaverage atmosphericcarbondioxideconcentrationcausedbytheworldwideemissionsfromburningoffossil fuelsandforests.Becausetheresidencetimeofcarbondioxideintheatmosphereisoftheorder ofacentury,thisriseinatmosphericconcentrationreflectsthecumulativeemissionsovermany priordecades.Unlikeurbanorregionalairpollutantemissionreduction,reducingcarbondioxide emissionswillnotreducetheambientcarbondioxidelevel,onlyslowitsinexorablerise.
Thescientificandtechnologicalbasisfornationalandinternationalmanagementofenvironmentalpollutionisthecumulativeunderstandingofthenaturalenvironment,thetechnologyof industrialprocessesthatreleaseharmfulagentsintotheenvironment,andthedeleteriouseffects uponhumansandecologicalsystemsfromexposuretothem.Byitself,thisknowledgecannot secureasolutiontoenvironmentaldegradation,butitisarequisitetofashioninggovernmental programsforattainingthatpurpose.
13Inregulatoryprocedures,itisusuallynotnecessarytoproveabsoluteharmlessness,butonlytheabsence ofdetectableharm.
Theindustrialrevolutionhasbeencharacterizedbyverylargeincreasesintheamountofenergy availabletohumansocietiescomparedtotheirpredecessors.Inpreindustrialeconomies,onlyvery limitedamountsofnonhumanmechanicalpowerwereavailable,suchasthatofdomesticated animals,theuseofwindpowertopropelboatsandpumpwater,andtheuseofwaterpowertogrind grain.Woodwastheprincipalfueltocookfood,toheatdwellings,andtosmeltandrefinemetals. Today,inindustrialnations,orintheurban-industrialareasofdevelopingnations,theavailability offossilandnuclearfuelshasvastlyincreasedtheamountofenergythatcanbeexpendedon economicproductionandpersonalconsumption,helpingtomakepossibleastandardofliving thatgreatlyexceedsthesubsistencelevelofpreindustrialtimes.Furthermore,thepopulationof theworldincreasedseveralfoldsincethepreindustrialera,thusrequiringtherecoveryofeverincreasingamountsofenergyresources.However,theseresourcesarenotevenlydistributedamong thecountriesoftheworld,andtheyarefinite.
Theprincipalsourcesofenergyinpresentsocietiesarefossilenergy(coal,petroleum,and naturalgas),nuclearenergy,andhydroenergy.Otherenergysources,theso-calledrenewables, arepresentlysupplyingaverysmallfractionofthetotalenergyconsumptionoftheworld.The renewablesincludesolar,wind,geothermal,biomass,ocean-thermal,andocean-mechanicalenergy. Infact,hydroenergymayalsobecalledarenewableenergysource,althoughusuallyitisnot classifiedtogetherwithsolar,wind,orbiomass.Increaseduseofrenewableenergysourcesis desirablebecausetheyaredeemedtocauselessenvironmentaldamage,andtheirusewouldextend theavailableresourcesoffossilandnuclearenergy.
Inthischapterwedescribethesupplyandconsumptionpatternsofenergyintheworldtoday, alongwiththehistoricaltrends,withemphasisonavailableresourcesandtheirrateofdepletion. Inrecentyearstheeffectsoftheglobalconsumptionoffossilfuelsontheincreaseofatmospheric concentrationofCO2 hasbecomeaninternationalconcern.Inexaminingtheglobalenergyuse,it isusefultoincludeinouraccountingtheconcomitantCO2 emissionstoprovideaperspectiveon theproblemofmanagingthepotentialthreatofglobalclimatechangeduetotheseemissions.
Thetrendofworldenergyconsumptionfrom1970to1997andprojectionsto2020isdepictedin Figure2.1.Theworldwideenergyconsumptionin1997was380Quads.1 In1997,theindustrialized 11Quad(Q) = 1quadrillion(1E(15))Britishthermalunits(Btu) = 1.005E(18)joules(J) = 1.005exajoules (EJ) = 2.9307E(11)kilowatthours(kWh).SeeTablesA.1andA.2.
countries,alsocalled“developed”countries,consumed54%oftheworld’senergy,the“lessdeveloped”countriesconsumed31.5%,andtheeasternEuropeanandformerSovietUnioncountriesconsumed14.5%.Itisinterestingtonotethatin2020,theprojectionisthatthelessdevelopedcountrieswillconsumeagreaterpercentageoftheworld’senergythantheindustrialized countries.
Table2.1liststhe1996population,totalenergyuse,GrossDomesticProduct(GDP),energy usepercapita,andenergyuseperGDPofseveraldevelopedandlessdevelopedcountries.The UnitedStatesisthelargestconsumerofenergy(88.2Q),followedbyChina(35.7Q)andIndia (30.6Q).TheUnitedStatesconsumes23.2%oftheworld’senergywith4.6%oftheworld’s population;westernEuropeconsumes16.7%oftheworld’senergywith6.5%oftheworld’s population.Chinaconsumesabout10%oftheworld’senergywith21%oftheworld’spopulation, whereasIndiaconsumes3%oftheenergywith16.3%ofthepopulation.
Amongthelistedcountries,Canada,Norway,andtheUnitedStatesaretheworld’shighest usersofenergypercapita:395,390,and335millionBtupercapitaperyear,respectively.Russia consumes181MBtu/capy,Japan171,UnitedKingdom169,Germany168,andFrance162.The lessdevelopedcountriesconsumemuchlessenergypercapita.Forexample,Mexicoconsumes 59MBtu/capy,Brazil43,China29.4,Indonesia54.1,andIndia32.6.Theworldaverageconsumptionis63MBtu/capy.
IfwecomparetheenergyconsumptionperGDP,adifferentpictureemerges.Amongdeveloped countries,Canadauses24.5kBtu/$GDP(reckonedinconstant1987dollars),Norway16.7,United States16.2,UnitedKingdom12.5,Germany9.1,France9,Italy8.4,andJapan7.1.Canada,Norway, andtheUnitedStatesusemoreenergyperGDPthantheotherwesternEuropeancountriesand Japan,inpartbecauseofthecolderclimate,largerlivingspaces,longerdrivingdistances,and largerautomobiles.Ontheotherhand,Russiaandthelessdevelopedcountries(withtheexception ofBrazil)spendahigherrateofenergyperdollarGDPthandoCanada,UnitedStates,Japan,and theEuropeancountries:Russia(108.3kBtu/$GDP),Indonesia(81),China(67),andMexico(36). Thisisanindicationthatmuchofthepopulationinthesecountriesdoesnot(yet)contribute significantlytotheGDP.Furthermore,theirindustrialfacilities,powergeneration,andheating
TABLE2.1 Population,EnergyUse,GDP,EnergyUseperCapita,andEnergyUseper $ GDPinSeveral Countries,1996a
a DatafromU.S.DepartmentofEnergy,EnergyInformationAgency,1997. InternationalEnergyOutlook1997.
b GrossDomesticProductinconstant1987U.S.dollars.
c NA,notapplicable.
(orcooling)systemsapparentlyarelessefficientorinotherwaysmorewastefulofenergythanin Canada,UnitedStates,westernEurope,andJapan.
Theprimaryenergysourcessupplyingtheworld’senergyconsumptionin1997werepetroleum (39%),coal(25%),naturalgas(21.5%),nuclear-electric(6.3%),hydroelectric(7.5%),and geothermalandotherrenewables(0.7%)(seeFigure2.2).2,3 Thetrendofthegrowthofenergy sourcesfrom1970to1997andthepredictionto2020isgiveninFigure2.3.Theprojectionfor thenexttwodecadesisthatnuclear’ssharewilldeclineandtheshareofrenewableswillincrease,
2Primaryenergyisenergyproducedfromenergyresourcessuchasfossilornuclearfuels,orrenewable energy.Itisdistinguishedfromsecondaryenergy,suchaselectricpowerorsyntheticfuel,whichisderived fromprimaryenergysources.
3Inconvertingnuclearandrenewable(e.g.,hydro)energytoprimaryenergyinQuads,theU.S.Energy InformationAgency(EIA)usesthethermalenergythatwouldbeusedinanequivalentsteampowerplant withathermalefficiencyofabout31%.
presumablywithincreaseoftheuseofsolar,wind,andbiomassenergy.Theconsumptionofall fossilfuelswillalsoincreaseinthenextdecades,withtheriseofnaturalgasuseexceedingthatof coalbytheyear2020.
Takenasalineargrowthrateoverthe10years1987–1997,theworldwideenergyconsumption wasincreasingatapproximately1.55%peryear.Coalconsumptiongrewby0.8%/yontheaverage,naturalgas2.45%/y,petroleum1.1%/y,nuclear-electric2.2%/y,hydroelectric2.1%/y,and geothermalandotherenergysources13%/y.However,asmentionedabove,thelatterconstitute onlyasmallfractionofthecurrentenergyconsumption.IntheUnitedStates,energyconsumption increased1.7%/yontheaverageoverthe10years.China’senergyconsumptiongrew5.3%/yon theaverage,whereasIndia’senergyuseincreasedabout6.6%/y.Mostofthegrowthisdueto increasedfossilfuelconsumption.
In1996,thetotalenergyconsumptionintheUnitedStateswascloseto90Q.ThedistributionoftheU.S.energyconsumptionbyenergysourceispresentedinFigure2.4.Petroleum contributed39.7%,naturalgas25.1%,coal22.8%,nuclear-electricity8%,hydroelectricity4%,
andgeothermalandotherrenewables0.4%.Theseproportionsarenotgreatlydifferentfromthose oftheworldasawhole.In1996,about50.5%oftheU.S.petroleumand12%ofnaturalgas consumptionwassuppliedbyforeignsources.
Electricityisasecondaryformofenergy,becauseprimaryenergy(fossil,nuclear,hydropower, geothermal,andotherrenewablesourcesofenergy)isnecessarytogenerateit.Thetrendofthe world’selectricityproductionfrom1990to1997andthepredictionto2020isdepictedinFigure2.5. In1997,theworld’stotalelectricityproductionwascloseto12trillionkilowatthours.By2020, theproductionispredictedtoincreasetoover21trillionkWh.
Ofthe1997electricityproduction,63%wasfromfossilenergy,19%wasfromhydroenergy, 17%wasfromnuclearenergy,andlessthan1%wasfromgeothermalandotherrenewablesources (seeFigure2.6).Becausetheworldwidethermalefficiencyofpowerplantsisabout33.3%,in1997 theseplantsconsumedabout32.6%oftheworld’sprimaryenergyandabout55.5%oftheworld’s fossilenergy.Themajorityofthelatter(over80%)wasintheformofcoal.IntheUnitedStates, Europe,Japan,andsomeothercountries,inthepastdecades,naturalgasbecameapreferredfuel forelectricitygeneration,andmanynewpowerplantswerebuiltthatemploythemethodofGas TurbineCombinedCycle(GTCC),whichisdescribedinSection5.3.1.
Therelianceonenergysourcesforelectricityproductionvariesfromcountrytocountry.For example,inthe1996,U.S.electricityproductionamountedto3079billionkWh.Ofthis,coal contributed56.4%,nuclearpowerplants21.9%,hydroelectricpowerplants10.7%,naturalgas 8.6%,petroleum2.2%,andgeothermalandothersourceslessthan0.3%(seeFigure2.7).
Hydropowerisasignificantcontributortoelectricitygenerationinmanycountries.Forexample,inNorwaypracticallyallelectricityisproducedbyhydropower,inBrazil93.5%,NewZealand 74%,Austria70%,andSwitzerland61%.ChinaandIndiaproduceabout19%oftheirelectricity fromhydropower.Whilehydroelectricityisarelativelycleansourceofenergyandthereisstilla potentialforitsgreateruseworldwide,mostoftheaccessibleandhigh“head”hydrostaticdams arealreadyinplace.Buildingdamsinremote,inhospitableareaswillbeexpensiveandhazardous. Furthermore,thereisagrowingpublicoppositiontodammingupmoreriversandstreamsfor
environmentalreasonsandalsobecauseofthedislocationofpopulationthatisofteninvolvedin creatingupstreamreservoirs.
Geothermalenergysuppliesasignificantportionofelectricityinthefollowingcountries:El Salvador(28.5%),Nicaragua(18.5%),CostaRica(10.3%),NewZealand(5.7%),Iceland(5.3%), Mexico(3.8%),Brazil(2.6%),Indonesia(1.8%),andItaly(1.6%).Geothermalenergyhasa greatpotentialforsupplyingheatandelectricitytomanyareasoftheworld.However,atpresent, geothermalenergyisonlycompetitivewithfossilenergywherethegeothermalsourcesareon,or near,thesurfaceoftheearth.
Incontrasttofossil-fueledpowerplants,nuclearpowerplantsdonotemitanyCO2 into theatmosphere,nordotheyemittheotherfossil-energy-relatedpollutants(SO2,NOx,particulate matter).However,thefearofnuclearaccidentsandtheunresolvedproblemofnuclearwastedisposal hasbroughttheconstructionofadditionalnuclearpowerplantstoahaltinmanycountries.Inthe UnitedStates,severalnuclearpowerplantsarepresentlybeingdecommissionedevenbeforetheir normalretirementdate.Ontheotherhand,insomecountries,newnuclearpowerplantsarebeing constructed,andnuclearenergydoesprovideasignificantportionofthetotalelectricityproduction. Forexample,inFrance76%oftheelectricityisnuclear-electric,SouthKorea36%,Germany29%, Taiwan27%,andJapan26%.
Table2.2liststhetotalcarbonemissions,carbonemissionspercapitaandperGDPofseveral countriesintheworldin1996.(Emissionsarereckonedinmassofcarbon,notthatofCO2.)In termsofabsolutequantities,theUnitedStatesandChinaarethelargestemittersofcarbon[1407and 871millionmetrictonsperyear(Mt/y),respectively],followedbyRussia(496Mt/y).Intermsofper capitaemissions,theUnitedStatesandCanadawerethelargestemitters,5270and4040kilogram percapitaperyear,followedbyRussia,3340kg/capy.Incountrieswherenonfossilenergyisused forelectricitygenerationandotherpurposes,thepercapitacarbonemissionsarelower.Thus,while theenergyconsumptionpercapitainGermanyandFrancearesimilar(168and162MBtu/capy, respectively),thecarbonemissionsarequitedifferent(2790and1600kg/capy,respectively).This reflectsthegreateruseofnuclearenergyforelectricitygenerationinFrance.Similarly,Switzerland andNewZealandhavelowercarbonemissionspercapita(1470and2100kg/capy,respectively) thanotherindustrialcountries,becauseoftheiruseofhydroenergyandgeothermalenergy.The worldaverageis1100kg/capy.TheUnitedStatesemitsaboutfivetimesasmuchcarbonpercapita astheworld’saverage.
IntermsofcarbonemissionsperdollarGDP,aninterestingpictureemerges.Theratiointhe UnitedStatesandCanadais0.26and0.25kgcarbonperdollarGDP(reckonedin1987U.S. dollars),respectively,whereasinJapan,Germany,France,Italy,andtheUnitedKingdom,itranges from0.1to0.2kg/$.InpartthisstemsfromthehigherconsumptionofenergyperunitofGDPinthe UnitedStatesandCanada,butalsofromthefactthattheUnitedStatesandCanadausemorefossil fuelpercapitaforspaceheating,spacecooling,andtransportationthandotheEuropeancountries andJapan.InRussia,theratioofcarbonemissionperdollarGDPis2.01,China1.62,India0.65, Indonesia0.62,andMexico0.63kg/$.Inthesecountries,fossilfuelisnotusedasefficientlyin theproductionofGDP.TheexceptionisBrazil,wheretheratiois0.2kg/$,probablyonaccountof Brazil’sgreateruseofhydroenergyandbiomassenergy.(Notethatemissionsfromforestburning arenotincludedintheseestimates.)
TABLE2.2
a DatafromU.S.DepartmentofEnergy,CarbonDioxideInformationAnalysisCenter,OakRidgeNationalLaboratory,OakRidge. b Millionmetrictonsofcarbonperyear
c GrossDomesticProductinconstant1987U.S.dollars.
d NA,notapplicable.
Inordertogainsomeinsightastowhereliethegreatestpotentialsinenergysavings,itisuseful toconsidertheconsumptionofenergyineachendusesector.Themajorsectorsareresidential–commercial,industrial,andtransportation.WeshallusetheUnitedStatesasanexample.Inother countriestheend-usepatternmaydiffersomewhat,dependingontheindustrialoutputofthe country(heavyvs.lightindustry),climate(heatingvs.airconditioning,orneither),andautomobile usage(personalvs.freight;distancestraveled).In1996,theU.S.totalprimaryenergyconsumption wascloseto90Q.Ofthistheindustrialsectorconsumed36.2%,residential–commercial36.6%, andtransportation27.2%.In1973,thesharesofthethreesectorswere:industry43%,residential–commercial32%,andtransportation25%.Thisreflectsthetrendof(a)populationgrowthand(b)a shiftfromanindustrialtoaserviceorientedeconomy,andwithintheindustrialsector,ashiftfrom heavy(“low-tech”)tolight(“hightech”)industry.IntheUnitedStates,overtheyears1973–1996 theenergyconsumptionperGDPalsodeclined.In1973,itwas19,000Btuperconstant1992dollar; in1996,13,000Btuper1992dollar.Thisshiftreflectstheincreasingshareoftheserviceindustry tothetotaleconomy.
Thetrendofannualconsumptionofenergyinthethreesectorsovertheyears1973–1996 isshowninFigure2.8.Inthoseyearstheenergyconsumptionforindustrialproductionbarely increased,whereastheconsumptionfortheresidential–commercialandtransportationsectorsincreasedsignificantly.Letusconsiderthepatternofenergyconsumptionwithineachsector.
Ofthetotalenergyusedbytheindustrialsector,about35%isusedforboilerfuel.Themajorpart ofthisboilerfuelisusedfordirectindustrialprocesses,includingelectricitygeneration;asmaller partisusedforspaceheating.Directprocessheatconsumes33%,machinedrive14%,nonprocess uses12%,electrochemicalprocesses3%,andprocesscoolingandotheruses2%ofthetotalenergy consumedbytheindustrialsector(seeFigure2.9).Eventhoughtheindustrialsectorhasbecome moreenergyefficientoverthepastyears,thereisstillroomforimprovement.Industrycouldsave energybyprocessmodification,betterheatexchangers,moreefficientdrivemechanisms,andloadmatched,variable-speedmotors.Insomecases,cogenerationcansaveenergy.Incogeneration,heat (steam)andelectricityrequiredbytheindustrialprocessandtheotherenergyneedsforthefacility (e.g.,spaceheating)aresuppliedfromthesamepowerplant.Thefuelsavingsareespecially
pronouncedwhenlow-qualityheatisadequatefortheindustrialprocessorspaceheating,suchas theheatrejectedbythesteamtoacondenserafterdrivingaturbine.
Ofthetotalenergyusedbytheresidentialsector,about40%isusedforappliancesandlighting (mainlyelectricity),34%forspaceheating(mainlyfossilfuelaspetroleumandnaturalgas), 16%forwaterheating(mainlyelectricityandnaturalgas),and10%forairconditioning(mainly electricity).ThisisdepictedinFigure2.10.Significantsavingsinspaceheatingcouldberealized byconservation(e.g.,loweringthethermostatinwinterandraisingitinsummer)andbybetter insulation.Solarheatingcouldbemorewidelyutilizedbothforspaceandwaterheating.Appliances canbemademoreenergyefficientandsmaller.Lightingcouldbeconvertedfromincandescentto fluorescentbulbs.
Ofthetotalenergyusedinthecommercialsector,about26%isusedforlighting,19%for spaceheating,9%forofficeequipment,8.5%forwaterheat,7.5%forairconditioning,7%for ventilation,5%forrefrigeration,3.5%forcooking,and14.5%forotheruses(seeFigure2.11).As
intheresidentialsector,thissectorcouldalsorealizelargeenergysavings,especiallyinlighting, spaceheating,cooling,andventilation.
Ofthetotalenergyusedbythetransportationsector,about42%isusedforpersonalautomobile transport,20%forlighttrucks(oftenjustusedforpersonaltransport),16%forheavyfreight, 9%forair,7%forwater,4%forpipe,and2%forrailtransport(seeFigure2.12).Considering thatintheUnitedStatesthetransportationfuelispracticallyallderivedfrompetroleum,thatover 50%ofpetroleumisimported,thatautomobilesareresponsibleforabout50%ofground-level airpollution,andthatthetransportationsectorcontributesaboutone-thirdofU.S.CO2 emissions, thetransportationsectorcouldrealizesignificantsavingsinenergyconsumptionandreduction inairpollutantandcarbonemissions.Thiscouldbeaccomplishedby(a)reducingtheweightof automobiles,(b)increasedenginefuelefficiency,(c)usingfuelcellandbatterypoweredelectric drivecars,(d)usinghybridinternalcombustionengine-electricpoweredcars,and(e)increased useofpublictransportation.SomeofthesealternativesarefurtherdiscussedinChapter8.
Inthissectionweshalladdressonlythesupplyoffossilenergy—thatis,coal,petroleum,naturalgas, andunconventionalsourcesoffossilenergy,suchasoilshale,tarsand,geopressurizedmethane, andcoalseammethane.
Coalisfoundpracticallyoneverycontinentandsubcontinent.Itisfoundburieddeeplyinthe groundorundertheseabed,orclosetothesurface.Coalcharacteristicsvarywidelyaccordingto itsbiologicalorigin(forests,lowgrowingvegetation,swamps,animals)andgeologicalhistory(age, overburden,temperature,pressure).Thus,thechemicalandphysicalcharacteristicsofcoalarealso highlyvariable,suchasthecontentofmoisture,minerals(ash),sulfur,nitrogen,andoxygen;heat
a Percentagesmaynotaddupto100%becauseofotherelementspresentincoal.
value;hardness;porosity;andsoon.Table2.3liststhecharacteristicsandcompositionofseveral U.S.coals.Thevariabilityfromcoaltocoalisclearlyevident.Forexample,thecarboncontent variesfrom62.9%forNorthDakotalignite(arelativelyyoungcoal)to93.9%forPennsylvania anthracite(arelativelyoldcoal).Thesulfurcontentvariesfrom0.7%to3.4%byweight,andthe higherheatingvalue(HHV)variesfrom7070Btu/lb(16,430kJ/kg)forNorthDakotaligniteto 13,620Btu/lb(31,650kJ/kg)forPittsburghseambituminous.4
Becauseofthewidelyvaryingcharacteristicsofcoals,itisdifficulttoestimatetheprecise energyreservesresidingintheworld’scoaldeposits.Theworldtotalcoalreservesareestimatedat 1.037E(12)metrictons.5 Aboutone-halfisbituminousandanthracitecoal,whereastheotherhalfis subbituminousandlignitecoal.AssumingthattheaverageHHVofbituminousandanthracitecoalis 12,500Btu/lb(29,050kJ/kg),andthatofsubbituminousandligniteis8200Btu/lb(19,055kJ/kg), theworld’scoalreserveshaveatotalheatingvalueofabout24,000Q.The1995worldcoal consumptionamountedtoalittlemorethan93Q/y.Ifthepresentconsumptionlevelwereto continueintothedistantfuture,theworldcoalreserveswouldlastabout250–300years.However, ifcoalconsumptionkeepsincreasingatarateof0.8%/y(seeSection2.3),thelifetimeoftheworld’s coalreserveswouldbeonlyabout140years.
Thecountrieswheretheworld’smajorcoalreservesarefoundare(inpercentofthetotal) UnitedStates(26),formerSovietUnioncountries(25),China(12),Australia(10),Germany(7), SouthAfrica(7),Poland(4),andothercountries(9)(seeFigure2.13).
Inadditiontotheabove reserves, coalmaybefoundinyetunprovenreservoirs.Unproven reservoirsarecalled resources. 6 Someestimatesplacethecoalresourcesatabout140,000Q.7 The
4Thehigherheatingvalue(HHV)includesthelatentheatofcondensationofthemoisturecontentofthecoal andthewatervaporformedincombustion,whereasthelowerheatingvalue(LHV)excludesit.
5EnergyInformationAgency,1997. InternationalEnergyOutlook, DOE/EIA-0484(97).
6Reservesofagivenfossilfuelarethosequantitiesthatgeologicalandengineeringinformationindicate withreasonablecertaintytobeextractableunderexistingeconomicandoperatingconditions.Resourcesare thosequantitiesthatfromgeologicalandengineeringinformationmayexist,buttheirextractionwillrequire differenteconomicandoperatingconditions.
7Anonymous,1978. WorldEnergyConference.Guildford:IPCScienceandTechnologyPress.
resourcescouldsupplythepresentconsumptionrateforabout1500years.Theresourcesaremainly locatedinChina,theformerSovietUnioncountries,theUnitedStates,andAustralia.However, theresourcesmaybelocatedatgreatdepthunderthegroundorunderthecontinentalshelves.The costofexploitingtheseresourceswillcertainlybemuchgreaterthanthatofthereserves.
Thetermspetroleumandmineraloil,oroilforshort,aresynonymous.Thecrudeoilthatisfound invariouspartsoftheworlddiffersinqualityandcomposition,dependingonthebiologicalorigin andgeologicalhistory.Itisfoundingeologicalreservoirsunderthegroundorundertheseabedat depthsuptoseveralthousandmeters.
ArecentsurveyoftheU.S.GeologicalSurvey(USGS)estimatedtheworld’soilreservesas 1.6E(12)barrels.8,9 Thedistributionoftheoilreservesamongthemajoroilreservoirsoftheworld isasfollows(inpercent):MiddleEast(42),NorthAmerica,includingUS,CanadaandMexico (15),Russia,includingSiberia(14),NorthandWestAfrica(7.2),SouthandCentralAmerica(6.1), AsiaandPacific(5.5),CaspianBasin(3.5),WesternEurope,includingtheNorthSea(3.1),and others(3.6)(seeFigure2.14).
Takinganaverageheatingvalueofcrudeoilas5.8E(6)Btu/bbl,theworld’soilreservesamount to9280Q.Theworld’soilconsumptionin1995amountedtoabout141Q/y.Ifthatconsumption rateweretocontinueintothefuture,theworld’soilreserveswouldlastonlyforabout65–70years. Ifoilconsumptionkeepsincreasingatarateof1.1%/y,thelifetimeoftheworld’soilreserves wouldbeonlyabout50years.
Ina1998 Science article,Kerrpredictedthatthepeakproductionrateofcrudeoilwilloccur sometimebetween2005and2020.10 Afterthat,theproductionratewilldecline,whichmeansthat theconsumptionratemustalsodecline.Thisalsomeansthattheworld’senergyappetitemustbe suppliedbysourcesotherthanoil.
8U.S.GeologicalSurvey,1997. RankingoftheWorld’sOilandGasReserves.USGSReport97-463.
91barrel(bbl) = 42U.S.gallons = 159liters.SeeTableA.2.
10Kerr,R.A.,1998.TheNextOilCrisisLoomsLarge—andPerhapsClose. Science 281, 1128–1131.
Inadditiontoconventionaloilreserves,vastamountsofhydrocarbonfluidsaredistributedinvarious geologicalformations,suchasoilshalesandtarsands.Oilshaledepositsareknowntoexistin theUnitedStatesintheColoradoBasin(Colorado,Utah,andWyoming)andintheAppalachian Basin(Pennsylvania,Virginia,andWestVirginia).TarsandsarefoundintheCanadianProvince ofAlberta,aswellasinVenezuelaandColombia.IntheUnitedStatesalone,itisestimatedthat depositsofoilshalecontainperhapscloseto2000Qofpetroleum.Withanestimatedrecovery factorof60%,theU.S.oilshalesmaycontainupto1200Q.Thisisabout10timesasmuchas theprovenoilreservesintheUnitedStates.However,theexploitationoftheseunconventional petroleumresourcesmayrequiregreaterfinancialandtechnologicalinvestmentsthanthosefor thediscoveryandextractionofoilreserves.Furthermore,theextractionofpetroleumfromoil shalemayimpacttheenvironmenttoagreaterdegreethanthatofpumpingoilfromon-oroffshorewells.Ontheaverage,oilshalescontainbetween60and120litersofpetroleumpertonof shalerock.Therockmustbeexcavatedandheatedinretortstodriveouttheliquidpetroleum.Thus, asignificantfractionofthederivedpetroleummustbeburntinordertoheattherockforfurther extractionofpetroleum.Theprocesswillrequirecomplexandexpensivecontroltechnologyfor thepreventionofairemissionsandliquideffluents.Also,thespentrockmustbedisposedofinan environmentallysafeandaestheticmanner.Theenvironmentalcontrolsalonewilladdgreatlyto thecostofextractingpetroleumfromtheunconventionalresources.AftertheOPECoilembargoes inthe1970s,aconsortiumofoilcompaniesstartedtoproducepilotscalequantitiesofpetroleum productsfromoilshaledepositsinColorado.However,afterthepricesofcrudeoilfellfroma highof$35perbarrelin1981totheteensinthelate1980s,alloilshaleactivitiesintheUnited Statesceased.
Thecombustiblepartofnaturalgas(NG)consistsmainlyofmethane(CH4)withsomeadmixture ofheavierhydrocarbons(ethane,propane,andbutane).However,frequentlynoncombustiblegases arefoundmixedwithNG,namely,N2 andCO2.Forexample,therecentlydiscoveredgasfields offthecoastoftheIndonesianarchipelagocontainupto70%byvolumeCO2.Ontheaverage, NGcontains74.4%byweightofcarbon,24.8%hydrogen,0.6%nitrogen,and0.2%oxygen.
Ontheaverage,theheatingvalueofNGis23,500Btu/lb(55MJ/kg),or1032Btupercubicfoot (38.5MJ/m3).
Naturalgasisaverydesirablefuelforseveralreasons.First,itiseasytocombustbecause, beingagas,itreadilymixeswithair.Thus,thecombustionisrapidlycompleted,andtheboiler orfurnacevolumeissmallerthanthatrequiredforoilorcoalcombustion.Second,thecombusted gascandirectlydriveagasturbinewithapplicationsinpowergeneration.Third,gascombustion doesnotproduceparticulateandsulfurouspollutants.Fourth,NGproducesone-halftheamount ofCO2 perunitheatingvalueasdoescoal,anditproducesthree-quartersasmuchasoil.
TheUSGSestimateoftheworld’snaturalgasreservesis6.75E(15)cubicfeet.Takingthe heatingvalueofNGas1032Btu/ft3,theworld’sNGreservesamountto6966Q,comparableto thoseofoil.Theworld’srateofconsumptionofNGin1995amountedto77.5Q.Ifthatratewere tocontinueinthefuture,theworld’sprovengasreserveswouldbedepletedinabout85–90years. Ifgasconsumptionkeepsincreasingatarateof2.45%/y,thelifetimeoftheworld’sgasreserves wouldbeonlyabout50years.
Thegasreservesaredistributedamongthemajorreservoirsasfollows(inpercent):Middle East(24.3),Russia,includingSiberia(23),NorthAmerica,includingtheUnitedStates,Canada, andMexico(17.4),AsiaandPacific(7.9),CaspianBasin(6.8),NorthandWestAfrica(5.4),West Europe,includingtheNorthSea(5.2),SouthandCentralAmerica(3.6),andothers(6.4)(see Figure2.15).
Methaneisknowntoexistalsoinunconventionalreservoirs.Theseare(a)gastrappedinsandstone,(b)gastrappedinshalerock,(c)gastrappedincoalseams,(d)gastrappedinpressurizedundergroundwaterreservoirs(“geopressurizedmethane”),and(e)methaneclathrates,also calledhydrates,foundatsomelocationsatthebottomofoceansandicecaps.Methanehydratesarebasicallyicecrystalsinwhichamethane“guest”moleculeistrapped.Hydratesare formedunderthehighpressuresandlowtemperaturesprevailingattheoceanbottomorice caps.ThefirstfourreservoirsintheUnitedStatesalonemayyield600–700Q,whichisabout 70%oftheprovengasreservesintheUnitedStatesandabout10%oftheworld’sprovengas reserves.
Theamountofmethanehydratesattheoceanbottomsandicecapsmayrangefrom1to 2E(16)kg.11 Takingtheheatingvalueofmethaneas4.76E(4)Btu/kg,theheatingvaluestored inmethanehydratescouldamountto5–10E(5)Q,twoordersofmagnitudelargerthanproven gasreserves.However,theamountofgashydratesisspeculative,andnotechnologyexistsyetto recoverthemethanefromgashydrateslayingontheoceanbottomorundericecaps.
Theworld’sprovenfossilfuelreservesaresummarizedinTable2.4.Alsolistedarethelifetimes ofthereservesforthecasethat1995consumptioncontinueswithoutgrowthintothefutureand forthecasethatthe1987–1997growthratecontinuesintothefuture.
Wereviewedthepresentandhistorictrendsofenergyconsumptionandsupplypatternsinthe worldasawhole,aswellasinindividualcountries—byindustrialsector,byend-use,andper capita.Theso-called“developed”countriesconsumeamuchlargeramountofenergyandemita muchhigherrateofCO2 percapitathanthe“lessdeveloped”countries.However,theconverse istrueforenergyuseperGrossDomesticProduct(GDP).The“lessdeveloped”countrieshave ahigherratioofenergyconsumptionandahigheremissionrateofCO2 perdollarGDPthanthe “developed”countries.
Measuredbytheavailableprovenfossilenergyreserves,andpresentrateofconsumption,coal maylast250–300years,oil65–70years,andnaturalgas85–90years.Unconventionalfossilenergy resources,suchasoilshale,tarsands,geopressurizedmethane,andmethanehydrates,mayextend thelifetimeoffossilfuelsseveralfold,buttheirexploitationwillrequiregreatlyincreasedcapital investmentandimprovedtechnology.Thepriceofthedeliveredproductwillbemuchhigherthan iscurrentlypaidforthesecommodities.
Themajorconclusionisthatforthesakeofhusbandingthefossilfuelreserves,aswellas forthesakeofmitigatingairpollutionandtheCO2-causedglobalwarming,mankindoughtto conservethesefuels,increasetheefficiencyoftheiruses,andshifttononfossilenergysources.
Problem2.1
FromFigure2.1determinetherateofgrowth r (%/y)ofenergyconsumptionfortheyears1970–2000.Fortheindustrialcountriesusealinearleast-squarefitthroughthedatapoints.Usethe interceptat1970asabase.Forthedevelopingcountriesuseanexponentialfit, Q{t}= Q0 exp{rt}
Problem2.2
FromTable2.1produceabarchartofenergyusepercapita(GJ/capy)forthelistedcountries. Drawadashedlinethroughthebarsattheleveloftheworld’saveragepercapitaenergyuse.Do thesameforenergyuseperdollarofGDP(MJ/$GDP).
Problem2.3
FromFigure2.3determinetherateofgrowth r (%/y)forcoal,oil,andnaturalgasfortheyears 1970–2000.Forcoalusealinearleast-squarefitthroughthedatapointswiththeinterceptat1970 asabase;foroilandgasuseanexponentialfit.
Problem2.4
FromTable2.2produceabarchartofcarbonemissions(kgC/capy)forthelistedcountries.Draw adashedlinethroughthebarsataleveloftheworld’saveragecarbonemissions.Dothesame forcarbonemissionsinkgC/$GDPwithadashedlinefortheaverageof(a)theUnitedStates, Canada,Japan,Germany,France,Italy,UnitedKingdom,Norway,Sweden,andNewZealandand (b)Russia,China,India,Indonesia,andMexico.Whyistheaverageemissionper$GDPsomuch lowerforthegroupofcountries(a)andsomuchhigherforcountries(b)?
Problem2.5
BasedonFigure2.8,drawlinearbestfitlinesthroughthedatapointsofU.S.energyconsumption(Q/y)fortheyears1973–1996forthethreesectors:industry,residential–commercialand transportation.Determinetherateofgrowthordeclinein%/y,usingtheinterceptat1973asabase.
Problem2.6
Byconsultingtherelevantliterature,trytogiverealisticestimatesofenergysavings,inpercent, intheU.S.residentialsectorforappliances,lighting,spaceheat,waterheat,andairconditioning overthenext20years.
Problem2.7
DothesameforU.S.personalautomobilesincludingsportutilityvehicles(SUV).Useavailable literatureandChapter8foryourestimates.
Problem2.8
FromTable2.3calculatethehigherheatingvalue(HHV)forU.S.coalsinkJ/kg.
Problem2.9
Theworld’scoalreservesareestimatedtobe24,000Q.HowmuchisthatinEJ?Whatwillbethe lifetimeofcoalreservesifthepresentconsumptionrateof93Q/ycontinuesintothefutureandif theconsumptionincreasesby r = 0 5,0.8,and1%/y?(Thelifetime T ofareserveiscalculated from T = r 1{ln[r (QT/Q0) + 1]},where r istherateofgrowthofconsumption, QT isthetotal reserve,and Q0 isthepresentconsumptionrate.)
Problem2.10
Theworld’soilreservesareestimatedatcloseto10,000Q.Thepresentconsumptionrateis140Q/y. Whatwillbethelifetimeofoilreservesifthepresentconsumptionratecontinuesintothefuture andiftheconsumptionrateincreasesby1%/y,1.5%/y,and2%/y?
Problem2.11
Theworld’snaturalgasreservesareestimatedatcloseto7000Q.Thepresentconsumptionrate is80Q/y.WhatwillbethelifetimeofNGreservesifthepresentconsumptionratecontinuesinto thefutureandiftheconsumptionrateincreasesby2%/y,2.5%/y,and3%/y?Tabulateresultsof Problems2.9–2.11intheformofTable2.4.
Problem2.12
Estimatetheproportions(%)ofworld’senergyconsumptionin2050suppliedbyprimaryenergy sourcesasshowninFigure2.2for1997.Justifyyourproportionsonthebasisofwhatyouread andknowonthepredictedavailability,acceptability,andcostoftheenergyresources.
AnnualReviewofEnergy, 1975–1999.Volumes1–24.PaloAlto:AnnualReviews. Kraushaar,J.J.,andR.A.Ristinen,1993. EnergyandtheProblemsofaTechnicalSociety, 2ndedition.New York:JohnWiley&Sons.
Matare,H.F.,1989. Energy:FactsandFuture.BocaRaton:CRCPress.
Tester,J.F.,D.O.Wood,andN.A.Ferrari,Ed.,1991. EnergyandtheEnvironmentinthe21stCentury Cambridge:MITPress.
U.S.DepartmentofEnergy,EnergyInformationAgency,1997. InternationalEnergyOutlook.Washington, D.C.:DOE/IEA-048(97).
U.S.DepartmentofEnergy,EnergyInformationAgency,2000. InternationalEnergyOutlook.Washington, D.C.:DOE/IEA-0484(2000).
Thedevelopmentofthesteamengine,aninventionthatpoweredthefirsttwocenturiesofthe industrialrevolution,precededthediscoveryofthescientificprincipleinvolved—namely,the productionofmechanicalworkinadevicethatutilizesthecombustionoffuelinair.Thescientific understandingthatexplainstheproductionofworkindifferentkindsofcombustionenginesis derivedfromthelawsofthermodynamics,developedinthenineteenthcentury.Inthetwentieth centurytheseprinciplesaidedthedevelopmentofenginesotherthanthesteamengine,suchasthe reciprocatinggasolineanddieselengines,thegasturbine,andthefuelcell.Withtheaidofthis scientifichindsight,inthischapterwewillreviewhowthelawsofthermodynamicsdeterminethe functioningofthesesourcesofmechanicalenergy,andespeciallyhowtheylimittheamountof mechanicalworkthatcanbegeneratedfromtheburningofagivenamountoffuel.
Thesourceofmechanicalpowerdevelopedfromthecombustionoffossilfuelsorthefission ofnuclearfuelinanengineistheenergyreleasedbythechangeinmolecularornuclearcomposition.Thisreleasedenergyisneverlostbutistransformedintootherforms,appearingassome combinationofmechanicalorelectricenergy,internalenergyofthemolecularornuclearproducts ofthereactions,orenergychangesexternaltotheenginecausedbyheattransferfromit.This conservationofenergyisexplicitlyexpressedbythefirstlawofthermodynamics.
Theprincipleofenergyconservation,orfirstlaw,placesanupperlimitontheconversionof chemicalornuclearenergytomechanicalwork;thatis,theworkofanenginecannotexceedthe energyavailable.Experienceshowsthattheworkisverysignificantlylessthantheenergyreleased byfuelreactionsinengines,amatterhavingimportantpracticalconsequences.Thescientific principlethatexplainswhy,andbyhowmuch,thereisaworkshortfalliscalledthesecondlaw ofthermodynamics.Incombinationwiththefirstlaw,itenablesustounderstandthelimitsto producingworkfromfuelandtoimprovetheenginesthathavebeeninventedtoaccomplish thistask.
Thelawsofthermodynamicscannotsubstituteforinvention,buttheydoinformusofthe performancelimitsofaperfectedinvention.Inthischapterwereviewtheprinciplesofoperationof themajorinventionsthattransformchemicaltomechanicalenergy:thesteamengine,thegasoline anddieselengines,thegasturbine,andthefuelcell.Ineachcaseweshowthatthelawsof thermodynamicsprovidelimitsonhowmuchofthefuel’senergycanbeconvertedtoworkand
describehowvariousdebilitatingfactorsreducetheworkoutputofpracticaldevicestovalues belowthislimit.Thermodynamicanalysesofthistypeprovideguidanceforimprovingtheenergy efficiencyofmechanicalpowerproduction.
Inthenextfivesectionsofthischapterwesummarizetherelevantprinciplesofthermodynamics asembodiedinitstwolaws,includingtheconceptsofenergy,work,andheat,thedefinitionof usefulthermodynamicfunctions,andtheirapplicationtothesteadyflowofworkingfluids,such asairandcombustiongases.Wethenproceedtothespecialapplicationofthecombustionoffuels andthevariousthermodynamiccyclesthatexplainhowcommonheatandcombustionengines function.Asubsequentsectiontreatsseparatelythefuelcell,amorerecentdevelopmentthat operatesonadifferentprinciplethanheatengines,producingworkdirectlyinelectricalform.The fuelefficienciesofvariouspower-producingcyclesarethensummarized.Thechapterconcludes withashortdiscussionoftheenergyefficiencyofsyntheticfuelproduction.
Theconceptofenergy,whichoriginatedwithAristotle,hasalonghistorybothinscienceandas acolloquialterm.Itisacentralconceptinclassicalandquantummechanics,whereitappears asaconstantofthemotionofmechanicalsystems.Inthescienceofthermodynamics,energy hasadistinctdefinitionthatdistinguishesitfromheat,work,orpower.Inthissectionwedefine thermodynamicenergyasaquantitythatisderivedfromanunderstandingofthephysicaland chemicalpropertiesofmatter.
Newtonianmechanicsidentifiestwoformsofenergy,the kineticenergy ofamovingbodyandthe potentialenergy ofthefieldofforcetowhichthebodyissubject.Thekineticenergy KE isequal totheproductofthemass M ofthebodytimesone-halfofthesquareofitsvelocity V,
Thepotentialenergy PE ofabodysubjecttoaforce F{r} atalocation r inspaceisequaltothe workdoneinmovingthebodytothelocation r fromareferenceposition rref ,
Whilethekineticenergyhasalwaysapositivevaluewithazerominimum,thepotentialenergy’s valueismeasuredwithrespecttothereferencevalueandmaybepositiveornegative.
OneconsequenceofNewton’slawsofmotionofabodyinaforcefieldisthatthesumofthe kineticandpotentialenergiesisaconstantofthemotion;thatis,itisnotafunctionoftime.Calling thissumthetotalenergy E,wehave E ≡ KE + PE = constant
Absentanyotherforceappliedtothebody,itsenergy E isunchangeddespiteitsmovementwithin theregionofspaceavailabletoit.Wemaycallthisthe principleofconservationofenergy Asimpleexampleofthemotionofabodythatpossesseskineticandpotentialenergyisthatof asatellitemovinginorbitaroundtheearth.Thepotentialenergyisthatofthesatellitemassinthe earth’sgravitationalfield,whichincreasesinverselyinproportiontothedistanceofthesatellite fromthecenteroftheearth.Ifthesatelliteisinaneccentricorbitabouttheearth,theconservation ofenergyrequiresthatthesatellitespeed(andkineticenergy)isamaximumwhereitdipsclosest totheearth’ssurface.
Itispossibletochangetheenergy E ofabodybyactinguponitwithanexternalforce.In thecaseofthesatellite,aquickimpulsefromitsrocketenginecanchangeitsvelocityandkinetic energy,therebychangingitstotalenergy E.Theamountbywhichthetotalenergy E ischangedis directlyrelatedtotheamountoftherocketimpulse.Itistherebypossibletoextendthestatement oftheconservationofenergybytakingintoaccountthechangesin E broughtaboutbyexternal impulsesappliedtothemovingbody.Thisisthemostgeneralformoftheprincipleofconservation ofenergy.
Thematterofamacroscopicbodyiscomposedofmicroscopicatomsand/ormolecules(themselves aggregatesofatoms).Sometimes,asforgases,thesemoleculesaresowidelyseparatedinspace thattheymaybeconsideredtobemovingindependentlyofeachother,eachpossessingadistinct totalenergy.Otherwise,inthecaseofliquidsorsolids,eachmoleculeisundertheinfluenceof forcesexertedbynearbymolecules,andwecanonlydistinguishtheaggregateenergyofallthe moleculesofthebody.Wecallthisenergythe internalenergy andgiveitthesymbol U.Even thoughthemotionofmicroscopicmoleculesisnotdescribablebyNewtonianmechanics,itisstill possibletoconsidertheirtotalenergytobethesumofthekineticenergiesoftheirmotionandthe potentialenergiesoftheirintermolecularforces.
Itisnotpossibletoobservedirectlytheenergiesofindividualatomsofathermodynamic substance,butchangesinitsinternalenergyareindirectlymeasurablebychangesintemperature, pressure,anddensity.Theseobservables,calledthermodynamicstatevariables,arethesurrogates forspecifyinginternalenergy.
Moleculesaredistinctstablearrangementsofatomicspecies.Theiratomsareheldtogetherby strongforcesthatresistrearrangementoftheatoms.Todisassembleamoleculeintoitscomponent atomsusuallyrequirestheexpenditureofenergy,sothatthemoleculesofabodymaybeconsidered topossessanenergyofformationrelatedtohowmuchenergywasinvolvedinassemblingthem fromtheirconstituentatoms.Iftheinternalenergy U ofamaterialbodyischanged,butthe individualmoleculesremainintact,thentheirchemicalenergyofformationremainsunchanged andcontributesnothingtothechangein U.Ontheotherhand,ifachemicalchangeoccurs,so thatnewmolecularspeciesareformedfromtheatomspresentintheoriginalspecies,therewill bearedistributionofenergyamongthecomponentsoftheinternalenergy,ofwhichthechemical energyofformationofthemoleculesmustbetakenintoaccount.
Asimilarenergychangeaccompaniestheformationofnewatomicnucleiinthefissionofthe nucleiofheavyelementsorthefusionoflightones.Becausethebindingforcesthatholdnuclei
togetheraresomuchlargerthenthosethatholdmoleculestogether,nuclearreactionsaremuchmore energeticthanmolecularones.Nevertheless,wecanconsiderbothmoleculesandatomicnuclei topossessenergiesofformationthatmustbetakenintoaccountinexpressingtheconservationof energyformaterialbodiesthatexperiencechemicalornuclearchangesincomposition.
Moleculesthatpossessamagneticorelectricdipolemomentcanstoreenergywhentheyarein thepresenceofamagneticorelectricfield,intheformofmagneticorelectricpolarizationofthe material.Thisenergyisassociatedwiththeinteractionofthemoleculardipolesofthematerial bodywiththeexternalelectricchargesandcurrentsthatgiverisetotheappliedelectricormagnetic field.Sincecapacitorsandinductorsarecommoncomponentsofelectronicandelectricalcircuits, thisformofenergyisimportanttotheirfunctioning.
Thevariousformsofenergythatcanbepossessedbyamaterialbody,asdescribedabove,canbe addedtogethertodefineatotalenergy,towhichwegivethesymbol E,
Itisveryseldomthatmorethanjustafewoftheseformsaresignificantinanypracticalprocess forwhichtherearechangesinthetotalenergy.Therearemanyexamples.Inagasolineengine,the combustionofthefuel–airmixtureinvolves U and Echem ;inasteamandgasturbine,only KE and U change;inanuclearpowerplantfuelrod, U and Enuc areinvolved;andinamagneticcryogenic refrigerator, U and Emag areimportant.Nevertheless,themannerinwhichthevariousformsof energyenterintothelawsofthermodynamicsisexpressedthroughthetotalenergy E,aresultof verygreatgeneralityandconsequence.
Thermodynamicsdealswiththeinteractionofathermodynamicmaterialsystemanditsenvironment.1 Itisthroughsuchinteractionsthatweareabletogeneratemechanicalpowerorotheruseful effectsintheenvironment.Therearetwoquitedifferentbutimportantmodesofinteractionofa systemwithitsenvironment,calledtheworkinteractionandtheheatinteraction.Eachoftheseis aprocessinwhich,overtime,thesystemanditsenvironmentundergophysicaland/orchemical changesrelatedtothekindofinteractiontakingplace,eitherworkorheat(orbothsimultaneously). Asweshallseebelow,workandheatinteractionsaredistinguishablefromeachotherbythe characterofthechangesinthesystemandtheenvironment.Botharequantifiableintermsofthe interaction,beingexpressedinenergyunits.Neitherisaformofenergy,butonlyatransaction
quantitythataccountsforthecharacteroftheexchangeofenergybetweenathermodynamicsystem anditsenvironment.
Newtonianmechanicsemploystheconceptofworkastheexertionofaforceactingthrougha displacementoracoupleactingthroughanangulardisplacement.2 Wesaythattheamountof workrequiredtoliftamass m throughaverticaldistance r intheearth’sgravitationalfieldisthe productofthemagnitudeofthegravityforce, mg,timesthedistance r,where g isthemagnitude ofthelocalaccelerationofgravity.Inthermodynamics,byconvention,positiveworkisdefined tobetheproductoftheforceexertedbyasystemontheenvironmenttimesanydisplacementof theenvironmentthatoccurswhiletheforceisacting.(ByNewton’sprinciple,theforcethatthe systemexertsontheenvironmentisequalinmagnitudebutoppositeindirectiontotheforcethat theenvironmentexertsonthesystem.)Iftheforce Fen exertedontheenvironmentbythesystem isaccompaniedbyanincrementaldisplacement dren oftheenvironmentinthedirectionof Fen , theincrementofworkmaybeexpressedas
Whenthesystemdoesworkontheenvironment, dW ispositive;whentheenvironmentdoeswork onthesystem,then dW isnegative.
Therearemanysimpleexamplesofaworkinteraction.Ifagasiscontainedinacircular cylindercappedatoneendandfittedwithamovablepistonattheother,thentheforceexertedby thegasonthatportionoftheenvironmentthatisthemovablepistonis pA,where p isthegas pressureand A isthepistonfacearea.Ifthepistonisdisplacedanincrementaldistance dren inthe directionofthepressureforce pA,thepositiveworkincrement dW inthisdisplacementis
where dV = Adren istheincrementinthevolume V ofthegasinthecylinder.Orthework interactionwiththeenvironmentmayinvolvethemovementofanincrementofelectriccharge dQen throughanincreaseinelectricpotential φen ,suchaswhenacurrentflowsfromthesystem toandfromanelectricmotorintheenvironment,forwhichtheworkincrementis
Anothercommonexampleistherotationoftheshaftofaturbine(amaterialsystem)thatapplies atorque Ten (orcouple)toanelectricgenerator(theenvironment)attachedtotheturbine,rotating itthroughanincrementofangle dθen inthesamedirectionasthetorque,givingrisetoapositive workincrement,
Thesearebutafewspecificexamplesofthemanypossiblekindsofworkinteractionbetweena thermodynamicsystemanditsenvironment.
Weareveryfamiliarwiththeprocesseswherebysubstancesarewarmedorcooled.Cookingor refrigeratingfoodrequiresincreasingordecreasingitstemperaturebybringingitintocontactwith awarmerorcoolerenvironment.Atemperaturedifferencebetweenasystemanditsenvironment isrequiredforaheatinteractiontotranspire.Iftheenvironmentundergoesatemperatureincrease afterasystemwarmerthantheenvironmentisbroughtintocontactwithit,thenaheatinteraction hastakenplace.Theincrementalamountoftheheatinteraction dQ,whichinthiscaseequalsthe energytransferfromthesystemtotheenvironment,isequaltotheproductoftheheatcapacity Cen oftheenvironmenttimesitstemperatureincrease dTen .Butbyconventiontheenergytransferred to asysteminaheatinteractionisregardedasapositivequantitysothatinthiscasetheenergy transferisnegative.Consequently,
Weusuallydescribethisinteractionas heattransfer, althoughitisenergywhichisbeingexchanged inaprocesssolelyinvolvingaheatinteraction.
Bothheatandworkquantitiesinvolvedinaninteractionofasystemanditsenvironment arerecognizedbytheireffectsintheenvironment,asdescribedinequations(3.2)–(3.6)above. Furthermore,bothheatandworkinteractionsmayoccursimultaneously,beingdistinguishableby theirdifferentphysicaleffectsintheenvironment(e.g., Fen dren vs. Cen dTen ).
Thefirstlawofthermodynamicsisanenergyconservationprinciple.Itrelatestheincremental changeinenergy dE ofasystemwiththeincrementsofwork dW andheat dQ recognizableinthe environmentduringaninteractionofthesystemwithitsenvironment.Inwords,itstatesthatthe incrementinsystemenergy dE equalstheincrementinheat dQ transferredtothesystemminus thework dW donebythesystemontheenvironment,
Itisanenergyconservationprincipleinthesensethatthesumofthesystemenergychange dE, thework dW,andtheheat dQ addedtotheenvironmentiszero;thatis,thissumisaconserved quantityinanyinteractionwiththeenvironment.
Equation(3.7)expressesthefirstlawindifferentialform.Ifmanysuccessiveincremental changesareaddedtoaccomplishafinitechangeinthesystemenergy E fromaninitialstate i toa finalstate f ,thefirstlawmaybeexpressedinintegralformas
Inthisform,thefirstlawexpressesthefinitechangeinenergyofthesystemasequaltothesumof theheattransferredtothesystemminustheworkdonebythesystemontheenvironmentduring theprocessthatbroughtaboutthechangefromtheinitialtothefinalstate.
Theintegralsoftheheatandworkquantitiesontheright-handsideoftheequation(3.8)cannot beevaluatedunlessthedetailsoftheprocessthatcausedthechangefromtheinitialtothefinal stateofthesystemisknown.Infact,theremaybemanydifferentprocessesthatcanbringaboutthe samechangeinenergyofthesystem,eachdistinguishedbydifferentamountsofheatandwork, butallhavingincommonthatthesumoftheheatandworkquantitiesaddedtotheenvironment arethesameforallsuchprocessesthatchangethesystemfromthesameinitialtofinalstates.
Insomepower-producingandrefrigerationsystems,aworkingfluidundergoesaseriesof heating,cooling,andworkprocessesthatreturnsthefluidtoitsinitialstate.Because E f = Ei for suchacyclicprocess,theintegralexpressionofthefirstlawofthermodynamics,equation(3.8), hastheform
wherethesymbol identifiesthecyclicprocessforwhichtheheatandworkintegralsareevaluated. Inotherwords,inacyclicprocessthenetheatandworkquantitiesareequal.
Thegoalofengineerswhodesignpowerplantsistodeviseasystemtoconverttheenergyofafuel intousefulwork.Ifweconsiderthecombustionofafossilfueltoprovideasourceofheating,then thedesirableobjectiveistoconvertallofthefuelenergytowork,asthefirstlaw,equation(3.9), allows.However,thesecondlawofthermodynamicsstatesthatitisnotpossibletodeviseacyclic processinwhichheatingsuppliedfromasinglesourceisconvertedentirelytowork.Instead,only someoftheheatmaybeconvertedtowork;theremaindermustberejectedtoaheatsinkatalower temperaturethantheheatsource.Inthatwaythenetoftheheataddedandsubtractedinthecycle equalstheworkdone,asthefirstlawrequires.
Itisnotpossibletoexpressdirectlythissecondlawstatementintheformofanequation. However,itispossibletodeducethreeimportantconsequencesofthesecondlaw.Thefirstisthat thereexistsanabsolutetemperaturescale,denotedby T ,whichisindependentofthephysical propertiesofanysubstanceandwhichhasonlypositivevalues.Thesecondisthatthereisa thermodynamicpropertycalledentropy,denotedby S,whoseincrementalchangeisequaltothe heatinteractionquantity dQ dividedbythesystemtemperature T foranyincrementalprocessin whichthesystemtemperatureremainsspatiallyuniform,calledareversibleheataddition,or
Asaconsequence,inaprocessforwhich dQ = 0,whichiscalledan adiabatic process,the entropymayremainthesameorincreasebutmayneverdecrease.Anadiabaticprocessforwhich theentropyincreasesisanirreversibleprocessbecausethereverseofthisprocess,forwhichthe entropywoulddecrease(dS < 0),violatesthesecondlawasexpressedinClausius’inequality. TherearemanyimportantconsequencesofClausius’inequalitythatwewillnotexaminein detailinthischapter,butwillbeidentifiedassuchattheappropriateoccasionofuse.Amongthem aretheconditionsforthermodynamicequilibrium,includingthermochemicalequilibrium,andthe limitsontheproductionofusefulworkincyclesorprocesses.3
Themostcommonmethodsforutilizingtheenergyoffossilornuclearfuelsrequiretheuseof fluidsasthemeanstogeneratemechanicalpowerortotransportenergytoadesiredlocation.The thermodynamicpropertiesoffluidstherebyassumeagreatimportanceinthesystemsthattransform energy.
Weknowthatinasteampowerplanttheworkingfluid,water,undergoeslargechangesin temperatureandpressureasitmovesthroughtheboiler,turbine,andcondenser.Thethermodynamic propertiespressure p andtemperature T arecalled intensive propertiesbecausetheirvaluesarenot proportionatetothemassofafluidsamplebutarethesameatallpointswithinthesample.Onthe otherhand,theenergy E,volume V,andentropy S are extensive propertiesinthattheirvaluesare directlyproportionatetothemassofafluidsample.4 Butifwedivideanextensiveproperty,such as E,bythemass M offluidwhoseenergyis E,thentheratio E/M,calledthe specificenergy, is independentoftheamount M offluid.Denotingspecificextensivepropertiesbyalowercaseletter, wehaveforthespecificenergy e,volume v,andentropy s
Theuseofspecificextensivepropertiessimplifiestheanalysisofthermodynamicsystemsutilizing fluidsandothermaterialstoproduceworkortransformenergy.Byfollowingthechangesexperiencedbyaunitmassofmaterialasitundergoesachangewithinthesystem,theworkandheat quantitiesperunitmassmaybedetermined.Thetotalworkandheatamountsforthesystemmay thenbecalculatedbymultiplyingtheunitquantitiesbythetotalmassutilizedintheprocess.
Thefirstandsecondlawproperties,energyandentropy,aresometimesnotconvenientto useinanalyzingthebehaviorofthermodynamicsystems.Rather,particularcombinationsofthe properties p, T,v, e,and s turnouttobemorehelpful.Oneoftheseusefulpropertiesiscalledthe
3Thethirdlawofthermodynamicsisanadditionalprinciplethatiscloselyrelatedtothesecondlaw.Itstates thattheentropyofallthermodynamicsystemsiszeroattheabsolutezerooftemperature.Amongotherthings, itisimportanttothedeterminationofthefreeenergychangeincombustionreactions.
4Inthefollowingdiscussion,wedisregardthekineticandpotentialenergycomponentsofthetotalenergyas expressedinequation(3.1)asweareconsideringthepropertiesofasystemthatisstationaryintheearth’s gravityfield.Whenitisnecessarytotakethismotionintoaccount,asinaflowthroughaturbine,wewill explicitlyaddtheseadditionalenergycomponentsattheappropriatepoint.
h ≡ e + pv
Theenthalpyhasasimplephysicalinterpretation.Supposeaunitmassofmaterialissurroundedby anenvironmentinwhichthepressureisfixedandequaltothepressure p ofthesystem.Ifasmall amountofheat, dq,isaddedtothesystem,itstemperaturewillriseanditwillexpand,undergoing anincrementofvolume dv andperforminganamountofwork dw = pdv ontheenvironment. Accordingtothefirstlaw,equation(3.7),theheatandworkamountschangetheenergy e:
de = dq pdv
dq = de + pdv = de + d( pv) = d(e + pv) = dh
wheretheequality pdv = d( pv) followsfromtheconstancyof p inthisprocess.Thustheamount ofheataddedinaconstantpressureprocessisequaltotheincreaseinenthalpyofthematerial.The ratiooftheincreaseinenthalpy,atfixedpressure,totheincrementoftemperatureexperiencedin thisprocessiscalledthe constant-pressurespecificheat andisgiventhesymbol c p, 5
Whenweconsiderasimilarheatingatfixedvolume,noworkisdoneandtheincreaseinenergy de isequaltotheheatincrement dq.Theratiooftheenergyincreasetotheconcomitanttemperature increaseiscalledthe constant-volumespecificheat,cv ,
Foraprocessthatproceedsatconstanttemperatureandpressure,thesecondlawofthermodynamics requiresthattheamountofworkdonebyasystemcannotexceedthereductionoffreeenergy f .The freeenergyisausefulthermodynamicfunctionincasesofchemicalorphasechange.Forexample, asampleofliquidwaterandwatervaporcanbeheldinequilibriumattheboilingtemperature correspondingtothesamplepressure.Ifheatisaddedwhilethepressureremainsfixed,some liquidisconvertedtovaporbutthetemperatureremainsunchanged.Forthisheattransferprocess atfixedtemperatureandpressure,thefreeenergy f isunchanged.InSection3.12weshallusethe freeenergytodeterminethelimitingperformanceofelectrochemicalcells.
5Inthisexpression, h{ p, T } isconsideredapropertydependinguponthepressure p andtemperature T .The partialderivative ∂h/∂ T istakenwithrespectto T holding p fixed.Asimilarconstraintisimpliedinequation (3.15)below,where e{v, T } isafunctionofvolume v andtemperature T
Itispossibletoexpresstherelationshipbetweenthesepropertiesindifferentialformbynoting that,forareversibleprocess, dq = Tds byequation(3.10),sothat
Manythermodynamicsystemsincorporatecomponentsthroughwhichafluidflowsatamass flowrate m thatisinvariantintime,whichwecall steadyflow.Thatistrueforthecompressor, combustor,andturbineofagasturbinepowerplant;fortheboiler,steamturbine,condenser,and feedpumpofasteampowerplant;butnotforthecylinderofanautomobileengine,wherethe flowisintermittent.6 Iftheflowissteady,thefirstlawmaybeexpressedinaformthatrelatesthe thermodynamicpropertiesoftheinflowingandoutflowingfluidstreamswiththerates ˙ Q and ˙ W atwhichheatisaddedtoandworkisdonebythefluidwithinthecomponentinquestion,
˙ W (3.20)
wherethesubscripts out and in identifythethermodynamicstateofthefluidattheoutletandinlet ofthecomponent.7 Foraboiler, Q wouldbetherateatwhichheatisaddedtochangethewater flowtosteam;forasteamturbine, W isthemechanicalpowerdeliveredbytheturbineasitsshaft rotatestodriveanelectricgeneratororothermechanicalload.Ifwedivideequation(3.20)by ˙ m, then q ≡ Q/m and w ≡ W/m aretheheatandworkquantitiesperunitmassoffluidflowing throughthedevice;thechangeinfluidenthalpy hout hin isthenequaltothesumoftheseterms, hout hin = q w (3.21)
Manypowerplantcomponentsbelongtooneoftwocategories:adiabatic( ˙ Q = 0)devices thatdeliverorabsorbmechanicalpower(e.g.,turbines,pumps,compressors)orworkless( ˙ W = 0) heatexchangersinwhichafluidisheatedorcooled.Thecombustionchamberofagasturbine powerplantisanexceptiontothisrule,becauseitisbothadiabaticandworkless.
Whilethelawsofthermodynamicstellushowmuchworkcanbegeneratedbyaddingandsubtractingheatfromaworkingfluid,theydon’ttellushowquicklywecanaccomplishthistask,a
6Whenoperatedatasteadyspeed,theinflowsoffuelandairandoutflowofexhaustgasfromanautomobile enginemayberegardedassteady,sothatsteadyflowequation(3.20)belowmaybeapplied.
7Wehaveomittedinthisexpressionthecontributionsofthekineticandpotentialenergiesofthefluid,which inmanycasesarenegligiblecomparedtotheotherquantities.
matterofgreatpracticalconsequencebecausethetimerateofexchangeofworkandheatquantitiesdeterminethemechanicalorthermalpowerthatcanbeproduced.Themorepowerthatcan begeneratedfromagivenmassofmaterial,atagivencost,themoredesirablethepowersystem becomes.
Dependinguponthecircumstances,wemaywanttoaugmentordiminishtherateatwhich heatflowsfromhottocoldenvironments.Forexample,asteampowerplantboilerisdesigned tofacilitatetherapidheatingofthecirculatingwaterbythehotcombustiongases,theheat beingtransferredthroughthewallofthemetaltubeswithinwhichthewaterflowsandoutside ofwhichthehotgasescirculate.Ontheotherhand,whenheatingabuilding’sinteriorspacein wintermonths,thelossofheattothecoldexteriorenvironmentisminimizedbyinstallingthermal insulationinthewalls.
Inmostcasesofsteadyheattransferfromahottoacoldenvironment,thetimerateofheat transfer Q mayberepresentedby8
where Th Tc isthetemperaturedifferencebetweenthehotandcoldenvironments, A isthe surfaceareaofmaterialthatseparatesthetwoenvironmentsandacrosswhichtheheatflows,and U isthe heattransfercoefficient, apropertyofthematerialseparatingthetwoenvironments.9 To attainhighvaluesof U,oneshoulduseathinlayerofamaterial,suchascopper,thatisagood heatconductorandprovidevigorousmotionofthehotandcoldfluidswithwhichitisincontact. Toobtainlowthermalconductances,oneneedsthicklayersofthermallyinsulatingmaterial,like foamedplastics.
Heatexchangersarepassivedevicesthataccomplishatransferofheat,usuallybetweentwo streamsoffluids,onehotandtheothercold.Typically,onefluidflowsinsideparallelcylindrical tubeswhiletheotherfluidflowsoutsideofthem.Inasteamboiler,forexample,thecoldwater (orsteam)flowsinsidethetubeswhilethehotcombustiongasesflowaroundthem.Similarly, inasteampowerplantcondenserthecoldcoolingwaterflowsthroughthetubeswhilethehot exhauststeamfromtheturbinepassesoutsidethetubes,condensingonthecoldsurface.Theuse ofheatexchangersisoftennecessarytothefunctioningofapowerplant,asintheseexamples, buttheynecessarilyexactpenaltiesintheformoflossofmechanicalpower,increasedeconomic cost,andreducedthermodynamicefficiency.Asanexampleofthelatter,considerthedesignof acondenserthatmusttransferafixedamountofheatperunittime, ˙ Q.Accordingtoequation (3.22),wecouldreduceitssize(A),andtherebyitscost,byincreasingthetemperaturedifference (Th Tc) andtherebyreducethesteamcycleefficiency.Alternatively,wecouldincreasethe heattransfercoefficient U bypumpingthecoolingwaterthroughthetubesatahigherspeed,but thatwouldincuranextrapumpingpowerloss.Asaconsequence,thetransferofheatatfinite ratesinthermodynamicsystemsinevitablyincursperformancepenaltiesthatcannotbereduced tozeroexceptbytheexpenditureofinfiniteamountsofcapital.Fortunately,theseperformance
8Thisexpressionisnotathermodynamiclaw,althoughitisinagreementwiththerequirementofthesecond lawthatheatcanbetransferredonlyfromahottoacoldbody,notthereverse.
9Theproduct U A iscalledthethermalconductance,inanalogywiththeelectricalconductanceofanelectric circuit,whichistheratiooftheelectriccurrent(analogoustotheheatflux Q)tothevoltagedifference (analogoustothetemperaturedifference Th Tc).
penaltiescanbelimitedtoacceptablelevelsatacostcommensuratewiththatofothercomponents ofthesystem.
Thesourceofenergythatisutilizedinfossil-fueledpowersystemsisthechemicalenergythatis releasedwhenafuelisoxidizedbyburninginair.Themostcommonfossilfuelsarehydrocarbons— thatis,mixturesofmoleculescomposedofcarbonandhydrogen.10 Upontheircompletecombustion,thecarboninthefuelisoxidizedtocarbondioxideandthehydrogentowatervapor.The energymadeavailableinthisoxidationisthenetamountreleasedwhenthecarbonandhydrogenatomsareseparatedfromeachotherandsubsequentlycombinedwithoxygentoformcarbon dioxideandwater.
DenotingahydrocarbonfuelmoleculeasCn Hm ,where n and m denotethenumberofcarbon andhydrogenatomsinafuelmolecule,themolecularrearrangementaccompanyingcomplete oxidationofthecarbonandhydrogenmayberepresentedbythereaction
Foreachhydrocarbonmolecule, n + m/4diatomicoxygenmoleculesarerequiredtoconvertthe carbonandhydrogento n moleculesofCO2 and m/2moleculesofH2O.Theratioofthenumber ofoxygenmoleculestothenumberoffuelmolecules, n + m/4,iscalledthe stoichiometricratio. Itmaybeexpressedalternativelyasamassratiobymultiplyingthenumberofmoleculesbytheir molecularmasses,yielding
Thismassratioliesintherangebetween8/3 = 2.667(forpurecarbon)and7.937(forpure hydrogen),beingafunctionofthemolarratio m/n only.
Becausefossilfuelsinvariablyareburnedinair,thestoichiometricproportionsaremore usefullyexpressedintermsoftheratioofairmasstofuelmassbymultiplyingequation(3.24)by theratioofthemassofairtothemassofoxygeninair,whichis4.319:
Iflessairisavailablethanisrequiredforastoichiometricproportion,thennotallofthecarbon orhydrogenwillbefullyoxidizedandsomeamountofCO,solidC,orH2 maybepresentinthe productsofcombustion.Insuch“rich”mixturesnotalloftheavailablechemicalenergyisreleased inthe(incomplete)combustionprocess.Ontheotherhand,ifextraorexcessairisavailable,then notalloftheoxygenavailableisneededandsomewillremainunconsumedinthecombustion
10Syntheticfuelsmadefromhydrocarbonsmayincludeoxygen-containingcomponentssuchasalcoholsand carbonmonoxide.
products,butallofthefuel’schemicalenergywillhavebeenreleasedinthecombustionofthis “lean”mixture.
Whenamixtureoffuelandairisburned,thetemperatureofthecombustionproductsformedis muchhigherthanthatofthefuel–airmixture.Insomeinstances,heatmaybetransferredfromthe hotcombustionproductstoacolderfluid;forexample,inasteamboiler,thisheatcausesthewater towarmandthenboiltosteam.Theamountofheatavailableforthispurposeiscalledthefuel heatingvalueandisusuallyexpressedinenergyunitsperunitmassoffuel.
Consideracombustionchamberthatissuppliedwithasteadyflowofafuel–airmixture(the reactants)atapressure pr andtemperature Tr .Ifthefuelisburnedatconstantpressure pr and ifnoheatislostfromthecombustionchamber( ˙ Q = 0),thentheproductgastemperature Tp willbehigherthan Tr ,buttheproductgasenthalpy h p{Tp, pr } willexactlyequalthereactant streamenthalpy hr {Tr , pr },byequation(3.20).Thisprocessmaybeillustratedbyidentifyingthe reactantandproductstatesaspointsintheenthalpy–temperaturediagramofFigure3.1,inwhich theenthalpiesofthereactants(hr )andproducts(h p)areshownasfunctionsoftemperature,at thepressure pr ,astheupperandlowercurve,respectively.Thereactantenthalpycanbeidentified asthepoint R attheintersectionoftheupper(reactant)curveandtheverticallineatthereactant temperature Tr .Thehorizontallinethroughthispointthenintersectsthelower(product)curve atthepoint P,wheretheproducttemperatureis Tp,assuringthat
calledthe adiabaticcombustiontemperature.
Wearenowinapositiontodeterminethefuelheatingvalue.Ifthehotproductgasesare subsequentlycooledatconstantpressuretothereactanttemperature Tr atthepoint P ′,thenthe heatremovedperunitmassofproductgaswillbeequalinmagnitudetothereductioninenthalpy oftheproductgasbetween Tp and Tr ,or
Figure3.1 Theenthalpy h ofthereactants(uppercurve)andtheproducts(lowercurve)ofacombustion process,asfunctionsofthetemperature T ,arerelatedbythefuelheatingvalue.Foradiabatic,constant pressurecombustion,theproductstemperature Tp isgreaterthanthereactanttemperature Tr
Multiplyingthisbythemassflowrateofproducts, m p,dividedbythemassflowrateoffuel, m f , weobtainthefuelheatingvalue FHV{Tr , pr },
Commonhydrocarbonfuels,suchasgasolineordieselfuel,aremixturesofmanyhydrocarbons ofvaryingmolecularstructure.Thefuelheatingvalueforsuchfuelsismeasuredusingacalorimeter, towhichequation(3.26)isdirectlyapplicable.Butforpurecompounds,suchasmethane(CH4), thefuelheatingvaluemaybecalculatedfromvaluesoftheenthalpyofformationofthefueland theproductsofcombustion.11
Table3.1liststhefuelheatingvalue(FHV)ofsomecommonfuelsat25 ◦Candoneatmosphere ofpressure,assumingthattheH2Oformedintheproductisinthevaporphase.(Thisiscalledthe lowerheatingvalue,LHV.)Alsolistedisthestoichiometricair–fuelratio ( A/F)st ,theenthalpy difference hr h p atthereferencetemperatureandpressure,andthefreeenergydifference f perunitmassoffuel,
ThefuelheatingvaluesofTable3.1coverawiderange,fromabout10to120MJ/kg.Forthe saturatedhydrocarbonslisted,CH4 toC18H38,therangeismuchsmaller,about44to50MJ/kg.The partiallyoxygenatedfuels,CO,CH4O,andC2H6O,havelowerheatingvaluesthantheirparents, C,CH4,andC2H6,becausetheyhavelessoxidationpotentialandgreatermolecularweight.The lowvalueforsolidcarbonreflectstheconsiderableenergyrequiredtoconvertthecarbonatoms fromsolidtogaseousform.
AdifferentaspectofthefuelsismadeevidentinthefifthcolumnofTable3.1,whichcompares theenthalpydifference hr h p atthereferenceconditions.Thisenthalpydifferenceisthechemical energythatismadeavailableinaconstant-pressure,adiabatic,stoichiometriccombustionprocess toincreasetheproducttemperaturetotheadiabaticvalue.Iftheproductgasesofthedifferentfuels possessedthesamespecificheat,thenthetemperaturerisewouldbeproportionaltothisvalue. Itcanbeseenthatmostofthesefuelswouldhaveapproximatelythesameadiabaticcombustion temperature,whichturnsouttobeabout1900 ◦C,withtheexceptionofhydrogen,whichhas somewhathighertemperature.
ThelastcolumnofTable3.1liststhefuelheatingvalueperunitmassoffuelcarbon.Itsreciprocalisthecarbonemissionstotheatmosphere(intheformofCO2)perunitoffuelheatingvalue realizedwhenthefuelisburnedandtheproductsofcombustionarereleasedintotheatmosphere. Ofthefuelslisted,methaneprovidesthemostfuelheatingvalueperunitmassofcarbon,although allotherhydrocarbonfuelspossessonlyabout20%lessthanmethane.12
Theprincipalcommerciallyavailablefuelsarecoal(anthracite,bituminous,andsubbituminous),liquidpetroleumfuels(gasoline,dieselfuel,kerosene,homeheatingfuel,commercialheating fuel),petroleumgases(naturalgas,ethane,propane,butane),andwood(hardwood,softwood).The
11Theenthalpyofformationofacompoundisthedifferencebetweentheenthalpyofthecompoundandthatof itselementalconstituents(intheirstableform),allevaluatedatthesamereferencetemperatureandpressure.
a DatafromLide,DavidR.,andH.P.R.Frederikse,Eds.,1994. CRCHandbookofChemistryandPhysics. 75thed.BocaRaton:CRCPress; Probstein,RonaldF.,andR.EdwinHicks,1982. SyntheticFuels. NewYork:McGraw-Hill;Flagan,RichardC.,andJohnH.Seinfeld,1988.
FundamentalsofAirPollution. EnglewoodCliffs,NJ:Prentice-Hall.
b H2Oproductinvaporphase;heatingvalueisthelowerheatingvalue(LHV ).
c 1MJ/kg = 429.9Btu/lbmass.
d Gasphase,exceptcarbon.
e NA,notapplicable.
heatingvaluesofthesefuelsvaryaccordingtothefuelcomposition,noneofthemhavingapure molecularcompositionandsomeofthemincludinginertcomponents.Theunitsellingpriceof thesefuelsmaybebaseduponthevolume(liquids,gases,andwood)orthemass(coal),butthe heatingvaluemaybeafactorintheprice.TheirheatingvaluesarelistedinTable3.1.
Invirtuallyallcombustionsystems,thewatermoleculesintheproductsofcombustionleaving thedeviceareintheformofvapor,notliquid,becausetheeffluenttemperatureishighenoughand theconcentrationofwatermoleculesislowenoughtopreventtheformationofliquiddroplets.As apracticalmatter,theheatofcondensationofthewatervaporisnotavailableforpartialconversion towork,andtheeffectivefuelheatingvalueshouldbebaseduponthewaterproductasavapor,as assumedinTable3.1.Nevertheless,sometimesa higherheatingvalue (HHV)isusedinthesaleof fuel,basedupontheassumptionthatthewaterproductisintheliquidform.Todeterminethis HHV forthefuel,weshouldaddtothelowerheatingvalue(FHV ofTable3.1)theheatofvaporization ofwateratthereferencetemperature,expressedasenthalpyperunitmassofhydrogeninwater,13 timesthemassfractionofhydrogeninthefuel.14
Thedistinctionbetweenhigherandlowerheatingvalueisprimarilyamatterofconvention. SellersoffuelliketoquotetheirpriceintermsofdollarspermillionBtuofhigherheatingvalue, alowerpricethanthatpermillionBtuoflowerheatingvalue.Ontheotherhand,usersoffuel whogenerateelectricityprefertoratetheirplantefficiencyintermsofelectricalenergyproduced perunitoffuellowerheatingvalueconsumed,leadingtohigherefficienciesthanwhenusingthe higherfuelheatingvalue.Aslongasthebasisofthepriceorplantefficiencyisstated,noconfusion shouldresult.
Generatingmechanicalpowerfromthecombustionoffossilfuelisnotastraightforwardmatter. Onemustutilizethecombustionprocesstochangethetemperatureand/orpressureofafluidand thenfindawaytousethefluidtomakemechanicalworkbymovingapistonorturningaturbine. Thefirstandsecondlawsofthermodynamicslimittheamountofworkthatcanbegeneratedfor eachunitmassoffuelused,andthoselimitsdependuponthedetailsofhowthefuelisusedto createpower.
Tounderstandtheimplicationsofthethermodynamiclawsfortheconversionoffuelenergy tomechanicalpower,itisconvenienttoanalyzeidealdevicesinwhichafluidisheatedandcooled, andproducesorabsorbswork,asthefluidmovesthroughacycle.Suchadevicecanbecalleda heatengine inthatitexchangesheatwithitsenvironmentwhileproducingworkinacyclicprocess. Thecombustionoffuelisrepresentedinthisidealizedcyclebytheadditionofheatfromahightemperaturesource.Somepracticalengines,likethegasturbineandtheautomobileengine,arenot heatedfromanexternalsource.Thesearetermed internalcombustionengines (ICE).Nevertheless, mostoftheirfeaturescanbemodeledasidealheatenginecyclestohelpusunderstandtheirchief attributes.
13At25 ◦C,thisvalueis21.823MJ/kgH.
14Thedifferenceinheatingvaluesisamaximumforhydrogen(21.823MJ/kgfuel),butapproaches3.136 MJ/kgfuelfortheheaviesthydrocarbonsofTable3.1.
Inthissectionweconsidersimplemodelsofheatenginesthatillustratetheprincipalfeatures ofseveralpracticaldevices.Ofparticularimportanceistheamountofworkproduced(w)in proportiontotheamountofheatthatisadded(q)torepresentthecombustionoffuel,whoseratio iscalledthe thermodynamicefficiency ηth(≡ w/q).Butotherfeaturesareofpracticalconsequence aswell,andthesearedisplayedintheanalysis.
Inalltheseanalyses,weassumethatthefluidthatproducesthemechanicalworkundergoes reversibleprocesses,sothattheentropychangeisrelatedtotheheatadditionbyequation(3.10).
TheCarnotcycleisaprototypecyclethathaslittlepracticalimportancebutisbeautifullyillustrative ofthesecondlawlimitsonthesimplestofheatenginecycles.Itissustainedbytwoheatreservoirs, ahotoneoftemperature Th andacoldoneoftemperature Tc.(Wemaythinkofthehotreservoiras onethatiskeptwarmbyheattransferfromaburningfuelsourceandthecoldoneastheatmosphere.)
Considertheheatenginetobeacylinderequippedwithamovablepistonandenclosingafluidofunit mass.Thecycleconsistsoffourparts,asillustratedinFigure3.2:anisothermalexpansionduring whichanamountofheat qh isaddedtotheengine(1 → 2inFigure3.2);anadiabaticisentropic additionalexpansionduringwhichthefluiddecreasesintemperaturefrom Th to Tc (2 → 3);an isothermalcompressionwhilethesystemaddsaquantityofheat qc tothecoldreservoir(3 → 4); andfinallyanisentropiccompressiontotheinitialstate(4 → 1).Forthiscyclethenetwork w of thepistonpercycleis pdv,andbythefirstlawequation(3.9)weobtain
InFigure3.2atemperature–entropyplotoftheCarnotcycleshowsthattheentropyincrease (s2 s1)duringheatingbythehotreservoirisequalinmagnitudetothedecrease(s3 s4)during cooling,andbythesecondlaw(3.10)itfollowsthat
Figure3.2 TheCarnotcycleconsistsofisothermalandisentropicexpansions (1 → 2, 2 → 3) and compressions (3 → 4, 4 → 1) ofafluidinacylinderwhileabsorbingheat qh fromahotreservoir (1 → 2), rejectingheat qc toacoldreservoir (3 → 4) andproducingwork w
Bycombiningthesetworelations,wemayfindthethermodynamicefficiency ηth oftheCarnot cycletobe
Themostremarkableaspectofthisresultisthatthethermodynamicefficiencydependsonly uponthetemperaturesofthetworeservoirsandnotatalluponthepropertiesofthefluidusedin theheatengine.Ontheotherhand,theamountofnetwork w thattheheatenginedeliversdoes dependuponthefluidpropertiesandtheamountofexpansion,
w = pdv = Tds (3.31)
wherewehaveusedequation(3.17)toshowthatthenetworkisequaltotheareaenclosedbythe cyclepathinthe T –s planeofFigure3.2.
TheconclusiontobedrawnfromtheexampleoftheCarnotcycleisthatthethermodynamic efficiencyisimprovedbysupplyingtheheat qh totheengineatthehighestpossibletemperature Th . Butforafuelburninginambientairandsupplyingthisheattothehotreservoirsoastomaintainits temperature, Th couldnotexceedtheadiabaticcombustiontemperature Tad .Furthermore,forany Th < Tad onlyafractionofthefuelheatingvaluecouldbeaddedtothehotreservoir,thatfraction beingapproximately (Tad Th )/(Tad Tc).Theresultingthermodynamicefficiencybasedupon thefuelheatingvaluewouldthenbe
Forexample,if Tad = 1900 ◦C = 2173Kand Tc = 25 ◦C = 298K,thenthemaximumthermal efficiencywouldbe46%when Th = 805K = 532 ◦C.ThisisconsiderablylessthantheCarnot efficiencyof86.3%when Th = Tad forthiscase.
Apossibleplanforincreasingtheefficiencyabovethevalueofequation(3.33)wouldbeto employalargenumberofCarnotengines,eachoperatingatadifferenthotreservoirtemperature Th butthesamecoldreservoirtemperature Tc.Thecombustionproductsofaconstant-pressureburning ofthefuelwouldthenbebroughtintocontactwithsuccessivelycoolerreservoirs,transferringheat amounts dh fromthecombustiongasestoproduceworkamounts dw,where
andwherewehavemadeuseofthefactthat dh = Th ds foraconstant-pressureprocess.The thermodynamicfunction h Tc s thatappearsinequation(3.34)iscalledthe availability.Inthis casethechangeinavailabilityofthecombustionproductsistheamountofthefuelheatthatis
availabletoconverttoworkbyuseofanarrayofCarnotengines.Itisthemaximumpossible workthatcanbegeneratedifthefuelisburnedatconstantambientpressurewhentheambient environmenttemperatureis Tc.
Ifweassumethattheconstant-pressurespecificheatofproductgasisconstant,thenequation (3.34)maybeintegratedtofindthethermodynamicefficiency η,
Forthevaluesof Tad = 2173Kand Tc = 298Kusedabove, η = 68%.Whilethisisanimprovementonthepreviouscase[equation(3.33), η = 46%],itisstilllowerthantheCarnotefficiency of86.3%for Th = 2173K.Evidently,considerablecomplicationisrequiredtoboostidealthermodynamicefficienciesforfossil-fueledcyclesabove50%,andthereislittlehopeofapproaching theCarnotefficiencyattheadiabaticflametemperature.TheCarnotcycleisanimportantguideto understandinghowasimpleheatenginemightwork,butitisnotaverypracticalcycle.
Fromthebeginningoftheindustrialrevolutionuntiltheeveofthetwentiethcentury,mostmechanicalpowergeneratedbytheburningoffossilfuelutilizedthesteamcycle,calledtheRankine cycle.Inasteampowerplant,fuelmixedwithairisburnedtoheatwaterinaboilertoconvertit tosteam,whichthenpowersaturbine.Thisisanexternalcombustionsystemwheretheworking fluid,water/steam,isheatedinpipesthatarecontactedbyhotfluegasformedinthecombustion chamberofthefurnace.Inanefficientsteamplant,nearlyallthefuel’sheatingvalueistransferred totheboilerfluid,butofcourseonlypartofthatamountisconvertedtoturbinework.Thesteam cycleismechanicallyrobust,providingmechanicalpowerevenwhentheboilerandturbineare notperfectlyefficient,accountingforitsnearlyuniversalusethroughtheendofthenineteenth century.15
ThethermodynamicprocessesoftheRankinecycleareillustratedinFigure3.3,showing(on theleft)thechangesintemperatureandentropythattheworkingfluidundergoes.Inasteampower plant,ambienttemperaturewaterispumpedtoahighpressureandinjectedintoaboiler(1 → 2 inFigure3.3),whereuponitisheatedtoitsboilingpoint(3),completelyturnedintosteam(4), andthenusuallyheatedfurthertoahighertemperature(5).Thisheatingwithintheboileroccurs ataconstanthighpressure pb.Thestreamofsteamflowsthroughaturbine(5 → 6)undergoinga pressurereductiontoamuchlowervalue, pc,whiletheturbineproducesmechanicalpower.The low-pressuresteamleavingtheturbineiscooledtoanambienttemperatureliquidinthecondenser (6 → 1)andthenpumpedintotheboilertocompletethecycle.
IntheidealizedRankinecycleofFigure3.3,theadiabaticsteadyflowworkperunitmassof steam wt producedbytheturbineisequaltotheenthalpychange h5 h6 acrosstheturbine,by virtueofthefirstlawequation(3.20).Asthisisideallyanisentropicprocess,theenthalpychange
Figure3.3 TheRankinecycleisasteadyflowcyclewherewateristurnedtosteamathighpressureina boiler (2 → 5) andthenpassesthroughaturbinetogeneratemechanicalpower (5 → 6),afterwhichthe steamiscondensedtowater (6 → 1) andpumpedbackintotheboiler (1 → 2).(Inthe T –s diagramonthe left,theareaunderneaththedashedlinedelineatestheconditionswherebothsteamandliquidwatercoexist, incontrasttosteamonlytotherightandliquidwatertotheleft.)
maybeexpressed,throughequation(3.18),as
Thereisasimilarexpressionfortheworkrequiredtooperatethepump.Thenetwork w produced inthecyclemaythenbeexpressedas
where vs and vw arethespecificvolumesofthesteamintheturbineandwaterinthepumpand pb and pc aretheboilerandcondenserpressures.Becausethespecificvolumeofliquidwateris somuchsmallerthanthatofsteam,thepowertorunthepumpisonlyatinyfractionofthepower producedbytheturbine,amechanicallyrobustattributeoftheRankinecycle.
BecausetheheatingandcoolingprocessesoftheidealRankinecycle(2 → 5,6 → 1)occur atconstantpressurewhiletheworkprocessesareisentropic,thethermodynamicefficiencymaybe expressedas
ThereareseveralaspectsoftheRankinecyclethatdeservenotice.Firstofall,unliketheCarnot cycle,itsthermodynamicefficiencydependsexplicitlyuponthepropertiesoftheworkingfluid, water,asmaybeseeninFigure3.3andequation(3.37).Secondly,thecycleefficiencyisincreased iftheboilerpressure(andsteamtemperature)isincreased.Atthesametime,highboilerpressures increasetheamountofworkproducedperunitmassofwaterflowingthroughthesystem,reducing thecostoftheturbineperunitofpoweroutput.Thebasiccycleiscapableofimprovementsin efficiencybyuseofinternalheatexchangeatintermediatepressurelevels.
ForRankinecyclesusingwaterastheworkingfluid,thetemperatureofthesteamfromthe boilerseldomexceeds550 ◦C,andthenonlyforboilersthatoperateatahighpressure.Ahighpressureandhigh-temperaturesteamcycleisoneforwhichthesteampressureandtemperature exceedthevaluesatthe criticalpoint ofwater.16 Thethermodynamicefficiencyofasteamcycleis improvedifahighpressureandtemperatureareused.Butthereareadditionalstepsthatmaybe takentoimprovetheefficiencyofthebasicRankinecycle.One,called superheating, isillustrated inFigure3.3.Herethesteamevolvedbyboilingthewaterisfurtherheatedinthesuperheater sectionoftheboilertoatemperature T5 thatishigherthantheboilingpoint T4 corresponding totheboilerpressure p4 = p3.Anotheristoreroutesteamleavingthehigh-pressureturbine (seeFigure3.4)backtotheboilerfor reheating to T5,whereuponitreturnstothelower-pressure turbinestages,producingmoreturbinepowerthanifithadnotbeenreheated.Athirdimprovement involvesextractingafractionofthesteamfromthehigh-pressureturbineexhaustandusingitto heatthewaterleavingthefeedwaterpump,attemperature T2.Thislatteriscalled regenerative feedwaterheating.Theneteffectofanyorallofthesealternativesistoincreasetheaverage temperatureoftheworkingfluidduringwhichheatisaddedintheboiler.UsingtheCarnotcycle astheparadigm,thisincreasestheRankinecyclethermodynamicefficiency.Dependingupon thecircumstances,employingallthesemeasurescanaddupto10pointsofefficiencytothe basiccycle.
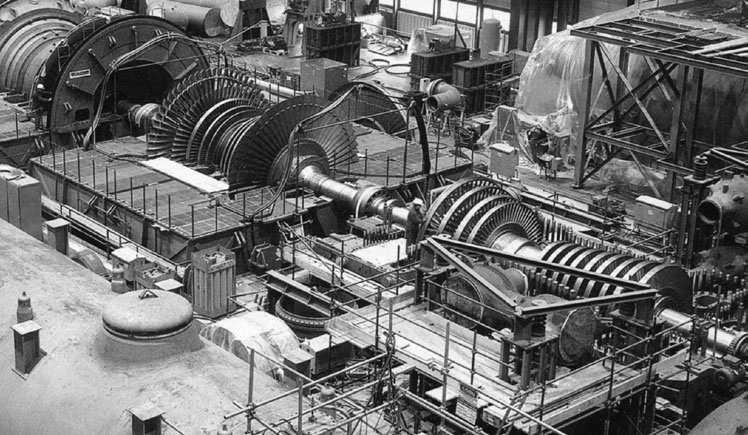
ThethermodynamicefficiencyoftheidealRankinecycleisintherangeof30–45%,depending uponthedetailsofthecyclecomplexity.Butactualsteamplantshavelower-than-idealefficiencies, forseveralreasons.Thesteamturbineandfeedwaterpumpsarenot100%efficient,resultingin
16Thecriticalpointistheconditionforwhichtheliquidandvaporphasesareindistinguishable.Forwaterthe criticalpressureandtemperatureare221.3bar(= 22.13MPa = 3210psi)and374.2 ◦C(= 705 6 ◦F).
lessnetworkthanintheidealcycle.Othermechanicalpowerisrequiredtooperatetheboilerfans andcondensercoolingwaterpumps,reducingthenetpoweroutput.Theboilerdoesnottransfer totheworkingfluid(water,steam)allofthefuelhigherheatingvalue,becausethefluegases exitfromtheboilerathigherthanfuelinputtemperatureandexcessair,abovethatrequiredfor stoichiometriccombustion,isused.Eventhebeststeamelectricpowerplantsseldomexceed40% thermalefficiency,basedupontheratioofthenetmechanicalpoweroutputdividedbytheheating valueofthefuelsupply.
Thesteamturbineforanelectricpowerplantexperiencesalargechangeinpressurebetween entranceandexit,duringwhichthesteamdensitydecreasesgreatly,requiringeverlongerturbine bladestoextractpowerfromtheflow.Figure3.4showstherotorofa1500-MWsteamturbine, whichisdividedintothreestages,fromrighttoleftinthephotograph.Inthehigh-,intermediate-, andlow-pressurestagesthesteampressureisreducedfrom71to10,10to3,and3to0.1bar, respectively.17
Themostubiquitousfossil-fueledengineisthatintheautomobile.Unlikethesteamplant,theautomobileenginedoesnotdependuponheattransfertotheworkingfluidfromanexternalcombustion source.Instead,thefuelisburnedadiabaticallyinsidetheengine,andtheproductsofcombustion producemoreworkduringtheexpansionstrokethanmustbeinvestedinthecompressionstroke, givinganetpoweroutput.Thecombustionproducts,whichareexhaustedtotheatmosphere,are replacedbyafreshair–fuelchargetobeginthenextcombustioncycle.Theworkingfluidflows throughtheengineandisnotrecycled.Thisistermedan opencycle—incontrasttothesteamcycle, whichisclosed.
Thethermodynamicheatengineclosedcyclethatreplicatesthepressure–volumecharacteristicsofthereciprocatinginternalcombustionengine(ICE)iscalledtheOttocycle.Assketched inthe T –s planeofFigure3.5,itconsistsofanisentropiccompressionfromavolume ve atthe
beginningofthecompressionstroketo vc attheend(1 → 2),followedbyaconstant-volume heating(2 → 3)toreplicatetheadiabaticcombustionofthefuel–airmixture,thenanisentropic expansiontothemaximumvolume ve,afterwhichaconstant-volumecooling(4 → 1)completes thecycle(aprocesswhichisabsentintheopencycleICE).
Thenetcyclicwork w,equivalentheatadded q,andthermodynamicefficiency ηth fortheOtto cycleare
TheOttocycleefficiencyisamonotonicallyincreasingfunctionofthevolumetriccompression ratio, ve/vc,and,ofcourse,thethermodynamicpropertiesoftheworkingfluid.Forsimplifying assumptionsabouttheworkingfluid,itmaybeexpressedas
Ingasolineengines,thecompressionratioislimitedbythetendencyofthefuel–airmixture tocombustspontaneously(called knock).Ahighercompressionratioisusedinthedieselengine, wherethefuelisinjectedaftertheairiscompressed,providingagreaterthermodynamicefficiency forthedieselenginecomparedwiththegasolineengine.
BecausetheOttocycleisamodelforthereciprocatingICE,theamountofequivalentheat q islimitedbytheamountoffuelthatcanbeburnedinthefuel–airchargeinthecylinderat theendofthecompressionstroke.Thecombustiblefuelisamaximumwhentheair/fuelratiois stoichiometric,whichisthenormalconditionforgasolineengines.18 Themaximumtemperature T3 attheendofcombustionisthustheadiabaticcombustiontemperatureofthecompressedmixture inthecylinder.19 BecausethereciprocatingICEengineexperiencesthispeaktemperatureonly momentarilyandisotherwiseexposedtoamuchloweraveragetemperature,itisabletooperate successfullywithpeaktemperaturesthatexceedthemeltingpointofmostmaterialsandsecurethe favorablethermodynamicefficienciesthataccompanysuchhightemperatures.
Thethermodynamicefficienciesofautomotiveenginesarenoticeablylessthantheidealefficiencyofequation(3.39).Frictionofpistonsandbearings,powerrequiredtooperatevalves, coolingpump,andthefuelsupplysystem,pressurelossesinintakeandexhaustsystems,and
18Ingasolineenginestheloadisvariedbychangingthepressure p1 andthustheamountofstoichiometric fuel–airmixtureinthecylinder.Indieselengines,theairpressureisfixedbuttheamountoffuelinjectedis varied.
19IntheOttocyclemodeloftheICE,combustionoccursatconstantvolume.Theconstant-volumefuel heatingvalueandadiabaticcombustiontemperaturearenotexactlythesameasthoseforconstant-pressure combustion,butthedifferencesaresmall.
heatlosstothecylinderduringthepowerstrokesallcombinetoreducethepoweroutputcomparedtotheidealcycle.Forfourstrokecyclegasolineengines,thelowintakepressureexperiencedatpartloadisanadditionallossthathasnocounterpartindieselengines.Thebestthermal efficienciesforautomotiveenginesareabout28%and39%forthegasolineanddieselengine, respectively.20
ThethermodynamicanalysisoftheOttocycledoesnotexplainthemostsalientfeatureofthe reciprocatingICE—thatis,thatitcanbeconstructedinusefulsizesbetweenabout1kilowattand 10megawatts.Thisisinmarkedcontrasttothesteampowerplantwhich,forthegenerationof electricpower,isusuallybuiltinunitsof100to1000MW.Thesedifferencesareaconsequence ofmechanicalfactorsrelatedtothelimitingspeedofpistonsversusturbinebladesandotherfactors unrelatedtothethermodynamicsofthecycles.21
Sincethemiddleofthetwentiethcenturythegasturbinehasbecomethedominantpropulsive engineforlargeaircraftbecauseofitssuitabilitytohighsubsonicspeedpropulsion,lightweight, fueleconomy,andreliability.Butithasmadeinroadsintootherusessuchasnavalvesselpropulsion, high-speedlocomotives,and,morerecently,electricpowerproduction.Inthelattercase,thegas turbineisoftenusedwithaRankinecyclesteamplantthatisheatedbythegasturbineexhaust,the coupledplantsbeingtermeda combinedcycle.
Initssimplestformthegasturbineplantconsistsofacompressorandturbineintandem,both attachedtothesameshaftthatdeliversmechanicalpower.Situatedbetweenthecompressorand turbineisacombustionchamberwithinwhichinjectedfuelburnsatconstantpressure,raisingthe temperatureofthecompressedairleavingthecompressortoahigherlevelpriortoitsentering theturbine.Inpassingthroughtheturbine,thehotcombustiongasisreducedinpressureand temperature,generatingmoreturbinepowerthanisconsumedincompressingtheairenteringthe compressorandmakingavailableanetmechanicalpoweroutputfromtheshaft.Thecompression, combustion,andexpansionprocessesareadiabatic;andlikethereciprocatingenginecycles,the gasturbineisanopencycle.
Theidealthermodynamiccyclethatmodelsthethermalhistoryoftheairandcombustion gasflowthroughagasturbinepowerplantiscalledthe Braytoncycle. IllustratedinFigure3.6, itconsistsofanisentropiccompressionofairinthecompressorfromtheintakepressure pi to thecompressoroutletpressure pc (1 → 2inFigure3.6),followedbyaconstant-pressureheating (2 → 3)thatraisesthegastemperaturetothevalue T3 attheturbineinlet.Thecombustiongas expandsisentropicallywhileflowingthroughtheturbine,itspressurebeingreducedfrom pc to pi (3 → 4).
IntheBraytoncycle,thesteadyflowworkproducedbytheturbineandthatabsorbedbythe compressorareeachequaltothechangeinenthalpyofthefluidflowingthroughthem.Perunit massoffluid,thenetwork w ofthegasturbineplantisthedifferencebetweentheturbinework
20Underaverageoperatingconditions,thethermalefficiencyislessthanthesemaximumvaluesbecausethe engineoperatingconditionsareselectedtooptimizevehicleperformanceratherthanefficiency.
21ForadetaileddescriptionoftheOttocycle,seeChapter8.
TheBraytoncyclemodelsthegasturbinecycle,whereairiscompressedfromtheinletpressure pi inacompressortotheoutletpressure pc (1 → 2),thenburnedwithfueltoahighertemperatureatthe constantpressure pc (2 → 3),andsubsequentlyexpandedintheturbine (3 → 4),producingnetwork w. andthecompressorwork,
Theheat q addedtothefluidleavingthecompressor,whichreplicatesthetemperaturerisecaused byadiabaticcombustion,isjusttheincreaseinenthalpyintheconstantpressureprocess,
Asaconsequence,thethermodynamicefficiency ηth oftheBraytoncycleis
wherethefinalexpressionontherightofequation(3.42)followsfromtheequalityofconstantpressureheatadditionand Tds.
ThethermodynamicefficiencyoftheidealBraytoncycledependsuponthepressureratio p2/ p1 = p3/ p4 andthethermodynamicpropertiesofairandcombustionproducts.Forsimplifying assumptionsabouttheseproperties,thisefficiencymaybeexpressedas
showingthattheefficiencyincreaseswithincreasingpressureratio.Forexample,ifthepressure ratio
2%.
Thereareseveralpracticalproblemsinbuildingasuccessfulgasturbinepowerplant.The powerproducedbytheturbine,andusuallythatabsorbedbythecompressor,iseachgreaterthan thenetpoweroutput,sothatthetotalpowerofthismachineryisconsiderablygreaterthanthe netoutputpower.Theaerodynamicefficienciesofthecompressorandturbineneedbothbehigh sothatasmuchnetpowerisproducedaspossible.Thethermodynamicefficiencyofthecyclecanbeimprovedbyincreasingtheturbineinlettemperature,butthelatterislimitedbythe
high-temperaturestrengthoftheturbineblades.Itwasnotuntilthedevelopmentofefficientaerodynamicbladedesignsandhigh-temperatureturbinematerialsthatthegasturbineplantbecame practicalandeconomicallyfeasibleinthetwentiethcentury.
ForthesimpleBraytoncycle,thebestthermodynamicefficienciesareabout33%.Byuse ofheatexchangebetweenthehotexhaustgasandthecompressedgasenteringthecombustion chamber,thisefficiencymaybeincreasedbyaboutfourpercentagepoints.Economicfactors mayrequirethattheplantoperateatmaximumpoweroutput,forwhichtheefficiencywouldbe somewhatlowerthanthesevalues.
Thecompressorandturbineofagasturbinepowerplantareusuallybuiltintoasinglerotor, asshowninFigure3.7,withthecombustionchambersandwichedbetweenthecompressorand turbine.Thisisthearrangementforaircraftgasturbines,whichmustbeaslightaspossible.The rotorshaftdeliversthenetpowerdifferencebetweentheturbineandcompressorpowerstothe electricgenerator.
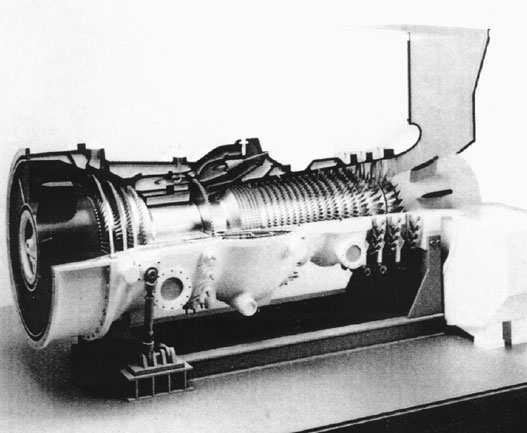
Thecombustionproductsgasstreamleavingthegasturbinecarrieswithitthatportionofthefuel heatingvaluethatwasnotconvertedtowork.Thishotstreamofgasmaybeusedtogeneratesteam inaboilerandproduceadditionalworkwithoutrequiringtheburningofmorefuel.Theuseofa gasturbineandsteamplanttoproducemoreworkfromagivenamountoffuelthaneitheralone couldproduceiscalledacombinedcycle.
Thethermodynamicefficiency ηcc ofacombinedcyclepowerplantmaybedeterminedasa functionofthecomponentefficiencies, ηg and ηs ,ofthegasturbineandsteamcycles.Forthegas
turbine,thework wg isequalto ηg q f ,where q f isthefuelheataddedperunitmassofcombustion products.Theamountofheatthatcanbeutilizedinthesteamcycleisjust q f wg = q f (1 ηg ) Thesteamcycleworkoutput ws istherefore ηs timesthisheat,or ηs q f (1 ηg ).Thuswefindthe combinedcycleefficiency,
Theefficiencyofthecombinedcycleisalwayslessthanthesumoftheefficienciesofthecomponent cycles.Nevertheless,thecombinationisalwaysmoreefficientthaneitherofitscomponents.For example,if ηg = 30%and ηs = 25%,then ηcc = 47.8%.
Inthecombinedcyclegasplussteampowerplant,thethermalefficiencyofthesteamcycle componentisconsiderablylowerthanthatforthemostefficientsteam-onlypowerplant,because thegasturbineexhaustgasisnotashotasthecombustiongasinanormalboilerandbecausethe gasturbinerequiresmuchmoreexcessairthandoesasteamboiler.Bothrestrictionslimitthesteam cycleefficiency,butneverthelessthecombinedcycleplantprovidesanoverallfuelefficiencythat ishigherthanthatforanysinglecycleplant.
Thecombinedcyclepowerplantburningnaturalgasorjetfuelisoftenthepreferredchoice fornewelectricgeneratingplants,ratherthancoal-fueledsteamplants,foravarietyofreasons thatovercomethefuelpricedifferentialinfavorofcoal.Thesereasonsaremostlyfinancialand environmental,thelatterincludingthereducedairpollutantemissions,especiallycarbondioxide.22
Theuseofmechanicalpowertomoveheatfromalowertemperaturesourcetoahighertemperature sinkisthethermodynamicprocessthatunderliesthefunctioningofrefrigerators,airconditioners, andheatpumps.Theprocessisthereverseofaheatengineinthatpowerisabsorbed,ratherthan beingproduced,butitstillobservestherestrictionsofthefirstandsecondlawsofthermodynamics thattheheatandworkquantitiesbalance[equation(3.9)]andthattheratiooftheheatquantitiesis relatedtothetemperaturesoftheheatsourceandsink.
Themostcommonformofrefrigerationsystememploysthe vaporcompressioncycle. The refrigerationequipmentconsistsofanevaporator,avaporcompressor,acondenser,andacapillary tubeconnectedinseriesinapipingloopfilledwiththerefrigerantfluid.Therefrigerantischosen soastoundergoachangeofphasebetweenliquidandvaporatthetemperaturesandpressures withinthesystem.Thefluidflowsthroughthesecomponentsintheorderlisted,beingpropelled bythepump.Thepurposeofthecapillarytubeistoreducethepressureoftherefrigerantfluid flowingfromthecondensertotheevaporator,resultinginaloweringofitstemperature.Thefluid statesintheidealvaporcompressioncycleareillustratedinthetemperature–entropydiagramon theleftofFigure3.8.Vaporleavingtheevaporator (1) iscompressedisentropically (1 → 2) by thecompressortoahigherpressure,whereitentersthecondenseratatemperature T2 thatishigher thantheenvironmenttowhichheatwillbetransferredfromthecondenser.Thecondenser,aheat
(2 → 4) toformasaturatedliquid (4).Theliquidleavingthecondenserundergoesanadiabaticpressure decline (4 → 5),enteringtheevaporatorasacoldliquid–vapormixture (5),whereuponitabsorbsheatfrom therefrigeratedspace (5 → 1).(Inthe T –s diagramontheleft,theareabeneaththedashedlinedelineates theconditionswherebothvaporandliquidrefrigerantcoexist,incontrasttovaporonlytotherightand liquidtotheleft.)
exchanger,condensesthevaportoliquidform (2 → 4) bytransferringheattotheatmosphere orotherenvironmentalsink.Theliquidrefrigerantleavingthecondenser (4) passesthrougha small-diametercapillarytube,undergoingaviscouspressuredroptoentertheevaporatorata lowerpressure (5).Inthisadiabatic,constant-enthalpyprocess,thefluidtemperaturedecreases andsomeoftheliquidchangestothevaporform.Theliquid–vapormixturethenpassesthrough theevaporator,aheatexchangerthatabsorbsheatfromtherefrigeratedspacewhilechangingthe liquidportionoftherefrigeranttoavapor,completingthecycle.
Inheatenginecyclesthatproduceworkfromthecombustionoffuel,thethermodynamic efficiencymeasurestheratiooftheoutput(work)tothefuelinput(heat).Thesecondlawof thermodynamicsassuresthattheoutputisalwayslessthantheinput,sothatthethermodynamic efficiencyislessthan100%.Forrefrigeratorsandairconditioners,however,thedesiredoutput (heatremovedfromtherefrigeratedspace)isnotnecessarilylessthantheinput(compressorwork). Nevertheless,wemayformtheratioofoutputtoinput,whichiscalledthe coefficientofperformance (COP),usingthisasafigureofmeritfortheperformanceofthesedevices.
Thecoefficientofperformanceofthevaporcompressioncyclemaybedeterminedinterms ofthechangesinthethermodynamicstatesoftherefrigerantfluid,suchasthoseillustratedin Figure3.8.Thework w requiredtocompressaunitmassofrefrigerantequalsitschangein enthalpy h2 h1.Theheat qc absorbedbytherefrigerantfromtherefrigeratedspaceisequalto itschangeinenthalpy h1 h5,whichalsoequals h1 h4 becausetheprocess4 → 5isoneof unchangingenthalpy.Asaconsequence,thecoefficientofperformanceis
Thecoefficientofperformanceisgreatestwhenthetemperaturedifferencebetweentherefrigerated spaceandtheenvironmentisleast.Itdecreasesmonotonicallyasthistemperaturedifference
becomeslarger,andbecomeszeroatasufficientlylargevalueofthetemperaturedifference, dependinguponthecharacteristicsoftherefrigerantfluid.
Aheatpumpisarefrigeratoroperatinginreverse;thatis,itdeliversheattoanenclosedspaceby transferringitfromanenvironmenthavingalowertemperature.Heatpumpsarecommonlyusedto providewintertimespaceheatinginclimateswherethereisneedforsummertimeairconditioning. Thesamerefrigerationunitisusedforbothpurposesbyredirectingtheflowofair(orotherheat transferfluid)betweenthecondenserandevaporator.
Foraheatpump,thecoefficientofperformance (COP)hp isdefinedastheratiooftheheat qh transferredtothehigher-temperaturesink,dividedbythecompressorwork w,
wherewehaveusedthefirstlawrelationthat qh = qc + w andequation(3.45)tosimplifythe right-handsideof(3.46).
Theheatpump’scoefficientofperformanceisalwaysgreaterthanunity,fortheheatoutput qh alwaysincludestheenergyequivalentofthepumpwork w.Butinverycoldwinterclimates, (COP)hp maynotbeverymuchgreaterthanunityandtheheatdeliveredwouldnotbemuchgreater thanthatfromdissipatingthecompressor’selectricalpowerinelectricalresistanceheatingofthe space,amuchlesscapitalintensivesystem.Itistheyear-rounduseofrefrigerationequipmentfor summertimeairconditioningandwintertimespaceheatingthatjustifiestheuseofthisexpensive system.
InSection3.10weconsideredseveraldifferentsystemsforconvertingtheenergyoffueltomechanicalenergybyutilizingdirectcombustionofthefuelwithair,eachbaseduponanequivalent thermodynamiccycle.Inthesesystems,asteadyflowoffuelandairissuppliedtothe“heatengine,” withinwhichthefuelisburned,givingrisetoastreamofcombustionproductsthatareventedto theatmosphere.Thethermalefficiencyofthesecycles,whichistheratioofthemechanicalwork producedtotheheatingvalueofthefuel,isusuallyintherangeof25%to50%.Thisefficiencyis limitedbythecombustionpropertiesofthefuelandmechanicallimitationsofthevariousengines. Thermodynamicallyspeaking,thecombustionprocessitselfisanirreversibleone,anditaccounts foralargepartofthefailuretoconvertmoreofthefuelenergytowork.
Isthereamoreefficientwaytoconvertfuelenergytowork?Thesecondlawofthermodynamics placesanupperlimitontheamountofworkthatcanbegeneratedinanexothermicchemical reaction,suchasthatinvolvedinoxidizingafuelinair.Inachemicalchangethatproceedsata fixedtemperatureandpressure, themaximumworkthatcanbeextractedisequaltothedecreasein Gibbsfreeenergyofthereactantsastheyformproductsinthereaction.Formostfuelsthechange ofGibbsfreeenergy f ,definedinequation(3.16),isonlyslightlydifferentfromthefuelheating value(seeTable3.1),butthislimitiscertainlymuchgreaterthantheworkproducedbypractical heatorcombustionengines.Butthermodynamicsalonedoesnottellushowitmightbepossible tocapturethismuchgreateramountofavailableenergyinfuels.
Anelectrochemicalcellisadevicethatcanconvertchemicaltoelectricalenergy.Itconsistsofanelectrolytefillingthespacebetweentwoelectrodes.Ina battery, theelectrodesare
Asketchofahydrogen–oxygenfuelcell.Hydrogenandoxygenaresuppliedtoporous electrodesseparatedbyanelectrolyteinwhichtheelectriccurrentiscarriedbyhydrogenions.Inthe externalelectriccircuit,currentiscarriedbyamatchingelectronflow.Theproductofoxidation,water, evolvesfromthecathode.
chemicallydissimilar,whichcausesanelectricpotentialdifferencebetweenthem.Ina fuelcell, theelectrodesarechemicallysimilarbutoneissuppliedwithafuelandtheotherwithanoxidant, generatinganelectricpotentialdifferencebetweenthem.Byclosingtheelectriccircuitexternal toanelectrochemicalcell,acurrentmaybedrawnfromthecell,generatingelectricalpower.The electricalenergyconsumedintheexternalcircuitisgeneratedbychemicalchangeswithinthecell. Theelectricalenergydeliveredtotheexternalelectriccircuitisnevergreaterthanthereductionof freeenergyoftheaccompanyingchemicalchangeswithinthecell.
Thestructureofafuelcell,sketchedinFigure3.9,isamazinglysimple.Twoporousmetal electrodesareseparatedbyaspacefilledwithanelectrolyte,afluidorsolidinwhichthefuelor oxidantcandissociateintoioniccomponents.Fuelandoxidantaresuppliedtoseparateelectrodes, diffusingthroughtheporousmaterialtotheelectrolyte.Attheanode(thenegativeelectrode), electronsaretransferredtotheelectrodefromtheelectrolyteaspositiveionsareformed;atthe cathode(thepositiveelectrode),electronsareemittedtotheelectrolytetoformnegativeionsor toneutralizepositiveions.Iftheelectrodesareconnectedbyelectricallyconductingwirestoan externalload,asshowninFigure3.9,anelectriccurrentwillflow(inthecounterclockwisedirection inFigure3.9)andelectricalworkwillbeexpendedontheloadbecausethecathodeelectricpotential isgreaterthanthatoftheanode.Insidethefuelcell,theelectriccurrentcompletingthecircuitis carriedbyionsmovingthroughtheelectrolyte.
Thechemicalreactionthatgeneratestheelectricalenergyexpendedintheexternalloadoccurs partiallyateachelectrode.Takingasanexamplethehydrogen–oxygenfuelcellshowninFigure3.9, thesurfacereactionattheanodewhenahydrogenfuelmoleculeisionizeduponenteringthe
where el istheelectricpotentialoftheelectrolyteand a isthatoftheanode.Inthisreaction theelectronmovesintotheanodeatitspotential a whiletheionmovesintotheelectrolyteatthe potential el .Atthecathode,theoxidizingreactionis
where c isthecathodeelectricpotential.Theneteffectofbothoftheelectrodereactionsinthe productionofwaterandthemovementofachargethroughtheexternalcircuit,foundbyadding (3.47)and(3.48),is
Inthisoverallreactionthehydrogenandtheoxygenmoleculesproducewatermolecules.Inthe process,foreachhydrogenmoleculetwoelectronsflowfromthelowanodepotentialtothehigh cathodepotentialintheexternalcircuit,producingelectricalwork.If qe isthemagnitudeofthe chargeofanelectronand mH2 isthemassofahydrogenmolecule,thentheelectricalworkwork perunitmassoffuelinthereactionis w = (2qe/mH2 )( c a ).Multiplyingthenumeratorand denominatorofthefirstfactorofthisexpressionbyAvogadro’snumber(seeTableA.3),wefind
where F = 9.6487E(4) coulomb/moleistheFaradayconstantand MH2 isthemolecularmass(g) ofamoleofdiatomichydrogen(H2).
Thesecondlawlimitstheelectrodepotentialdifference c a thatcanbeachieved,because thework w cannotexceedthefreeenergychange f availableintheoxidationreaction
where(3.50)hasbeenusedtoeliminate w inthesecondlineof(3.51).Theright-handsideof (3.51)isthusthemaximumpossibleelectrodepotentialdifference.Forahydrogen–oxygenfuel cellat20 ◦Candoneatmosphereofpressure,usingthevaluesofTable3.1,thisiscalculatedto be1.225V.
Themaximumpotentialdifferenceofafuelcell,determinedbythefreeenergychangeof thefueloxidationreactionasinequation(3.51),isonlyreachedwhenthecellisoperatedina reversiblemannerbylimitingthecurrenttoextremelylowvalues,ineffectzerocurrentoropen externalcircuit.Forfinitecurrentdraw,therewillbeavoltagedropattheelectrodesurfacesand withintheelectrolytethatisneededtomovethefuelionstothecathodeatafiniterate,alongwith acorrespondingdeclineintheelectrodepotentialdifference.Thethermodynamicefficiency η fc ofafuelcellmaythenbedefinedastheratiooftheactualelectricwork w deliveredbythecellto
Thehighefficienciesoffuelcells,comparedtoheatenginesutilizingthedirectcombustionof fuelwithair,stemsfromtheelectrodeprocesseswheretheelectrostaticenergybindingmolecules canbeconverteddirectlytoelectrostaticenergyoftheionsandelectronsthatmoveinthecell circuit.Incontrast,inanadiabaticcombustionprocessthefuelenergyisconvertedtorandom kineticandpotentialenergyofproductmolecules,whichcannotbefullyrecoveredinsubsequent flowprocesses.
Figure3.10(a)illustrateshowthefuelcellvoltageandpowervarywiththecurrentwhenthe electrolyteprovidestheonlyresistancetocurrentflowwithinthecell.Asthecurrentincreases,the cellvoltagedropslinearlyfromitsmaximumvaluegiveninequation(3.51).Thepoweroutput, whichistheproductofthecurrenttimesthevoltage,reachesamaximumwhenthevoltagehas fallento50%ofitsmaximumvalue.Thefuelcellefficiency,giveninequation(3.52),declineswith increasingpower,asshowninFigure3.10(b),to50%atmaximumcellpower.Whenoperatingat partload,fuelcellscanhavesignificantlyhigherefficienciesthandocombustionengines.
Tomaintainthefuelcelltemperatureatafixedvalue,heatmustberemoved.Themagnitudeof theheatremovedperunitmassoffuel, |q fc|,isdeterminedfromthefirstlawofthermodynamics appliedtothissteadyflowprocesstobe
where FHV isthefuelheatingvalueandtheinequalityfollowsfromthesecondlawconstraint.In fuelcellsusedtogenerateelectricutilitypower,theheatremovedfromthefuelcellmaybeusedto generateadditionalelectricityinaRankinecycleplant,providedthatthefuelcelloperatingtemperatureissufficientlyhigh.Thiscombinedcycleplantcanachieveveryhighthermalefficiencies.
Theenergyembodiedinfuelscanservemanypurposes:generatingmechanicalorelectricalenergy, propellingvehicles,heatingworkingorlivingspaces,creatingnewmaterials,refiningores,cooking food,andsoon.Inthischapterwehavefocusedontheproductionofmechanicalworkasanexample oftheconstraintsimposedonfuelenergyusebythelawsofthermodynamics.Nevertheless,these lawsapplyuniversallytoallenergytransactions.
Theuseoffueltoproducemechanicalorelectricalpower,forwhateverpurpose,accounts formorethanhalfofallfossilfuelconsumption.Itisforthisreasonthattheconsiderationsof thischapterprovideimportantinformationneededtoevaluatetheenvironmentalconsequencesof currentuseofthistypeandespeciallyofoptionsforreducingfossilfueluseinthefuture.Whatever thebeneficialuseofthemechanicalenergyproduced,beitvehiclepropulsion,materialprocessing, fluidpumping,andsoon,theinitiatingstepofconvertingfuelenergytomechanicalformisan essentialingredientthathasimportanteconomicandenvironmentalconsequences.Ameasureof theinfluenceupontheseconsequencesistheefficiencywithwhichthefuelenergyisconvertedto mechanicalform.
Apracticalmeasureoftheefficiencyofconvertingfuelenergytoworkistheratioofthework producedtotheheatingvalueofthefuelconsumed,whichwemaycallthe fuelefficiency η f (or alternatively, thermalefficiency).Usuallyweusethelowerheatingvalue LHV ofthefuelforthis purpose,asthismeasuresthepracticalamountoffuelenergyavailable.Fuelefficiencyisuseful becausewecanreadilycalculatethefuelmassconsumptionrate m f ofanengineofgivenpower output P ifweknowitsfuelefficiency,
Sometimesthefuelefficiencyisexpresseddifferently.Theratiooffuelconsumptionrate m f to enginepower P iscalledthe specificfuelconsumption.Fromequation(3.54),wecanconclude thatthespecificfuelconsumptionistheinverseoftheproduct η f (LHV ).
Table3.2summarizestherangeofvaluesoffuel(thermal)efficienciesofcurrenttechnologies forproducingmechanicalorelectricalpower.Itcanbeseenthatnoneoftheseexceeds50%.These
TypeEfficiency
Steamelectricpowerplant
Steamat62bar,480 ◦C30%
Steamat310bar,560 ◦C42%
Nuclearelectricpowerplant
Steamat70bar,286 ◦C33%
Automotivegasolineengine25%
Automotivedieselengine35%
Gasturbineelectricpowerplant30%
Combinedcycleelectricpowerplant45%
Fuelcellelectricpower45%
efficienciesreflecttheconstraintsofthelawsofthermodynamics,thelimitationsofmaterials,and thecompromisesinherentinachievingeconomicalaswellasefficientsystems.Whilethereis roomforimprovement,onlymodestincreasesabovethevaluesinTable3.2canbeexpectedfrom extensivedevelopmentefforts.
Asyntheticfuelisonethatismanufacturedfromanotherfuelsoastoenhanceitsusefulnesswhile retainingasmuchoftheoriginalheatingvalueaspossible.Typicalexamplesareoilproducedfrom coal,oilshale,ortarsands;gasfromcoal,oil,orbiomass;alcoholsfromnaturalgasorbiomass;and hydrogenfromcoal,oil,ornaturalgas.Someliquidfuels,suchasgasoline,arepartiallysynthetic inthattherefiningprocessproducescomponentsthataresynthesizedfrompetroleumconstituents andaddedtothenaturalfractionsofpetroleumthatordinarilycomprisetheliquidfuel.Major advantagesofasyntheticfuel,otherthanitsformasliquid,gas,orsolidthatmightenhanceits transportabilityandconvenienceofstorage,are(a)theremovalofbasefuelconstituentssuchas sulfur,nitrogen,andashthatleadtoharmfulairpollutantsand(b)theabilitytoburnthefuelin specialdevicessuchasgasturbinesandfuelcells.Amajordisadvantageisthecostofsynthesizing thefuelandthelossofitsheatingvalue,bothofwhichraisethecostofsyntheticfuelheat.This costfactorhasbeenthemajorobstacletowidespreadproductionanduseofsyntheticfuels.
Syntheticfuelsareformedinsteadyflowreactorssuppliedwithfuelandotherreactants,usually atelevatedpressuresandtemperatures.Thechemicalreactionsthatgeneratethesyntheticfuelsare aidedbytheuseofcatalyststhatenhancethereactionratestoeconomicallypracticallevels.Where thesynthesizingreactionsareendothermic,heatmustbeaddedtomaintainthereactortemperature. Thusthesynthesisproceedsatfixedtemperatureandpressure.
Asanexampleofasyntheticfuel,considertheproductionofsynthesisgasfromcoalbythe reaction
where12kilogramsofsolidcarbonand18kilogramsofsteamreacttoform28kilogramsofcarbon monoxideand2kilogramsofhydrogen.Butthefuelheatingvalueofthecarbonis(seeTable3.1) 12kg × 32.76MJ/kg = 393MJ,whilethatofthesynthesisgasis18kg × 10.10MJ/kg + 2kg × 141.8MJ/kg = 465MJ,sothatthisprocesswouldbeendothermicintheamountof2.4MJ/kgof productsat25 ◦C.Thusadditionalcoalwouldhavetobeburnedtoprovidethisamountofheatto maintainthesynthesis.Inaddition,thesecondlawrequiresthatthefreeenergyoftheproductgas notexceedthatofthereactantmixturebecausenomechanicalworkisinvestedintheprocess.As aconsequence,practicalsynthesisresultsinareductionofheatingvalueinthesynthesizedfuel.23 Fossilfuelsarethefinalsynthesisstepinthephotosyntheticproductionofcarbohydrates fromcarbondioxideandwaterinplants,derivingtheirchemicalenergyfromsunlight.Inthe photosynthesisreaction,energeticsolarphotonsprovidethelargeincreaseinfreeenergyofthe carbohydratemolecules,incontrasttothethermalreformingsynthesisof3.55wheretheproduct moleculeshavelowerfreeenergy.Anyreformingofnaturalfossilfuelstosyntheticformwill
FuelProductEfficiencya (%)
CoalSynthesisgas72–87
CoalMethane61–78
CoalMethanol51–59
CoalHydrogen62
OilHydrogen77
MethaneHydrogen70–79
Coal,oil,orgasHydrogen(electrolytic)20–30
OilshaleOilandgas56–72
MethanolOilandgas86
WoodGas90
CornEthanol46
ManureGas90
a Thermalefficiencyistheratiooftheheatingvalueofthesyntheticproductdividedby theheatingvalueoftheparentfuel.
resultinalossoffuelheatingvalueandanincreaseofcarbonemissionsperunitofsyntheticfuel heatingvalue.
Table3.3summarizesthethermalefficiencies(theratioofsyntheticfuelheatingvalueto thatoftheparentfuel)forseveralsyntheticfuelproductionprocesses.Withbutfewexceptions, theseefficienciesliewithintherangeof60%to90%.Mostconversionprocessesrequirehigh processtemperaturesandpressures,needcatalyticsupporttoimprovetheproductionrate,and consumemechanicalpowertoprovidefortherequisitepressurizationandheattransferprocessing. Theeconomicandenergycostsofsyntheticfuelproductioncanonlybejustifiedwhenthereare compensatinggainsattendingtheuseofsyntheticfuels,suchasthesuitabilityforuseinfuelcells orconvenienceofstorageandtransport.
Syntheticnuclearfuelscanbeproducedinnuclearreactors.Uranium-238,whichisnota fissionablenuclearfuel,canbeconvertedtoplutonium-239,whichcanbeusedtofuelanuclear fissionreactor.SeeSection6.2foradescriptionofthisprocess.
Hydrogenhasbeenpromotedasanenvironmentallyfriendlysyntheticfuelthatcanbeusedinafuel celltogenerateelectricalpowerathighefficiencywhileemittingnoairpollutants.Twopossible sourcesofhydrogenfuelarethereformingofmethaneandtheelectrolysisofwater:
Bothofthesereactionsrequireadditionalenergytobringthemtocompletion.Thefirstrequires combustionofadditionalmethanetosupplytheheatneededforthereformingofmethaneto hydrogen.Thesecondcannotbeeffectuatedbyheatingalone,becausethereisagreatincreasein freeenergy.Instead,thefreeenergyincreaseisprovidedbyelectricpowerinanelectrolyticcelland onlyasmallamountofheatisinvolved.Producingelectrolytichydrogenisveryenergyinefficient
whentheelectricityisgeneratedbyburningafossilfuel,becausetheheatingvalueofthehydrogen willbelessthanone-thirdoftheheatingvalueofthefuelburnedintheelectricpowerplant.
Proponentsofhydrogenasasubstituteforfossilfuelinvehiclesorpowerplantspointto itslackofcarbondioxideemissions.Butifhydrogenisproducedbyreformingafossilfuel, thereisnonetreductionincarbondioxideemissions;inmostcircumstancestherewillbean increaseinemissionsandcosts.Ifelectrolytichydrogenisproducedbyelectricity,thereisno reductionincarbondioxideemissionsaslongassomeelectricityisproducedinfossilfuelplants. Inaddition,storingandtransportinghydrogenisexpensive,sothatitsproductionbyelectricityis mosteconomicallyaccomplishedatthepointofuse.
Ontheotherhand,hydrogenproductionfromafossilfuelprovidesapathforCO2 recovery andsequestration(seeSection10.4.4).Inthisschemeafossilfuelisconvertedtoanoncarbonfuel, H2,whiletheCO2 thatisformedintheconversionprocess,suchasequation(3.56)above,canbe recoveredandsequesteredundergroundorintheocean,preventingitsemissionintotheatmosphere thatwouldhavefollowedfromdirectcombustionofthefossilfuel.Inthismanner,60%to80%of theheatingvalueofafossilfuelmaybeutilizedwhilereducingoreliminatingtheemissionsofCO2
Nearly86%oftheworld’senergyissuppliedbythecombustionoffossilfuel.Whiletheprocesses bywhichtheenergyofthisfuelismadeavailableforhumanuseintheformofheatormechanical powerarecircumscribedbytheprinciplesofthermodynamics,thetechnologiesemployedarethe consequencesofhumaninvention.
Inthischapterwehavedescribedtheimplicationsofthefirstandsecondlawofthermodynamicsforthefunctioningofselectedtechnologiesforproducingmechanicalpower,withparticular attentiontotheefficiencyofconversionoffuelenergytousefulwork.Wefoundthatthefuel energythatcanbemadeavailablebyburningfuelinair,calledthefuelheatingvalue,appearsas thesumofworkproducedbyaheatorcombustionengineandheatrejectedtothesurrounding environment,asrequiredbythefirstlawofthermodynamics.Butonlyafractionofthefuelenergy canbeconvertedtowork,accordingtothesecondlawofthermodynamics,withthemagnitudeof thatfractiondependinguponthedetailedoperationofthetechnologybeingused.Itisextremely difficulttoconvertmorethanhalfofthefuelheatingvaluetowork,butveryeasytoconvertallof ittoheatalone.
Mostmechanicalpowerisproducedinsteampowerplants,whereitisconvertedtoelectrical formfordistributiontoendconsumers.Water/steamiscirculatedwithinaclosedloop,beingheated inaboilerbythecombustionoffuelandthenpoweringasteamturbine.Themostefficientsteam plantsconvertabout40%ofthefuelenergytomechanicalpower.
Thegasturbineengine,developedinitiallyforaircraftpropulsionandutilizingcombustionof fuelintheairsteamthatflowsthroughtheengine,isoneprominentformofinternalcombustionengine.Unlikethesteamengine,itdoesnotrequiretheexchangeofheatwithanexternalcombustion system.Itsperformanceislimitedbythestrengthoftheturbinebladesthatmustendurehighcombustiontemperatures.Whenusedtogenerateelectricity,it’sefficiencyisonlyabout30%.Bycombiningwithasteamplant,calledcombinedcycle,theefficiencyofthecombinationisabout45%.
Theotherprominentformofinternalcombustionengineisthecommonautomobileengine, eithergasoline(sparkignition)ordiesel(compressionignition).Herethecyclicnatureoftheengine allowsmuchhighercombustiontemperaturesthaninthegasturbine,alongwithhigherefficiencies of25%to35%.
Thereisanalternativetoproducingmechanicalpowerbytheabovemethods.Theelectrochemicalcell,orfuelcell,suppliedwithfuelandoxidant,canconvertpartofthefuelenergy directlytoelectricalpower.Operatingmuchlikeabattery,electrochemicalreactionsatpositive andnegativeelectrodesgenerateanelectriccurrentwithinthecellthatflowsfromthenegativeto positiveterminal,asinanelectricgenerator.Thesereactionsaresustainedbytheoxidationofthe fuel,whichoccursatmoderatetemperatureswellbelowthoseencounteredinmechanicalengines. Fuelcellefficienciesareabout45%.
Thescienceofthermodynamicsprovidesaguideforimprovementsintheperformanceof combustionsystems,butcannotsubstitutefortheinventionandingenuityneededtobringthem about.
Problem3.1
Ittakes2.2milliontonsofcoalperyeartofuela1000-MWsteamelectricplantthatoperatesata capacityfactorof70%.Iftheheatingvalueofcoalis12,000Btu/lb,calculatetheplant’sthermal efficiencyandheatrate.(ThelatterisdefinedastheratiooffuelheatinBtutoelectricoutput inkWh.)
Problem3.2
Givenapressureratio p2/ p1 = 12acrossagasturbineandaspecificheatratio c p/cv = 1 35of theworkinggasfluid,calculatetheidealthermalefficiencyofaBraytoncyclegasturbineplant. Explainwhyrealgasturbineplantsachieveonly25%to35%thermalefficiency.
Problem3.3
ARankinecycleoceanthermalpowerplantissuppliedwithheatfromaflowofwarmocean surfacewater,whichiscooledby15 ◦Casitpassesthroughtheboiler.Iftheplantelectricaloutput is10MWandthethermalefficiencyis5%,calculatethevolumeflowrateofwarmwater,inm3/s, suppliedtotheboiler.
Problem3.4
Asyntheticfuelconsistsof50%byweightCOand50%byweightH2.Calculateitsfuelheating value,MJ/kgfuelandMJ/kgproduct,andstoichiometricair–fuelratiousingthedataofTable3.1.
Problem3.5
Acombinedcyclepowerplanthasagasturbinecyclethermodynamicefficiencyof30%anda steamcycleefficiencyof30%.Calculatethecombinedcyclethermodynamicefficiency,theratio
ofgasturbinepowertosteamturbinepower,andthefractionofthefuelheatthatisremovedin thecondenserofthesteamplant.
Problem3.6
Insynthesizinghydrogenforuseinafuelcell,methanemaybeusedintheoverallreaction
CH4 + 2H2O → CO2 + 4H2
whichisendothermic.UsingthedataofTable3.1,calculatetheamountofheatthatmustbe suppliedforthissynthesis,perunitmassofmethaneconsumed,ifitproceedsat25 ◦Candone atmosphereofpressure.Ifthisheatissuppliedbyburningadditionalmethaneinair,calculatethe totalkilogramsofmethaneconsumedperkilogramofhydrogenproduced.
Problem3.7
Thepotentialdifference ofahydrogenfuelcell,asafunctionofthecellcurrentdensity i amp/cm2,isfoundtobe
CalculatethemaximumpoweroutputofthecellinW/m2,andcalculatethevaluesof i, ,and thecellefficiencyatmaximumpower.
Problem3.8
APEMfuelcellusingmethanolasfuelissuppliedwithamethanol–watermixtureattheanode. Theanodereactionproduceshydrogenionsintheelectrolyteandanodeelectronsaccordingtothe reaction
Atthecathode,thecathodicelectronsandelectrolytichydrogenionscombinewithoxygentoform watermolecules,
Thecombinationofthesereactionsistheoxidationofmethanolwhileproducingacurrentflowin theexternalcircuitacrosstheelectrodepotentialdifference a c,
(a)UsingthedataofTable3.1,calculatethemaximumpotentialdifference a c thatthefuel cellcangenerate.(b)Calculatetheratioofthemaximumelectricalworkperunitoffuelmass (J/kg)tothefuelheatingvalue.
Aschner,F.S.,1978. PlanningFundamentalsofThermalPowerPlants. NewYork:JohnWiley&Sons. Black,WilliamZ.,andJamesG.Hartly,1985. Thermodynamics. NewYork:HarperandRow. Flagan,RichardC.,andJohnH.Seinfeld,1988. FundamentalsofAirPollution. EnglewoodCliffs:PrenticeHall.
Haywood,R.W.,1991. AnalysisofEngineeringCycles, 4thedition.Oxford:PergamonPress. Holman,J.P.,1980. Thermodynamics, 3rdedition.NewYork:McGraw-Hill. Horlock,J.H.,1992. CombinedPowerPlantsIncludingCombinedCycleGasTurbine(CCGT)Plants. Oxford: PergamonPress.
Kordesch,Karl,andGunterSimader,1996. FuelCellsandTheirApplications. NewYork:VCHPublishers. Lide,DavidR.,andH.P.R.Frederikse,Eds.,1994. CRCHandbookofChemistryandPhysics, 75thedition. BocaRaton:CRCPress.
Probstein,RonaldF.,andR.EdwinHicks,1982. SyntheticFuels. NewYork:McGraw-Hill. Saad,MichaelA.,1997. Thermodynamics:PrinciplesandPractice. UpperSaddleRiver:Prentice-Hall. Spalding,D.B.,andE.H.Cole,1973. EngineeringThermodynamics. London:EdwardArnold. Wark,Kenneth,Jr.,1988. Thermodynamics, 5thedition.NewYork:McGraw-Hill.
Priortotheindustrialrevolution,humanandanimalpowerhadprovidedthebulkofthemechanical workneededinanagriculturalsocietytoprovidefood,clothing,andshelterforhumansettlements. Throughinventionandtechnologicaldevelopment,wind,tidal,andriverflowsprovidedmechanical powerformillingofgrain,sawingoftimber,andoceantransportationofgoods.Buttheinvention ofthesteamengineintheearlyyearsoftheindustrialrevolutiongreatlyexpandedtheamount ofmechanicalpoweravailableinindustrializingcountriesforthemanufactureofgoodsandthe transportationofpeopleandfreight,givingrisetoeconomicgrowth.Bythelatenineteenthcentury theformsofmechanicalpowergenerationhadevolvedtoincludethesteamturbineandgasoline anddieselenginesandtheirusesinoceanandlandvehicles.Bythattimethedominantfuels thatproducedmechanicalpowerwerecoalandoilratherthanwood.Althoughhumanandanimal power,aswellastherenewablepowerofwindandstream,werestillsignificantatthedawnof thetwentiethcentury,fossil-fueledmechanicalengineswereclearlythemajorandrapidlygrowing sourceofindustrialenergy.
Atechnologicaldevelopmentthatgreatlyaugmentedtheusefulnessofmechanicalpowerin manufacturingand,eventually,commercialandresidentialsettingswasthenineteenth-century inventionoftheelectricgeneratorandmotorthatconvertsmechanicalandelectricalpowerfrom oneformtotheotherwithlittlelossofenergy.Unlikemechanicalpower,whichisgeneratedfrom fossilfuelatthesiteofpoweruse,asinamanufacturingplant,railroadlocomotive,orsteamship, electricpowergenerationmadepossiblethetransmissionofelectricalpowerfromacentrallocation todistantconsumersviaelectrictransmissionlines,whichgreatlyincreasedtheusefulnessofthe electricalformofwork.Togetherwiththeend-useinventionsthatmakeelectricalpowersouseful, suchastheelectriclightandelectriccommunicationdevices,theproductionofelectricpowerhas grownsothatitconstitutesnearlyone-thirdofenergyuseincurrentindustrializedsocieties.
TodayintheUnitedStates,mostelectricpowerisgeneratedinlargepowerplantswherefossil ornuclearfuelprovidestheheatneededtogeneratemechanicalworkinasteamcycle,withthe mechanicalpowerbeingconvertedtoelectricalpowerintheelectricgenerator,oralternator,as 60-cyclesynchronousalternatingcurrent(AC)electricity.1 Intransmittingthepowertodistant
1Electricutilityplantsareinterconnectedwitheachotherbytransmissionlinessothatelectricpowermay bereliablysuppliedtoallcustomers.Thisrequiressynchronizationofthegeneratorsandstandardizationof voltagesamongparticipatingplants.Foradescriptionoftheseplants,seeChapters5and6.
consumers,thevoltageisincreasedbyelectricaltransformersandthepowerismergedintoa networkofhigh-voltagetransmissionlinesthatjoinstheoutputsofmanypowerplantstosupply themyriadsofend-userswhoareconnectedtothetransmissionslinesbyanetworkofdistribution linesatlowervoltage.Morerecently,electricpowerisbeinggeneratedinsmallerplants,often employinggasturbineengines,eitheraloneorincombinationwithsteamturbines(calledcombined cyclepowerplant),asthemechanicalpowersource.Inaddition,someelectricityisgeneratedin industrialorcommercialplantsthatutilizethewasteheatfromthepowerproductionprocessfor processorspaceheating(calledcogeneration).Thetransmissionanddistributionsystemsthat connectallthesesourcestoeachotherandtotheusersofelectricpowerisusuallyownedand managedbypublicutilitycompanies.2
Someelectricpowerisproducedfromnonthermalsourcesofenergy.Themostprominentof theseishydropower,wheremechanicalpowerisproducedbyhydroturbinessuppliedwithhighpressurewaterfromareservoirimpoundedbythedammingofariver.Theenergysourceisthe differenceingravitationalenergyofthehigher-levelwaterbehindthedamcomparedwiththelowerlevelwaterdownstreamofthedam,thisdifferenceinlevelbeingcalledthehead.3 Hydropower maybegeneratedaswellfromtheriseandfallofoceantides.Someelectricpowerisnowgenerated bythemechanicalpowerofwindturbinesextractingenergyfromthewind.
Solarinsolationisbeingusedtogenerateelectricpowereitherdirectly,utilizingphotovoltaic cellsthatconverttheenergyofsolarphotonstoelectricpower,orindirectlybysupplyingheatto thermalsteamorvaporenginesthatdriveelectricgenerators.Solarinsolationprovidestheenergy neededtogrowplantsandmaytherebybeutilizedindirectlytogenerateelectricpowerwhen biomasscropsareusedasfuelinthermalpowerplants.
Nonthermalandsolarsourcesofelectricpoweraretermedrenewable,incontrasttomineral fuels,suchasfossilandnuclear,thatareextractedfromtheearthorocean.Renewableenergy systemsarediscussedinaChapter7.
Thermochemicalsystems,suchasbatteriesandfuelcells,convertthechemicalenergyof reactantmoleculesdirectlytoelectricitywithoutanintermediatestepwheremechanicalpoweris generated.Whiletheycurrentlycontributeverylittletotheamountofelectricpowergeneration, theyareobviouslyimportantinsuchapplicationsasportablecommunicationdevicesandtothe developmentofelectricdriveroadvehicles.4
Thephysicalprinciplesofelectricityandmagnetism,whichexplainhowstationaryandmoving electricchargesgenerateelectricandmagneticfields,howmechanicalforcesareexertedonelectric currentsflowinginelectricalconductorsinthepresenceofmagneticfields,andhowelectriccurrent isinducedtoflowbyelectricfieldsinconductingmaterials,providethebasisforthemechanism bywhichelectricalpowerisgenerated,transmitted,andutilized.5 Theseinteractionsarethoseof thermodynamicwork,usingtheparlanceofthescienceofthermodynamicsexplainedinChapter2.
4
Insofaraselectromagneticphysicsdealswithforcesonchargesandcurrents,itmayberegarded asexplainingaformofworkorpower,reasonablycalledelectricalworkorpower,todistinguish itfrommechanicalworkorpower,inwhichtheforcesarecausedbymechanicalcontactora gravitationalfield.Correspondingly,wemayregardthattheworkrequiredtomoveachargeor current-carryingconductorinanelectricormagneticfieldresultsinachangeofelectricormagnetic energyofthefield,sothatenergymaybesaidtobestoredinthefield,inanalogywiththechange inpotentialenergyofamassintheearth’sgravityfield.
Therearecircumstanceswhereitisdesirabletostoremechanicalorelectricalworkgenerated frommineralfuelconsumptionforuseatlatertimes.Acommonexampleisthestorageofelectrical energyinanautomobile’selectricstoragebatterytosupplythepowerneededtostarttheenginein asubsequentuse.Intheautomobileengineitselfaflywheelstoresrotationalenergyproducedby thepowerstrokeofthepistons,returningitduringthecompressionstroke.
Oneofthemostprominentusesofelectricenergystorageisthatemployedbyelectricutility systemstoevenoutdiurnalvariationsinthedemandforelectricpowerbystoringenergyduring nighttimehourswhendemandislowandexcesspowerisavailableandthenrestoringthisenergy tothesystemduringdaytimehoursofpeakdemand.Thispermitsthecentralelectricgenerating plantstooperateatconstantpowerandbestefficiencyalldaylong,loweringthecostofelectricity generation.
TheprincipleinvolvedisillustratedinFigure4.1depictingthediurnalvariationofelectric powerdemandinatypicalelectricutilitysystem.Startingatmidnight,thedemanddeclinestoa minimumintheearlymorninghoursandthenincreasestoadailymaximuminthelateafternoonor earlyeveninghours,afterwhichitdeclinesagaintoitsmidnightlevel.Theutilitypowersuppliers usuallymatchthisdemandbyturningonindividualplantsduringtherisingportionofthedemand andthentakingthemofflineasthedemanddeclines.However,asufficientnumberofplants mustberuncontinuouslytosupplytheminimumdemand,calledthebaseload.Supplyingthe baseloadcanbeaccomplishedmoreefficientlythansupplyingthevariableloadbetweenthe minimumandpeakloadwhereplantsoperateatless-than-optimalconditions,botheconomically
andthermodynamically.Ifelectricstoragesystemsareusedtostoreenergyduringtimesoflessthan-averagedemandandreturnthisenergyduringtimesofabove-averagedemand,thenfewer powerplantswillbeneededtosatisfythediurnaldemandandthosefewerplantsmaybeoperated atoptimalconditions.
Themostcommonformofstoringenergyforuseincentralelectricpowersystemsisthe pumpedstoragesystemwherewaterispumpedfromalower-toahigher-levelreservoir,with theenergybeingstoredintheearth’sgravitationalfield.Thisenergyislaterrecoveredwhenthe storedwaterflowsthroughaturbogeneratortothelower-levelreservoir.Otherschemeshavebeen proposedaswell,includingtheuseofelectricstoragebatteries,electriccapacitorsandinductors, andflywheels.Theselatterarealsopossiblesourcesofemergencyelectricpowerforessential purposes,likehospitaloperatingroompowerandcomputerpower.
Electricpowerproducedfromsomesourcesofrenewableenergy,suchasphotovoltaiccells, windturbines,andtidalpowersystems,maynotbeavailableattimesthatsynchronizewithelectric powerdemand,asillustratedinFigure4.1.Energystoragemaybenecessaryforthesuccessfuluse ofthesesystems,especiallywheretheycannotbetiedintoanelectricpowergridthatwillprovide powerattimeswhentherenewablesourceisabsent.
Inrecentyearsarenewedinterestinelectricallypropelledautomobilesandothervehicleshas arisenasaconsequenceofadesiretoimprovevehicularenergyefficiencyandreduceairpollutant emissionsfromgroundtransportationvehicles.Mostoftheproposedsystemsincorporate,inpart, someenergystorageintheformofelectricstoragebatteries,flywheels,orelectriccapacitors.For suchapplications,theweight,volume,andcostofsufficientenergystoragetoprovideacceptablevehicleperformanceisgenerallymuchgreaterthanthatforconventionalhydrocarbon-fueled vehicles,posingobstaclestotheirwidespreaduse.Comparedtostationaryenergystoragesystems, mobileonesmustmeetmuchmorestringentrequirements.
Thischaptertreatsthephysicalprinciplesthatdeterminehowelectricalpowerisgenerated, transmitted,andstored.Wefirstconsiderhowmechanicalworkisconvertedtoelectricalworkinan electricalgenerator,alongwiththeinverseofthatprocessinanelectricmotor.Wenextshowhow electricpowerflowsinatransmissionlinethatconnectstheelectricgeneratorwiththeend-userof theelectricpower,andweexplainhowsomeofthatpowerislostinresistancetotheflowofcurrent inelectricwires.Finally,wedescribethekindsofenergystoragesystemsthatareusedtoprovide electricalormechanicalpowerforuseattimeswhenitisnototherwiseavailable.Emphasisis placedontheenergyandpowerperunitmassandvolumeofthesesystems,thecostperunitenergy stored,andtheefficiencyofrecoveryofthestoredenergy,becausethesearetheparametersthat determinetheirusetoreplacetheconventionalsystemswheremineralfuelisconsumedasneeded tosupplyelectricalormechanicalpowerandheat.
Theelectricgeneratorandelectricmotoraretheprincipaldevicesbywhichmechanicalandelectricalpowerareconvertedfromoneformtotheother.IntheUnitedStates,almostallutilityelectric powerisgeneratedbysteam,gas,hydro,orwindturbinesdrivinganelectricgenerator.About60% ofthiselectricpowerisconvertedbyelectricmotorstomechanicalpowerforresidential,commercialandindustrialuse.Fiftypercentofallmechanicalpowerproducedbyfossilandnuclearfuel consumptionisusedtogenerateelectricpower.
E.(b)Asketchofasimplearmaturecircuit showinghowthecurrentloopisconnectedtoslipringsthatdeliverthecurrenttoanexternalcircuit.
Themagneticinteractionthatunderliestheoperationofanelectricmotororgeneratoris illustratedinFigure4.2,showingamagnetizedcompassneedleplacedinamagneticfield.The needleseekstoalignitselfwiththemagneticfieldlines,asdoesacompassneedleintheearth’s magneticfield.Ifweholdtheneedlestationaryatanangle θ fromthedirectionofthemagnetic field,wemustapplyatorque T thatisequaltotheproductoftheneedle’smagneticdipolemoment M,thestrengthofthemagneticfield B,andsin θ .Alternatively,workcanbedonebytheneedle ifitrotatestoalignitselfwiththemagneticfield,intheamount MB(1 cos θ),butworkcanbe generatedonlyforahalfrevolutionoftheneedle,atmost.Tomakeanelectricmotorofthis device,wemustreversethedirectionoftheneedle’smagnetizationeveryhalfrevolution.Thiscan beaccomplishedbysurroundingtheneedlewithacoilofwirethroughwhichacurrentflowsfrom anexternalcircuit,withthecurrentbeingreversedeachhalfrevolution.Thebasicelementsof bothmotorandgeneratorareamagnetizablerotorandastationarymagneticfield,eitherorboth ofwhichareconnectedtoexternalelectriccircuitsthatadjusttheamountanddirectionofthe magneticfields.
Thephysicalprinciplesunderlyingboththeelectricmotorandelectricgeneratorareillustrated inFigure4.3(a).Awireoflength L carryingacurrent I inthepresenceofamagneticfield B is
subjecttoarestrainingforce F,
Inaddition,ifthewiremovesatavelocity V inthedirectionoftheforce,itexperiencesanelectric field E inthedirectionoppositetothatofthecurrentintheamount6
Inageneratorormotor,wiresattachedtoarotatingarmaturemovethroughamagneticfield establishedbyafieldcoilorpermanentmagnet.Theforce F appliedtoageneratorarmaturewire deliversmechanicalpower P atarate FV whiletheelectricalpowerproducedwhenthecurrent I flowsinthedirectionofthepotentialincrease EL is IEL.Utilizingequations(4.1)and(4.2),these powersarefoundtobeequal:7
Neglectinganyelectricalandmechanicallosses,themechanicalpowerinput(FV)toanideal generatorthenequalstheelectricalpoweroutput(IEL).
Ifwereversethedirectionofthevelocity V,thedirectionofthemechanicalpowerisalso reversed;thatis,thereisamechanicalpoweroutputfromthedevice.Simultaneously,theelectric fieldisreversedandelectricpowerisnowaninput.Inthismodethedeviceisanelectricmotor. Neglectinglosses,equation(4.3)definestheequalityofinputelectricalpowertooutputmechanical powerforanelectricmotor.
Figure4.3(b)showshowarectangularloopofwireattachedtoarotatingarmatureandconnectedtoslipringscandeliverthecurrenttoanexternalstationarycircuitviabrushesthatcontact therotatingsliprings.Forthisgeometry,theperipheralvelocity V ofthearmaturewiresis2πrf , where f isthearmature’srotationalfrequencyand r isthedistanceofthewirefromthearmature axis,sothattheidealoutputandinputpower P is,usingequation(4.3),
wherethefactorof2arisesfromthereturnlegofthecircuit.Becausetheelectricalpowerequals theproductofthecurrent I timesthepotentialdifference φ acrosstheelectricaloutputterminals, thefactor (4π frLB) inequation(4.4)isequalto φ. 8
InthecaseofthearmaturecircuitofFigure4.3(b),theelectricpotentialchangesalgebraicsign asthearmaturelooprotatesthrough180degrees,thusproducingalternatingcurrent(AC)power
6Thegeneralformsofequations(4.1)and(4.2),usingboldfacecharacterstorepresentvectorquantities,are, respectively, F =−(I × B)Land E =−V × B
7Hereweareignoringanyresistivelossinthewire.
8Thepotentialincrease φ ofanelectricgeneratoriscalledan electromotiveforce.Thegenerator’sinternal current I flowsinthedirectionofincreasingelectricpotential φ,whereasthecurrentinanexternalcircuit connectedtothegeneratorflowsinthedirectionofdecreasingpotential.Asourceofelectromotiveforce, suchasageneratororbattery,isasourceofelectricpowerfortheattachedexternalcircuit.
(inthecaseofagenerator),providedthatthemagneticfield B maintainsitsdirection.Various formsofarmatureandmagneticfieldcircuitsgiverisetotheseveraltypesofalternatingcurrent anddirectcurrentmotorsandgenerators.
TheACsynchronousgeneratorinanelectricutilitypowerplantrotatesataprecisespeedso astoproduce60-cycleACpower.Allpowerplantsthatfeedintoacommontransmissionlinemust adheretothesamefrequencystandard.Becausegeneratorshaveanintegralnumberofmagnetic poles,theirrotationalspeedsareanintegralsubmultipleof60Hz.Thegeneratorsmaintainafixed voltageinthetransmissionanddistributionsystems,whilethecurrentvariestosuitthepower needsofelectricitycustomers.
Becauseofelectricalandmechanicallossesinelectricmotorsandgenerators,theoutputpower islessthantheinputpower.Theratiooftheoutputtotheinputpowersistheefficiency η ofthe device,
Accordingtothefirstlawofthermodynamics,thedifferencebetweentheinputandoutputpowers appearsasaheatflowfromthedevicetotheenvironment,intheamountof (1 η) timestheinput power.Bothelectricmotorsandgeneratorsmustbecooledwhenoperatinginordertopreventthe overheatingofinternalparts.
Theelectricalresistance R ofthearmaturewireisasourceofinefficiencyinbothgenerators andmotors.Theelectricalpowerlostinovercomingthisresistance, I 2 R,increasesas I 2 whereas thepowerincreasesas I ,asinequation(4.3).Thiselectricallosstherebybecomesalargerfraction ofthepoweroutputasthelatterisincreased.Asaconsequence,theelectricalefficiencyofmotors andgeneratorsisleastatfullpower.Foreconomicefficiencywewouldliketoobtainthemaximum powerforagiveninvestment,whichmeansoperatingatmaximumpowerand,therefore,least electricalefficiency.
Theefficiencyofelectricmotorsandgeneratorsisgreaterforlargethanforsmallmachines. Figure4.4exhibitsthisincreaseofefficiencywithsizeforenergy-efficientinductionmotors.The
sizeeffectisrelatedtothelowerrotationalspeedoflargermachinesandthenecessarilymore complexstructureofthemagneticandelectriccircuits.Figure4.5showsthestatorofalarge inductiongeneratorandthecomplexelectricandmagneticcircuitfeaturesthatareneededto achievehighefficiency.
Toachievegoodefficiencyandmeetthepracticallimitsonmagneticfieldstrength,thepower perunitvolumeormassofamotororgeneratorislimited,beingoftheorderof1E(5)W/m3 and 30W/kg.Becauseofthesimilarityofthestructureofthesedevices,thematerialamountsperunit volumeareapproximatelyindependentofsizeandhencepoweroutput.
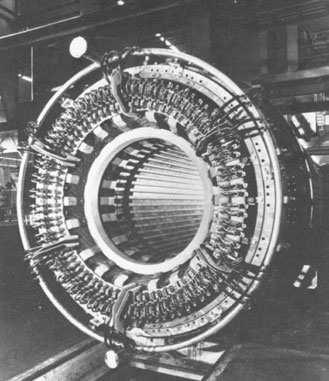
Thevastgrowthofelectricpowerproductionandconsumptioninthetwentiethcenturywasa consequenceoftheabilitytotransmitelectricpowerfromthesourceofproduction,thecentral powerplant,tothemanyconsumersinresidential,commercial,andindustriallocationsfarremoved fromthesiteofthepowerplant.Eventhoughthereislittleenergystorageinthetransmissionand distributionsystemandthepowerplantmustproducesufficientpowertomeettheinstantaneous demandsofthemanyconsumers,thissystemworksremarkablywell,especiallywhenmanypower plantsareconnectedinanetworkthatpermitssharingthepowerdemandinaneconomicaland reliablemanner.
ThecomponentsofanelectricpowersystemaresketchedinFigure4.6.Agasorsteamturbine powersanelectricgeneratorsupplyingalternatingcurrenttoatransformerthatstepsuptheline voltagetoahighvalueinthetransmissionline,usually60–500kilovolts.Aftertransmissionfrom thepowerplanttothevicinityofloadcenters,astep-downtransformerreducesthevoltagetoa lowervalue,12–35kilovolts,forthedistributionsystemthatdeliverspowertotheend-users.For residentialuse,afurtherreductionto120–240voltsisrequired.
Electricpoweristransmittedviaelectriccableconsistingoftwowiresthatconductelectrical currentatdifferentelectricpotentials.9 Ina directcurrent (DC)systemtheelectriccurrentineach wireflowsinonedirectiononly.Ontheotherhand,inan alternatingcurrent (AC)system,wherethe potentialdifferenceandcurrentaresinusoidalfunctionsoftime,thecurrentsineachwirereverse directioneveryhalf-cycle.Ineithercase,theinstantaneouselectricalpower Pel transmittedinthe cableistheproductofthepotentialdifference
wheretheoverlineindicatesatime-averagedvalueand φ isthephaseanglebetweenthecurrent I andthepotentialdifference foralternatingcurrent.
InbothDCandACtransmissionsystemsthereisalossofelectricpowerinthetransmission lineintheamount I 2 R,where R istheelectricalresistanceoftheline.Tominimizethisloss,the lineresistancecanbereducedbyusinglargesizecopperwireandthecurrentminimized,foragiven power,byincreasingthepotentialdifference.Long-distancetransmissionlinesoperateathundreds ofthousandsofvoltstoreducethetransmissionloss.Buthighvoltagesareimpracticalandunsafe fordistributiontoresidencesandcommercialuserssothevoltageinACdistributionsystemsis reducedtomuchlowerlevelsbytransformers.BecauseDCpowercannotbetransformedeasilytoadifferentvoltage,itsuseisrestrictedtospecialapplications,suchaselectricrailtrains. TheuseofACpowerpredominatesinmodernelectricalpowersystems.Nevertheless,highvoltageDC(∼ 500kilovolt)transmissionlinesmaybeusedforverylongdistancetransmission (∼ 1500kilometers)toreduceenergyloss.
Theenergyefficiencyofelectricpowertransmissionanddistributionisalmostentirelydeterminedbyeconomicchoices.Toincreasetheefficiency,moremoneymustbeinvestedincopper wireandtransformercores,whichisonlyjustifiedifthevalueofthesavedelectricenergyexceeds theamortizationcostsoftheincreasedinvestment.Transmissionanddistributionlossesinelectric
Althoughnearlyallelectricpowerisgenerated,transmitted,andutilizedinACform,thereare importantusesforDCpowerthatusuallyrequiretheconversionofanACpowerinputtoDCform. Themostprominentofthesearecommunicationsystems,suchasthetelephoneandcomputer, wheredigitalcircuitsuseDCpower.AnothercommonDCsystemisthatoftheautomobile,where alternatingcurrentgeneratedintheenginedrivenalternatorisconvertedto12-voltDCpowerthat chargesthebatteryandsuppliespowerforlights,fans,radio,andsoon.
A rectifier isanelectricalcircuitdevicethatconvertsACtoDCpower.Itconsistsofdiodes thatpermitcurrenttoflowinonedirectiononly,therebytransformingtheACcurrenttoDCform. Asinmostelectricaldevices,somepowerislostinthistransformation.Everycomputerhasan internalorexternalpowersupplythatconvertshouseholdACtotheDCpowerneededfordigital circuits.
TherearesomesourcesofelectricpowerthatareDCinnature,mostnotablyphotovoltaic cellsandfuelcells.WherethispowerisfedtoelectricutilityACtransmissionordistribution lines,theDCpowerfirstmustbetransformedtoACform.Theelectricdevicethataccomplishes thisconversioniscalledan inverter.Whileitispossibletoachievethisconversionmechanically byemployingaDCmotortopoweranACgenerator,invertersaregenerallyelectricalcircuit componentsthataccomplishthesamepurpose.Thereissomepowerlossthataccompaniesthis conversion.
Thereisverylittleenergystoredintheelectricutilitysystemthatsupplieselectricpowerto consumers.Theelectricpowermustbesuppliedatthesameratethatitisbeingutilizedbythe utility’scustomers.Althoughthereissomeenergytemporarilystored(andremoved)eachhalfcycleinthetransmissionanddistributionlinesandtransformers,itisnotavailableforsupplying powerwhendemandexceedssupplyduringasustainedperiod.However,therearesystemsthat willfulfillthisneedandthatofotherapplications,suchasstoringenergythatcouldbeusedfor electricdrivevehicles.Inthissectionwewilldescribetheprinciplesthatformthebasisforthe constructionofsuchdevices.
Acapacitorisadeviceforstoringelectricchargeatanelevatedpotential.AssketchedinFigure4.7(a),itconsistsoftwoelectricallyconductingplates,ofarea A,separatedbyanelectrically insulatingdielectricmediumofequalareaandthickness h.Positiveandnegativecharges,inequal amounts Q,storedontheplatesinduceanelectricpotentialdifference φ betweenthem.The chargeandpotentialdifferencearerelatedbyCoulomb’slawforthisconfiguration,
where ǫ isthe electricpermittivity ofthedielectricmediumand C ≡ ǫ A/ h isthe capacitance of
thedevice.10 Ifanincrement dQ ofchargeismovedfromthenegativeplatetothepositiveone throughthepotentialincrease φ,viathecircuitexternaltothecapacitor,anamountofelectrical work φ dQ isdoneinthisprocess,increasingthecapacitorfreeenergybytheamount dF,
Wemaydeterminethefreeenergiesperunitvolumeandmassintermsoftheelectricfield E = φ/ h inthecapacitoras
where f isthefreeenergyperunitmass, ρ themassdensity(kg/m3)ofthedielectricmedium,and weneglectthemassoftheelectrodes.
Toobtainhigh-energystoragedensities,weshouldchooseamaterialwithahighelectric permittivity ǫ andanabilitytowithstandahighelectricfield E withoutbreakdown—thatis, withoutconductingacurrentthatwouldshort-circuitthecapacitorinternally.Suchmaterialsare composedofmoleculesthathaveapermanentelectricdipolemomentandthatarenoteasily ionizedinthepresenceofstrongelectricfields.Forexample,polypropylenehasapermittivity
10
ǫ = 2E( 11) farad/meter,adielectricstrengthofE = 6 5E(9) V/m,anddensity ρ = 1E(3) kg/m3 , sothatthefreeenergyperunitvolumeis F/V = 4 3E(8)J/m3 andthefreeenergyperunitmassis f = 4.3E(5) J/kg.
High-energydensitycapacitorsarebeingdevelopedforpotentialelectricvehicleuse,with energydensitiesofabout10Wh/kg = 0.036MJ/kg.Theelectricpowerinputandoutputrequires highandvariableelectricpotentialsrequiringpowerconditioningequipmenttodeliverthelower voltageandhighercurrentneededfortractionmotors.Electricfailureofthecapacitordielectric canpresentsafetyproblems.
Itispossibletostoreenergyinthemagneticfieldproducedbyacurrentflowinginaconducting wire.InthesketchofFigure4.7(b),amagneticinductorconsistsofalongcylinderofmaterial,of cross-sectionalarea A andlength L,aroundwhichacoilofelectricwirehaving N turnscarriesa current I .Ampere’slawrelatesthe magneticinductionB11 inthematerialtothecurrentflowing inthewire,
where µ isthemagneticpermeabilityofthematerial.12 Todeterminetheenergystoredinthe inductor,wefirstnotethatanincrementofmagneticinduction dB,causedbyanincrementof current dI inatimeinterval dt,isrelatedtothepotentialdifference φ betweentheendsofthe coilbyFaraday’slawofmagneticinduction,
Duringthistimeinterval,electricpowerofamount φ I isexpendedinincreasingthemagnetic induction,sothatthefreeenergyincreaseis
Thisrelationmaybeexpressedalternativelyintermsofthe inductance L ofthecoil,13 whichis theratio φ/(dI /dt) = µN 2 A/L byequation(4.13),sothat
11Theunitsofmagneticinductionareweber/meter2 = voltsecond/meter3.(SeeTableA.1.)
12Theunitsofmagneticpermeabilityarehenry/meter = voltsecond/amperemeter.(SeeTableA.1.)
13Theunitofinductanceisthehenry = voltsecond/ampere.(SeeTableA.1.)
Thestorageofmagneticenergyiscomplicatedbytwoeffects.Maintainingthecoilcurrent I requirestheexpenditureofelectricpowertoovercomeitsresistivelosses,unlessasuperconducting coilisused.Thereisapracticalupperlimittothemagneticinduction B relatedtothefactthat thecoilwindingsaresubjecttoanoutwardforceperunitlengthproportionalto IB thatmust besupportedbyacontainingstructurehavingavolumecomparableto AL.Thislimitsmagnetic inductiontovalueslessthanabout6weber/m2 andcorrespondingenergydensitiesof1.43E(7)J/m3 and1.8E(3)J/kg.
Superconductingmagneticenergystoragesystemshavebeenproposedforusewithelectricutilitysystems.Designsprojectenergystoragedensitiesof1MJ/m3,prospectivecostsof $180/kWh = $50/MJ,andanenergyefficiencyof95%.
Wearefamiliarwiththeemploymentofbatteriestosupplyelectricpowerforamyriadofuses:
flashlights,portableradios,watches,hearingaids,heartpacemakers,toys,andsoon.Batteriesthat converttheenergyofreactantchemicalstoelectricalworkandarethendiscardedwhendischarged arecalled primarybatteries.Incontrast, secondarybatteries, whosechemicalconstituentscan bereconstitutedbyrechargingwithelectricalpower,arecommonlytermedstoragebatteries.The mostcommonstoragebatteryisthatusedintheautomobile,primarilyforsupplyingenginestarting power.
Astoragebatteryconsistsoftwoelectrodes,apositiveoneandanegativeone,eachofdifferent chemicalcomposition,immersedinanelectrolyte.Theelectrodesprovidethestoreofchemical energythatisconvertedtoelectricalworkasthebatteryisdischarged.Theelectrolyteprovides aninternalelectriccurrentofnegativelychargedanionsand/orpositivelychargedcationsclosing theexternalelectriccircuitthatconsumesorprovideselectricworkasthebatteryisdischargedor charged.Incontrastwiththefuelcell,whichalsoconvertschemicalenergytoelectricalworkbut whichrequiresanexternalsourceoffuelandoxidantflow,thestoragebatteryhasonlyalimited amountofchemicalenergystoredwithinitthat,onceconsumed,bringstoanenditssupplyof electricalwork.Inthismanneritresemblestheotherenergystoragesystemsthatwehavebeen discussinginthischapter.
Toillustratetheprincipleofoperationofastoragebattery,wewillconsidertheexampleofthe lead-acidstoragebattery.Initscompletelychargedconfiguration,itconsistsofapositiveelectrode composedofleaddioxide(PbO2),anegativeoneofpurelead(Pb),andanelectrolytethatis aconcentratedsolutionofsulfuricacid(H2SO4)inwater.Thesulfuricacidisdissociatedinto hydrogencations(H+)andhydrosulfateanions(HSO4 ).Theconversionofchemicalenergyto electricalworkoccurspartiallyateachelectrode.Atthenegativeelectrode,ahydrosulfateionat theelectrolytepotential el reactswiththeleadtoformleadsulfate(PbSO4),ahydrogenion(H+) attheelectrolytepotential el ,andtwoconductingelectronsinthenegativeelectrodeatitselectric potential
Atthepositiveelectrode,twoelectronsatitspotential p andaleaddioxidemoleculecombine withthreehydrogenionsandahydrosulfateionattheelectrolytepotential el toformaleadsulfate
moleculeandtwowatermolecules:
Thenetreactioninthestoragebatteryisthesumofthecathodeandanodereactions,equations(4.15) and(4.16):
Inthedischargereactionofthelead-acidbattery,equation(4.17),bothelectrodesurfacesareeach convertedtoleadsulfatewhilesulfuricacidisremovedandwaterisaddedtotheelectrolyte, dilutingit.14 Whenbothelectrodesurfacesarecompletelycoveredwithleadsulfate,thereisno differencebetweentheelectrodesandnofurtherelectricworkmaybedrawnfromit.
Inthedischargereaction,equation(4.17),theelectricalworkofmovingthetwoelectrons throughtheexternalcircuitequals2qe( p n ),where qe isthemagnitudeoftheelectroncharge. Whenthisdischargeoccursveryslowlyatfixedtemperatureandpressure,theelectricalworkis thenequaltothereductionoffreeenergyperunitmass ( f )la whenthereactantsPb + PbO2 + 2(H+ + HSO4 )areconvertedtotheproducts2PbSO4 + 2H2O.Asaconsequence,thebattery potentialdifference p n canbewrittenas
where Mla isthemolecularweightofthereactantsand F istheFaradayconstant.15 Atusual conditions,thelead-acidbatterypotentialdifferenceis2.05V.Inthereactionofequation(4.17), thefreeenergychangeperunitmassofreactants, ( f )la ,is171Wh/kg = 0.6MJ/kg.
Theadvantageofthestoragebatteryisthatthedischargereactions,suchasthoseofequations(4.15)and(4.16)forthelead-acidbattery,canbereversedindirectionbyimposinganexternal potentialdifferencebetweenthepositiveandnegativeelectrodesthatexceedstheequilibriumvalue ofequation(4.18).Insodoing,theproductsofthedischargereactionareconvertedbacktoreactants,renewingtheenergystoredinthebattery,withtheenergyincrementbeingsuppliedby electricalworkfromtheexternalchargingcircuit.Inthedischargingandrechargingofastorage batterythereisusuallyanetlossofenergybecausemoreelectricalworkisrequiredtocharge thebatterythanisrecoveredinitsdischarge.Thisenergylossofthecharge–dischargecycleis dependentuponthecharginganddischargingrates:Whentheseratesarehigher,thelossisgreater. Someofthelossiscausedbyresistiveheatingresultingfromtheinternalioncurrentofthebattery, whiletherestisaconsequenceofelectrochemicalirreversibilitiesattheelectrodesurfaces.
Theelectrodereactionsthatreleaseorabsorbelectricalworkoccurattheelectrodesurface. Theelectrodesofstoragebatterieshaveaporous,sponge-likestructuretomaximizetheratioof surfaceareatoelectrodevolume.Inthiswaytheamountofenergystoredperunitmassofelectrode materialmaybemaximizedandthecostofenergystorageminimized.
14Thedegreeofdischargeofthelead-acidbatterycanbedeterminedbymeasuringthespecificgravityofthe electrolyte,whichdecreasesastheacidcontentisdiluted.
15SeeTableA.3.
Energy/MassPeakPower/MassCostEfficiency BatteryType(Wh/kg)(W/kg)($/kWh)(%)
Leadacid4025013080
Nickel/cadmium5011030075
Nickel/metalhydride8025026070
Sodium/sulfur19023033085
Lithium-ion10025020095
Thelead-acidstoragebatteryisawell-developedtechnology.Thereareabout200million lead-acidbatteriesinstalledinU.S.roadvehicles,eachstoringabout1kWhofenergy,foratotalof about7E(4)GJofelectricenergystored.Thisisabout1%ofthedailyelectricenergyproducedin theUnitedStates.Ifstoragebatterieswereusedtolevelthedailyelectricutilitysupply,averylarge increaseinbatteryproduction,abovethatrequiredfortheautomotivemarket,wouldbeneededto satisfythisrequirement.
Theenergyefficiencyoflead-acidbatteriesisabout75%atlow(multi-hour)chargeand dischargerates.Manufacturingcostisabout$50/kWh = $14/GJ.Batterylifeisusuallyabout1000 fullcharge–dischargecycles,whichmakesstoragebatteriesmoreexpensivethanpumpedstorage forelectricutilitystoragesystems.
Iflead-acidbatteriesareovercharged,theyemithydrogengas,whichcanbeanexplosion hazard.
Otherwell-developedstoragebatteriesemployanalkalineelectrolyte,ametaloxidepositive, andametalnegativeelectrode.Thenickel–cadmiumbattery,commonlyusedinportableelectronic equipment,consistsofaNiOOHpositiveandCdnegativeelectrode,withaKOHelectrolyte.Such batteriescanprovidemoreenergystorageperunitweightthanlead-acidbatteries,butatgreater economiccost.Table4.1listsseveralelectricstoragebatterysystemsandtheirproperties.
Thecommonformofstoringenergyforuseinelectricutilitysystemsisthatofpumpedhydropower. Itconsistsofanormalhydroelectricplantthatissuppliedwithwaterimpoundedbehindadamat highelevationanddischargingtoabodyofwateratalowerelevationthroughaturbinethatdrives anelectricgenerator.Butunliketheusualhydropowerplant,thewaterflowmaybereversedand pumpedfromthelowertothehigherreservoirusingelectricpoweravailablefromtheutilitysystem duringtimesoflowdemand.Operatingonadiurnalcycle,thepumpedstoragesystemundergoes nonetflowofwaterbutdoesnotdeliverasmuchelectricalenergyasitusesduringthepumping partofthecyclebecauseitscomponents(turbogeneratorandpump–motor)arelessthan100% efficient.
Energyinapumpedhydropowersystemisstoredbyliftingamassofwaterthroughavertical distance h intheearth’sgravitationalfield.Thegravitationalenergystoredinthereservoirwater, perunitmassofwater,is gh,whiletheenergyperunitvolumeis gh/ρ,where g isthegravitational acceleration.For h = 100m, gh = 9 8E(2)J/m3 and gh/ρ = 0 98J/kg.Theseareextremelylow energystoragedensities,requiringverylargevolumesofwatertostoredesirableamountsofenergy.
Becausewaterisessentiallyafreecommodity,thecostofstorageisrelatedtothecivilengineering costsofthereservoirandpowerhouse.
Thissystemisbyfarthemostcommonlyusedenergystorageinelectricpowerutilitysystems. ThelargestpumpedstoragesystemintheUnitedStatesistheLuddington,Michiganplantthatstores 15GWh(= 5.4E(4)GJ)ofenergy,providing2000MWofelectricalpowerunderanhydraulic headof85m.ButthetotalU.S.pumpedstoragepowerisabout2%ofthetotalU.S.electricpower, implyinganenergystorageof170GWh(= 6E(5)GJ).Becausenormalhydropowerprovides about11%ofU.S.electricalpower,pumpedstoragehydropowerisnotanegligibleapplicationof hydropowermachinery.
Theoverallenergyefficiencyofhydropowerstorageisabout70%;thatis,theenergydelivered totheelectricpowersystemis70%ofthatwithdrawnduringthestorageprocess.Thiscreditably highvaluestemsfromthefixedspeedandhydraulicheadoftheturbomachineryusedtofilland withdrawwaterstoredinthereservoir.
Hydroelectricmachineryissafe,reliable,andcheaptooperate.Thecapitalcostofpumped storageinstallationsissignificantlyrelatedtothecapitalcostofthecivilworks(dam,reservoir, etc.).Ifthecapitalcostis$500/kWofpower,thenthecapitalcostofpumpedstorageenergyis $23/GJ.
Flywheelenergystoragesystemsarebeingdevelopedforuseinroadvehiclesandforemergencyelectricpowersupplies.Inthisdevice,anaxiallysymmetricsolidmaterialisrotatedabout itsaxisofsymmetryatahighangularspeed .Thematerialattheouteredgeoftheflywheelrim, whoseradiusis R,movesatthespeed R andhasthekineticenergyperunitmassof ( R)2/2 andthekineticenergyperunitvolumeof ρ( R)2/2,where ρ istheflywheelmassdensity.Ifthe flywheelrimhasaradialthicknesssmallcomparedwith R,thenitwouldexperienceatangential stress σ = ρ( R)2,whichistwicethekineticenergyperunitvolume.Inotherwords,themaximumkineticenergyperunitvolumeequals σ/2andthekineticenergyperunitmassis σ/2ρ, where σ isthemaximumallowabletangentialstressintheflywheel.Forhigh-strengthsteel,where σ = 9E(8)Paand ρ = 8E(3)kg/m3,thekineticenergyperunitvolumeis4.5E(8)J/m3 andthe kineticenergyperunitmassis5.63E(4)J/kg.
Theenergyinputandoutputareusuallyintheformofelectricpower.Thesesystemshavevery highrotationalspeedsthatdeclineasenergyiswithdrawnfromthem.Theiroverallenergyefficiency iscomparabletootherformsofstorage.Energystoragedensitiesareabout50Wh/kg = 0.18MJ/kg. Toreachtheseenergystoragedensities,high-strength-to-weightmaterials,suchascarbonfiber, areused.Intheeventofastressfailure,theflywheelcomponentsbecomedangerousprojectiles movingattheflywheelperipheralspeed,sosafetycanbeaproblem.
Forsomeenergystoragesystemsthestoragecapacityperunitvolumeormass(J/m3,J/kg)are importantcharacteristics.Forexample,inelectric-drivehighwayvehiclesthemassorvolumeofa batteryorflywheelsystemneededtosupplyenoughtractionenergyforadesirabletriplengthmay betoogreatforapracticaldesign.Also,thecapitalcostoftheenergystoragesystemisrelatable toitsmassandaffectsthedollarcostperunitofstoredenergy($/MJ).Valuesoftheseproperties fortheenergystoragesystemsconsideredabovearelistedinTable4.2.
AmongthesystemslistedinTable4.2,thereisalargerangeinstoredenergyperunitvolumeand perunitmass.Yeteventhebestofthemdoesnotapproachthehighenergydensityofahydrocarbon
Lead-acidstoragebattery3E(7)2E(5)1575 Flywheel2E(8)2E(5)80
fuel,baseduponitsheatingvalue,of5E(7)J/kg.Itisthisgreatenergydensityoffossilfuelthat makeshighwayvehicles,ships,andaircraftsuchproductivetransportationdevices.Ontheother hand,theenergyneedsofaportabledigitalcomputercanbesatisfiedeasilybyhigh-gradestorage batterieshavingamassthatissmallcomparedtothecomputermass.
ThecapitalcostofenergystorageisnotgreatlydifferentamongthesystemslistedinTable4.2. Ifwevalueelectricenergyatthreecentsperkilowatthour(= 2.8E( 2) $/MJ),thenthecapital costofatypicalstoragesystemisabout3000timesthevalueofthestoredenergy.Ifthestored energyisdischargedeachday,asitwouldbeinasupplylevelingsystemforanelectricutility, thecapitalchargeforstoragewouldaboutequalthecostofelectricenergy,thusdoublingthecost ofthestoredenergyinthisinstance.Theeconomiccostofstoringenergyisanimportantfactor limitingitsuseinelectricutilitysystems.
Theefficiencyofenergystoragesystems—theratiooftheoutputenergytotheinputenergy—is exhibitedinthelastcolumnofTable4.2.Thesearerelativelyhighvalues,reflectingthebestthat canbedonewithoptimumenergymanagement.
Thegenerationandtransmissionofelectricpowerisanecessarycomponentoftheenergysupplyof modernnations.Mostsuchpowerisgeneratedinthermalplantsburningfossilornuclearfuel,orin hydropowerplants.Ineithercase,steam,gas,orhydroturbinessupplymechanicalpowertoelectric generatorsthatfeedelectricpowerviatransmissionanddistributionlinestotheendconsumer.The electricitygenerationanddistributionprocessisveryefficient,withoverallpercentagelossesbeing inthesingle-digitnumbers.
Thereisverylittleelectricenergystoredinthegenerationandtransmissionsystem,soelectric powermustbegeneratedatthesamerateasitisconsumediflinevoltagesandfrequenciesareto bemaintained.Thediurnalpatternofelectricitydemandrequiresthattheelectricpowernetwork becapableofsupplyingthepeakdemand,whichmaybe25%ormoreabovetheaveragedemand. Pumpedhydroelectricplantsareusedtostoreenergythatmaybeusedtosupplydailypeakelectric powerdemand.
Electricenergymaybestoredforvariouspurposesinstoragebatteries,capacitors,andinductors,buttheonlysignificantamountofenergystorageofthesetypesisthatoflead-acidbatteries inmotorvehicles.Costandweightofstoragebatterieshaslimitedtheiruseforprimarypowerin vehicles.
Problem4.1
FromFigure4.1,estimatetheratioofpeakdemand/averagedemandandthatofminimum demand/averagedemand.Iftheelectricitysupplysystemmusthaveacapacity20%abovethe peakdemand,estimatethesystemcapacityfactor—thatis,theratioofaveragedemandtosystem capacity.
Problem4.2
Ageneratorarmaturecoiloflength L = 10cmandhalf-width r = 2cm,asshowninFigure4.3(b), isplacedinamagneticfieldofstrength B = 1weber/m2.Ifthecoilrotatesatafrequencyof 60revolutionspersecondandacurrent I is10amperes,calculatetheperipheralvelocity V,the force F oneachlength L ofthecoilandthecorrespondingelectricfield E,theelectricpotential difference acrossthecoilsliprings,andtheexternaltorque T appliedtothearmature.
Problem4.3
Acapacitorforstoring100MJofenergyinanelectricdrivevehicleutilizesadielectricofthickness h = 0.1mmandelectricpermittivity ǫ = 2E( 11) farad/meter.Themaximumelectricfield E is 3E(9)volts/meter.Forthiscapacitor,calculatetheelectricpotential ,therequiredcapacitance C,thecapacitorarea A,andthevolumeofdielectricmaterial.
Problem4.4
Atypicalautomotivelead-acidbatterystores100ampere-hoursofcharge.Calculatethechargein coulombs.Assumingthatthebatterycandischargeitsfullchargeatanelectrodepotentialof12 volts,calculatetheenergystoredinthefullychargedbattery.
Problem4.5
Apumpedstorageplantisbeingdesignedtoproduce100MWofelectricalpowerovera10-hour periodduringdrawdownofthestoredwater.Themeanheaddifferenceduringthisperiodis30m. Calculatetheamountofelectricalenergytobedeliveredandtherequiredvolumeofwatertobe storedifthehydropowerelectricgeneratorsystemis85%efficient.
Problem4.6
Thecharacteristicsofabatterypoweredelectricvehicle,listedincolumn1ofTable8.3,givean electricenergystorageof18.7kWhandabatterymassof595kg.Ifthebatterieswerereplaced byanelectric,magnetic,orflywheelenergystoragesystemofcharacteristicsgiveninTable4.2, calculatethemassandvolumeofthesealternativesystems.Wouldanyofthesealternativesbe practical?
Andreas,JohnC.,1992. Energy-EfficientElectricMotors. 2ndedition.NewYork:MarcelDekker. Dunn,P.D.,1986. RenewableEnergies:Sources,ConversionandApplications. London:PeterPeregrinus. Howes,Ruth,andAnthonyFainberg,Eds.,1991. TheEnergySourcebook.GuidetoTechnology,Resources, andPolicy. NewYork:AmericanInstituteofPhysics.
Panofsky,WolfgangK.H.,andMelbaPhillips,1962. ClassicalElectricityandMagnetism. Reading:AddisonWesley.
Rand,D.A.J.,R.Woods,andR.M.Dell,1998. BatteriesforElectricVehicles. Somerset:ResearchStudies Press.
Ter-Gazarian,A.,1994. EnergyStorageforPowerSystems. Stevenage:PeterPeregrinus.
InChapter2wesawthatfossil-fueledelectricpowerplantsworldwideconsume55.5%ofthe annualsupplyoffossilfuel,ofwhichmorethan80%isintheformofcoal.Thus,fossil-fueled powerplantsaremajorcontributorstotheanthropogenicemissionsofCO2 andotherpollutants, suchasSO2,NOx,productsofincompletecombustion,andparticulatematter(PM).
Becausepowerplants,forreasonsofeconomyofscale,areusuallybuiltinlarge,centralized units,typicallydeliveringintherangeof500–1000MWofelectricpower,mucheffortisbeing spentontheirefficiencyimprovementandenvironmentalcontrol,sincetheseeffortscouldresult insignificantglobalreductionofpollutantemissionsandconservationoffossilfuelreserves.
Almostallfossil-fueledpowerplantsworkontheprincipleofaheatorcombustionengine, convertingfossilfuelchemicalenergyfirstintomechanicalenergy(viasteamorgasturbines), thenintoelectricalenergy,asdescribedinChapters3and4.1 Mostlarge-scalepowerplantsuse theRankinesteamcycle,inwhichsteamisproducedinaboilerheatedbyacombustiongas;the steamdrivesasteamturbinethatdrivesageneratorofelectricity.2 Usually,steamturbineplants providethebaseloadforaregionalgridincombinationwithnuclearplants.Ontheotherhand, peakloadsaresometimessuppliedbygasturbineplantsthatworkontheBraytoncycle.3 Inthose plants,naturalgasisburned,andthecombustionproductsdirectlydriveagasturbine,whichin turndrivesagenerator.
Thebeststeamcyclepowerplantscanachieveathermalefficiencyabove40%;theU.S.average is36%andtheworldwideaverageisabout33%.4 Gasturbinepowerplantsachieveathermal efficiencyinthe25–30%range.Moreadvancedpowerplantsexisttodaythatuseacombinationof BraytonandRankinecycles.Combinedcyclepowerplantscanachieveanefficiencyofabout45%. Therelativelylowthermalefficiencyofpowerplantsisduetotwofactors.Thefirstisaconsequence oftheSecondLawofThermodynamics,wherebyinaheatenginecycle,afterperforminguseful
1Theexceptionwouldbeapowerplantthatusesafuelcellfortheconversionoffossilfuelchemicalenergy directlyintoelectricalenergy.However,veryfewpowerplantsexisttodayworkingontheprincipleofafuel cell.TheworkingsofafuelcellelectricitygeneratoraredescribedinChapter3.
2ForadetaileddescriptionoftheRankinecycle,seeSection3.10.2.
3Forexplanationofbaseandpeakload,seeChapter4.TheBraytoncycleisdescribedinSection3.10.4.
4Thermal(orfuel)efficiencyisdefinedastheratioofelectricalenergyoutputtofossilfuelenergyinput (seeSection3.13).Anequivalentdefinitionisthe heatrate.ThisistheamountofBritishthermalunitsor gigajoulesoffuelenergyspentperkilowatthourofelectricityproduced.
work,theresidualofthefuelheatneedstoberejectedtoacoldreservoir,usuallyasurfacewater (river,lakeorocean)ortheatmosphereviaacoolingtower.Thesecondfactorisduetoparasitic heatlossesthroughwallsandpipes,frictionallosses,andresidualheatescapingwiththefluegas intotheatmosphere.Itisanunfortunatefactofelectricitygenerationthatpowerplantsuseonly about25–50%oftheinputchemicalenergyoffossilfuelstogenerateelectricity;therestiswasted; thatis,itgoesdowntheriverandupintheair,sotospeak.
Inthischapterwedescribetheworkingsoffossilfueledpowerplantsandtheircomponents: fuelstorageandpreparation,burner,boiler,turbine,condenser,andgenerator.Wefocusinparticular onemissioncontroltechnologiesthatpowerplantsarerequiredbylawinmostcountriestoinstall inordertosafeguardpublichealthandtheenvironment.Wealsoreviewbrieflyadvancedcycle powerplantsthathavethepromiseofincreasingthermalefficiencyandreducingpollution.
Inafossil-fueledpowerplantthechemicalenergyinherentinthefossilfuelisconvertedfirsttoraise theenthalpyofthecombustiongases;thatenthalpyistransferredbyconvectionandradiationtoa workingfluid(usually,water/steam);theenthalpyoftheworkingfluidisconvertedtomechanical energyinaturbine;andfinallythemechanicalenergyoftheturbineshaftisconvertedtoelectrical energyinagenerator.
Themajorcomponentsofafossilfueledpowerplantareasfollows:
• Fuelstorageandpreparation
• Burner
• Boiler
• Steamturbine
• Gasturbine
• Condenser
• Coolingtower
• Generator
• Emissioncontrol
Coalisdeliveredtoapowerplantbyrailor,inthecaseofcoastalorriverineplants,byshiporbarge. Usually,powerplantoperatorsliketohaveseveralweeksofcoalsupplyonsite,incaseofdelivery problemsorcoalminestrikes.Becausea1000-MWpowerplant,havingathermalefficiencyof 35%,consumesontheorderof1E(4)metrictonsofcoalperday,thecoalmoundsneartheplant maycontainupto3E(5)metrictonsofcoal.Somecoal-firedpowerplantsaresituatedrightnear coalmines(so-calledmine-mouthplants).Eventheseplantsstoreatleastamonth’ssupplyofcoal neartheplant.
Whencoalarrivesbyrail,itisusuallycarriedbyaunittrain,consistingofahundredwagons filledwithcoal,at100tonsperwagon.Thewagonsareemptiedbyarotarydump,andthecoalis carriedbyconveyorstoastockpile,ordirectlytothepowerplant.
Coalisdeliveredtoaplantalreadysizedtomeetthefeedsizeofthepulverizingmill(see below),intheorderofafewtotencentimeterspercoallump.IntheUnitedStatesandmanyother countries,coaliswashedatthemine.Washingofcoalremovesmuchofthemineralcontentofthe coal(includingpyriticsulfur),thusreducingitsashandsulfurcontentandimprovingitsheating valueperunitmass.Inpreparationforwashing,thecoaliscrushedattheminemouthtolessthan acentimeterper nut or slack.
Mostmodernsteampowerplantsfirepulverizedcoal.Therawcoalfromthestockpileis deliveredonaconveyorbeltdirectlytoapulverizingmill.Suchmillsareeitheroftherotatingring, rotatinghammer,orrotatingballtype.Themillreducestherawcoallumpstoparticlessmaller than1millimeter.Thepulverizedcoalisstoredinlargeverticalsilosfromwhenceitisblown pneumaticallyintotheburnersataratedemandedbytheloadoftheplant.
Inoil-firedpowerplants,oilisstoredinlargetanks(the“tankfarm”),towhichoilisdelivered eitherbypipeline,byrailroadtankers,orbytankershiporbargeiftheplantislocatednearnavigable waters.Powerplantsliketohaveatleasta30-daysupplyofoilintheirtanks.Fora1000-MW plantwith35%efficiency,thiscanamounttoover1E(5)metrictonsofoil.Theoilispurchased fromrefineriesintheformitiscombustedintheburners,withspecifiedsulfur,nitrogen,andash contentaswellasotherproperties,suchasviscosityandvaporpressure.
Innaturalgas-firedpowerplants,gasisdeliveredtothepowerplantbypipelineathigh pressure(compressednaturalgas,CNG).Somegas-firedpowerplantsuseliquefiednaturalgas (LNG).Liquefiedgasistransportedinhuge(upto1.25E(5)m3)refrigeratedtankersat 164 ◦C. TheLNGisstoredinrefrigeratedtanksuntilused.
Theroleoftheburneristoprovideathoroughmixingofthefuelandairsothatthefueliscompletely burned.Ignitionisaccomplishedbyaspark-ignitedlightoiljetuntiltheflameisself-sustaining. Inthecombustionchamberapulverizedcoalparticleoratomizedoildropletburnsinafraction ofasecond.Thecoalparticleoroildropletburnsfromtheoutsidetothecore,leavingbehind incombustiblemineralmatter.Themineralmatteriscalledash.Inmodernpulverizedcoaland atomizedoilfiredpowerplants,morethan90%ofthemineralmatterformstheso-called flyash, whichisblownoutoftheboilerbyforcedornaturaldraftandislatercapturedinparticlecollectors. About10%ofthemineralmatterfallstothebottomoftheboileras bottomash.Whenthebottom oftheboilerisfilledwithwater,thebottomashformsawetsludge,whichissluicedawayinto animpoundment.Someoftheflyash,however,isdepositedonthewaterpipesliningtheboiler. Thisformsaslagwhichhindersheattransfer.Theslagneedstoberemovedfromtimetotimeby blowingsteamjetsagainstitorbymechanicalscraping.
Coalburnsrelativelyslowly,oilburnsfaster,andgasburnsthefastest.Forcompletecombustion (carbonburn-out),excessairisdelivered—thatis,moreairthanisrequiredbyastoichiometric balanceoffuelandtheoxygencontentofair.Pulverizedcoalrequires15–20%excessair;oiland gas5–10%.
AtypicalburnerforpulverizedcoalisdepictedinFigure5.1.Thecentralcoalimpellercarries thepulverizedcoalfromthesiloinastreamofprimaryair.Tangentialdoors(registers)builtinto thewindboxallowsecondaryairtobeadmixed,generatingafastburningturbulentflame.The impellerispronetocorrosionanddegradationandhastobereplacedonceayearorso.
Theburnersareusuallyarrangedtopointnearlytangentiallyalongtheboilerwalls.Insuch afashionasingleturbulentflameensuesfromallfourburnersinarow,facilitatingtherapidand
Air register flaps
Secondary air
Pulverized coal and primary air impeller
Secondary air
Boiler water wall
completeburn-outofthefuel.Dependingonthepoweroutputoftheboiler,asmanyassixrows ofburnersareemployed,totaling24burners.
Somepowerplantsemploycyclonefurnaces,especiallyforpoorergradesofcoalwithahigh ashcontent.Inacyclonefurnacethecombustionofthepulverizedcoalisaccomplishedinawatercooledhorizontalcylinderlocatedoutsidethemainboilerwall.Thehotcombustiongasesare conveyedfromthecyclonefurnacetothemainboiler.Theadvantageofacycloneburneristhat themajorityofthemineralmatterformsamoltenash,called slag, whichisdrainedintothebottom oftheboiler,andonlyasmallerportionexitstheboilerasflyash.Thus,smallerandlessexpensive particlecollectorsarerequired.Thedisadvantageisthatatthehightemperaturesexperiencedinside thecyclonefurnace,copiousquantitiesofNOxareformed.Nowadays,plantsequippedwithcyclone furnacesrequiretheinstallationoffluegasdenitrificationdevicesforreducingNOx concentrations inthefluegas,largelyvitiatingthecostsavingsofcyclonefurnacesintermsofcoalqualityand ashcontent.
Someolderpowerplantsandsmallerindustrialboilersemploystokerfiring.Instoker-fired boilers,thecrushedcoalisintroducedintotheboileronaninclined,travelinggrate.Primaryair isblownfrombeneaththegrate,andsecondaryoverfireairisblownabovethegrate.Bythetime thegratetraversestheboiler,thecoalparticlesareburntout,andtheashleftbehindfallsintoa hopper.Thecarbonburn-outefficiencyislowerinstokerthaninpulverizedcoalburnersbecause ofpoorermixingofcoalandairthatisachievableinstoker-firedboilers.Therefore,stoker-type boilershavealowerthermalefficiencycomparedtopulverizedcoalboilers.
Theboileristhecentralcomponentofafossil-fueledsteampowerplant.Mostmodernboilersare ofthewaterwalltype,inwhichtheboilerwallsarealmostentirelyconstructedofverticaltubes thateithercarryfeedwaterintotheboilerorcarrysteamoutoftheboiler.Thefirstwaterwallboiler wasdevelopedbyGeorgeBabcockandStephenWilcoxin1867.Theearlywaterwallboilerswere usedinconjunctionwithreciprocatingpistonsteamengines,suchasusedinoldlocomotives.Only inthetwentiethcentury,withtheadventofthesteamturbine,anditsrequirementforlargesteam pressuresandflows,hasthewaterwallboilerbeenfullydeveloped.Inamodernwaterwallboiler thefurnaceandthevariouscompartmentsoftheboilerarefullyintegrated.
Saturated steam
To high-pressure turbine
To low-pressure turbine
From high-pressure turbine
Flue gas to stack
highpressure feedwaterheater atatemperatureof230–260 ◦Cisfurtherheatedinthe economizer sectionoftheboilerto315 ◦C,thenflowsintothe steamdrum, whichismountedontopofthe boiler.5 Thesteamdrummeasurestypically30minlengthand5mindiameter.Inthesteam drumliquidwaterisseparatedfromthesteam,usuallybygravity.Fromthesteamdrum,liquid waterflowsdownthe downcomer tubesintothe header.Fromthere,thehotpressurizedwater flowsupward(becauseofanegativedensitygradient)throughthe riser tubes,wheretheactual boilingofwaterintosteamoccurs.Theseparatedsteampassesanothersectionoftheboiler, calledthe superheater, whereitstemperatureisraisedto565 ◦Catapressureof24MPa.Atthis pointthetemperatureandpressurearehigherthanthecriticaltemperature(Tc = 374 ◦C)and pressure( pc = 22MPa)ofwater.Thesupercriticalsteamdrivesthehigh-pressureturbine.The exhauststeamfromthehigh-pressureturbineflowsthroughthe reheater sectionoftheboiler,where thetemperatureisraisedagaintoabout500 ◦Catapressureof3.7MPa.Thissteamdrivesthe
low-pressureturbine.Thesuperheaterandreheatersectionsoftheboilerareusuallysituatedpast abendintheboiler,calledthe neck.Inordertooptimizethermalefficiency,thecombustionair ispreheatedtoatemperatureof250–350 ◦Cinthe airpreheater sectionoftheboiler.Nearthe burners,heatistransferredfromthecombustiongasestotheboilertubesbyradiation.Awayfrom theburners,heatistransferredmainlybyconvection.Coalandoilflamesarehighlyluminousin thevisibleportionofthespectrumbecauseoftheradiationfromunburntcarbonandashparticles. Naturalgasflamesarelessvisiblebecauseoftheabsenceofparticlesintheflame.However, mostoftheradiativetransferofheatfromallflamesoccursinthenonvisibleinfraredportion ofthespectrum.Thetheoretical(Carnot)thermodynamicefficiencyofaheatenginethatworks betweenatemperaturedifferentialof838K(565 ◦C)and298K(25 ◦C)—thatis,betweenthe temperatureofthesuperheaterandthecondensationtemperatureofwaterinthecondenser—is
η = (TH TL )/TH = 64%.However,asmentionedintheintroduction,typicalefficienciesof steampowerplantsareinthe33–40%range.Becauseheatisaddedtothewaterandsteamat alltemperaturesbetweentheselimits,theRankinecycleefficiencyisnecessarilylowerthanthe Carnotvalue.Furthermore,parasiticefficiencydegradationoccursbecauseofheatlossesthrough thewallsoftheboiler,ducts,turbinebladesandhousing,andfrictionalheatlosses.
Steamturbineswerefirstemployedinpowerplantsearlyinthetwentiethcentury.Theycanhandle amuchlargersteamflow,muchlargerpressureandtemperatureratios,andamuchlargerrotational speedthancanreciprocatingpistonengines.Todayvirtuallyallsteampowerplantsintheworld employsteamturbines.Thesteamturbinearguablyisthemostcomplexpieceofmachineryinthe powerplant,andperhapsinallofindustry.Thereareonlyascoreofmanufacturersintheworld thatcanproducesteam(andgas)turbines.
Theantecedentofthesteamturbineisthewaterwheel.Justaswaterpushesthebladesof awaterwheel,steampushesthebladesofasteamturbine.Consideringthehighpressureand temperatureofthesteam,thattheturbinemustbeleakproof,theenormouscentrifugalstresses ontheshaft,andthefactthatsteamcondensestowaterwhileexpandingintheturbine,thereby creatingatwophasefluidflow,onegetsanideaofthetechnologicalproblemsfacingthedesigner andbuilderofsteamturbines.
ThedevelopmentofthemodernsteamturbinecanbeattributedtoGustavdeLaval(1845–1913) ofSwedenandCharlesParsons(1854–1931)ofEngland.deLavalconcentratedonthedevelopment ofanimpulseturbine,whichusesaconverging–divergingnozzletoacceleratetheflowspeedof steamtosupersonicvelocities.Thatnozzlestillbearshisname.Parsonsdevelopedamultistage reactionturbine.Thefirstcommercialunitswereusedforshippropulsioninthelastdecadeofthe 1800s.Thefirststeamturbineforelectricitygenerationwasa12MWunitinstalledattheFisk powerplantinChicagoin1909.A208-MWunitwasinstalledinaNewYorkpowerplantin1929.
Inanimpulseturbineajetofsteamimpingesonthebladesofaturbine.Thebladesaresymmetrical andhaveequalentranceandexitangles,usually20 ◦.Steamcomingfromthesuperheater,initially at565 ◦Candover20MPa,whenexpandedthroughadeLavalnozzlewillhavealinearvelocity ofabout1650ms 1.Toutilizethefullkineticenergyofthesteam,thebladevelocityshouldbe about820ms 1.Suchaspeedwouldgenerateunsustainablecentrifugalstressesintherotor.To
reducetherotorspeed,turbinesusuallyemploycompoundingorstaging.Inastagedturbine,two ormorerowsofmovingblades(rotors)areseparatedbyrowsofstationaryblades(stators),asin Figure5.3(a).Eachpairofstatorandrotorbladesiscalledastage.Whenthesteamkineticenergy isdividedamong n stages,thelinearbladevelocityoftherotorswillbe1/2n thatofasinglerotor.
Theforceexertedonarotorbladeis F =˙m(vs vb) newtons,where m isthemassflow rateofsteamthroughtheblade(kgs 1), vs isthetangentialvelocityofthesteamjet(ms 1),and vb isthebladespeed.Thepowergeneratedbythebladeis P = Fvb watts.Itcanbeshownthat maximumpower,obtainedfor vb = vs /2,is Pmax =˙mv2 s /4.
Areactionturbineconsistsofrowsoffixed(stator)andmoving(rotor)blades.Thebladesare shapedtoformaconvergingnozzle[seeFigure5.3(b)].Withintheconvergingbladesthesteam pressure,densityandtemperaturedeclinewhileconvertingitsenthalpytokineticenergy.Thesteam pressuredropssteadilythroughallrowsofblades,stationaryandmoving,butthesteamvelocity oscillates,dependingonlocationwithinthebladeformation.Inareactionturbinetheoptimum bladevelocityis vb,opt = vs cos θ ,where θ istheleavingangleoftheblades,andthemaximum powerobtainedis Pmax =˙mv2 b,opt
Inreactionturbinesthepressuredropsacrossthemovingblades.Thismakesthemlesssuitable forhigh-pressuresteambecauseofleakagearoundthebladetipsandconsequentlossofefficiency. Therefore,impulseturbinesareusuallyusedforhigh-pressuresteam,andreactionturbinesare usuallyusedforintermediateandlow-pressuresteam.Inaddition,thehigh-pressureimpulsestage canreducethesteamflowtotheturbinebyclosingoffsomeofthefirst-stagenozzles;thisflow controlisabsentinreactionstages.InFigure3.4wehaveseenaphotoofa1500-MWsteamturbine complexforhigh-,intermediate-,andlow-pressurestages.
Inboththeimpulseandreactionturbines,efficiencylossesareduetosupersaturation,fluid friction,leakage,andheattransferlosses.Supersaturationoccursprimarilyinreactionturbines whenaccordingtothermodynamicequilibriumintheexpansionprocesssteamoughttocondense, releasinglatentheatofcondensation.Instead,steamremainsforawhileinasupercooledstate beforerevertingtothermodynamicequilibrium.Thisresultsinasuddenreleaseofenergy,calledthe condensationshock.Itisanirreversibleprocess,causinglossinefficiencyandenergyavailability.
Fluidfrictionoccursthroughouttheturbine,inthesteamnozzles,alongtheblades,andalong therotordisksthatcarrytheblades.Inaddition,therotorandbladerotationimpartacentrifugal actiononthesteam,causingittobedraggedalongtheblades.Whenthebladesarenotproperly designed,flowseparationmayensue,furtherincreasingturbinelosses.
Heattransferlossesarecausedbyconduction,convection,andradiation.Conductionisthe resultofheattransferbetweenmetalpartsoftheturbine.Convectionistheheattransferbetween steamandthemetalparts.Radiationistheheatgivenoffbytheturbinecasingstothesurroundings. Heattransferlossesarehighestinthehigh-temperature,high-pressuresectionsoftheturbines.
Inaddition,therearefrictionallossesinbearings,governormechanisms,andreductiongearing. Also,turbinesmustsupplypowerforaccessories,suchasoilpumps.Thecombinedefficiencylosses andsyphoningofauxiliarypoweramountto10–20%;thatis,turbinesconvertonly80–90%ofthe availablesteamenthalpyintomechanicalenergythatdrivesthegenerator.
Inagasturbineplantwhereoil,naturalgas,orsynthesisgasmaybeusedasafuel,thehotcombustion gasesaredirectlyusedtodriveagasturbine,ratherthantransferringheattosteamanddrivinga steamturbine.Thisrequiresadifferentturbine,appropriateforthemuchhighertemperatureofthe combustiongasesandtheirdifferentthermodynamicpropertiescomparedtosteam.Gasturbines areeasilybroughtonlineandhaveflexibleloadmatch.Buttheircycleefficienciesarelowerthan thoseofsteamplants,andthefuelismoreexpensive.Therefore,gasturbinesaremostlyused forpeakloadproductionandforauxiliarypower,suchasduringmajorplantoutages.However, recentlymanynaturalgas-fueledgasturbineplantshavebeeninstalledintheUnitedStatesand othercountries;buttheseusuallyemploythecombinedcyclemode,whichhasahigherefficiency thanthesinglecyclemode.GasturbinesoperateontheprincipleoftheBraytoncycle,whichwas describedinChapter3.Compressedairentersacombustionchamber,whereliquidorgaseousfuel isinjected.Thecombustionofthefuelincreasesthetemperatureofthecombustiongas,producing anetworkoutputoftheturbine–compressorsystem.Thetemperatureofthecombustiongasesison theorderof1100–1200 ◦C,whichisthemaximumtolerablebypresent-daysteelalloysusedforgas turbineblades.Evenatthesetemperatures,thermalstressesandcorrosionproblemsaremanifested, sothatturbinebladecoolingfromtheinsideoroutsideofthebladesbyairorwaterisnecessary.
Gasturbinesareofthereactiontype,wherebladesformaconvergingnozzleinwhichthe combustiongasesexpand,thusconvertingenthalpytokineticenergy.Asinsteamturbines,staged turbinesareemployed,consistingofseveralrowsofmovingandfixedblades.
Theworkingfluidingasturbines,composedofnitrogen,excessoxygen,watervapor,and carbondioxide,isnotrecycledintothecompressorandcombustionchamberbutis,instead,vented intotheatmosphere.Insomesystems,apartoftheenergystillresidingintheexhaustgasisrecovered inheatexchangerstoheatuptheairenteringthecombustionchamberinordertoenhancetheoverall thermalefficiencyoftheBraytoncycle,buteventuallytheexhaustgasisvented.Thisisincontrast tosteamturbineswheretheworkingfluid,steam,isrecycledintotheboilerascondensedwater.6
6Gasturbineshavemanyapplicationsotherthanforelectricitygeneration.Theyareusedforpipelinepumping ofnaturalgas,shippropulsion,andforemostforairplanepropulsioninturbojetaircraft.Here,airiscompressed inthecompressor,andjetfuel(kerosene)isaddedtothecombustionchamber.Thecombustiongasesdrive theturbinethatsuppliespowertothecompressorandauxiliarysystems(e.g.,electricitygeneration),andthe turbineexhaustgasespassadeLavalnozzletoprovideforwardthrusttotheairplane.
Inheatenginecycles,afterperformingusefulwork,theworkingfluidmustrejectheattoacold body.Steamturbineelectricpowerplantsworkontheprincipleofheatengines.Theyrejecta significantamountofheatintotheenvironment.Between1.5and3timesasmuchheatisrejected astheplantproducesworkintheformofelectricity.A1000-MWelectricpowerplantworking at25%efficiencyrejects3000MWofheattotheenvironment,whereasoneworkingat40% efficiencyrejects1500MW.Someofthatheatisaddedtotheenvironmentbythecondensing systeminasteamcycle,andtherestisaddedbythedischargetotheatmosphereofthehotflue gasventedthroughthesmokestack.
IntheRankinesteamcycle,afterexpansionintheturbine,thesteamisfirstcondensedinto waterinacondenser,thenthewaterisrecycledintotheboilerbymeansofafeedpump.The circulatingcoolingwaterofthecondenserrejectsitsheattotheatmospherebymeansofacooling towerortoanearbysurfacewater.Thecondenserservesnotonlythepurposeofcondensingthe high-qualityfeedwateroftheboiler,butalsotolowerthevaporpressureofthecondensatewater. Byloweringthevaporpressure,avacuumiscreatedwhichincreasesthepoweroftheturbine.
Therearetwotypesofcondenser: directcontact and surfacecontact condensers.Adirect contactcondenserisdepictedinFigure5.4(a).Theturbineexhaustpassesanarrayofspraynozzles throughwhichcoolingwaterissprayed,condensingthesteambydirectcontact.Thewarmcondensateispumpedintoacoolingtowerwhereupdraftingaircoolsthecondensatethatflowsintubes. Thecooledcondensateisrecycledintospraynozzles.Becausethecoolingwaterisindirectcontact withthesteamexhaust,itspuritymustbemaintained,justlikethatofthefeedwater.Thismakesthe processmoreexpensive,andthemajorityofpowerplantsuseasurfacecontactcondenser,depicted inFigure5.4(b).Itisessentiallyashell-and-tubetypeheatexchanger.Theturbineexhaustpassesan arrayoftubesinwhichthecoolingwaterflows.Becauseforlargepowerplantsverylargevolumes ofsteamneedtobecondensed,thecontactsurfaceareacanreach100,000m2 fora1000-MW plant.Thedesignofaproperlyfunctioningcondenserinvolvescomplicatedcalculationsofheat transfer.Thetubesaresurroundedbyfinstoincreasetheheattransferarea.Theincomingsteam needstobedeaeratedofnoncondensables,mainlyairthatleakedintothesystem.Theoxygenof
airiscorrosive.Also,noncondensablesinthecondensatewouldincreasethecondenserpressure andtherebyreducethesteamturbinepower.
Thebulkoftheheatrejectionfromthesteamcycleoccurseithertoasurfacewaterortothe atmosphere.Inthepast,mostpowerplantswerelocatednearariver,lake,orocean.Inthose plantsthehotwaterfromthecondenserisdirectlydischargedtothesurfacewaterbymeansof adiffuserorindirectlyintoacanalthatleadstothesurfacewater.Thedischargeofwarmwater intothesurfacewatercancausethermalpollutionandpossibleharmtoaquaticorganisms.Also, contaminantsthatleachintothedischargewaterfrompipesandductsmaypollutethesurface waters.Asaconsequence,environmentalprotectionagenciesinmanycountriesmandatethatheat rejectionoccurintotheatmosphereviacoolingtowers.
Therearetwotypesofcoolingtowers: wet and dry.Therearealsocombinationsofwetand drytowers,aswellascombinationsofcoolingtowersandsurfacewatercooling.
Inawetcoolingtowerthehotcondensateorcoolingwateriscooledbytransferofsensibleheat totheatmosphereandevaporationofpartoftherecirculatedwateritself,therebyabsorbingfrom theairandwaterthelatentheatofvaporization.Thecoolingtowerisusuallyvisibleasagigantic spool-likestructureconstructednearafossilornuclearpowerplant.Thespoolconfigurationis advantageousfromastructuralstandpoint;itrequireslessconcreteforitssize,anditismore resistanttostrongwinds.
AtypicalwettowerschematicwithnaturaldraftisdepictedinFigure5.5.Hotwaterfromthe condenserissprayedoveralatticeworkofcloselyspacedslatsorbars,called fill or packing.Outside
airisdrawninthroughlouversinthebottomofthetowerbynaturaldraft.Heatistransferredfrom thecoolingwatertotheairdirectly,andthewaterisfurthercooledbyevaporationofpartofthe water.Coldwaterfallsbygravityintothecollectingbasinfromwhenceitisrecirculatedintothe condenser.Amisteliminatorisplacedabovethefill.Nevertheless,amistplumeusuallyforms abovethetower,especiallyincoldweather.Thiswhiteplumeisoftenmistakenaspollution;in factitisjustcomposedofwaterdropletsoricecrystals.7
A1000-MWpowerplantworkingat33%efficiencyinahotclimateevaporates0.63m3 s 1 water,whichis1.3%oftherecirculatingwater.Inacoldclimatethesameplantwouldevaporate only1%oftherecirculatingwater.Thisamountsto2E(7)or1.5E(7)m3 y 1 waterthatthe powerplantmustwithdrawfromasurfacewater,well,ormunicipalwaterinhotorcoldclimate, respectively.
Inadrycoolingtower,therecirculatingwaterflowsthroughfinnedtubesoverwhichcoldair isdrawn.Inadrytowerallheatrejectionistotheatmosphere.Theadvantagesarethatnowaterevaporates,andadrytowerislessexpensivetomaintain.Thedisadvantagesarethatitis moreexpensivetobuildandthebackpressureontheturbinesishigher,causingplantefficiency loss.Nevertheless,inaridareaswherenomake-upwaterisavailable,drycoolingtowersare employed.
Thegeneratoristheheartofthepowerplant.Thatiswhereelectricityisgenerated.Comparedtothe boiler,turbines,condenser,coolingtower,andotherauxiliaryequipment,thegeneratoroccupiesa smallfractionofthetotalplantoutlay.Itsnoiselevelisalsonegligiblecomparedtothehumand drumofthecoalmills,burners,pumps,fans,andturbines.
TheelectromagnetictheoryofthegeneratorisdescribedinChapter4.Briefly,theshaftofthe turbineturnsconductingcoilswithinamagneticfield.Thisinducesanelectriccurrenttoflowin thecoils.Theelectricpoweroutputofthegeneratorequalsthemechanicalpowerinputoftheshaft, minusminorresistivelossesinthecoilsandfrictionallosses.Inordertopreventtheoverheating ofthegeneratorinducedbytheselosses,generatorsarecooledbyhighconductivitygases,suchas hydrogenorhelium.
Thegeneratorproducesanalternatingcurrent(AC):60HzintheUnitedStatesandCanada, 50Hzinmostothercountries.Theshaftoftheturbinemustrotateataprecisespeedinorder toproducetheexactfrequencyoftheAC.Thevoltageproducedbythegeneratorisenhanced bystep-uptransformersandthentransmittedintothegrid.Becauseresistancelossesareproportionaltothesquareofthecurrentbutlinearlyproportionaltothevoltage,itisadvantageousto transmitpoweratlowcurrentandhighvoltage.Long-distancetransmissionusuallyoccursinthe hundredsofkilovoltrange.Attheuser,thevoltageisreducedbystep-downtransformersto110 or220V.
Ifleftuncontrolled,powerplantscanemitquantitiesofairpollutantsthatcauseambientpollutant levelstoexceedstandardsdesignedtoprotecthumanhealthandtheenvironment.Supposea 1000-MWpowerplantburnscoalwitha10%mineralcontentand2%sulfurcontent(notunusual). Itisabase-loadedplantthatworksat100%capacityand35%thermalefficiency.Thecoalhasa heatingvalueof12,000Btulb 1 (≈ 28MJkg 1).Allthemineralcontentexitsthesmokestackas particles(flyash),andthesulfurexitsassulfurdioxideSO2.Thisplantwouldemit3.2E(5)ty 1 ofparticlesand1.3E(5)ty 1 ofSO2 (sulfurdioxidehastwicethemolecularweightofsulfur). Inaddition,theplantwouldemitcopiousquantitiesofnitrogenoxides,productsofincomplete combustion(PIC),carbonmonoxide,andvolatiletracemetals.Clearly,suchanuncontrolledpower plantcouldpresentamajorrisktohumanhealthandtheenvironment.Therefore,inmostcountries, environmentalregulationsrequirethattheoperatorofthepowerplantinstallemissioncontrol devicesforthesepollutants.Thesedevicescontributesignificantlytothecapitalandoperatingcost oftheplant,andreducetosomedegreethethermalefficiency,becausethedevicessyphonoffsome ofthepoweroutputoftheplant.Thesecostsarepassedontothecustomersasaddedcostofthe electricity.Thecontroldevicesalsoproduceastreamofwaste,becausewhatisnotemittedinto theatmosphereusuallywindsupasasolidorliquidwastestream.
ThecontrolofPICandCOisrelativelyeasytoaccomplish.Ifthefuelandairarewell-mixed,asis thecaseinmodernburners,andthefuelisburntinexcessair,thefluegaswillcontainverylittle, ifany,PICandCO.Itisintheinterestofpowerplantstoachieveawell-mixed,fuel-lean(airrich)flame,notonlyforreducingtheemissionofthesepollutants,butalsoforcompleteburn-out ofthefuel,whichincreasesthethermalefficiencyoftheplant.PICandCOemissionsdooccur occasionally,especiallyduringstart-upsandcomponentbreakdowns,whentheflametemperature andfuel–airmixtureisnotoptimal.Underthoseconditionsavisibleblacksmokeemanatesfromthe smokestack.Theseoccurrencesshouldberareandshouldnotcontributesignificantlytoambient concentrationsofthesepollutants.
Particles,alsocalledparticulatematter(PM),wouldbethepredominantpollutantemanatingfrom powerplantswereitnotcontrolledatthesource.Thisstemsfromthefactthatcoal,andeven oil,containsasignificantfractionbyweightofincombustiblemineralmatter.Inolder,stoker-fed andcycloneburnerplants,themineralmatteraccumulatesinthebottomoftheboilerasbottom ashandisdiscardedassolidwasteortakenupinwaterandsluicedaway.Inmodernpulverized coal-firedplantsthemajority(≈ 90%)ofthemineralmatterisblownoutfromtheboileras flyash.Theflyashcontains(a)ahostoftoxicmetals,suchasarsenic,selenium,cadmium, manganese,chromium,lead,andmercury,and(b)nonvolatileorganicmatter(soot),including polycyclicaromatichydrocarbons(PAHs);thesewouldposeapublichealthandenvironmental riskifemittedintotheatmosphere.Forthatreason,mostcountriesinstitutedstrictregulationson particleemissionsfrompowerplants.
IntheUnitedStates,powerplantsbuiltbetween1970and1978hadtomeetastandardforPM emissionsofamaximumof0.03lbpermillionBtuheatinput(0.013kg/GJ).Forpowerplantsbuilt after1978,thereisnonumericalstandard,buttheso-calledBestAvailableControlTechnology (BACT)standardapplies(seeSection9.2.1).Presently,BACTforpowerplantsisanelectrostatic precipitator.
ElectrostaticPrecipitator. TheESPwasinventedintheearly1900sbyF.G.Cottrellatthe UniversityofCalifornia,Berkeley,inordertocollectacidmistinsulfuricacidmanufacturing plants.Itwassoonappliedforcollectingdustincementkilns,leadsmelters,tar,paperandpulp mills,andotherfactories.Beginninginthe1930sand1940s,ESPwasappliedtocoal-firedpower plants.TheinstallationofearlyESPsprecededenvironmentalregulations;theywereinstalledto protecttheownersfrompossibleliabilitysuitsbecausetheparticleemissionscouldcauseahealth hazard.
TheESPworksontheprincipleofchargingparticlesnegativelybyacoronadischargeand attractingthechargedparticlestoagroundedplate.AschematicofanESPisgiveninFigure5.6. Severalchargingwiresaresuspendedbetweentwoparallelplates.Ahighnegativevoltage,onthe orderof20to100kV,isappliedtothewires.Thiscausesanelectricfieldtobeestablishedbetween thewiresandtheplatesalongwhichelectronstravelfromthewirestowardtheplates.Thisiscalled a coronadischarge.Theelectronscollidewithgasmolecules,primarilywithoxygen,creating negativeions.Themolecularionskeeptravelingalongthefieldlines,collidingwithparticlesand transferringthenegativechargetotheparticles.Now,theparticlesmigratetotheplateswheretheir chargeisneutralized.Theneutralparticlesareshakenofftheplatesbyrappingthemperiodically. Theparticlesfallintoahopperfromwhencetherearecartedaway.
ThecollectionefficiencyofanESPdependsonmanyfactors,primarilytheparticlediameter (thesmallerthediameter,thelesstheefficiency),theplatearea,thevolumetricflowrateoftheflue gaspassingbetweentheplates,andtheparticlemigrationspeedtowardtheplates,Theefficiency
iscalculatedfromtheDeutschequation
η = 1 exp( w A/Q) (5.1)
where w isthemigrationspeed, A isthetotalareaoftheplates,and Q isthevolumetricflowrate. Themigrationspeedisapproximatedfrom w ≈ 0.05d p ms 1 whentheparticlediameter d p is givenin µm.Actually, w isafunctionofthevoltageandtheelectricalresistivityoftheparticles. Ironically,thehigherthesulfurcontentofthecoal,thelowertheresistivityoftheflyashandthe higherthemigrationspeed.However,thehigherthesulfurcontentofthecoal,thehigheracidgas emissions,sothereisatrade-off.
Forexample,considera1000-MWcoal-firedpowerplantwithathermalefficiencyof36% usingcoalwithaheatingvalueof12,000Btulb 1 (7.75kWhkg 1).Thisplantwouldconsume coalatarateof99.6kgs 1.Assumingthattheatomiccompositionofthecombustiblepartofcoal isCHandthecoalisburnedwith20%excessair,thecombustiongeneratesfluegasattherateof Q = 1260m3 s 1.Ifparticlesof1-µmdiameteraretobecollectedwith95%efficiency,weneeda platearea A = 75,500m2.Ifeachplatemeasures20 × 5m,andtwosidesoftheplatearecollecting particles,weneed377plates.Figure5.7givesthecollectionefficiencyofanESPwiththeabove specificationsasafunctionofparticlediameter.Itisseenthatforparticlediametersgreaterthan 1 µm,theefficiencyapproaches100%,butsubmicronparticlesarenotcollectedefficientlyatall. AcutawaydrawingofalargeESPisshowninFigure5.8.Typicallytheoverallwidthofan ESPisabout20–30m,andtheoveralllengthis18–20m.Typicalplatedimensionsare20 × 5m, platespacingis0.25m,andthenumberofplatesareinthehundreds.Afterexitingfromtheboiler, thefluegasistransferredtotheESPinlargeducts.FromtheESP,thecleansedfluegasentersthe smokestack.TheESP,togetherwithitshousing,transformers,hoppers,andtruckbays,mayoccupy
astructurehalfthesizeoftheboilerofapowerplant.ThepowerdrawnbytheESP,includingthe fansthatdrivethefluegasthroughit,andthemechanicalenergyforrappingtheplatesconsume lessthan0.1%oftheplant’spoweroutput.Thelevelizedcost(amortizedcapitalandoperating cost)ofrunninganESPmayadd6–10%tothegeneratingcostofelectricity.8
Therelativelylowefficiencyofsmall-particlecollectionbyexistingESPsposesaproblem totheoperatorsofexistingpowerplantsbecauseenvironmentalprotectionagenciesinseveral countries,notablytheUnitedStates,plantointroducenewambientstandardsforparticleslessthan 2.5 µmindiameter.Thenewstandardmayrequireretrofittingofpowerplantswithdevicesthat collectmoreefficientlysmallparticles,suchasafabricfilter.
FabricFilter. Afabricfilter,alsocalled baghouse, worksontheprincipleofadomesticvacuum cleaner.Particle-ladengasissuckedintoafabricbag,theparticlesarefilteredout,andtheclean gasisventedintotheatmosphere.Theporesizeofthefabriccanbechosentofilteroutanysizeof particles,evensubmicronparticles,albeitattheexpenseofpowerthatisrequiredtodrivetheflue gasthroughthepressuredroprepresentedbythefabricpores.
AtypicalfabricfilterschematicisshowninFigure5.9.Long,cylindricaltubes(bags)madeof theselectedfabricaresealedatoneendandopenattheotherend.Thesealedendofthetubesare hungup-sidedownfromarackthatcanbeshakenmechanically.Theparticle-ladenfluegasenters throughthebottom,openendofthetubes.Thecleanfluegasissuckedthroughthefabricofthe tubesbyfan-induceddraftorspecialpumpsandisventedthroughthesmokestack.Abaghousefor alargepowerplantmaycontainseveralthousandtubes,eachupto4metershigh,12.5to35cmin
8Dataonemissioncontrolefficiencyandcostareobtainedfrom“Airpollutioncontrolcostsforcoalfired powerstation,”InternationalEnergyAssociationCoalResearch,IEAPER/17,London,UK(1995).
diameter.Itisnecessarytodistributetheincomingfluegasequallytoalltubes,whichisdonein the plenum.Thetubesprovidealargesurfaceareaperunitofgasvolumetricflowrate.Theinverse iscalledtheair-to-clothorfilteringratio,whichisequaltothesuperficialgasvelocity;ittypically rangesbetween0.5and4cms 1
Thecollectedparticlescanberemovedbymechanicalshakingofthetubesorbythereverse jetmethod.Mechanicalshakingisinducedbyacam-drivenmovingrackonwhichthetubeshang. Inthereversejetmethod,astrongairflowisblownfromtheoutsideofthetubestowardtheinside, dislocatingtheparticlecakethathasbuiltup.Theremovalofparticlesisnotalwayscomplete, becauseparticlesclingtothefabricandarelodgedinthepores.Thiscausesfrequentbreakdowns andrequiresreplacementofthefabrictubesaboutonceayear.Ironically,themorecloggedthe tubes,thebettertheremovalefficiency,butattheexpenseofpumpingpowerthathastobesupplied inordertomaintainthesuperficialgasvelocity.Theremovedparticlesfallintothebottomhopper fromwhencetheyarecartedawaybytrucks.
Thefluegasattheentrancetothebaghousehasarelativelyhightemperatureof300–350 ◦C. Also,thefluegasmaycontaincorrosivegasesandmoisture.Theseconditionsrequireaheat andcorrosionresistantfabric.Usually,fiberglassischosenforcoal-firedpowerplants,whereas otherfabrics,naturalorsynthetic,areapplicableforotherfacilities,likecementkilns,ferrousand nonferroussmelters,andpaperandsawmills.
Fabricfilterswithahighcollectionefficiencyforsmallparticlesareexpectedtohaveahigher capitalandoperatingcostthanESPs.
Aslivingorganismscontainsulfurintheircellularmake-up,thissulfurismostlyretainedinthe fossilizedremnantsoftheseorganisms.Coalcancontainupto6%byweightofsulfur,andoilup to3%.However,mostcoalsandcrudeoilscontainamuchlowerpercentageofsulfur.Generally, bituminous,subbituminous,andlignitecoalsareusedinpowerplants.Theycontain0.7–3%by weightofsulfur.Residualoilusedinpowerplantscontains0.7–2%sulfur.Withoutsulfuremission controldevices,theoxidizedsulfur,mainlysulfurdioxideSO2,minorquantitiesofSO3,and sulfuricacidH2SO4,wouldbeemittedthroughthesmokestackintotheenvironment.Theoxides ofsulfurareprecursorstoaciddepositionandvisibilityimpairinghaze(seeSections9.2.3and 9.2.7).Becausecoal-firedpowerplantsemitthemajorityofallsulfuroxideemissionsworldwide (industrialboilers,nonferroussmelters,dieselandhomeheatingoilmakeuptherestofsulfur emissions),operatorsoftheseplantsarerequiredtolimittheemissionsbyeitherswitchingto low-sulfurcontainingfuelsorinstallationofsulfuremissioncontroldevices.
Therearebasicallythreeapproachestoreducingsulfuremissions:before,during,andafter combustionofthefossilfuel.
CoalWashing. Whencoalisremovedfromthecoalseamsinundergroundorsurfacemines,there isalwayssomemineralmatterincludedinthecoal.Themajorityofmineralmatteriscomposed ofsilicates,oxides,andcarbonatesofcommoncrustalelements,suchascalcium,magnesium, aluminum,andiron,butsomeofitcontainspyrites,whicharesulfidesofiron,nickel,copper, zinc,lead,andothermetals.Becausethespecificgravityofmineralmatter,includingthepyrites, isgreaterthanthatofthecarbonaceouscoal,apartofthemineralmattercanberemovedby “washing”thecoal.Coalwashingnotonlyreducesthesulfurcontentofcoal,butalsoreducesits ashcontent,therebyincreasingitsheatingvalue(Btu/lborJ/kg)andputtingalesserloadonthe particle-removingsystems.
Coalwashingisusuallyperformedattheminemouth.Typically,thecrushedrawcoalisfloated inastreamofwater.Thelightercoalparticlesfloatontop,andtheheaviermineralssinktothe bottom.Thewetcoalparticlesaretransferredtoadewateringdevice,generallyavacuumfilter, centrifuge,oracyclone.Thecoalcanbefurtherdriedinahotairstream.
Oneproblemwithcoalwashingisthatthestreamcontainingmineralmattermaycontain dissolvedtoxicmetalsanditcanbeacidic.StrictregulationshavebeenintroducedintheUnited Statesandelsewheretopreventdumpingofthesetoxicacidicstreamsintotheenvironmentwithout priortreatment.
IntheUnitedStates,about50%ofallcoalsdeliveredtopowerplantsarewashed.Theseare mainlycoalsfromeasternandmidwesternshaftandstripmines.Westerncoalsgenerallyhave alowmineralandsulfurcontent,sowashingisnotnecessary.Coalwashingcanremoveupto 50%ofthepyriticsulfur,whichisequivalentto10–25%removalofthetotalsulfurcontentofthe coal.
CoalGasification. Coalcanbeconvertedbyachemicalprocessintoagas,calledsynthesisgas, orsyngasforshort.Intheprocessofcoalgasification,mostofthesulfurcanbeeliminatedbefore
thefinalstageofgasification.Theclean,desulfurizedsyngascanbeusedtofuelagasturbineor combinedcyclepowerplant.TheprocessofcoalgasificationwillbedescribedinSection5.3.2.
OilDesulfurization. Refineriescanreducethesulfurcontentofcrudeoilalmosttoanydesired degree.Thisisusuallydoneinacatalyticreduction–oxidationprocesscalledtheClausprocess. First,sulfurcompoundsintheoilarereducedtohydrogensulfidebyblowinggaseoushydrogen throughthecrudeoilinpresenceofacatalyst:
whereRisanorganicradical.Next,H2SisoxidizedtoSO2 byatmosphericoxygen,andsimultaneouslySO2 isreducedbyH2Stoelementalsulfur,alsoinpresenceofacatalyst:
Theelementalsulfurisanimportantbyproductofoilrefiningandcanbeoftenseenasayellow moundwithintherefinerycomplex.Itisamajorrawmaterialforsulfuricacidproduction.
Eventhoughthesulfurincrudeoilisasalablebyproductofoilrefining,refinerieschargemore forlowsulfuroilproducts.Thus,utilitiespayapremiumpriceforlowsulfuroil,andwepayhigher ratesforelectricitygeneratedbytheoilburningpowerplant.However,itisusuallycheaperfora utilitytobuylowsulfuroilthantoremoveSO2 fromthestackgas.
FluidizedBedCombustion. Fluidizedbedcombustion(FBC)istheburningofcoal(oranyother solidfuel)imbeddedinagranularmaterial,usuallylimestone,ridingonastreamofair.Theprimary aimofthedevelopmentofFBCwasnotspecificallytoreduceSO2 emissions,butrathertoenable thecombustionofallsortsoffuel,includingnonpulverizablecoal,municipalsolidwaste,industrial andmedicalwaste,wood,tar,andasphaltene(residueofoilrefining).Theadmixedlimestoneacts asasorbent,extractingsulfurandotherimpuritiesfromthefuel.
AschematicofaFBCwithsimultaneouscoalandsorbentinjectionisshowninFigure5.10. TheFBCisacylindricalretortwithagrateinthebottom.Crushedcoal,6–20mminsize,together withlimestone(CaCO3),isblownpneumaticallyoverthegrate.Combustionairisblownfrom beneaththegrate.Afterignition,theburningcoal–limestonemixturefloatsoverthegrate,riding onanaircushion.Theburningmixtureactsdynamicallylikeafluid,hencethenamefluidizedbed combustion.Boilertubesareimmersedintothefluidizedbedwherethereisdirectheattransfer fromthebedtothetubes.Anotherbankofboilertubesismountedabovethebed,towhichtheheat transferoccursbyconvectionandradiationfromthefluegases.
Thesulfuriscapturedbythesorbenttoformamixtureofcalciumsulfite(CaSO3)andcalcium sulfate(CaSO4)particles.Theseparticles,togetherwithunreactedCaCO3 andunburntcoalparticles,arecarriedwiththefluegasintoacyclone.Thelargerparticlesareseparatedinthecyclone andarerecycledintothefluidizedbedforreburning.Smallerparticlesexitthecycloneandare removedinanelectrostaticprecipitatororbaghouse.
ThecaptureefficiencyofSO2 inFBCisdependentontheintimatemixingofcoalandlimestone andisalsodependentontheirquality.CalcinedlimestonecontainingCaOisfoundtobeabetter sorbentthanrawlimestone.Ontheaverage,FBCwithlimestoneinjectioncapturesonlyabout 40–60%ofthesulfurincoal.
TheadvantagesofFBCareasfollows:
• Low-qualitycoalandotherfuelscanbeused.
• Ithasathermalefficiencycomparabletothatofpulverizedcoalcombustionwithemission controls.
• Sorbentischeap(limestone).
• Combustiontemperatureislower(800–900 ◦C)thanthatinpulverizedcoalcombustion (1900–2000 ◦C),whichreducesthermalNOx formation.
ThedisadvantagesofFBCareasfollows:
• Sulfurcaptureefficiencyisonlyabout40–60%,anditmaynotmeetemissionstandardsfor SO2.
• Ithasaconstantcapacityandcannotfollowload.
• Ithasstart-updifficulties.
• Itcausescorrosionandfoulingofboilertubes.
• Becauseofthestringentrequirementforpropermixingoffuel,limestone,andair,itcannot bescaledtolargepowerplantloads;itissuitableonlyfor10-to100-MW-capacityboilers.
Insummary,FBCisbestsuitedforcombustionoflow-qualityfuels,suchasnonpulverizable coal,crudeoilresidues,wood,andmunicipalandindustrialwaste.Itssulfuremissionreduc-
tioncapacityislimited.ItisdifficulttoscaleFBCtothelargeloadrequirementsofcentralized powerplants.
Theremovalofsulfuroxidesfromthefluegasaftercombustionofthefuelinafurnaceorboiler iscalledfluegasdesulfurization(FGD).ThereareseveralmethodsofFGD:sorbentinjectionand wetanddryscrubbers.
SorbentInjection. Insorbentinjection(SI),asorbent,usuallydrysinteredCaCO3 orCaO,ora slurrythereof,isinjectedintothefluegasintheupperreachesoftheboiler,pasttheneck.The sorptionofSO2 proceedssimilarlyasinFBCbyformingamixtureofcalciumsulfiteandsulfate. Thecaptureefficiencyisdependentonmanyfactors:thetemperature,oxygenandmoisturecontent ofthefluegas,timeofcontactbetweensorbentandSO2,andthecharacteristicsofthesorbent(e.g., sinteredsorbent,porosity,admixtureofothersorbingagents).Theresultingparticles,consisting ofhydratedcalciumsulfiteandsulfateandunreactedsorbent,inadditiontotheflyash,needtobe capturedinanelectrostaticprecipitatororbaghouse.
Sorbentinjectioncanberetrofittedtoexistingcoal-firedpowerplants,albeittheparticle removalsystemmayhavetobeupgradedtocollecttheconsiderablelargerloadofparticles.The sulfurcaptureefficiencyisontheaverage50%,whichmaybeadequateformeetingemission reductionquotasfor existing powerplants,butnotenoughforemissionstandardsof new power plants.
WetScrubber. Inawetscrubberthefluegasistreatedwithanaqueousslurryofthesorbent,usually limestone(CaCO3)orcalcinedlime(CaO),inaseparatetower.Aschematicofawetscrubberis showninFigure5.11.Afterexitingtheelectrostaticprecipitator,thefluegasentersanabsorption towerwhereitissprayedthroughanarrayofnozzleswithaslurryofthesorbent.Thefollowing sequenceofreactionstakesplacebetweenSO2 andthesorbentslurry:
Thewatermoleculesthatareattachedtocalciumsulfiteandsulfatearecalledwaterofcrystallization.Hydratedcalciumsulfateissimilartonaturalgypsum.
Theformedmixtureofhydratedcalciumsulfiteandsulfate,togetherwithsomeunreacted limestone,fallstothebottomofthewetscrubberintheformofawetsludge,fromwhereit istransferredintoafunnel-shapedthickener.Thetopliquorofthethickenerisdecantedintoan overflowtank,fromwhereitisrecycledtomakeupafreshslurryoflimestone.Thesettledthick sludgeispumpedintoavacuumfilteringsystemwhereitisdewateredasmuchaspossible.Both hydratedCaSO3 andCaSO4 aredifficulttodewater;theyformagelatinoussludge.Thissludge maybethickenedfurtherwithflyashcomingfromtheESP,thendisposedintoalandfill.
Abovethespraynozzles,amisteliminatorcondenseswater.Thecleanfluegasentersareheater (toaddbuoyancy),andthenitexitsthroughthesmokestack.
Whileperfectedoverthepastdecades,thewetscrubberstillposesmanyoperationalproblems. Thespraynozzlestendtoclog;sludgeoftenclingstothebottomandsideoftheabsorptiontower,
fromwhereithastoberemovedmechanically;theslurryoflimeandlimestoneishighlycorrosive; thedewateringsystemispronetobreakdowns;thedewateredsludgeisdifficulttotransporttothe disposalsite.Frequentoutagesmaystillbeexperienced,andbecausepowerplantscannotafford toinstalldualsystems,duringscrubberoutagestheSO2 containingfluegasissimplybypassed directlyintothesmokestack.
ThesorptionofSO2 bylimestoneisfarmorecompleteintheaqueousslurryofthewetscrubber thaninfluidizedbedcombustionorsorbentinjection.Awell-designedwetscrubbercanremoveas muchas90–99%ofthesulfurinthefluegas.Itspowerrequirements(pumps,filters,reheater,etc.) maysyphonoff2–3%ofthepowerplant’selectricaloutput,therebyreducingtheoverallthermal efficiencybythesameamount.Itsamortizedcapitalandoperatingcostmayadd10–15%tothe electricitygeneratingcost.
DryScrubber. Thechemicalreactionmechanisminthedryscrubberissimilartothatinthewet scrubber;thatis,CaCO3,CaO,orbothareusedtoabsorbSO2 fromthefluegas,formingamixture ofcalciumsulfiteandsulfate.Thedifferenceisthatinthedryscrubberthesorbentisintroducedas averyfinesprayofanaqueousslurry.Thehotfluegasisblowncountercurrentagainsttheslurry spray.Theproportionsofslurryandfluegasarecarefullymetered,sothattheslurrycompletely evaporateswithinthescrubber.Insuchafashion,adrypowderofcalciumsulfite,sulfate,and unreactedsorbentiscreated.Here,theparticleremovalsystem,usuallyafabricfilter,isinstalled
downstream ofthescrubber,incontrasttothewetscrubber,wheretheparticleremovalsystem, usuallyanESP,is upstream ofthescrubber.Thus,thedryscrubberdoesnotcreateagelatinous sludgethatisdifficulttotransportanddisposeof,butitdoesimposealargerloadontheparticle removalsystem.
ThedryscrubberSO2 removalefficiencyisnotashighasthatofthewetscrubber,amounting to70–90%.Itscapitalandoperatingcostsaresomewhatlowerthanthoseofawetscrubber.
IntheUnitedStates,allnewcoal-firedpowerplantsmustinstallascrubber,eitherawetora dryscrubber,dependingonthesulfurcontentofthecoal.Atpresent,intheUnitedStatesabout 25%ofcoal-firedpowerplantshaveinstalledascrubber.InGermanyandJapanpracticallyall coal-firedpowerplantshaveinstalledascrubber.
Theothermajorcategoryofpollutantsthatemanatesfromfossilfuelcombustionisnitrogenoxides, calledNOx,whichincludesnitricoxideNO,nitrogendioxideNO2 (anditsdimerN2O4),nitrogen trioxideNO3,pentoxideN2O5,andnitrousoxideN2O.OtherthanNOandNO2,theotheroxides areemittedinminusculequantities,sothatNOx usuallyimpliesthesumofNOandNO2 NOx isaperniciouspollutantbecauseitisarespiratorytractirritantanditisaprecursorto photo-oxidants,includingozone,andaciddeposition(seeSection9.2.6).Atthistime,theU.S.EPA planstointroduceastricterambientstandardforozone,whichnecessarilyimpliesamorestringentcontrolofNOx emissionsfrombothstationaryandmobilesources,includingelectricpower plants.
Coalandoilcontainorganicnitrogenintheirmolecularstructure.Whenburnt,thesefuels producetheso-called fuel NOx.Inaddition,allfossilfuelsproduce thermal NOx.Thisresultsfrom therecombinationofatmosphericnitrogenandoxygenunderconditionsofthehightemperatures prevailingintheflameoffossilfuelcombustion:
Therecombinationinvolvesintermediateradicals,suchasatomicoxygenandnitrogen,andorganic radicals,whichareformedatthehightemperatures.Asthecombustiongasescool,theformedNO doesnotreverttoN2 andO2,asitwouldifthermodynamicequilibriumprevailedatthegasstack temperatures.Asthefluegastraversesthestack,apartoftheNOoxidizesintoNO2 andother nitrogenoxides.
CoalandoilcombustionproducebothfuelandthermalNOx,whereasnaturalgasproduces onlythermalNOx.Asaruleofthumb,coalandoilproduceaboutequalamountsoffuelandthermal NOx.Thefluegasofuncontrolledcoalandoilcombustioncontainsthousandsofpartspermillion byvolumeofNOx,whereasthatofnaturalgascontainshalfasmuch.
Becauseorganicnitrogencannotberemovedpriortocombustionofthefuel,NOx emission controlcanonlybeachievedduringandaftercombustion.
Low-NOx Burner. Alow-NOx burner(LNB)employsaprocesscalled stagedcombustion.The factthatNOx formationisafunctionofair-to-fuelratio(byweight)intheflameisexploitedin LNB.Thisratioaffectstheflametemperatureandtheavailabilityoffreeradicalsthatparticipate intheNOx formationprocess.AplotofNOx concentrationintheflameversusair-to-fuelratio
ispresentedinFigure5.12.Itisseenthatunderstoichiometricconditions(air/fuelratio ≈ 15)— thatis,whenexactlyasmuchairoxygenispresentasnecessaryforcompletecombustionofthe fuel—maximumNOx isformed.LessNOx isformedbothunderfuel-richandfuel-leancombustionconditions.(Fuel-richconditionsaretotheleftinFigure5.12;fuel-leanconditionsareto theright.)
AschematicofaLNBispresentedinFigure5.13.Fuel(e.g.,pulverizedcoal)andairis injectedthroughthecentralannulusoftheburner.Theair/fuelratioislessthanstoichiometric,that is,fuel-rich.Thisproducesaluminousflame,withsomeofthepulverizedcoalleftunburnt,but alsowithlowNOx formation,accordingtotheleft-handsideofFigure5.12.Secondaryandtertiary airarrivesthroughouterannuli,creatinganouterflameenvelopethatisfuel-lean.Here,allthe
unburntcarbonburnsupandlessNOx isformed,accordingtotheright-handsideofFigure5.12. Thenetresultiscompleteburn-outofthefuelandlessNOx formation,circumventingthepeak NOx formationofFigure5.12.
TheretrofittingofboilerswithLNBisrelativelyeasyandinexpensivetoaccomplish.The incrementalcostofelectricityproductionusingLNBisonly2–3%.Infact,mostfossil-fueled powerplantsandindustrialboilershaveinstalledLNBs.TheproblemisthatLNBcanreduceNOx formationonlyby30–55%comparedtoregularburners.Becauseoftheprevailingproblemsofacid depositionandhighozoneconcentrationsinurban-industrialregionsofcontinents,thepressureis mountingonoperatorsoffossil-fueledpowerplantsandindustrialboilerstofurtherreduceNOx emissionsbymoreeffectivemeansthanLNB.
SelectiveCatalyticReduction. Inaselectivecatalyticreduction(SCR)processeitherammoniaor ureaisinjectedintoacatalyticreactorthroughwhichthefluegasflows.Thefollowingreaction takesplacewhenammoniaisinjected:
Thus,NOisreducedbyammoniaandammoniaisoxidizedbyNOandO2 toformelemental nitrogen.Thecatalystisamixtureoftitaniumandvanadiumoxidesdispersedonahoneycomb structure.TheSCRreactorisplacedbetweentheeconomizerandairpreheatersectionsoftheboiler, wherethefluegastemperatureis300–400 ◦C.Thereactionis80–90%complete;thus,10–20% oftheNOx escapesthroughthesmokestack,and10–20%oftheunreactedammoniaalsoescapes. Thisiscalled ammoniaslip.Whileammoniaisatoxicgas,bythetimethefluegasplumedisperses totheground,itsconcentrationisnotconsideredharmful.
Thecatalystiseasily“poisoned,”especiallyifthefluegascontainsflyashandsulfuroxides. (NotethatthecatalyticreactorisupstreamfromtheESPandscrubbers.)Therefore,thecatalyst requiresfrequentreplacement,whichisoneofthemajorcostelementsinoperatingaSCR.For SCRamajorreconstructionisnecessary,becausethecatalyticreactormustbeinsertedbetweenthe economizerandairpreheatersectionsoftheboiler.Theincrementalcostofelectricityproduction inacoal-firedpowerplantusingSCRisabout5–10%.
SelectiveNoncatalyticReduction. AreductionofNOcanbeaccomplishedatahighertemperature withoutacatalystbyusingaprocessofselectivenoncatalyticreduction(SNCR).Inthisprocess, ureaisusedinsteadofammonia.Anaqueoussolutionofureaisinjectedintothesuperheater sectionoftheboiler,wherethetemperatureisabout900–1000 ◦C,whichissufficientlyhighfor thereactiontoproceedtonearcompletion:
Manyoperatorsofelectricpowerplantspreferthisoptionbecauseitneedsnocatalyst.However, ureaismoreexpensivethanammonia.Thisoptionisalsomoreamenabletoretrofittingofexisting plantsbecausetheureainjectorcanbemounteddirectlyontothewalloftheboiler.
SNCRcanbeusedinconjunctionwithlow-NOx burners.ThefinalreductionofNOx isinthe 75–90%range,andtheincrementalcostofelectricityproductionis3–4.5%.
Coaland(toalesserextent)oilcontainmineralmatterthatduringthecombustionprocessmay producetoxicvaporsandparticles.Particleslargerthan1–2micronsindiameterarealmostall capturedbytheparticleremovalsystem,eitherbyanelectrostaticprecipitatororafabricfilter. Smallerparticlesandvaporsmayescapethroughthesmokestackandpollutetheenvironment. Mercury,selenium,cadmium,andarsenicaresemivolatiletoxicmetalsthatinpartmayescape throughthesmokestackasvapors.Inparticular,mercuryemissionsarecausingconcernbecause excessivemercuryconcentrationshavebeenfoundinsomelakesandcoastalwaters.Fishandother aquaticorganismsmaybioaccumulatemercuryandpassitonthroughthefoodchaintohumans. Currently,intheUnitedStates,Europe,andJapan,studiesarebeingconductedontheextentof themercuryproblemandonthetechnologiesthatcouldbeemployedinordertoreducemercury emissionsfrompowerplants.9
Anotherproblemassociatedwithcoal-firedpowerplantsisradonemissions.Radonisadisintegrationproductofuranium,themineralsofwhichmayclingtothecoal.Radonisaradioactive gasthatemitsalphaparticles.Apartoftheomnipresentradonintheatmospheremaybetracedto coal-firedpowerplants.
Coal-firedpowerplantsproduceasignificantamountofsolidwaste.Oil-firedplantsproducemuch lesswaste,andgas-firedplantsproducepracticallynone.Wecalculatedbeforethata1000-MW plantfiredwithcoalthatcontains10%byweightmineralmatterproducesabout3.2E(5)ty 1 offlyash.Ifthecoalcontains2%byweightofsulfur,andifthatsulfurisremovedbyfluegas desulfurizationusingawetlimestonescrubber,another3-4E(5)ty 1 ofwetsludgeiscreated containinghydratedcalciumsulfite,calciumsulfate,andunreactedlimestone.Whilesomeplants succeedinselling,oratleastgivingaway,theflyashforpossibleuseasaggregateinconcreteand asphaltorasroadfillmaterial,thescrubbersludgehaspracticallynouse.10 Forsomecoalsthe flyashandthescrubbersludgemaycontaintoxicorganicandinorganiccompounds.Inthatcase, thewasteneedstobedisposedofinasecurelandfill.Thelandfillmustbelinedwithimpenetrable material,sothatleachingintothesoilandgroundwateristobeprevented.Typicallinermaterials arenaturalclaysorsyntheticfabrics.Becausetransportcostscanbesubstantial,thelandfillarea shouldbeinthevicinityofthepowerplant.Themixedflyashandsludgefroma1000-MW coal-firedpowerplantwouldfillabout10–20acres(4–8hectares)about1foot(0.305m)deep everyyear.Thus,anewcoal-firedpowerplantmustbesituatedwhereasuitablelandfillarea isavailable.
Wehaveseenthatthebestfossil-fueledsteampowerplantscanachieveathermalefficiencyofclose to40%,buttheaverageintheUnitedStatesis36%,andtheworldwideaverageis33%.Power plantsthatworkonthegasturbineprincipleachieveevenless,ontheorderof25–30%thermal efficiency.Thismeansthat60–75%ofthefossilfuelheatingvaluethatpowersthemgoestowaste. Furthermore,theemissionsperkilowatthourofelectricityproducedisinverselyproportionalto thermalefficiency:Thelowertheefficiency,themoretheplantpollutesandthehighertheCO2 emissions.Thus,greateffortsandmoneyarespentbyprivateandgovernmentagenciestoimprove powerplantthermalefficienciesbydevelopingadvancedcyclepowerplants.IntheUnitedStates, researchanddevelopmentissponsoredbytheElectricPowerResearchInstituteandtheU.S. DepartmentofEnergy.
WedescribedthethermodynamicprinciplesofacombinedcycleinSection3.10.5.Apowerplant schematicusingagasturbinecombinedcycle(GTCC)isshowninFigure5.14.Inthefirstcycle, calledthe topping cycle,asuitablefluidfuel,usuallynaturalgas,powersagasturbine.Thestill hotexhaustgasofthegasturbinepassesthroughaheatexchanger,calledaheatrecoveryboiler (HRB),andthentothestack.IntheHRB,feedwaterisboiledintosteamthatpowersasteam turbine,calleda bottoming cycle.Sometimes,morefuel(heat)isaddedtothegasturbineexhaust gasinacombustionchamberbeforethehotgasesentertheHRB.Thecombinationofthetwo cyclescanachieveathermalefficiencyof45%,animprovementovereitherasingle-cyclesteam turbineoragasturbinepowerplant.
Aproblemwiththecombinedcycleisthattheprimaryfuel,naturalgas,ismoreexpensive perunitheatingvaluethancoal.Also,gasreserveswillnotlastaslongascoalreserves(see Chapter2).Combinedcyclepowerplantsaresuitablewheregassuppliesareplentifulandcheap andwhereenvironmentalregulationsimposeaheavytechnicalandfinancialburdenoncoal-fired powerplants.Theyareespeciallyattractiveinurbanenvironmentsbecausetheyrequirepractically nofuelstoragefacilities(compressedgasarrivesinpipestothepowerplant),noparticleremoval system,andnoscrubberforSO2 removal.Thereisalsonosolidwastetodisposeof.However,
combinedcyclepowerplantsmayrequireaNOx controlsystembecauseinthegasturbinecopious quantitiesofthermalNOx maybecreated.Ofcourse,acondenserandcoolingtowerarealso requiredforthesteamportionofthecombinedcycle.
Acombinedcyclepowerplantcanbefueledbycoal,butthenthecoalneedsfirsttobegasified.The gasifiedcoal(syngas)propelsthetoppingcyclegasturbine.Apowerplantusingcoalgasification andcombinedcycleiscalledanintegratedgasificationcombinedcycleplant(IGCC).
Variouscoalgasificationmethodsweredevelopedalreadyinthenineteenthcenturyforprovidingpipedgasforhomeheating,cooking,andlighting.Thiswascalled citygas andwasused beforenaturalgasbecamewidelyavailableinthesecondhalfofthetwentiethcentury.Intheworld wars,Germanyusedgasifiedcoalasafuelforautomobiles,trucks,andmilitaryvehicles.
Coalcanbegasifiedtolow-,medium-andhigh-heatingvaluesyngas.Theprocessesdiffer dependinguponwhetherairorpureoxygenisusedforgasificationandwhethertheproductgasis richordevoidofCO2.ForanIGCCplant,high-heatingvaluesyngasispreferred.
Theprocessstartswithcrushingthecoal.Ifthecoalhasatendencyforcaking,preoxidation mybenecessarytorenderitssurfacemoreporous.Thecrushedcoalisfedtoaretort,where,in thepresenceofcatalysts,itisexposedtopureoxygenandsteam:
Pureoxygen(99%+)issuppliedfromaspecial airseparationunit constructedattheplantsite. Theresultinggaseousmixturecontainsahostofhigher-molecular-weightorganiccompounds,as wellashydrogensulfide.Thenextstepiscalled quenching, inwhichtheheavyoilsandtarare removedfromthemixturebycondensationandaqueoussolutionscrubbing.Thisisfollowedby removalofH2Sbytheabove-describedClausorsimilarprocess.
Thesyngasresultingfromreaction(5.10)hasarelativelylowheatingvalueof250–500Btu perstandardcubicfoot(sfc),whichequals9.1–18.2MJm 3.Thisgaswouldnotbesuitableasa fuelforanIGCC.Toincreasetheheatingvalue,thecarbonmonoxideandhydrogenispassedover acatalystatabout400 ◦Ctoformprincipallymethane,aprocesscalled methanation:
Theresultingsyngashasaheatingvalueof950–1000Btu/scf(36–38MJm 3),similartomethane. Forthissyngas,aconventionalgasturbinecanbeused.Analternativeistheproductionofhydrogen inthe watergasshiftreaction:
TheresultinghydrogencanbeseparatedfromCO2 bymembraneseparationandusedinhighefficiencyH2/O2 fuelcells(seeSection3.12).
Theestimatedthermalefficiencyofacoalgasificationcombinedcycleplantisontheorder of40–45%,includingtheenergyrequiredforairseparationandcoalgasification.Thisefficiency exceedsthatofapulverizedcoal-firedsteamplantwithemissioncontrols,havinganefficiencyof 36–38%.However,thecapitalandoperatingcostsofsuchaplantwouldbeconsiderablyhigher
thanthatofapulverizedcoal-firedsteamplant.Atpresent,thesecostsarenotoffsetbythehigher thermalefficiency.
IntheUnitedStates,theElectricPowerResearchInstitutetogetherwithaconsortiumof privateutilitiesbuiltademonstrationIGCCpowerplantincludinganairseparationunitinBarstow, California,calledtheCoolwaterPlant.Ithadanetelectricpoweroutputof105MW,butbecause notallcomponentswereoptimizedandintegrated,itsthermalefficiencywasonly31%.The airemissionsmetthestringentrequirementsoftheCaliforniaAirResourcesBoard.Itoperated satisfactorilyfor5years(1984–1989),butwasmoth-balledthereafterbecauseofthehighoperating costs.However,theCoolwaterPlantdemonstratedthatIGCCisfeasibleandcanbecompliantwith strictemissionstandards.
Cogenerationisthetermappliedtosystemsthatprovidebothelectricalpowerandusefulheat fromtheburningoffuel.Inindustrialorcommercialinstallationstheheatmaybeusedforspace heatingormaterialprocessing.Theincentiveforcogenerationisprimarilyfinancialinthatthecost ofsupplyingelectricityandheatviaacogenerationschememightbelessthansupplyingthem separately,suchaspurchasingelectricpowerfromasupplierwhilegeneratingheatfromaninplantfurnaceorboiler.Whetherornotacogenerationsystemreducestheamountoffuelneededto supplytheelectricityandheatdependsuponthedetailsofthecogenerationsystem.Also,emission controlsmaybemoreefficientandcheaperonalarge-scaleelectricpowerplantthanonasmallerscalecogenerationplant—unlessthelatterisfueledbynaturalgas,whichinherentlyproducesless pollutantemissions.In2000,about12%ofU.S.electricgenerationcapacitywasincogeneration facilities.
Whenaheatenginedrivesanelectricgeneratortoproduceelectricity,italsoprovidesastream ofhotexhaustgas.Wheretheexhaustgasiswarmenoughtobeusedforprocessorspaceheat, someoftheexhaustgasenthalpymaybeextractedtosatisfytheheatrequirementinacogeneration plant.If Q fuel istherateoffuelheatconsumptionneededtogenerateelectricpower Pel andprocess heat Q proc inacogenerationplant,then
where Qex istheenthalpyfluxoftheexhaustgas, ηth isthethermalefficiencyoftheelectrical generationprocess,and ηxch ≤ 1isthefractionoftheexhauststreamenthalpythatisdelivered asheatforprocessing.Thesplitoffuelheat Qfuel betweenelectricpower, ηth Qfuel,andprocess heat, ηxch(1 ηth)Qfuel,dependsuponthethermalefficiency ηth oftheheatengineandtheheat exchangereffectiveness ηxch.Thelatterdependsprincipallyonthetemperatureatwhichprocess heatisdeliveredcomparedwiththetemperatureoftheexhaustgas—beinggreatestwhenthe differenceislarge,andleastwhenitissmall.Whenprocessheatisneededathightemperatures, theusableprocessheatfromacogenerationsystemmaybetoosmallcomparedtotheelectric powergeneratedtojustifythiscomplexsystem,anditmaybemoreeconomicalandfuelefficient
tobuyelectricityfromanefficientcentralpowerplantandgenerateprocessheatinanefficient in-plantboilerorfurnace.
Cogenerationismostusefulwhenprocessorspaceheatisrequiredatalowtemperature.Then Qex,insteadofbeingdumpedinacondenserandcoolingtower,isheatexchangedwiththedevice thatneedstherelativelylowtemperatureheat,sayfordryingorspaceheating.Whenacentral powerstation(orincinerator)islocatedinadenselypopulatedorcommercialdowntownarea, Qex maybepipeddirectlyintothebuildingsforspaceandwaterheating.Thisiscalled districtheating.
ThefunctioningofafuelcellwasdescribedinSection3.12.Afuelcellisnotaheatengine.In afuelcell,someofthechemicalenergyofthefuelisdirectlyconvertedintoelectricalenergy, withtherestappearingasheatrejectedtotheenvironment.Itstheoreticalthermalefficiencyin termsofelectricalenergygeneratedversusfuelchemicalenergyinputcanbecloseto100%when producingalowoutputofpower.However,becauseofparasiticheatlosses(e.g.,ohmicresistance) andbecauseofthepowerrequirementsofauxiliaryequipment(e.g.,pumps,fans),currentfuelcells usingnaturalgasorhydrogenandair(insteadofoxygen)haveamuchlesserthermalefficiency whenoperatingatmaximumpower,inthe45–50%range.Furthermore,ifhydrogenisusedas afuel,ithastobegeneratedseparatelyinsomefashion,whichrequiresenergy.Forexample, hydrogencanbegeneratedfromwaterbyelectrolysis.But,thesplittingofwaterintohydrogenand oxygenrequiresabout18MJofelectricenergyperkilogramofwater,morethanisgeneratedin thefuelcellbytheelectrolytichydrogen.Fuelcellhydrogenisusuallygeneratedbythereforming ofmethane(seeSection3.14.1).
Fossil-fueledpowerplantsconsume55.5%oftheworld’sfossilenergy.Worldwideabouttwothirdsoftheelectricalenergyisgeneratedbyfossilenergy,80%ofwhichiscoal.Almostall fossil-fueledpowerplantsworkontheprincipleofheatengineswhere25–40%ofthefossilenergy inputisconvertedintoelectricalenergy,therestiswastedintheformofheatrejectiontoacold reservoirandparasiticheatlosses.Furthermore,fossil-fueledpowerplants,especiallycoal-fired ones,produceahostofpollutants,includingparticulatematter,sulfurandnitrogenoxides,and toxicorganicandinorganicbyproductsofcombustion.Theemissionsofthesepollutantsmustbe controlledinordertosafeguardpublichealthandtheenvironment.Emissioncontroldevicessubtractfromthethermalefficiencyofpowerplantsandaddtotheelectricitygeneratingcost.Power plantsalsoproducelargeamountsofsolidandliquidwaste,consumesignificantamountsoffresh water,andlast,butnotleast,emitlargequantitiesofCO2,agreenhousegasthatcontributesto globalwarming.
However,lifeinanurban-industrialsocietycannotbeimaginedwithoutelectricity.Weonlycan strivetowardincreasingthethermalefficiencyofpowerplants,improvingtheiremissioncontrol technologies,andgraduallyreplacingthemwithfuelcellsandsolar,wind,andotherrenewable energypowerplants.Eventually,withthedepletionoffossilfuelsandtheloomingcrisisofglobal warming,nuclear-fueledpowerplantsalsomayhavetobeutilizedingreaterproportionthanis currentlythecase.
Problem5.1
Acoal-firedpowerplant(PP)hasaratedpowerof1000MW(el).Itworksat100%capacity(baseloaded)atathermalefficiencyof35%.Itburnscoalhavingaheatingvalueof30MJ/kganda sulfurcontentof2%byweight,anitrogencontentof1%byweight,andamineral(ash)content of10%byweight.
(a)Howmuchelectricitydoesthepowerplantproduceperyear(kWh/y)?
(b)HowmuchcoaldoesthePPconsumeperyear(metrictonsperyear,ton/y)?
(c)HowmuchSO2 doesthePPemitperyear(ton/y)?(NotethatSO2 hasdoublethemolecular weightofS.)
(d)HowmuchNO2 doesthePPemitperyear(ton/y),assuming“thermal”NO2 formation doublestherateof“fuel”NO2 emissions?(NotethatNO2 has3.28timesthemolecular weightofN.)
(e)HowmuchflyashdoesthePPemitperyear(ton/y)?Assumeallmineralcontentisemitted asflyash.
Tabulatetheresultsof(a),(b),(c),(d),and(e).
Usingthesulfurandnitrogencontentofcoalasinthepreviousproblem,calculatetheemissionrate ofSO2 andNO2 perunitheatinput(lbSO2/MBtuandlbNO2/MBtu),assumingagainthattotal NO2 emissionsaretwicethefuelNO2 emissions.Comparethesevaluestothe1970U.S.emission standardsforcoal-firedlargeboilers:1.2lbSO2/MBtuand0.7lbNO2/MBtu.
Problem5.3
A1000-MW(el)powerplant,of35%thermalefficiencyand90%averagecapacityfactor,uses coalwithaheatingvalueof30MJ/kg.ThecombustiblepartofcoalhasthechemicalformulaCH. Thecoalisburnedwith20%excessair.CalculatethevolumetricflowrateofthefluegasQin m3 s 1 atSTP.
Problem5.4
Howmuchair(m3/sat1atm)needstobepumpedthroughtheboileroftheplantinProblem5.3 inordertoburnthecoal(chemicalformulaCH)with20%excessair?
Problem5.5
ThecoalinthepowerplantofProblem5.3alsocontains10%byweightmineralmatterthat isconvertedintheboilertoflyash.Calculatethemassconcentrationoftheflyashintheflue gas(g/m3).
Problem5.6
Thecollectionefficiency η ofparticlesinanelectrostaticprecipitatorisgivenbytheDeutsch equation
η = 1 exp( Aw/Q) where A istheareaofcollectionplates, w isthedriftvelocity(= 0.05 dp m/s,where dp isthe particlediameterin µm),and Q isthevolumetricflowrate.(a)Calculatethecollectionefficiency for dp = 0 1,0.3,1,and3 µm,using A = 75,500m2 and Q fromProblem5.3.Tabulateandplot theseresults.(b)Calculatetheplateareanecessaryfor99%removalefficiencyof1-µm-diameter particles.
Problem5.7
TheplantwiththeparametersgiveninProblem5.1hasanelectrostaticprecipitatorwiththeremoval efficienciesandweightdistributioninthegivensizeranges(showninTableP5.7).Determinethe rateoffly-ashemission(g/s).
TABLEP5.7
Particlesize, µm0–55–1010–2020–40 ≥40 Removalefficiency,%7092.59699100
Weight,%1417212325
Problem5.8
Acoalhasaheatingvalueof12,000Btu/lbandthefollowingmolecularcomposition: C100H100S1N0 5.Itisburntinair,withoutexcessoxygen.
(a)CalculatetheemissionrateofSO2 andNO2 inlb/MBtu.Oncemoreassumethatthetotal emissionrateofNO2 istwicetheemissionrateoffuelNO2.Comparethiswiththe1970 U.S.emissionstandardsforlargecoal-firedboilers.
(b)Calculatethemolefractionandvolumefraction(ppmV)ofSO2 andNO2 inthefluegas.
Problem5.9
ThefluegasoftheplantinProblem5.8istobetreatedwithfluegasdesulfurization(FGD)usinga limestone(CaCO3)wetscrubbertoremovetheSO2.Assumethat2molesofCaCO3 arenecessary foreverymoleofSO2.Howmuchlimestoneisconsumedpertonofcoal?
Problem5.10
ThefluegasoftheplantinProblem5.8istobetreatedwithfluegasdenitrification(FGN)using urea(CO(NH2)2)injectiondirectlyintotheboiler.AssumethatamolarratioNO2:CO(NH2)2 = 1:1 isnecessary.Howmuchureaisconsumedpertonofcoal?
A1000-MWelpulverizedcoalsteamplantoperatingat35%thermalefficiencyrejectsone-thirdof thecoalheatingvalue(30MJ/kg)totheonce-throughseawatercoolingsystem.Atthedischarge pointtheseawatercanonlybe5 ◦Cwarmerthanattheintakepoint.Howmuchseawaterneedsto bepumpedthroughthecoolingsystem(m3/s)?
El-Wakil,M.M.,1984. PowerplantTechnology.NewYork:McGraw-Hill. Decher,R.,1994. EnergyConversion.NewYork:OxfordUniversityPress. Weston,K.C.,1992. EnergyConversion.St.Paul:WestPublishingCo.
Cooper,C.D.,andF.C.Alley,1986. AirPollutionControl.ProspectsHeights:WavelandPress. Takeshita,M.,1995. AirPollutionControlCostsforCoal-FiredPowerStations.CoalResearchPublication IEAPER/17.London:InternationalEnergyAssociation.
TheU.S.developersofcommercialnuclearpowerplantsinthelate1950sand1960spromisedto producevastamountsofelectricalenergy,electricitythatwouldbe“toocheaptometer.”Theplants wouldnotcauseairpollutionandotherdetrimentalenvironmentaleffects.Furthermore,countries, includingtheUnitedStates,thatimportpartoralloftheirfossilfuelneededforelectricpower wouldnotbesubjecttofossilenergyimportembargoesandpriceescalations.
In1990,nuclearpowerplantssuppliedmorethan20%oftheelectricityintheUnitedStates, andin2001morethan100nuclearpowerplantsareinoperationthere.InFrance,morethan50 plantsareoperating,supplyingmorethanthree-quartersofitselectricity.Japanhasabout40plants, supplyingmorethanone-thirdofitselectricity.Altogether,morethan400nuclear-fueledpower plantsoperateintheworldin2001,supplyingabout17%oftheglobalelectricityconsumption. However,inthelasttwodecadesofthetwentiethcentury,nuclearpowerplantsfellintodisfavor. TheThreeMileIslandnuclearpowerplantaccidentintheUnitedStatesin1979,theChernobyl powerplantaccidentintheformerUSSRin1986,andtherecentnuclearfuelprocessingplant accidentinTokaimurainJapanin1999allraisedgraveconcernsinthepubliceyetowardfurther electricitygenerationinnuclearpowerplants.Also,theissueofthedisposalofthehigh-level radioactivewastethatkeepsaccumulatingattheplantshasnotbeenresolvedintheUnitedStates andworldwide.
IntheUnitedStates,economicsisalsoafactoraffectingthemaintenanceofexistingnuclear powerplantsandbuildingnewones.Thecomplexityofnuclearpowerplantsisstaggering,making electricityproductioncostsinexistingplantsequaltoorgreaterthanthatinfossil-fueledplants. Atpresent,thecapitalinvestmentofanewnuclearpowerplantistwo-toseveral-foldhigherthan apulverized-coal-firedornatural-gas-firedcombinedcycleplant,includingthecapitalinvestment inemissioncontrolequipmentthatfossil-fueledpowerplantsrequire.Also,fossilfuelisrelatively cheapatpresent,rangingfrom$2to$5perMBtu,sothatfuelcostisnotadeterrenttoitsuse.
Insomecountries,notablyFranceandJapan,whichlackfossilfuelresources,energysecurity argumentsappeartopredominateoversafetyconcernsoreconomicfactors,sothatnuclearpower plantscontinuetosupplyanincreasingfractionoftheelectricitydemand.
Inthefuturethesituationmaychange.Theglobalfossilenergyresourcesarefinite.Wehave seeninSection2.7.6thatatthecurrentconsumptionrate—letaloneifconsumptionwillincrease withpopulationandeconomicgrowth—fluidfuels(oilandgas)willbedepletedwithinacentury. Whilecoalresourcesmaylastlonger,theenvironmentaleffectsofcoaluse,notablythegreenhouse effect,militateagainstwideruseofcoal.Renewableenergymayplayanincreasingroleinmarginal
energyuse,butitisdoubtfulthatrenewableenergywillreplacelarge-scalecentralizedfossilfueled ornuclearpowerplantssupplyingthebaseloadforurban-industrialareas.
Nuclearenergyresourcesarefarmoreabundantthanfossilfuelresources.Itisestimated thathigh-gradeuraniumorescouldprovidethepresentmixofreactorsforabout50years,but utilizationoflower-gradeores(withconcomitantincreaseofrefineduraniumfuelprice)would lastformanycenturies.Utilizationofthoriumoresandfastbreederreactorscouldextendnuclear energyresourcestomillennia.1 Thus,itispossiblethatworldwidenuclearpowerplantswillagain winpublicfavorandbecomeeconomicallycompetitivewithotherenergysources.
Inthischapterwedescribethefundamentalsofnuclearenergy,itsapplicationforelectricity generation,thenuclearfuelcycle,andtheproblemsassociatedwithnuclearpowerplantsinregard totheirsafety,nuclearweaponsproliferation,andradioactivewastedisposal.
Nuclearenergyisderivedfromthebindingforce(the“strong”force)thatholdsthenucleons2 of theatomicnucleustogether.Thebindingforcepernucleonisgreatestforelementsinthemiddle oftheperiodictableandissmallestforthelighterandheavierelements.Whenlighternuclei fuse together,energyisreleased3;whenheaviernucleiundergo fission, energyisalsoreleased.When anucleusof 235U(anisotopeofuranium)isbombardedwithaneutron,itsplitsintomanyfission productswiththereleaseoftwotothreetimesasmanyneutronsaswereabsorbed.Forexample, oneofthefissionreactionsisthesplittingof 235Uinto 144Baand 89Kr,withthereleaseof3neutrons plus177MeVofenergy4,5:
wherenstandsforaneutron.
1“NuclearElectricity,”1999.UraniumInformationCentre,Melbourne,Australia.
2Forourpurposesweshallconsiderasnucleonsonlypositivelychargedprotonsandchargelessneutrons. Otherparticleshavebeenobservedinnucleardisintegrationexperiments,buttheyarenotgermanetoour discussion.
3Weshalldiscussfusionattheendofthischapter.
4Electronvolt(eV) = energygainedbyanelectronwhenacceleratedthroughanelectricalpotentialdifference of1volt.1eV = 1.602E( 19)J;1MeV = 1.602E( 13)J.
5TheenergyreleasedinafissionreactioncanbecalculatedbymeansofthefamousEinsteinequationthat tiesenergytomass, E = mc2.Themassesontheleft-handsideofequation(6.1)are 235U = 235.04394amu (1atomicmassunit = 1.66E( 27)kg),n = 1.00867amu;ontheright-handside 144Ba = 143.92amu, 89Kr = 88.9166amu,3n = 3.026amu.Ifwesubtractthesumofthemassesontheright-handsidefromthesumof themassesontheleft-handside,thereisa“massdeficit,” m = 0 19amu.Thismassdeficitisconvertedinto energy E = mc2 = 0.19amu × 1.66E( 27)kg × [3E(8)]2 m2 s 2 = 2.84E( 11)J = 177MeV.(1amu deficitisequivalentto931.5MeV.)Thefissionof 235Uproduces2.84E( 11)J × 6.023E(23)atomsmole 1 ÷ 0.235kgmol 1 = 7.3E(13)Jkg 1 energy.Incomparison,thecombustionofcarbonproduces3.3E(7)Jkg 1 , about2milliontimeslessenergyperunitweightthanafissionreaction.
Mostofthefissionproductsareradioactive(seeSection6.3below).Becausemorethanone neutronisreleasedinthefissionreaction,achainreaction6 develops,withanincreasingrateof releaseofenergy.Thegreaterportion(about80%)ofthereleasedenergyiscontainedinthekinetic energyofthefissionproducts,whichmanifestsitselfassensibleheat.Apartoftheremaining energyisimmediatelyreleasedintheformof γ and β raysandneutronsfromtheexcitedfission products.Therestofthefissionenergyiscontainedindelayedradioactivityofthefissionproducts. Atthesametimethat 235Usplitsintofissionproductswiththereleaseof2–3neutrons,apart oftheneutronscanbeabsorbedbythemoreabundant 238Uinthefuel,convertingitinaseriesof reactionstoanisotopeofplutonium, 239Pu:
Thisreactionseriesisaccompaniedby γ and β radiation.
239Puisa fissile7 elementthatcansustainachainreaction(seebreederreactorsinSection6.4.4). Furthermore,becauseplutoniumisadifferentelementthanuranium,itcanbeextractedchemically fromthespentfuelandthenusedasfreshfuelforreloadingareactor.Theextractedplutoniumcan alsobeusedinatomicbombs.Thus,reprocessingofspentfuelcarriestheriskofnuclearweapons proliferation.Reprocessingofspentfuelforthepurposeofextractingplutoniumiscurrentlybanned intheUnitedStates.8
Radioactivityisthespontaneousdecayofcertainnuclei,usuallythelessstableisotopesofthe elements,bothnaturalandman-made,whichisaccompaniedbythereleaseofveryenergetic radiation.Aftertheemissionofradiation,anisotopeoftheelement(orevenanewelement)is formed,whichisusuallymorestablethantheoriginalelement.Itisimportanttonotethatradiation emanatesdirectlyfromthenucleus,nottheatomasawhole.Thisisanimportantdistinction, becauseX-rayradiation,althoughequallydamagingasradioactivity,emanatesfromtheinner electronicshellsoftheatom,notthenucleus.
Inradioactivedecay,therearethreetypesofradiation: α, β,and γ .Onlythelatterisaform ofelectromagneticradiation;thetwoformerareemissionsofveryhighenergyparticles.Allthree arecalledionizingradiationbecausetheycreateionsastheirenergyisabsorbedbymatterthrough
7A fissile nucleusisonethatcansplitafterabsorptionofathermalneutron.Examplesare 235U, 239Pu,and 233U.A fertile nucleusisonethatcanconvertintoafissilenucleusafterabsorptionofafastneutron.Examples offertilenucleiare 238Uand 232Th.
8Ithastobeemphasizedthatwhilethechainreactioninanuclearpowerplanthastobecarefullycontrolled,a nuclearreactorcannotexplodelikeanatomicbomb.Atomicbombscontainhighlyenriched 235U(95%+)or 239Pu,incontrasttonuclearreactorsthatcontainamaximumof3–4%enriched 235Uor 239Pu.Anuncontrolled chainreactioninthereactorcanleadtoa“meltdown”andpossibledispersalofradioactivefissionproducts, ashappened,forexample,atChernobyl.Butthereisneveranydangerofanaccidentatanuclearpowerplant resultinginanuncontrolledchainreactionwiththeexplosiveforceofanatomicbomb.
whichtheytravel.Ionizingradiationcantravelonlysofarintomatter,dependinguponitsenergy andcharacter.
In alpharadiation, awholenucleusofaheliumatom,containingtwoprotonsandtwoneutrons, isemitted.Becausetwoprotonsoftheoriginalnucleusarelost(andconsequently,twoelectrons mustbelostfromtheelectronicorbitalsinordertomaintainelectricneutrality),thedaughter isotopemovestwoelements backward fromtheparentelementintheperiodictable.Forexample, theisotope 239Pudisintegratesintotheisotope
Uwiththeemissionofan α particle:
Anotherexampleisthedisintegrationofanisotopeofradon 222Rn(whichisagasatnormal temperatures)intopolonium 218Po.Thelatteremitsanother α particlewiththeformationofa stableisotopeoflead 214Pb:
Because α particlesarerelativelyheavy,theirpenetrationdepthintomatterisverysmall,onthe orderofamillimeter.Asheetofpaperoralayerofdeadskinonapersoncanstop α radiation.
In betaradiation, anelectronisemitted.Thiselectrondoesnotstemfromtheelectronic orbitalssurroundingthenucleus,butfromthenucleusitself:aneutronconvertsintoaprotonwith theemissionofanelectron.Inthatconversion,aparentisotopeconvertsintoadaughterisotope, whichisanelement forward intheperiodictablebecauseaprotonhasbeenaddedtothenucleus. Anexampleisthedecayofstrontium
Because 90Srisoneoftheproductsofuraniumfission,thisisotopeisamajorsourceofradiation fromthespentfuelofanuclearreactor.Theemittedelectronisrelativelylight;thereforeitcan penetratedeeperintomatter,ontheorderofcentimeters.Toshieldagainst β radiation,aplateof metal,suchaslead,isnecessary.
Generally,theemissionof β radiationisfollowedbytheemissionof gammaradiation.Because thenumberofprotonsorneutronsdoesnotchangeinthatradiation,theradiatingisotopedoesnot changeitspositionintheperiodictable.Gammaradiationisessentiallytheemissionofveryshortwave,andhenceenergetic,electromagneticradiation.Anexampleistheemissionof γ radiation fromanisotopeofcobalt 60Co:
The γ radiationfrom 60Cofindsmedicinaluse,suchasdestroyingcancercells,andhenceprovides atherapyforcertaintypesofcancer.Because γ rayscarrynomass,itspenetrationintomatteris verydeep,ontheorderofmeters,andveryheavyshieldingisnecessarytoprotectagainstit.
Thedepthofpenetrationof α, β,and γ radiationincreaseswiththeenergyoftheradiation.For a1-MeVenergy,thepenetrationdepthsinwaterortissueare1E( 3),0.5,and33cm,respectively, and1E( 2),7,and55cmfor10-MeVenergy.Theirpenetrationdepthsinairareaboutathousand timesgreaterthaninwater.
Inadditiontotheabovethreetypesofradiation,thereistheemissionofneutrons.Usually, neutronsareemittedasaconsequenceofanuclearfission.Wealreadymentionedthefissionof 235U withtheemissionofthreeneutrons[equation(6.1)].Theseneutronscanenterothernucleiof 235U, whichleadstoachainreaction.Also,neutronirradiationofothernucleicanleadtotheirdestabilization,withthesuccessiveemissionof β or γ radiation.9 Radioactivityaccompaniesthewhole nuclearpowerplantfuelcycle,fromminingofuraniumore,throughuraniumextraction,isotope enrichment,fuelpreparation,fuelloading,reactoroperations,accidents,plantdecommissioning, and,lastbutnotleast,spentfueldisposal.
Thedecayrateofanensembleofradioactivenuclei,towhichthediminishingintensityofradioactivityisproportional,isgovernedbythelawofexponentialdecline:
where N isthenumberofdecayingnuclei,ortheirmass,presentattime t,and k isthedecayrate inunitsoft
where N0 isthenumberofnuclei,ortheirmass,atthestartofcountingtime.Thetimeafterwhich thenumberofdecayingnucleiishalvediscalledthehalf-life t1/2:
Someradioactivenucleidecayveryfast,andtheirhalf-livesaremeasuredinseconds;othersdecay slowly,andtheirhalf-livescanbedays,years,orevencenturies.
Thedecayratehasgreatimportanceinregardtoradioactivewastedisposal.Forexample,spent fuelofanuclearpowerplantcontainsmanyradioactiveisotopes,suchasstrontium-90(half-life 28.1y),cesium-137(half-life30y),andiodine-129(half-life15.7millionyears).Strontium-90 andcesium-137willdecaytosmallamountsinhundredsofyears,butiodine-129willstayaround practicallyforever.10 Table6.1listssomeradioactiveisotopesthatplayaroleinthefuelcycleof nuclearpowerplants,alongwiththeirradiationandhalf-lives.
Thelevelofradioactivityofasampleofsubstanceismeasuredbythenumberofdisintegrations persecond.TheSIunitofradioactivityisthebecquerel(Bq),whichisonedisintegrationper second(seeTableA.1).Amorepracticalunitofmeasurementofradioactivityisthecurie(Ci),
9Theirradiationbyneutronsiscalledneutronactivation.Itisused,forexample,foridentificationandquantitationofelementsinenvironmentalsamples.Researchreactorsatuniversitiesandotherinstitutionsareused toirradiatesamplesinsertedintotheirreactorsforneutronactivationanalysis.
10Withahalf-lifeof28.1years, 90Srwilldecayto1%ofitsinitialvaluein187years. 137Cswithahalf-life of30.2yearswilldecayto1%in201years.
whichisdefinedas3.7E(10)Bq,or3.7E(10)disintegrationspersecond.Theradioactivityofone gramofradium-233is1Ci,andthatofcobalt-60is1kCi.11 Butformixturesofradioactive isotopes,suchasfoundinoresamplesorspentreactorfuel,theradioactivelevelmeasuredin curiescannottellustheamountorcompositionoftheradioactivecomponents,onlytheirtotal disintegrationrate.
Becauseexposureofhumansto α, β,and γ radiationcanbeharmful,weneedpracticalunits ofmeasurementofexposuretothem.TheSIunitofabsorbeddoseofradiationisthegray(Gy), whichequalsonejouleofabsorbedenergyperkilogramofmatterpenetratedbytheradiation. Anothercommonlyusedunitofabsorbeddoseistherad,whichequals1E( 2)Gy.12
Theabsorbedenergyisnotentirelysatisfactoryasameasureoftheharmfulnesstohumans ofionizingradiation,becauseotherqualitiesoftheradiationarealsoimportant.Totaketheseinto account,adifferentunit,thesievert(Sv),isusedtomeasurewhatiscalledthedoseequivalent.Like thegray,ithasthedimensionsofJ/kg.TheSieverttakesintoaccountthequalityoftheabsorbed radiation.Anequivalentdoseof1Svisreceivedwhentheactualdoseofradiation(measuredin grays),afterbeingmultipliedbythedimensionlessfactors Q (theso-calledqualityfactor)and N (theproductofanyothermultiplyingfactors),is1J/kg. Q dependsonthenatureofradiationand hasavalueof1forXrays, γ rays,and β particles;10forneutrons;and20for α particles. N isa factorthattakesintoaccountthedistributionofenergythroughoutthedose.Analternativeunitof doseequivalentistherem,definedas1E( 2)Sv.
11Thespecificradioactivitylevelofasampleisobtainedbydividingtheradioactivitylevelbythemassor volumeofthesample(e.g.,Ci/kgorCi/L).
12Inthetreatmentofcancerwithradiation,theabsorbeddoseneededtokillcancercellsisoftheorderof 100Gy.
Anaccumulationofabsorbed α, β,and γ radiationovertimeiscalledaradiationdosage. Forexample,theaveragepersonintheUnitedStatesreceivesinoneyearadosageofabout360 millirems(3.6mSv),ofwhich200isfromradon-86,27fromcosmicrays,28fromrocksandsoil, 40fromradioactiveisotopesinthebody,39fromXrays,14fromnuclearmedicine,and10from consumerproductsandotherminorsources.
Theaveragepersononearthreceivesabout2.2mSvy 1.Ashort-termdoseof1Svcauses temporaryradiationsickness;10Svisfatal.AftertheChernobylaccidentintheformerSoviet Union,theaveragedosereceivedbypeoplelivingintheaffectedareassurroundingtheplantovera 10-yearperiod,1986–1995,was6–60mSv.The28radiationfatalitiesatChernobylappeartohave receivedmorethan5Svinafewdays;thosesufferingacuteradiationsicknessaveraged3–4Sv.
Thegreatestrisktohumansofnuclearpowerplantoperationsisassociatedwithradioactivity,also calledionizingradiation,becauseofthecreationofionsleftbythepassageof α, β,and γ raysand neutrons.Radioactivityaffectshumansandanimals,causingsomaticandgeneticeffects.13 Somatic effectscanbeacutewhenanorganismissubjectedtolargedosesofradiation,orchronicwhenthe exposureisatlowlevels,butoverprotractedperiods.Acuteeffectsincludevomiting,hemorrhage, increasedsusceptibilitytoinfection,burns,hairloss,bloodchanges,and,ultimately,death.Chronic effects,whichusuallymanifestthemselvesovermanyyears,includeeyecataractsandtheinduction ofvarioustypesofcancer,suchasleukemia,thyroidcancer,skincancer,andbreastcancer.Genetic effectsmaybecomeapparentinlatergenerationsbutnotintheexposedperson.Theseeffectsare duetomutationsinthegeneticmaterial—forexample,chromosomeabnormalitiesorchangesin theindividual’sgenesthatmakeupthechromosomes.
Theprescriptionofradiationprotectionstandardsisanonerousandcontroversialtask.Inthe UnitedStates,thistaskwasvestedintheCommitteeontheBiologicalEffectsofIonizingRadiation (BEIR)oftheNationalAcademyofSciences,andinternationallyitwasvestedintheUnitedNations ScientificCommitteeontheEffectsofAtomicRadiation(UNSCEAR).Thetaskisdifficultbecause directevidenceonbiologicaleffectsofradiationcomes(unfortunately)fromhigh-levelexposures, suchasreceivedbythepopulationofHiroshimaandNagasakiduringatomicbombingandby theworkersattheChernobylandTokaimuraaccidents.Lower-levelexposuredatacanonlybe obtainedfromanimalstudies,thenextrapolatedtohumans.However,eveninanimals,theeffects oflow-levelexposurecanonlybeestablishedstatistically,observingalargecohortofanimalsover lengthyperiodsandovermanygenerations.
Insettingradiationstandards,thefollowingthreeassumptionsaremade:
(a)Thereisnothresholddosebelowwhichradiationhasnoeffect.
(b)Theincidenceofanydelayedsomaticeffectisdirectlyproportionaltothetotaldose received.
(c)Thereisnodose-rateeffect.
Basically,theseassumptionsconstitutethelinear-no-threshold(LNT)hypothesis.Theassumptionsmeanthateventheslightestradiationcouldleadtodelayedsomaticorgeneticeffects,and theoccurrenceofdelayedeffectsdoesnotdependonthestochasticnatureofradiation,orwhether thegivendoseisreceivedoverashortorextendedtime.
BasedontheLNThypothesis,theNuclearRegulatoryCommissionintheUnitedStatesset astandardofexposureforworkersinnuclearpowerplantsto50millisievertperyear(50mSv y 1 = 5remy 1).Forthegeneralpopulation—thatis,anypersonintheregionoutsidetheplant boundary—thestandardis1mSvy 1 = 100mremy 1 .
Anuclearreactorinanuclearfueledpowerplantisapressurevesselenclosingthenuclearfuel thatundergoesachainreaction,generatingheatwhichistransferredtoafluid,usuallywater,that ispumpedthroughthevessel.Theheatedfluidcanbesteam,whichthenflowsthroughaturbine generatingelectricpower;oritcanbehotwater,agas,orliquidmetalthatgeneratessteamina heatexchanger,thesteamthenflowingthroughaturbine.
ThefirstcontrollednuclearreactorwasbuiltanddemonstratedbyEnricoFermiin1942.It wasconstructedunderthebleachersofthestadiumattheUniversityofChicago.Thereactorhad dimensions9mwide,9.5mlong,and6mhigh.Itcontainedabout52tonsofnaturaluraniumand about1350tonsofgraphiteasamoderator,andcadmiumrodswereusedasacontroldevice.The reactorproducedanoutputofonly200Wandlastedonlyafewminutes.Fermi’s“pile”ushered inthenuclearage.
Thefirstcommercialscalenuclearpowerplantof180-MWcapacitywentintooperationin 1956atCalderHall,England.IntheUnitedStatesa60-MWstationstartedoperatingin1957at Shippingport,Pennsylvania.Beforethat,anexperimentalbreederreactorthatproducedelectricity wasdemonstratedin1951nearDetroit,Michigan.Thefirstnuclear-poweredsubmarine,the Nautilus, waslaunchedin1954.Submarinereactorsproducesteamthatdrivesaturbine,whichinturn propelsthesubmarine.
Wehavediscussedbeforethattheenergyofanuclearreactorisderivedfromsplittingafissile heavynucleus,suchas 235Uor 239Pu.Inanuclearreactorofapowerplant,thesplittingofthe nucleusandsustainingoftheensuingchainreactionhastoproceedinacontrolledfashion.
Thebasicingredientsofanuclearreactorare fuelrods, a moderator,controlrods, anda coolant. AschematicofareactorisdepictedinFigure6.1.
The fuelrods containthefissileisotopes 235Uand/or 239Pu.Naturaluraniumcontainsabout 99.3% 238Uand0.7% 235U.Theconcentrationofthefissileisotope 235Uinnaturaluraniumisnot enoughtosustainachainreactioninmostpowerplantreactors;therefore,thisisotopeneedstobe “enriched”to3–4%(forenrichmentprocesses,seeSection6.5).14 Thefuelrodscontainmetallic uranium,soliduraniumdioxide(UO2),oramixofuraniumdioxideandplutoniumoxide,called MOX,fabricatedintoceramicpellets.Thepelletsareloadedintozircalloyorstainlesssteeltubes, about1-cmdiameterandupto4mlong.
Control rods
Coolant out
Coolant in
Thermal shield
Pressure vessel
Fuel rods
Core barrel
Support plate
Moderators areusedtoslowtheenergeticneutronsthatevolvefromthefissionreaction, yieldinglow-energyneutrons,alsocalledthermalneutrons.Thisincreasestheprobabilityforthe neutronstobeabsorbedinanotherfissilenucleus,sothatthechainreactioncanbepropagated. Moderatorscontainatomsormoleculeswhosenucleihavehighneutronscatteringandlowneutron absorptioncharacteristics.Typicalmoderatorsarelightwater(H2O),heavywater(D2O),graphite (C),andberyllium(Be).Thelightorheavywatermoderatorscirculatearoundthefuelrods. Graphiteorberylliummoderatorsconstituteablockintowhichfuelrodsareinserted.Forexample, theoriginalFermi“pile”consistedofagraphiteblockintowhichmetallicuraniumfuelwasinserted. TheChernobyl-typereactorsalsousegraphiteasamoderator.
Controlrods containelementswhosenucleihaveahighprobabilityofabsorbingthermal neutrons,sothattheyarenotavailableforfurthersplittingoffissilenuclei.Inthepresenceof controlrods,thechainreactioniscontrolledorstoppedaltogether.Typicalcontrolrodsaremade ofboron(B)orcadmium(Cd).
Thechainreactioninsidethereactorisgovernedbythe neutroneconomycoefficientk.Under asteadystate,thenumberofthermalelectronsisinvariantwithtime, dn/dt = 0,and k = 1.The reactoristhenina critical condition.When k < 1,thereactoris subcritical; when k > 1,itis supercritical.Anuclearreactorbecomescriticalwhencontrolrodsareliftedoutofthecoreofthe reactortoadegreewheremorethanoneneutronreleasedbythefissionofafissilenucleussurvives withoutbeingabsorbedbythecontrolrods.Thepositionofthecontrolrodsdeterminesthepower outputofthereactor.Monitoringthecriticalconditioninanuclearreactorwhilevaryingtheoutput isquitecomplicated.Generally,nuclearpowerplantsarerunatfullload,providingthebaseload ofagrid.Runningtheplantatfullloadisalsomoreeconomical.
Oncetheremainingfuelintherodscannotsustaintheratedcapacityoftheplant,evenwith completewithdrawalofthecontrolrods,thefuelrodsneedtobereplaced.Thisoccursevery 2–3years.
Heatmustbeconstantlyremovedfromthereactor.Heatisgeneratednotonlybythefission reaction,butalsobytheradioactivedecayofthefissionproducts.Heatisremovedbya coolant, whichcanbeboilingwater,pressurizedwater,amoltenmetal(e.g.,liquidsodium),oragas(e.g.,
heliumorCO2).TheaccidentattheThreeMileIslandpowerplantnearHarrisburg,Pennsylvania, in1979occurredbecauseaftershutdown(fullinsertionofthecontrolrods),thereactorwascompletelydrainedofitscoolant,sothattheresidualradioactivityinthefuelrodscausedameltdown ofthereactor.
Theheatremovedbythecoolant,intheformofsteamorpressurizedhotwater,isusedin conventionalthermodynamiccyclestoproducemechanicalandelectricalenergy.Inadditiontothe controlrodsposition,themassflowofthecoolantalsodeterminestheplant’spoweroutput.
Aboutone-quarteroftheU.S.nuclearpowerplantsareoftheBWRkind.Theschematicofa BWRisdepictedinFigure6.2;thereactorassemblyitselfisdepictedinFigure6.3.MostBWR’s use3–4%enriched 235Uasthefuel.Lightwaterservesasboththecoolantandmoderator.As thecontrolrodsarewithdrawn,thechainreactionstartsandthecoolant–moderatorwaterboils. Thesaturatedsteamhasatemperatureofabout300 ◦Candpressureof7MPa.Afterseparation ofcondensateinthesteamseparator,thesteamdrivestheturbinethatdrivesthegenerator.After expansionintheturbine,thesteamiscondensedinthecondenserandreturnedviathefeedwater pumptothecore.
Thedirectcyclehastheadvantageofsimplicityandrelativelyhighthermalefficiency,because thesteamgeneratedinthecoredirectlydrivesaturbinewithoutfurtherheatexchangers.Thethermal efficiencyofaBWRisontheorderof33%,calculatedonthebasisoftheinherentenergyofthe nuclearfuelthathasbeenconsumedinpowerproduction.
InaBWRthereisnoneedforanextramoderator,becausethecoolantlightwaterslows downthefastneutronstothermalvelocitiesthatcanengageinfurtherfissionreactions.Another advantageofaBWRisthefactthatitisself-controlling.Whenthechainreactionbecomestoo intense,thecoolantwaterboilsfaster.Becauseofitslowdensity,steamhaslittleornomoderating
Reactor pressure vessel
Steam dryer
Steam outlet nozzle
Reactor water cleanup/shutdown cooling section nozzle
Condensor return nozzle
Steam separator
Feedwater inlet nozzle
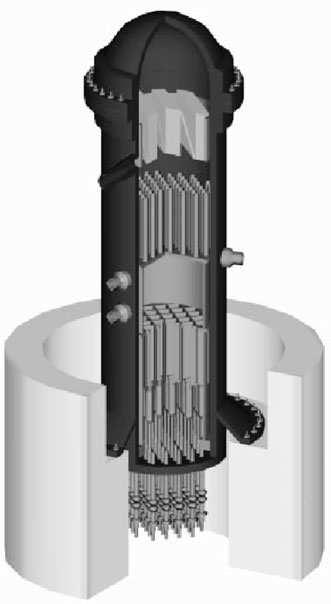
Core grid
Fuel assembly
Control rod guide tubes
Control rod drives
Shield wall
propensity.Thus,thereductionoftheliquidcontentofthecoolantwaterautomaticallyslowsthe chainreaction.
InaBWR,thecoreisenclosedintheprimarycontainmentvesselmadeofsteelandsurroundedbyreinforcedconcrete.Asecondarycontainmentvesselmadeofreinforcedconcrete (thedome-shapedbuildingvisibleatnuclearpowerplants)containsthesteamseparatorandthe spentfuelstoragepool.Thesteamturbine,condenser,andelectricgeneratorarelocatedoutsideof thesecondarycontainmentvessel.Eventhoughthecoolantwaterisdemineralized,someradioactivematerialmayleachfromthecoreintothecoolantwaterandsubsequentlybetransferredbythe steamtothesteamturbines.Furthermore,thecoolantwatermaycontaintracesofmildlyradioactive isotopesofhydrogen(tritium[3H])andnitrogen(16Nand 17N).Thesteamremainingincontact withtheturbineandotherequipmentlosesitsradioactivityquitefast,andwithproperprecautionno significantexposureispresentedtoworkersinthepowerplantorthepopulationoutsidetheplant.
ThemajorityofnuclearpowerplantsintheUnitedStatesandworldwideareofthePWRtype.A schematicofaPWRisdepictedinFigure6.4.Intheprimaryloopsurroundingthereactorcore, thecoolantwateriskeptatahighpressureofabout15MPa,sothatthewaterdoesnotboilinto
steameventhoughthetemperatureisinthe340–350 ◦Crange.Atthattemperature,thepressure ofthewaterexceedsthevaporpressure,sothereisonlyliquidphase.Thehot,nonboilingwater ispumpedintoaheatexchanger,whichislocatedtogetherwiththereactorcoreinsideaheavy steelandreinforcedconcretecontainmentvessel.Intheheatexchanger,feedwaterisboilinginto steamatabout7MPainasecondaryloop.Thesteamdrivesaturbinethatdrivestheelectric generatorinaconventionalRankinecycle.Thesteamturbineandcondenserarelocatedoutsideof thecontainmentvessel.
OneadvantageofthePWRisthatbecauseofthesinglephaseofthecoolantwater,themoderatingcapacityofthe(light)watercanbepreciselyadjusted,unlikeinaBWR,wherethecoolantis intwophases,liquidandvapor.Usually,boronintheformofboricacidisaddedtothecoolantto increasethemoderatingcapacity.Insuchafashion,fewercontrolrodsarenecessarytomaintain thereactoratthedesigncapacity.Theotheradvantageisthatthesteamwhichisgeneratedinthe heatexchangernevercomesintodirectcontactwiththecoolantwater.Thus,anyradioactivity thatmaybepresentinthecoolantisconfinedtotheprimaryloopinsidethecontainmentvessel. BecauseoftheheatexchangertheoverallthermalefficiencyofaPWRissomewhatlowerthan thatofaBWR,ontheorderof30%.
AspecialtypeofPWRistheCanadianDeuteriumUranium(CANDU)reactor.Thistypeof reactorisalsousedinArgentina,India,Pakistan,andKorea.CANDUusesnaturaluraniumfuels (withoutenrichment)andheavywater(D2O)asthemoderator.Heavywaterabsorbspracticallyno neutrons;thusitsneutroneconomyissuperiortothatoflightwater.Ontheotherhand,itsmoderating capacityislessthanthatoflightwater;thereforeneutronshavetotraveltwiceasfartobeslowed down(becomethermal)asinlightwater.Thefissilematerialis 235Uasinenricheduraniumreactors, butsomeofthefertile 238Uisconvertedintofissile 239Pu,whichcanparticipateinthechainreaction orcanbeextractedforfuelrecyclingorforweaponsproduction.Insteadofuraniumenrichment facilities,theCANDU-typereactorrequiresheavywaterproductionstills.Dependingonwhich
facilitiesacountrypossesses,oneconomicincentivesofaparticulargovernment,andonthewish ofacountrytoproduceweaponsgradeplutonium,itmaybemoreadvantageoustooperatea naturaluranium/heavywaterreactorthantooperateanenricheduranium/lightwaterreactor.Inthe UnitedStates,becauseoftheavailabilityofenricheduranium,noheavywaterpowerplantsare operating.
AreactortypethatwasdevelopedinparticularinGreatBritainisthe gas-cooledreactor.In fact,thefirstcommercialpowerplantputintooperation,in1956atCalderHall,wasaGCR. Generally,thesereactorsarefueledbynaturalorenricheduranium,eithermetallicorceramic uraniumoxide.Themoderatorisgraphite;andasthenameimplies,thecoolantisagas,normallyCO2,butheliumcanalsobeused.Becauseofthelowerheattransfercapacityofgasesas comparedtoliquids,thecontactsurfacesandflowpassagesinthereactormustbelargerthan thoseinliquid-cooledreactors.Inordertoobtainareasonablethermalefficiency,GCRsarerunat highertemperaturesthanPWRsorBWRs.Thisnecessitatescladdingandpipingmaterialsthatcan withstandthehighertemperatures.SomeGCRsareusingenricheduraniumtoboostthethermal efficiency.
Anexampleofahigh-temperaturegas(CO2)-cooledreactorisoperatingatHinkleyPointin theUnitedKingdom.Itsnetoutputis1250MW.ThefuelisUO2 with2.6% 235U.TheCO2 leaves thereactorat655 ◦Cand4.3MPa.TheCO2 ispumpedtoaheatexchangerwheresteamisgenerated at540 ◦Cand17MPa.Theplantachievesathermalefficiencyofcloseto42%.
IntheUnitedStatesa40-MWhigh-temperaturegas-cooledpowerplantwasconstructedand operatednearPhiladelphia,Pennsylvania.Itisnowdecommissioned.Another330-MWplantwas operatednearPlatteville,Colorado.Whileprovidinginterestingexperience,theplanthadmany engineeringproblemsandisbynowalsodecommissioned.ResearchanddevelopmentonGCRs iscontinuing,andtheirrevivalmayoccurinthefuture.
Ina breederreactor, fissilenucleiareproducedfromfertilenuclei.Theprincipalbreedermechanism istheconversionof 238Uto 239Puasshowninequation(6.2).Theintermediary 239Uhasahalf-life of23minutes,thenconvertstoneptunium 239Npwithahalf-life2.4days,whichinturndecaysto 239Pu,withahalf-lifeof24,000years.The 239Puformed,whileafissilenucleus,doesnotparticipate toasignificantextentinthechainreaction,butaccumulatesinthespentfuelfromwhichitislater extractedandreused.
Unlike 235U,whichefficientlyundergoesfissionwithslowthermalelectronswhoseenergyisin thetenthsofeVrange, 238UcapturesefficientlyfastneutronsintheMeVrange.Toobtainthiswide spectrumofneutronenergies,acoolant/moderatorotherthanlightorheavywaterisrequired.The preferredcoolantisliquidsodium,andsuchareactoriscalledtheliquidmetalfastbreederreactor (LMFBR).Thesodiumnucleushasalargermassthandoeshydrogenordeuterium;thereforea neutroncollidingwithasodiumnucleusbouncesoffwithnearlyitsoriginalmomentum,whereas aneutroncollidingwithahydrogennucleus(e.g.,aproton)impartsnearlyhalfofitsmomentum tohydrogen.
Theefficiencyoffuelutilizationinabreederreactorisexpressedastheratioofthenumberof fissilenucleiformedtothenumberdestroyed.Thisratioiscalledbreedingratio(BR):
WhenBRisgreaterthan1,breedingoccurs.Notethatbothinthenumeratoranddenominatorof equation(6.11)fissilenucleiincludenotonly 235U,but 233Uandinitiallypresent 239Pu. Breederreactorscouldalsousethoriumasafuel. 232Thisafertilenucleusthatcanbeconverted intofissile 233Ubythefollowingreactionsequence:
Here 233Paisanisotopeofelement91,protactinium.Becauseworldwidethoriumoreshaveabout anequalabundanceasuraniumores,theuseofthoriumwouldextendthenuclearfuelresources byaboutafactoroftwo.Sofar,thorium-basedbreederreactorsareonlyintheplanningand developmentphase.
Amajorproblemwithbreederreactorsistheneedtouseliquidsodiumasacoolant.(A helium-cooledbreederreactorwasdesignedbyGulfGeneralAtomicCorporationinthe1960s, butwasnotconstructed.)Inadditiontotheappropriatemoderatingcharacteristicsofsodium,it alsohasanexcellentheattransfercapacity.Sodiummeltsat90 ◦Candboilsat882 ◦C.Thisallows thereactortorunhotter,andconsequentlyahigherthermalefficiencyisobtained.Butsodiumis anastychemical.Itburnsspontaneouslyinair,anditreactsviolentlywithwater.Furthermore, 23Na(thenaturalisotope)canabsorbaneutrontoconvertfirstinto 24Na,andthenintothestable 24Mg.Theintermediary 24Naemitsveryenergetic β and γ radiation.Therefore,morethanone sodiumloopisrequired,aseparateloopforthesodiumcoolantcirculationandanotherloopfor thewater/steamcycle.AschematicofaLMFBRwithtwosodiumloopsispresentedinFigure6.5. Thereactorcore,sodiumloops,heatexchangers,andsteamloopsarealllocatedinacontainmentvessel;thesteamturbine,condenser,andtherestofthegeneratingplantareoutsideofthe vessel.
SeveralfastbreederreactorswereoperatedintheUnitedStates,UnitedKingdom,France, Germany,India,Japan,andRussia.Thelargest(400-MW)breederreactorintheUnitedStates operatedfrom1980to1994atClinchRiver,Tennessee,butwasterminatedbecauseofconcern aboutnuclearproliferation.Breederreactorsstillinoperationarethe250-MWPhenixinFrance (the1240-MWSuperphenixwasshutdownin1998),the40-MWFBTRinIndia,the100-MW JoyoinJapan,the135-MWBN350formerlyinUSSRbutnowinKazakhstan,andthe10-MW BR10,the12-MWBOR60,andthe600-MWBN600inRussia.
Mostbreederreactors,withtheexceptionofthoseinJapan,wereoperatedfortheprimarypurposeofproducingweapons-gradeplutonium.Thisiscertainlyoneofthedrawbacksof breeder-typepowerplants.Whiletheyproducemorefissilefuelthantheyconsumeintheprocessof powerproduction,thefissilefuel,plutonium,canbefairlyeasilyextractedtomakeatomicbombs. Strictinternationalsupervisionwillbenecessaryif,inthefuture,breeder-typepowerplantswill commonlybeusedforelectricpowerproduction.
Thenuclearfuelcyclestartsfrommininguranium(orthorium)ore,throughextractionoftheuseful uraniumconcentrate,gasificationtoUF6,enrichmentof 235U,conversiontometallicuraniumor oxideofuranium,fuelrodfabrication,loadingofareactor,retrievalofspentfuel,reprocessingof spentfuel,andfinallyfuelwastedisposal.Ablockdiagramofthenuclearfuelcycleispresented inFigure6.6.
Uraniumorescontainingvariableconcentrationsofuraniumarefoundinmanypartsoftheworld. Richoresmaycontainupto2%uranium,medium-gradeores0.5–1%,andlow-gradelessthan 0.5%.IntheUnitedStates,oresarefoundinWyoming,Texas,Colorado,NewMexico,andUtah. LargedepositsarefoundinAustralia,Kazakhstan,Canada,SouthAfrica,Namibia,Brazil,and Russia.
Themosteconomicwayofextractingtheoreisfromopensurfacemines.Becauseuranium depositsarealwaysassociatedwithdecayproducts(daughters)ofuranium,suchasradiumand radon,theseorescanberadioactive,andworkers’protectionmuststartattheminingphase.Open pitminesarewell-ventilated,somostradiation,especiallythatassociatedwithradon,whichisa gas,escapesintotheatmosphere.However,masksmustbeworntopreventinhalationofmining dustwhichcancontainradioactiveelements.
Theoreiscrushedandground.Thegroundoreisleachedwithsulfuricacid.Uranium,together withsomeothermetals,dissolves.UraniumoxidewiththeapproximatecompositionU3O8,called yellowcake,isprecipitated,dried,andpackedinto200-literdrumsforshipment.Theradiation fromthesedrumsisnegligible.However,thesolidsremainingafterleachingwithacidmaycontain
Low-level wastes
Mining of uranium
Uranium ore Yellow cake
Milling Mill tailings
Chemical conversion
Low-level wastes
Low-level wastes
Isotope separation Depleted U
Fuel fabrication
Reactor operation
UF6 Enriched U Fresh fuel Spent fuel
Storage in water pool
Reprocessing
Fuel plus waste High-level waste
Disposal in repository
radioactiveisotopesofradium,bismuth,andlead.Thesesolidsarepumpedasaslurrytothetailings heap,alsocalledtailingsdam.Thetailingsmustbecoveredwithclayorotherimpenetrablematerial toprotecthumansandanimalsfromradiationexposure.
TheU3O8 concentrateisshippedfromtheminestotheenrichmentfacilities.Theconcentratehasthe normalisotopedistribution,about99.3% 238Uand0.7% 235U.WiththeexceptionofCANDU-type heavy-water-moderatedreactors,allotherreactorsneeduraniumenrichedwith 235U. Forenrichment,agaseousuraniumcompoundisnecessary.Theconcentrateistreatedwith hydrogenfluoridegasandtheuraniumoxideisconvertedtouraniumhexafluorideUF6.Thisisa whitesolidthatsublimatestoavaporatapressureof1atmosphereat56 ◦C.ThegaseousUF6 is enrichedbyoneofthefollowingprocesses.
Membraneswithsmallporesallow gaseousdiffusion tooccur.Therateofdiffusionisafunction ofpressureandtemperatureandisalsoafunctionofthemoleculardiameterofthediffusinggas. 235UF6 hasaslightlysmallerdiameterthan 238UF6.Thus,thelighterisotopediffusessomewhat fasterthroughtheporesthantheheavierisotope.Inonepassage,theenrichmentfactorisverysmall, butbyforcingthegasestopassmanymembranes(“stages”),almostanydegreeofenrichmentcan beachieved.Forlight-water-moderatednuclearreactors,thedesiredenrichmentis3–4%.Ifthe enrichmentfactorisafractionofapercentperstage,hundredstothousandsofstagesarerequired forthedesiredenrichmentlevel.Thisrequireslargeandexpensivefacilitieswithhugeelectricity consumptionforthevacuumpumpsandtheblowersthatforcethegasesthroughthemembranes. Therefore,gaseousdiffusionfacilitiesareusuallylocatednearasupplyofabundantandcheap electricity.IntheUnitedStates,gaseousdiffusionplantsarelocatedinOakRidge,Tennessee,and Hanford,Washington,wherelargehydroelectricdamsarelocatednearby.
Inthegaseousdiffusionprocessabout85%oftheuraniumfeedisrejectedasdepleteduranium. Currently,these“tails”arestockpiledforeventualfutureuseinfastbreederreactors.
Thegaseousdiffusionfacilitieswereestablishedduringthesecondworldwarfortheproductionofweapons-gradehighlyenricheduranium.Therelativelylowenricheduraniumusedfor powerplantreactorsisabyproductofthewartimeeffort.Criticsofnuclearpowerplantsoften chargethatwereenricheduraniumnotavailablefromdiffusionplantsconstructedandoperatedby governments,nuclearelectricitywouldbefarmoreexpensive,ornotavailableatall.
Recently,intheUnitedStatesandEurope,enrichmentplantshavebeenbuiltthatworkonthe principleofa gaseouscentrifuge.Whentheuraniumgasesarespunveryfastinacentrifuge,the heavier 238UF6 spreadstowardtheedgesofthecentrifugewhilethelighter 235UF6 concentrates towardthecenter.Here,theenrichmentisdependentontherateofrevolutionsandthetimespent inthecentrifuge.Gaseouscentrifugesarelessenergy-consumingthandiffusionplantsandrequire lowercapitalinvestment.
Developmentisinprogressinvariouscountrieson laserenrichment ofuranium.Inthisprocess, metallicuraniumisvaporizedinanoven.Astreamofvaporizeduraniumatomsexitstheovenport. Alaserbeamwithaverynarrowwavelengthbandisshoneuntotheatomicstreamtodifferentially excitetoahigherelectronicstateonly 235U,butnottheheavierisotope.Theexcitedatomisthen ionizedwithultravioletlight.Theionized 235Uiscollectedonanegativelychargedplate.
Afterenrichment,theUF6 gasormetallicuraniumisconvertedtouraniumdioxideUO2.This isaceramic-likematerialthatisfabricatedintopellets.Thepelletsareloadedintofuelrods.A 1000-MWpowerplantneedsabout75metrictonsofuraniumdioxidepelletsperload.
Inboilingandpressurizedwaterreactorsthefuelstaysinthereactorfor2–3years,generating electricity.Afterthatperiod,theleveloffissionproductsandotherneutronabsorbershasbuilt up,andthefissionreactionhassloweddown,withaconcomitantdeclineinsteamandelectricity production.Atthattime,thefuelrodshavetobereplacedwithfreshones.InCANDU-type reactors,fuelrodshavetobereplacedevery18months.Theretrievedfuelrodsemitahighlevelof radiationbecauseoftheradioactivefissionproductsandotherneutron-activatedisotopesthathave accumulatedinthespentfuelrods.Generally,theextractedfuelrodsarestoredinthecontainment vesselofthepowerplant,insteelandconcrete-walledwaterpoolsordrycasks.
Oncetheradioactivelevelofthespentfuelhasdeclinedsufficientlytobehandledbyremote controlandpropershielding,itshouldbetakenawaytoapermanentdisposalsite.Unfortunately,in
theUnitedStatesthisisnothappeningbecauseapermanentdisposalsitehasnotyetbeenapproved. Exceptfortheearlierreprocessingofspentfuel(nowbannedintheUnitedStates),everyspentfuel rodisstillstoredinthewaterpoolordrycaskatthepowerplantswheretheyhavebeenwithdrawn fromthereactor.Atsomepowerplantsthestoragespaceisrunningout,andtheirreactorsmay havetobeshutdown.
Inothercountries,afterduedeclineofradioactivity,thespentfuelisreprocessed.About 96%oftheoriginaluraniuminthefuelisstillpresent,althoughitcontainslessthan1% 235U. Another1%oftheuraniumhasbeenconvertedto 239Pu.Thespentrodsarechoppedupand leachedinacid.Uraniumandplutoniumdissolveandareseparatedchemicallyfromtherestof dissolvedelements.Therecovereduraniumissentbacktotheenrichmentfacilities.Therecovered plutoniumismixedwithnaturaluraniumandmadeintofreshfuel,calledmixedoxide(MOX). Francereprocessesabout2000tonsperyearofspentfuel,UnitedKingdom2700tons,Russia400 tons,India200tons,andJapan90tons,butJapansendsspentfuelabroadforreprocessing.These amountsdonotincludeplutoniumreprocessingfromdefenseestablishmentreactorsforweapons fabrication.
Theliquidwastesgeneratedinreprocessingplantsarestoredtemporarilyincooledstainless steeltankssurroundedbyreinforcedconcrete.Afteracoolingperiod,theliquidwastesare calcined (evaporatedtodrypowder)and vitrified (encasedinmoltenglass).Themoltenglassispouredinto stainlesssteelcanisters.IntheUnitedKingdom,France,Belgium,andSwedenthecanistersare storedindeepsilos,pendingpermanentdisposal.
Perhapsthelargestproblemfacingnuclearpowerplantsisthepermanentdisposalofspentfuel,or thewasteremainingafterextractingthestillusefulfuelfromthespentfuel.Thelevelofradioactivity ofthespentfueldeclinesabouttenfoldeveryhundredyears.Afterabout1000yearsthelevelreaches thatoftheoriginalorefromwhencethefuel(uranium)wasextracted.15
Theonlypracticalwayofdisposingofthewastewouldbeinstablegeologicformations knownnottosufferfromperiodicearthquakesandwherethewatertableiseitherabsentorvery deepbeneaththeformation.Forexample,deepsaltformationshavethesecharacteristics;otherwise thesaltwouldhaveleachedoutlongago.
IntheUnitedStatesaformationatYuccaMountain,Nevada,hasbeenselectedforpermanent disposal.Currentplanscallfortherepositoryfacilitytobeexcavatedfromvolcanictuffatadepth ofabout300metersbeneathYuccaCrest,whichis300metersabovethelocalwatertable.When filled,therepositoryisprojectedtostore70,000tonsofspentfueland8000tonsofhigh-level militarywaste.Manystudieshavebeenundertakentomodelthefateofthedisposedwaste.Most studiesconcludedthatthewastewouldbeundisturbedforperiodsof10thousandstomillionsof years.Yetsomeuncertaintiesremainintheseassessmentsthatneedtobeclarifiedbeforeofficial approvalofYuccaMountainasthepermanentspentfueldisposalsiteintheUnitedStates.Current plansarefora2010openingofthissite.16
16SeeaseriesofarticlesbyJ.F.Ahearne,K.D.Crowley,W.E.Kastenberg,L.J.Gratton,andD.W.North in PhysicsToday, 50,22–62,June1997.
Thelackofpermanentwastedisposalsystemsandtheunfavorableeconomicshasdeterred privatelyandpubliclyfinancedelectricityproducersfrombuildingnewnuclearpowerplantsin theUnitedStates.Noothercountryhasyetsolvedthepermanentdisposalproblemofradioactive wastefromnuclearpowerplants.
AsnotedinSection6.2,alargeamountofenergyisevolvedwhenlightnucleifusetogether.For example,thefollowingfusionprocessesareaccompaniedbyenergyevolvement:
Thesumofthemassesofthenucleithatfuse(theleft-handsideoftheequations)isnotexactlythe sumofthemassesofthefusednucleusplusthemassoftheejectedneutronorproton(theright-hand sideoftheequations).The“massdeficit”appearsastheevolvedenergy.Theejectedneutronsor protonscollidewithsurroundingmattersothattheirkineticenergyisconvertedintosensibleheat. Suchfusionreactionspowerthesunandotherself-luminousstars,aswellasthermonuclearbombs, alsocalledhydrogenbombs.
Itwouldbedesirabletoperformfusionreactionsundercontrolledconditions,sothatthe evolvedheatenergycanbetransferredtoacoolantworkingfluid,whichinturnwoulddrive aturbo-machinery.Theadvantagesoffusion-basedpowerplantsarethreefold:(a)The“raw” materialorfuelavailableforfusionreactorsisalmostunlimited,becausedeuteriumisanatural isotopeofhydrogentotheextentof1deuteriumatomin6500hydrogenatoms.17 Tritiumisnot foundinnature,butcanbemanufacturedfromanisotopeoflithiuminthefollowingreaction:
(b)Thefusionreactionswouldproduceaminimalamountofradioactivity.Someradioactive isotopesmaybecreatedduetoabsorptionofneutronsinmaterialssurroundingthefusionreactor. Also,tritiumismildlyradioactive,emittinglow-energy β rayswithahalf-lifeofabout12years.
(c)Thereisnospentfuelwastefromwhichingredientscouldbeextractedforfabricatingfission nuclearweapons.
Thedifficultyofachievingacontrolledfusionisinovercomingtheelectricalrepulsionforce ofthepositivelychargednuclei.Toovercometherepulsiveforce,thecollidingnucleimusthavea kineticenergycomparabletoatemperatureoftensofmilliondegrees.Atsuchtemperatures,atoms arecompletelydissociatedintopositivelychargednucleiandfreeelectrons,theso-called plasma state.Forthereleaseofsignificantamountsofenergy,manynucleimustcollide.Hencetheplasma needstobeconfinedtoasmallvolumeatahighpressure.
Attemptsofcontrolledfusionprocesseshavebeenconductedsincethe1950s.Sofaronly limitedsuccesshasbeenachieved;here,successmeansthatanequalorgreateramountofenergy isreleasedaswasconsumedinthefusionexperiment,theso-called“break-even”point.Optimistic estimatespredictthatcommercialpowerplantsbasedonfusionwillbeoperativeinthenext40–50 years.Pessimisticestimatesclaimthatfusion-typepowerplantswillneverbepractical,orthey willbetooexpensivecomparedtopowerplantsbasedonfissionreactorsorrenewableenergy,let alonefossilenergy.
Mostapproachestoplasmaconfinementandinducementtofusionrelyonmagneticfieldconfinement.Themagneticfieldiscreatedinsidecylindricalcoilsinwhichacurrentflows.Thecylindrical coilsformacircle,sothatthemagneticfieldhastheshapeofatoroid(doughnut).Theplasma particlestravelinhelicalrevolutionsalongthemagneticfieldlines.
ThefirsttoroidalmagneticfieldreactorwasconstructedintheformerUSSR,hencetheacronym Tokamak, shortinRussianfortoroidalmagneticchamber.Furtherconfinementoftheplasmais providedbyanadditionalcurrentflowingintheplasmaitself.Theplasmacurrentisinducedby transformeractionfromexternalcoils.Theplasmaisheatedbyacombinationoftheresistivedissipationfromthecurrentflowingintheplasmaandfromexternalsources,suchasradio-frequency waves.Also,energeticparticlesmaybeinjectedintotheplasma,suchashigh-velocityionsfrom anaccelerator.
Tokamak-typefusionmachinesareoperatinginRussia,Europe,Japan,andUnitedStates. In1993,theTokamakreactoratthePrincetonPlasmaPhysicsLaboratoryusingthedeuterium–tritiumfusionachievedanominaltemperatureof100milliondegreesandapowerof5million wattsforabout4seconds.Plansareunderwaytobuilda$1.2billionInternationalThermonuclear ExperimentalReactor,jointlyfundedbytheUnitedStates,Japan,Russia,andseveralEuropean countries.Thisfacilitywillusedeuterium–tritiumasafuelandsuperconductingmagnetsfor confinement.
Laser-inducedfusionapparatusesareoperatingattheLawrenceLivermoreLaboratory,California; LosAlamosLaboratories,NewMexico;andRochesterUniversity,NewYork.
Afuel(e.g.,amixtureofdeuteriumandtritium)iscontainedinasmall(1-mm)spheremade ofglassorsteel.Themixtureisirradiatedwithseveralhigh-intensitylaserbeams.Thesphereis compressedandheatedbyimplosion.Theglassorsteelouterlayerevaporates.Thetemperature ofthecontentgasesincreasestotensofmillionsdegrees,andthepressurerisestothousandsof atmospheres.Laserbeamsofmegajoulesofenergyareemployedinveryshortpulses,abillionth ofasecondlong.Thepoweratthecenterofthespherereaches1E(15)W.Theinitialbeamisfrom aneodymium-glasslaserradiatingat1 µm.Acrystalisusedtogeneratehigherharmonicsinthe ultravioletrange.Unfortunately,thelasersystemoperatesatabout1%efficiency,sothat99%of theinputenergydoesnotresultinlightemission.Higher-efficiencylaserspulsingatahigherrate willbenecessaryforbreak-evenpowerproduction,letaloneforacommercialpowerplant.
PlansareunderwaytobuildtheNationalIgnitionFacilityattheLawrenceLivermoreLaboratory,California,employingadeuterium–tritiumfueland192laserbeams.
Morethan400nuclearpowerplantsarecurrentlyoperatingintheworld,supplyingabout17%of theglobalelectricitydemandofmorethan2E(15)kWhperyear.Whilecomplicated,thetechnology iswell-developed,andthepowerplantsoperaterelativelyreliably.
Mostofthecurrentpowerplantsuseareactorofthepressurizedwatertype(PWR)inwhich thefuelisuraniumenrichedto3–4%uranium-235;thepressurizedlightwaterservesbothasthe coolantandthemoderator,andcadmiumorboroncontrolrodsservetocontrolthepoweroutputorto shutdownthereactor.Theboilingwaterreactors(BWR)usethesamefuelandcontrolrods,butthe coolant/moderatorisintwophases:liquidwaterandsteam.InsomeBWRthemoderatorisgraphite. AnothertypeofreactorisusedintheCANDUpowerplants,wherethefuelisnaturalorslightly enricheduranium,thecoolant/moderatorisheavywater,andthecontrolrodsaresimilartotheother reactors.Breederreactorshavebeenprimarilyusedtoproduceweapons-gradeplutonium.Theyuse naturaluraniumandacoolant/moderatorthatusuallyisliquidsodium.Mostofthebreederreactors havebeenphasedoutsincesufficientplutoniumforweaponsproductionhasbeenstockpiled,and thereisnoimmediatescarcityofnaturaluranium.
Furtheradvancesindevelopingnovelnuclearpowerplantsarepossiblethatwillincreasetheir thermalefficiency,uselessexpensivefuels,suchasnaturaluraniumandthorium,and,foremost, ensuretheirabsolutesafety.
Despitepersistingconcernsaboutnuclearpowerplantsafety,onlyoneacknowledgedserious accidentoccurred—thatatChernobylin1986—involving28mortalitiesandayetunknownnumber oflatentmorbidities.TheThreeMileIslandaccidentin1979isnotknowntohavecausedexcess mortalityormorbidity.TheTokaimuraaccidentin1999wasnotassociateddirectlywithpower plants,butwithreprocessingspentfuel.
Nevertheless,thefutureofnuclearpowerplantsisverymuchuncertain.Inparttheuncertainty stemsfromthepublic’sperceptionthatnuclearpowerplantsareinherentlyunsafe,notwithstanding thecontraryrecordsandstatistics.Theotherfactoriseconomics.Althoughgovernmentsdirectlyor indirectlysubsidizednuclearpowerplantsbyfundingresearch,development,andtheinfrastructure uponwhichtheplantswerefounded,theproductioncostofelectricityinexistingplantsiseither equaltoorgreaterthanthatinfossil-fueledplants.Newplantsmaybecomemoreexpensive thanexistingonesbecauseoftheincreasedcapitalinvestmentneededforaddedsafetyfeatures. Productioncostsmayalsoincreasebecausealargernumberoftechnicalpersonnelwillberequired toensuresafeoperationofthenewplantandalsobecauseoftheimbeddedcostofsafedisposalof spentfuelanddecommissioningtheplantafterreachingretirement.
Realistically,theonlyconditionsunderwhichnuclearpowerplantswillincreasetheirshare ofglobalelectricitysupplyareasfollows:(a)fossilfuelswillbecomescarceand/orexpensive; (b)internationalornationalpoliciestopreventthethreatofglobalwarmingwillmilitateagainst electricityproductionbyfossil-fueledpowerplants;(c)renewableenergiescannotsatisfythe increasingelectricitydemand;(d)nationalpoliciesofgovernmentsthatwishtobeindependent offoreignfossilfuelsupplies;(e)nationalpoliciesofgovernmentsthatwishtodevelopnuclear weapons,theingredientsofwhich(i.e.,plutonium)comefromreprocessedspentfuelofpower plants.
Inanycase,ifnuclearpowerplantsaretoincreasetheirshareofelectricitysupply,therisk ofradiationaccidentsmustbebroughttonearzero,andtheproblemoflong-termdisposalof radioactivewastemustbesolved.
Problem6.1
(a)Calculatethemassdeficit( m)inatomicmassunits(amu)ofthefollowingfissionreaction. (Useliteraturevaluesfortheexactmassesoftheisotopesandneutrons.)
235U + n → 139Xe + 95Sr + 2n
(b)Calculatetheenergy(MeV)releasedperonefission.(c)Calculatetheenergyreleasedper kilogramof 235U,andcompareittotheenergyreleasedinthecombustionof1kgofcarbon.
Problem6.2
(a)Calculatethemassdeficit( m)inatomicmassunits(amu)ofthefollowingfusionreaction.
2D + 3T → 4He + n
(b)Calculatetheenergyreleased(MeV)peronefusion.(c)Calculatetheenergyreleasedper kilogramofdeuterium.
Problem6.3
Inanuclearaccidentthereisareleaseof 90Srthatemits γ rayswithahalf-lifeof28.1y.Suppose 1 µgwasabsorbedbyanewlybornchild.Howmuchwouldremainintheperson’sbodyafter18 and70yearsifnoneislostmetabolically?
Problem6.4
Theisotope 223Rahasahalf-lifeof11.4days. 223Radecaysatarateof1Cipergramofradium isotope.(Ci = Curie = 3.7E(10)disintegrations/sec.)Whatwillbethedecayrate(Ci)ofthe1-gram sampleafter10,100,and1000days?
Problem6.5
Theisotope 129Ihasahalf-lifeof15.7years.Inanuclearpowerplantaccident,1kgoftheiodine isotopeisdispersedintothesurroundingsoftheplant.Howmuchoftheiodineisotopewillremain inthesurroundingsafter1,10,and100years?
Problem6.6
Definethefollowingtermsandgiveexamplesasappropriate:
fissilenucleus
fertilenucleus
chainreaction
neutroneconomy,sub-andsupercriticality fuelrod moderator controlrod coolant
Problem6.7
Foreachofthefollowing,createaschematicdiagramanddescribeandlistitsadvantagesand disadvantages:
(a)Boilingwaterreactor
(b)Pressurizedwaterreactor
(c)Breederreactor
Problem6.8
Createablockdiagramof,anddescribe,thenuclearfuelcycle.Listtherisksateachstep.
Problem6.9
Whyistherenodangerofanuclearpowerplantreactorexplodinglikeanatomicbomb?
Bodansky,D.,1996. NuclearEnergy—Principles,PracticesandProspects. NewYork:AmericanInstituteof Physics.
El-Wakil,M.M.,1982. NuclearEnergyConversion.LaGrangePark:AmericanNuclearSociety. El-Wakil,M.M.,1984. PowerplantTechnology.NewYork:McGraw-Hill.
Glasstone,S.,andA.Sesonske,1994. NuclearReactorEngineering.NewYork:ChapmanandHall. Hinrichs,R.A.,1996. Energy.Orlando:HarcourtBraceCollegePublishers.
Matar´e,H.F.,1989. EnergyFactsandFuture.BocaRaton:CRCPress.
Murray,R.L.,1989. UnderstandingRadioactiveWaste. Columbus:BattellePress.
Tester,J.W.,D.O.Wood,andN.A.Ferrari,Eds.,1991. EnergyandtheEnvironmentinthe21stCentury. Cambridge:MITPress.
Turner,JamesE.,1986. Atoms,Radiation,andRadiationProtection.NewYork:PergamonPress.
Renewableenergysystemsdrawenergyfromtheambientenvironmentratherthanfromtheconsumptionofmineralfuels(coal,oil,gas,andnuclear).Theultimatesourceofmostrenewable energyproductionisthesun,whosetotalradiantenergyfluxinterceptedbytheearthprovidesa muchgreatersourceofpowerthancanbecapturedbypracticalrenewableenergyschemes.1 Despitethevastamountsofenergythatarepotentiallyavailablefromrenewablesources,collecting andutilizingthatenergyinaneconomicalandeffectivemannerisfarfromaneasytask.
Therearemanyreasonsforthegrowthofinterestinrenewableenergysystems.Suchsystems areindependentoffuelsupplyandpricevariabilitiesandaretherebyeconomicallylessrisky. Renewableenergyresourcesaremoreuniformlydistributedgeographicallythanarefossilfuels, providingindigenousenergyresourcesformostfuel-poornations.Someformsofrenewableenergyoperateefficientlyinsmallunitsandmaybelocatedclosetoconsumers,reducingenergy transmissioncosts.IntheUnitedStatesinrecentyears,governmentalregulationoftheelectric utilitysystemhasprovidedsomeeconomicincentivefortheconstructionofrenewableenergy systemsasasmallpartofthemixofelectricpowersources.Becauserenewableenergysources havelesserenvironmentaleffectsthanconventionalenergysources,especiallyinregardtothe emissionoftoxicandgreenhousegasestotheatmosphere,theyareexpectedtobecomeanimportantsourceofenergyinfutureyearsasenvironmentalcontrolsbecomemorestringent.But themajorobstacletogreateruseofrenewableenergyisitsgenerallyhighercostcomparedto conventionalsources.
Therenewabletechnologiesthatcurrentlyareemployedorshowpromiseofbecomingpractical are:(a)hydropower,(b)biomasspower,(c)geothermalpower,(d)windpower,(e)solarheatingand thermalelectricpower,(f)photovoltaicpower,(g)oceantidalpower,(h)oceanwavepower,and(i) oceanthermalelectricpower.AsshowninFigures2.2and2.4,renewableenergyaccountsfor4.4 %oftotalU.S.1996energyproductionand8.2%ofworldenergyproductionin1997,almostall ofitintheformofhydropower,buttheamountofnon-hydrorenewablepowerisgrowingrapidly. Somerenewableenergysystemsproduceonlyelectricalpower,whichhasahighereconomic valuethanheat.Amongthesearehydro,wind,photovoltaic,tidal,andoceanwavepower.Nevertheless,biomass,geothermal,andsolarsystems,whichcandeliverbothelectricpowerandheat,are equallyimportantrenewableenergysources.Table7.1liststhe1997U.S.renewableenergypro-
a DatafromUSDOE,1998.DOE/EIA-0603(98)andDOE/EIA-0484(98).
ductionbytypeofsource.Bothelectricandthermalcontributions,whereappropriate,arelisted. Oftheelectricalpowercomponent,hydropoweraccountedfor83%,biomass13%,geothermal 3%,wind0.8%,andsolar0.2%.Together,renewableelectricityaccountedfor13%ofU.S.1997 electricityproduction.(Onaworldwidebasis,renewableelectricityisagreaterproportion,21.6%.)
AlsolistedinTable7.1foreachtypeistheinstalledelectricalcapacityandcapacityfactor(ratio oftheactualannualelectricalenergyproducedtothatwhichwouldbepossibleifthesourceranat itsinstalledcapacitycontinuouslyforafullyear).2
Renewableenergyischaracterizedbyseveralimportanttraits:
• Ubiquityofrenewableenergysources.
• Lowintensityofenergyfluxesbeingcaptured,comparedtoconventionalsystems.
• Random,intermittentnatureofrenewableenergyfluxes.
Someformofrenewableenergyisavailableeverywhereonearth.Averagedoverayear, theentireearth’ssurface(includingthepolarregions)interceptssomesunlight,makingsolar insolationuniversallyavailable;althoughlow-latitude,dry(clear)climateshavethemost,whereas thepolarregionshavetheleast,solarfluxatgroundlevel.Solarinsolationinducescirculationin theearth’satmosphere,givingrisetowindandoceanwaves,alongwithprecipitationintoelevated drainagebasins,providingsecondarysourcesofsolarenergy.Biomasscropsandforestsgrow intropicalandtemperatelandshavingsufficientprecipitation.Oceantidesarenoticeablealong continentalmargins.Temperaturegradientsbeneaththeearth’ssurfaceexisteverywhere,providing thepossibilityofgeothermalenergy.Butitisgenerallytruethatthereisconsiderablegeographic variabilityofeachformofenergy,sothatsomelocationsaremorefavorableforitsdevelopment thanothers.
Fossil-andnuclear-fueledpowersystemsoperateunderconditionsofintenseenergytransferwithintheircomponents,typicallyoftheorderof1E(5)W/m2,sothattheyproducelarge amountsofpowerperunitvolume.Incontrast,renewableenergyfluxesaremuchsmaller,althoughquitedifferentamongthevarioussources,aslistedinTable7.2,requiringlargerstructurestoreapthesameamountofpower.Asaconsequence,thecapitalcostperunitofaverage
2FortheUnitedStatesin1997,theelectricalpowerproducedbybothutilitiesandindustrialsourcesamounted to3340E(9)kWh/y,theinstalledelectricalcapacitywas683.2GW,andtheaveragecapacityfactorwas55.8%.
poweroutputishigherforrenewablethanforconventionalpowerplants,butthecostoffuel fortheconventionalplantmaymorethanoffsetitslowercapitalcost,makingrenewableenergy cheaper.
Energyfromsunlightisonlyavailableabouthalfofthetime,anditreachesitshigherintensities intheseveralhoursoneithersideoflocalnoon.Oncloudyandpartlycloudydays,thereisa considerablereductioninsolarinsolationcomparedwithcleardays.Electricpowergeneratedfrom sunlightmustbestoredorintegratedintoadistributionnetworkwithotherpowersourcestobeuseful inanindustrialsociety.Similarconsiderationsapplytowind,wave,andtidalpowersystems,which arealsointermittentsources.Ontheotherhand,hydropower,biomass,andgeothermalsystems havestoragecapabilitiesthatpermitthemtodeliverpowerwhenitisneeded,asdoconventional systems.
Inthischapterweexplainthephysicalbasisforeachoftherenewableenergysourceslisted aboveandalsodiscussthetechnologyusedtocollectandutilizethatenergy.Insomecasesit ispossibletoidentifycostsandperformanceforsystemsinuse.Wealsodiscussenvironmental effectswhich,whilegreatlyreducedcomparedtotraditionalenergysources,canbesignificant.
Beforesteamenginesweredeveloped,mechanicalpowergeneratedbyriverwaterflowingpast waterwheelswasthemajorsourceofpowerforindustrialmills.Thesemillshadtobelocatednear riverfallssothatwatercouldbedivertedfromanimpoundmentupstreamofthefallsandfedtoa waterwheelorturbinedischargingtoalowerleveldownstreamofthefalls.Theneedformechanical powerandsitesforindustrialfacilitiessoonoutgrewtheavailabilityofhydropower,leadingtothe introductionofsteamenginesand,eventually,steamelectricpowerplantsthatdistributetheir powerviaelectriclinestoconsumersfarremovedfromthepowerplantsite.Nevertheless,today hydropowercontinuestobeanimportantsourceofelectricpowergeneration,supplying10.7%of U.S.and19%ofworldelectricityproduction.
IntheUnitedStatesin1980,theinstalledhydropowercapacitytotaledabout63GWgenerated in1384plantsdistributedthroughoutthecountry,aslistedinTable7.3,operatingatanaverage capacityfactorof51%.ItisestimatedthatthetotalpotentialcapacityintheUnitedStatesisabout
threetimesthisamount.MostoftheU.S.hydropowerplantsaresmall,withtheaveragepower being46MW.Thelargest,GrandCoulee,locatedontheColumbiariver,cangenerate7.5GW. Worldwidetherearesevenplantsgeneratingmorethan5GWlocatedinVenezuela(10.6),United States(7.5),Brazil/Paraguay(7.4),formerSovietUnion(6.4and6.0),andCanada(5.3and5.2). ChinaispresentlyconstructingadamattheThreeGorgessectionoftheYangtseriverthatwill generate18.2GW.
Aneconomicalhydropowerplantrequiresareliablesupplyofwaterflowfromanelevated sourcethatcanbedischargedatalowerelevationnearby.Mostsitesrequiretheconstructionof adamatalocationalongariverwherealargevolumeofwatercanbeimpoundedbehindthe damatalevelhigherthantheriverbed.Apipeconnectedtotheupstreamreservoir(calleda penstock)conductshigh-pressurewatertotheinletofahydroturbinelocatedatalevelatorbelow thedownstreamriverbed,intowhichtheturbinedischargewaterisreleased,generatingmechanical powertoturnanelectricgenerator.Ifthedifferenceinheightofthewaterbetweenupstreamand downstreamofthedamis h (calledthe head)andthevolumeflowrateofwaterthroughtheturbine is Q,thenthemaximumpowertheturbinecangenerateis ρghQ,where ρ = 1E(3) kg/m3 isthe massdensityofwaterand g = 9 8m/s2 istheaccelerationofgravity.Fora1000-MWhydropower plantutilizingaheadof10m,aflowofmorethan1E(4)m3/swouldberequired.Onlythelargest ofriverscansupplyflowsofthismagnitude.
Riverwaterflowdependsuponprecipitationinthedrainagebasinupstreamofadamsite.Only afractionoftheprecipitationreachestherivercourse,withtheremainderbeinglosttoevaporation intotheatmosphereandrechargingoftheundergroundwateraquifer.Onaseasonalorannual basis,precipitationandriverflowisvariable,sothatitisdesirabletoimpoundavolumebehindthe hydropowerplantdamthatcanbeusedintimesoflowriverinflow.Inlocationswhereasubstantial portionofannualprecipitationisintheformofsnow,itssuddenmeltinginthespringwillproduce asurgeinflowthatmayexceedthecapacityofthehydroplanttoutilizeorstore.Itisusuallynot possibleoreconomicaltoutilizetheentireannualriverflowtoproducepower.
Inmountainousterrainitmaybepossibletolocatesiteshavingalargehead,oftheorder ofseveralhundredsofmeters,butwithonlymoderateorlowflowrates.Suchsitesmayprove economicalbecauseofthelargepoweroutputperunitofwaterflow.Ontheotherhand,low-head “runoftheriver”plantsthatstorenowaterbehindtheirdamsbutcanutilizewhateverflowis availableduringmostoftheyearhavealsoprovedeconomical.
Thetechnologyofhydropoweriswelldeveloped.Hydroturbinesarerotatingmachinesthat converttheflowofhigh-pressurewatertomechanicalpower.Forlow-head,high-volumerateflows theKaplanturbineisanaxialflowdevicethatsomewhatresemblesaship’spropellerinshape(see Figure7.1).Forhigherheads,theFrancisturbineisaradialinflowreactionturbineinwhichthe flowisapproximatelythereverseofacentrifugalpump.Forverysmallflowrates,thePeltonwheel utilizesanozzletoacceleratethehigh-pressurewaterstreamtoahigh-velocityjetthatsubsequently impingesontheperipheralbladesoftheturbinewheel.Poweringasynchronouselectricgenerator, hydroturbineinstallationscanconvertmorethan80%oftheidealwaterpoweravailabletoelectric power.
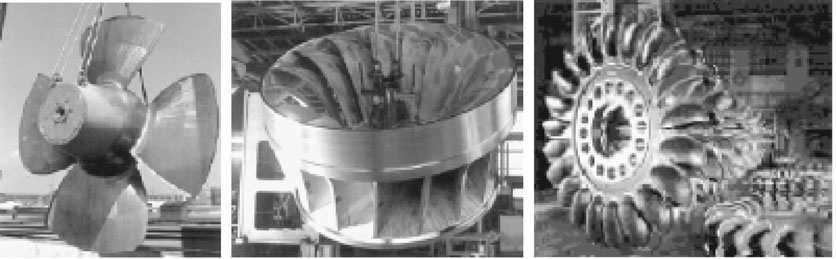
Mosthydropowerplantsrequiretheconstructionofadamandspillway,thelattertobypass excesswaterflowaroundthedamwhenthereservoirisfullandtheturbinesareoperatingatfull capacity.Thecivilworksrequiredforthedam,spillway,andpowerhousecanbeaconsiderable fractionofthecostoftheinstallation,sothattheoverallcostperunitofelectricalpowergeneration ishigherthanthatforthehydroturbineandgeneratoralone.Afavorablesiteforahydropower plantisoneforwhichthecostofthecivilworksisnotlargecomparedtothepower-producing equipment.
AnexampleofahydropowerinstallationisshowninFigure7.2.Onthefarleftandrightisan earthendamthatbacksuptheriverflow,formingahigher-levelpoolextendingmilesupstream.In thecenter,ontheleft,isaspillwaythatpassesexcessriverflow;andinthecenter,ontheright,is apowerhousewithfiveturbine-drivengeneratorsdischargingwatertoalowerleveldownstream.
Giventheunevennessofriverflowandthefinitenessofreservoirvolume,hydropowerplants donotoperateattheirratedcapacityyear-round.Atypicalcapacityfactoris50%,whichrepresents acompromisebetweenthedesiretoutilizeallthehydroenergyavailableintheriverflowandthe necessitytolimitthecapitalcostsofdoingso.
Hydroplantshaveindefinitelylong,usefullives.Thecivilworksandpower-generatingmachineryareveryrobust,andoperatingexpensesareverylow.Manylargehydropowerplantshave beenconstructedbynationalgovernments,andtheircosthasbeenpaidinpartfromgovernment revenuesaswellasbyelectricityconsumers.Theconstructionofthedammayprovidebenefits otherthanelectricpower,suchaswaterforirrigationorfloodcontrol,thatreducethecostsallocated toelectricityproduction.Nevertheless,therearehydropowersitesthatcanbedevelopedthatare economicallycompetitivewithfossilfuelpowerplants.
Hydropowerplantscanhavesevereenvironmentaleffects.Whereareservoirisformedbehinda dam,aquaticandterrestrialecosystemsaregreatlyaltered.Downstreamofthedam,theriverine flowisaltered,interferingwiththeecosystemsthathaveadjustedtothenaturalvariableriver flowpattern.Thereservoirinterruptsthenaturalsiltationflowintheriveranditscontributionto alluvialdepositsdownstream.Thefloodingoflandthatpreviouslyservedforagricultureandhuman habitationmaybeasignificantsocialandeconomicloss.Theconstructionofdamsinterfereswith themigrationofanadramousfishandadverselyaffectstheirpopulations,evenwherefishladders areemployed.Currently,removalofU.S.hydropowerdamsinthePacificnorthwestandMaine havebeenrecommendedtoreviveendangeredsalmonfisheries.
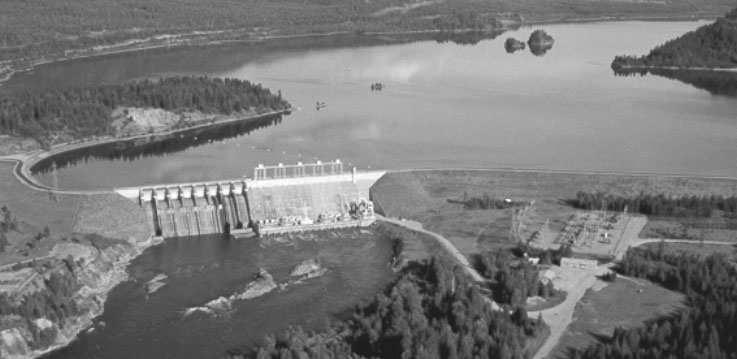
Untiltheonsetoftheindustrialrevolutionledtotheexploitationoffossilfuels,woodwasthe principalfuelavailabletohumans,beingusedforcookingandspaceheating.Inmanydeveloping nationstoday,woodsuppliesuptohalfoftheenergyconsumption,whichisverylowonapercapita basis.Woodcrops,arenewableresource,replacethemselvesevery50–100years.Theamountof non-food-producinglandavailableforenergycrops,likewood,isinsufficienttosupplantentirely currentfossilfuelconsumption.Nevertheless,avarietyofagriculturalandsilviculturalcropsor theirbyproductscancontributetoenergysuppliesandtherebyreplacesomefossilfuelconsumption.
Anotherformofbiomassthatcanbeconvertedtoausefulfuelisanimalwaste.Digesters cangeneratemethanefromfarmanimalorhumanwastes,withtheresidueofthisprocessbeing suitableforcropfertilizing.Organicmatterinmunicipalwastelandfillsgeneratesmethaneinan uncontrolledprocessthatcansupplylowheatingvaluegas.
IntheUnitedStatesin1997,biomassprovided29%ofrenewableenergyand1.25%oftotal energy.Italsocontributed13%ofrenewableelectricpowerand1.7%ofallelectricpower.
Organicmatterinterrestrialplantsandsoilis,amongotherthings,atemporarystoragesystem forsolarenergy.TheconversionofatmosphericCO2 andH2Otoorganicmatterbyphotosynthetic reactionsinplantsstorestheenergyofvisiblelightfromthesunintheformofchemicalenergy oftheorganicmatter.Thelattermaybeutilizedinthesamemannerasfossilfuels,releasingCO2 backtotheatmosphere.ThusnonetemissionsofCO2 totheatmosphereresultfromthiscycle. However,theefficiencyofconversionofsolarradiationtobiomassenergyisverylow,lessthan1 %,withtheterrestrialaverageenergyconversionrateamountingto0.5W/m2 .
Thefoodenergystoredinagriculturalcropslikegrainsisonlyafractionofthatintheentire cropmass,sothatagriculturalcropresiduesarepotentialsourcesofbiomassenergy.Ithasbeen estimatedthatcropandforestresiduesintheUnitedStateshaveaheatingvalueequalto12%of fossilfuelconsumption,butonlyaboutone-fifthofthisisreadilyusable.3 Theenergyrequired tocollect,store,andutilizethisresiduefurtherreducestheamountofenergyavailablefromitto replacefossilfuels.Furthermore,cropresiduesareoftenusedtobuildsoilmassandfertilityby composting,duringwhichsome,butnotall,oftheresiduecarbonisreleasedtotheatmosphereas CO2.Usingresiduesasfuelreducestheamountofcarbonuptakeinsoil.
Theoverallphotosyntheticprocessbywhichwaterandcarbondioxidearecombinedtoform carbohydratemoleculesinplantsmaybesummarizedas
Thefirststepofthisoverallprocessisthephotosyntheticone,inwhichsolarradiationprovides theenergyneededtostarttheprocessthatendsintheproductionofcarbohydrates,suchassugar, starch,orcellulose.Subsequentstepsdissipatesomeofthatenergy,storingtherestinchemical form.Theprocessofconversionofsolarenergyintobiomassiscalledprimaryproduction.All livingsystemsdependultimatelyuponthisprocesstomaintaintheirviability.
Agriculturalcropssupplyhumanswithfoodandmaterials(e.g.,lumber,paper,textiles)as wellasenergy.Onanenergybasis,thepricetoconsumersofthesecommoditiesexceedsthatof fossilfuels,oftenbyaconsiderableamount.Tocompeteeconomicallywithtraditionalagricultural commoditiesforscarceagriculturalresources,biomassenergysuppliesmustuseotherwiseundervaluedbyproductsandwastestreamsorefficient,lowcapitalizationfacilitiesthatconvertprimary biomasstohighervaluefuels.
Theprincipalprocessesthatutilizetheenergycontentofprimarybiomassareasfollows:
• Combustion
• Gasification
• Pyrolysis
• Fermentation
• Anaerobicdigestion
Woodyplantsandgrassescanbeburneddirectlyinstoves,furnaces,orboilerstoprovidecooking, space,orprocessheatandelectricpower.Alternatively,biomassmaybeconvertedtoagaseous fuelcomposedofH2 andCOinathermalprocessthatconservesmostofitsheatingvalue,withthe fuelbeingcombustibleinboilersandfurnaces.Pyrolysis,thethermaldecompositionofbiomass,
producesacombinationofsolid,liquid,andgaseousproductsthatarecombustible.Fermentationanddistillationofcarbohydratesproducesethanol(C2H5OH),avaluableliquidfuelthatis commonlyblendedwithgasolineformotorvehicleuse.Anaerobicdigestionproducesagaseous mixtureofCO2 andCH4.Thegaseousfuelscanbeupgradedtomoredesirableforms,albeitat somelossofenergy.
Theprocessingofbiomasstoaformthatismorereadilyusedasareplacementforfossil fuelinevitablyresultsinalossofsomeofitsheatingvalueandgeneratesaproductioncostof theconversion.Tocompeteeconomicallywithfossilfuels,whichhavesmallprocessingcosts, biomass-derivedfuelsmustutilizelowcostformsofprimarybiomass.
Exceptforwood,whichmaybeharvestedyear-round,biomassenergycrops,likefoodcrops, mustbestoredafterharvestingtoprovideasteadysupplyoffeedstockfortheremainderofthe year.Theeconomiccostofstorageandmaintainingayear’sinventoryaddstothepricedifferential betweenbiomassandfossilfuels,whichhavemuchsmallerinventories.
Duringthe1970s,wheninternationaloilpricesskyrocketed,manyagricultural-based,biomassderivedliquidfuelproductionschemeswereinvestigated.Ofparticularinterestwastheenergygain factor,theratiooftheenergyvalueofthefuelproduced(usuallyethanol)totheenergyconsumed inproducing,harvesting,andprocessingthebiomass.Notonlymustthisratioexceedunity,sothat thereisanetoutputofenergyfromthebiomassconversionprocess,butitmustbesufficientlygreater thatother,non-energycostsofproductioncanbecoveredbythesalesrevenuesgenerated.4 Such requirementscouldonlybemetbyutilizingahigh-energycroplikesugarcaneandincorporating theenergysupplyofthecropresidueintothefuelsynthesisprocess.Currently,theseenergyand economicconstraintsmakefuelsderivedfrombiomassfoodcrops,suchasgrainsorsugarcane, noncompetitivewithfossilfuelsatcurrentworldmarketprices.
Asanexample,intheUnitedStates,corniscurrentlyemployedasafeedstocktomanufacture ethanolforuseasanadditiveinmotorvehiclefuel.Inthefermentationanddistillationprocessthat convertscornstarchtoethanol,only65%ofthegrainheatingvalueispreservedintheethanol outputfromtheprocess.5 Inaddition,fossilfuelisconsumedintheproductionandharvestingof cornandtheproductionofethanol.Asaconsequence,useofethanolasavehiclefueladditive resultsinonlya50–60%reductioninfossilfuelenergyuseanda35–46%reductioningreenhouse gasemissions,comparedtotheuseofordinaryvehiclefuel.6 Thustheenergygainfactorfor corn-generatedethanolis2–2.5.7
Theuseofwoodharvestingresiduestogenerateprocessheatandelectricpowerinpapermills, eliminatingtheiruseoffossilfuels,isnowcommoninthepaperindustry.Theresiduesarecollected alongwiththewoodusedtofeedthepulpingoperation.Whiletheresiduessupplysomeorallofthe mill’senergyrequirements,thereisgenerallynosignificantsurplusthatmightotherwisegenerate electricpowerforotherpurposes.(Thesameistrueforwoodharvestedforlumber.)Incontrast
5Probstein,RonaldF.,andR.EdwinHicks,1990. SyntheticFuels. Cambridge:pHPress.
6Wang,M.,C.Saricks,andM.Wu,1999. J.AirWasteManage.Assoc. 49, 756–772.
7Theheatingvalueofabushelofcornisabout400MJ.Atanaveragepriceof$3perbushel,thisenergycosts about$8permillionBtu.Averagepricesofcoalandnaturalgasinthe1990swereabout$1.25and$3per millionBtu.
tothisuseofanotherwisevaluelessbyproduct,electricpowerplantsfueledbywoodharvested forfuelonlypurposeshavebeenconstructed.Theharvestingandtransportationcostsofthewood fuelfortheseplants,addedtothemarketvalueofthewoodcomponentaspulpfeedorlumber(in contrasttotheresiduecomponent),generatesacostlyfuelandmakestheseplantsuneconomical comparedwithfossilfuelpowerplants.8
Figure7.3showsagasifierthatconvertswoodwastetogaseousfuelforuseinanelectric powerplant.Byconvertingfromasolidtoagaseousform,thefuelcanbeusedinacombined cyclepowerplant,doublingthethermalefficiencyofabout20%obtainedinconventionalwood burningpowerplants.
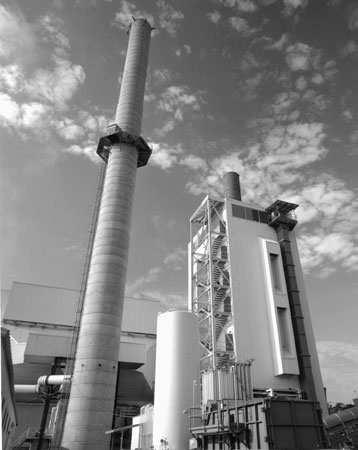
Theuseofcropsortheirresiduestosupplyfueltoreplacefossilfuelcreatesenvironmental impactssimilartothoseassociatedwithagricultureandsilviculture:consumptionofmanufactured fertilizers,spreadingofpesticidesandherbicides,soilerosion,consumptionofirrigationwater, andinterferencewithnaturalecosystems.Airemissionsfromthecombustionofbiomassfuelsare notalwayslessthanthosefromthefossilfuelstheyreplace.
Fossilfueldeposits,whichformthebulkoftheworld’scurrentenergysupply,aretheresidueof biomassformedmillionsofyearsago,inwhichsolarenergywasstoredinlivingmatter.Made accessiblebyindustrialtechnology,fossilfuelisthemosteasilyandcheaplyexploitableformof energy.Buttheenergystoredinthehotinterioroftheearthisvastlygreaterinmagnitudeandis potentiallyexploitable,yetisalmostentirelyinaccessible.Thisenergyiswhatremainsfromthe gravitationalcollapseoftheinterplanetarymaterialfromwhichtheearthwasformed.
Theearth’sinteriorconsistsofacoreofmostlymoltenmaterialatatemperatureofabout 4000 ◦C,extendingtoalittlemorethanhalfanearthradiusandsurroundedbyamantleofdeformablematerial.Theouteredgeofthemantleiscoveredbyacrustofsolidmaterial,ofthickness between5and35km.Withinthecrustthereisanoutwardflowofheatfromtheearth’sinteriorof approximately50mW/m2 whichisaccompaniedbyatemperaturegradientofabout30K/km.9 No practicalusecanbemadeofsuchafeebleflowofheatunlessitcanbesubstantiallyamplified.By drillingwellstodepthsof5–10kmandpumpingfromthemwaterorsteamheatedto200–300 ◦C, enoughheatmaybeextractedtogeneratehundredsofmegawattsofelectricalpowerinasingle geothermalplant.
Themosteconomicalsitesatwhichtodevelopgeothermalenergyarethosewherethesubsurfacetemperaturesarehighestandundergroundwaterandsteamdepositsareclosesttothesurface. Suchsitesarefoundmostlyatthebordersoftheearth’stectonicplates,nearactiveorrecently inactivevolcanos,hotsprings,orgeysers.Favorablesitesofthistypeoccupyonlyasmallfraction oftheearth’slandarea.
Theprincipalcountriesthathaveinstalledgeothermalelectricalpowergenerationsystems arelistedinTable7.4,togetherwiththeamountsofinstalledelectricalpower.Oftheworldtotal
TABLE7.4 InstalledElectricalandThermal PowerofGeothermalSystemsin1993a ElectricalThermal Country(MW)(MW)
UnitedStates2,594463
Phillipines888—
Mexico7528
Italy637360
NewZealand285258
Japan2703,321
Indonesia144—
ElSalvador105—
Other2406,802
Total5,91511,204
a DatafromDickson,MaryH.,andMarioFanelli,Eds.,1995. GeothermalEnergy. Chichester:JohnWiley&Sons.
9
ofnearly6000MW,theUnitedStatesaccountsfor44%,mostofwhichislocatedinnorthern California.In1977,theaveragecapacityfactorforU.S.geothermallygeneratedelectricity was15.6%.
Geothermalheatisrecoveredinmanylocationswherethereservoirtemperatureisinsufficient foreconomicalpowergenerationbutwherethelow-temperatureheatmaybeusedforspaceheating orindustrialprocessing.Theheatrecoverycapacityofthistypeofgeothermalenergysupplyislisted inthelastcolumnofTable7.4.Assuminganaveragethermalefficiencyof20%forgeothermal electricpowergeneration,thefiguresinTable7.4suggestthatnearlythree-quartersoftheworld’s geothermalheatrecoveryisusedtogenerateelectricity.
AtypicalgeothermalelectricpowerplantissketchedinFigure7.4.Aproductionwellsupplies pressurizedwarmwater,awaterandsteammixture,oronlysteam,dependinguponthetemperature andpressureconditionsintheundergrounddeposit.Thisfluidisfedtoaseparator,wheresteam isseparatedfromliquid.Theliquidwaterispumpedbackintothegroundviaaninjectionwell, whilethesteamisfedtoalow-pressureturbinethatgenerateselectricalpower.Theturbineexhaust steamiscondensedinacondenser,wherecoolwaterfromacoolingtowerremovesheatfromthe exhauststream.Thecondensedsteamisreinjectedintotheground.Thesesystemstypicallysupply steamat160–180 ◦Candapressureof0.6–0.9MPaandhavethermalefficienciesof20–25%. MoreelaboratesystemsthanthatshowninFigure7.4,whichimprovethethermalefficiency,have beenconstructed,albeitathighercapitalcost.10
Ageothermalplanttransfersheatfromahotundergroundreservoirtotheearth’ssurface, whereitcanbeprofitablyutilizedtoproduceelectricalpowerorforotherheatingpurposes.Ifit istobeasourceofrenewableenergy,thisheatmustnotberemovedatafasterratethanitcanbe replenishedbyconductionfromdeeperintheearth.Intheregionswheregeothermalresourceshave
beendeveloped,thisheatfluxisoftheorderof0.3W/m2 = 3E(5) W/km2.A100-MWpowerplant wouldrequireageothermalfieldof1700km2 toensureasteadysourceofhotfluid.Mostcurrent geothermalplantsremoveheatatmorethan10timesthereplenishableratesoastoreducethe costofcollectingandreinjectingthehotfluid.Consequently,theundergroundreservoirsforthese plantsisslowlybeingcooleddown,butthiscoolingisnotsignificantovertheusefuleconomiclife oftheplants.
Theproblemofdevelopinganeconomicalgeothermalresourceissimilartothatfordevelopingapetroleumornaturalgasresource.Areservoirofundergroundwaterofsufficientlyhigh temperaturemustbelocatedatdepthsthatareaccessiblebydrillingwells.Itmustbesufficiently largetosupplytherequiredheatforaperiodof40yearsormore.Theresistancetounderground fluidflowtoandfromthesupplyandinjectionwellsmustbelowenoughtoproducethevolume flowofhotfluidneededfortheplantwithoutrequiringexcessivepumpingpower.Forthesereasons itisnevercertainthatapromisingresourcecanbedevelopeduntilsufficientexploratorydrilling andtestinghasbeenconducted,whichaddstothecostsofgeothermalplants.
Analternativegeothermalsystem,knownas“hotdryrock,”wouldutilizeimpermeablerock formationslackingundergroundwater,amorecommongeologicalconditionthatwouldgreatly increasethepotentialavailabilityofgeothermalenergyinproximitytoprospectiveusers.Theplan istofracturetheformationsurroundingtheproducingandinjectionwellsbyhydraulicpressurizationorexplosives.Thiswouldprovidesufficientpermeabilitytoenablethepumpingofwater betweenthewells,heatingitbycontactwiththehotrock.Sofar,exploratoryattemptstodevelop thesesystemshavefailed,forvariousreasonsrelatedtotheestablishmentofasatisfactoryproductionpotential.Itappearsthatthecostofcreatingapermeable,water-filledundergroundresource equivalenttothenaturalonesthathavealreadybeenorcanbeexploitedistoogreat,usingcurrent technologyandgeologicaldevelopmentpractices.Theeconomicsofthesesystemsispresently unfavorabletotheirdevelopment.
Onerecentdevelopmentthatutilizestheheatstoragecapacityofanundergroundaquiferis calledthegeothermalheatpump.Inthissystem,waterfromawellsuppliesheattoaheatpump thatthenreleasesagreateramountofheattoabuildingspaceduringcoldweather.Becausethe wellwateriswarmerthantheambientwinterair,theheatpumpproducesmuchmoreheatper unitofelectricalworkrequiredtorunitthanwouldbethecaseiftheheatpumpusedcoldwinter ambientairasitsheatsource.11 Inclimateswhereairconditioningisneededinsummertime,this samesystemcanbereversedtodeposittheheatrejectedbytheairconditionertothewellwater, whichismoresavingofpowerthanrejectingittothehotsummerambientair.Thissystemis practicalonlyforcentralairconditioningandheatpumpsystemsandtheninvolvestheadditional expenseofwelldrilling.Dependinguponthepriceofelectricity,thesavingsinpowermayrepay theadditionalinvestment.
Geothermalfluidscontaindissolvedsolidsandgasesthatmustbedisposedofsafely.Thesolids arereturnedtotheundergroundreservoirinthereinjectedfluid.(Withoutreinjection,thedischarge ofgeothermalwatertosurfacewaterswouldadverselyaffectwaterqualityandpossiblyproduce subsidenceinthegeothermalfield.)Ofthedissolvedgases,someofwhichmustberemovedfrom
thecondenserbysteamejectors(anenergyloss),hydrogensulfide,sulfurdioxide,andradon,all ofwhicharetoxictohumans,mustbesafelyvented.
Aprodigioussourceofradiantenergy,thesunemitselectromagneticradiationwhoseenergyflux perunitarea,called irradiance, decreasesasthesquareofthedistancefromthesuncenter.Atthe meansun–earthdistanceof1.495E(8)km,thesolarirradianceis1367W/m2 . 12 Thesun’slight isnearly,butnotexactly,parallel;thesun’sdisc,viewedfromtheearth’smeanorbit,subtendsa planeangleof9.3E( 3) radian = 31.0minutesandasolidangleof5.40E( 6) steradian.Itisthis energystreamfromthesunthatmaintainstheearthatalivabletemperature,farabovethecosmic backgroundtemperatureof2.7Kthatwouldexistifthesun’sirradiancewerezero.
Notallofthissolarradiationreachestheearth’ssurface.Someisreflectedfromtheearth’s atmosphericgasesandclouds;someisabsorbedbyairmolecules(principallyoxygen,carbon dioxide,watervapor,andozone),clouds,andatmosphericdust;someisscatteredbyairmolecules anddust.Asaconsequence,onlyafractionofthesolarirradianceimpingingontheearth’satmosphere(calledthe extraterrestrialirradiance)actuallyreachesgroundlevel.Ofthatfraction,some retainsitssolardirection,called beamirradiance, whiletheremainder,called diffuseirradiance, hasbeenscatteredthroughlargeangles,approachingthegroundfromdirectionsquitedifferent thanthatofthesun.13 Ofthesunlightreachingtheground,someisabsorbedandtherestreflected upward,withthelatterundergoingscatteringandabsorptionintheatmosphereonitswayoutto extraterrestrialspace.14
Thesolarradiationapproachingtheearthcomprisesawidebandofwavelengths,butmost (94%)oftheradiantenergyliesbetween0 3and2 µminwavelength.ThedistributionoftheextraterrestrialsolarirradianceamongitsvariouswavelengthsisshownasadashedlineinFigure7.5. Themaincomponentsofthesolarspectrumaretheultraviolet(< 0 38 µm),thevisible(0 38 µm to0 78 µm),andtheinfrared(> 0 78 µm).Theenergycontentoftheseportionsare6%,48%,and 46%ofthetotalirradiance,respectively.Theenergyofanindividualphoton,thequantumpacket ofelectromagneticradiation,isproportionaltoitsfrequencyandhenceinverselyproportionaltoits wavelength.Ultravioletphotons,havingshorterwavelengthsandhencehigherindividualenergies thanvisibleorinfraredphotons,arepotentiallymoredamagingtolivingorganisms,eventhough theiraggregateshareofsolarenergyismuchsmaller.
12Becausetheearth’sorbitaroundthesunisellipticalratherthancircular,thesolarirradiancevariesby ±3.3% =±45.1W/m2 duringtheyear,beingamaximumonDecember26andaminimumonJuly1,when theearthisclosestandfurthestfromthesun,respectively.
13Atmosphericmoleculesscatterbluelightmorethanredlight,makingaclearskyuniformlyblueand sunsetsred.
14Asmallportionofabsorbedincomingsunlightcausesphotochemicalreactionsintheatmosphere,mainly ozoneformationinthestratosphereandsmogformationinthelowertroposphere.Also,someofthegroundlevelincidentradiationabsorbedbyplantsresultsinphotosynthesis.Nevertheless,thesolarenergyinvestedin chemicalchangeintheatmosphereandplantsistinycomparedtotheheatingoftheatmosphere,hydrosphere, andgeospherebyabsorbedsunlight.
Theportionoftheincomingbeamirradiancethatisabsorbedorscatteredbytheatmosphere dependsuponthewavelengthoftheincominglight.Scatteringpredominatesforshortwavelengths (blue),andmolecularabsorptionpredominatesforlongwavelengths(red).Thenetbeamirradiance atgroundlevel—thatis,whatremainsafterscatteringandabsorption—isshownasasolidline inFigure7.5.Thesharpdipsinspectralirradianceintheredandinfraredregionsarecausedby molecularabsorptionbycarbondioxide,watervapor,andozone(whicharegreenhousegases), whiletheultravioletabsorptioniscausedbydiatomicoxygenandozone.Underthebestofconditions,foraclearskyandthesunoverhead,about80%oftheextraterrestrialbeamirradiance reachestheearth’ssurface.
Thedistinctionbetweenbeamanddiffuseradiationisimportanttothedesignandfunctioning ofsolarenergycollectionsystems.Ifthecollectorisaflatsurfaceexposedtothesky,itwillcollect bothbeamanddiffuseradiation.Butifanopticalfocusingsystemisusedtointensifythesolar radiationimpingingonthecollector,onlybeamradiationiscollected,whichisalesseramount thanthetotalofbeamanddiffuse.Theproportionsofbeamanddiffuseradiationdependupon theamountofcloudcover,withaclearskyprovidingmostlybeamradiationandaheavycloud coverresultinginentirelydiffuseradiation.15 Summedoverdaytimeperiods,thisrelationshipis exhibitedinFigure7.6.Theabscissaistheratioofdailytotalsolarradiationonahorizontalflat platetotheextraterrestrialvalueandiscalledthe clearnessindex, whiletheordinateistheratioof thedailytotaldiffuseradiationtodailytotalradiation.Astheskybecomeslessclear,Figure7.6 showsthatboththebeamanddiffuseradiationdecrease,buttheformerdecreasesproportionately faster.Focusingsystemscollectlittleenergyoncloudydays.
Theamountofsolarenergyfallinguponasolarcollectordependsuponitsorientationwith respecttothesun’sdirection,asviewedfromtheearth’ssurface.Thesolardirectionvarieswith thelocalhourofthedayandthedayoftheyear.Fixedcollectorsremaininthesameposition year-round.Commontypesoffixedcollectorsarehorizontal(e.g.,solarpond),tiltedatanangle
abovethehorizontal,andvertical(windows).Ontheotherhand,focusingcollectorsmaymove intheverticalandazimuthaldirectionstodirectthecollectoraperturetobenormaltothesolar direction.Eachtypeofcollectorreceivesadifferentamountofsolarenergy.
Table7.5liststheclear-daysolarirradianceat40 ◦Nlatitude16 incidentuponfourcommon typesofcollectors:ahorizontalsurface(firstcolumn);asouth-facingflatplatetilted40 ◦ above thehorizontal(secondcolumn);averticalsouth-facingsurface(thirdcolumn);andafocusing collectorthatisorientedbothverticallyandhorizontallytocollectdirect(orbeam)irradiance (fourthcolumn).Thedailytotalofenergyincidentuponthesecollectorsislistedintheupperpart ofthetableforfourdaysoftheyear:thespringandfallequinoxes(21Marchand21September) andthesummerandwintersolstices(21Juneand21December).Ontheequinoxialdaysthesun’s positionintheskyisessentiallyidentical,whilethesolsticesmarktheannualextremesinsolar irradiance.Thelowerhalfofthetableliststhemaximumhourlysolarirradiance,whichforthe collectorsselectedoccursatlocalnoon.Theannualaveragevalueoftheseitemsisalsolistedin thetable.
Severalimportantconclusionsaboutclear-skysolarirradiancemaybedrawnfromtheentries inTable7.5.Forthehorizontalcollector,thesummerdailytotalismorethanthreetimesthe wintervalue.17 Bytiltingthecollectorto40 ◦,thedifferencebetweensummerandwinterismuch reduced,toaratioof1.5:1,sothatthedailytotalismorenearlyuniformyear-round.Foravertical
16Thisisthemedianlatitudeforthelower48U.S.states,whichgenerallyliebetween30 ◦ and50 ◦Nlatitude. Alowerlatitudewillexperienceagreatersolarirradianceandalesservariabilitybetweensummerandwinter, andviceversaforahigherlatitude.
17Thedailyirradianceonahorizontalsurfacemaintainsthesurfaceatmospherictemperaturelevel.The differencebetweensummerandwinterirradianceaccountsinpartfortheatmospherictemperaturedifference betweentheseseasons.
collector,suchasawindow,thewinterdailytotalirradianceismuchgreaterthanthatinsummer, makingasouth-facingwindowagoodsourceofwinterspaceheatandasmallsourceofsummer air-conditioningload.Thefocusingcollector’sdailyirradianceisabout30%higherthanthetilted flatplate,whichmaybehardlyenoughinitselftojustifythecomplicationofmovingthecollector totrackthesun.Onanannualaveragebasis,thereisonlyafactoroftwodifferencebetween thegreatestandleastvaluesofthedailytotalsforthevariouscollectorsofTable7.5.Similar distinctionsapplytothemaximumnoontimehourlyirradiance,listedinthelowerhalfofTable7.5. Undermostcircumstances,thesevaluesliewithintherange800–1000W/m2,or60–75%ofthe extraterrestrialirradianceof1367W/m2 .
ThevaluesofTable7.5applyonlytoclear-skyirradiance.Theeffectofcloudsandatmospheric dustwillreducetheavailableirradiancetolesservalues.Figure7.6illustrateshowcloudiness, inreducingtheirradianceonahorizontalsurface,hasagreatereffectonbeamirradiancethan doesdiffuse,orscattered,light.Theaveragevalueoftheclearnessindex,theratioofdailytotal irradiancetotheextraterrestrialvalue,varieswithgeographiclocationandseasonoftheyear.As aconsequence,seasonalorannualaverageirradiancescanbeaslowashalfofthevaluesshown inTable7.5.
Aswillbeseenbelow,onlypartoftheincidentsolarenergyfluxcanbecollectedbyawelldesignedcollectorsystem.Whileacollectorcanabsorbahighfractionofthesolarirradiance,it alsolosesheattotheambientatmosphere,themoresoasitattemptstostorethecollectedenergy atatemperaturehigherthanatmospheric.Practicalsolarcollectorsmayaveragebetween5and 10MJ/m2 ofcollectedenergyperdayattypicalU.S.locations,or2to4GJ/m2 peryear.Ifthis energyweretobevaluedmonetarilyasequaltothatfortheheatingvalueoffossilfuel,which currentlyisintherangeof3–5$/GJ,thenthedollarvalueofthecollectedenergywouldbe6–20$/m2y.Ontheotherhand,ifitwerevaluedasequaltotheretailpriceofelectricenergy,which isabout30$/GJ,thentheannualvalueofthecollectedsolarenergywouldbe60–120$/GJ.Itis forthisreasonthatsolarcollectorsareeconomicallyadvantageousiftheyreplaceelectricityfor theheatingofdomestichotwater.
Themostcommonandeconomicalformofsolarthermalenergycollectoristheflatplatecollector, illustratedinFigure7.7.Itconsistsofathermallyconductingcollectorplateequippedwithpassages throughwhichaheattransferfluidpasses,transferringheatfromthecollectorplatetoafluid storagetank.Thecollectorplatesurfacefacingtheincomingsunlightistreatedtoabsorbasmuch ofthatsunlightaspossible.Atransparentcover(usuallyglass)isplacedparalleltothecollector plate,forminganenclosedspacethatreducestheheatlosstothesurroundingatmosphere,whose temperature Ta islessthanthatofthecollectorplate, Tc Oftheincomingsolarirradiance I thatfallsonthecoverplate,someisreflectedandabsorbed bythecoverplate,andonlyaportionofwhatistransmittedthroughthecoverplateisabsorbedby thecollectorplate.Overall,ifthefractionoftheincomingsolarirradiance I thatisabsorbedbythe collectorplateis β,thenthesolarheatfluxtotheplateis β I . 18 Thewarmcollectorplatewilllose heattothesurroundingatmospherebyheatconduction,convectionandradiationataratethatis proportionaltothetemperaturedifference Tc Ta betweentheplateandtheambientatmosphere. Theproportionalityconstant U,calledtheoverallheattransfercoefficient,dependsinpartupon theheattransferpropertiesofairandtheradiantheattransferpropertiesofthecollectorandcover plates.Asaconsequence,thenetunitheatflux q thatiscollectedinthestoragesystemisthe differencebetweentheabsorbedirradianceandthelosstotheatmosphere:
Notethatthehigherthetemperatureofcollection,thesmallertheamountoftheheatcollected, 18Thevalueof β dependsupontheangleofincidenceoftheincomingsolarradiation,therefractiveand transmissivepropertiesoftheglasscoverplate(seeFigure7.7),andtheabsorptivepropertiesofthecollector surfaceforsolarwavelengths.Forthebestdesigns,about80%oftheincidentsolarradiationisabsorbedby thecollectorplate.
therebeingamaximumcollectortemperature (Tc)max atwhichnoheatiscollected:
Thefractionoftheincidentirradiancethatiscollected, q/I ,iscalledthecollectorefficiency η:
Thecollectionefficiency η isalinearlydecreasingfunctionoftheratio U (Tc Ta )/I ,andthe heatcollectionrate q decreaseswithincreasingcollectortemperature.Themaximumcollector efficiencyis β whenheatiscollectedatambienttemperature.Theefficiencyfallstozerowhen thecollectortemperaturereaches (Tc)max .Eitheroftheselimitsofoperationhasnopracticalvalue becauseeithernoheatiscollectedoritiscollectedatambienttemperature,whichhasnouseful function.Practicalcollectorsystemswillfunctionatintermediateconditionswhere η<β and Tc <(Tc)max
Flatplatecollectorsoperateatlowerefficiencyinwinterthaninsummer.Whenweusetypical collectorvaluesof β = 0.8and U = 5W/m2K,winterandsummerclear-daynoontimevalues of I = 870W/m2 , Ta = 70 ◦F(21 ◦C), I = 910W/m2,and Ta = 32 ◦F(0 ◦C),andacollector temperatureof Tc = 140 ◦F(60 ◦C)suitablefordomesticwaterheating,thecorrespondingwinter andsummercollectorefficienciesare ηw = 45.5%and ηs = 58.6%.Atotherhours,where I is lessthanthesenoontimevalues,thecollectorefficiencieswillbeless.Thiswillalsobethecase whentheskyiscloudy.Year-roundcollectorefficienciesarelikelytobeintherangeof30–50%.
Becauseofthevagariesofsolarirradiancefromdaytoday,asolarcollector,nomatterhowbig, cannevercompletelysatisfythedemandforyear-roundheatfordomestichotwaterorspaceheating, andabackupsupplymustbeavailableforsatisfactoryoperation.Therelationshipbetweenannual heatcollectionandcollectorareaissketchedinFigure7.8(a).Averysmallcollectoraccumulates onlyasmallamountofheat,whereasanoversizedonecollectsenoughheattomeetthedaily demandonallbutafewverycold,cloudydays,whenauxiliaryheatmustbesupplied.Thecapital costofacollectorsystemisplottedinFigure7.8(b),showinghowthecostincreaseswithcollector area,butisfiniteforsmallareasbecausethestorage,piping,andcontrolsystemneededconstitute
anirreduciblecost.Anoptimumdesignwouldminimizetheratioofcosttoheatcollectionand wouldhaveanareaintermediatebetweenasmallandlargevaluebecausetheseextremeshave eithersmallheatcollectionorlargecost,makingtheratiolargerthantheoptimum.
Thepurposeofemployingfocusingsolarcollectorsystemsistoincreasetheintensityofthesolar radiationfallingonthecollector,therebymakingitpossibletocollectsolarenergyatahigher temperatureandwithasmallercollectorareathanforasimpleflatplatesystem.Thefactorby whichthesolarirradianceisincreasediscalledtheconcentrationratio, CR.
TheprincipleoflightconcentrationissketchedinFigure7.9.Acurvedparabolicmirrorwhose axispointsinthesun’sdirectionwillformanimageofthesunatitsfocalpoint,adistance F from themirrorcalledthefocallength.Theimagedimension Di isequaltotheproductofthefocal length L andthesmallplaneangle α = 9.3E( 3) radianthatthesunsubtendswhenviewedfrom theearth.Theratioofmirrordimension Dm toimagedimension Di isthusfoundtobe
Foranordinarymirrorofcircularshapethatformsanimageasdoesacamera(calledspherical),the concentrationratioisequaltotheratiooftheareaofthemirrortothatoftheimage,or (Dm /Di )2 . Foracylindricalmirror,whichfocuseslightonlyinonedimension,theconcentrationratiois (Dm /Di ).Thus
Incameralenses,theratiooffocallengthtolensdiameteriscalledthe fnumber.Thesmallerits value,thegreateristhelens’lightgatheringpower,orconcentrationratio,permittingfilmexposure indimlightingconditions.Forfocusingsolarcollectors,itisnotpracticaltoconstructmirrorswith F/Dm lessthanabout2.
Thecollectorsforfocusingsystems,whichoperateathighertemperatures,areofdifferent designthanthoseforflatplatesystems.Nevertheless,theircollectionefficiencyandmaximum
temperatureobeythesamerelationshipsofthatofequations(7.4)and(7.3),butwiththecollector irradianceincreasedbythefactor(CR):
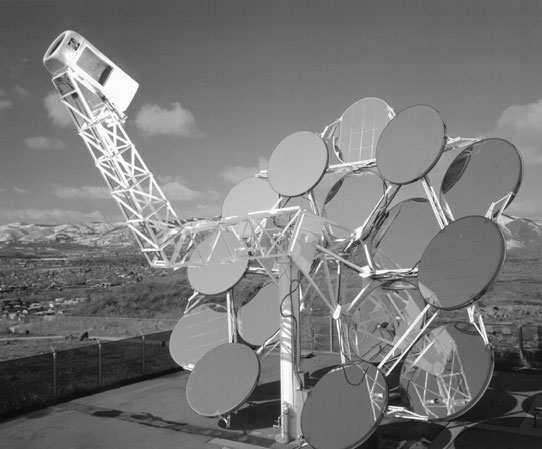
inwhich CR istobetakenfromequation(7.6),andtheabsorbedlightfraction β andheattransfer coefficient U arethoseforthefocusingsystemcollector.Itshouldalsobenotedthat I isthesolar beamirradianceanddoesnotincludethediffuselight,whichcannotbefocusedbythemirror.But giventhelargevaluesoftheconcentrationratio CR thatareavailabletofocusingsystems,theycan operateathighefficiencyevenwithhighcollectortemperatures.
Focusingsystemscollectsolarenergyatasufficientlyhightemperaturetousethatenergyin aheatenginecycletogenerateelectricpowerefficiently.Figure7.10showsasphericalfocusing systemconsistingofindividualmirrorsattachedtoamovableframewhoseopticalaxistracksthe sun’spositioninthesky.ThemirrorsfocusonaSterlingcycleheatenginethatgenerates25kWof electricalpower,withabout24%ofthesolarbeamirradiancefallingonthemirrors.Analternative sphericalsystemisshowninFigure7.11whereindividualmirrorsarrayedaboutacentralfocusing axiseachtrackthesun’smotionsoastofocusthesun’simageonacollectoratthetopofacentral tower.Inthissystem,twomegawattsofelectricalpoweraregeneratedinaRankinecycleengine thatisheatedbyhotfluidcirculatingthroughthecollectoratthetower’stop.Acylindricalcollector systemcanbeseeninFigure7.12,wherethecollectorisapipethroughwhichfluidcirculates.Nine Californiapowerplantsusingcylindricalcollectorsgenerateatotalof354MWofelectricalpower.
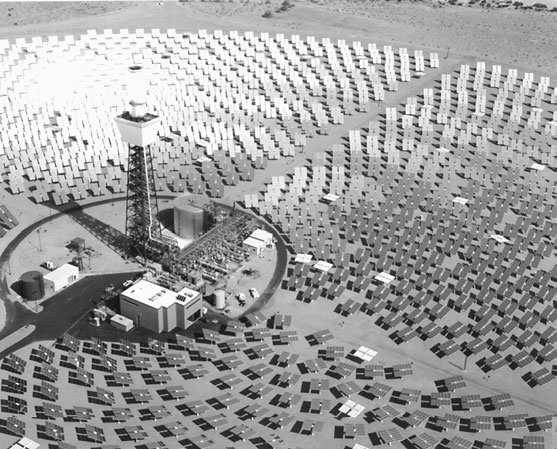
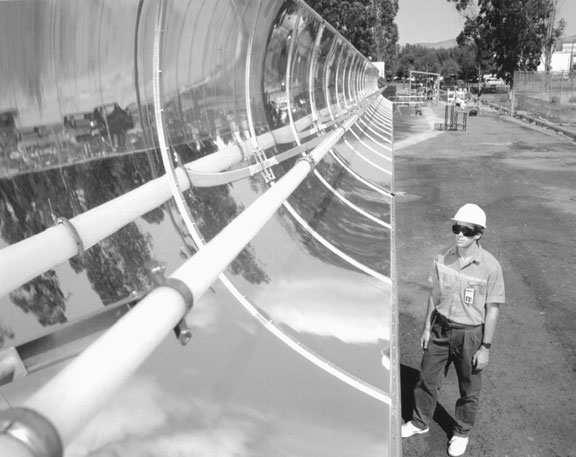
Photovoltaiccellsaresolid-statedevicesthatgenerateelectricpowerwhenirradiatedbysolarlight. Theyprovideanalternativemethodofelectricpowerproductiontothatofsolarthermalsystems generatingelectricpowerbyaheatenginesuppliedwithheatfromasolarcollector.Likesolar thermalsystems,onlyafractionofthesolarirradianceincidentuponasolarcellcanbeconvertedto electricpower.Nevertheless,theirmechanicalandelectricalsimplicity,negligibleoperatingcost, andabilitytoproducepowerinanyquantitymakestheuseofphotovoltaicpowersystemsvery attractive.Amajorobstacletowidespreaduseofphotovoltaiccellsistheircurrenthighcostper unitofpoweroutput.
Theprocesswherebytheenergyfluxinsolarradiationisconvertedtoelectricalpoweris quantummechanicalinorigin.Theenergyofsunlightisincorporatedinpacketsofelectromagnetic radiationcalledphotons,eachofwhichpossessesanenergyofamount hc/λ,where h isPlanck’s constant, c isthespeedoflight,and λ isthewavelengthoflight.Sunlightcontainsphotonsof allwavelengthsandenergies,butmostofthesolarenergycontentliesinthewavelengthrangeof 0.3–2.5 µm(seeFigure7.5).Ifaphotoncandeliverallitsenergytoanelectroninasemiconductor, forexample,itcanmovetheelectrontoahigherenergystateofelectricpotentialmagnitudeequal to hc/eλ,where e istheelectroncharge.Forsolarphotons,thecorrespondingelectricpotential rangeis0.5–2.5V.Iftheenergeticelectroncanflowthroughanelectriccircuitwhileexperiencing thispotentialchange,itcandeliverelectricalenergytoanexternalload.
ThecomponentsofaphotovoltaiccellaresketchedinFigure7.13.Thecellconsistsofa base layerofa p-typesemiconductor,about250 µminthickness,joinedtoanextremelythin emitter layerofan n-typesemiconductorabout0.5 µmthickthatisexposedtothesolarirradiance.Solar radiationisabsorbedmostlyinthethinregionclosetothejunctionofthetwomaterials.Current generatedbythecelliscollectedatpositiveandnegativeelectrodesattachedtotheexteriorof
Figure7.13 Theelementsofaphotovoltaiccellofarea A exposedtoasolarirradiance I andsupplyinga totalcurrent jA toanexternalloadatapotentialdifference V .Thecurrentdensityinthecellis j A/m2
the p-typeand n-typesemiconductorlayers,respectively.Theexternalcircuitthatreceivesthe electricalpowergeneratedbythecellisconnectedtotheseelectrodes.
The n-typeand p-typesemiconductormaterialsconsistofapuresemiconductor,suchas silicon,dopedwithasmallamountofanotherelement.Inthe n-typelayer,siliconisdopedwithP orAs,elementsthatreadilygiveupanelectronfromtheoutershellandaretherebycalled donors. Inthe p-typelayer,siliconisdopedwithBorGa,whichacceptanelectronintotheiroutershell andarecalled receptors.Themobileelectronsinthe n-typelayerandthemobile“holes”inthe p-typelayerprovidechargecarriersthatpermitanelectriccurrenttoflowthroughthecell.Atthe junctionofthetwolayers,thereexistsanelectricpotentialdifferencebetweenthemrequiredto maintainthermodynamicequilibriumbetweenthechargecarriersineitherlayer.
Whensunlightfallsuponthecell,somephotonspenetratetotheregionoftheinterfaceandcan createthereanelectron–holepair,providedthatthephotonenergyequalsorexceedsthegapenergy Eg neededtomoveanelectronfromthevalencebandtotheconductionband;thatis,provided thatthewavelength λ islessthan hc/Eg .Theelectronandholethenmovetothenegativeand positiveelectrodesrespectivelyandprovideacurrentthatmovesthroughtheexternalcircuitfrom thepositivetothenegativeelectrodeswithanaccompanyingelectricpotentialdrop,bothsustained bytheflowofphotonsintothecell.
Intheseprocessesonlyafractionofthesolarenergyfluxisutilizedtocreateelectricalpower tofeedintotheexternalcircuit.Long-wavelengthphotons (λ> hc/Eg ) haveinsufficientenergy tocreateanelectron–holepair,sotheirabsorptionmerelyheatsthecell.Short-wavelengthphotons (λ< hc/Eg ) havemoreenergythanneeded,withtheexcess (hc/λ Eg ) appearingasheating,not electricalpower.Typically,onlyabouthalfofthesolarirradianceisavailabletoproduceelectrical power.Ofthisamount,onlyafractioneventuallyresultsinelectricpowerflowingtotheexternal circuitbecauseofvariousadditionalinternallossesinthecell.
Whenexposedtosunlight,aphotovoltaiccellgenerateselectriccurrentandacellpotential difference,dependinguponthesolarirradiancelevelandtheelectricalcharacteristicsoftheloadin theexternalcircuit.Inthelimitwheretheexternalcircuitisnotclosed,nocurrentcanflowbutan open-circuitvoltage Voc isgeneratedthatincreaseswithsolarirradiance,butnotproportionately so,assketchedinFigure7.14(a).Attheoppositelimitofanexternalshortcircuit,wherethecell voltageiszero,ashort-circuitcurrent(currentdensity jss A/m2)flowsthroughthecellinanamount proportionaltothesolarirradiance[seeFigure7.14(a)].Inboththeseextremes,noelectricalpower isgeneratedbecauseeitherthecurrentorvoltageiszero.Forintermediatecaseswherethecell deliverselectricalpowertoaload,thecellvoltageandcurrentdensity, V and j,areeachlessthan thelimitingvaluesof Voc and jss .Foragivenvalueoftheirradiance,therelationshipbetween V and j,sketchedinFigure7.14(b),dependsupontheelectricalcharacteristicsoftheload.The poweroutputistheproduct Vj,whichreachesamaximum (Vj)max atapointintermediatebetween theopen-andshort-circuitconditions.Themaximumpowerperunitareathatthecellcandeliver, (Vj)max ,isgenerallyabout60–80%oftheproduct Voc jss
Theefficiency η ofaphotovoltaiccellistheratiooftheelectricalpowergeneratedperunit area (Vj) tothesolarirradiance (I ) impingingonthecellsurface:
Theefficiencyincreaseswithincreasingirradianceand,foranylevelofirradiance,isamaximum atthemaximumofoutputpower.Photovoltaiccellefficienciesareratedforasolarirradianceof
1kW/m2 undertheconditionsformaximumpower.Typicalefficienciesareintherangeof15–25 %,with Voc ∼ 0 5Vand jss ∼ 300–400A/m2
Thephotovoltaiccellisbutonecomponentofapracticalsystemforconvertingsunlightdirectly tousefulelectricpower.Manyindividualcellsmustbewiredtogethertoproduceoutputpower atdesirablevoltageandcurrentlevels,andthearrayofcellsmustbemountedinamannerthat optimizesthesolarirradianceinput.Photovoltaicpowerisdirect-current(DC)powerandmustbe convertedtoalternating-current(AC)formformostuses.Theseotherconstituentsofapractical photovoltaicpowersupplyaddtoitscapitalcost,althoughatthepresenttimethebasiccellcostis sohighthatitconstitutesbyfarthemajorcomponentofsystemcost.
Theuseofwindtoprovidemechanicalpowerforgrindinggrainandpropellingshipsandboats datesfromancienttimes,threeorfourmillenniaago.Substantialimprovementinwindtechnology withinthepastthousandyears,especiallyfortransoceanicvessels,madepossiblethemigration ofpopulationstowesternandsoutherncontinentsandtheinitiationofintercontinentaltrade.The technologyofsailingvesselshadreachedahighlevelinthemid-tolatenineteenthcenturywhen itwassuddenlydisplacedbysteel-hulled,fossil-fuel-poweredsteamshipsthatgreatlytransformed intercontinentaltravelandtrade.
Atonetime,wind-poweredmillsforgrindinggrainandpumpingwaterwerecommonin westernEurope,numberingsome10,000bythetwelfthcentury.Bypresentstandardstheirdesign wasrudimentaryandtheiruse,likethatofsailingvessels,wasdisplacedbytheadventofindustrial powerinthenineteenthcentury.
Themodernwindturbineisadevelopmentofthelastfewdecadesthatutilizesthelatest technologyindesignandmanufacture.Currentlyusedexclusivelytoproduceelectricalpower, windturbinesareusuallytiedintoelectricaltransmissionanddistributionsystem,althoughsome turbinesareusedtopowerremoteinstallations.Despitethemanyingeniousformsofwindturbines thathavebeendeveloped,thepredominanttypeusedtodayisthehorizontalaxismachine,mounted onasupporttower,thatisfreetorotatesoastoaligntheaxiswiththewinddirection.Theturbine rotor,invariablyathree-bladedpropeller-likestructure,drivesanelectricpowergeneratorthrough aspeedincreasinggear.Becausetheturbine–generatormustbeabletorotatewithrespecttoits supportingtower,electricalpoweristransmittedthroughslipringstotheelectricaltransmission system.Becausetheturbomachineryismountedatthetopofatower50ormoremetersinheight, withthewindturbinerotatingandthewholepowerunitswivelingintothewind,areliableand strongsupportingstructurethatwillwithstandthehighestexpectedstormwindsisrequired.
Awindturbinemorecloselyresemblesanairplanepropellerthanitdoesasteamorgasturbine rotor.Thewindturbinebladesarelongandslender;thetipoftheblademovesataspeedmuch greaterthanthewindspeed.Anairplanepropellerisdesignedtoproducealargethrustwhilethe windturbinemustproducepower,whichistheproductofthetorquethatthewindappliestothe turbinerotortimesitsrotationalspeed.Nevertheless,thewindturbinebladeshapeisquitesimilar tothatofanairplanepropeller.
Thesourceofpowerfromthewindistheflowofairthroughthewindturbine.If V isthewind speed,eachunitmassofairpossessesakineticenergyofamount V 2/2.If A = π R2 isthearea subtendedbytherotatingbladesoflength R,thenthemassflowrateofairthroughanarea A of theundisturbedwindstreamis ρVA,where ρ istheairdensity.Themaximumrateatwhichthe windkineticenergycouldbesuppliedbythewindflowpassingthroughtheturbineistheproduct ofthemassflowrate, ρVA,andthekineticenergyperunitmass, V 2/2,foravalueof ρV 3 A/2. Inpractice,thewindturbinepoweravailablefromaerodynamicallyperfectdesignislessthanthis valuebecausetheactionoftheturbinemodifiesthesurroundingwindflow,reducingthemassflow ratebelowthevalueof ρVA
Toillustratethiseffect,Figure7.15showstheidealwindflowpastaturbine.Becausethe turbineextractssomeofthekineticenergyofthewindflow,thewindspeedisreducedinthe
vicinityoftheturbinetoavalue Vt attheturbineandanevenlowervalueof Vw downstreamof theturbine,calledthewakeregion.Theturbinepower P isthentheproductofthemassflowrate throughtheturbine, ρVt A,andthereductionofkineticenergyofthewind, V
/
V
w /2,or
Astheairslowsdownbothupstreamanddownstreamofthewindturbine,itundergoesapressure risethatisverysmallcomparedtoatmosphericpressure.Thisprovidesapressuredropacrossthe windturbineofamount ρ(V 2 V 2 w )/2andacorrespondingaxialthrustforceof ρ(
Butthisforcemustalsoequalthereductioninmomentumofthewindflow,
followsthat Vt istheaverageof V and Vw :
w )
Thefactorinbracketshasamaximumvalueof16/27when Vw = V /3,inwhichcase8/9ofthe wind’skineticenergyhasbeenremovedbythewindturbine.Asaconsequence,thewindturbine powercannotexceedthelimit:
Theforegoingconsiderationsdonotrevealthedetailedmechanismwherebythewindflow exertsatorqueonthewindturbinerotorinthedirectionofitsrotation,therebygeneratingmechanicalpower.Figure7.16depictstheamountanddirectionofthewindflowrelativetoasection oftheturbinebladeataradius r fromtheturbineaxis.Inthetangentialdirection,thevelocity
componentis2πrf ,where f istherotationalfrequencyoftheturbineshaft.19 Inthedirection oftheturbineaxisthewindspeedis Vt .Thenetrelativespeed Vrel isthereby V 2 t + (2πrf )2 , andthisvelocityliesatanangle β = arctan(Vt /2πrf ) tothetangentialdirection,asshownin Figure7.16.Theairfoil-shapedsectionoftheturbineblade,pitchedatasmallangleofattacktothis direction,developsaliftforce L anddragforce D thatare,respectively,perpendicularandparallel tothedirectionoftherelativevelocity.Thenetforceexertedonthebladesectioninthedirection ofitsmotionis L sin β D cos β,andtherateatwhichthisforcedoesworkontheturbine,which isthepowerdevelopedbythewind,isthereby2π fr (L sin β D cos β).
Therearetwoimportantdeductionsthatcanbemadefromthisanalysis.Thefirstisthatit isnecessarythattheairfoillift L shouldgreatlyexceeditsdrag D,whichcanbesecuredby utilizingefficientairfoilshapesinformingtheturbineblades.Thesecondisthattheturbinepower isenhancedbyturbinetangentialspeedsthatarelargecomparedtothewindspeed,soastocome ascloseaspossibletothepowerlimitofEquation(7.13).Optimumdesignsincorporateaspeed ratio(turbinetipspeed/windspeed)ofaboutfivetoseven.
Theperformanceofawindturbinemaybedescribedintermsofadimensionlesspower coefficient C p definedas
where A istheturbinerotordiskarea.Thepowercoefficientcannotexceedtheidealvalueof16/27, butisotherwiseafunctionofthespeedratio,assketchedinFigure7.17,reachingamaximumatthe designspeedratio.Atlowerspeedratiostheairfoilangleofattackistoogreatandtheaerodynamic drag D increasesgreatly,reducingturbinepower.Athigherspeedratios,theairfoilangleofattack decreases,reducingthelift L andalsotheturbinepower.
Aneconomicalwindturbinedesignmusttakeintoaccountseveralfactors.Thepoweravailable fromtheturbineandthatdeliveredbytheelectricgeneratoritdrivesismatchedatthedesignwind
19Strictlyspeaking,therelativespeedinthetangentialdirectionissomewhatlessthan2πrf becausethe bladetangentialforceinducesasmallamountoftangentialflow.Thisisgenerallynegligibleforefficientwind turbinedesigns.
speed Vd .Whenthewindspeedishigherthan Vd ,theturbinecandelivermuchmorepower(since P variesapproximatelyas V 3)buttheelectricgeneratorcannotabsorbthisadditionalpowerwithout overheatingandburningout,sotherotorpitchangleisadjustedtodeliveronlythedesignpower outputtothegenerator.Ontheotherhand,atwindspeedslessthan Vd,muchlesspowercanbe begenerated,byafactorofabout (V /V 3 d ),andtheelectricaloutputisreducedbelowthedesign value.Theeconomicaloptimumdesignisonethatmaximizestheratiooftheaverageelectrical poweroutputtothecapitalcostofthewindturbineinstallation,giventhewindspeedsavailable atthesite.Forefficientdesignsusedatdesirablesites,theratiooftime-averagedpoweroutputto theratedoutput,calledthe capacityfactor, isabout25–30%.
Adesirablesiteforawindpowerinstallationisonehavingahighaveragewindspeed.Sites arecommonlyratedbytheaveragevalueoftheenergyfluxperunitarea, ρV 3/2.20 Highvalues ofwindenergyfluxrequiresmaller,lesscostlyturbinerotorsforagivenelectricalpoweroutput. Figure7.18identifiesU.S.regionswithhighwindenergylevels.Thesearelocatedmostlyathigher elevationsandinmountainousregions,aswellasincoastalareas.
Atanyonesite,windspeedsarequitevariableinmagnitudeandduration.Daytimewindspeeds arehigherthannighttimelevelsbecauseofdaytimesolarheatingoftheatmosphere.Averagewinter seasonwindspeedsexceedthoseofthesummer.Whilethetime-averagedannualwindspeed V approximatelymeasurestheavailabilityofwindenergy,amoredetailedknowledgeofwindspeed statisticsisneededforanaccurateassessmentofasite’swindenergypotentialandtheselectionof
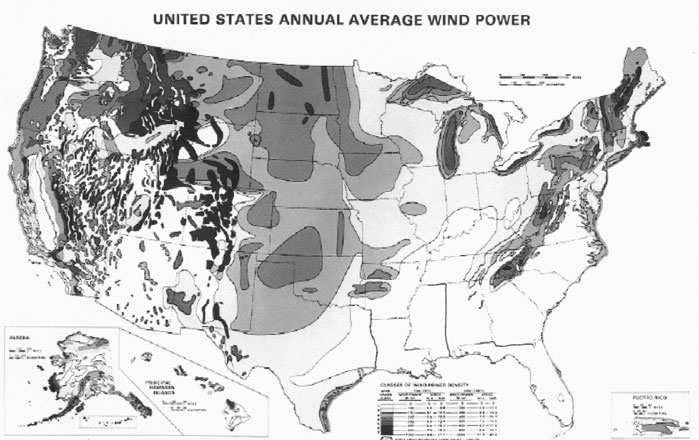
asuitablewindturbinedesign.Acommonlyusedformoftheprobabilitydistributionfunctionof windspeedsis
where p{V } istheprobabilityofawindspeed V ,perunitofwindspeed,atasitewhere V isthetime-averagedwindspeed.21 InFigure7.19,itcanbeseenthataveryloworhighwind speed,comparedtotheaverage,isveryunlikely,andthatthemostprobablewindspeedis0 8 V Inaddition,theaveragevalueofthecubeofthewindspeed, V 3,towhichtheaveragewind powerisproportional,canbecalculatedtobe V 3 = (6/π)V 3 = 1.91 V 3.Thustheaveragevalue ofthewindenergyflux ρV 3/2isconsiderablymorethanitsvalueattheaveragewindspeed, ρ(V )3/2.
Atanysite,windspeedandenergyfluxincreasegraduallywithdistance z abovegroundlevel. Whileitistheoreticallyadvantageoustoplaceawindturbineonahightowersoastotakeadvantage ofthehigherenergyfluxavailablethere,thegreatercostofahighertowermaynotbeoffsetby alesscostlyturbine.Generally,towerheightisproportionaltoturbinediameter,theturbineaxis beingaboutonetotwodiametersaboveground.
Windturbinesneedtobeprotectedfromdamagebystormorhurricanelevelwindsand,in northernclimates,fromicingconditionsinwintermonths.
Windturbinesarecustomarilyinstalledatadjacentsitescalled“windfarms,”anexampleof whichisshowninFigure7.20.Currently,windturbinesaremanufacturedinthepowerrangeofa fewhundredkilowattstoseveralmegawatts,sothathundredsofthemmustbedeployedtoequal theoutputofatypicalsteamelectricpowerplant.Maintenanceofthismanyunitsataremoteor
21Equation(7.15)iscalledaRayleighdistribution.Itsatisfiestheintegralconditionsthat ∞ 0 p{V } dV = 1 and ∞ 0 Vp{
noteasilyaccessiblesite,inanunshelteredandsometimeshostileenvironment,presentspractical difficultiesthatmayleadleadtohighoperatingcosts.
Windturbinesoftendriveinductiongeneratorsasthesourceofelectricalpower.Because inductiongeneratorsoperateatnearsynchronousspeedwhensupplying60-cyclepowertoan electricgrid,theturbinespeedisheldconstantoveritsloadrange,therebyoperatingatless-thanoptimumefficiencyatlowandhighspeeds.Amoreefficientmatchbetweenthewindturbineand electricgeneratorispossibleiftheturbineandgeneratorspeedcanbevariedwiththewindspeed, butthisrequiresconversionoftheACgeneratoroutputtoDCandthenbackto60-cycleAC,which maybelesseconomicaldespitetheimprovedturbineefficiency.
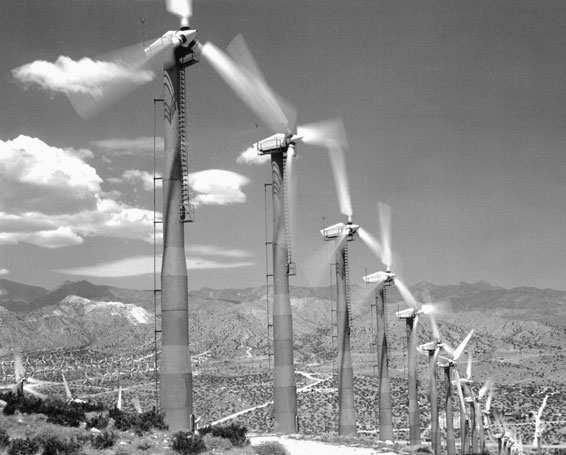
Thereareseveralenvironmentaldrawbacksofwindenergysystems.Windturbinesgenerateaudible noise,somewhatakintothatofhelicopters,butmuchlessintensebecauseoftheirmuchlower powerlevels.Nevertheless,windturbinesareunwelcomenoisyneighborsinpopulatedareasbut havenoadverseeffectonlivestockoperations.Theycan,however,killmigratingbirdsthatattempt toflythroughtheturbine.Tosomeobserverstheyprovidevisualblight,especiallyiflocatedin otherwiseundevelopednaturalareas.
Theregularriseandfalloftheoceanlevelatcontinentalmarginshasbeenusedinpastcenturiesto producemechanicalpowerforgrindinggrainorsawingwoodbydammingwaterincovesorriver
mouthsathightidallevelsandthenreleasingittotheseathroughturbinesorwaterwheelswhen thetideisatitslowestlevel.Intermittenttidalpowerprovedpracticalonlywherethetidalrange (thedifferenceinelevationbetweenhighandlowtides)exceededafewmeters.Inrecentyears, tidalplantshavebeenconstructedattheLaRanceestuaryontheBrittanycoastofFranceandat AnnapolisRoyal,NovaScotia,intheBayofFundy,bothofwhichgenerateelectricalpower.
Thetidalriseandfallintheoceanisaconsequenceofthedifferentialgravitationalforce exertedonoppositesidesoftheearthprimarilybythemoon,andsecondarilybythesun,which givesrisetosimultaneoushigheroceansurfaceelevationsontheearth’ssidesfacingtowardand awayfromthemoon(orsun)andlowerelevationshalfwayinbetween.22 Atagivenpointinthe ocean,theperiod T ofthelunartideisone-halfofthelunarday(T = 12h,24min = 4.464E(4) s);thatofthesunisjust12hours.Thesolarandlunareffectsreinforceeachothertwiceamonth, atthetimeofafullmoonandanewmoon,givingrisetomaximum,or spring, tides.Halfway betweenthespringtides,atthetimeofthefirstandlastquartersofthemoon’smonthlycycle,the solareffectisleast,resultingintheminimum,or neap, tides.23
Thetidalrangeoftheoceanatthecontinentalmarginsisfarfromuniformworldwide.Ata fewlocations,suchastheBayofFundyandCookInletinNorthAmericaandtheBristolchannel andBrittanycoastinwesternEurope,resonanceeffectsinthetidalmotionleadtorangesashigh as10m,whichcontrastswithanaverageoceanicrangeof0.5m.Thislargeamplificationofthe oceanictidalrangeisassociatedwitharesonantmotionofwatermovementacrosstheshallow watersofthecontinentalshelfintorestrictedbaysorestuaries.AbouttwodozensitesinNorthand SouthAmerica,Europe,EastandSouthAsia,andAustraliahavebeenidentifiedaspossessingthis tidalamplification.
TheprincipleoftidalpowerisillustratedinFigure7.21,showinginelevationacrosssection ofa tidalpool separatedfromtheoceanbya dam (or barrage).A sluiceway inthedamallows watertoflowquicklybetweentheseaandthetidalpoolatappropriatetimesinthetidalcycle,as doesalsoaturbineina powerhouse.Ifthetidalpoolisfilledtothehightidelevelandthenisolated fromtheseauntilthelatterreachesitslowtidelevel,avolumeofwaterisimpoundedwithinthe tidalpoundofamount AH,where A istheaveragesurfaceareaofthetidalpondand H isthetidal range.Ifthecenterofmass CM ofthiswaterisadistance h abovethelowtidelevel,workcanbe extractedfromthisvolumeatthetimeoflowtidebyallowingittoflowthroughaturbineuntilthe
22Thesolareffectisabout40%ofthatcausedbythemoon.
23Thereareadditionalperturbationsofthetidalrangeassociatedwiththepositionofthemoonrelativetothe solareclipticplaneandthevariationofboththemoon–earthandsun–earthdistances.
poollevelreachesthatoflowtide.Themaximumamountofthisworkisequaltotheproductof themassoffluid ρ AH,theaccelerationofgravity g,andtheaveragedistance h bywhichitfalls duringoutflowtothesea,foratotalmaximumenergyof ρg AHh.Iftheemptiedpoolisthenagain closedofffromtheseauntilhightideoccurs,anadditionalamountofenergy, ρgH A(H h),may bereapedforatotalenergyof
Theidealtidalpowerperunitoftidalpoolsurfacearea, ρgH 2/T ,whichequals0.22W/m2 for H = 1m,increasesasthesquareofthetidalrange,showingtheimportanceoftidalrangeinan economicalpowerplantdesign.
Ifpowerisgeneratedbothduringinflowtoandoutflowfromthetidalpool,thedesigniscalled a doubleeffect plant.Becauseitisdifficultandexpensivetodesignaturbineandpowerhousethat operatesinbothflowdirections,mosttidalpowerplantsoperateintheoutflowdirectiononly,called a singleeffect plant.24 Because h isusuallymorethanhalfof H,moreenergycanberecoveredon theoutflowthantheinflowtothepool.
Foratypicalsingleeffectplant,Figure7.22showsthepoolandseasurfacelevelsandpower outputduringonetidalcycle.Beginningatmidtide,thesluicegatesareopenedandseawaterflows intothepool,fillingittothehightidelevelinthefirstquarterperiod,atwhichpointthesluiceis closed.Shortlythereafter,theturbineinletisopenedandtheturbinepoweroutputrisesquicklyto itsratedpowerfornearlyhalfofthetidalcycle.Whenthedifferenceinwaterlevelbetweenpool andoceanbecomessmall,neartheendofthecycle,theturbineiscloseddown.
24TheLaRanceplant(seeTable7.6)wasbuilttooperateasadoubleeffectplant,includingthepossibilityof incorporatingpumpedstorage,butnowoperatesexclusivelyasasingleeffectoutflowtidalplantforvarious practicalreasons.
Ratedturbineflowrate(m3/s)3783240
Ratedturbinehead(m)5.58
Ratedelectricpower(MW)17.8240
Sluicegateflowarea(m2)2301530
Capacityfactor, η 0.3210.225
Effectiveness, ǫ 0.1710.331
a DatafromFay,J.,andM.Smachlo,1983. J.Energy, 7,529.
Therearetwomeasuresofperformanceofatidalpowerplant.Oneisthe capacityfactor η, theratiooftheaverageturbinepoweroutputtotheratedturbineoutput.Ahighcapacityfactor providesmoreannualrevenueperunitofcapitalinvestmentintheturbine/generator.Asecond measureistheplant effectiveness ǫ,theratiooftheaveragepoweroutputtotheidealpowerof equation(7.17).Ahigheffectivenessallowstheplanttoutilizemostofthetidalpoweravailable atthesite.Unfortunately,itisnotpossibletoobtainhighvaluesforboththesemeasuressimultaneously,becauseincreasingonecausestheothertodecrease.Figure7.23showstherelationship oftheseparametersforsingleeffectplants.25
ThecharacteristicsoftwoplantsthatarecurrentlyinoperationarelistedinTable7.6.The smallerplant,atAnnapolisRoyal(Figure7.24),hasahighercapacityfactorbutlowereffectiveness thanthelargeroneatLaRance,inagreementwiththetrendsofFigure7.23.Theaverageelectrical poweroutputspersquarekilometeroftidalpoolareaare1.19MW/km2 and4.19MW/km2 , respectively,fortheAnnapolisRoyalandLaRanceplants.
Thehydroturbineofatidalpowerplantoperatesatalowheadthatissomewhatlessthanthe tidalrange H (seeFigure7.22).Thisrequiresanaxialflowmachinewithalowflowvelocityof about √gH .Theturbineaxismustbelocatedbelowthelowestwaterlevelinthecyclesoasto avoidcavitation,sotheturbinediameterisgenerallylessthan H .Themaximumpowerfroma singleturbineisoftheorderof ρ(gH )3/2 H 2,whichworksouttoabout10–30MWforpractical plants.Forlargeinstallations,multipleturbinesarerequired.
Theprincipalenvironmentaleffectsoftidalpowerplantsareaconsequenceofthechangestothe tidalflowinthepooland,toalesserextent,theoceanexteriortothepool.Forasingleeffectplant, theflowintothepoolisreducedbyabouthalf,decreasingtheintertidalzonebyaboutthesame amountandreducingtheaveragesalinityofthepoolwaterswhenthepoolisanestuary,bothof whichalterthenatureoftheoriginalmarineecosystems.Theplantalsoimposesanimpediment tothemovementofmarinemammalsandfish.Thepatternsofsiltation,oftenasignificantnatural processatsiteshavinglargetidalranges,ischangedbythepresenceofatidalplant.Shipnavigation intothepoolispreventedunlessalockisbuiltintothedam.Theunpredictableandpossiblyadverse changestoexistingecologicalsystems,includingfisheriesandotherwildlife,hasweighedheavily intheassessmentofproposalsfornewtidalpowerplants.
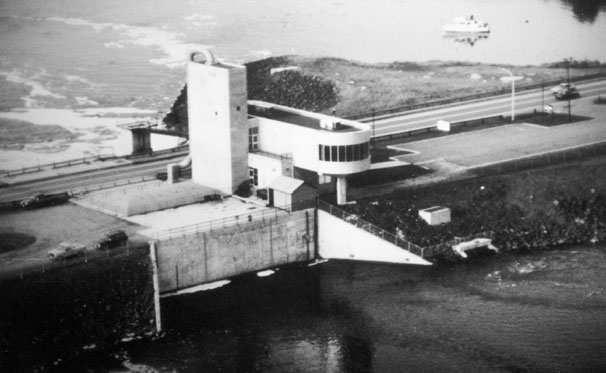
Thedamagetooceanshorelinescausedbystorm-drivenwavesisampleevidenceofthedynamic powerreleasedwhenwavesimpingeonacoastalshore.Itwouldseemthatharnessingthepower
ofwavescouldprovideasourceofelectricalenergyanalogoustothatofthewind.Thetechnology fordoingso,however,presentsbotheconomicandengineeringchallenges.
Oceanwavesareformedontheocean’ssurfacebyactionofthewind.Byfrictionandpressure forcesexertedattheair–waterinterface,windenergyistransferredtotheenergyofgravitywaves movingacrosstheoceansurface.Thewaveenergymoveswiththewave,buttheoceanwaterhas nonetmotioninthedirectionofthewavepropagation.Bysuitablemechanicaldevices,theenergy inawavemaybeconvertedtomechanicalpower.
Oceanwavesinvolveperiodicmotionofthewateratorclosetotheoceansurfacethatis sustainedbygravity[seeFigure7.25(a)].Thecyclicfrequency f ofanoceanwaveisrelatedtoits wavelength λ by
where g istheaccelerationofgravity.Thevelocity c atwhichthewavepatternmovesacrossthe surfaceofthewater,calledthephasevelocity,istheproductofthewavelengthtimesthefrequency:
Long-wavelengthwavesmovefasterthanthoseofshorterwavelength,leadingtodispersion,or spreadingoftheenergyinanoceanwavesystem.
Theenergyofanoceanwaveconsistsoftwoparts:thekineticenergyofthemovingwater particlesinthewaveandthegravitationalpotentialenergyofthefluiddisplacedfromitsequilibrium positionofaflathorizontalsurface.Itisthismotionanddisplacementimpartedtotheoceansurface bythewindthatconstitutesthesourceofpowerthatcanbeabstractedbyawavepowersystem.
Themotionofthewaterinanoceanwaveisconfinedmostlytoalayerofdepth λ/2π below thesurface.If H isthewaveheight,measuredfromcresttotroughasinFigure7.25,thenthe velocityofawaterparticleinthewaveisabout Hf andthekineticenergyofthewaterinthislayer, perunitofsurfaceareaofthewave,istheproductofthewatermassdensity ρ timesthedepth λ/2π timesthekineticenergyperunitmass, (Hf )2/2,foratotalof ρλH 2 f 2/4π = ρgH 2/8π 2 .
Thustheaveragekineticenergyperunitsurfaceareaofawavesystemisoftheorderof ρgH 2 and isindependentofthewavelengthorfrequency.Thepotentialenergyofthewave,perunitsurface area,isapproximatelytheproductofthedisplacedmassperunitarea ρ H,itsverticaldisplacement H,andthegravitationalacceleration g,foratotalof ρgH 2.Anexactcalculationofthekineticand potentialenergiesperunitofwavesurfacearearevealsthattheyareequalandtheirsumcanbe
expressedas
Thewaveenergyofequation(7.20)ispropagatedinthedirectionofmotionofthewave,which isgenerallythedirectionofthewind,atthegroupvelocityofanoceanwave.Thelatterequalshalf thephasevelocity c,or g/4π f .Thefluxofwaveenergy,orpower,perunitofdistancenormalto thedirectionofwavepropagation,istheproductoftheenergyperunitareaandthegroupvelocity:
Unlikethewaveenergy,thewavepowerdependsuponthewavelength,albeitasthehalfpowerof thewavelength.
Dependinguponthewindspeed,thesurfaceoftheoceaniscoveredwitharandomcollection ofwavesofdifferentheightandwavelength.Asthespeed V ofthewindincreases,boththemean squarewaveheight H 2 andthemeanwavelengthincreaseandthemeanfrequency f decreases. Oceanographershavemeasuredthesequantitiesasafunctionofwindspeedandfoundthemtobe empiricallyrelatedbythefollowingformulas
Substitutingtheserelationsintoequations(7.20)and(7.21)forwaveenergyandpower,wefind that
Forexample,awindspeedof20knots(10.29m/s)willgenerateanenergydensityof3.13kJ/m2 , awavepowerof45.8kW/m,anaveragewaveheightof1.6m,andanaveragewavefrequencyof 0.106Hz,whichisawaveperiodof9.4s.
Thedependenceofwavepoweronwindspeed, V 5,issteeperthanthatforwindpower, V 3 . Asaconsequence,mostofthewavepoweravailableatasiteiscollectibleonlywhenthewind exceedsitsaveragevalue,ascanbeseeninFigure7.26,showingtheprobabilitydistributionof wavepowerwithwindspeed,assumingthewindspeedprobabilitydistributionofFigure7.19. Figure7.26contrastssharplywithFigure7.19forthedistributionofwindspeed.Theaverage wavepowerforthedistributionofFigure7.26is60/π 2 = 6 08timesthepoweravailableatthe meanwindspeed V
Mostofthewaveenergyatasiteisavailableonlyasmallfractionofthetime.Capacityfactors forpracticalwaveenergysystemsareinevitablysmall,intherange15–20%.Thisisunfavorable totheeconomicviabilityofwavepoweranditssuitabilityasasourceofelectricalpower.
Themostfavorablesitesforoceanwavepowerarethecontinentalorislandmarginsexposed toprevailingwinds.Formid-tohighlatitudesthesewindsarewesterly,whilefortropicallatitudes theyblowfromtheeast.Atfavorablelocations,theannualaveragewavepoweravailableisabout 50kW/m.Becausecapacityfactorsaresmallforwavesystems,theinstalledpoweratsuchlocations wouldbeabout250kW/m.
Manyingeniousmechanismshavebeenproposed,andsomeofthemtested,toproducemechanicalorelectricalpowerfromwavesystems.Theyareoftwotypes:(a)floatingbodiesthat areanchoredinplaceand(b)structuresfixedtotheseabed.Mechanicalpowerisproducedby therelativedisplacementofpartsofthestructureorbytheflowoffluidwithinit,causedbythe impingementofwavesonthedevice.Thepowerthatisproducedisafractionofthepoweravailable inthewavesthatareinterceptedbythedevice.
Oneofthedevices,whichhasbeentestedtoconfirmahighefficiencyofwavepowerconversion,isillustratedinFigure7.25(b).CalledtheSaltercam,thedeviceconsistsofahorizontal cylindricalfloat,ofasymmetricalcrosssectionshowninFigure7.25(b),thatinstillwaterfloats withmostofitsvolumebelowtheseasurface.Whenwavesimpingeonthefloat,itrotatesabouta stationarycircularsplineinanoscillatorymanner.Anelectricalpowersystemappliesarestraining torquetothefloatthatabsorbsmostofthepowerintheincidentwavesystem.Thecamstructure musthavedimensionsgreaterthanthewaveheight,andbetunedtotheaveragewavefrequency, ofthewavescorrespondingtoitspowercapacity.Ineffect,thevolumeofthedevicewillbe proportionaltoitsratedpower.
Anoceanwavesystemcarriesmomentumaswellasenergy.Ifthewaveenergyisabsorbed byawavepowersystem,ahorizontalforceperunitlengthwillbeexertedonthepowersystem ofamountequaltotheenergyperunitsurfacearea,equations(7.20)and(7.24).Acorresponding restrainingforcemustbesuppliedbytheanchoringgearthatholdsthepowersysteminplace.
Theconstructionandoperationofwavepowersystemsimmediatelyseawardoftheocean shorefrontwouldhavesomeadverseenvironmentalimpacts.Theymustbeanchoredtothesea bottom,disturbingsomepartofit.Theymayimpedenavigationandrecreationaluseoftheocean front,andtheydefinitelywouldhaveaestheticdrawbacks.
Figure7.27 Diagramsofthefluidflowinanoceanthermalpowerplant.(a)Anopencycleemploysthe waterevaporatedfromwarmseawaterastheworkingfluidinalowpressuresteamcycle.(b)Aclosedcycle usesammoniaastheworkingfluid,thelatterbeingvaporizedandcondensedinheatexchangerssupplied withwarmandcooloceanstreams.
Theconceptofgeneratingmechanicalpowerusingwarmsurfacewaterfromatropicalocean sitewasfirstadvancedbyJacquesd’Arsonvalin1881.Thewarmwaterwouldprovideheattoa Rankinecycleheatenginewhilecooldeepwaterwouldsupplythecoolingneededtocondense theworkingfluid.Inlow-latituderegionsoftheocean,within20degreesoftheequator,water nearthesurface,wheresunlightisabsorbed,iswarmerbyabout20Kthanwateratdepthsgreater thanakilometer.(Thecooldeepoceanwateroriginatesinthepolarregions.)Commonlycalled oceanthermalenergyconversion (OTEC),suchaplantwouldnecessarilyhaveasmallthermodynamicefficiencybecauseitwouldoperatewithatemperaturedifferencethatissmallcompared totheabsolutetemperatureoftheheatsource.27 Althoughtheheatthatcanbeextractedfrom theoceansurfaceisverygreat,mechanicalpowerisrequiredtocirculatethesurfaceanddeep waterthroughthepowerplant,subtractingfromthepowergeneratedbytheRankinecycleturbine.ThisandotherpracticaldifficultieshavepreventedOTECplantsfromdevelopingbeyondthe demonstrationstage.
TwotypesofOTECplantshavebeentried.Thefirst,anopencycle,utilizeswaterevaporated fromthewarmstreamunderlowpressuretosupplyaturbinedischargingtoanevenlowerpressure condensercooledbyasprayofcoolwater[seeFigure7.27(a)].Thesecond,aclosedorhybridcycle, employsheatexchangersthatsupplyorremoveheatfromaclosedRankinecycleworkingfluid, usuallyammonia,permittingamoreeconomicalandefficientturbinethanthatfortheopencycle, butrequiringamoreexpensiveevaporatorandcondenser[seeFigure7.27(b)].Inbothcycles,large volumesofwarmandcoolwatermustbepumpedfromtheoceanthroughlong,large-diameter ductsandthenreturnedtotheseaviaathirdduct.Thesesystemsmustbeconstructedtominimize
27ACarnotcycleoperatingwithatemperaturedifferenceof20Kandsuppliedwithheatfromawarmsource at25 ◦Cwouldhaveathermodynamicefficiencyof20/(25 + 273) = 6.7%.ApracticalRankinecyclewould haveevenlowerefficiencythantheidealCarnotcycle.
theamountofpowerrequiredtocirculatethefluidstreamsfromandtotheoceanviathepower plant.
In1979,asmallclosed-cycledemonstrationplantmountedonabargeanchoredoffKeahole PointinHawaiigenerated52kWofgrosselectricalpowerbutonly15kWofnetpower,with thedifferencebeingconsumedinpumpinglosses.Theheatexchangersweremadefromtitanium plate.Thecoolwaterpolyethylenepipewas0.6mindiameteranddrewwaterfromadepthof 823m.Currently,experimentsarecontinuingwitha50-kWclosed-cycleplantlocatedonshore attheNaturalEnergyLaboratoryofHawaii,withtestingofheatexchangersthatwillbemore economical.
In1981,Japandemonstratedashore-basedclosed-cycleplantutilizingafluorocarbonworking fluid.Coolwaterwasdrawnfromadepthof580m.Thegrossandnetpowersfromthisplantwere 100kWand31kW,respectively.
In1992,anopen-cycleplantwastestedattheNaturalEnergyLaboratoryofHawaiithat generated210kWofgrosselectricalpowerand40kWofnetelectricalpower.Theturbinerotor forthisplantweighed7.5tons.
Thereareseveralproblemstobeovercomeifoceanthermalpowersystemsaretobecome practical.Foulingofthewarmwatersupplypipeandheatexchangerbymarineorganisms,and thecorrosionofheatexchangers,needstobeeliminated.Themechanicalpowerneededtopump fluidsthroughthesystemmustbekeptwellbelowthegrossoutputoftheturbine.Allcomponents ofthesystemneedtobeconstructedeconomicallysothatthecapitalcostperunitofnetpower outputbecomescompetitivewithothertypesofrenewableenergysystems.
UnderthenewregulatoryregimebeinginstitutedinsomestatesoftheUnitedStatesin2000,and whichperhapswillbeextendedsubsequentlytoallofthestates,thepriceofelectricitypaidby consumersisthesumofseveralparts.Onepartisthepricechargedbytheelectricityproducerfor electricityleavingthepowerplant.Otherpartsincludethepricefortransmissionbyhigh-voltage powerlinesanddistributionnetworkstotheconsumer’slocation.Onemightsaythattheelectricityproducersellsaproduct,electricenergy(measuredinkilowatthours),whilethetransmission anddistributionutilitysellsaservice,transmittingtheelectricenergytothecustomer.Individual producerswillcompetetosellelectricenergytoconsumersforthelowestprice,butthetransmissionanddistributionsystemwillremainapublicutilitymonopolywhosepriceofservicewill beregulatedbypublicauthorities.Inacompetitivemarket,electricityproducerswillpricetheir producttocoverthecostsofproduction,plusaprofitforprivatelyownedproducers.
MostofthecurrentlyinstalledrenewableenergysystemsintheUnitedStatesgenerateelectricpower(seeTable7.1).Thesesystemscollectnaturallyavailableformsofrenewableenergy andconvertthemtoelectricalpower.Theeconomiccostofdoingsostemsalmostentirelyfrom thecapitalinvestmentrequiredtoproduceandinstalltheequipmentthataccomplishesthisenergy conversion.Incontrasttofossilfuelpowerplants,wherethecostoffuelandofoperatingand maintainingtheplantmayequalorexceedtheannualizedcapitalcost,renewableenergyplants havesmalloperatingcostsand,ofcourse,nofuelcost.Becauserenewableenergyplantshave highercapitalcostsandlowerutilizationthanfossilfuelplants,theircostofproducingelectricity isusuallyhigherthanthatoffossilfuelplants.
Hydropower2000506.8
Biomassa 1000602.9
Geothermal15001517.1
Wind1200258.2
Photovoltaic40003022.8
Tidal20003011.4
a Wood-fueledsteamplant.
Tocomparetherenewableenergytechnologieswitheachother,andwithfossilfuelplants, wecomputedthecomponentofthecostofproducingelectricitythatisallocatedtofinancing thecapitalinvestmentneededtoconstructthefacility,foreachtypeofrenewableenergyplant listedinTable7.7.Foreachkilowattofinstalledpower,theannualcostofcapitaltoberecovered byelectricitysalesisassumedtobe15%ofthecapitalcostperkilowatt.Whenthisisdivided bytheannualaverageoutputperkilowattofinstalledpower,whichisthecapacityfactortimes 24 × 365 = 8760hoursperyear,thequotientisthecapitalcostcomponentofthecostofelectricity productionatthatplant,showninthelastcolumnofTable7.7.
FortherenewableenergysystemslistedinTable7.7thecapitalcostcomponentofelectricity coversalargerange.Partofthisvariabilityreflectsthedifferenceinunitcapitalcost,andthe restisaconsequenceofdifferentcapacityfactors.Exceptforphotovoltaicsystems,thesesystems requireturbine-generatormachinerythatconstitutesalargeshareofthecapitalcost,whichisin therangeof1000–2000$/kW.Thecapacityfactors,takenfromTable7.1,aremostlylow,for reasonsinherentinthevariabilityoftherenewableenergyresource.28 Incontrast,thecapitalcost formodernefficientfossilfuelplantslieintherangeof500–1300$/kWandthecorresponding capitalcostofelectricityis1.2–3.0cents/kWh.Takingintoaccountthecostsoffuelandoperations, thesefossilfuelplantsproduceelectricityatacostof4–6cents/kWh.Onlyhydropowerandwind energyplantscomeclosetobeingcompetitivewithnewfossilfuelplants.29
Ithasbeenarguedthatresearchandproductionsubsidiesmaysoenlargethemarketforrenewableenergytechnologiesthattheircapitalcostswillbereducedtothepointthattheybecome economicallycompetitivewithfossilfuelplants.Inaddition,iffossilfuelplantsmustreducetheir CO2 emissionsbycapturingandsequesteringtheCO2,theextracostofdoingsomaymakerenewablesourcesmoreeconomicallyattractive.Ineithercasegovernmentintervention,eithereconomic orregulatory,willbenecessarytoincreasethemarketshareforrenewableelectricpower.
28Thelowhistoricvalueof15%forgeothermalpowerisaconsequenceofthemarketutilizationforthis powerinCalifornia.Otherwise,thecapacityfactorshouldbeintherangeof50%.
29Thewood-fueledsteamplantofTable7.7mayhavelowcapitalcost,butthefuelcostishighbecauseof lowthermalefficiency,comparedtofossil-fueledplants.Toimprovethisefficiency,andtherebylowerfuel cost,thefuelmustbegasifiedandacombinedcycleplantconstructed,increasingthecapitalcost.
Therenewableenergytechnologiesthathavebeendemonstratedtobetechnologicallypractical sourcesofpowerarehydro,biomass,geothermal,wind,solarthermalandthermalelectric,photovoltaic,andoceantidal.Ofthese,hydroandbiomasscomprisealmosttheentirerenewableinstalled capacityintheUnitedStatesin1997,buttheproportionofwindisincreasing,especiallyworldwide.Neitheroceanwavenoroceanthermalelectricpowerhasyetemergedfromthedevelopment stage.
Hydro,biomass,andgeothermalplantsareabletosupplyelectricpowerdependablyonadaily andannualbasis.Wind,solarthermal,photovoltaic,andoceantidalpowerhavediurnalrhythms andseasonalchangesthatdonotnecessarilymatchthedemandforelectricpower.Whenlinked toanintegratedpowertransmissionsystem,theydisplacefossilfuelconsumption,reducingair pollutantandcarbonemissions.
Renewableenergytechnologiesarecapitalintensive,havingcapitalcostsperinstalledkilowatt thataretwotoeighttimesthoseoffossilfuelplants.Furthermore,theseplantsmayhavelowcapacity factors(theratioofaveragetoinstalledpower),whichincreasesthecapitalcostportionoftheprice ofelectricitytheygenerate,comparedwithconventionalplants.Theeconomiccompetitivenessof renewableenergyplants,comparedtofossilfuelplants,isstronglydependentuponthecostsof capitalandfuel.
Theadverseenvironmentaleffectsofrenewableenergyplantsaregenerallylessthanthoseof conventionalpowerplants,butarebynomeansnegligible.Hydroandtidalplantsrequireextensive changestothenaturalhydrologicsystem,andbiomassplantsemitairpollutants.Becauseofthe lowintensitiesofrenewableenergy,thesizeofarenewablepowerplantislargerthanthatofa conventionalplantofequalpower,requiringmorelandarea.
Problem7.1
Aproposedhydroelectricpowerstationwouldproducemaximumpowerwhenthevolumeflowrate reached100m3/sataheadof10m.(a)Iftheturboelectricmachineryoperateswithanefficiency of85%,calculatethemaximumelectricpoweroutputofthefacility.(b)Iftheannualaverage capacityfactoroftheplantis65%,calculatetheannualincomefromthesaleofelectricpowerif thesellingpriceis$0.03/kWh.(c)Ifthecapitalcostofthepowerplantis$1000/kW,calculatethe ratioofannualincometocapitalcost,expressingtheresultas%/y.
Problem7.2
TheannualaveragedailysolarirradiancefallingonagriculturallandintheUnitedStatesisabout10 MJ/m2 perday.(a)If0.1%ofthisisconvertedtobiomassheatingvalue,calculatetheannualrateof biomasscropheatingvaluethatmaybeharvestedperhectareofcropland.(b)Ifthebiomassheating valueisconvertedtoelectricpoweratanefficiencyof25%,calculatetheannualaverageelectric
powergeneratedperhectareofcropland.(c)Ifelectricpowerissoldat0.03$/kWh,calculatethe annualincome,perhectareofland,fromelectricitysalesofthisbiomassenergy.
Problem7.3
Alargeoaktreeproduces2.2tonsofwoodin50yearsofgrowth.Thetreehasacanopyof10m indiameter,anditcollectssolarenergyforsixmonthseachyearatanaveragerateof177W/m2 . Whatisthetree’sefficiencyforconvertingsolarenergytowoodheatingvalue?(Assumeawood heatingvalueof20MJ/kg.)
Problem7.4
Drawaschematicdiagramforageothermalheatpumpthatworkstosupplyspaceheatinwinter andairconditioninginsummer,andexplainhowitworks.
Problem7.5
Therateofheat q collectedbyaflatplatesolarcollectorisgivenbyequation(7.2).According tothelimitsofthesecondlawofthermodynamics,themaximumelectricpower pm thatcouldbe generatedfromthisheatflux q wouldbelowerbythefactor(1 Ta /Tc),where Tc and Ta arethe temperaturesofthecollectorfluidandtheatmosphere,respectively.(a)Deriveanexpressionfor thetemperatureratio Tc/Ta thatwillmaximize pm ,intermsofthecollectorparameters β I and U, andthetemperature Ta .(b)Calculatethenumericalvaluesof Tc/Ta , Tc,and pm when β = 0.8, I = 900W/m2 , U = 5W/m2K,and Ta = 300K.
Problem7.6
Calculatethecollectorsurfacearea A requiredtoheat500litersofwateradayfrom15 ◦Cto80 ◦C underconditionswherethedailyinsolationonaslantedcollectoris1.13E(7)J/m2,assuming33% collectorefficiency.
Problem7.7
Explainwhyasolarflatplatecollectorusedfordomesticwaterheatingcanworkeveninsubfreezing ambienttemperatures.
Problem7.8
Asphericallyfocusingsolarcollectorisbeingdesignedtogenerateelectricpowerfromaheat engine,similartothatshowninFigure7.9.Forthisdesign, β = 0.9,thedesignsolarirradianceis I = 700W/m2,andtheconcentrationratiois CR = 2000.Assumingthattheheatlossratefromthe collector, U (Tc Ta ),isequaltotheblack-bodyradiationfromthecollector,or σ T 4 c (where σ isthe Stefan–Boltzmannconstant[seeTableA.3]),calculatethemaximumcollectortemperature, (Tc)max
Problem7.9
Ifincidentsolarradiationaverages700W/m2 for8hours,estimatethearea A of80%efficient heliostatsneededtoprovide10MWofelectricalpower(asinSolarOne).Assumethattheefficiency ofconvertingsolarheattoelectricenergyis35%.
Problem7.10
Calculatethelandareainkm2 thatwouldbeneededforasolarthermalpowerplantdelivering 1000MWofelectricalpowerunderthefollowingconditions:Theconcentratingmirrorsreceive 700W/m2;eachconcentratingmirroranditsplatformrequirealandareatwicetheareaofthe mirroritself;theefficiencyofconvertingsolarheattoelectricenergyis35%.
Problem7.11
Anearthsatellitephotovoltaicpowersystemisorientedtowardthesuntointerceptthesolar irradianceof1367W/m2.(a)Ifthephotovoltaiccellefficiencyis17%,calculatetheelectrical poweroutputperunitofsurfacearea.(b)If90%ofthesolarirradianceisabsorbedbythecell, calculatetheheatflowrate,perunitarea,radiatedtospacethatisneededtomaintainthecellat afixedtemperature.(c)Ifthisradiantheatflowisthatofablackbody(σ T 4,wheresigmaisthe Stefan–Boltzmannconstant[seeTableA.3]and T isthecellabsolutetemperature),calculatethe celltemperature.
Problem7.12
Ifsolarirradiationis700W/m2 andtheefficiencyofaphotovoltaiccellis10%,calculatethearea (inm2 andft2)ofaPVcellneededtorunsimultaneously—andwithoutagridorbatterybackup—a typicalrefrigerator,toaster,TV,andstereoset.Useelectricpowerconsumptiondatafromyour ownappliancesorfromtheliterature.
Problem7.13
Asingle-storyretailstorewishestosupplyallitslightingrequirementwithbatteriescharged byphotovoltaiccells.ThePVcellswillbemountedonthehorizontalrooftop.Thetime-averaged lightingrequirementis10W/m2;theannualaveragesolarirradianceis150W/m2;thePVefficiency is10%;thebatterycharging–dischargingefficiencyis80%.Whatpercentageoftheroofareawill thephotocellsoccupy?
Problem7.14
Calculatethepowerproducedperm2 ofwindturbinediskareaforawindvelocityof20miles perhour,assumingapowercoefficient C p of0.5andanairdensityof1.2kg/m3.Calculatethe diameterofawindturbinethatwouldsupply1MWofelectricalpowerundertheseconditions.
Calculatethemechanicalpowerproducedbyawindturbinewithrotordiameter40mwhenthe windspeedis8m/s,assumingapowercoefficient C p of0.3andanairdensityof1.2kg/m3 Howmanyhouseholdscanthiswindturbinesupply,assuminganaveragepowerrequirementof3 kW/household?Howmanywindturbineswouldbeneededforacityof100,000populationwith fourpeopleperhousehold?Calculatethelandareaforthispopulation,inm2 andacres,neededfor thewindturbinefarm,assumingthatthewindturbinesshouldbeplaced2.5rotordiametersapart perpendiculartothewind,and8rotordiametersapartparalleltothewind.Place10windmills perpendiculartothewind,therestparallel.Comparethewindfarmareatothatofatypicalcityof 100,000(single-familyhomes,nohighrises).
Aninventorproposestoutilizeasurplusship’spropellor,ofdiameterequalto2m,asanunderwater “windturbine”atalocationwhereatidalcurrentis2m/s.Calculatethemaximumpowerthatthis turbinecouldproducefromtheunderwaterflow.
FortheAnnapolisRoyaltidalpowerplant,Table7.6liststhepoolarea A =4.8km2,tidalrange H = 6.3m,ratedelectricpower Pel = 17.8MW,andcapacityfactor η = 0.321.(a)Usingequations(7.16)and(7.17)andthesevalues,calculatetheidealtidalenergyandidealtidalpower. [Youmayassumethatthetidalperiodequals4.46E(4)s.](b)Calculatetheaveragepowerandthe effectiveness ǫ = (averagepower)/(idealpower),andcompareitwiththevalueofTable7.6.
Awaveenergysystemisbeingevaluatedforasitewherethedesignwindspeed V is20knots. Usingequations(7.22),(7.23),and(7.25),calculatetheexpectedmeanwaveheight H 2,mean wavefrequency f ,andthewavepowerperunitlength.
Avery,WilliamH.,andChihWu,1994. RenewableEnergyfromtheOcean. Oxford:OxfordUniversityPress. Armstead,H.,andH.Cristopher,1978. GeothermalEnergy.London:E.F.N.Spon.
Baker,A.C.,1991. TidalPower. London:PeterPeregrinus. Boyle,Godfrey,Ed.,1996. RenewableEnergy.PowerforaSustainableFuture. Oxford:OxfordUniversity Press.
Dickson,MaryH.,andMarioFanelli,Eds.,1995. GeothermalEnergy. Chichester:JohnWiley&Sons. Duffie,JohnA.,andWilliamA.Beckman,1991. SolarEngineeringofThermalProcesses, 2ndedition. NewYork:JohnWiley&Sons.
Fay,JamesA.,1994. IntroductiontoFluidMechanics. Cambridge:MITPress. Kreith,Frank,andJanF.Kreider,1978. PrinciplesofSolarEngineering. Washington,D.C.:Hemisphere. Lewis,Tony,1985. WaveEnergyEvaluationforC.E.C. London:Graham&Trotman. Lunde,PeterJ.,1980. SolarThermalEngineering. NewYork:JohnWiley&Sons. Markvart,Thomas,Ed.,1994. SolarElectricity. NewYork:JohnWiley&Sons. McCormick,Michael,1981. OceanWaveEnergyConversion. NewYork:JohnWiley&Sons. Merrigan,JosephA.,1982. SunlighttoElectricity. 2ndedition.Cambridge:MITPress. Probstein,RonaldF.,andR.EdwinHicks,1990. SyntheticFuels. Cambridge:pHPress. Selzer,H.,1986. WindEnergy.PotentialofWindEnergyintheEuropeanCommunity.AnAssessmentStudy. SolarEnergyR&DintheEuropeanCommunity, SeriesG,Volume2.Dordrecht:D.Reidel. Simeons,Charles,1980. Hydropower.TheUseofWaterasanAlternativeSourceofEnergy. Oxford:Pergamon Press.
Seymour,RichardJ.,1992. OceanEnergyRecovery:TheStateoftheArt. NewYork:AmericanSocietyof CivilEngineers. Warnick,C.C.,1984. HydropowerEngineering. EnglewoodCliffs:Prentice-Hall. Wortman,AndrzeJ.,1983. IntroductiontoWindTurbineEngineering. Boston:Butterworth.
NeartheendofthenineteenthcenturyintheUnitedStates,apredominantlysteampowered,coalfueledtransportationsystemhadaidedthetransformationofwhathadbeenamostlyagricultural economyatthecentury’sbeginningintoonedominatedbyindustrialactivity.Railroads,coastal ships,andriverbargesmovedfarmproduceandforestproductstourbanconsumers,mineralores torefineriesandsteelmills,andcoaltoindustrial,commercialandresidentialconsumers.Except fortheaffluentwhocouldaffordhorse-drawncarriages,mosturbanandruralworkerswalkedfrom hometotheplaceofemployment.Inthemajorcities,however,horse-drawnorelectric-powered streetcarsprovidedpassengertransportfordailytravelwhereresidentialareasspreadbeyond theurbancoreinresponsetopopulationgrowth.Long-distancepassengertravelwasexclusively providedbytrainsandships.Nevertheless,horse-drawnwagonswerenecessaryforthedistribution offoodandgoodswithinurbanandruralregionsalike,andanimalpowerprovidedthesourceof muchagriculturalenergy.
Thedevelopmentoftheinternalcombustionengine(ICE)anditssupplyofliquidfossil fueltransformedbothurbanandruralcommunitiesinthetwentiethcentury,mostmarkedlyby greatlyexpandingthekindandfunctionoftransportationandworkvehicles.Bythecentury’s end,practicallyalladultshadtheuseofanautomobileforcommutingtoworkorotherpersonal dailytravel.Passengertraveltoandincentralurbanareasbybusandelectric-poweredrail(above ground,atgroundlevel,orunderground)complementedtheneedforpersonaltravelwherethe densityoftravelcouldnotbeaccommodatedbyautomobilesalone.Mostfreightmovedbytruck, butbulkcommoditieswereshippedbyrailandriverbarge.Therapiddevelopmentofcommercialair travel,beginningatmidcentury,expandedlong-distancetravelavailability,supersedingrailroads, whichhadalreadylostmarketsharetointercitybusesandprivateautomobiles.ICEpowered tractorsrevolutionizedagriculture,andruralfarmpopulationdeclineddrastically.Workmachines (bulldozer,chainsaw,constructioncrane,etc.)greatlyincreasedhumanproductivityintasksthat previouslyconsumedlargeamountsofhardhumanlabor.
Thegrowthoftransportationinthetwentiethcenturyparalleledthatofelectricpower,with bothbecomingmajorfactorsintheeconomiesofdevelopednationsatthecentury’send.Inthe UnitedStatesin1996,transportationandelectricityaccountedforabout25%and45%ofthetotal primaryenergyconsumption,respectively.Theavailabilityofbothelectricpowerandtransportation inmodernindustrialsocietiesisanimportantfactorinhumanproductivity,althoughtheefficiency oftheirusemaywellbeimprovable.
TherapidgrowthinthenumberofU.S.highwaytransportationvehiclesinthetwentieth centuryisgraphicallydepictedinFigure8.1.Thepopulationofroadvehiclesinusehasgrownat arateofabout3.4millionvehiclesperyearsince1950,1 reaching201.5millionin1995,ofwhich 64%areautomobiles,36%aretrucks(light,medium,andheavyduty),and0.3%arebuses.
2 The numberofthesevehiclesiscloselyapproachingthenumberofeligibledrivers,buttheannualrate ofincreaseinvehiclesexceedsthatoftheU.S.populationincreasebyonemillionperyear.3
Thegrowthinthenumberofhighwayvehicles,mostlyprivatelyowned,hasbeenaccompanied byagrowthinhighwaysandroads,publiclyfinancedandmaintained.IntheUnitedStatesthereare currently3.93millionmilesofhighways(79%rural,21%urban),about40vehiclesperhighway mile.Inthelastdecade,highwaymileshaveincreasedatanannualrateofabout0.1%peryear, muchlessthanthe1.7%peryeargrowthinthevehiclepopulation.Thisslowgrowthinhighway milesreflectsboththedifficultyofsitingnewroadways,especiallyinurbanregions,andthescarcity ofpublicfundsforinfrastructureimprovement.Theconcentrationofnationalvehicleownership inurbanareas(whichaccountsforonly21%ofhighwaymilesbut75%ofthepopulation),along
1Thisamountstoacurrentannualgrowthrateof1.7%.Theworldvehiclepopulation,about600millionwith productionofabout50millionnewvehiclesperyear,isgrowingatanannualrateof2.2%.
2About15.4millionnewvehiclesaresoldeachyear,12millionofwhichareneededtoreplacetheaging membersofthe201.5millionvehiclesinuse.Theapproximatevehiclelifeexpectancy,equaltotheratioof vehiclepopulationtonewvehiclesales,is13years.
3TheUnitedStateshasthehighestratioofvehicletohumanpopulationofanynation.Mostdeveloping countriescurrentlyhavevehicle/humanratiosaboutthesameasthatoftheUnitedStatesinthe1920–1940 period.
a DatafromBureauofTransportationStatistics,U.S.DepartmentofTransportation,1999.
withthefastergrowthofvehiclepopulationthanhighwaymiles,hasaggravatedtheproblemof increasinghighwaycongestioninU.S.cities.
Highwayvehiclefuelconsumptionshowsagrowthproportionatetothevehiclepopulation (seeFigure8.1),butannualvariationsarelarger,reflectingthetemperingeffectsofvariationsin economicactivityandlevelofemployment.In1995,U.S.highwayvehiclefuelconsumptionwas 134.8Ggal/y(510.2GL/y),averagingoutto669gallonsperyear(2532L/y)pervehicle.Weighted bythefuelheatingvalue,thisannualconsumptionis16.3Quad/y = 0.54TW.
AbreakdownoftheuseofalltransportationvehiclesintheUnitedStatesin1995isgivenin Table8.1.Smallpassengervehicles(cars,lightdutytrucks,sportsutilityvehicles,vans)account for96%ofallhighwayvehicles,92%ofhighwayvehiclemiles,and76%ofhighwayfuel.These privatelyownedvehiclesclearlydominatehighwaytravelandenergyuse.Publicpassengertravel, bybusandtransitonthegroundandairplaneabove,accountsforonly0.6%oftotaltransportation vehiclemilesannually.
Smallpassengervehiclesareusedonlyasmallfractionofthetime,mostlyforshorttrips. Theiraverageyearlymileage,about12,000milesperyear,amountsto33.7milesperday,aboutan hourperdayofoperatingtime.Theaverageone-waytriplengthislessthan10miles,sovehicles donotmovefarfromtheirhomelocations,onaverage.
IntheUnitedStates,themanufacture,operation,andmaintenanceofhighwayvehiclesand therefininganddistributionoftheirfuelsispervasivelyregulatedbybothfederalandstategovernments.Twooftheregulatoryobjectivesareofinteresthere:controlofexhaustandevaporative emissionsandvehiclefueleconomy.4 Otherobjectivesincludevehicleandpassengersafety,operatorcompetence,andownerfiscalliability.Theregulationofemissionsandfueleconomyfalls principallyuponthevehiclemanufacturer,toalesserextentonthefuelsupplier,andhardlyatall uponthevehicleowner,whoseprincipalresponsibilityistomaintaincontrolequipmentduringthe vehiclelifetime.
Theproblemofairpollutantemissionsfromtransportationvehiclesisprimarilythatassociated withtheprivatepassengervehicle.Theiremissions,principallycarbonmonoxide(CO),oxides
4U.S.federalregulationofvehiclefueleconomywasinstitutedaftertheoilcrisisofthe1970ssoastoreduce thedependenceofthenationaleconomyonthesupplyofimportedoil.Atpresent,thereisnolegislative requirementthatvehiclefueleconomyshouldberegulatedtoreducevehicularCO2 emissions.
ofnitrogen(NOx),hydrocarbons(HC),sulfurdioxide(SO2),andparticulatematter(PM),are distributedgeographicallyinproportiontovehicleusage,whichisconcentratedinurbanregions. ButthesecondarypollutantsphotochemicallyformedfromthedirectemissionsofNOx andHC canreachelevatedlevelsdownwindfromthevehicularsourcesandoutsidetheurbanregion.As aconsequence,allprimaryemissionsare(orsoonwillbe)regulatedtoensurethatprimaryand secondaryairpollutantlevelsdonotexceedharmfullevels,eitherlocallyorregionally.
Inthischapterwediscussthetechnologyoftheautomobileasitaffectstheefficiencyoffuel useandtheemissionofatmosphericpollutants.Thechapteremphasizesthecauseandamelioration ofordinaryairpollutantemissionsaswellasthereductionofCO2 emissionsbyimprovements invehiclefuelefficiency.Wesummarizethecurrentstateofdevelopmentofalternativevehicle systemsthatshowpromiseofsignificantemissionreductions,includingelectricdrivevehicles (battery-poweredorfuel-cell-powered)andhybridelectric/ICEdrivevehicles.
Themostcommonengineinroadvehiclesisthegasoline-fueledsparkignition(SI)reciprocatingengine.Itiseconomicaltomanufactureandmaintain,providesamplepowerperunitweight, andhasausefullifethatequalsthatofthetypicalpassengervehicle.Thelesscommonalternative,thediesel-fueledcompressionignition(CI)reciprocatingengine,ismoredurableandmore fuelefficient,butismoreexpensivetomanufactureandprovideslesspowerperunitweight(unlessturbocharged).5 Eachenginetypehasdifferentairpollutantemissionsandrequiresdifferent technologytoreducethem.
TheSIandCIengines,developedatatimewhenthedominantsteamenginewasareciprocating device,utilizethesamemechanismofamovablepistonwithinaclosed-endcylinderlinkedby aconnectingrodtoarotatingcrankshaftthatconvertsthereciprocatingmotionofthepistonto therotarymotionofthecrankshaft[seeFigure8.2(a)].High-pressuregasinthecylinderexerts anoutwardforceonthepiston,doingmechanicalworkonthecrankshaftasthepistonrecedeson thepowerstroke.Onthereturninwardstroke,wherethecylinderisfilledinitiallywithlow-pressure gas,lessworkisdonebythecrankshaftonthepistonthanwasdoneonthecrankshaftduringthe outwardstroke,sothecrankshaftdeliversnetpositiveworktothemechanismtheengineisturning. Aflywheelisrequiredtosmoothouttherotationalspeedofthecrankshaftwhilethepistonexerts variableamountsoftorqueduringitsreciprocatingmotion.
AspreviouslyexplainedinSection3.10ontheOttocycle,ahighpressureisgeneratedin thecylinderjustatthebeginningoftheoutwardexpansionstrokebyburningafuelwithair inthecylinder.IntheSIengine,afuel–airmixture,preparedoutsidethecylinder,flowsinto itpriortotheinwardcompressionstroke,eventuallybeingignitedbyasparkwhenthepiston reachesitsinnermostposition(calledtopcenter,TC).Ontheotherhand,fortheCIengine,pure airisingestedpriortothecompressionstrokeandthefuelissprayedintotheairattheendof
compression,whereuponitignitesandburnsquickly,withoutthenecessityofaspark,toproduce apressurerise.
Tomakearepetitivecycleoutofthisprocess,itisnecessarytoreplacetheburnedgasesinthe cylinderwithafreshcharge(fuel–airmixturefortheSIengine,pureairfortheCIengine).This isaccomplishedbyopeningportsinthecylinderconnectedtoducts(calledmanifolds)thateither conductthefreshchargeintothecylinderorcollectthecombustiongasesleavingthecylinderat theendoftheexpansionstroke.Therearetwomechanicalschemesforeffectingthisreplacement ofburnedgasbyafreshcharge.Inone,calledthe two-strokecycle, thefreshchargedisplacesthe combustionproductsduringashorttimeintervalwhenthepistonisnearitsoutermostposition (calledbottomcenter,BC)andbothaninletportandanexhaustportareopen.Onlytwostrokesof thepiston,oneinwardtocompressthefreshchargeandthesecondoutwardtoexpandtheburned gases,areneededtocompletethistwo-strokecycle,duringwhichthecrankshaftturnsthroughone revolution.Inthesecondscheme,calledthe four-strokecycle [seeFigure8.2(b)–(e)],theoutward powerstrokeisfollowedbyafullinwardstrokeinwhichthepistondisplacesthecombustion products,pushingthemoutthroughanopenexhaustportlocatedintheclosedendofthecylinder (calledthe cylinderhead).Attheendofthisinwardstroke,calledtheexhauststroke,theexhaust portisclosedandaninletportisopened,allowingthepistontosuckinafreshchargeasitmoves outwardduringthesubsequentintakestroke.Byaddingthesetwoextrastrokes(anextrarevolution ofthecrankshaft),afreshchargeispreparedinthecylinder,permittingthetwosubsequentstrokes tocompress,burn,andexpandthecharge,therebyproducingwork.Thesefourstrokes(twocrank revolutions)comprisethefour-strokecycle.
Almostallhighwayvehiclesarepoweredbyfour-strokecycleengines,predominantlygasolinefueledSIenginesforpassengervehiclesanddiesel-fueledCIenginesfortrucks.Two-stroke-cycle SIenginesaremostlyusedtopowertwo-wheeledvehicles,suchasmotorcyclesandmopeds. Enginesinthelattervehicleshavelowerfuelefficiencyandhigherexhaustpollutantemissions, butarelighterandlessexpensivetomanufacture(foragivenpower).Thetrendofincreasingly stringentgovernmentregulationofpollutantemissionsandvehiclefuelefficiencyhasspurred manufacturerstoimprovebothtwo-andfour-stroke-cycleengines,butthepredominantuseof
four-stroke-cycleenginesisunlikelytochangeintheforeseeablefuture,especiallybecausetwostrokecycleengineshavehigherexhaustpollutantemissions.6
AlthoughSIandCIenginesaresimilarinthattheybothburnfuelwithairinthecylinderwhen thepistonisnearTC,soastocreatethepressurerisethateventuallyproducesnetmechanical workduringthefour-strokecycleofevents,theydifferinthreeimportantways.IntheSIengine thefuelandairaremixedtogetheroutsidethecylindertoformauniformfuel–airmixturethatis ingestedduringtheintakestroke;intheCIenginethefuelissprayedintoairinthecylinder,near TC,forminganonuniformfuel–airmixture.IntheSIengine,thecombustiblemixtureisburned whenignitedbyasparkattheappropriatetimeinthecyclenearTC,whereastheCIfuel–air mixtureignitesspontaneously,shortlyafterthefuelissprayedintotheenginecombustionchamber attherequisitetimenearTC.Athirddifferenceisthemethodofcontrollingthepoweroutputof theengine,animportantconsiderationbecausethevehicleenginemustoperatesatisfactorilyover awiderangeofpowerinacontinuouslyandfrequentlyvariablemanner.Thisisaccomplishedin theSIenginebyadjustingtheairpressureintheintakemanifoldbymeansofathrottlevalvethat lowersthatpressurebelowtheatmosphericvalue,themoresoastheenginepowerisreduced.In theCIengine,thepowerisloweredbyreducingtheamountoffuelinjectedintothecylinderat eachcycle.Thesedifferenceshaveimportantimplicationsfortheformationofpollutantsandthe fuelefficiencyofeachtypeofengine,SIorCI.
Thepowerneededforapassengervehicleengineisintherangeoftenstohundredsof kilowatts.Formanypracticalreasons,thecylindersizeinlight-dutypassengervehiclesandtrucks isapproximatelythesameforallengines,withhigher-poweredenginesusingmorecylinders thansmallones.Thusenginesofincreasingpowermaycontain2,3,4,5,6,8,or10cylinders. Geometrically,thepistonmotionsinthesecylindersarephasedsothatthecylindersfireatequally timedintervalsduringthetworevolutionsofthecrankshaft(720 ◦)thatconstitutethefour-stroke cycle.Thisalsofacilitatesthemechanicalbalanceofthemovingparts,whichwouldotherwise causeexcessiveenginevibrations.Itisgeneralpracticetoconstruct2-,3-,4-,5-,and6-cylinder engineswithallthecylindersalignedonebehindtheother,while6-,8-,and10-cylinderengines havetwobanksofcylindersinaV-shapedarrangement.Thispermitsmoreefficientuseofthe enginespaceinthevehicle,especiallyforfront-wheel-drivevehicles.
Toperformproperly,anyreciprocatinginternalcombustionenginemustburnamixtureofairand fuelinaveryshorttime,completingthecombustionsoonafterthepistonbeginsitsoutwardpower stroke.Thedurationofcombustionshouldnotmuchexceedabout50degreesofrotationofthe crankshaft,whichwouldequalabout2msifthecrankshaftwererotatingat3600revolutionsper minute(rpm),atypicalvalueforavehicletravelingathighspeed.Inorderforafuelmoleculeto burn,itmustbemixedintimatelywithoxygenatthemolecularlevel.Eventhen,theconversion ofahydrocarbonmoleculetocarbondioxideandwatervapormoleculeswillnotoccurrapidly enoughunlessthemixedairandfuelaresufficientlyhot.Thisisassuredbytherapidtemperature riseofthecylinderchargeduringtheinwardcompressionstroke.
ThecombustionprocessintheSIengineisinitiatedbyatimedelectricsparkthatstartsaflame frontpropagatingthroughtheair–fuelmixture.Asitsweepsthroughthecombustiblemixture, heatingthereactantstothepointwheretheyburnextremelyrapidly,itconvertsfueltoproductsof combustion,witheachfuelmoleculebeingprocessedinabout1 µs.Whentheflamefrontreaches thewallsofthecombustionchamber,itisextinguished,butnotuntilallexceptatinyproportion ofthecombustiblemixturenexttothewallwillhavebeenreactedtoformcombustionproducts.7 However,inordertopropagateareliable,rapidlymovingflame,thecombustiblemixturemust notbetoorichortoolean;thatis,itmustnothavetoomuchortoolittlefuel,comparedtothe amountofair,thanisneededtocompletelyconsumeallthefuelandoxygenpresent,calledthe stoichiometricmixture.Itisforthisreasonthatthefuelandairaremixedincarefullycontrolled proportionspriortoorwhileenteringtheenginecylinder.Toreduceenginepower,theamount offuelburnedpercycleisloweredbyreducingthepressure,andhencedensity,oftheincoming charge;itsproportionsoffuelandair,aswellasitstemperature,remainingunchanged.Thusthe favorablehigh-speedflamepropagationrateandrapidcombustionareretainedinSIengines,even downtoidlingconditions.
FuelcombustionintheCIengineproceedsquitedifferently,withoutflamepropagation,albeit withcomparablespeed.Fuelinjectedintotheveryhotairwithinthecylinderisquicklyevaporated, andthefuelvaporthenbecomesmixedwiththesurroundingairandburnsspontaneouslywithout thenecessityofsparkignition.Thesurroundingairswirlspasttheinjectornozzle,providingaflow ofoxygenneededtooxidizetheevaporatingfueldropletsastheyemergefromthenozzle.When lesspowerisneeded,lessfuelisinjectedintothefixedamountofairinthecylinder,consuming lessoxygenandreducingthepressureriseinthecylinder.Thusthefuel–airratiointheCIengine isvariableandlean.Atmaximumpower,someexcessairisrequiredtoburnallthefuelbecause mixingconditionsarenotideal.
Atthemolecularlevel,thecombustionprocessismuchmorecomplexthanmightbeinferred fromtheoverallstoichiometryofthereaction.Forexample,thecompleteoxidationofoneoctane molecule(C8H18)requires8 + 9/2oxygenmolecules(O2),forming8CO2 and9H2Omolecules. Therearrangementofthecarbon,hydrogen,andoxygenatomsamongthereactingmolecules occursonestepatatime,requiringnumerousindividualchangesassingleHandCatomsare strippedawayfromthefuelmoleculeandoxidized.Thesechangesareaidedbyveryreactive intermediatespeciescalledradicals,suchasH,O,OH,C2,CH,CH2,andsoon,thatactto acceleratethemolecularrearrangementbutthatdisappearoncethereactioniscompleted.Nevertheless,thecombustionprocessisnotperfect,sothatsmallamountsofunreactedorimperfectly oxidizedproductsmayremain;moleculesthatreacheddeadendpathsandwereunabletoattain thecompletethermochemicalequilibriumofthebulkofthereactants.Thesemoleculesaredispersedamongtheprincipalcombustionproductsand,unlessremoved,entertheatmosphereasair pollutants.
Nitricoxide(NO)isanimportantairpollutantthatisabyproductofthecombustionprocess.It isformedfromnitrogenandoxygenbecauseitisthermochemicallyfavoredatthehightemperature ofthenewlyformedcombustionproducts.Itisproducedrapidlybythetwofollowingreaction
7Undercertainconditionsitispossibleforthecombustiblemixturetoignitespontaneouslyandburn explosively,inanuncontrolledanddestructivemanner.Thisiscalledcombustionknock,whichisavoidedby controllingthechemicalpropertiesofthefuel.
steps,facilitatedbythepresenceofatomicoxygeninthecombustionzone:
TherewouldbenoNOintheexhaustgasreachingtheatmosphereifthesereactionsreversed theircourseastheproductgastemperaturedeclinedduringtheexpansionstrokeandtheNO maintainedthermochemicalequilibriumwiththerestoftheexhaustproducts.Unfortunately,this reverseprocessceasesduringtheexpansion,leavingaresidualamountofNOthatcanbereduced bysubsequenttreatmentintheexhaustsystemoutsidethecylinder.ThisresidualNOissensitively dependentupontheair–fuelratioandtheflametemperatureinthecombustionprocess.
Theburningoffuelinthecylinderofareciprocatinginternalcombustionengineproducesmechanicalpowerbyexertingaforceonthemovingpiston.Atanyinstant,if V isthevolumeofgas inthecylinderand p isthegaspressure,thentheincrement dW inworkdonebythegasonthe pistonwhenitmovessoastoincreasethevolumebyanamount dV is
Thetotalwork W donebythegasinonecycleoftheengine(twoorfourstrokes)isfoundby integratingequation(8.3)overacycle:
where p isaneffectiveaveragegaspressureand Vc isthecylinderdisplacement—thatis,the volumeofgasdisplacedwhenthepistonmovesfromtheinnermosttooutermostposition.If thecrankshaftrotatesatafrequency N and n isthenumberofcrankrevolutionspercycle,thenthe timeforacompletecycleis n/N andthepowerinputtothepiston P is
Figure8.3depictsthevariationofgaspressureinthecylinderofafour-stroke-cycleSIengine. Theuppermostcurvetracesthepressureduringtheoutwardpowerstroke,whichisfollowedbythe inwardexhauststroke,forwhichthecylinderpressureisaboutequaltothatintheexhaustmanifold. Thepressureinthefollowingintakestrokeislower,anditisequaltotheintakemanifoldpressure sothatthefinal,compressionstrokestartsfromalowpressure.Theworkpercycle, pdV,canbe seentobethedifferencebetweentheareaenclosedbytheupperloopofFigure8.3minusthatof thelowerloop.
Onlyapartoftheworkdonebythegasonthemovingpistonsofanengineisdeliveredtothe outputshaftoftheengine,whereitcanthenbeconnectedtothetransmissionandultimatelytothe wheelstopropelavehicle.Thefrictionofthepistonsmovingalongthecylindersurfaces,aswellas
thefrictionofthepiston,connectingrod,andcrankshaftbearings,alongwiththepowerconsumed inoperatingthevalves,pumpingthelubricant,andcoolingthewater,reducethepoweroutputof theenginebelowthatdeliveredbythegasinthecylinders[equation(8.5)].Thisnetoutput Pb, calledthe brakepower, isdeterminedwhilerunningtheengineinalaboratoryatvariousrotational speeds N andthrottlesettings.Thepoweriscomputedastheproductofthebraketorque Tb (which ismeasured)andtheshaftangularfrequency2π N:
Sometimesthepowerandtorqueareexpressedintermsofanaveragecylinderpressure p
, calledthe brakemeaneffectivepressure, usingequations(8.5)and(8.6)
where Ve isthe enginedisplacement, theproductofthecylinderdisplacementandthenumberof cylinders.Thebrakemeaneffectivepressureisanindicatorofthecycleworkperunitdisplacement volumeoftheengine,andislittleaffectedbyenginesize.Itdirectlyreflectstheamountoffuel burnedperunitofcylindervolume.8
Thesizeofengineinstalledinavehicleisdeterminedbythepowerrequiredtopropelthe vehicleatthespeedandaccelerationneededtoperformsatisfactorily.Animportantcharacteristic ofanengineisitspowerandtorquewhenoperatedatmaximumfuelinputpercycle.ForanSI engine,thisoccurswhenthethrottleiswideopen.Figure8.4isasketchofthebrakepower Pb andbrakemeaneffectivepressure pbmep [whichisrelatedtothebraketorque Tb byequation(8.7)]
asafunctionofenginespeed N .Thebrakepower Pb risesmonotonicallywithspeed,reachinga maximumvalue max Pb atanenginespeed Nm .Ontheotherhand,thebrakemeaneffective
pressure pbmep variesonlymoderatelyovertherangeofspeedsbetweennormalidlingspeed Ni [typically800rpm(13.3Hz)]andthespeed Nm atmaximumpower.Itreachesitsmaximumvalue maxpbmep ataspeedabouttwo-thirdof Nm.
Atconstantthrottlesettingorinletpressure,thebraketorquedoesnotchangemuchwith enginespeed.Atlowspeeds,thetorquedeclinessomewhatduetoheatlossesfromthecylinder. Athighspeed,thetorquedeclinesmoreprecipitously,aspressurelossesintheinletandexhaust valvesandincreasedpistonfrictionreducethebrakemeaneffectivepressureandcausethebrake powertopeak.Toimprovehigh-speedpower,multipleinletandexhaustvalvesmaybeusedand theenginemaybesupercharged.
Thecharacteristicsofasampleofmodelyear2000passengercarsandlightdutytrucks equippedwithSIenginesarelistedinTable8.2,inorderofascendingenginedisplacement.The bigger,morepowerfulenginesemploymorecylinders,butthecylindervolumeismorenearly thesameamongtheseenginesthanisthesize.Thereareonlysmalldifferencesinthemaximum brakemeaneffectivepressureamongtheseengines,andtherearecomparablysmalldifferencesin powerperunitofenginedisplacement.Asweshallseebelow,thedifferencesinenginesizereflect thedifferencesinvehiclemass,abilitytoaccelerate,andvehiclefueleconomy.
Thefueleconomyoftheengineisusuallyexpressedasthe brakespecificfuelconsumption(bsfc), theratioofthemassoffuelconsumedperunitofmechanicalworkoutputbytheengineshaft. Thevalueofthebrakespecificfuelconsumptiondependsupontheengineoperatingconditions. ForSIengines,themosteconomical(i.e.,theminimum)bsfcisabout0.27kg/kWh,whilefor
CIengines,itislower,about0.20kg/kWh.9 Analternativemeasureofengineperformanceisthe thermalefficiency ηe,theratioofenginemechanicalworktotheheatingvalueofthefuelmass consumedtoproducethatwork.Intermsofthelowerheatingvalue(LHV)perunitmassoffuel, thesefueleconomymeasuresarerelatedby
Thelowerheatingvaluesofvehiclefuels,perunitmassorvolume,areempiricallyrelatedtothe fuelspecificgravity
9Thebsfcissometimesgiveninunitsofpounds(mass)perbrakehorsepowerhour,whereonepound(mass) perbrakehorsepowerhourequals1.644kg/kWh.
Forgasolineof SG = 0 72,the LHV is43.55MJ/kgor31.6MJ/L,whilefordieselfuelof SG = 0 85, the LHV is41.18MJ/kgor35MJ/L.10 Convertingtothermalefficiencybyequation(8.8),thebest SIengineefficiencyisabout31%whilethatofaCIengineis44%.
Theengineefficiency ηe isafunctionoftheenginespeed N andbrakemeaneffectivepressure, asdemonstratedinFigure8.5.Itspeakvalueoccursatabout35%ofthemaximumenginespeed Nm and80%ofthemax pbmep,wheretheenginepowerisabout35%ofthemaximumpower.The efficiencydeclinesrapidlywithdecreasing pbmep butlesssowithincreasingspeed.Thisdecrease ofefficiencyisaconsequenceoftherelativeincreaseofenginefrictionandflowlosses,compared toengineoutput,as pbmep andenginepowerarereducedbelowtheoptimumvalue.Becausea roadvehicleenginemustprovidethefullrangeofitspoweroverthespeedrangeofthevehicle,it cannotoperateatmaximumefficiencyallthetime.Nevertheless,bypropermatchingoftheengine tothevehicle,itispossibletominimizethefuelconsumptionneededtomeetaparticularvehicle drivingcycle.
Movingavehiclealongahighwayrequirestheexpenditureofmechanicalpowertoturnthewheels. Partofthispowerisneededtoovercomethedragforceexertedbytheaironthemovingvehicle. Anotherpartisneededtocountertheresistanceofthetiresmovingovertheground,calledthe rollingresistance.Ifthevehicleisclimbingahill,additionalpowerisneededtoliftitvertically
10Dieselfuelhasmoreheatingvalueperunitvolumethangasoline,byabout11%.Wherevehiclefuel efficiencyismeasuredintermsofmilespergallonorkilometersperliter,adiesel-poweredvehiclehasan inherent11%advantage,otherthingsbeingequal.
intheearth’sgravitationalfield.Finally,whenthevehicleacceleratestoahigherspeed,poweris neededtoincreasethekineticenergyofthevehicle.
Theaerodynamicdragforceactingonavehicleisconvenientlygivenastheproduct ρC D AV 2/2,where ρ isthemassdensityofair(kg/m3), A isthefrontalarea(m2)ofthevehicle(about80%oftheheighttimesthewidth), V isthevehiclespeed(m/s),and C D isthedrag coefficient.Thelatterisempiricallydeterminedbytestingvehiclemodelsinawindtunnel,and itsvalue,generallyintherangeof0.25–0.5,dependsverymuchonthevehicleshapeandexternal smoothness.Giventhefactthatapassengervehiclemustenclosethepassengersinasafestructure employinggoodvisibilityandwithoutexcessmaterial,itisdifficulttoreduce C D belowabout 0.25.Thecorrespondingpower Pair neededtoovercometheairresistanceistheproductofthe forcetimesthevehiclevelocity:
Thepowerrequiredtoovercomeairresistancethusincreasesasthecubeofthevehiclespeed.At highvehiclespeeds,airresistanceisthemajorfactorindeterminingtherequirementforengine power.
Itmightseemthatwheelsshouldpresentlittleornoresistancetoforwardmotion.Whilethis resistanceissmall,itcannotbereducedtozero.Thesourceofthisresistanceliesinthedeflection ofthetirewhereitcomesintocontactwiththeground.Thisdeflectionisnecessarytosupportthe weightofthevehicleandtoprovideacontactareabetweenthetireandtheroadthatisneededto preventthetireslippingalongtheroadsurface.Thedeflectionissuchthat,whenthewheelrotates, theroadsurfaceexertsaretardingtorqueonthewheel,whichmustbeovercomebytheengine drivesystem,andacorrespondingretardingforceonthewheelaxle.Thisforceisusuallyspecified as C R mg,andthecorrespondingpower Proll becomes
Proll = C R mgV (8.11)
where m isthevehicularmass, g istheaccelerationofgravity(mg isthetotalvehiclegravity forcesupportedbythetires),and C R isasmalldimensionlessconstantwhosevaluedependsupon thetireconstructionandpressure.Stiff,highlypressurizedtireswillhavesmaller C R ,butwill bemorepronetoslipandtransmitroadunevennesstothevehicle.Thevaluesof C R lieinthe range0.01–0.02.Becausetherollingpowergrowsonlyasthefirstpowerofthevehiclespeed,it isgenerallysmallerthan Pair athighspeedsbutcanbecomelargeratlowspeeds.
Whenclimbingahillofriseangle θ ,theforceofgravityactingonthevehicle, mg,hasa component mg sin θ opposingtheforwardmotion.Thepowerrequiredtomaintainasteadyclimb rateis Phill = mgV sin θ (8.12)
Finally,theinstantaneouspowerrequiredtoacceleratethevehicle, Pacc,issimplythetime rateofincreaseofvehicularkineticenergy, m(1 + ǫ)V 2/2,or
where ǫ isasmalldimensionlessconstantthataccountsfortherotationalinertiaofthewheelsand drivetrain,and dV/dt istheaccelerationofthevehicle.Ofcourse,whenthevehicledecelerates (dV/dT < 0)byusingthebrakesorclosingthethrottle,thenegativepowerofequation(8.13)does notputpowerbackintotheengine,sothat Pacc iseffectivelyzeroduringdeceleration.Inelectric drivevehicles,someofthedecelerationenergycanberecovered,storedinbatteries,andusedlater intheoperatingcycle,savingfuel.
Thetotalpowerthusbecomes
Thefirstthreetermsontheright-handsideofequation(8.14),thepowerrequiredtoacceleratethe vehicle,overcometherollingresistance,andclimbahill,areeachproportionaltothevehiclemass m.Incontrast,thelastterm,thepowerneededtoovercomeaerodynamicdrag,isindependentof thevehiclemass,dependinginsteadonthevehiclefrontalarea A,whichisnearlythesameforall lightdutypassengervehicles(seeTable8.2)butisnoticeablylargerforlight-dutytrucks.Fora givendrivingcycle,heavycarswillrequiremorepowerfulenginesandwillconsumemorefuel, moreorlessinproportiontovehiclemass(seeTable8.2),thanwilllightvehicles.Averyfuel efficientvehicleisnecessarilyalightone.
Fordrivingatasteadyspeed,onlyrollingandaerodynamicresistancemustbeovercome,the powerrequiredbeing
Forthetypicalpassengervehicle,therollingandaerodynamicresistanceareequalataspeedof about60km/h.Forhighwaycruisingat120km/h,theaerodynamicdragwouldbefourtimesthe rollingresistance,thepowerrequiredbeinglessdependentuponvehiclemassthanwhendriving atlowspeed.
Theparametersofvehicledesignthatleadtoincreasedfueleconomyincludelowvaluesof vehiclemass m,dragareaproduct C D A,androllingresistancecoefficient C R .Inaddition,recovery ofvehiclekineticenergyduringdecelerationforreuseduringotherportionsofthedrivingcycle willalsoimprovevehiclefueleconomy.
Enginepowerisamaximumatthehighestenginespeed Nm ,butlesspowerisavailableatlower enginespeeds(seeFigure8.4).Ifwewishtomaximizethepoweravailableatallvehiclespeeds,it isnecessarytoreducetheratioofenginespeedtowheelspeedasthevehiclespeedincreases.This isaccomplishedinthetransmission,adeviceattachedtotheenginethatprovidessteppedspeeds tothedriveshaftthatconnectsittothewheels.
Therearetwoformsoftransmission:manualandautomatic.Inavehiclewithanormaltransmission,thevehicleoperatordisengagesaclutchandmanuallyshiftstoadifferentgearbefore engagingtheclutchagain.Inanautomatictransmission,afluidcouplingreplacestheclutchandgear shiftingisaccomplishedbycomputer-controlledhydraulicactuators.Themoreoperator-friendly
Adiagramofthemaximumenginepowerprovidedbyafour-speedtransmissionasafunctionof vehiclespeed(solidlines).Thedash–dotlineisthesteady-speedvehiclepowerrequirement.Contoursof relativeenginethermalefficiencyforlesserpoweroperationinfourthgearareshownasdashedlines,with the100%peakbeingmarkedby +
automatictransmissionislessefficientthanthemanualonebyabout10percentagepoints.Most passengervehiclesemployfourorfiveforwardspeedsandonereverse.Thespeedratiobetween adjacentshiftsisabout1.5.
Thedriveshaftconnectingtheengine/transmissiontothewheels,eitherfrontorback(orboth inthecaseoffour-wheeldrive),utilizesadifferentialgeartoapplyequaltorquetobothdrive wheelswhileallowingdifferentwheelspeedsduringmaneuvering.Thedriveshaftprovidesfor theverticalmotionofwheelswithrespecttothechassisandforthesteeringmotionwhenusinga front-wheeldrive.
Themaximumenginepoweravailabletoavehicle,asafunctionofvehiclespeedandtransmissiongearratio,isshowninFigure8.6(solidlines)forafour-speedmanualtransmission.Each ofthesefourcurvesisidenticaltothebrakepowercurveofFigure8.4,butisplottedhereagainst vehiclespeedratherthanenginespeed.Atanyvehiclespeed,themaximumenginepower(which occursatwideopenthrottle)istheordinateofthecorrespondinggearshiftlevel(1,2,3,or4). Atlowervehiclespeeds,threeorfourlevelsareavailable,withthelowestyieldingthegreatest possiblepower.Atthehighestspeed,onlythehighestgearcanbeusedtodeliverenginepower.
Forconstant-speedtravel,theenginepowerdemand,asdeterminedfromequation(8.15),is shownasadash–dotcurveinFigure8.6.Itrisesrapidlywithvehiclespeed,astheaerodynamic dragoutpacesrollingresistance.Atanyvehiclespeed,theverticaldistancebetweenthe“demand” (dash–dot)curveandthe“maximumsupply”(solid)curveisthemaximumpoweravailablefor vehicleaccelerationandhillclimbing.Atlowvehicularspeeds,thisdifferenceisgreatestforthe lowestshiftlevel,whileatthehighestspeedthisdifferenceisleast,shrinkingtozeroatthevehicle’s topspeed.Thelowergearlevelsareneededtoprovidehighaccelerationatlowvehicularspeed.
ItisclearfromFigure8.6thatonlyasmallfractionofthemaximumenginepowerisused atsteadyvehiclespeeds,reachingabout40%atcruisingspeed.Theremainderisavailablefor accelerationandhillclimbing.Foraveragevehicledutycycles,onlyafractionofthetimeisused inacceleration,andtheportionofthatatwhichtheenginepowerisamaximumissmall.The vehiclecapacityfactor,thetime-averagedfractionofinstalledpowerthatisutilizedbyamoving
vehicle,islessthan50%fortheaveragedutycycle.Nevertheless,forsatisfactoryperformance reservepowerisrequiredoverthenormalspeedrangeofthevehicle.
SuperimposedinFigure8.6aretherelativeefficiencycurvesofFigure8.4(dashedlines),for fourthgear.The100%peakismarkedby +.Itisreadilyapparentthat,forasteadyvehiclespeed, theenginerelativeefficiencyisatbest50%forspeedslessthanhalfthecruisespeed,risingto about80%atcruisespeed.Thenormalpracticeofdownshiftingatlowspeedsleadstoevenlower relativeefficiencies.Takingintoconsiderationtheshortperiodsofaccelerationwithinatypical drivingcycle,thetime-averagedrelativeengineefficiencyiscertaintobelessthan80%,perhaps closerto60%.Thisperformancecouldbeimprovedalittlebyaddingafifthgearlevel,butthat wouldleavelesspowerreserveforacceleration,necessitatingdownshiftingbeforeaccelerating atthehigherspeeds.Analternativeistoemployacontinuouslyvariabletransmissionthatcan reachhigherrelativeengineefficienciesoverarangeofsteadyspeeds,butwilldownshiftwhen accelerationisneeded.
Traditionally,theefficiencyofuseoffuelbyavehicleismeasuredbythedistanceitmovesin atripdividedbythefuelconsumed.11 Forroadvehicles,thisratioiscustomarilyreportedinthe unitsofkilometersperliter(or,intheUnitedStates,milespergallon).Thevehicle’sfuelefficiency determinesboththefuelcostofthetripandtheaccompanyingcarbonemissionstotheatmosphere, whicharealmostentirelyintheformofcarbondioxide.Thevehicleoperatorisconcernedwith thefuelcostwhilenationalauthoritiesareconcernedwiththeeffectsofaggregatevehicularfuel consumptionontheproblemsofmaintainingareliablefuelsupplyand,mostrecently,onthe contributionofvehiclestothenationalbudgetofgreenhousegasemissions.IntheUnitedStates, wherefuelretailpricesarelowcomparedwithmostotherdevelopednations,fuelcostisasmall fractionoftotaloperatingcostsofapassengercar,yetitisstillafactorinconsumerchoiceofvehicle. ComparedwithEuropeanandJapaneseowners,Americansonaveragedrivelarger,heavier,less efficient,andmoreexpensiveautomobiles,butpaylessforfuel.Nationaltaxpoliciesthatgreatly affectthepriceoffuelplayalargeroleinthisdifference.
Thedevelopmentofvehicleandenginetechnologythatismorefuelefficientandlessemitting ofpollutantsisprimarilyaresponsebymanufacturerstonationalpoliciesofregulationandeconomictaxdisincentivesthatnarrowthewindowofvehicledesignsthatappealmosttoconsumers. Inthissectionweconsiderthetechnologicalfactorsthatdirectlyeffectvehiclefuelefficiencywhile meetingtherestrictionsonvehicleemissions.
IntheUnitedStates,fuelefficiencyofnewpassengervehiclesandlighttrucksisregulatedbythe NationalHighwayTrafficSafetyAdministrationoftheU.S.DepartmentofTransportation.This regulationhaditsoriginintheoilshortagesofthe1970scausedbyanembargoonoilexports
11Weusethetechnicalterm fuelefficiency interchangeablywiththecommonterm fueleconomy, usedin governmentregulations.Afuelefficientvehiclewouldbeeconomicaltooperate,havinglowfuelcostper distancetraveled.
byOPECnations.Toamelioratethenation’sfuturedependenceuponimportedoil,Corporate AverageFuelEconomy(CAFE)standardswerepromulgated,beginningwiththe1978modelyear. Thesestandardsrequiredautomobilemanufacturerstodesignvehiclessothattheirsales-averaged vehiclefueleconomy12 didnotexceedtheleveldesignatedforeachoftwovehicleclasses:passenger vehiclesandlighttrucks(pickuptrucks,vans,sportutilityvehicles).13 In2000,theCAFEstandards forpassengercarsandlighttruckswere27.5miles/gallon(11.7km/L)and20.7miles/gallon(8.8 km/L),respectively.
Themeasurementofvehiclefueleconomyisbasedupondynamometersimulationsoftypical drivingcyclesforurbanandhighwaytravel,originallydevisedbytheU.S.EPAforevaluating vehicleemissions(UrbanDynamometerDrivingSchedule,UDDS).Thetestvehicleisoperated inastationaryposition,whilethedrivewheelsturnadynamometerthatisadjustedtoprovide theacceleration/decelerationandairresistanceloadsasdescribedinequations(8.10)and(8.13). Whilethedynamometerdoesnotpreciselysimulatetheseforcesateachpointinthetest,itsufficestoprovideareasonableaverageforcharacterizingtheemissionsandfueleconomyofthe testcycle.
Twotestcyclesareusedformeasurementsofvehiclefuelefficiency,oneforurbandriving andtheotherforhighwaytravel.Figure8.7showsthevehiclespeedversustimeforeachcycle. Theurbancyclehasmanystartsandstops(25ina17.8-kmridelasting23minutes)andalow averagespeed(whilemoving)of31.4km/h.Foranaveragevehicle,about34%oftheenergy neededtopropelthevehiclethroughthiscycleisdissipatedinbraking.Incontrast,thehighway drivingcycleproceedsatamoreuniformspeed,averaging78.5km/hovera16.5-kmrun,with onlyonestop.Thetwocyclesrepresenttwocommontypesofvehicleuse:(a)stop-and-godriving incongestedurbanstreetsand(b)uncongestedfreewaytravel.Forpassengercars,highwaytravel isbetween30%and50%morefuelefficientthanurbantravel(seeTable8.2).Newvehicle purchasersarenotifiedofthefueleconomiesforurbanandhighwaytraveldeterminedfromthese tests.14 ForthepurposeofenforcingCAFEstandards,aweightedaverageisused(55%urbanand 45%highway).15
12Whiletheaveragefueleconomyisreportedinunitsofmilespergallon,theaveragingvariableisthefuel consumption,measuredinunitsofgallonspermile.Thustheaveragefuelconsumptionpermiletraveledis regulated.
13Passengercarsarecalledlight-dutyvehicles(LDV)todistinguishthemfromheavy-dutypassengervehicles suchasbusesthatcarrymorethan12passengers.Light-dutytrucks(LDT)areutilityvehiclesthatcancarry freightorpassengers,whosegrossvehicleweightrating(GVWR)islessthan8500pounds(3.856t)and frontalareaislessthan45squarefeet,orcanoperateoffhighways(e.g.,sportutilityvehicle).Thereare fourcategoriesofLDT(LDT1,LDT2,LDT3,andLDT4)dependinguponthevehicleGVWR(<6000lb, >6000lb)andtheloadedvehicleweight(LVW),whichisthesumofthevehiclecurbweightplus300pounds (<3750lb, <5750lb).Thevehiclecurbweight(VCW)isthemanufacturer’sestimatedweightofafueled vehicleinoperatingcondition.
14Theconsumerguidetovehiclefueleconomydiscountsthehighwayandurbantestfueleconomiesby10% and22%,respectively,toaccountpartiallyfordisparitiesinthetestprocedurecomparedtoaveragedriving conditions.Studiesoffuelconsumptionofvehiclesinuseindicatehigherconsumptionthantheconsumer guidevalues.
15Theweightingfactorsareappliedtothefuelconsumption,whichisthereciprocalofthevehiclefuel economy.
Figure8.7 U.S.EPA1972drivingcyclesforevaluatingemissionsandfueleconomy.Uppercurve:Urban drivingcycle(17.77-kmlength,22.87-minduration,31.4-km/haveragespeed,91-km/hmaximumspeed, 1.48-m/s2 maximumacceleration,cruisetime7.9%,accelerationtime39.6%,decelerationtime34.6%,idle time17.8%,1.43stopsperkilometer).Lowercurve:Highwaydrivingcycle(16.5-kmlength,12.7-min duration,78.5-km/haveragespeed,96.4-km/hmaximumspeed,1.43-m/s2 maximumacceleration,cruise time16.5%,accelerationtime44.4%,decelerationtime38.7%,idletime0.4%,0.06stopsperkilometer). (DatafromBlackmore,D.R.,andA.Thomas,1977. FuelEconomyoftheGasolineEngine. London: Macmillan.)
IntheUnitedStatesin1993,aconsortiumofU.S.vehiclemanufacturersandtheU.S.federal governmentundertooktodevelopamid-sizepassengervehiclethatwouldattainafueleconomy aboutthreetimesthecurrentvaluebutwouldhaveperformancepropertiesequaltothoseofcurrent vehicles,yetwouldbeaffordablypriced.KnownasthePartnershipforaNewGenerationof Vehicles(PNVG),thisambitiousprogramplannedforintroducingsuchavehicleprototypebythe modelyear2004.Thefueleconomygoalwasjudgedtobeattainableusingcurrentordeveloping technologies.EvenifthePNGVprogramfailstoreachitsultimategoalofahighlyfuel-efficient vehicle,thetechnologicalimprovementsinvestigatedwillmakeitpossibletogreatlyimprove vehiclefuelefficiencyofcurrentvehicles.
TherearetwomajorthrustsofthePNGVprogram:improvementstothevehicledesignandto thepowersource.Indeed,bothvehicleandpowersourcemustbematchedtoobtainthemaximum benefit.Nevertheless,inwhatfollows,weconsidertheseseparately,withtheunderstandingthat theymustnotbeconsideredinisolation.
InSection8.4wedescribedthethreecomponentsofpowerconsumptioninamovingvehicle: vehicleacceleration,rollingresistance,andaerodynamicdrag.Thefirsttwoareproportionalto
vehiclemass,whilethelatterdependsuponvehiclesizeandshape,butnotmass.Thethreemajor parametersdeterminingthesecomponentsarevehiclemass m,rollingresistancecoefficient CR, andthevehicledragarea CD A.Alloftheseareimportant.
VehicleMass. Incurrentconventionalvehicles,massistheparameterthatbestcorrelatesfueleconomy(seeTable8.2).Large,heavyvehiclesrequirebigenginestoperformwell;theyconsequently consumemorefuel.Foragivenvehiclesize,reducingvehiclemasswillpermitreductionsinengineandtransmissionmass,tireandwheelmass,brakingsystemmass,fuelstoragemass,steering systemmass,engineradiatormass,andsoon,compoundingthegainsindirectmassreductionof thevehicleframe.Theprincipalmeansforreducingmassisthesubstitutionoflightermaterials ofequalstrengthandstiffness,suchasaluminumalloysorfiber-reinforcedplasticforsteeland plasticforwindowglass,aswellastheredesignofthevehiclestructuretominimizestructural mass.Reductionsofupto40%ofvehiclemassseempossible.16
Reducingvehiclemassbymaterialsubstitutionmayhaveimplicationsforvehiclesafety. Vehicleframesaredesignedtoabsorbthevehicle’skineticenergyinacrashwhileprotecting theoccupantsfromharm.Substitutionofalightermaterialofequalstrengthandenergyabsorbing capacityinthebodystructurecanmaintainthesamelevelofkineticenergyabsorbtionandpassenger protection,whilereducingoverallvehiclemass.Butinatwo-vehiclecollisionofvehiclesof unequalmass,thelightervehicleabsorbsmorethanitsownkineticenergyandtherebysuffers asafetydisadvantage.InthecurrentU.S.fleetoflight-dutypassengervehiclesandtrucks,the massratiooftheheaviesttolightestvehicleisabout3.Aslongasvehiclesofdifferentsize persistinfuturefleets,thismassdisparitywillcontinueevenifallvehiclesaremadelighterthan currentones.
Vehicleswithpropulsionsystemsthatutilizeheavyenergystoragesystems(electricstorage batteries,pressurizedgaseousfuelsuchasnaturalgasorhydrogenstoredinsteelcylinders)incur vehiclemasspenalties.Forlead-acidstoragebatteries,thebatterymassperunitofenergystorage is5000timesthatofgasoline,sothatvehiclemassforelectricbatteryvehiclesisdominatedby thebatterymassneededtogivethevehicleanadequaterange.Forhydrogen-fueledornatural-gasfueledvehicles,thestorageoftheenergyequivalentof60Lofgasolinewouldaddabout300kg and130kg,respectively,tovehiclemass(seeSection4.4.5).
AerodynamicResistance. Reductionofaerodynamicresistanceislimitedtoloweringthedrag coefficient C D bycarefulstreamliningoftheentirebody,becausethefrontalarea A isessentially fixedbytherequirementsofprovidinganenclosureforthepassengers(seeTable8.2).Thebulky formoftheautomobilelimitswhatcanbedonetoreduceaerodynamicdrag,butattentiontodetails canbringthedragcoefficientintotherangeof0.20–0.25forpassengervehicles.Theredoesnot appeartobeaweightpenaltyattachedtolowdragcoefficients.
16Thecostofdirectweightreductionbymaterialsubstitutionisintherangeof$1to$3perkilogram(Mark, Jason,1999. GreenerSUVs.ABlueprintforCleaner,MoreEfficientLightTrucks. Cambridge:Unionof ConcernedScientists.).Buteachkilogramofdirectweightreductionbymaterialsubstitutionprovidesan opportunityforadditionalweightreductioniftheengineanddrivetrainarereducedinsizeinproportionto thevehiclemassreduction,therebyprovidingacostsaving.Thiswouldlowerthenetcostofthematerial substitutionweightreduction.
RollingResistance. Therollingresistancecoefficient C R canbeloweredto0.005fromcurrent valuesof0.010–0.014byimprovementsintiredesign,butitisdifficulttomaintaindurability, performance,andsafety(traction)whilereducingrollingresistance.Lightalloywheelsreduce sprungmass,whichisdesirable,butmorecomplexsuspensionsystemswillbeneededtorecover normalperformancewithlow-resistancetires.
Thereareseveralpathstoimprovingtheefficiencyofengineswhilesupplyingtherequisitepower neededbythevehicle.Oneistoimprovethefuel(orthermal)efficiencyoftheengine,especiallyat off-optimumconditionswheretheengineisusuallyoperated.Asecondistoutilizetransmissions thatpermittheenginetomaximizeitsefficiencyforarequiredpoweroutput.Athirdistoreduce enginemass,foragivenpower,soastoimprovevehicleefficiency.However,thereareserious constraintsimposedonengineefficiencyimprovementsbytherequirementsforlimitingexhaust pollutantemissions.Thesemaylimitthepossibleefficiencyimprovements.
ReducingIntakeStrokeLossesinSIEngines. AsexplainedinSection8.3,atpartialloadthecylinder pressureduringtheintakestrokeisloweredtoreducethefuelamountinthecylinder,resulting inalossofefficiency.Thislossmaybeoffsetbyvaryingthetimingoftheinletandexhaust valveswiththeengineload.Variablevalvetiming(VVT)systemsarecurrentlyusedinfour-valve engines,addingtothepeakpoweroutputandenginemassreductionbenefit.Anotheralternativeis directfuelinjection(DI)intothecylinderduringtheintakestroke,forminganonuniformfuel–air mixtureathigheroverallpressureandlowerintakestrokepowerloss,albeitatsomepenaltyin NOx emissions.Therecirculationofexhaustgasintothecylinderduringtheintakestrokesoas toreduceexhaustpollutantemissionscanbearrangedtoreduceintakelossesandimproveengine efficiencyatpartload.
ReplacingSIEnginesbyCIEngines. TheindirectinjectionCIengineenjoysabouta25%advantage infueleconomyovertheSIengineanddoesnotsufferasmuchefficiencylossatpartloadasdoesthe SIengine.DirectinjectionCIengineshaveevenhigherfueleconomyadvantage,about30–40%.17 Ontheotherhand,theCIengineisheavier,foragivenpower,therebyincurringavehiclemass efficiencypenalty,andismoreexpensive.Also,itismoredifficulttoreduceNOx andparticulate emissionsintheCIengine.Ifthelattercanbeovercome,theCIengineprovidessignificantbetter fueleconomy.
Supercharging. BothSIandCIenginescanbesupercharged(orturbocharged)toincreasemaximumenginepowerforagivendisplacementandenginemass,withsomeimprovementinengine efficiencyathigherloads.Thisprovidesavehiclemassefficiencybenefit.
ContinuouslyVariableTransmission. AsexplainedinSection8.4.1,thetraditionalmultisteptransmissiondoesnotpermittheenginetooperateatmaximumthermalefficiencyovertheentire
17Intermsofthermalefficiency,theadvantageislowerbecauseofthedifferenceinfuelheatingvalueperunit volumeoffuelbetweengasolineanddieselfuel.
vehicledutycycle.Indeed,theengineseldomoperatesatbestefficiency.Acontinuouslyvariable transmission(CVT)canbecontrolledtomaximizetheengineefficiencyatanypowerlevelneeded bythevehicle.CurrentCVTtransmissionshaveshownthatoverallvehicleefficiencycanbe improved,providedthatthetransmissionefficiencyisclosetothatofconventionaltransmissions.
EngineIdle-Off. Incongestedurbandriving,considerabletimeisspentwiththeengineidling whilethevehicleisstationary.Iftheengineisstoppedduringtheseintervals,fuelwillbesaved andexhaustemissionswillbereduced.However,stoppingtheengineandrestartingalsoconsumes fuel,sothatthelengthoftheidleperiodhastobesufficientfortheretobeafuelreductionin idle-offcontrol.
Intheearliestyearsofthedevelopmentoftheautomobile,somewerepoweredbyelectricdrive motorsenergizedbylead-acidstoragebatteries.Despitetheiradvantagesofnonoiseandexhaust emissions,theirlimitedrangeanddifficultyofrechargingconfinedtheirusetourbanfleetdelivery vehicles.
Inthelastfewyears,electricdrivevehicleshavebeenreconsidered.Advancesinelectricand mechanicalenergystoragesystemsandtheenergysavingstobemadebystoringandreusingvehicle brakingpowermakesuchvehiclesattractivefromboththeemissionsandvehicleefficiencypoint ofview.ProvidingelectricdrivepowerfromanonboardfuelcellorICEmotor–generatorsetcan providemoreacceptablevehiclerange.Variouscombinationsofthesedrivesystemsmightprove evenmoreadvantageous.Inthissectionwereviewtheprogressmadeinincorporatingtechnological improvementsinvehiclesofthistype.
Thedevelopmentofbattery-poweredelectricdrivevehicleswasspurredintheUnitedStateswhen thestateofCaliforniaestablishedafuturerequirementforsomezeroemissionvehiclesinits newcarfleetmix,beginningwiththe2003modelyear.Severalmanufacturerscurrentlyproduce smallpassengercarsandpickuptrucksthatarebattery-powered.Theirspecificationsarelistedin Table8.3.Likeothervehiclesofthistype,theyhavelimitedpassenger-orfreight-carryingcapability comparedtoconventionalvehiclesandhavemuchsmallertravelrangebetweenrechargesofthe onboardenergysupply.
AllthesevehiclesarepoweredbycooledACinductionmotorsdrawingtheirpowerfrom batterybanksviapowerconditioningequipment.Thetractionmotorisgearedtothedrivewheels atafixedspeedratio,anditcanregenerateapartialbatterychargeduringperiodsofvehicle deceleration.
TheEV1isequippedwitheitheralead-acidornickelmetalhydridebatterybank,withthe latterstoring40%moreenergywith12%lessweightthantheformerandtherebyachievinga36% greaterrange.Thetimeneededtochargethebatterybankcompletelyis6–8hours.Afterabouta thousandcharge–dischargecyclesthebatteriesmustbereplacedbynewones,butofcoursethe
ManufacturerGMGMToyotaChevroletFordFord ModelEV1EV1RAV4S-10Ranger-EVRanger-EV SizeTwo-passengerTwo-passengerFive-passengerPickupPickupPickup BatteryTypeLeadAcidNiMHNiMHLeadAcidLeadAcidNiMH
depletedbatteriescanberecycledtorecoverbatterymaterials.18 Batteryreplacementwillcost severalthousanddollarsevery50,000miles.
Thebatterymassofthesevehiclesconstitutesabout40%ofthevehiclemass,implyinga verylargevehiclemasspenaltytothevehicleenergyefficiency.Indeed,ifweconvertthevehicle electricenergyefficiencyof1.0–1.7km/MJtoanequivalentfuelefficiencyof10–16km/L(see Table8.3),thenthesevehiclesareonlyslightlymoreefficientthancurrentvehiclesofcomparable masslistedinTable8.2.Despitetherecoveryofbrakingenergy,theelectricvehiclesareunableto achievehigherfuelefficiencythancomparableconventionalones.
Thepower/massratiosofthesevehicles,whichlieintherangeof30–55,areonlyhalfthose ofconventionalvehicles(Table8.2),limitingtheiraccelerationandgradeclimbingabilities.
Thelimitedrangeandfuelefficiencyofcurrentbattery-poweredelectricvehiclesistiedtothe lowenergystoragedensitiesofcurrentlyavailablebatteries,about25–50Wh/kg(90–180kJ/kg).
Butotherelectricalstoragesystemsbeingdeveloped,suchaselectriccapacitorsandflywheels, havenohigherenergystoragedensities(seeTable4.1),andothertypesofhigh-densitystorage
18
Inalead-acidbattery,theelectrolytesulfateionsaredepositedonthesurfacesoftheelectrodesduringbattery discharge.Thisprocessisnotentirelyreverseduponrecharge,graduallyleadingtothelossofelectrodeactive surfaceareaandtheenergystoragecapacityofthebatterywitheachrechargecycle.
batteriesareunsuitableforautomobiles(seeTable4.2).Addingbatterymasstothevehiclewill notbringaboutacommensurateincreaseinrange,whichisbetterimprovedbyincreasingthe efficiencywithwhichstoredenergyisutilizedinpropellingthevehicle.
Hybridvehiclesarethosethatcombineconventionalpowersources(SIorCIengines)withelectric motorstopowerthevehicle.Inoneextreme,theSIorCIenginecanpowerageneratorthat deliverselectricpowertoanelectrictractionmotor;thissystemisusedinrailwayengines.The moreattractivesystemforautomobilesistoattachanelectricmotor/generatortothecombustion engineshaft,betweentheengineandthetransmission.Themotor/generatorcanstoreenergyina batterybankwhenexcesspowerisavailable,duringdecelerationorwhenthepowerneedisless thanwhatthecombustionenginecandeliver,andcandeliverextrapowertothewheelswhenitis temporarilyneededforaccelerationorhillclimbing.Suchasystemcanlevelthepeaksandvalleys ofpowerdemandinthedrivingcycle,enablingthecombustionenginetorunclosertoaverage drivingcyclepowerandpotentiallybetteraverageengineefficiency.
ThecharacteristicsoftwohybridvehiclesofthistypearelistedinTable8.4.IntheHonda vehicle,theelectricmotor/generatormaximumpowerisonly10kWcomparedtotheSIengine maximumpowerof47kW.Nevertheless,thisissufficienttoprovideextrapowerforacceleration andabsorbbrakingpowerintheurbandrivingcycle.Theratioofelectricalenergystorageto maximumelectricalpowerisgreaterthanthatforthebattery-poweredvehicles(seeTable8.3). Thevehiclefueleconomyisimpressive,aweightedaverageof27.5km/L(64.7miles/gallon). WhilethisisstillshortofthePNGVgoalof35.1km/L(82.5miles/gallon),andthevehicleisnot mid-size,itisapromisingdevelopment.
Themotor/generatoroftheHondahybridservestwootherpurposes.Theengineisstopped whenthevehicleisstationary(idle-off),anditisrestartedusingthemotorwhilethetransmission isinneutral.Inaddition,themotor/generatorarmatureactsasthemotorflywheel.Becausethe motor/generatorisattachedtotheengineshaft,itoperatesthroughthevariablespeedtransmission whenaddingorsubtractingpowertothewheeldrivesystem,enablingthemotor/generatorto operateefficientlyoverawidevehiclespeedrange.
ComparingtheHondaandToyotahybridsofTable8.4withtheconventionalHondaandAcura vehiclesofTable8.2thatareofcomparablevehiclemass,wenotethathybridvehiclesareabout 80%morefuelefficient(forequalmass)andthatforeitherhybridorconventionalvehicle,asmall fractionalreductioninmassapproximatelybegetsacomparablefractionalincreaseinvehiclefuel efficiency.Thissubstantialadvantageofthehybridoverconventionaldesignofequalmassisa compositeofbrakingenergyrecovery,lowerrollingandaerodynamicresistance,moreefficient engineoperatingconditions(despitethesamedrivingcycle),andpossiblyahigherpeakengine efficiency.
Evolutionofstandardvehiclesinfutureyearswillmoveinthedirectionofhybriddrives. Itisexpectedthattheelectricauxiliarysystemwillchangefrom14to42voltsandtriplein power.Thecurrentstartermotorandbelt-drivenalternatorwillbereplacedbyamotor/generator directlyconnectedtotheenginedriveshaft,asintheHondavehicleofTable8.4,permitting idle-offoperationwhenthevehicleisstationary.Recoveryofbrakingenergywouldbepossible, dependinguponthemotor/generatorpowerandelectricstoragecapacity.Althoughthepurpose ofthisdevelopmentistoutilizeelectricdriveforauxiliarypowerandtherebyimproveengine efficiency,itclearlycanbeextendedtobecomeahybridsystem.
Prototypesofelectricdrivevehicleswhoseelectricpowerissuppliedbyfuelcellshavebeen underdevelopmentforseveraldecades.Potentially,suchvehiclescouldprovidehighervehicle fuelefficienciesthanconventionalvehicleswithlittleornoairpollutantemissions.Increasingly stringentexhaustpollutantemissionstandards,especiallyinCalifornia,andnationalpoliciesin developednationstosecurebotheconomicandenvironmentalbenefitsofimprovingfueleconomy haveincreasedtheincentivesformanufacturerstodevelopvehiclefuelcelltechnologies.
AsexplainedinSection3.12,theoxidationofafuelinafuelcellhasthepotentialtoconvert ahigherpercentageofthefuel’sheatingvaluetoelectricalworkthandoesthetypicalcombustion engine.Theupperlimittothisproportionistheratioofthefreeenergychangeinthefueloxidation reaction, f ,totheenthalpychange,orfuelheatingvalue FHV.Forhydrogen,thisratiois0.83, whileformethaneandmethanolitis0.92(seeTable3.1);theseupperlimitsareatleastdouble whatcouldbeobtainedbyburningthesefuelsinasteamorgasturbinepowerplant.However, asFigure3.10illustrates,thishighconversionefficiencyisonlyreachedatzeropoweroutput;at higherpowerthecellvoltagedeclinesnearlylinearlywithincreasingcellcurrent,resultinginonly 50%oftheuppervaluebeingrecoverableatmaximumcellpower(41.5%forhydrogenand46% formethaneandmethanol).Still,thesearehigherfuelefficienciesthanareobtainableinvehicleSI enginesatfullpower;thecomparisonisevenmorefavorabletothefuelcellatpartloadbecause thefuelcellefficiencyincreasesatreducedload.
Buttherearecountervailingfactorsinvehiclefuelcellsystemsthatlowerthisfuelefficiency. Theonlypracticalfuelcellforvehicleuserequiresgaseoushydrogenfuel.Themosteconomical andenergyefficientsourceofhydrogen,asyntheticfuel,isbyreformingfromafossilfuelsuch
asnaturalgas,oil,orcoal,orfromanothersyntheticfuellikemethanolorethanol.Whetherthis reformingisdoneatthefueldepot,wherethehydrogenisthenloadedandstoredonthevehicle, orisaccomplishedonboardthevehicleinaportablereformer,thereformingoperationpreserves atbestonly80%oftheparentfuel’sheatingvalue(seeTable3.3).Thisadditionallosslowersthe maximumpowerfuelefficiencyofhydrogento33.2%.Furthermore,ifhydrogenisliquifiedfor storageonthevehicle,ratherthanbeingstoredasacompressedgasintanks,anadditionalenergy penaltyofabout30%isincurredbecauseenergyisneededtoliquifyhydrogenattheverylow temperatureof 252.8 ◦C.Altogether,thesesyntheticfueltransformationpenaltiesdiminishthe fuelefficiencyadvantageoffuelcellscomparedtoconventionalinternalcombustionenginesin vehiclesfueledbyconventionalhydrocarbonfuels.19
Thehydrogenfuelcellusedinvehiclesutilizesasolidpolymerelectrolyte,calledaproton exchangemembrane(PEM).Onlyafractionofamillimeterinthickness,themembraneiscoated onbothsideswithaverythinlayerofplatinumcatalystmaterialthatisrequiredtopromotethe electrodereactionsproducingtheflowofelectriccurrentthroughthecellanditsexternalcircuit, asdescribedinSection3.12.Carbonelectrodes,providedwithgroovesthatensurethegaseous reactants[hydrogenattheanodeandoxygen(inair)atthecathode],aredistributeduniformly acrosstheelectrodesurfacesandaresandwichedoneithersideofthePEM,formingasinglecell. Asmanyasahundredormorecellsarestackedinseries,mechanicallyandelectrically.Thefuel andoxidantaresuppliedunderapressureofseveralbar,soastoincreasethemaximumpower outputperunitofelectrodearea,whichisusuallyoftheorderof1W/cm2.Water,formedatthe cathode,mustberemoved,butthePEMmustremainmoisttofunctionproperly.Inaddition,heat isreleasedinthecellreaction,sothatthecellmustbecooled,maintainingatemperatureless than100 ◦C.
Table8.5liststhesalientfeaturesofseveralfuelcellvehiclesdevelopedduringthe1990sin EuropeandtheUnitedStates:twoversionsofacompactcar(NECAR4andNECAR3),aU.S. compactcar(P2000),avan(NECAR2),andamunicipalbus(NEBUS).Theyallarebasedupona conventionalvehiclewiththereplacementoftheengineandfueltankbyafuelcell,electricmotor, andfuelstoragesystem,whilemaintainingtheoriginalvehicle’spassengercapacityandrange. ThearrangementofthereplacementfuelcellsysteminthevehicleisshowninFigure8.8forthe NECAR4andNEBUSvehicles.
NECAR4isthemostrecentversionoftheDaimlercompactcar.Itshydrogenfuelisstoredin liquidforminacryogenicinsulatedfueltank.Thepreviousversionofthiscar,NECAR3,utilizes liquidmethanolasthefuel,whichisconvertedtohydrogeninanonboardreformer.NECAR2and NEBUSstorehydrogengasintankspressurizedto300barandweighingabout75timesmorethan thefueltheycontain,addingtothevehiclemass.Ingeneral,thesevehiclesweighmorethantheir conventionalcounterparts.
Thevaluesforfueleconomyofthesevehicles,expressedaskilometerspermegajouleoffuel heatingvalue(km/MJ)orkilometersperliter(km/L)ofgasolineequivalent(intermsoffuelheating value),arelistedinthetableaswell.Forcomparison,Table8.5alsoliststhefueleconomiesofthe conventionalvehiclesofthecomparableclass,bothCI-andSI-powered.Thefuelcellvehicleshave comparablefueleconomies,butareclearlynotdistinctlysuperiortotheirconventionalcousins.
a Doesnotincludesyntheticfuelenergypenalty.
b Convertedtoenergydensityofgasoline.
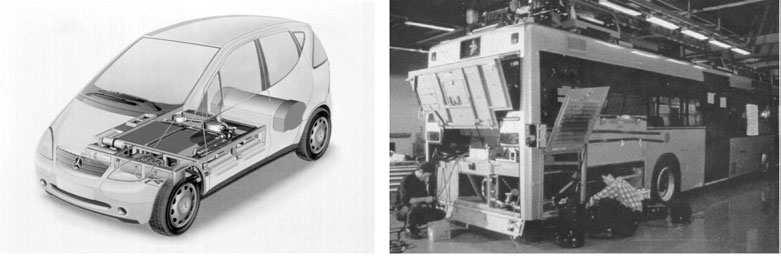
c Includespenaltiesof20%formethaneconversiontohydrogenormethanoland30%forhydrogengastoliquid.
d Adjustedforvolumeequivalentofgasoline.
Butifoneconsidersthesyntheticfuelpenaltiesinvolvedinpreparinghydrogen,bothgaseousand liquid,ormethanol,asdoneinTable8.5,thenthefuelcellvehicles,atleastatthisstageoftheir development,havelittleornofueleconomyadvantage.
Thereisnoquestionthatfuelcellvehiclessufferfromthelimitedavailabilityandhighcostof hydrogenfuel.Commercial-scalehydrogenreformersfueledbynaturalgasarecomplexsystems, withtheproductstoredathighpressureintanksfortransfertovehicles.Hydrogenisespecially pronetoburnandexplode,raisingsafetyproblemsevenforfleetvehiclesthatcanbemorecarefully supervisedthanindividuallyownedvehicles.Ontheotherhand,on-boardreformerseliminatethe hydrogensupplyproblem,yettheyworksatisfactorilyonlywithpurefuelinput,suchasmethanolor ethanol,butnotsofarwithdiversehydrocarbonmixtureslikegasolineordieselfuel.Development ofon-boardreformers(suchasusedinNECAR3)andacommonfuelwouldmakefuelcellvehicles suitablesubstitutesforconventionalones.
Bythemiddleofthetwentiethcentury,vehicleexhaustemissionswererecognizedtobeanimportant contributortourbanphotochemicalairpollution,especiallyinlocationslikesouthernCalifornia wherehighinsolationandtemperatureandpooratmosphericventilationcombinedwitharapidly growingautomobilepopulationtoproducerecordlevelsofgroundlevelozoneconcentrations. Notlongthereafter,similarpollutionproblemsappearedinothermajorcitiesaroundtheworldas urbanvehiclepopulationsblossomed.Theseproblemsaremoreacuteinlowerlatitudelocations, especiallyindevelopingcountrieswherevehicleemissioncontrolsarenotyetstringent.
Ofcourse,vehiclesprovideonlypartofozoneprecursoremissions.Buttheyaremobileand morenumerousthanstationarysources,andtheypresentdifferentproblemsforabatement.Early inthepollutantregulatoryhistoryoftheUnitedStates,itbecameobviousthatitwasmoreeffective torequireafewvehiclemanufacturerstoinstallcontrolequipmentonmillionsofnewvehicles ratherthantorequiremillionsofvehicleownerstotrytoreducetheirownvehicle’semissions. Thisscheme,adoptedbyalldevelopednations,replacesallvehicleswithnewandcleanerones every12–15years,providingtheopportunitytocapitalizeontheimprovementsinemissioncontrol technology.IntheUnitedStates,ithasresultedinsignificantreductionsinairpollutantemissions fromvehicles.
Inthissectionwediscussthevehicletechnologiesthatareusedtoreducetheemissionsfrom ICEenginesinvehiclesinresponsetonationalregulations.
Vehicleemissionstotheatmosphereareoftwokinds:exhaustemissionsandevaporativeemissions. Thefirstarethecombustiongasesemittedwhiletheengineisrunning,whetherornotthevehicle ismoving.Thesecondareemissionsoffuelvaporsfromthefuelsupplysystemandtheengine, whenthevehicleisstationarywiththeenginenotoperating.20 Thefederalgovernmentregulates bothoftheseemissionsbyrequiringthemanufacturersofnewvehiclessoldintheUnitedStates
20Emissionoffuelvaporwhilerefuelingmaybeseparatelyregulatedbystateagenciesunderstateimplementationplansforconformingwithfederalair-qualityregulations.
toprovidethetechnologyneededtolimittheseemissionsfortheusefullifeofthevehicleandto warranttheperformanceofthesecontrolsystems.
Tocertifyavehicleclassforexhaustemissions,themanufacturermusttestaprototypevehicle onadynamometerfollowingtheFederalTestProcedure(FTP)(seeSection8.5.1),duringwhich exhaustgasesarecollectedandlateranalyzedforpollutantcontent.Regulatedpollutantsinclude nonmethanehydrocarbons(NMHC)ororganicgases(NMOG),carbonmonoxide(CO),nitrogen oxides(NOx),particulatematter(PM),andformaldehyde(HCHO).Themassofeachpollutant collectedfromtheexhaustduringthetestisdividedbythetestmileageandisreportedasgrams permile.Iftheprototypevehicle’sexhaustemissionsdonotexceedthestandardssetforitsvehicle type,vehiclesofitsclassandmodelyearmaythenbesoldbythemanufacturer.Themanufacturer isfurtherresponsibleforensuringthattheirvehicles’controlsystemscontinuetofunctionproperly duringthelifeofthevehicles,currentlysetat100,000miles.Vehiclesmustalsoconformtothe exhaustemissionlimitationsoftheSupplementalFederalTestProcedure(SFTP),designedto evaluatetheeffectsofairconditioningload,highambienttemperature,andhighvehiclespeeds (notincludedintheFTP)onemissions.
Evaporativeemissionsaretestedfortwoconditions:onewherethevehicleisatrestafter sufficientusetohavebroughtittooperatingtemperature,theotherforaprolongedperiodof nonuse.Intheseteststhevehicleisenclosedinanimpermeablebagofknownvolume,andthe organicvapormassissubsequentlydetermined.
IntheUnitedStates,vehicleemissionstandardsaresetbytheU.S.EnvironmentalProtection Agencyinaccordancewiththeprovisionsoffederalair-qualitylegislation.Theregulationisbased upontherecognitionoftheubiquityandmobilityoftheautomobile,itsconcentrationinurbanareas, itscontributiontourbanandregionalair-qualityproblems,andtheabilityofthemanufacturer,and nottheowner,toameliorateitsemissions.Intheyearssincetheearly1970s,whenregulation wasfirstintroduced,emissionstandardshavebecomemorestringentasthemanufacturersdevised bettertechnologiesandthedifficultyofachievingdesirableairqualitythroughouttheUnitedStates becamemoreapparent.Giventheleadtimerequiredbythemanufacturerstodevelopnewcontrol technologiesandincorporatetheminareliableconsumerproduct,emissionstandardsmustbeset yearsinadvanceoftheirattainmentinnewvehiclessoldtotheconsumer.
U.S.exhaustemissionstandardsforvehiclesofmodelyear1996andbeyondarelistedin Table8.6.(EmissionstandardsforearliermodelyearvehiclesareshowninTable9.2.)Thestandards applyfortwotimeperiods;1996to2007(Tier1)and2004andbeyond(Tier2).TheTier2standards arephasedinovertheperiod2004–2010,duringwhichtheTier1standardsaresimultaneously beingphasedout.
Tier1standardslimitfourpollutantsforfivevehicleclasses:light-dutyvehicles(LDV,which arepassengervehiclesfor12passengersorless)andfourtypesoflight-dutytrucks(LDT1,LDT2, LDT3,andLDT4,distinguishedbythegrossvehicleweightratingandtheloadedvehicleweight [seeSection8.5.1]).Thelargerlight-dutytrucksarepermittedgreateremissionsinrecognition oftheirgreaterweight-carryingcapability.Likeearlierstandards,theTier1standardsapplyto severalvehicleclasses,butwithineachclasseachvehiclemodel,smallorlarge,mustmeetthe samestandard.
Tier2standardsintroduceanewmethodoflimitingemissions.Likethefueleconomystandard, eachmanufacturermustachieveasales-averagedNOx emissionsforallitsvehiclesof0.07g/mile, althoughindividualvehiclemodelsmayemitmoreiftheyareoffsetbyothersthatemitless.Each vehiclemodeliscertifiedinoneofsevenemissioncategories(denotedbyBin1,..., Bin7in Table8.6),whichensuresthatthesales-averagedemissionlimitsforpollutantsotherthanNOx will
a Modelyears1996–2007.Fiveyears,50,000miles.
b Nonmethanehydrocarbons.
c Modelyears2004–2010,except2008–2010forLDT3andLDT4.Fullusefullife(120,000miles).
d Nonmethaneorganicgases.
e Formaldehyde.
alsonotbeexceeded.Thisnewmethodoflimitingemissionswillallowmanufacturerstoachieve thenecessaryoverallreductionintheirfleet’semissionsaseconomicallyaspossiblebyproviding incentivestoreduceemissionsbelowthestandardinlight,low-poweredvehiclesthatmaythenbe creditedtoheavy,high-poweredones.
TheTier2standards,whichbeginwiththe2004modelyear,arequitestringentcomparedwith thoseoftheearly1970s,whenstandardswerefirstapplied(seeTable9.2).Fortheozoneprecursor pollutants,NOx andNMOG,Tier2levelsareabout2%ofthosefor1971modelyearvehicles andareapproximately0.2%ofunregulated1960’svehicles.Thisconsiderablereductionwillbe requiredtomakeitpossibletoachieveambientozonestandardsinU.S.metropolitanareasinthe earlypartofthetwenty-firstcentury,despiteincreasingvehiclepopulationandincreasedannual travelpervehicle.
Vehicleexhaustpollutantsaretheremnantsofanincompleteandnonequilibriumcombustion processintheenginecylinder.Ofthemixtureoffuelandairintroducedintothecylinder,all
butatinyfractionofthefuelisoxidizedtoCO2 andH2O,reachingastateofthermochemical equilibriumafterreleasingthechemicalenergyboundupinthefuel.However,asmallamount ofthereactantsdonotreachthisequilibriumstate,butinsteadremainfrozenintoametastable form.TheprincipalmoleculesofthistypeareNO,CO,andvariouskindsofhydrocarbon(HC) molecules,allofwhichcancontaminatetheatmosphereintowhichthevehicleexhaustgasstream isintroduced.Thepurposeofvehicleemissioncontroltechnologyistoreducetheamountsofthese pollutantstosuchlowvaluesthatthecumulativeeffectsofmanyvehiclesandothersourceswill notbegreatenoughtocauseanydamagetolivingsystems,includinghumans.
InSIengines,theamountofeachoftheseprincipalpollutantsissensitivetotheair/fuelratioof themixtureinductedintothecylinderpriortoignitionbythesparkplug.Theproportionofairtofuel mustnotbetoofarfromthestoichiometricvaluefortheenginetofunctionproperlyandefficiently. Ifthemixtureisfuel-rich(morefuelthancanbecompletelyoxidizedbytheavailableoxygen), someCOwillbeformedandnotallofthefuel’sheatingvaluewillbereleased.Ifthemixture isfuel-lean(excess,unusedoxygen),thecombustionproducttemperatureandpressurewillbe less,resultinginlessengineworkpercycle.Thesedifferencesinthechemicalandthermodynamic stateofthecombustiongasesinfluencetheamountsofpollutantsthatleavetheenginethroughthe exhaustport.
21
Whenthereissurplusoxygen(leanmixture),COandHCdiminish
Figure8.9showshowthemassofexhaustgaspollutantsvarieswiththeair/fuelratioina SIengine.Inrichmixtures,thereisinsufficientoxygentooxidizecompletelythefuelmolecules, leavingsomeunburnedHCorincompletelyoxidizedCOandH2,themoresoastheoxygen deficiencybecomeslarger.
tolowvaluesastheextraoxygenfindsandoxidizesthem.Ontheotherhand,NOisformedby thereactionofN2 withO2 atthehightemperaturebehindtheflamefront,butonlyinverysmall quantities,anddoesn’trevertcompletelytoN2 andO2 atthemuchlowerexhausttemperature,as itshouldifthermochemicalequilibriumprevailed.Itishighestatorclosetothestoichiometric mixturewheretheflametemperatureishighest.ThemassofHCandNOcanbeoftheorderof1 %ofthefuelmass(about0.1%oftheexhaustgasmass),buttheCOmassis10timeslarger.Such valuesare10ormoretimeshigherthanallowedbyfutureU.S.exhaustemissionstandards.
Forpollutantstoreachtheverylowlevelsnowbeingrequiredofroadvehicleexhauststreams, twostepsmustbeundertakensimultaneously.Thefirstistoreduceasmuchaspossiblethepollutant concentrationsintheexhaustgasasitleavestheengine(engine-outemissions);thesecondisto reducetheseemissionsevenfurtherbyexhaustgastreatmentsystemslocatedbetweentheengine andthetailpipe.Neitherofthesesystemsbyitselfcansufficetocleanuptheemissionstothe requiredlowlevels.
ThereareseveralfeaturesofmodernSIenginesthatarenearlyuniversallyusedtoimproveengineoutemissions.
PreciseControlofAir/FuelRatio. Lowvaluesofthethreeprincipalpollutants—HC,CO,and NO—canbemaintainediftheair/fuelratioiskeptclosetoitsstoichiometricvalueunderall operatingconditions.Fuelinjectionpermitsclosecontroloverfuelflowtoeachcylinder,andit canbecomputer-controlledtobeproportionatetotheintakeairflow.Anoxygendetectorplaced downstreamoftheexhaustportsprovidesasensitivesignalusedtocorrectthefuelflowsoasto homeinonthedesiredair/fuelratio.Afurtherbenefitofthiscontrolsystemisthatitcanprovide optimumconditionsforsubsequentexhaustgasprocessing.
ExhaustGasRecirculation. Attheendoftheexhauststroke,whentheexhaustvalvehasclosed andtheintakevalveopenstoadmitafreshchargeofair–fuelmixture,theresidualvolumeof thecylinderisfilledwithexhaustgas.Thismixeswiththeincomingfreshcharge,dilutingit andreducingthetemperatureandpressurethatisreachedwhenthatchargeisfullyburnedatthe beginningofthepowerstroke.BecausetheamountofNOformedisverysensitivetothepeak temperaturereachedduringcombustion,wecanreduceengine-outNObydilutingthefreshcharge withevenmoreexhaustgasthanisnormallyencountered.Thiscanbedonebyvaryingtheexhaust andinletvalvetimingorpumpingexhaustgasfromtheexhaustsystemintotheintakesystem. Thisisdoneatpartloadsothemaximumenginetorqueandpowerarenotcompromised,butis acceptablebecausethesemaximumvaluesareseldomutilizedinstandarddrivingcycles.
Theexhaustgaspollutants—HC,CO,andNO—arenotinthermochemicalequilibriumwiththe restoftheexhaustgas.ItshouldbepossibletooxidizebothHCandCOtoCO2 andH2Oif enoughoxygenispresent,andtoreduceNOtoN2 andO2,becausethesearethermodynamically favored.Tomakethishappenquicklyenough,thesemoleculesmustattachthemselvestoasolid
surfacecoatedwithacatalyst,wheretheycanreactandtheirproductsevolveintothegasstream. Furthermore,thissurfacereactionwillonlyoccurquicklyifthesurfaceishotenoughandthe propercatalystisused.Currentthree-wayoxidation–reductioncatalystsutilizesuchcatalystsas platinumandrhodium,andtheymustbeheatedto250 ◦Cormoretobeeffective.
SimultaneousoxidationofCOandHCandreductionofNOinacatalyticconverterrequires veryclosecontroloftheair/fuelratiointheengine.Insufficientairwillinhibitoxidation,whereastoo muchwillpreventreduction.Thewindowofair/fuelratiothatwillremoveequallyallthepollutants isquitesmall,onlyafewpercentchangebeingallowed.ThisisillustratedinFigure8.10showing howthecatalyticefficiency(percentofpollutantremovedintheconverter)oftheoxidationand reductionreactionsdependcriticallyupontheair/fuelratio.Oxygenaccumulationonthecatalyst surfaceisbuiltintothesecatalyststowidentheoperatingwindow.
Foracatalyticconvertertoworkproperly,everypollutantmoleculemusthavethechance tosticktothecatalystsurfacebeforeitflowsthroughthereactor.Thisrequiresthattherebea largesurfaceareacoatedwithcatalystandthattheflowpassagessurroundingthissurfacebefinely divided.Eitherahoneycombstructureorapackedbedofcatalyst-coatedpebblessatisfiesthis requirement.Typically,thegaspassagedimensionisoftheorderofseveralmillimeters,andthe convertervolumeisabouthalftheenginedisplacement.Thisallowstheexhaustgasonlyabout oneenginecycleperiodtopassthroughtheconverterandbecleansedofmostofthepollutants.
Whenanengineisfirststartedatambienttemperature(calledacoldstart),theconverterdoes notworkuntilithasbeenwarmedbythehotengineexhaustgastoits“light-off”temperatureof
about250 ◦C.Duringtheminuteortwothatisrequiredtoreachconverterlight-offconditions,high engine-outpollutantlevelsareemittedfromthetailpipe.Indeed,morethanhalfoftheemissionsin theFederalTestProceduremaybeemittedduringthiswarm-upperiod.Whenenginesarestarted incoldwinterweather,excessfuelmustbeinjectedtoachievesufficientfuelevaporationtostart theengine,givinggreatlyincreasedCOandHCemissions.Preconvertersoflowheatcapacity, locatedclosetotheengineorelectricallyheated,arerequiredtoachievelowemissionlevelsduring coldstarts.
Catalystsurfacesmaybedamagedbyoverheatingiftheexhaustgascontainsexcessiveunburnedfuel,whichmightoccuriftheair/fuelcontrolsystemfails.Also,fuelimpuritiesthatleave surfacedepositsmaydestroythecatalyticfunction.Leadadditivestogasolinehavebeenphased outtoprotectconverters,andcurrentU.S.fuelregulationswillrequireremovalofnearlyallsulfur inthenearfuture.Ultracleanfuelswillensurethatconverterswillnotdeteriorateovertheuseful lifeofthevehicle.
Exhaustemissionsofnitrogenoxidesandincompletelyburnedfuelcontributetotheformationof ground-levelozoneintheatmosphere.Buttheinadvertentescapetotheatmosphereofvehiclefuel vaporalsocanbeanimportantcontributortothereactiveorganiccompoundsthatparticipatein theformationofozone.Asaconsequence,evaporativeemissioncontrolsystemsarerequiredon newU.S.vehicles.
Thereareseveralsourcesofvehicleevaporativeemissions.Fuelstoredinthefueltankemits vaporintotheairspaceabovethefuelsurfacewithinthetank.Thisvaporcanleaktotheatmosphere duringfuelrefillingoperationsandduringdiurnalatmospherictemperatureandpressurechanges.At engineshutdown,unburnedfuelremainsintheengineandcansubsequentlyleaktotheatmosphere fromtheairintakeorexhaust.
Fuelvaporhasadifferentchemicalcompositionthandoesthefuelbecausethevaporconstituentsaremuchricherinhigher-vapor-pressure,lower-molecular-weightcomponentsthanis theliquidfuel.Someofthesecomponentsarealsomorechemicallyreactiveinozoneformation, makingitallthemoreimportanttopreventtheirreleasetotheatmosphere.Fuelvaporpressureincreasesrapidlywithtemperature,sothatuncontrolledevaporativeemissionsarehigherinsummer thaninwinter.Becauseozoneformationisinherentlyhigherinsummerthaninwinter,escapeof fuelvaporsexacerbatesthesummertimesmogproblem.
Fueltankvaporemissionsarecontrolledbyplacingavaporadsorbingfilterintheventline betweenthefueltankairspaceandtheatmosphere.Ifthefuelandtankairspacewarmupfrom solarheating,expellingsomevapor–airmixturethroughtheventline,thefilterwillretainthevapor moleculesonitsadsorbingsurface.Topreventtheadsorbingsurfacefrombecomingsaturatedwith fuelmolecules,andtherebyineffectiveforfurtherfiltering,airisdrawninwardthroughthefilter whentheengineisrunning,cleaningitofadsorbedvapormolecules.Thisinflowisductedintothe engineintakesystemsoastoincineratethedesorbedvaporintherunningengine.
Whenafueltankisfilled,thevapor–airmixtureinthetankairspaceisdisplacedbythe incomingfuel.Thismixturepreferentiallyescapesthroughthefuelfillopening;andifitisnot collectedduringthefillingprocessbyavaporcontrolsystematthefillingstation,itwillbeemitted intotheatmosphere.U.S.stateswithozoneexceedenceproblemsusuallyrequiretheinstallation ofsuchequipmentbyservicestations.
Diesel(CI)enginesgenerallyemitlesseramountsofCOandHCthanSIengines,butmoreof NOandparticulatematter.Theoverallair/fuelratioinaCIengineisalwayslean,themoreso atpartialpowerlevels,providingexcessoxygentooxidizeHCandCOtoCO2 andH2O,and N2 toNO.ButtheevaporationandmixingofthefueldropletsinaCIenginewithsurrounding airisuneven,sothatsomeofthefuelburnsinanoxygen-deficientatmosphere,givingriseto tinysolidelementalcarbon(soot)particles.Mostofthisparticulatemattereventuallyisoxidized, butsomedoesnotandremainsunburnedintheengineexhauststream.Sootparticlesmaybe coatedwithlow-volatilityhydrocarbonmolecules(polycyclicaromaticcompounds,PAH)which aretoxictohumans.BothNOandPMemissionsaremoredifficulttocontrolinCIenginesthan inSIengines.
Variousmodificationstodirectinjectiondieselenginecombustionarebeingtriedtoreduce bothNOandPMengine-outemissions.Oneapproachistoincreasethefuelinjectionpressureand controlitstimingsoastoprovidemoreuniformfuel–airmixingandtherebybettercombustion conditions.Four-valvecylindersandexhaustgasrecyclingalsohelptocontrolthecombustion processsoastoreduceemissions.Ifthemixtureoffuelandairwithinthecylindercanbemade nearlyuniform(calledhomogeneouschargecompressionignition),emissionsaresignificantly reduced,atleastatpartload.
TheuseofcatalyticconverterstoreduceNOmoleculesintheengineexhaustislesssuccessful forCIenginesthanforSIenginesbecausetherearefewerhydrogen-containingmoleculesneeded forcatalyticreductionofNO.InjectingsmallamountsoffuelintotheexhaustimprovesNO catalyticreduction.Nevertheless,substantialcatalyticconversionwillbenecessarytomeetTier2 NOx emissionsstandardsforCI-poweredvehicles.
Catalyticconvertersoxidizesomeoftheengine-outPM,butnotenoughtomeetfuturePM emissionsstandards.ParticlefilterscanfurtherreducetailpipePMemissions,butperiodiccleaning ofthefiltersbycatalyticcombustionorothermeansisnecessarytoensurereliablePMreduction. Particlefiltershavenotyetreachedthelevelofdevelopmentofcatalyticconverters,butarelikely tobenecessaryforfuturediesel-poweredlightdutyvehiclesintheUnitedStates.
CIengineemissionsareaffectedsomewhatbythecompositionofdieselfuel.Thegreatest effectisduetofuelsulfur,whichburnstoSO2 andhampersNOreductioninthecatalyticconverter. ThesulfurcontentofvehiclefuelsiscurrentlyregulatedbytheU.S.EPAtomaintaingoodlifetime performanceofcatalyticconverters.
ThesuperiorfuelefficiencyofdirectinjectionCIenginesisastrongincentivefortheiruse whereconsumerfuelcostishigh.IntheUnitedStates,wherefuelpricesarelow,thefuelefficiency incentiveresideswiththemanufacturer,whomustmeetCAFEstandards,especiallydifficultfor thecurrentlight-dutytruckmarket.Shouldreductionofvehiclecarbondioxideemissionsbecome apublicpolicygoalintheUnitedStates,therebyencouraginggreateruseofCIenginesinthe passengervehiclemarket,moreintensedevelopmentofCIengineemissioncontroltechnology willbenecessarytomeetexpectedemissionstandards.
Wehavealreadynotedthatfuelanti-knockleadadditivesandsulfurhavebeenrestrictedtoensure thesuccessfuloperationofexhaustgascatalyticconverters.Otherregulationoffuelproperties havebeendirectedatbothexhaustandevaporativeemissions.
Toachievedesirableanti-knockproperties,fuelrefinerschangethecompositionofthefuel, utilizingmorevolatilecomponentsthatincreasevaporpressureandtherebyevaporativeemissions andaremorepronetogenerateozone.Ithasbeenfoundthattheadditionofoxygenatedfuelcomponents,suchasmethanolorethanol,improvesfuelperformanceandreducesexhaustemissions, especiallyinoldervehicles,soincentivestoemploytheseadditiveshavebeenutilized.Another fueladditive,MTBE(methyltertiarybutylether),hasbeenrequiredbysomestateswithozone problems,buthasbeenfoundtobeenvironmentallyharmfulinfuelleakstogroundwater,inwhich itisverysoluble.
Naturalgasisacleanvehiclefuel,yieldingreducedexhaustemissionsandnofuelvaporproblembecauseitisveryunreactiveinphotochemicalozoneproduction.Butstoringnaturalgasina vehicle,eitherasacompressedgasinhigh-pressuretanksorasarefrigeratedliquidat 253 ◦C, isdifficultandexpensive,anditlimitsthevehiclerangebetweenfuelrefills.Atthepresenttime, naturalgasvehiclesarerestrictedtofleetvehicleswithlimiteddailyrangeoperatingoutofcentral fueldepots.
AmongalltransportationvehiclesintheUnitedStates,light-dutypassengervehiclesandtrucks,in aggregate,arethepredominantusersoffuelandemittersofairpollutants.Transportationaccounts foraboutaquarterofU.S.energyuse,sosubstantialimprovementsinfuelefficiencyandemissions oflight-dutyvehiclescouldcontributeproportionallytoreductionsinnationalfuelconsumption andpollutantemissions.
Asubstantialgaininvehiclefuelefficiencyisprimarilyamatterofimprovedvehicledesign andonlysecondarilydoesitturnontheimprovementofengineefficiency.CurrentU.S.vehicles differmuchmoreinvehiclethaninenginefuelefficiency,withthelarger,moremassivevehicles havingpoorervehiclefuelefficiencythanthesmaller,lighterones.
Thevehicledesignparametersaffectingvehiclefuelefficiencyarevehiclemass,aerodynamic drag,androllingfriction(inorderofdecreasingimportance).Foragivenvehiclesize,vehicle masscanbereducedbelowcurrentdesignsbysubstitutionoflightermaterialsofequalstrength, particularlyinthevehicleframe,withoutimpairingvehiclesafetyincollisions.Asvehiclemass isreduced,lesspowerandmassisneededfortheengine,transmission,wheels,tires,fueltank, andsoon,compoundingthegaininframemassreduction.Bycarefulattentiontovehicleshape, aerodynamicresistancecanbereduced.Efficienttires,inadditiontomassreduction,lowerthe rollingresistance.Altogether,thesetechnologiescanimprovevehiclefuelefficienciesindependent ofimprovementstoengineefficiency.
Improvementsinenginefuelefficiencyarecloselyconstrainedbytherequirementtolimit exhaustpollutantemissions.Inthepast,enginefuelefficiencyhasgraduallyimprovedwhile exhaustemissionsweregreatlyreduced.Thereisstillroomforcontinuedimprovementinboth respectsforbothSIandCIreciprocatingengines.
Themostfuel-efficientcurrentvehicle,thehybridelectricvehicle,canachievetwotimesthe vehiclefuelefficiencyofcurrentreciprocatingenginevehiclesofsimilarsizeandperformance. Utilizingthesameprinciplesofvehicledesign,vehiclespoweredbyCIDIenginecouldachieve nearlycomparablevehiclefuelefficienciesascurrenthybrids.Additionalimprovementsseem likelyinthefuture,giventhelonghistoryofexperiencewiththeseconventionaltechnologies.
Althoughelectricdrivevehiclespoweredbybatteriesorfuelcellsarestillunderdevelopment, theirvehiclefuelefficienciesarenotaspromising,beingscarcelybetterthanexistingvehicles. Thebattery-poweredvehiclesuffersfromaninherentweightproblemthatlimitsitsequivalent vehiclefuelefficiencyandvehiclerange.Thefuelcellvehiclehasalesserweightproblem,but itsdependenceuponhydrogenfuel,whethergeneratedonboardoratfuelsuppliers,complicates thevehicletechnology.Thethermodynamicsofsynthetichydrogenproductionandutilizationin thefuelcelldoesnotyetprovideasignificantfuelefficiencyadvantageovertheconventional utilizationoffuelinvehiclestooffsettheeconomicandvehicledesignadvantagesthatimproved conventionalvehiclespromise,especiallyconsideringtheinfrastructureneedsofahydrogenfuel economy.Furthermore,theverylowemissionsoftheseelectricdrivesystemsbecomealess valuableoffsettingbenefitasthecompetingconventionalvehiclesbecomecleaner.
Thetechnologyforreducingexhaustemissionsiswell-developed,especiallyfortheSIengine. Improvementstotheengineandcatalyticconvertercouldreduceemissionsfurther,shoulditprove necessarytogobeyondtheU.S.nationalTier2standards.ImprovementstoCIengineemissionsare moredifficulttoachieve,andtheymayalwayshavehighernitrogenoxideandparticulatematter emissionsthantheirSIcounterparts.
Problem8.1
Table8.2liststhecharacteristicsofaselectionof2000modelyearconventionalvehicles.Thefuel efficiency(km/L)inhighwaymodeandvehiclemass(t)arelistedfor12vehicles.(a)Plotthe fuelconsumptionFC(L/km),theinverseofthefuelefficiency,asafunctionofvehiclemass(t). Estimateorcalculatebylinearregressionthevalueoftheslope m,whereFC = m(mass)isthebest fitforastraightlinethroughthesepointsthatpassesthroughtheorigin.(b)Calculatetheaverage valueofFCtimesthevehiclemass(tkm/L)forthesevehicles,togetherwithitsstandarddeviation. (c)Discusswhetherornot,andwhy,thesefiguressupporttheanalysisofSection8.3.
Tables8.3–8.5listcharacteristicsofbattery-poweredelectric,hybridelectric,andfuelcellpassenger vehicles.(a)Foreachofthesethreevehicletypes,calculatetheaverageratioofvehiclemass(t) tohighwayfueleconomy(km/L).(b)Rankorderthesevehicletypesaccordingtothevalueofthis ratio.
Table8.2liststhecharacteristicsofaselectionof2000modelyearconventionalvehicles.Forthese vehicles,plottheurbanfuelefficiencyasafunctionofthehighwayfuelefficiency.Calculatethe averagevalueoftheratiourban/highwayfuelefficiency,alongwithitsstandarddeviation.Discuss thesignificanceofutilizingbothurbanandhighwayfuelefficienciesincomparingtheoverall efficienciesofdifferentvehicles.
Problem8.4
Anewsportsutilityvehicleaverages22milespergallon.Itisexpectedtotravelanaverageof 12,000milesperyearduringalifetimeof14years.Iffuelsellsfor$1.50pergallon,calculatethe lifetimeexpenditureonfuel.
Problem8.5
UsingthedataofTable8.1fortheyear1995,calculateforeachvehicleclassitsfractionofthe annualfuelconsumedbytransportationvehicles.
Problem8.6
Theenginepowerandsizeofalightdutyvehicleisrelatedtovehiclemass.Forthevehicles ofTable8.2,calculatetheaveragevaluesofpower/displacement,power/mass,anddisplacement percylinder.Usingthesevalues,calculatethetypicalenginepower,displacement,andnumberof cylindersfora2-tonvehicle.
Problem8.7
Apassengervehicledieselenginehasaminimumbrakespecificfuelconsumptionof0.22kg/kWh. Calculateitsmaximumthermalefficiency.
Problem8.8
A1.5-tonSIvehicleacceleratesfromrestto100km/h,thendeceleratestoastopbybraking.The averagevehiclespeedduringthiscycleis50km/h,andthecyclelasts30seconds.(a)Calculatethe kineticenergyofthevehicleatitspeakspeed.(b)Calculatethetime-average(W)anddistanceaverage(J/km)oftheenergydissipatedinbraking.(c)If25%ofthefuelheatingvalue(31.6MJ/L) isdeliveredtothewheels,calculatetheaveragevehiclefueleconomyinkm/Lforthisstart/stop mode,neglectingeverythingbutthedissipationofbraking.Comparethiswiththehighwayfuel economyofTable8.2.
Problem8.9
Motorvehiclemanufacturerslistthemaximumtorqueaswellasthemaximumpowerofthevehicle engine.Explainwhythemaximumtorquehasnodirectinfluenceonthevehicleperformance.
Problem8.10
A1.5-tonvehiclehasafrontalareaof2m2,arollingresistancecoefficientof0.1,andadrag coefficientof0.3.Calculatethemechanicalpowerdeliveredtothewheelsatsteadyvehiclespeeds of50and100km/h,iftheatmosphericdensityis1.2kg/m3 .
Appleby,A.J.,andF.R.Foulkes,1993. FuelCellHandbook.Malabar:Krieger. Barnard,R.H.,1996. RoadVehicleAerodynamicDesign.AnIntroduction. Essex:Addison-WesleyLongman. Blackmore,D.R.,andA.Thomas,1977. FuelEconomyoftheGasolineEngine. London:Macmillan. Heywood,JohnB.,1988. InternalCombustionEngineFundamentals. NewYork:McGraw-Hill.
Heywood,JohnB.,andEranShaw,1999. TheTwo-StrokeCycleEngine:ItsDevelopment.Operation,and Design. Philadelphia:TaylorandFrancis.
Kordesch,Karl,andGunterSimader,1996. FuelCellsandTheirApplications. NewYork:VCHPublishers. Mark,Jason,andCandaceMorey,1999. DieselPassengerVehiclesandtheEnvironment. Cambridge:Union ofConcernedScientists. NationalResearchCouncil.1997. TowardaSustainableFuture.AddressingtheLong-TermEffectsofMotor VehicleTransportationandaSustainableEnvironment. Washington,DC:NationalAcademyPress. Poulton,M.L.,1997. FuelEfficientCarTechnology. Southampton:ComputationalMechanicsPublications. Stone,Richard,1985. IntroductiontoInternalCombustionEngines. London:Macmillan.
Weiss,MalcombA.,JohnB.Heywood,ElizabethDrake,AndreasSchafer,andFelixF.AuYeung,2000. On theRoadin2020. Cambridge:EnergyLaboratory,MassachusettsInstituteofTechnology.
Theuseoffossilfuels(coal,oil,ornaturalgas)almostalwaysentailssomeenvironmentaldegradationandrisktohumanhealth.Thenegativeimpactsstartattheminingphase,continuethrough transportandrefining,andconcludewiththefuelcombustionandwastedisposalprocess.
Underground(shaft)miningofcoalhasclaimedthousandsoflivesthroughoutthecenturies, becauseofexplosionsofmethanegasinthemineshaftsandalsobecauseoftheinhalationofcoal dustbytheminers.Attheminemouth,mineralandcrustalmatter,calledslag,isseparatedfromthe coal.Theslagisdepositedinheapsnearthemine,thusdespoilingthelandscape.Inrecenttimes, mostoftheminedcoaliscrushedatthemine.Thecrushedcoalis“washed”inastreamofwater inordertoseparatebygravitationalsettlingtheadherentmineralmatter,therebybeneficiatingthe coalpriortoshipment.The“wash”usuallycontainsheavymetalsandacidiccompounds,which, ifnottreated,contaminatesstreamsandgroundwater.Surface(strip)mining,whichismuchmore economicalthanshaftmining,causesscarringofthelandscape.Onlyrecentlywerethereintroduced someregulationsintheUnitedStatesandothercountriestoensuretherestorationofthewounds causedbytheremovalofoverburdenofthecoalseams,andrecoveryofthepitsandtrenchesafter thecoalhasbeenexhausted.
On-andoff-shoreoilandgasdrillingproducepilesofdrillingmud,alongwithanunsightly vistaofoilandgasderricks.Also,thereistheriskofcrudeoilspills,andexplosionsorfireatoil andnaturalgaswells.
Transportofcoal,oil,andgasbyrailroad,pipelines,barges,andtankerscarrytheriskofspills, explosions,andcollisionaccidents.Intherefiningprocess,especiallyofcrudeoil,toxicgasesare emittedintotheairorflared.Usually,someliquidandsolidbyproductsareproducedthatmaybe toxic.Strictregulationsmustbeenforcedtopreventthetoxicwastesfromenteringtheenvironment andtherebythreateninghumans,animals,andvegetation.
Thecombustionoffossilfuels—whethercoal,oil,orgas—inevitablyproducesahostof undesirableandoftentoxicbyproducts:(a)gaseousandparticulateemissionsintotheatmosphere,(b)liquideffluents,and(c)solidwaste.Inmanycountries,strictregulationswereenactedastothemaximumlevelofpollutantsthatcanbeemittedintotheairordischargedinto surfacewatersorthegroundfromlargecombustionsources,suchaspowerplants,industrial boilers,kilns,andfurnaces.However,thesmalleranddispersedcombustiondevices,suchas residentialandcommercialfurnacesandboilers,arenotregulated,andtheydoemitpollutants intotheair.Whilegreatstrideshavebeentakeninmanycountriestocontrolemissionsfrom
automobiles,trucks,andothervehicles,thesemobilesourcesstillcontributesignificantlyto airpollution.
Perhapsthegreatestlong-termthreattotheenvironmentisthesteadilyincreasingconcentration ofcarbondioxideintheatmosphere,forthemostpartaconsequenceofthecombustionoffossil fuel.CO2 andsomeotherso-calledgreenhousegasesmaytraptheoutgoingthermalradiationfrom theearth,therebycausingglobalwarmingandotherclimatechanges.
Inthischapterwedealwiththeenvironmentalproblemscausedbytheuseoffossilfuels.The chapterisdividedintosectionsonairpollution(withseparatesubsectionsonphoto-oxidantsand aciddeposition),waterpollution,andlandpollution.Thelargeloomingproblemofglobalclimate changeassociatedwithCO2 andothergreenhousegasemissionswillbeaddressedinthefollowing chapter.
Amongtheenvironmentaleffectsoffossilfueluse,thosethatimpairairqualityarearguablythe mostproblematic.Mostemissionsintotheatmosphereareaconsequenceoffossilfuel combustion Weareallfamiliarwiththevisiblesmokethatemanatesfromsmokestacks,fireplaces,anddiesel truckexhaustpipes.Butinadditiontothevisiblesmoke,aplethoraofpollutantsareemitted fromcombustion“sources”inaninvisibleform.Emissionsmayoccuralsoduringtheextraction, transport,refining,andstoragephasesoffossilfuelusage.Examplesarefugitivecoaldustemissions fromcoalpilesattheminemouthorstorageareasatpowerplants;evaporativeemissionsfrom crudeandrefinedoilstoragetanks,aswellasfromoilandgasolinespills;evaporativeemissions fromgasolinetanksonboardvehiclesandduringrefueling;naturalgasleaksfromstoragetanks andpipelines;fugitivedustfromashpiles;andsoon.
Airpollutionisnotarecentphenomenon.Airpollutionepisodesduetoopen-firecoalburning wereobservedinmedievalandrenaissanceEngland.In1272,KingEdwardIissuedadecree banningtheuseof“seacoal,”coalthatwasminedfromshallowseabedsandwasburnedwet inopenkilnsandironbaskets.In1661,JohnEvelyn,afoundingmemberoftheRoyalSociety, wrote“ asIwaswalkinginyourMajestiesPalaceatWhitehall apresumptuousSmoake didsoinvadetheCourt [that]mencouldhardlydiscernoneanotherfromtheClowd And whatisallthis,butthatHellishanddismallClowdofSea-Coal [an]impureandthickMist, accompaniedwithafuliginousandfilthyvapour .... ”1
Theassociationofairpollutionepisodeswithhumanmortalityandmorbiditywasrecognized inthelatenineteenthandearlytwentiethcentury.In1873,inLondon,duringatypical“fog” episode,268deathsoccurredinexcessofwhatwouldbenormallyexpectedinthatperiod.In 1930,intheheavilyindustrializedMeuseValley,Belgium,duringathree-daypollutionepisode, 60peoplediedandhundredswerehospitalized.In1948,duringafour-dayepisode,inDonora, Pennsylvania,whereseveralsteelmillsandchemicalfactoriesarelocated,20personsdiedand aboutone-halfofthe14,000inhabitantsgotsick.AterriblefogepisodeoccurredagaininLondon from5to8December1952.Theexcessdeathnumbered4000!Mostofthedeadpeoplehada
historyofbronchitis,emphysema,orheartdisease.Apparently,individualswithaprevioushistory ofrespiratoryandcardiacdiseasesarepredisposedtotheimpactofairpollution.
The1952LondonpollutionepisodeinducedtheBritishParliamenttopassaCleanAirActin 1956.ThisactfocusedonthemannerandqualityofcoalburnedinGreatBritain.Thisact,andthe factthatGreatBritainshiftedmuchofherfuelusefromcoaltooil,“cleaned”theairconsiderably overtheBritishIsles.TheubiquitousLondonfogbecameamuchrarerevent;andwhenitoccurs, itmaybetrulyanaturalphenomenon,ratherthanofanthropogeniccauseasitwasoftenin thepast.
IntheUnitedStatesthefirstCleanAirActwaspassedbyCongressin1963.Subsequently,the CleanAirActwasamendedin1970,1977,and1990.Othercountriesfollowedsuitbyenacting theirowncleanairactsandvariouslegislationandregulationspertainingtoreducingairpollution. Asaconsequence,theairqualityinmostdevelopedcountriesisimprovingsteadily,althoughwhat isgainedinreducingemissionsfromindividualsourcesisoftennegatedbytheever-increasing numberofsources,especiallyautomobiles.
Weclassifyairpollutantsintwocategories:primaryandsecondary.Primarypollutantsare thosethatareemitteddirectlyfromthesources;secondaryonesarethosethataretransformedby chemicalreactionsintheatmospherefromprimarypollutants.Examplesofprimarypollutantsare sulfurdioxide,nitricoxide,carbonmonoxide,organicvapors,andparticles(inorganic,organic, andelementalcarbon).Examplesofsecondarypollutantsarehigheroxidesofsulfurandnitrogen, ozone,andparticlesthatareformedintheatmospherebycondensationofvaporsorcoalescence ofprimaryparticles.Weshalllaterexplainsomeoftheprocessesthatleadtothetransformationof primarytosecondarypollutants.
Mostdevelopedcountriesprescribethemaximumamountofpollutantsthatcanbeemitted fromthesources.Thesearecalled emissionstandards.Forlargesources,theemissionstandardsare usuallysetatalevelthat,afterdispersionintheairwithinareasonabledistance,thepollutantswill notcausesignificanthumanhealthorenvironmentaleffects.Forsmallsources,suchasautomobiles, theemissionstandardmaybesetsoastopreventhealtheffectsfromthecumulativeemissionsof allsources.
Inordertoprotecthumanhealthandbiota,mostcountriesalsoprescribemaximumtolerable concentrationsintheair.Thesearecalled ambientstandards.Theemissionandambientstandards arelegalparameters,publishedinlawsanddecrees.Ifthesestandardsareexceeded,thecausative sourcescanbepunishedorpenalized,ortheirlicencescanberevoked.
IntheUnitedStates,emissionstandardshavebeenpromulgatedforstationaryandmobilesources. TheCleanAirActAmendmentsof1970,1977,and1990requiretheEnvironmentalProtectionAgency(EPA)topromulgateemissionstandards,calledNewSourcePerformanceStandards (NSPS)andNationalEmissionStandardsforHazardousAirPollutants(NESHAP).Emission standardsarespecifictocertainindustrialcategories,suchaspowerplants,steelplants,smelters, refineries,pulpandpapermills,chemicalmanufacturing,andsoon,aswelltomobilesources—that is,automobiles,trucks,aircraft,andships.Themaximumallowableemissionratesareprescribed foravarietyofpollutantsincludingSO2,NOx (thesumofNOandNO2),CO,particulatematter (PM),lead,mercury,arsenic,copper,manganese,nickel,vanadium,zinc,barium,boron,chromium, selenium,chlorine,HCl,benzene,asbestos,vinylchloride,pesticides,radioactivesubstances,and manyotherinorganicandorganicpollutants.
a DatafromEPA,StandardsofPerformanceforNewStationarySources,ElectricSteamGeneratingUnits, FederalRegister, 45, February1980,pp.8210–8213.
b Forpowerplantsbuiltafter1978,BestAvailableControlTechnology(BACT)applies.Thismeansthatifthe uncontrolledSO2 emissionsweretoexceed1.2lb/MBtu,90%emissionreductionisrequiredbyappropriate controltechnology(e.g.,wetlimestonescrubber).Foruncontrolledemissionslessthan0.6lb/MBtu,70% emissionreductionisrequired(e.g.,dryscrubber).Foruncontrolledemissionsbetween0.6and1.2lb/MBtu, aspecifiedcontroltechnologyappliesthatreducesemissionstoamaximumof0.6lb/MBtu.
c PM = particulatematter.ForPMemissionsanopacitystandardalsoapplies,whichallowsamaximum obscurationofthebackgroundskyby20%fora6-minuteperiod.
Asanexample,Table9.1liststheNSPSforfossil-fuel-firedsteamgenerators,includingelectric powerstations,withathermalpowerinputofmorethan73MW(250millionBtu/hr).Thethermal powerinputequalsthefuelheatingvaluetimesitsmassrateofconsumption.Thus,apowerplant witha500-MWelectrical output rating,operatingatathermalefficiencyof33.3%,willhavea 1500-MWthermal input.Likewise,theNSPSaregiveninunitsofpollutantmassperfuelenergy (heatingvalue) input, grams/Jouleorlb/Btu.
TheestimationofthemassemissionrateofSO2 fromafossilfuelfiredsteamgeneratorsis quitesimple.BecausepracticallyallsulfuratomsinthefuelburnuptoformaSO2 molecule,all weneedtoknowistheweightpercentofsulfurinthefuelanditsheatingvalue.Themassemission rate
where FR isthefiringrateoffuelinlb/sorg/s.Thespecificemissionrateperunitoffuelenergy input, eSO2 ,is
where HV istheheatingvalueoffuelinBtu/lborJ/g.ThefactoroftwoarisesbecauseSO2 has doublethemolecularweightofS.
TheemissionrateofNOx orCOcannotbecomputedinthatmanner,becausetheformationof thesepollutantsisdependentonthecombustionprocess,andnotontheweightpercentoftheatoms inthefuel.Therateofemissionofparticulatematterisdependentonthecontentofincombustible
mineralmatterinthefuelandonthecombustionprocess.TheemissionratesofNOx,CO,andPM wouldhavetobemeasuredatthestackexit.
FormobilesourcestheU.S.emissionstandardsaregivenforfourmajorpollutantsthatare emittedfromthesesources:carbonmonoxide,hydrocarbons(HC),oxidesofnitrogen,andparticulatematter(PM).Table9.2liststheemissionstandardsformobilesources.Theunitsaregrams/mile. ForNOx theunitsarereckonedinmassofNO2.Hydrocarbonsincludeallcarbonaceousemissions, exceptcarbonmonoxideanddioxide,comingfromthetailpipeandevaporativeemissionsfrom thefueltank,lines,pump,andinjectiondevices.Thehydrocarbonmassunitofmeasurementisthe molecularfragmentHC.
BeginningwiththeCleanAirActAmendmentsof1977,andcontinuingwithCAAA1990, theU.S.CongressrequiredEPAtoadoptacompletelynewwayofregulatingemissionratesfrom stationarysources.Insteadofdefiningandmeasuringemissionratesforeachindustrialcategory, whatisspecifiedisthe controltechnology thatispresumedtoachievethedesiredemissionstandard. Thus,amultitudeofacronymscameintobeing,likeBACT(BestAvailableControlTechnology), MACT(MaximumAchievableControlTechnology),andRACT(ReasonableAvailableControl Technology).Dependingontheindustrialcategory,thepollutant,andthequalityoffuel,aswell asontheseverityofpollutioninan“airshed,”theEPAdetermineswhichcontroltechnology needstobeinstalledon new sources.TheCAAA1990wentevenfurther.Forthecontrolof emissionsoftoxicpollutantsandtheprecursorsofphoto-oxidants,theactrequiresthateven existing sourcesneedtheinstallationofemissioncontroltechnology.Thismeans retrofitting control devicesonoldersourcesthatinpreviousactswere“grandfathered.”Forexample,inpowerplants thatusecoalinexcessof0.6%byweightofsulfurtheBACTforSO2 controlisawetlimestone scrubber;forcoalwithalowersulfurcontent,itisadrysorbent(usuallylimestoneorlime)injection (seeSection5.2.9.3).ForNOx controlthepresentfederalBACTisalow-NOx burner(LNB),but somestatesrequireforNOx controlselectivecatalyticreductionornonselectivecatalyticreduction
(seeSection5.2.9.4).Forparticlecontrolonpowerplants,BACTisanelectrostaticprecipitator.For otherindustrialcategoriestherequirementmaybeafabricfilter(“baghouse”)oraspraychamber scrubber(seeSection5.2.9.1).
TitleIVofCAAA1990specificallyaddressestheaciddepositionproblem.Bytheyear1995, theaverageemissionlevelofallmajorpowerplantsandindustrialboilerswastobelimitedto 2.5lbSO2 permillionBtuheatinput;andbytheyear2000,1.2lbSO2/MBtu.Itisestimatedthat intheyear2000theU.S.emissionsofSO2 wereroughlyone-halfofwhattheywerein1990,or abouta10milliontonreduction.Theutilitiesandindustrycouldchooseanymethodtheywished toachievethatemissionreduction,includinginstallingfluegasdesulfurizationtechnology,fuel switching,seasonalfuelswitching(e.g.,usingcoalinthewinterandnaturalgasinthesummer), andmarketablepermits.ThelattermeansthatifonesourcereducesSO2 emissionsbymore thantherequiredquota,theexcesscanbesoldtoasourcethatdoesnotwishtoreducethat pollutant.
Fortoxicpollutants,suchasmaybeemittedfrompetroleumrefineries,chemicalmanufacturing,aluminumsmelters,paperandpulpmills,automobilepaintshops,drycleaners,andsoon,the requirementisMaximumAchievableControlTechnology(MACT).Dependingonthepollutant andthefacility,MACTusuallyconsistsofadsorption,absorption,orincineration.
TheBACTsandMACTsarenotsupposedtobecastinconcreteforalltimes.Asnewtechnologiescomeintothemarketthatprovetobemoreefficientand/ormoreeconomical,theEPA mayadopt,afterdueprocess,newtechnologiesinlieuoftheoldones.Inanycase,theintroduction of“technologyforcing”asmanifestedbyBACTandMACTisarevolutionaryconcept.Itplaces theonusongovernmenttodevelopanddefineappropriateemissioncontroltechnologies,rather thanmerelysettinganemissionstandard,andletthe“sources”findthedevicesthatmeetthestandard.Also,thefederallyrequiredcontroltechnologiesareuniformacrossthenation.Individual statesmayimposeevenstrictercontroltechnologies,butneverlessefficientones.Thisnewway ofcontrollingemissionsplacesemphasisnotonlyonmeasurementofemissionrates,butalsoon monitoringandsupervisingtheinstallationandproperfunctioningofthecontroldevices.
Thesettingofemissionstandardshasasitspurposeensuringthatconcentrationsofairpollutants intheambientairremainatasufficientlowlevelsothatthepopulationatlarge—and,especially, sensitiveindividuals,suchaschildrenandtheelderly—willnotsufferadversehealtheffects. Theappropriateindicesforexposuretoharmfulairpollutantsaretheambientconcentrationsand theaveragingtimeperiodsforwhichtheseconcentrationsprevail.Therefore,theU.S.Congress mandatedtheEPAtopromulgateambientconcentrationstandards,calledtheNationalAmbient AirQualityStandards(NAAQS).TheNAAQSstipulatetheconcentrationsandtheaveraging timeperiodsforvariousairpollutantsthatshouldnotbeexceeded.IntheUnitedStates,current ambientstandardsexistforfivepollutants:particulatematter(PM),sulfurdioxide(SO2),nitric oxides(NOx,measuredasNO2),carbonmonoxide(CO),andozone(O3).Thesearetheso-called criteriapollutants.Thisisnottosaythatconcentrationsofotherpollutantsneednotbecurtailed.
Indeed,sometoxicpollutantsmaybefarmoreinjurioustohumanhealthandbiotathanthe aforementionedfivepollutants.Thefactisthatforthecriteriapollutantsafairlywellknowndose–responserelationshiphasbeenestablishedoveryearsofclinicalandepidemiologicalresearch, whilesucharelationshipmaynotbeknownformanyotherpollutants.Fortheotherpollutants, classifiedas toxicpollutants, therearenospecifiedambientstandards,buttheiremissionintothe
PrimarySecondary Pollutantppm µg/m3 ppm µg/m3
Carbonmonoxide(CO)
8-haverage 910mg/m3
1-haverage 3540mg/m3 Nitrogendioxide(NO2)
Annualarithmeticmean0.053100SameSame Ozone(O3)a 3-yaverageofannualfourthhighestdaily maximum1-hconcentration0.12236SameSame Particulatematter,diameter < 10 µm(PM-10)b
Annualarithmeticmean 50Same
Arithmeticmeanof24-h99thpercentile, averagedover3y 150Same Sulfurdioxide(SO2)
Annualarithmeticmean0.0380 24-haverage0.14365 3-h 0.51300
a Proposednewstandard:3-yaverageofannual4thhighestdailymax.8-hconcentration,0.08ppm = 157 µg/m3 b Proposedadditionalnewstandardforparticulatematter,diameter < 2.5 µm(PM-2.5):3-yannualarithmetic mean,15 µg/m3;arithmeticmeanof24-h98thpercentileaveragedover3y,65 µg/m3 .
atmosphereistobepreventedasmuchaspossiblebyapplyingatthesourcesMaximumAchievable ControlTechnology(MACT).
TheNAAQSforthefivecriteriapollutantsarelistedinTable9.3.Primarystandardsrelateto humanhealtheffects,andsecondarystandardsrelateto“welfare”effects.TheNAAQSdefinitely haveananthropocentricaspect—thatis,theypertaintohumanhealthandwelfare—butitisunderstoodthatthewelfarestandardsareforprotectingtheenvironmentingeneral.Theaveraging timescanbeasshortasonehour(forCO)tooneyear(forPM,SO2,andNO2).Thereasonisthat theexposureofsomepollutantsatahighconcentrationforashortperiodmaycauseacuteeffects, whereastheexposureofothersatarelativelylowlevelforlongerperiodsmaycausechroniceffects (seebelow).Thenumberofallowed“exceedances”isalsolisted.Forexample,the1-hourstandard forCO,40mg/m3 (9partspermillionbyvolume,ppmV),mustnotbeexceededmorethanonceper year.TheO3 standardis0.12ppmV,1-houraverage,nottobeexceededmorethanonceperyear. Recenthealthandecologicalstudiesindicatedthatozonemaybeharmfulatalowerlevelwhen exposedforalongerperiod,soanewstandardhasbeenproposedof0.08ppmV,8-houraverage. Likewise,anewPMstandardhasbeenproposed.Currently,onlyparticleswithanaerodynamic diameteroflessthan10 µmareregulated(PM-10).However,recentepidemiologicalstudiesindicatedthatparticlessmallerthan2.5 µmaremostdetrimentaltohealth,becausetheylodgedeeply inthelung’salveoli.Thus,inadditiontoPM-10aPM-2.5standardmaybeimplemented.
TheEPAismandatedtorevisetheNAAQSfromtimetotime,asmoreresultsfromhealthand environmentaleffectsstudiesbecomeavailable.Forexample,EPAhasbeenurgedtopromulgate ashorttimestandardforNO2 insteadoftheannualstandard.
IftheNAAQSareexceededwithinanAirQualityControlRegion(AQCR),thestateinwhich theregionislocatedmustdevelopaplan,calledtheStateImplementationPlan(SIP),which laysoutastrategyofhowtheregionwillattaincompliancewiththeNAAQSinareasonable timeperiod.TheSIPmayincludeemissioncurtailmentsfromemittingsources,trafficregulations, tightenedinspectionschedulesandprocedures,andothermeasures.However,researchinthepast fewdecadesbroughtoutclearlythatairpollutantsdonotrespectpoliticalandnaturalgeographic boundaries.Theytravelovercontrolregions,statelines,rivervalleys,mountains,andevenover oceans.Thus,nostatecancontrolitsairpollutionsolelybyitsownmeans.Aregional,national, andeveninternationalapproachisnecessarytocontrolairpollutionoveraregion,overacontinent, and,forsomeairpollutants,overtheglobe.Inpart,thisisthereasonthatintheUnitedStates, emissionsofmostairpollutantsareregulatedonthefederalratherthanonthestatelevel.
Airpollutants,whentheyexceedcertainconcentrations,cancauseacuteorchronicdiseasesin humans,animals,andplants.Theycanimpairvisibility,causeclimaticchanges,anddamage materialsandstructures.Traditionally,themajorconcernwastheimpactonhumanhealth.That iswhyintheUnitedStatesthestandardsthataresupposedtoprotecthumansarecalledprimary standards,andthosethatprotect“welfare”arecalledsecondarystandards.
Table9.4listssomeofthehealthandenvironmentaleffectsofairpollutantsthatarerelated tofossilfueluse.ThelistedairpollutantsareclassifiedascriteriapollutantsbyEPA:SO2,NOx, O3,CO,andparticulatematter(PM).Forthesepollutants,EPApromulgatedNationalAmbientAir QualityStandards(NAAQS;seeSection9.2.2).Theorderoflistingdoesnotfollowanyparticular ranking:Someindividualsorplantsaremoresensitivetoonekindofpollutantthantoanother.The pollutantscancauserespiratorydiseases,andsomearesuspectedtoxigens,mutagens,teratogens, carcinogens,andpossibleanimal-andplant-disease-causingagents.2
ThedefinitionofthedeleteriouseffectsofPMiscomplicatedandcontentious.Theambient standardsaregiveninunitsofmasspervolume(µg/m3).Surely,theeffectsonhealthandbiotaare notdependentasmuchonmassconcentrationsoftheinhaledparticles,butontheirquality—that is,theircomposition.Whileordinarysoilandroaddustmaynotcausesignificanthealtheffects, particlesthatcontainacidicspecies,heavymetals,soot,andpolycyclicaromatichydrocarbons (PAH)maycauserespiratory,neurological,andcancerousdiseases.Itisunlikelythatagricultural workerswhoinhaleagreatamountofsoildustsufferasmuchrespiratoryandneurologicaldiseases asurbandwellerswhoinhalemuchsmalleramountsbutpotentiallymorelethalphotochemical smogparticles.OnereasonthatEPAandotherenvironmentalprotectionagenciesareusingmass concentrationsasastandardforPM,ratherthanchemicalcomposition,isthatthedeterminationof chemicalcompositionrequirescomplicatedandexpensiveanalyticalinstrumentation.Furthermore, EPAmaintainsthatthereisevidencefromepidemiologicalstudiesthatexcessivemortalityand morbidityiscorrelatedwithmassandsizeoftheparticles,regardlessofchemicalcomposition.
2Toxigen:achemicalagentthatmaycauseanincreaseofmortalityorofseriousillness,orthatmayposea presentorpotentialhazardtohumanhealth.Mutagen:anyagent,includingradioactiveelements,thatmay causebiologicalmutation—thatis,alterationofthegenesorchromosomes.Teratogen:anagentthatmay causedefectsordiseasesoftheembryo.Carcinogen:anagentthatmaycausecancer.
TABLE9.4 EffectsofCriteriaAirPollutantsonHumanHealth,FaunaandFlora,andStructuresand Materials
PollutantHealthEffectFaunaandFloraEffectStructureandMaterial
SO2
NOx
O3 andphotooxidants
Bronchoconstriction,cough.Cellularinjury,chlorosis,witheringofleavesandabscission.Precursortoacidrain:acidification ofsurfacewaterswithcommunityshiftsandmortalityofsome aquaticorganisms.PossibleeffectonuptakeofAlandother toxicmetalsbyplantroots.
Pulmonarycongestionandedema, emphysema,nasalandeye irritation.
Pulmonaryedema,emphysema, asthma,eye,nose,andthroatirritation,reducedlungcapacity.
CONeurologicalsymptoms,impairmentofreflexesandvisualacuity,headache,dizziness,nausea, confusion.Fatalinhighconcentrationsbecauseofirreversible bindingtohemoglobin.
ParticulatematterNonspecificcomposition:bronchitis,asthma,emphysema.Compositiondependent:brainand neurologicaleffects(e.g.,lead, mercury),toxigens(e.g.,arsenic, selenium,cadmium),throatand lungcancer(e.g.,coaldust,coke ovenemissions,polycyclicaromatichydrocarbons,chromium, nickel,arsenic).
a NA,notavailable.
AdaptedfromWark,K.,C.F.Warner,andW.T.Davis,1998.
Chlorosisandnecrosisofleaves. Precursortoacidrainandphotooxidants.
Vegetationdamage,necrosisof leavesandpines,stuntingof growth,photosynthesisinhibitor, probablecauseofforestdie-back, suspectedcauseofcroploss.
Weatheringandcorrosion.Defacingofmonuments.
Weatheringandcorrosion.
Attackanddestructionofnatural rubberandpolymers,textilesand materials.
NASoilingofmaterialsandcloth. Visibilityimpairmentduetolight scatteringofsmallparticles.
AirPollution:ItsOriginandControl.Reading:Addison-Wesley.
Afterleavingthesmokestackorexhaustpipe,theprimaryairpollutantsdisperseintotheatmosphere byturbulentdiffusion,advectbywinds,andtransformintosecondarypollutantsbychemical reactionsamongthemselvesandwithatmosphericspecies.Theestimationoftheconcentration ofpollutantsinspaceandtimeiscalledair-qualitymodeling.Itisalsocalledsource–receptor modelingordispersionmodeling,wherethesourcesareemissionsfrompoint(e.g.,asmoke stack),line(e.g.,ahighway),orarea(e.g.,anindustrialcomplex)sources,andthereceptorsare
designatedhumanhabitatsorecologicallysensitiveareas.3 Inthissectionweshalldealonlywith nonreactivepollutants—thatis,thosethatarenottransformedintheatmosphere.Insubsequent sectionsweshallincorporatetransformationprocessesintoair-qualitymodels.
Abasicinformationnecessaryforair-qualitymodelingisthewindstatisticsforthemodelingdomain andthedispersioncharacteristicsoftheatmosphere.Windsblowfromhigh-tolow-pressureregions onearth.Becausetheearthisarotatingbodyrevolvingaroundthesun,anyspotonearthreceives constantlychanginginsolationoverdayandnightandovertheseasons.Inaddition,orographic effects—thatis,mountainsandvalleys—alterthecourseofwinds,asdoessurfacefriction,sea–landinterfaces,streetcanyons,andsoon.Thus,forair-qualitymodeling,multiyearwindstatistics arenecessaryforpredictingtheadvectionbywindsofpollutantsfromthesourcestothereceptor.
Meteorologicaldataareavailablefromnumerousweatherstationsoperatingaroundtheworld, especiallyinthemoredevelopedcountries.Theseweatherstationsmeasureandrecordsurface andupperairwinds,atmosphericpressure,humidity,precipitation,insolation,temperatureatthe ground,andthetemperaturegradientintheatmosphere—thatis,thetemperaturevariationwith altitude.Themeasurementsareusuallyrenderedtwicedailyat0000and1200GreenwichMean Time(GMT),sothatmeasurementsaresynchronizedallovertheworld.Pastandpresentweather dataareavailablefromnationalrepositories—forexample,intheUnitedStates,theNational WeatherServiceinAsheville,NorthCarolina.
Intheatmosphere,dispersionoccursmostlybyturbulentoreddydiffusion.Suchdiffusionis ordersofmagnitudefasterthanmolecularorlaminardiffusion.Thecauseforturbulentdiffusionis eithermechanicalorthermal.Mechanicalturbulenceisduetowindshearsinthefreeatmosphere (adjacentlayersoftheatmospheremoveindifferentdirectionsorspeeds),orfrictionexperienced bywindsblowingoverthegroundsurfaceandobstacles,suchastreecanopies,mountains,and buildings.Theothercauseofturbulenceisthethermalgradientintheatmosphere.Inthelower troposphere,thetemperatureisusuallyhighernearthegroundanddeclineswithaltitude.Inadry atmosphere,thegradientamountstoapproximately 10 ◦C/km.Thisisthedryadiabaticlapse rate.Occasionally,thegradientissteeper,meaningmorenegativethan 10 ◦C/km.Inamoist atmospherethegradientislesssteep,duetotheadditionofthelatentheatofcondensationofwater vapor.Atnight,duetoradiativecoolingofthesurface,thegradientmaybecomepositive,with temperatureincreasingwithaltitude.Thisiscalledaninversion.Inversionscanalsooccuraloft, whenanegativegradientisinterruptedbyapositiveone.Thebottomlayeruptotheinversionis calledthemixinglayer,andtheheighttotheinversioniscalledthemixingdepth.Aninversionlayer actslikealidonthemixinglayer.Withaninversion,atmosphericconditionsareespeciallyprone toairpollutionepisodes,becausepollutantsemittedatthegroundareconcentratedintheshallow mixinglayer.Laterintheday,asthesunrises,theinversionlayermaybreakup,allowingpollutants toescapealoftandthusalleviatingthepollutionepisode.Valleysandurbanareassurrounded bymountainchainsexperiencefrequentlyinversionlayers,andthereforetheyareplaguedwith
3Anothertypeofmodelingiscalledreceptormodeling.Thesemodelsattempttoidentifyandquantifythe contributionofvarioussourcestotheamountandcompositionofthepollutantconcentrationatthereceptor byusingsomecharacteristicsofthesources.Forexample,receptormodelingmaycomparethedistribution oftraceelementsatthereceptortothedistributionoftraceelementsintheemissionsofvarioussources.
pollutionepisodes.LosAngeles,Denver,SaltLakeCity,MexicoCity,andindustrial-urbanizedriver valleysacrossthecontinentsareexampleswithfrequentinversions,wherepollutantconcentrations oftenexceedair-qualitystandards,andthepopulationsuffersfrompollutant-causedrespiratoryand otherdiseases.
Whenthetemperatureintheupperlayersismuchcolderthanthatinthelowerlayers,upper airparcelsfalldownwardduetotheirlargerdensity,andlowerairparcelsmoveupward.This movementgeneratesturbulentoreddydiffusion.Thesteeperthetemperaturegradient,themore theturbulentintensity.Thisiscalledanunstablecondition.Atemperaturegradientthatisequal tothedryadiabaticlapserateiscalledaneutralcondition,anditleadstomoderateturbulence.A temperaturegradientthatislesssteepthanthedryadiabaticlapserate,orevenapositivegradient, iscalledastablecondition,inwhichthereisminimalornoturbulenceatall.
Itisaconventiontoclassifytheturbulentconditionsoftheatmosphereintosixstability categories,calledPasquill–Giffordstabilitycategories.TheyrangefromA,veryunstable(very turbulent),toF,verystable(littleturbulence).CategoryDiscalledneutral,withmoderateturbulence.Thenegativetemperaturegradient(lapserate)ofcategoryDcoincideswiththedryadiabatic lapse,about 10 ◦C/km.ForcategoriesA,B,andCthemagnitudeofthenegativegradientisgreater thanthatforD;forEthegradientissmallerthanthatforD;andforFthegradientispositive.
Whilethelapserateoftheatmosphereismeasuredtwicedailyattheweatherstations,the stabilitycategoriescanbeapproximatelydeterminedbyknowingthesurfacewindspeed,insolation, andcloudcover.Table9.5liststhestabilitycategories.Itisseenthatindaytime,lowwindspeeds andstronginsolationleadtounstablecategoriesAorB;highwindspeedsandmoderatetoslight
insolationleadtoneutralcategoriesCorD.Atnight,thestabilitycategoriesarealmostalways neutralorstable:D,E,orF.Table9.5alsoliststhetemperaturegradientswhichcorrespondtothe stabilitycategories.
Whenaneffluentfromapowerplantstackleavesthetopexitofthestack,itimmediatelybeginsto mixwiththesurroundingatmosphere,becausetheeffluentjetvelocityisdifferentfromthatofthe surroundingatmosphere.Thismixingprocessbeginstodilutetheconcentrationofthestackgas, themoresothemoreatmosphericairisentrainedinthestackplume.Mostofthetimeawindis presentsothattheplume,asitmixeswiththeatmosphere,soonattainsthehorizontalspeed u ofthe wind,withtheplumeaxis(orcenterline)bendingsharplyandapproachingthehorizontaldirection. Atthispointintheplumetrajectory,mixingoftheplumegaswiththeatmospherecontinuesat aratedeterminedbytheturbulentmotionoftheatmosphere.Asaconsequenceofthismixing process,theconcentrationoftheplumegas,amixtureoftheprincipalproductsofcombustion andtheairpollutantsofinterest,steadilydeclineswithdownwinddistancefromthestackexit. Thephysicalevidenceofthismixingisvisibletotheeyeforsmokyplumes,whereitcanbeseen thattheplumewidthinbothverticalandhorizontaldirectionsincreaseswithdownwinddistance, markingtheportionofthesurroundingatmosphereintowhichtheeffluentgashasbeenmixedand therebydiluted.
Measurementsofthepollutantgasconcentrationsdownwindofstacksshowthat,atanydistance x downwind,theyaremaximumattheplumecenterlineanddeclinewithverticalorlateral distancefromtheplumecenterline.Thecenterlineconcentrationandtheeffectiveverticaland horizontalwidthsofplumechangegraduallywiththedistance x,inawaythatisdependentupon theatmosphericconditions.Theconcentrationprofileinboththe y and z directioncanbeapproximatedbyaGaussian(bell-shaped)curve.Togeneralizetheresultsofsuchplumemeasurements, amathematicalmodel,calledtheGaussianplumemodel,hasbeendeveloped.
AsmokestackplumeisdepictedinFigure9.1.Thestackisplacedattheoriginofthecoordinate system,withthe x axisdownwind,the y axiscrosswind,andthe z axisisinthevertical.Thestack
hasaheight h.Becausetheexhaustgasisusuallywarmerthantheambientair,itrisesdueto buoyancybyanincrementalheight h.Thisisthe“plumerise,”whichwillbeevaluatedlater.The finalplumecenterlineisatheight H = h + h.Thepollutanttime-averagedmassconcentration
c(x, y, z) atadownwinddistance x fromasourceofpollutantemittedatamassrate Q p gs 1,at aheight H m,inthepresenceofwindofspeed u ms 1,isgivenbythefollowingequation,called theGaussianplumeequation(GPE):
c(x, y, z) =
The σ ’sarethestandarddeviationsoftheGaussianprofile.Theirdimensionisgiveninmeters. The σ ’sarecalleddispersioncoefficients,althoughtheyshouldnotbeconfusedwithdiffusion coefficients,whichhaveadimensionm2 s 1.The σ ’sareafunctionoftheturbulentcondition oftheatmosphereandthedistancefromthesource.Thedispersioncoefficients σy and σz as afunctionofdownwinddistance x arepresentedinFigure9.2.Itisseenthatthe σ ’sarenot necessarilyequalinthe y and z directions.Thesixcurvescorrespondtotheatmosphericstability categoriesAthroughF.Becausethe σ ’sarelargestforunstableconditionsandaresmallestforstable conditions,stabilitycategoryAleadstoarapiddispersionoftheemittedpollutantsandleadsto highestgroundconcentrationnearthesource.CategoryFleadstoaslowdispersionandleads tohighestgroundconcentrationfarfromthesource.Mostly,weareinterestedinconcentration ofpollutantsontheground;thatis, z = 0.Forground-levelconcentrationsitisassumedthatthe pollutantmoleculesarenotabsorbedattheground,butreflectedasiftheywereanopticalray thatgrazesamirror.Withthisassumption,thefactor2disappearsinthedenominatoroftheGPE [equation(9.3)],andground-levelconcentrationsaretwicethatwithoutreflection.
Forquickestimationofmaximumground-levelpollutantconcentrations(withgroundreflection)itisconvenienttouseFigure9.3.Here cmax isthemaximumconcentrationin µgm 3 , u iswindspeedinms 1,and Q p mustbereckonedin µgs 1.Theletteredparametersontopof thecurvesarethestabilitycategories;thoseonthesidearetheplumecenterlineheights H after theplumehasrisentoitsequilibriumvalue.Itisseenthatforhighstacks(H ≥ 50m),theunstable categoriescausemaximumconcentrationsonthegroundrelativelyneartothestack,andstable categoriescauseweakmaximumconcentrationfarfromthestack.
ItmustbeemphasizedthattheGaussianplumemodelisonlyanapproximation.Itworksbest onlevelground.Becausethewindspeed u appearsinthedenominator,theGPEcannotbeusedfor calms,whenthewindspeedislessthanapproximately2m/s.Also,themodelingdistanceshould notbeextendedfurtherthan20–30km,becausewinddirectionandspeed,aswellasthedispersion characteristics(atmosphericstabilitycategory),maychangeoverlongerdistances.Becausethe GPEisasteady-statemodel,theemissionrate Q p andplumerise h mustalsoremainconstant. Experienceshowsthatwithinalimiteddistanceandonlevelterrain,theGPEgivesconcentration contoursonthegroundthatarewithinafactoroftwoofmeasurements.Invalleys,hills,andurban areas,aerodynamicobstacleeffectsneedtobeconsidered.Numerousequationsexistthatwork reasonablywellwhencorrectionsforterraincomplexitiesareincorporatedintotheGaussianplume model.
Thereareseveralempiricalequationsthatallowtheestimationofplumerise h fromknown stackexitconditions.HerewegivetheBriggsplumeriseequation,whichismostlyusedin
EPA-recommendeddispersionmodels.For unstable and neutral conditionswehave
andwhere
g = accelerationofgravity(9.8ms
vs = fluegasstackexitvelocity,ms 1
Ds = stackdiameter,m
Ts = fluegasexittemperature,K
Ta = ambienttemperatureatstackheight,K
u = windspeedatstackheight,ms
andwhere δθ/δz isthepotentialtemperaturegradient,whosevalueis0.02K/mforcategoryEand is0.035K/mforcategoryF.4
Alinesourcepertainstoasituationwherepointsourcesarealignedinarow,suchasseveralsmoke stacksalongariverbank,ormanyautomobilesandtruckstravelinginbothdirectionsalonga straighthighway.ThegeometryofalinesourceisdepictedinFigure9.4.Thegroundlevelmass concentration c(x) isestimatedbythefollowingvariantoftheGPE
where
Ql = averagelinesourcemassemissionratepermeter,gm 1 s 1
H = averagereleaseheightfromsources,m
4Equation(9.4)isonlyapplicableforabuoyancyparameter F > 55m4 s 3.For F ≤ 55m4 s 3,andunstable orneutralconditions h = 21 425F3/4 u 1
φ = anglebetweenthesourceaxisandtheprevailingwinddirection(whichbyconvention alwaysblowsinthe x direction),degrees
x = distanceofthereceptorfromthesourceaxisinthedirectionofthewind,m
Notethatthedistanceparalleltothesourceaxisdoesnotappearinequation(9.8)becausethe concentrationdoesnotchangeinthatdirection.Equation(9.8)shouldnotbeusedwhen φ isless than45
Emissionsfromanurbanareacanbeconsideredasemanatingfromabunchofparallellinesources, asdepictedinFigure9.5.Theground-levelmassconcentration c(x) ofpollutantatadownwind
distance x isgivenbythefollowingequation:
Qa = averagemassemissionratepersquaremeter,gm 2 s 1
l = widthoftheurbanareaalongthewindaxis,m
Equation(9.9)canonlybeusedatdownwinddistances x ≫ l.Itisalsonecessarythatthe crosswinddimensionoftheurbanareabelargerthan σy (l).
Photo-oxidantsareaclassofsecondaryairpollutantsformedfromsomeoftheprimarypollutants emittedbyfossilfuelcombustion.Thenamearisesbecausethesechemicalsareformedunderthe influenceofsunlight,andallofthemhavestrongoxidizingcapacity.Theyirritateanddestroy (oxidize)therespiratorytract,eyes,skin,animalorgans,vegetationtissues,andmaterialsand structures.Themajorrepresentativeofthisclassofchemicalsisozone,O3,butothercompounds areincluded:ketones,aldehydes,alkoxyradicals(RO)peroxyradicals,(RO2),peroxyacetylnitrate (PAN),andperoxybenzoylnitrate(PBN).ThesymbolRdenotesahydrocarbonfragment,withone hydrogenmissing.
Troposphericozone(the“bad”ozone)istobedistinguishedfromstratosphericozone(the “good”ozone).Troposphericozoneismainlyformedasaconsequenceoffossilfuelcombustion, whilestratosphericozoneisformednaturallybyphotochemicalreactionsundertheinfluenceof solarultravioletradiation.5 Someofthetroposphericozonemaybeduetointrusionofstratospheric ozoneintothetroposphere.Thisconstitutesabackgroundlevelofozone.However,comparedto concentrationsofozoneinanurbanpollutedatmosphere,thebackgroundozoneisasmallfraction ofthatconcentration.
ThecurrentNAAQS(seeSection9.2.2)forO3 is120partsperbillionbyvolume(ppbV), 1-hourmaximumconcentration.Duringthe1990s,thisstandardwasexceededmanytimesper yearinmostmajormetropolitanareasoftheUnitedStates,especiallyincitieswithhighinsolation andtemperatureandwheretopographicconditionsarepreventinggoodventilation,suchasLos Angeles,SaltLakeCity,Phoenix,Houston,Dallas-FortWorth,Denver,Atlanta,andothercities. Highozonelevelsareobservedinmostmetropolitanareasoftheworld,especiallyareaswith highinsolation,suchasMexicoCity,SaoPaulo,Jakarta,Bombay,Cairo,Istanbul,Rome,Athens, Madrid,andothercities.Butruralandremoteareasthataredownwindfrommetropolitanareas arealsoexperiencingelevatedozoneconcentrations.Thehighconcentrationsinruralandremote areasmaycontributetodegradationanddie-backofplantsandtrees.
5Asiswellknown,stratosphericozonehasbeendepletedoverthepastdecadesduetothepenetrationinto thestratosphereoflong-livedindustrialchemicals,thechlorofluorocarbons,creatingtheso-called“ozone hole.”Stratosphericozoneshieldshumans,animals,andvegetationfromthepenetrationtothesurfaceofthe earthofharmfulultravioletradiation.Itisanironythatmankind,ononehand,createstroposphericozone byemissionsofcombustionproductsoffossilfueland,ontheotherhand,destroysstratosphericozoneby emissionsofsomeotherchemicals.
Theonlyprecursorthatcaninitiateozoneformationinthetroposphereisnitrogendioxide, NO2.Asweshallseelater,othergases,bothman-madeandnaturalones,canabetozoneformation, buttheinitiationoftheprocessissolelyduetoNO2.Nitrogendioxideisabrowngas,formedby oxidationofnitricoxide,NO.ThesumofNOandNO2 istermednitricoxides,NOx.Nitricoxides areformedprimarilyinthecombustionoffossilfuels.ApartoftheNOx isformedonaccount oftheinherentnitrogencontentoffossilfuels,especiallycoalandpetroleum.Thisiscalled“fuel NOx .”Agreaterpartisformedduringcombustion.Atthehighflametemperaturessomeoftheair O2 andN2 combinetoformNOandNO2.Thisiscalled“thermalNOx .” Nitrogendioxidegascanphoto-dissociateinsunlight,atwavelengthsshorterthan420nm. Theresultingatomicoxygencombineswithmolecularoxygentoformozone:
whereMisaninertmoleculewhichisnecessarytobringaboutthecombiningofatomicand molecularoxygen.SincetheformedO3 canbedestroyedbythesameNOwhichisformedin (9.10):
thiscycleofreactionscannotexplainthelargeconcentrationsofozonethatareobservedinvarious regionsoftheworld.Itwasassumedinthelate1950sandearly1960sbyscientistsattheCalifornia InstituteofTechnologythatinsteadofreaction(9.12),NOisreoxidizedtoNO2 bysomeatmospheric oxidantotherthanO3,therebystartingreaction(9.10)alloveragain,allowingthebuild-upofO3 fromarelativelysmallconcentrationofNO2.That“mystery”oxidantturnedoutlatertobeaperoxy radical,RO2.Thisradicalisformedinthefollowingsequenceofreactions:
RHdesignatesahydrocarbonmolecule,OHisahydroxylradical,ROisaanalcoxyradical,and RO2 isaperoxyradical.Thenaturallyoccurringperoxyradical,HO2,canalsooxidizeNOtoNO2 Thehydroxylradicalappearstobeomnipresentintheatmosphere.Itisformedbyreactionofwater vaporwithanexcitedoxygenatomO(1D).ThelatterisformedinthephotodissociationofO3 by sunlightofwavelengthlessthan319nm.
Indeed,theperoxyradicalsweresubsequentlyfoundinthelowertroposphereandinlaboratory experiments,calledsmogchambers.Nowthepictureoftheformationprocessofozoneandthe otherphoto-oxidantsbecomesmuchmorecomplicated.WhileNO2 isthesparkthatstartstheflame, other“fuels”arenecessarytosustaintheflameandraiseitstemperature,metaphoricallyspeaking. Theotherfuels,orprecursorsastheyarecalled,arehydrocarbonmoleculesandotherorganic compounds,collectivelyknownasvolatileorganiccompounds(VOC).SomeoftheVOCareof anthropogenicorigin,suchasproductsofincompletecombustion,evaporationoffuelsandsolvents, emissionsfromrefineries,andotherchemicalmanufacturing.Othersareofbiogenicorigin,suchas
evaporationandvolatilizationoforganicmoleculesfromvegetation,wetlands,andsurfacewaters. Forexample,evergreentreesexudecopiousquantitiesofisoprene,terpenes,pinenes,andother compounds,which,byvirtueofdoublebondsintheirmolecules,areveryreactivewithahydroxyl radical.
Afterthediscoveryofthepresenceintheatmosphereofthevariousoxidizingagentsandother compoundsthatparticipateintheozoneformationprocess,researchersdevelopedmodelsthat attemptedtoshowhowobservedconcentrationsofozoneandothersmogingredientsarereached asafunctionofprecursorconcentrations,meteorologicalconditions,andinsolation.
Becauseozoneandtheotherphoto-oxidantsaresecondarypollutants,theregulardispersionmodels describedinSection9.2.4,pertainingtoprimarypollutantsthatdonottransformwhiledispersing, arenotapplicable.Forphoto-oxidantmodeling,inadditiontometeorologicalparameters,the reactionsoftheprimarypollutantsamongthemselves,andthosewithatmosphericspecies,plusthe interactionswithsunlightneedtobeincluded.Afurthercomplicationisthatsomeofthechemical kineticprocessesarenotlinear;thatis,theyarenotfirst-orderratereactions.
Therateofthereaction(9.13)dependsonthekindofVOC.Moleculeswithadoubleortriple bondareveryreactive,followedbyaromatics,thenbybranched-andextended-chainaliphatics. Thesimplemoleculemethane,CH4,reactsveryslowlywithOH;thereforeCH4 isnotincludedin therateequations.
ThemodelthathasbeenusedmostfrequentlyinthepastiscalledtheEmpiricalKinetic ModelingApproach(EKMA).ItisaLagrangianmodel;thatis,thecoordinatesystemmoveswith theparcelofairinwhichchemicalchangesoccur.ThearchitectureofEKMAisasfollows.A columnofairistransportedalongawindtrajectory,startingat0800localtime(LT).Thecolumn heightreachestothebottomofthenocturnalinversionlayer.Theconcentrationofchemicalspecies inthecolumnisestimatedfromthe0800LTemissionratesofthefollowingpollutants:NO,NO2, CO,andeightclassesofVOC:olefins,parafins,toluene,xylene,formaldehyde,acetaldehyde, ethene,andnonreactives.Otherinputparametersaredate,longitude,andlatitude,whichdefine theinsolationrate.Asthecolumnmoveswiththewind,freshpollutantsareemittedintothe column.Astimeprogresses,thesolarangleincreasesandtheheightofthecolumn(mixingheight) increases,withaconsequentdilutioneffect.Insidethecolumnthephotochemicalreactionsoccurin whichozoneisgenerated.Therateconstantsforthechemicalreactionsareempiricallydetermined basedonsmog-chamberexperiments.Themodelcalculationsstopwhentheozonelevelreachesa maximumvalue,whichusuallyoccursbetween1500and1700LT.
Figure9.6presentsanisoplethplotofmaximumozoneconcentrationsversus0800LTconcentrationsofthesumofeightVOCcompoundsonthehorizontalaxis,measuredinunitsofparts permillioncarbon(ppmC),andtheNOx concentrationontheverticalaxis.Theisoplethshavethe shapeofhyperbolas.Thediagonalsdrawnthroughtheisoplethsrepresentthemorningratiosof VOC/NOx.Aratioof4:1correspondstoatypicalurbanratio;8:1,suburban;16:1,rural.Suppose themaximumozonelevelreachedis200ppbV.The“design”(i.e.,NAAQS)valueis120ppbV.To reachthedesignvalue,onecangointwodirections:reducingeitherthe0800LTVOCortheNOx concentrations,representedbythehorizontalandverticaldashedlinesinFigure9.6,respectively. Itcanbeseenthatinanurbanenvironment(4:1diagonal),the120ppbVlevelcanbereachedwith amuchsmallerreductionofVOCconcentrationsthanNOx.Inaruralenvironment(16:1diagonal),
asmallerreductionofNOx wouldbenecessary.(Athirdwaywouldbetogoalongthediagonal fromthe200ppbVisoplethtothe120ppbVisopleth.ThiswouldrequirereductionsofbothVOC andNOx,albeitinlesserquantitiesthanbyreducingonlyonekindofpollutant.)
TheshortcomingsofEKMAarethatitmodelstheozoneconcentrationsonlywithinaparticularaircolumn,andonlyforasingleday.BecauseNOx isnotappreciablydestroyedintheozone formationcycle,theNOx justkeepsmovingdownwindwiththecolumnofair.ThetransportedNOx willparticipateinozoneformationfurtherdownwindonthesameday,andevenonsubsequent days,becauseitslifetimecanbeseveraldays,dependingonatmosphericconditionsandcomposition.Thisisthereasonthatruralandremoteareasfardownwindfrommetropolitanareasalso experiencehighconcentrationsofozone,eventhoughtheemissionsofNOx inthoseareasmaybe quitesmall.
BecauseoftheshortcomingsofEKMA,regulatoryagenciesintheUnitedStatesandother countriesrelynowonmoresophisticatedmodelsthatcovermuchlargerareasthanasingleair columnandalsocoveralongertimeperiod,usuallyselectedtosimulateanelevatedpollution episode.SuchmodelsareoftheEuleriantype,inwhichthecoordinatesystemremainsfixed,and theareacoveredisdividedintogridcells.OnesuchmodeliscalledtheUrbanAirshedModel (UAM),andanotheriscalledtheRegionalOxidantModel(ROM).Thesemodelscoveranareaof severaldegreeslatitudeandlongitudewithvariablesizegridelements,downto2km2.Vertically, themodelsaredividedintoseverallayersbelowandabovethemixingheight.Themodelinputs arethewindfieldinthemodeledarea,temperature,humidity,terrainroughnessandvegetation cover(thelatteraffectdepositionrates),emissioninventory,andthebackgroundlevelofozone. ThegoverningchemicalreactionsarequitesimilartoEKMA,witheightVOCcategories.These modelscanpredictthetimeprofileofozoneoveraselectedlocation,orproduceacontourmap ofmaximumconcentrationsoverthewholemodelingdomain.Thetimedomainofthemodelisa
meteorologicalepisodelasting3–5days,usuallyterminatingwithaprecipitationevent.Figure9.7 showstheaveragecomparisonbetween15,000measuredandmodeleddatapointsusingROM. Whilethereisafairlygoodcorrelationbetweenobservationsandpredictions,thereisatendency tooverpredictatlowconcentrationsandunderpredictathighconcentrations.
Thegridmodelsbringoutclearlythatozoneisaregionalproblemthatcanonlybesolvedwith aregionalemissionreductionstrategy.BecauseoftransportoftheprecursorsNOx andVOCand oftheformedozoneitself,highconcentrationsinthetensandhundredsppbVareobservednot onlyinurbanareas,butinruralandremoteareas,atlowerandhigherelevations,andevenover thesea.Peakconcentrationsarenotonlyencounteredinmid-afternoonhoursastheEKMAmodel wouldpredict,butarealsoencounteredatpracticallyallhoursofthedayandnight.
InareaswheretheVOC/NOx ratioishigh,NOx controlprovidesmoreozonereduction;inareas withalowVOC/NOx ratio,VOCcontrolappearsmoreeffective.Inruralandremoteareaswhere theavailabilityofVOCisplentifulfrombiogenicsources,NOx availabilityisthelimitingfactorto ozoneproduction.Thisissobecauseinchemicalkineticsthereactantinshortsupplydetermines therateofthereaction.Forasubcontinentalregion,suchasthenortheasternorsoutheasternUnited States,thediurnalandseasonalaverageozoneconcentrationscanonlybesubstantiallyreducedby region-wideNOx emissionreductions.Thisisbecauseonaregionalbasis,biogenicVOCemission canpredominateoveranthropogenicVOCemissions.
WhileintheUnitedStatesandotherdevelopedcountriesgreatstrideshavebeentakento reduceNOx emissionsfrombothstationaryandmobilesources,ambientNOx concentrationsin theUnitedStatesandworldwideareeitherontheincreaseoratbestarelevel(seeFigure9.10for NOx emissiontrendsintheUnitedStates).ThisisbecausewhatisgainedinNOxcontroltechnology islostintheeverincreasingnumberofNOx emittingsources,especiallyautomobiles.IntheUnited States,forexample,thehighwayvehiclepopulationhasbeenincreasingatarateof3.4million vehiclesperyearduringtheperiod1950–1995.IntheUnitedStatesitremainstobeseenwhether inthefuturethecurrentozonestandardof120ppbV,1-haverage,willnotbeexceeded,letalone theproposednewstandard,80ppbV,8-haverage.
Aciddepositionispopularlytermedacidrain.Aciddepositionisamoreappropriatetermbecause acidicmattercanbedepositedonthegroundnotonlyasrainbutalsoinotherkindsofprecipitation— forexample,snow,hail,andfog—andindryform.Thedepositionbyprecipitationiscalled wet deposition;thedirectimpactiononlandandwaterofacidicgaseousmoleculesandacidicaerosols (particles)iscalled dry deposition.Aciddepositionisasecondarypollutant,becauseitisaresult oftransformationofprimaryemittedpollutants.
Inthelateseventeenthcentury,RobertBoylerecognizedthepresenceof“nitrousandsalinosulfurousspirits”intheairandrainaroundindustrialcitiesofEngland.In1853,RobertAngus Smith,anEnglishchemist,publishedareportonthechemistryofraininandaroundthecityof Manchester.Helatercoinedtheterm“acidrain.”Inthe1960sand1970sitwasfirstnoticedin Scandinavia,theninthenortheasternUnitedStatesandsoutheasternCanada,thatsomelakeswith averylowbufferingcapacity(i.e.,lakeswithlowalkalinity),wereslowlybeingacidifiedwitha pHreachingaslowas5.5–6.Asmostaquaticorganismscannotsurviveinthatkindofacidwater, theselakesbecamedevoidoflife.BecausetheacidityofrainprecipitationinEuropeandinNorth AmericawasmeasuredtoreachapHvalueaslowas3,andfrequentlyinthepH4–5range,itwas soonrealizedthatlakeacidificationmustbeaconsequenceofacidrain.Lakesactlikeamildly alkalinesolutioninabeaker.Whenthesolutionis“titrated”overtheyearswithaciddeposition,it becomesacidic.6
AschematicofaciddepositionispresentedinFigure9.8.Powerplant,industrial,commercial, residential,andmobilesourcesemittheprecursorsofaciddeposition,namely,sulfurandnitrogen oxides(SOx andNOx).Theprecursorsareadvectedbywindsandaredispersedbyturbulent diffusion.Duringtransportintheair,theprecursorsreactwithvariousoxidantspresentintheair andwatermoleculestoformsulfuricandnitricacid(H2SO4 andHNO3).Theacidsaredeposited onlandandwaterinthedryandwetform.Thiscausesdeleteriousenvironmentaleffectsthatwere listedpreviouslyinTable9.4.
6pHisthenegativelogarithmofthehydrogenionconcentration,[H+]molesperliter,inanaqueoussolution; thatis,pH =−log[H+].Neutralwaterhasahydrogenionconcentrationof10 7 molesperliter;thusitspHis 7.Aone-tenthmolarconcentrationofhydrochloricacidhasahydrogenionconcentrationof10 1 molesper liter;thusitspHis1.LemonjuicehasanapproximatepHof3.CarbonicacidhasapHof5.6.Thus,raindrops incontactwithatmosphericcarbondioxidehaveaslightlyacidicpHbetween5and6evenwithoutaddition ofotheracidicspecies,suchasH2SO4 andHNO3.Ontheotherhand,raindropsincontactwithatmospheric alkalineaerosols,suchasCaCO3,CaO,MgCO3,andothers,mayactuallyhaveapHgreaterthan7.
Theexacttransformationmechanismsoftheprecursorstoacidicproductsisstillbeingdebated.Evidently,therearetworoutesoftransformation:the“gas-phase”and“aqueous-phase” mechanisms.Inthegasphasemechanismthefollowingreactionsseemtooccur:
Theacidsmaydirectlydepositonlandandwaterasgaseousmolecules,oradhereontoambient aerosols,andthendepositinthedryparticulateform.Theacidmoleculesandaerosolsmaybe scavengedbyfallinghydrometeorsandthenbedepositedinthewetform.Thisiscalled“wash-out.”
Intheaqueousphasemechanismtheprecursorsarefirstincorporatedintoclouddrops,a processcalled“rain-out,”followedbyreactionswithoxidantsnormallyfoundinclouddrops, namely,hydrogenperoxide(H2O2),andozone(O3).Thedistinctionbetweenthetwomechanisms isofsomeimportance,becausethegas-phasemechanismwouldindicatethattheacidsareformed inalinearproportiontoSO2 andNO2 concentrationsintheair,whereasintheaqueousphase mechanismtheproportionmaynotbelinear.Ifanonlinearrelationshipprevailed,onewouldnot expectthat aciddepositionrates weredirectlyproportionalto acidprecursoremissionrates.Trend analysesofaciddepositionshowthatthetotalamountofdepositionintegratedoveralargeregion andoveraseasonoryearisnearlylinearlyproportionaltothetotalamountofemissionsofthe precursorsintegratedoverthesameregionandtime.Thisdoesnotnecessarilymeanthatallthe transformationoccursinthegasphase,butthattheaqueousphasetransformationisalsonearly proportionaltotheprecursorsconcentrationintheclouddrop.
Becausethesulfateion(SO2 4 )isbivalentandthenitrateion(NO3 )ismonovalent,ifonly thesetwoionswerepresentinequalmolarconcentrations,two-thirdsofthehydrogenions(H+) wouldcomefromsulfuricacidwhileone-thirdwouldcomefromnitricacid.However,precipitation alsocontainsothercationsandanions;thus,theproperionbalanceequationis
where a, b,..., i arefactorsweightingtherespectiveionconcentrations,andthesquarebrackets havebeenomitted.Someoftheionsarefromman-madesources,whereasothersarenatural(e.g., seasalt,carbonicacid,andionsfromearthcrustalmatter).InEasternNorthAmerica(ENA),an approximateempiricalionbalanceequationappearstohold7:
ForequimolarconcentrationsofSO2 4 andNO3 ,about63%ofthehydrogenionsareduetosulfate ionsand37%areduetonitrateions.
InENA,inthe1970sto1980s,typicalSO2 4 andNO3 concentrationsinprecipitationwerein therange15–25micromolesperliter,each.Using(9.20),theaveragepHofprecipitationcanbe calculatedintherange4.2–4.4.Figure9.9(a)showsmeasurementsofthe1986annualaveragepH
valuesathundredsofprecipitationmonitoringstationsintheUnitedStatesandsouthernCanada.In theeasternpartofthecontinentthelocationofthestationswassodensethatonlythepHisocontours aredrawnaroundthestations.ItisseenthatinthecenteroftheeasternUnitedStatesthepH4.2 isocontourprevailed,whereasthepH4.4isocontourencompassedalmostallnortheasternstatesand southernOntarioandQuebec.Thisisingoodagreementwiththeestimatesobtainedfrom(9.20).
InthewesternUnitedStatestheaverageionconcentrationswerelower,andusuallythenitrateto sulfateconcentrationratioswerelargerthanthoseintheeasternUnitedStates.Figure9.9(a)shows thatinthewesternUnitedStatesthemeasuredpHvalueswereintherangepH5.0–5.5.
Theaverageacidityofprecipitation(i.e.thepH)isonlyapartialindicationoftheaciddeposition problem.Abetterassessmentoftheproblemistheannualdepositionrateofhydrogenions.Lakes andothersurfacewatersareacidifiedcumulativelywhilebeingexposed(“titrated”)toyearsofacid depositionandexhaustionoftheiralkalinitycontent.Episodicdepositionratesofhydrogenions areobtainedbymultiplyingtheaveragehydrogenionconcentrationsineachprecipitationepisode bytheamountofprecipitationinthatepisode.Usually,hydrogeniondepositionsaremeasuredina bucketthatcollectsallprecipitationthatfallsoveraweek.Annualdepositionratesareobtainedby summingtheweeklydepositionratesoverayear.Figure9.9(b)showsthe1986annualhydrogen depositionratesacrosstheUnitedStatesandsouthernCanadainunitsofkilogramsperhectare (10,000m2).TheisocontoursstretchmoretowardthenortheastthanthepHisocontours.Thisismost likelyduetothehigherprecipitationratesinthenortheasternUnitedStatesthanintheMidwest.
Figure9.10showsthetrendofSO2 andNOx (reckonedasNO2)emissionratesintheUnited Statesfortheyears1970–1996.In1970,SO2 emissionratesreachedmorethan30millionshorttons peryear,butfellsteadilythereafterasaconsequenceof(a)installingSO2 controltechnologyonall newcoal-firedpowerplantsand(b)retrofittingexistingplantsasrequiredbythe1990CleanAir ActAmendments.Concomitantly,thesulfateandhydrogeniondepositionratesdecreasedslowly. Whentheaciddepositionsection(TitleIV)ofthe1990CAAAisfullyimplementedintheearly 2000s,thenationwideSO2 emissionratesareexpectedtobeaboutone-halfthoseof1970.NOx emissionsreachedapeakin1980ofabout24millionshorttonsperyear,andtheyhavehovered aroundthatmarkeversince.Assumingthatsulfateiondepositionswilldecreasebyone-halfand thatnitrogeniondepositionsremainconstant,intheearly2000shydrogeniondepositionrateswill
beaboutone-thirdless,andtheaveragepHofprecipitationwillgoupby0.175units,comparedto 1970slevels.
Beforeenactingcostlyemissioncontrolstrategies,governmentlegislatorsandadministratorswould liketoknowtheexpectedenvironmentalbenefitsofthesestrategies.Forexample,ifSO2 emissions werereducedbyone-half,willsulfateiondepositionratesdecreaseproportionallyeverywhere?This relatesto(a)thelinearityoftransformationofprimaryemission(SO2)tosecondarypollutant(SO2 4 ) and(b)thegeographicdistributionofthesecondarypollutant.Toanswerthesequestions,onehas toresorttoatmospherictransportandtransformationmodels,alsocalledsource–receptormodels.
Inthe1980sintheUnitedStates,Canada,andEurope,literallydozensofmodelsweredeveloped,rangingfromsimpleboxmodels(noatmosphericdynamics,justchemicalreactionsinan enclosedboxthesizeofasubcontinent)tocomplexEulerianmodelsstretchingoverasubcontinent,withindividualemissionratesingridsofafewkm2 alongwithsimulatedwind,diffusion, precipitation,andothermeteorologicandtopographicfactors.Theselattermodelsarecalledsupermodels;theyrequireenormouscomputationalcapacitytoexercisethem.However,thesupermodels canonlysimulateasingleprecipitationepisode;theycannotestimateseasonalorannualaverage depositionratesatwidelydispersedreceptorsfromseasonalorannualemissionratesatwidely dispersedsources.Thesemodelshaveproven,however,thatthereisanear-linearproportionof SO2 4 depositionratestoSO2 emissionrates.Probably,thesemodelsencouragedtheU.S.Congress toenactTitleIVofthe1990CAAA,inexpectationthatreducingaboutone-halfofSO2 emissions willhalveSO2 4 depositionratesandthecommensuratehydrogeniondepositionrates.
TheauthorsdevelopedasimpleEulerianmodelwith time-averaged emissionrates,wind directionandspeed,diffusionrate,transformation,anddepositionrates.8 Becauseallparameters aretime-averaged,themodelcanonlybeappliedtolongerperiods,suchasaseasonoryear.The modelquitesuccessfullymatchedthepredictedandobservedannualandseasonaldepositionrates ofsulfateinENAintheyears1980–1982.Followingisabriefdescriptionofthatmodel.
Themodelisasolutiontothegeneralatmosphericdispersionequationundersteady-state conditionswithchemicalandphysicaltransformationprocesses.Thelatterareassumedtobefirst orderprocesses.Twosolutionsareobtained:onefortheprimaryemittedpollutantSO2,theother forthesecondarypollutantSO2 4 :
where
C p = concentrationofprimarypollutant[SO2],gm 3
Cs = concentrationofsecondarypollutant[SO2 4 ],gm 3
Q = sourceemissionrateofprimarypollutant,gs 1
h = averagemixingheightofmodelingdomain,m
D = diffusioncoefficient,m2 s 1
u = averagewindspeedofmodelingdomain,ms 1
r = distancebetweensourceandreceptor,m
θ = azimuthalanglefromthesourcetothereceptor,degree
ϑ = azimuthaldirectionofprevailingwindinmodelingdomain,degree
K0 = Besselfunctionofzerothorder
τc = transformationtimeconstantfromprimarytosecondarypollutant,s
τdp = drydepositiontimeconstantofprimarypollutant,s
τds = drydepositiontimeconstantofsecondarypollutant,s
τwp = wetdepositiontimeconstantofprimarypollutant,s
τws = wetdepositiontimeconstantofsecondarypollutant,s
Equations(9.21)and(9.22)givethe concentration atthereceptoroftheprimaryandsecondary pollutants.Ifweareinterestedin wetdeposition atthereceptorofthesecondarypollutant(i.e.,the wetdepositionofsulfateions),thefollowingequationisused:
where Dws isthewetdepositionrateings 1 , R istheannualorseasonalrainfallatthereceptor, and R0 istheannualorseasonalrainfallaveragedoverthemodelingdomain.Because h appearsin thedenominatorofequation(9.22)andthenumeratorofequation(9.25),thewetdepositionrate isindependentof h.Similarly,thedrydepositionrateofsulfateisobtainedfrom
Themodelparameterswerederivedbyanoptimizationtechnique.Severalyearsofobserveddata ofannualwetdepositionofsulfateinENAwerecomparedtomodelpredictedvalues.Optimized valueswereobtainedfromminimizingtherootmeansquareerror:
TheoptimizedmodelparametersarelistedinTable9.6.Theoptimizedparametersareconsistent withindependentlyderiveddataintheliterature.Fordifferentaveragingperiods(e.g.,summeror winterseasons)orfordifferentregions,differentmodelparametersmustbederived.
DatafromFayJ.A.,D.Golomb,andS.Kumar,1985. Atmos. Environ., 19, 1773–1782.
Usingoptimizedmodelparameters,sourcereceptordistance,andazimuthalangle,wet(and dry)depositionratesatanyreceptorduetoanysourceinENAcanbeestimated.Insteadofusing individualsources,suchasasinglepowerplant,itisconvenienttoaggregatesourceswithina wholestatebyassigningan“emissioncentroid”tothatstate.Usingstate-levelemissionratesof SO2 in31stateseastoftheMississippiRiver,alongwithobservedannualwetsulfatedeposition ratesattensofstationsinENAin1980–1982,thepredictedandobservedwetsulfatedepositionin ENAispresentedinFigure9.11.Theobserveddatapointsareprintedattheapproximatelocation ofthestations.Themodeledvaluesarerepresentedbytheisocontours.Thedepositionratesarein unitsofkgSO2 4 perhectareperyear.Itisseenthatagoodmatchisobtained,withacorrelation coefficientof0.88andanerrorof17%,asdefinedinequation(9.27).Likethehydrogendeposition inFigure9.9(b),theisocontoursarestretchedtowardthenortheastbecauseoftheprevailing southwesterlywinds.
Atransfercoefficient Tij isdefinedastheratioofannualwetsulfatedepositionatthereceptor j totheannualSO2 emissionfromsource i.Itisderivedfromequations(9.21)–(9.24)byvaryingthesource–receptordistanceandtheanglesubtendedbetweenthesourcereceptorlineand theprevailingwind.TransfercoefficientsforENAareplottedinFigure9.12forthreeangles: (a)receptorlyingdirectlydownwind;(b)receptorlyingcrosswind;and(c)receptorlyingupwind. Theunitsonthe y axisareha 1.IfSO2 emissionsaregiveninkgy 1,depositionsofSO 2 4 are obtainedinunitsof1.5kgha 1 y 1.(Thefactor1.5arisesbecausetheratioofmolecularweight SO2 4 /SO2 is1.5.)Theamountofwetsulfatedepositionatreceptor j fromallsources i isobtained from
where Qi istheannualSO2 emissionatsource i
Thefractionalcontributionofsource i tothewetdepositionatreceptor j canbedetermined from
wherethesummationisoverallcontributingsources.ThisisillustratedinFigure9.13,which showsthecontribution(%)of31easternU.S.statesandseveralsubprovincesofCanadatothewet sulfatedepositionintheAdirondackregionofNewYork.Thepercentcontributionisdependenton (a)theemissionrateofSO2 inaparticularstateand(b)thetransfercoefficientsbetweenthestates andtheAdirondacks.ThehighSO2 emittingstatesofPennsylvania,Ohio,WestVirginia,Indiana, andNewYorkarethelargestcontributorstoAdirondacksulfatedeposition.Bycoincidence,these statesalsolieupwindoftheAdirondacks.AsignificantportionoflakesintheAdirondackshave beenacidified,probablyduetoaciddeposition.
Thus,aciddepositionmodels,astheonedescribedabove,couldbeusedfor“targeted”emission reductionstrategies,whereinthosesourcesthatcontributemosttoaciddepositiontoasensitivearea wouldcurtailtheiremissionstoagreaterextentthanthosesourcesthatcontributelittleornothing. However,byvirtueofTitleIVofCAAA1990,theU.S.CongressdecidedthatSO2 emissions willbecutbyaboutone-halfof1980emissions,regardlessofthelocationofasource vis ` avis a sensitivearea.Fromapoliticalstandpoint,auniformemissionreductionstrategyismoreexpedient thanatargetedstrategy,whichwouldpitsomestatesandregionsagainstothers.
Smallparticles(alsocalledfineparticles)lessthan1–2 µmindiametersettleveryslowlyon thegroundandcantravelhundredstothousandsofkilometersfromtheiremittingsources. Apartofthefineparticlesareemitteddirectlyfromindustrial,commercial–residential,and transportationsources.Thesearecalledprimaryparticles.However,themajorityoffineparticlesisaproductofgas-to-particletransformationprocesses,includingphotochemicalprocesses, wheretheprecursorgasesareemittedfromtheaforementionedsources.Thesearecalledsecondaryparticles.Theparticlescanenvelopevastareas,suchasthenortheasternUnitedStatesand southeasternCanada,Californiaandadjoiningstates,westernand/orcentralEurope,andsoutheasternAsia.Satellitephotosoftenshowcontinentalareascoveredwithablanketofparticles, sometimesstretchingouthundredsofkilometersovertheocean.Thisphenomenoniscalled regionalhaze.Thehazeismostlyassociatedwithstagnatinganticyclones,whenahighbarometric pressurecellremainsstationaryoveraregion,sometimesoveraperiodofaweekormore. Thehigh-pressurecellcausesairtocirculateinaclockwisefashionaroundthecell,drawing inincreasinglylargeamountsofemissionsfromthesurroundingsources,formingtheregional haze.Usually,theregionalhazeperiodisterminatedbyacoldfrontmovingthroughtheregionwithaccompanyingconvectiveclouds,thunderstorms,andprecipitationthatwashesoutthe particles.
Thecompositionofthefineparticlesvariesfromregiontoregion,dependingontheprecursor emissions.InthenortheasternUnitedStates,centralEurope,andsoutheasternAsia,morethanhalf ofthecompositionismadeupofsulfuricacidanditsammoniumandsodiumsalts,largelydueto highsulfurcoalandoilcombustion.Therestismadeupofnitricacidanditssalts,carbonaceous material(elementalandorganiccarbon),andcrustalmatter(finedustofsoil,clay,androcks).In thewesternandsouthwesternUnitedStatesandinsomeotherurbanized/industrialareasofthe world,nitrateandcarbonaceousmattermakesupthemajorityofthecompositionoffineparticles. Thisisduetoheavyautomobiletraffic,chemicalindustries,refineries,gas-firedpowerplants,and otherurban/industrialsources.Apartofthehazemaybeduetobiogenicsources,suchasthe emissionsofisoprene,terpene,pinene,andotherisoprenederivativesfromconiferousforests,but thepredominantcauseofregionalhazeistheemissionofgaseousandparticulatematterfrom anthropogenicsources,mostlyfromfossilfuelcombustion.Condensedwaterisalsoaningredient offineparticles,astheprecursorgasesandtheformedparticlenucleiattractwatermoleculesfrom theair,especiallyduringhighhumidityperiods.
Thesmallparticlesareefficientscatterersoflight.Thescatteringefficiencyisdependent uponthewavelength.Maximumscatteringefficiencyforvisiblelight(400–750nm)occurswith particleslessthan1 µmindiameter,theso-calledsubmicronparticles.Lightscatteringprevents distantobjectsfrombeingseen.Thisiscalled visibilityimpairment.Duringregionalhazeperiods, onecannotdistinguishdistantmountainsonthehorizon,andoccasionallyonecannotseeobjects fartherthanhundredsofmeters,suchastheotherwallofarivervalleyorbuildingsafewcity blocksaway.9 Also,theincreasingconcentrationofparticlesinurbanizedpartsofthecontinents causesthelossofvisibilityofthestarlitnocturnalsky.Thesedays,smallstars,lessthanfifthorder ofmagnitude,rarelycanbeseenfrompopulatedareasoftheworld.
Thescatteringoflightcausesalossofcontrast.ThisisdepictedinFigure9.14.Apartofthe incomingsunlightisreflectedfromtheobjectandreachestheretinaoftheeye(ray1).Apartofthe reflectedlightisscatteredoutbyparticlesintheairanddoesnotreachtheretina(ray2).Apartof theincomingsunlightisscatteredbyparticlesbetweentheobjectandtheeye,reachingtheretina, butthisraycausesalossofcontrast(ray3).Finally,apartoftheincomingsunlightisscatteredby particlesbehindtheobject,reachingtheretina,butwithalossofcontrast(ray4).Theconsequence ofrays2to4isalossofcontrastoftheobjectagainstthebackground.Empirically,ithasbeen shownthatanobjectisnolongervisiblewhenthecontrastagainstthebackgroundislessthan2%. Thisiscalledthethresholdcontrastandcanbeexpressedas
where Cx isthecontrastatdistance x meters, Ibkg istheintensityoflightraysfromthebackground, and Iobj istheintensityoflightraysfromtheobject.Alternatively,thecontrastrelationshipcanbe written
where C0 isthecontrastatzerodistance,and bext istheextinctioncoefficientinm 1.Threshold contrastiswhen Cx /C0 = 0 02,thus
Equation(9.32)iscalledtheKoschmiederrelationship.Itgivestheextinctioncoefficient bext when anobjectlosesitscontrastagainstthebackgroundatadistance x meters.Inclearair bext = E( 5)
to5E( 5)m 1,andobjectscanbediscernedasfaras80to400km(ofcourse,thelatterdistance isonlyvisiblefromaheightortoaheight,soastoreachovertheearth’scurvature).Inpolluted air, bext canbeaslargeasE( 3) m 1,whenobjectsdisappearatafewkilometersdistance.
Visibilityimpairmentisasignificantandunpleasantsideeffectoffossilfueluse.Visibility improvementcanbeaccomplishedbyreducingfine-particleandgaseousprecursoremissionsfrom fossilfuelcombustionandotherfossilfuelusage.Inpracticethismeansimprovedemissioncontrol devicesforprimaryparticles,SO2,NOx,andVOC(seeChapters5and8).IntheUnitedStates, visibilityimprovementisaddressedinSection169AoftheCleanAirActAmendmentof1977, whichrequiresthatvisibilityimpairmentatU.S.nationalparksmustbelessenedbyreducing particlesandtheirprecursoremissionsfromnearbysources.Asaconsequenceofbetterandwider useofemissioncontroldevicesonstationaryandmobilesources,visibilityhasimprovedsteadily inthepastdecades,andregionalhazeoccurrencesintheUnitedStatesarenowlessfrequentthan theywereinthe1960sand1970s.
Theconsumptionoffossilfuelentailsasignificantimpactonwaterqualityandwaterusage.The contaminationofwaterstartsattheminingandextractionstage,throughtransportandrefining,all thewaytoleachingintothegroundwaterofashandscrubbersludgeleftbehindaftercombustionof fossilfuels.Weshalllimitthissectiontotheeffectsofacidminedrainage,coalwashing,leaching fromcoalandashpiles,andwaterpollutionduetoatmosphericdepositionoftoxicbyproductsof fossilfuelcombustion.
Themajorenvironmentaldisastersduetocollisionsorgroundingofsupertankerscarrying crudeoilhavebeendocumentedinscientificjournalsandthepressandwillnotbetreatedherein detail.Sufficeittosaythatin1978,the AmocoCadiz ranagroundoffthecoastofFrance,spilling 223,000metrictonsofcrudeoil.In1979,inthecollisionofthe AtlanticEmpress withthe Aegean Captain, 50milesnorthwestofTobago,morethan287,000twerespilled.In1983,the Castillode Bellver spilled252,000toffthecoastofSouthAfrica.In1989,the ExxonValdez spilled37,000tof crudeintheenvironmentallysensitivePrinceWilliamSoundinAlaska.In1991,the ABTSummer spilled260,000toffthecoastofAngola.Itisestimatedthatbetween3to4millionmetrictons ofoilisspilledannuallyintotheworldrivers,lakes,seasandoceans.Oilspillsseemtobeahigh environmentalriskassociatedwithfossiloilusage.
Intermsofsheerquantity,themostseriouswaterpollutionproblemassociatedwithcoaluseisacid drainagefrommines,especiallysurfacemines,coalpiles,andcoalwashing.Precipitationfallingon opencoalseamsandoncoalpileswillleachoutmineralmatter.Theleachatecontainsacids,toxic elements,andoftenradioactiveisotopes.LeachateswithapHaslowas2.7havebeenmeasured. Theacidisaproductofoxidationandhydrolysisofthepyriticsulfurincoal.Thefollowingtoxic elementsarefoundincoalmineandpiledrainageinconcentrationsthatexceeddrinkingwater standards:arsenic,barium,beryllium,boron,chromium,fluorine,lead,mercury,nickel,selenium, vanadium,andzinc.U.S.federalandstateregulationsnowrequirethattheleachatebeeither
treatedordisposedofinasecureimpoundment.Coalcontainstheradioactiveisotopes 14Cand 40K,becausetheseelementswereinherentintheoriginalbiologictissueoftheantecedentsofcoal. Theseradionuclidesdonotposeanenvironmentalhazard.However,frequentlyuranium,thorium, andtheirradioactivedaughterelementsarealsofoundinthemineralmatteradheringtothecoal. Thus,leachatefromcoalmines,piles,andslagneedstobemonitoredforitsradioactivitybefore enteringintotheenvironmentandforpreventingmineworkerexposure.
About50%ofallminedcoalintheUnitedStatesisnow“washed”attheminemouthprior toshipmenttotheuser(seeSection5.2.9.3).Coalwashingincreasestheheatingvalueperunit massofcoalbyremovingtheincombustiblemineralmatter.Moreimportantly,coalwashing removespyriticsulfur,whichcanamountupto50%ofthesulfurcontentoftherawcoal.The mostwidelyusedtechniqueforcoalwashingismassseparation.Mineralmatterhasahigher specificgravitythancoal.Byflushingcrushedcoalinastreamofwater,themineralmattersettles out,whilethelightercoalparticlesfloatinthestream.Thesettledmineralmattercontainsahigh concentrationofacidic,toxic,andpossiblyradioactivecompoundsandelements.Thisslagmust beanalyzedforitscontent.Ifthecontentistoxic,theslagmustbetreatedorsafelydisposedof inahazardouswasteimpoundment.IntheUnitedStates,dischargesfromminingactivitiesare regulatedundertheCleanWaterAct,specifically,theNationalPollutionDischargeElimination System(NPDES).
Althoughmuchofthemineralmatterofcoalisremovedattheminemouth,coaldeliveredtoa powerplantorotherfacilitiesstillcontainsadheringmineralmatter,simplycalledash.Theash contentcanamounttoanywherebetween1%and15%ofthecoalweight.Evenoilcontainsash, amountingto0.01–0.5%byweight.Aftercombustionofthecoalparticleoroildroplet,themineral matterremainsuncombusted,andeitherfallstothebottomoftheboilerorisblownoutwiththe fluegasas flyash.Inmodernpulverized-coal-firedboilers,about90%ofthemineralmatterforms flyash,and10%bottomash.Mostoftheflyashiscollectedinelectrostaticprecipitators(ESP,see Section5.2.9.2),excepttheverysmallparticles(lessthan1 µmindiameter),whichescapeintothe airbecausetheyarenotremovedefficientlybytheprecipitator.Theflyashcontainsapproximately thesameacidic,toxic,andradioactivematterastheoriginalmineralmatterincoal.Theflyashis requiredtobechemicallyanalyzedand,iffoundhazardoustohumanhealthandtheenvironment, properlydisposedof.Nonhazardousbottomandflyashisoftenusedasaggregatematerialin concreteorasphalt.
AsaconsequenceofaciddepositionregulationsintheUnitedStatesandmanyothercountries,coal-burningpowerplantsandindustrialboilersarerequiredtobeequippedwith fluegas desulfurization devices(seeSection5.2.9.3).Forhigh-sulfur-contentcoal(≥0.6%byweight),a wetlimestonescrubberisnecessary.AfterpassingtheESP,thefluegasentersascrubbertower.A slurryoflimestoneisinjectedfromsprinklersatthetopofthescrubber.FluegascontainingSO2 andothersulfurcompoundsflowscountercurrenttothelimestonespray.Asludgeiscollectedin thebottomofthescrubber,consistingofwetcalciumsulfate(gypsum)andcalciumsulfitealong withunreactedlimestone.Thesludgeisdewateredasmuchaspossible(unfortunately,gypsumis verydifficulttodewater),thendisposedof.Becausethesludgealsomaycontaintoxicelements— notablyarsenic,cadmium,mercuryandselenium—itsdisposalmayrequireaspeciallydesigned secureimpoundment.
Itisaconsequenceofthesecondlawofthermodynamicsthatheatengines,suchaspowerplants, mustrejectsomeofthefuelenergyintheformofheattransfertoacoldreservoir.Roughly aboutone-thirdoftheinherentheatingvalueofthefuelisrejectedviathesteamcondensertothe coldreservoir.Anotherthirdisrejectedtotheatmosphereviathestackgas,andonlyone-thirdis transformedintousefulwork.Thecoldreservoirisusuallyawaterbody.Somepowerplantsand industrialboilersarelocatednearsurfacewaters,suchasariver,lake,orocean,whichcanbeused forabsorbingtheheatfromthecondenser.Otherfacilitiesneedtouseacoolingtoweroracooling pond.TheEPArequiresthatallnewpowerplantsusecoolingtowersforheatrejection,rather thanonce-throughcoolingwaterfromadjacentsurfacewaters.Incoolingtowers,coldmunicipal orwellwaterpercolatesaroundthehotcondensertubes,takinguptherejectedheat.Thewater ischilledinadraftofcoldairandthenisrecycled.Alternatively,spentsteamfromthesteam turbineisdirectlycondensedincoldairthatisdrawnthroughthecoolingtowerbyhugefans.In bothcasesapartofthecoolingwaterisevaporatedbytakinguptheheatfromthecondensing steam.Evaporatedwaterrisesfromthecoolingtowerintothecoldambientairandcondenses, thusformingthevisible“steam”plumethatemanatesfromthetower.A1000-MWelectricpower plantworkingatathermodynamicefficiencyof33%andambienttemperatureof15 ◦
Closesabout 1.7E(7)m3/y(about4.4billiongallons/y)ofcoolingwaterduetoevaporation.IntheUnitedStates, coolingtowersaloneconsumebetween2%and3%oftotalwithdrawalsfromsurfacewaters.Some criticsquestionthewisdomofusingpreciouswaterresourcesforevaporativecoolingpurposes, ratherthansurfacewaters(whereavailable),eventhoughthelatterentails(a)someriskofthermal pollutionandsurfacewatercontaminationbyleachingoftheheatexchangercomponentsand (b)someincreasedevaporationofthesurfacewaterstotheatmosphere.Itisseenherethatthereis nosimpleorunequivocalsolutiontoenvironmentalandnaturalresourceproblemsengenderedby fossilfuelusage.
InSection9.2.6wedealtwithoneformofwaterpollutionduetocombustionoffossilfuels,thatof aciddeposition.Butinadditiontosulfurandnitrogenoxides,thereareothercombustionproducts thatescapefromsmokestacksandeventuallyaredepositedonlandandwater,whichmaycause deleterioushealthandenvironmentaleffects.Twocasesinpointaretheatmosphericdepositionof toxicmetalsandpolycyclicaromatichydrocarbons(PAH).
Wenotedpreviouslythatflyashparticlesmaycontaintoxicmetals,suchasarsenic,cadmium, mercury,lead,selenium,vanadium,andzinc.Thesemetalsarefoundinsmallparticles,lessthan
1 µmindiameter.ThesmallparticlesarenotefficientlycollectedbytheESPandthusescapeinto theatmosphere.Becauseoftheirsmallsize,theseparticlesarelittleaffectedbygravityandcanbe transportedoverlargedistances,hundredstothousandsofkilometers.Eventually,theyaredeposited indryorwetformonlandandwater.Fromtheland,toxicmetalsmayleachintogroundwater,or runoffintostreams,lakes,orocean.Thus,theymayenterthefoodchain,eitherdirectlybydrinking waterorviaaquaticorganismsthatdrinkorfeedinthewater.Forexample,fishfromtheGreat
LakesandotherlakesinthenortheasternUnitedStatesandsoutheasternCanadaoftencontaina concentrationofmercurywhichisdeemedunhealthy,especiallyforpregnantwomen.Children borntomotherswhoconsumedmercury-lacedfishmayshowbirthdefectsormentalretardation. Inadditiontocoal-burningpowerplants,municipalincineratorsaresourcesofmercury,because batteries,switches,andfluorescentbulbsthataretossedintothegarbagemaycontainmercury, which,whenincinerated,escapesintotheatmosphere.Leadmayalsocausementalretardationand otherbrainandcentralnervoussystemeffects.Partoftheleadenterssurfaceandgroundwatervia atmosphericdeposition.Theleadusedtooriginatefromleadedgasoline.Withthephasingoutof leadedgasoline,leaddepositionandlead-relateddiseasesareonthedecline.
PAHareorganiccompoundsconsistingoftwoormorefusedbenzenerings.Naphthalenehastwo rings,anthracenethree,pyreneandchrysenefour(indifferentarrangement),benzopyrenes(there areseveral)five,perylenesix,andcoroneneseven.SomeofthePAHareknownorsuspected carcinogens,notablybenzo(a)pyrene.PAHareaproductofincompletecombustion.Wheneverwe seeasootysmoke,wecanbesurethatitcontainsPAH,becausePAHadheretosootparticles.PAH inthevapororparticulatephasearecarriedbywindsandsubsequentlydepositedonlandandwater inthedryform,whilethosescavengedbyprecipitationaredepositedinthewetform.Because PAHareunstable(theydecomposeinsunlight,orbyoxidationwithatmosphericoxidants),theydo nottravelasfarasmetals,andtheyaredepositedclosertothecombustionsources.BecausePAH areveryhydrophobic,theydonotreadilyincorporateintoraindroplets;thereforedrydeposition predominatesoverwetdeposition,especiallynearpollutedcities.Rivers,lakes,andcoastalwaters surroundedbyurban-industrialareasareespeciallyaffectedbyPAHdepositionfromthemyriad ofcombustionsourcesinthoseareas.SootparticleswithadsorbedPAHsettleinthesediments ofthesewaters.BottomfeedingfishandshellfishthatliveinthesedimentsmayingestPAH andareoftenfoundwithcancerouslesionsandotherdiseases.BecausePAHdissolveinfatty tissues,theseorganismsmaybioaccumulatePAHandtransferthemtothefoodchain,including humans.
TheironyisthatPAHarenotemittedasmuchfrombigcentralizedcombustionsourcesas fromsmall,dispersedsources.Largepowerplants,industrialboilers,andmunicipalincineratorsare easilycontrolledforpreventingemissionsofproductsofincompletecombustion,ofwhichPAHare apart.Basically,thecontrolinvolves“goodengineeringpractice,”whichiscombustioninexcess air,thoroughmixingoffuelandair,highflametemperature,andsufficientresidencetimeinthe combustionchamber.Underthoseconditions,practicallyallthecarbonaceousmatterburnsupinto CO2 andH2O,andnoorganicmoleculesorradicalsareleftwhichmayrecombinetoformsootand PAH.MostofthesootandPAHemissionscomefromresidentialandcommercialfurnaces,wood stovesandfireplaces,openfires,barbecues,aircraftjetengines,gasturbines,and,mostcopiously, internalcombustionengines,suchasdieselandgasoline-fueledtrucksandautomobiles.Weare allfamiliarwiththecloudofsootemanatingfromadieseltruckunderacceleratingdrive,when thefuel-to-airratiobecomesveryrich,ortheblacktrailleftbehindajetaircraftduringtake-off. IfwewanttominimizePAHemissions,wemustfindbetterwaysofcontrollingthesedispersed stationaryandmobilesources.CigarettesmokealsocontainsPAH;thelatterareprobablythecause oflungandthroatcancerofsmokers.
Inregardtofossilfueluse,theheaviesttollonlandimpactisduetocoalmining—inparticular, surfacemining,alsocalledstripmining.IntheUnitedStates,morethan60%ofabout750million metrictonsofcoalminedannuallyissurfacemined.Becausethecoalseamisrarelyonthesurface itself,thisrequiresremovingthe“overburden.”Thelattercanamounttoupto100mofsoil,sand, silt,clay,andshale.Somecoalseamsappearinhillsidesandriverbanks.Herethecoalisremoved byaugermining,whichusesahugedrilltodigthecoaloutoftheseams.
Surfaceminingleavesbehindenormousscarsonthelandscape,nottomentionthedisruptionof theecosystemthatexistedbeforeminingstarted,orthelossofotherpossibleusesoflandinstead ofmining.Forthatreason,theU.S.Congressin1977passedtheSurfaceMiningControland ReclamationAct.Thelawdelegatestothestatestheauthoritytodeviseapermittingplanthatmust includeanenvironmentalassessmentoftheminingoperations,andproceduresforreclamation ofthelandaftercessationofoperations.Thepermittingplanmustdescribe(a)thecondition, productivity,uses,andpotentialusesofminelandspriortominingand(b)proposedpost-mining reconditioningoftheminedlands,includingrevegetation.Stringentoperationalstandardsapplyto miningincriticalareas,includingthosewithslopesgreaterthan20degreesandalluvialvalleys. Thelandmustberestoredtoaconditioncapableofsupportinganyprioruseandpossibleusesto whichthelandmighthavebeenputifithadnotbeenminedatall.Needlesstosaythatthislaw,and therequirementsforsafeandecologicallysoundsurfaceminingpractices,imposedagreateffort andeconomicburdenonsurfaceminingcompaniesandindirectlyraisedthepriceofsurface-mined coal.
Deepshaftminingalsoplacesaburdenontheland.Wementionedearlierthattheminedcoal isbroughttothesurface,whereitiscrushedandwashed.Theremovedmineralmatteraccumulates inenormousslagpilesthatmaranddespoilthelandscape.Nowadays,strictregulationspertainin theUnitedStatesandothercountriesastothedisposalofthecoalmineslagandrestorationofthe landscape.
Finally,weshouldmentionthatthevastnumberofderricksassociatedwithoilandgasexplorationandexploitationisneitheranaestheticallypleasingsightnorhelpfultotheecologythat existedonthelandpriortooilandgasmining.
Theconsumptionofvastquantitiesoffossilfuelbymankindcausesmanydeleteriousenvironmentalandhealtheffects.Theseeffectsstartfromtheminingphaseofthefossilfuels,through transportation,refining,combustion,andwastedisposal.Whencoalisminedindeepshaftsorin stripmines,mineralmatterisseparatedattheminesbymillingandwashing.Theresidualslagmay containtoxic,acidic,andsometimesradioactivematerial,whichneedstobeproperlydisposedof withoutendangeringtheenvironmentandhumans.Oilandgaswellderricks,on-andoff-shore, areaestheticeyesoresandarethecauseofoilspillage.Oilandgaspipesmayruptureandleaktheir contents.Oiltankersandbargesspillontheaverage4milliontonsperyearofcrudeandrefined petroleumonourwaterwaysandoceans.Oilrefineriesaresourcesof(a)toxicemissionsthrough vents,leaks,andflaringand(b)toxicliquideffluentsandsolidwaste.
Byfar,thegreatestenvironmentalandhealthimpactisduetofossilfuelcombustioninfurnaces,stoves,kilns,boilers,gasturbines,andtheinternalcombustionengine,whichpowersour automobiles,trucks,tractors,locomotives,ships,andothermobileandstationarymachinery.The combustionprocessemitspollutantsthroughsmokestacks,chimneys,vents,andexhaustpipes, suchasparticulatematter,oxidesofsulfurandnitrogen,carbonmonoxide,productsofincomplete combustion,andvolatiletoxicmetals.Someofthesepollutantsaretoxictohumans,animals,and vegetationperse,whereasotherstransformintheatmospheretotoxicpollutants,suchasozone, organicnitrates,andacids.Thepollutantsareadvectedbywindsanddispersedbyatmospheric turbulenceoverhundredstothousandsofkilometers,affectingsensitivepopulationandbiotafar removedfromtheemissionsources.Particles,besidescontainingtoxicandpotentiallycarcinogenicagents,oftenenvelopewholesubcontinentalareasinahazethatreducesvisibilityandthe enjoymentofthelandscapeandastarrysky.
Greatstrideshavebeentaken,especiallyinthemoreaffluentcountries,forlimitingtheemissionsofairpollutantsfromthecombustionsources.Forexample,mostparticlescanbefiltered outofthefluegasbyelectrostaticprecipitatorsorfabricfilters.Sulfuroxideemissionscanbe reducedbywetordrylimestonescrubbers.Nitricoxideemissionscanbereducedbycatalytic andnoncatalyticinjectionsofchemicalsintothefluegas.Thecatalyticconverter,whichisnow appliedtogasolinefueledautomobilesinmanycountries,reducedtheemissionsofautomobiles significantlycomparedtotheuncontrolledpredecessors.Dieselengines,withpropertuning,are alsoemittinglesspollutants,althoughamagicboxlikethecatalyticconverterhasyettobefound fordieselengines.Alas,littleornoemissioncontroldevicesareappliedtothemyriadofdispersed sources,suchasresidentialfurnaces,stovesandfireplaces,andsmallerindustrialfacilities.
Thelessaffluentcountries,becauseofmorepressingeconomicneeds,donotyetavailthemselvesofemissioncontroldevices.Consequently,airqualityinthosecountriesismuchworsethan inthemoreaffluentones.Becauseairpollutantsdonotstopatnationalboundaries,surrounding countriesmayfeeltheeffectofemissionsfromneighboringstates.Itisincumbentonthemore affluentsocietiestohelpthepooreronesincontrollingairpollutantemissions,becausethehealth ofthewholehumanpopulationandecologyoftheplanetisatstake.
Finally,thischapterhasnotaddressedthegreatloomingriskofglobalwarmingduetoanthropogenicgreenhousegasemissionsfromfossilfuelusage.Thiswillbethesubjectofthenext chapter.
Problem9.1
CalculatetheemissionrateofSO2 (lb/s)fromalargecoal-firedpowerplantthatuses2million shorttons(1shortton = 2000lb)peryearhavingacoalsulfurcontentof2%byweight.
Problem9.2
CalculatetheemissionrateofSO2 perfuelheatinput(g/GJ)ofalargecoal-firedpowerplantthat usescoalhavingaheatingvalueof30MJ/kgandasulfurcontentof2%byweight.
Problem9.3
Avehicletravelingalongahighwayat90km/hemits80gCOand10gNOperliteroffuelburned. Thevehicletravels8kmperliteroffuelburned.CalculatetheemissionrateofCOandNOinunits ofg/kmandg/mi.ComparethelatterwiththeU.S.federalvehicleemissionstandardsformodel year1994.
Problem9.4
TableP9.4showsozoneconcentrationsmeasuredeveryhouronthehouronahighpollutiondayin LosAngeles.Plotthediurnalozoneprofile.Determinethearithmeticaverageandgeometricmean ozoneconcentrationsforthatday.Determinethemaximum8-harithmeticaverageconcentration andcompareitwiththeproposedU.S.ambientO3 standardof80ppbV.
t(h)123456789101112
O3 (ppbV)12 84461023426388112183
t(h)131415161718192021222324
O3 (ppbV)21225430231231531220416288342318
Problem9.5
Acoal-firedpowerplanthasasmokestack30mhighand3min diameter.Thefluegasexitvelocity is5m/s,theexittemperatureis300 ◦C,theambienttemperatureis30 ◦C,thewindspeedis3m/s, andtheatmosphericstabilitycategoryisB.Calculatetheeffectiveheightabovegroundlevel(m) oftheplumecenterlineusingtheBriggsplumeriseequation.
Problem9.6
UsingthecalculatedemissionrateoftheplantwithcharacteristicsgiveninProblem9.1,the GaussianPlumeEquation,stabilitycategoryB,andtheeffectiveplumeheightcalculatedinProblem 9.5,calculatetheSO2 concentration(µgm 3)atadownwinddistanceof1km,100mperpendicular tothewinddirectionatthetopofa100mhighhill.
Problem9.7
Forthesamepowerplant,usingFigure9.3,estimatethehighestconcentrationofSO2 (µgm 3) onlevelgroundforstabilitycategoryB.Estimatethedownwinddistance(m)atwhichthehighest concentration(xmax )wouldoccur.
Problem9.8
Ahighwaywith8laneshastrafficofonevehicleper30mperlane.Eachvehicleemitsonthe average10g/sCOatanaverageheightof2m.Thewindspeedis6m/s,winddirectionatanangle
of45 ◦ towardthehighway,stabilitycategoryC.CalculatetheCOconcentration(µgm 3)ata receptor100mdownwindfromthehighway.
Problem9.9
UsingtheEKMAplotofFigure9.6,assumingthepeakafternoonconcentrationofO3 is200ppbV, estimatethepercentageofthenecessaryreductionsofinitialconcentrationsofVOCandNOx to achieveanafternoonpeakconcentrationofO3 of120ppbVforanurban(VOC:NOx = 4:1),suburban(VOC:NOx = 8:1),andrural(VOC:NOx = 16:1)environment.Estimatetheconcentration reductionsintwoways:VOConlyandNOx only.ExplainwhyinoneenvironmentitismoreeffectivetoreduceVOCconcentrations,whereasinanotherenvironmentitismoreeffectivetoreduce NOx concentrations.Isitpossibletoachieveinacertainenvironmentthe120ppbVconcentration byactuallyincreasingmorningNOx concentrations?Inwhichenvironmentisthatpossible,and whatwouldthatdotodownwindlocations?
Problem9.10
Measurementsshowthatinanenvironmentallysensitiveareatheaveragesulfateionconcentrationinprecipitationis25 µmol/Landthenitrateionconcentrationis15 µmol/L.Usingthe approximationequation(9.20),calculatethepHofprecipitation.
Problem9.11
ThestateofOhioemitsabout2.5milliontonsperyearofSO2.TheemissioncentroidofOhioisabout 1000kmfromthecenterofMassachusetts.OhioisexactlyupwindfromMassachusetts.(a)Using thetransfercoefficientsplottedinFigure9.12,estimatetheannualrateofwetdepositionofsulfate ions(kgha 1 y 1)inMassachusettsarisingfromOhioSO2 emissionsources.(b)Massachusetts receivesontheaverage25kgha 1 y 1 wetsulfatedeposition.Whatpercentageofthatdoes Ohiocontribute?Notethatthemolecularweightofsulfateis1.5timesthemolecularweight ofSO2
Problem9.12
TheannualaverageairbornesulfateparticleconcentrationinMassachusettsis7 µgm 3,thedry depositiontimeconstantofsulfateis τds = 2E(5)s,andtheaveragemixingheightis1000m.What isthedrydepositionrate(kgha 1 y 1)ofsulfateparticlesinMassachusetts.Comparethiswith thewetdepositionrateofsulfate.
Problem9.13
(a)Estimatethemaximumvisibilitydistance(km)forapollutedatmospherewith bext = 6E( 4)m 1 andforacleanatmospherewith bext = 6E( 5)m 1.(b)Ifthemaximumvisibilityis6km,what istheextinctioncoefficient(m 1)?
Heinsohn,R.J.,andR.L.Kabel,1999. SourcesandControlofAirPollution.NewYork:Prentice-Hall.
Kraushaar,J.J.,andR.A.Ristinen,1993. EnergyandProblemsofaTechnicalSociety, 2ndedition.New York:JohnWiley&Sons.
NationalAcidPrecipitationAssessmentProgram,1990. AcidicDeposition,StateofScienceandTechnology, infourvolumes.WashingtonD.C.:U.S.GovernmentPrintingOffice.
NationalResearchCouncil,1991. RethinkingtheOzoneProbleminUrbanandRegionalAirPollution Washington,D.C.:NationalAcademyPress.
Seinfeld,J.,andS.N.Pandis,1998. AtmosphericChemistryandPhysics, NewYork:WileyInterscience. Turner,D.B.,1994. WorkbookofAtmosphericDispersionEstimates, 2ndedition.Chelsea,Michigan:Lewis Publishers.
Wark,K.,C.F.Warner,andW.T.Davis,1998. AirPollution,ItsOriginandControl. Reading:Addison-Wesley.
Ofallenvironmentaleffectsoffossilfuelusage,globalwarming,includingitsconcomitantclimatechange,isthemostperplexing,potentiallymostthreatening,andarguablymostintractable. Itiscausedbytheever-increasingaccumulationintheatmosphereofCO2 andothergases,such asCH4,N2O,chlorofluorocarbons(CFCs),andaerosols,largelyduetoemissionsofthesegases fromanthropogenicactivities,andreacheslevelsthatexceedthosethatexistedforcenturiesbefore thebeginningoftheindustrialrevolution.Called greenhousegases, thesesubstancesaugmentthe greenhouseeffect oftheearth’satmosphere,whichprovidesawarmerclimateattheearth’ssurfacethanwouldexistinanatmosphere-freeearth.
Globalwarmingisanenhancementofthegreenhouseeffectoftheearth’satmosphere,resulting inanincreaseoftheannualaveragesurfacetemperatureoftheearthontheorderof0.5–1 ◦Csince themiddleofthenineteenthcentury.Whileyetsmall,thistemperaturerisemightreach2–3 ◦C bytheendofthetwenty-firstcentury,anamountbelievedalmostcertaintocauseglobalclimate changesaffectingallbiologicallifeontheplanetwithuncertainconsequences.
Mostoftheemissionsofgreenhousegasesandaerosolsareaconsequenceoffossilfuelusage tosatisfyourgrowingenergyneeds.Theburningof1kgofcoalliberatesabout3.4kgofCO2;that ofoil,3.1kg;andthatofnaturalgas,2.75kg.In1996,theglobalanthropogenicemissionsofCO2 amountedtoover25gigatonsperyear(Gty 1).Methaneemissionsareinpartduetofossilenergy usage,asCH4 leaksfromgaspipes,storagetanks,tankers,andcoalmineshafts.In1996,theglobal anthropogenicemissionsofCH4 amountedto0.4Gty 1.Nitrousoxide(N2O)isaminorproduct ofcombustionoffossilfuels.CFCsarenotdirectlyassociatedwithfossilfuelusage;however, theyareemittedinadvertentlyfromenergy-usingdevices,suchasrefrigerators,airconditioners, chillers,andheatpumps.
Thepreventionofglobalwarmingwillrequireaverysignificantshiftfromourpresentenergyusepatterntowardoneoflesserrelianceonfossilfuels.Inevitably,suchashiftwillcausea highercostforenergycommodities,employmentdisruptions(notnecessarilyjoblosses,butdifferentemploymentpatterns),developmentofalternativetechnologies,efficiencyimprovements,and conservationmeasures.Becauseoftheexpectedsocioeconomicdisruptions,thereisconsiderable oppositiontoimplementingpreventativepolicies.Oppositioncomesfromaffectedinterestgroups, includingcoal,oil,andgassuppliers;automobilemanufacturers;steel,cement,andotherheavy industries;theirfinanciersandshareholders;andtheirpoliticalrepresentatives.Oppositioncomes alsofromdevelopingcountries,whichclaimthattheirpeoples’economicstandardissomuch lowercomparedtothatinmoredevelopedcountriesthatincreaseduseoffossilfuelisnecessaryto elevatetheirstandard.Ontheotherhand,mostscientistsconsiderpreventativemeasuresanecessity
inordertoavoidsignificantchangesinglobalclimateandtheconsequentimpactonhumanhabitat andecologicalsystems.
In1999theAmericanGeophysicalUnion(AGU)issuedapositionstatementonglobalclimate change,partofwhichwequote1:
... presentunderstandingoftheearthclimatesystemprovidesacompellingbasisforlegitimate publicconcernoverfutureglobal-andregional-scalechangesresultingfromincreasedconcentrationsofgreenhousegases.Thesechangesarepredictedtoincludeincreasesinglobalmeansurface temperatures,increasesinglobalmeanratesofprecipitationandevaporation,risingsealevels,and changesinthebiosphere.... Theworldmayalreadybecommittedtosomedegreeofhuman-caused climatechange,andfurtherbuildupofgreenhousegasconcentrationsmaybeexpectedtocause furtherchange.Someofthesechangesmaybebeneficialandothersdamagingfordifferentparts oftheworld.However,therapidityandunevengeographicdistributionofthesechangescouldbe verydisruptive.AGUrecommendsthedevelopmentandevaluationofstrategiessuchasemissions reduction,carbonsequestration,andtheadaptationtotheimpactsofclimatechange.AGUbelieves thatthepresentlevelofscientificuncertaintydoesnotjustifyinactioninthemitigationofhuman inducedclimatechangeand/ortheadaptationtoit.
Similarly,in1995,theIntergovernmentalPanelonClimateChange(IPCC)concluded2: Ourabilitytoquantifythehumaninfluenceonglobalclimateiscurrentlylimitedbecausethe expectedsignalisstillemergingfromthenoiseofnaturalclimatevariability,andbecausethere areuncertaintiesinkeyfactors.Theseincludethemagnitudeandpatternsoflong-termnatural variabilityandthetime-evolvingpatternofforcingby,andresponseto,changesintheconcentrations ofgreenhousegasesandaerosols,andlandsurfacechanges.Nevertheless,thebalanceofevidence suggestsadiscernibleinfluenceonglobalclimate.
BasedontheIPCCrecommendations,theFrameworkConventiononClimateChangeconvenedinKyotoinlate1997todiscussinternationaleffortsoncurbinggreenhousegasemissions. Thedevelopedcountriesandtheso-called“transitioncountries”(mainlytheformerUSSRand easternEuropeancountries)agreedthatby2010theywouldreducetheirCO2 emissionstoan averageof6–8%below1990emissionlevels.(BecauseCO2 emissionsinthedevelopedcountries areincreasingonaverageby1.5–2%peryear,theemissionreductiontargetin2010wouldbe muchgreaterthan6–8%belowunconstrained2010levels.)Unfortunately,thelesserdeveloped countries,includingChina,India,Indonesia,Mexico,andBrazil,didnotsigntheKyotoagreement.Also,somedevelopedcountries,notablytheUnitedStates,hadnotratifiedtheagreementby 2000.3 Thus,itisdoubtfulthatsignificantCO2 andothergreenhousegasemissionreductionswill beachievedinthenearfuture,exceptincountrieswherethereisaneconomicdownturn.(Historically,economicgrowthwasalwaysassociatedwithincreasedCO2 emissions,whereaseconomic recessionwasalsoassociatedwithdecreasedemissions.)
Inthischapterweexplainthecharacteristicsofthegreenhouseeffect,thepredictedtrendof globalwarmingandclimatechange,andthepossiblemeanstoamelioratetheseeffects.
1EOS,Trans.Am.Geophys.Union, 80, 49,1999.
2Houghton,J.T.,G.J.Jenkins,andJ.J.Ephraums,Eds.,1995. ClimateChange,theIPCCScientificAssessment Cambridge:CambridgeUniversityPress.
Thetermgreenhouseeffectisderivedbyanalogytoagardengreenhouse.There,aglasscovered structureletsinthesun’sradiation,warmingthesoilandplantsthatgrowinit,whiletheglasscover restrictstheescapeofheatintotheambientsurroundingsbyconvectionandradiation.Similarly, theearth’satmosphereletsthroughmostofthesun’sradiation,whichwarmstheearth’ssurface, butcertaingases,calledgreenhousegases(GHG),trapoutgoing radiative heatnearthesurface, causingelevatedsurfacetemperatures.
Thewarmingeffectontheearth’ssurfacebycertaingasesintheatmospherewasfirstrecognizedin1827byJean-BaptisteFourier,thefamousFrenchmathematician.Around1860,theBritish scientistJohnTyndallmeasuredtheabsorptionofinfraredradiationbyCO2 andwatervapor,and hesuggestedthatthecauseoftheiceagesmaybeduetoadecreaseofatmosphericconcentrations ofCO2.In1896,theSwedishscientistSvanteArrheniusestimatedthatdoublingtheconcentration ofCO2 intheatmospheremayleadtoanincreaseoftheearth’ssurfacetemperatureby5–6 ◦C. ThemajornaturalGHGarewatervaporandcarbondioxide.Ifnotforthesegases,theearth wouldbequiteinhospitable,withatemperaturewellbelowfreezing.So,whyareweconcerned aboutaddingmoreman-madeGHGtotheatmosphere?Willnottheearthbecomeevenmore comfortabletolivingcreatures?Theansweristhathumansandecologicalsystemshaveadaptedto presentclimaticpatterns.Perturbingthosepatternsmayresultinunpredictableclimatic,ecologic, andsocialconsequences.
Thesunemitselectromagneticradiationrangingfromveryshortwavelengthgammarays,Xrays, ultravioletthroughvisible,toinfraredradiation.Asectionofthesolarspectrumreachingtheearth, whichcontainsthenear-UV,visible,andnear-IRspectrumupto3.2 µm,isshowninFigure10.1. Threespectraarepresented.Theuppermostcurvegivesthesolarirradianceoutsidetheearth’s atmosphere;thelowestcurveisthespectrumofincidentradiationatsealevel.Thedashedcurve, whichfollowscloselytheuppercurve,isthespectral radiance ofablackbodyheatedtoatemperatureof5900K,scaledtoequalthetotalsolar irradiance attheearth.4 Thistellsusthatthe sun’ssurfacetemperatureisapproximately5900K(theinteriorofthesunismuchhotter,bymany millionsK,becauseofthenuclearfusionreactionsoccurringthere).Ablackbodyheatedto5900K emitsitspeakradianceinthevisibleportionoftheelectromagneticspectrum,atabout500nm (0.5 µm).Thereasonthesolarirradiancecurvedoesnotfollowtheblack-bodyradiancecurve exactlyisthatatsomewavelengthsthereisexcessradiance,atothersadeficit.5
Thesolarirradiancespectrumatsealevel(lowercurve)ismuchdifferentfromthespectrum atthetopoftheatmosphere.Thisisbecausegasesintheearth’satmosphereabsorborscatter
4Ablackbodyisaperfectradiator.Itabsorbsalltheincidentradiationofanywavelength,anditemits radiationatanywavelengthcommensuratewithitstemperature.Aradiationfieldenclosedbyablackbody oftemperature T hasanenergydensity(anddistributionofthatenergywithwavelength)thatdependsonly uponthetemperatureandnotonanyothercharacteristicsoftheblackbody.
5Excessradianceresultsfromexcitationofatomsandionsinthesolarcorona(e.g.,thesodium-Dlinesaround 589nm).Deficitsresultfromself-absorptionoftheincidentradiationbyothergaseousatomsandionswhich arealsopresentinthesolarcorona.ThesearecalledFraunhoferlines.
Shadedareasindicateabsorptionofradiationbyatmosphericmolecules.Thedashedcurveistheradiance spectrumofablackbodyheatedto5900K,scaledtothesolarirradiancecurveatthetopofatmosphere. (DatafromValley,S.L.,Ed.,1965. HandbookofGeophysics. Bedford:UnitedStatesAirForce.)
radiation.OntheUVside,oxygenandozoneinthestratospherearethemajorabsorbinggases.In thevisibleportion,densityfluctuationsofatmosphericmoleculesscattersunlight.6 Intheinfrared, polyatomicmoleculespresentintheloweratmosphere(troposphere),suchasH2O,CO2,O3,CH4, N2O,andothers,absorbsolarradiation.
Theearthradiatesoutwardtospaceaspectrumcommensuratetohersurfacetemperature. Figure10.2presentstheearth’sradiance(“earth-shine”)asobservedbyaspectro-photometer housedonanartificialsatellitelookingtowardtheearth’ssurface.ThesolidcurvesinFigure10.2 representblack-bodyradiancesatvarioustemperatures.Theblack-bodyradiancecurvethatbest representstheearth’sradianceatthespotwherethespectrumwastakenisthatforatemperature ofabout280–285K.
Theradiancecurvesspanthefar-infraredregionoftheelectromagneticspectrum,fromabout5 to50 µm,peakingatabout18 µm.Buttheearth’sradiancecurvehasseveraldeficits.Thesedeficits aretheresultofabsorption,andemissionatreducedlevels,ofthe outgoing thermalradiationby greenhousegases.
Thesun–earth–spaceradiativeequilibriumisdepictedinFigure10.3.Thenumbersonarrows areaverageannualradiationreceivedfromthesunoremittedfromtheearth,inwattspersquare meter.(TheintensitiesinFigures10.1and10.2areinstantaneousradiationfluxesfromthesunand
6Scatteredsunlightcausestheskytobeblue.Blueisthepreferredscatteredradiationofapureatmosphere, devoidofparticles.Withincreasingparticleconcentrationthescatteredradiationbecomescolorless(i.e., white).
30%isreflectedintospace(albedo);therestreachestheearth’ssurfaceorisscatteredbyclouds,aerosols, andatmosphericmolecules.Oftheoutgoingterrestrialthermalradiation,about17%goesdirectlyinto space;therestemergesafterredistributionbyclouds,aerosols,andgreenhousegases.UnitsareWm 2
earth,respectively.)About30%oftheincomingsolarradiationisreflectedintospacebyclouds andtheearth’ssurface.Thisfactoriscalledthe albedo.Anotherpart(25%)isabsorbedbygases andaerosols,includingclouds,intheearth’supperandloweratmosphere,excitingandsplitting molecules,andionizingmoleculesandatoms(forexample,solarUVradiationcausestheformation ofozoneinthestratosphereandfreeelectronsintheionosphere).Therest(about45%)reaches andisabsorbedbytheearth’ssurface,therebyelevatinglandandwatertemperatures.Muchofthe absorbedradiationgoesintoevaporatingwaterfromtheoceansandothersurfacewaters.
Quantitatively,thesolarenergyinputtotheearthontopoftheatmosphereis
wherethefactor π R2 E isthediskareapresentedbytheearthtowardthesunandwhere
So = annualaveragesolarenergyimpingingontopoftheatmosphere,calledthesolarconstant, 1367Wm 2
RE = earth’sradius,6371km
α = thepresentaveragealbedooftheearth,0.3 ± 0.03
Theearth’sradiativeoutputtospaceis
where4π R2 E isthetotalareaoftheearthwhichradiatesintospaceandwhere
σ = Stefan–Boltzmannconstant,5.67E( 8)Wm 2 K 4
TE = equivalentblack-bodyradiativetemperatureofearth,K
From10.1and10.2wecancalculatetheearth’sradiativetemperature
whereweusedanalbedo α = 0.3.Thetemperature TE = 255Kistheaverageradiativetemperature oftheearthandheratmosphereasitwouldappeartoaspaceobserverlookingtowardtheearth. Presently,theearth’saveragesurfacetemperatureis
288K(15 ◦
= 33Kisaconsequenceofthegreenhouseeffect.Thiseffectispresentonotherplanets.Marshas averythinatmosphere;thereforetheeffectiveradiativetemperatureandthesurfacetemperature areveryclose:217and220K,respectively.Ontheotherhand,Venus,whichhasaverydense CO2 atmosphere,theeffectiveradiativetemperatureis232K,andthesurfacetemperatureisabout 700K.
Theearth’saveragesurfacetemperaturehasvariedoverpastgeologicalages,asevidenced bytheglacialandinterglacialperiods.Inpart,thesetemperaturevariationsmayhavebeencaused bychangingGHGconcentrationsintheatmosphere.Otherfactorsforglobalclimatechangemay havebeenrelatedtothevariationsoftheearth’sorbitaroundthesunandthetiltofheraxis.First, theeccentricityoftheearth’sellipticalorbitvarieswithaperiodofabout100,000years.That changestheaverageinsolationoftheearth.Second,theaxisofrotationoftheearthvis-`a-visthe eclipticvariesbetween21.6 ◦ and24.5 ◦ (currently23.5 ◦)withaperiodofabout41,000years. Thatchangestheamountofinsolationofthehemispheres.Athirdpossiblefactorisachangein thesolarconstant.
Modelingofglobalwarmingisbasedoncalculationsofradiativetransferbetweentheradiating body(inthiscasetheearth’ssurface)andatmosphericmolecules,togetherwithotherenergy transportprocessesintheatmosphere.ThechangecausedbyextraamountsofGHGiscalled radiativeforcing.Modelingrequiresadetailedknowledgeofthespectroscopiccharacteristicsof GHGandthestructureoftheatmosphere,aswellasveryhighcapacitycomputersonwhichto exercisetheradiativetransfermodels.
TheabsorptionbandsofatmosphericmoleculesinthefarIR,between5and50 µm,wherethe earth’soutgoingthermalradiationisprominent,canbeseenasthedeficitsinFigure10.2.Water vaporabsorbsat5–7 µmandallwavelengthsabove10 µm;CO2 at12–18 µm;CH4 andN2Oat 7–8 µm;O3 at9–10 µm;themajorCFCs(CFCl3 andCF2 Cl2)at10–12 µm.Eachabsorption bandiscomposedofmanyindividualabsorptionlines,duetovibrational–rotationaltransitionsof themolecule.Atsomewavelengthsthereisoverlapofabsorptionbyindividualspecies.Water vaporprovidesaquasi-continuumabsorption(crowdingofindividualrotationallines)atthelonger wavelengths.TheCO2 bandat12–18 µmissostrongthatitisalmostsaturatedatthecenter.Further additionsofCO2 totheatmospherewillresultinmoreabsorptionatthewingsofthebands,but littleatthecenter.Thus,adoublingoftheCO2 concentrationintheatmospherewillnotnecessarily resultindoublingoftheearth’sthermalradiationabsorption,butonlyafractionthereof.Thisis analogoustoawindowthatispaintedblackatthecenter,butshadesofgrayattheperiphery. Addinganothercoatofblackontheentirewindowwillnotdoubleitsopaqueness.Ontheother hand,CH4 bandsarenotsaturatedatall;thusdoublingofCH4 concentrationswillnearlydouble CH4 absorption.ItisestimatedthataddingonemoleculeofCH4 isaseffectiveinabsorbingthe farIRradiationasadding20moleculesofCO2
Theabsorptionofenergyataparticularwavelengthbyanindividualmoleculedependsonline intensity,linehalf-width,andlowerstateenergy.Thelatterisafunctionofthetemperatureofthe surroundingatmospherewithwhichthemoleculeisinequilibrium.Theatmosphereismodeled bymanylayers,ineachofwhichtheabsorbinggasconcentrationandtemperaturedeterminethe radiativetransportawayfromandtowardstheearth,andfromwhichthemodelpredictsthesurface temperatureandatmospherictemperatureprofile.
Theearth’satmospherehasacomplicatedtemperaturestructure.Inthetropospherethetemperaturedecreaseswithaltitude;inthestratospherethetemperatureincreases;inthemesosphereit decreases;inthethermosphereitincreasesagainwithaltitude.TheGHGmoleculescanreducethe outgoingterrestrialradiationonlyiftheyareatacoldertemperaturethantheradiatingearth.We notedbeforethattheearth’seffectiveradiatingtemperaturecorrespondstoablack-bodytemperature TE = 255K.Withanaveragesurfacetemperature TS = 288Kandanaveragetemperature gradient(lapserate)inthetroposphereofabout 6K/km,theapparentheight(calledthe mean radiatingheight),atwhichthetemperaturelevelof255Koriginatesis5.5km.Becausetheeffectiveradiatingtemperatureoftheearthwillremainnearlyat TE = 255K,additionofGHGtothe atmospherewillchangethesurfacetemperature TS ,thetemperatureprofileoftheatmosphere,and themeanradiatingheight.7 Thesun–earth–spacesystemremainsinradiativeequilibrium;what changeswiththeadditionofGHGtotheatmosphereisthe redistribution ofenergy,manifestedby aredistributionoftemperature,betweentheearth’ssurfaceandheratmosphere.IncreasedGHG concentrationshavetheeffectthatinthehighertroposphere,wheretheGHGmoleculesarecolder, moreoutgoingterrestrialradiationisabsorbed.Thatradiationisre-emittedinalldirections.About one-halfisradiateddownwardtotheearth’ssurface,raising TS ;theotherhalfisradiatedupward, warmingtheevencolderupperlayersofthetroposphere.Ontheotherhand,thelowerstratosphere willbecoolerbecausethoselayersreceivelessoutgoingradiationfromthesurface,duetoabsorptionoftheinterveningGHG.Takingthewholeatmospherictemperatureprofileintoaccount, themeanradiatingheightwillberelativelyhigherthanatpresent.Thesechangesaredepictedin Figure10.4.
InadditiontoradiativeforcingduetoenhancedconcentrationofGHG,themodelingofglobal warmingisfurthercomplicatedbecausearisingsurfacetemperatureinevitablywillcausesecondary effects,called feedbackeffects.Thiscanbeexpressedbytheproportionality
where TS istheriseofsurfacetemperature, Q istheradiativeforcingduetoGHGalone,and β isafactoraccountingforthefeedbackeffect.If β< 1,thefeedbackispositive,whichwillincrease thesurfacetemperatureevenmorethanbyincreasinggreenhousegasconcentrationsalone.If β> 1,thefeedbackisnegative,whichwillcauseasmallersurfacetemperatureincrease.There areseveralfeedbackeffectspossible:watervapor,cloud,aerosol,ice-albedo,andoceancirculation feedbacks.
Thismechanismmaybethemostimportantfeedbackeffect.Watervaporisastronginfrared absorbinggasatwavelengthsbetween5and7 µmandabove10 µm.Astheaverageearth’s surfacetemperaturerisesbecauseofincreasingGHGconcentrations,moreevaporationwilloccur fromthevastoceansurfaces,hencetheatmospherewillbecomeladenwithmorewatervapor; thatis,thehumiditywillincrease.Thiswouldresultinstrongerabsorptionoftheoutgoingfar-IR radiation,thusapositivefeedback.Radiativemodelspredictthatthewaterfeedbackeffectmay increasetheGHGcausedglobalwarmingbyabout60%(β ≈ 0.6).
Thefeedbackeffectofcloudsiscomplicated.Cloudscanhavebothanegativeandpositivefeedback effect.Thenegativeeffectisduetoreflectionbycloudsoftheincomingsolarradiation,contributing toanincreaseoftheearth’salbedoandthusreducingtheearth’ssurfacetemperature.Thepositive effectisduetothecloudsreflectingtheoutgoingearth’sthermalradiation.Thebalanceofthe twoeffectsisdependentoncloudcharacteristics,theiraltitude,anddropletorcrystalsize.In general,low,cumulus-typecloudsreflectsolarradiation:acoolingeffect.High-altitude,cirrustypecloudsreflecttheearth’sradiation:awarmingeffect.Modelingofcloudfeedbackeffectsis highlyuncertain.Atthisstageabest“guestimate”isthatintheoverallthepositivefeedbackeffect wins(morehighaltitudecloudsasaconsequenceofGHGcausedsurfacewaterwarming),sothat thecloudfeedbackeffectwilladdanother20%(β ≈ 0.8)tothesurfacetemperatureincreasedue toincreasingGHGconcentrations.
Similarlytoclouds,naturalandman-madesmallparticlessuspendedintheair,calledaerosols, caninterferewiththeincomingsolarandoutgoingterrestrialradiation.Theaveragecomposition ofaerosolsisaboutone-thirdcrustalmaterial(fugitivedustfromsoil,sand,rocks,andshale), one-thirdsulfate(mainlyfromsulfuremissionsassociatedwithfossilfuelcombustion),andonethirdcarbonaceousmatterandnitrate(alsofromfossilfuelcombustion).Thediameterrangeof theaerosolsismuchlessthanamicrometer.Thisdiameterrangeismoreeffectiveinscattering incomingsolarradiationthaninreflectingoutgoingterrestrialradiation.Thus,theaerosolfeedback effectisthoughttobenegative,reducingtheGHGeffectby10–15%(β ≈ 1.1).
Theaerosolsmayalsohaveanindirectfeedbackeffect.Aerosolsserveascondensationnuclei forclouds.Themoreaerosolsintheair,thehighertheprobabilityofcloudformation.Dependingon theformedcloudheight,anddropletorcrystalsize,cloudsmayreflectincomingsolarradiationor outgoingterrestrialradiation.Thisindirecteffectispresentlyunderintensestudy,andtheresulting feedbackcannotyetbeassessed.
Astheearth’ssurfacewarmsduetoincreasedGHGconcentrations,thefringesoftheArcticand Antarcticicecapsmaymelt.Also,glaciers,whichalreadyarerecedinginthisinterglacialperiod, mayrecedeevenfaster.Becauseicehasahigheralbedo(reflectsmoresunlight)thanwaterand land,thedisappearanceoficewillleadtoadecreaseintheearth’salbedo[α inequations(10.1) and(10.3)].Thiswillcausetheearth’sradiativetemperature TE ,andconcomitantlythesurface temperature TS ,toincreaseslightly.Theice–albedoeffectmayadd20%totheGHG-causedsurface warming(β ≈ 0.8).
Altogether,thevariousfeedbackeffectsmaydoubletheGHG-causedglobalwarming.
Anotherpossiblefeedbackmechanismisthealterationoftheoceancirculationandcurrents.In general,coldandhighlysalinewatersinkstogreaterdepths,andwarm,lesssalinewaterrises. Thecoldandlarger-than-averagesalinewatersaregeneratedintheArctics,asiceisformedatthe surface.Thesewaterssinktotheoceanbottomandmovetowardtheequator.There,warmerandless
salinewatersriseandmovetowardthepoles,completingaloop.Withmeltingicecaps,alongwith anincreaseofprecipitationathighlatitudes(whichsweetensthesurfacelayer),thenormalocean circulationpatternmaybealtered,withpossiblechangesintheaverageglobalsurfacetemperature. Thisfeedbackeffectonaveragesurfacetemperatureisverydifficulttopredict;itmaybenegative, positive,orneutral.Thedisruptionoftheoceancirculationmayhaveotherconsequences,suchas enhancedElNi˜noeffectandchangingstormsystempatterns(seeSection10.3).
Basedonradiativeforcingmodels,theIntergovernmentalPanelonClimateChange(IPCC)projects theaverageearth’ssurfacetemperatureincreaseinthetwenty-firstcenturyasshowninFigure10.5. ThisprojectionisbasedonestimatedincreaseofCO2 andotherGHGemissions,aswellonvarious feedbackeffects.The“best”estimatepredictsariseoftheearth’ssurfacetemperaturebytheend ofthiscenturyofabout2 ◦C;the“optimistic”estimatepredictsabout1 ◦C,andthe“pessimistic” estimatepredictsabout3 ◦C.TheoptimisticestimatereliesonslowingofCO2 andotherGHG emissions,thepessimisticestimaterelieson“business-as-usual”(i.e.,oncontinuingrateofgrowth ofCO2 andotherGHGemissions),andthebestestimateissomewhereinbetween.
BecauseatmosphericCO2 concentrationshaverisenfromabout280ppmvfromthestartofthe industrialeratoabout370ppmvtodate,modelsshowthattodatetherealreadyshouldhavebeen aglobalwarmingofabout0.5 ◦Cto1 ◦C,dependingonmodelandassumedfeedbackeffects.Has suchwarmingactuallyoccurred?
Figure10.5
Projectedtrendoftheearth’ssurfacetemperatureincrease.Uppercurve:pessimisticscenario, basedon“business-as-usual”fossilfuelconsumption.Lowercurve:optimisticscenario,basedonslowing downoffossilfuelconsumption.Middlecurve:inbetweenworstandbestscenario.(DatafromHoughton, J.T.,G.J.Jenkins,andJ.J.Ephraums,Eds.,1995. ClimateChange,theIPCCScientificAssessment. Cambridge:CambridgeUniversityPress.)
Figure10.6showstheobservedtemperaturetrendfrom1855to1999.Measuredtemperature datafromhundredsofstationshavebeenaveraged.Ascanbeseen,therearewidefluctuations fromyeartoyear.Inspiteofthefluctuations,thereisanunmistakableupwardtrend.Averagingthe fluctuations,themeanglobaltemperatureappearstohaverisenbyabout0.5 ◦Cto1 ◦C.Radiative forcingmodels,consideringtheeffectsofgreenhousegasesalone,predictariseofabout1 ◦C overthatperiod.Assumingthatman-madeaerosolshaveanegativefeedbackeffect,othermodels predictthattheaveragetemperatureshouldhaverisenbyonlyabout0.5 ◦C.Thus,modelingresults aremoreorlessinlinewiththeobservedglobalwarmingtrendoverthelastcentury.
AsaconsequenceofincreasedGHGconcentrationsintheatmosphere,theearth’ssurfacetemperaturemayriseasdiscussedinprevioussections.Thesurfacetemperaturerisemaycauseseveral ancillaryeffectsonglobalclimateandhydrogeology,whichinturnwillaffecthumanhabitat, welfare,andtheecology.
Withincreasingsurfacetemperaturestheaveragesealevelwillrisebecauseofthreefactors:melting ofpolaricecaps,recedingofglaciers,andthermalexpansionoftheoceansurfacewaters.
Thesealevelvariedgreatlyoverpastgeologicalperiods.Beforetheonsetofthelastglacial period,about120,000yearsago,theglobalaveragetemperaturewasabout2 ◦Chigherthantoday. Theaveragesealevelwasabout5–6mhigherthantoday.Attheendofthelastglacialperiod, about18,000yearsago,thesummerairtemperatureswerelowerby8 ◦Cto15 ◦Covermostof NorthAmericaandEurasiasouthoftheicesheets,andseasurfacetemperatureswereabout2 ◦Cto 2.5 ◦Cbelowpresent.Theaveragesealevelwasover100mlowerthanatpresent.Atthattimethe
BritishIsleswerejoinedwiththeEuropeanmainland,andthepolaricesheetsextendedinEurope asfarassouthernEnglandandSwitzerland,andinNorthAmericatheyextendedtotheGreatLakes andsouthernNewEngland.
Themeltingoficecapsmayactuallycontributethesmallestfractionofsealevelrise.This isbecauseoftwocompetingeffects.Withincreasingsurfacetemperaturestherewillbemore evaporationandprecipitation,includingsnowfall,whichenlargestheicecaps.Ontheotherhand, somemeltingofthefringesoficecapswilloccur.Thenetresultmaybeafewcentimetersofsea levelrisebytheendofthenextcentury.
Inrecenttimes,glaciersoverthecontinentshavebeenrecedingnoticeably.Overthelast centurythisrecedinghascontributedbetween2and5cmofsealevelrise.Ifallglaciersoutside AntarcticaandGreenlandweretomelt,thesealevelrisewouldbeintherange40–60cm.
Thelargestcontributiontosealevelrisewillcomefromthethermalexpansionofthesurface layeroftheoceans.Theestimationofthiscontributionisquitecomplicated,becausethecoefficient ofthermalexpansionofwaterisafunctionoftemperature,andthedepthofthemixedsurfacelayer whichvariesovertheglobe.
Combiningallthreefactors—meltingoficecaps,recedingofglaciers,andthermalexpansion ofwater—itisestimatedthatbytheendofthetwenty-firstcenturytheaveragesealevelmaybe 30–50cmhigherthanitistoday.Thiscanseriouslyaffectlow-lyingcoastalareas,suchasthe NetherlandsinEurope,BangladeshinAsia,andlow-lyingislandsinthePacificandotheroceans.
Predictingglobalandregionalclimaticchangesasaconsequenceofaveragesurfacetemperature riseisextremelydifficultandfraughtwithuncertainties.Itisexpectedthatregionaltemperatures, prevailingwinds,andstormandprecipitationpatternswillchange,butwhereandwhen,andtowhat extentchangeswilloccur,isasubjectofintensiveinvestigationandmodelingonthelargestavailable computers,theso-calledsupercomputers.Climateisinfluencednotonlybysurfacetemperature changes,butalsobybiologicalandhydrologicalprocessesandbytheresponseofoceancirculation, whichareallcoupledtotemperaturechanges.
Itisexpectedthattemperateclimateswillextendtohigherlatitudes,probablyenablingthe cultivationofgraincropsfurthertowardthenorththanatpresent.Butcropsneedwater.Onthe average,theglobalevaporationandprecipitationbalancewillnotchangemuch,althoughatany instantmorewatervapor(humidity)maybelockedupintheatmosphere.However,precipitation patternsmayalter,andtheamountofrainfallinanyepisodemaybelargerthanitisnow.Consequently,therunoff(andsoilerosion)maybeenhanced,andareasoffloodedwatershedsmay increase.
Hurricanesandtyphoonsspawninwatersthatarewarmerthan27 ◦C,inabandfrom5 ◦ to20 ◦ northandsouthlatitude.Asthesurfacewaterswillbecomewarmerandthelatitudebandexpands, itisverylikelythatthefrequencyandintensityoftropicalstormswillincrease.
Thewell-knownoceancurrents,suchastheGulfStream,Equatorial,Labrador,Peru,and Kuroshoicurrents,aredrivenbysurfacewindsanddensitydifferencesinthewater.AtypicalexampleistheElNi˜noevent.AlongthecoastofPeruandChile,prevailingwindsblowoffshore,drivingthesurfacewaterswestwardfromtheSouthAmericancoast.Thissetsupathree-dimensional patternofoceancirculationinwhichthewarmsurfacewatersarereplacedbyupwellingofcolder waterfromdepthsreachingto300m.Thesecolderwatersarerichinnutrientsonwhichpelagic (watercolumn)fishandotheraquaticorganismsfeed—forexample,theanchovies.Thisevent
occurscyclicallyaroundChristmas,hencethenameElNi˜no.Recently,majorElNi˜nosoccurredin 1957–1958,1972–1973,1976–1977,1982–1983,theearly1990s,and1997–1998.Thebenefitsof ElNi˜noarearicheranchovyharvest.Thedisadvantagesarewide-reachingclimaticeffects,such ascool,wetsummersinEurope;increasedfrequencyofhurricanesandtyphoonsinthewestern Pacific,SouthChinaSea,southernAtlantic,andCaribbeanSea;andheavystormsandprecipitationbatteringtheeasternPacificcoastfromMexicotoBritishColumbia.The1997–1998ElNi˜no, whichcausedwinterstormsalongthePacificcoastofNorthAmericawithheavyprecipitation, mudslides,andresultingpropertydamage,isarecentreminderofwhatmayhavebeenaperiodic naturalevent,butwhichcouldbeexacerbatedandmademorefrequentinthefuturewithenhanced globalwarming.
Thesealevelandclimaticchangesmaycauseconsiderableshiftsinpopulationcentersand distributionofagriculturalandforestryresources,andtheymayrequireincalculableinvestments inhabitatandpropertyprotection.
TheincreaseofGHGconcentrationsintheatmosphereisaconsequenceofrisingemissionsofthese gasesfromanthropogenicsources.ThemostsignificantofthesegasesisCO2,butCH4,CFCs,and N2Oemissionsalsoneedtobeconsidered,aswellaschangesinO3 concentrations.
Becausecarbonconstitutesamajormassfractionofalllivingmatter,onearththereisanenormous reservoirofcarboninthelivingbiosphereanditsfossilizedremnant.Sedimentarylimestone, CaCO3,containsabout12%ofitsmassascarbon.Thislimestoneoriginatesinpartfromshells andskeletonsofpastlivingcreatures,andinpartfromprecipitationfromasupersaturatedaqueous solutionofCaCO3.
ThereisacontinuousexchangeofCO2 betweenthebiosphereandatmosphere.Carbondioxide isabsorbedfromtheatmosphereduringphotosynthesisoflandvegetationandphytoplanktonliving inoceansandothersurfacewaters.Carbondioxideisreturnedtotheatmosphereduringrespiration ofanimalsanddecomposition(slowcombustionofcarbonaceousmatter)ofdeadplantmatterand animals.
Figure10.7showstheratesofcarbonexchangebetweenthebiosphereandatmosphereand betweenoceanandatmosphere,anditalsoshowsemissionsfromfossilfuelcombustionandforest burning(Gty 1).Thefigurealsoshowsthecarbonreservoirsresidinginbiotaandsoillitteron land(2000Gt),dissolvedintheocean(40,000Gt),infossilfuels(5000–10,000Gt),andinthe atmosphere(750Gt).8
Therespirationanddecompositionoflandorganismsemitabout60Gty 1 ofcarbonintothe atmosphere,whilephotosynthesisabsorbsabout62Gty 1.Thus,thereisasmallnetabsorption ofCO2 fromtheatmospherebyland-basedbiota.Theoceansandothersurfacewatersabsorb 92Gty 1 ofcarbonbydissolutionofCO2 andbyphotosynthesisofphytoplankton.Theoceans
8Carbonandcarbondioxidewillbeusedinterchangeablyinsubsequentdiscussions.Toconvertfromcarbon toCO2,multiplyby44/12 = 3 67.
Figure10.7 Ratesofcarbonexchangebetweenbiosphereandatmosphereandbetweenoceanand atmosphere.Alsoshownareemissionsfromfossilfuelcombustionandforestburning(Gty 1).Carbon reservoirsinsoil,ocean,fossilfuel,andatmosphere(Gt).
returnintotheatmosphereabout90Gty 1 byrespirationandoutgassing.Thus,theoceansarealso netabsorbersofCO2.Wenotethatthenetincreaseofatmosphericcarbon,about3Gty 1,isquite smallcomparedtotheannualcyclingof150Gty 1 vialandandwater.Itistheextremelyslow secularchangeinthelatterthathasaccompaniedglaciationperiods.
Currently,about6.8Gty 1 ofcarbon(25Gty 1 CO2)areemittedintotheatmosphereby fossilfuelcombustion(seeChapter2).Another1.5 ± 1Gty 1 areemittedduetodeforestation andlandusechanges,mainlyartificialburningofrainforestsinthetropicsandloggingofmature trees,whichdisruptsphotosynthesis.Theatmosphericcarboncontentisincreasingbyabout3Gt y 1.Becausethebiosphereandoceansabsorbabout2Gty 1 each,about1.3 ± 1Gty 1 ofcarbon areunaccountedfor.Mostlikely,thebiosphereandoceansabsorbmoreCO2 thanisindicatedin Figure10.7.
Figure10.8showsthegrowthofCO2 concentrationsintheglobalatmospherefrom1000to 2000.Theatmosphericconcentrationsbefore1958wereestimatedfromicecores.Duringdescentin theatmosphere,snowflakesequilibratewiththeatmosphericconcentrationofCO2.Subsequently, thesnowfalliscompressedintoice,withitsCO2 contentpreserved.Knowingtheageoftheice layer,itispossibletoreconstructtheprevailingatmosphericconcentrationofCO2 whenthesnow flakeswerefalling.In1958,CharlesKeatingestablishedanaccurateatmosphericCO2 concentration measurementdeviceusinginfraredabsorptionontopofMaunaLoa,Hawaii.Thisinstrumentis stilloperating,andthemeasurementsthereofprovideanaccuraterecordofglobalaverageCO2 concentrationseversince.
Thehistoricrecordindicatesthatbeforethetwentiethcenturytheatmosphericconcentrationof CO2 hoveredaround280ppmV,withadipinthesixteenthandseventeenthcenturies,corresponding tothe“littleiceage.”Startingaround1900,whentheuseoffossilfuelsaccelerated,theCO2 concentrationbeganasteadyincreaseofabout0.4%/y,reachingcloseto370ppmVin2000.If thatrateofincreaseweretocontinueintothefuture,adoublingofCO2 concentrationswould occurinabout175years.However,ifnomeasuresaretakentoreduceCO2 emissions,thendueto thepopulationincreaseandtheconcomitantenhancementoffossilfueluse,therateofgrowthof CO2 concentrationswillincreasemorethan0.4%peryear,andthedoublingtimewillbeachieved sooner.
Methaneisemittedbynaturalprocesses,suchas(a)theanaerobicdecompositionoforganicmatter inswampsandmarshesand(b)entericfermentationoffodderingutsofanimals.Anthropogenic emissionsofCH4 comefromleakageofoilandgaswells,gaspipelines,andstorageandtransportationvessels.AccumulatedCH4 incoalseamsismostlyventedintotheatmospherewhen mineshaftsaredugintotheseams.Worldwideconcentrationsarepresentlyabout1.7ppmvand aregrowingbyabout0.6%peryear.ConsideringthatCH4 isastrongerabsorberofIRradiation permolecule thanCO2 (seeSection10.2.3),itscontributiontothegreenhouseeffectissignificant eventhoughitspresentconcentrationintheatmosphereisonlyabout5E( 3)timesthatofCO2 AssumingcontinuedgrowthofCH4 andCO2 intheatmosphere,by2100CH4 maycontributeas muchas15%toglobalwarming.9
Nitrousoxideisemittednaturallyduringbacterialnitrogenfixationinsoils
andbylightningdischarge.Minorquantitiesareemittedfromfossilfuelcombustionandinsome chemicalmanufacturingprocesses(e.g.,nitricacid,chemicalfertilizer,andnylonproduction).Its currentconcentrationintheatmosphereisabout0.3ppmvandisgrowingbyabout0.25%peryear.
WhileN2Oisastrongfar-infraredabsorbinggasinthe7-to8-µmrange,currentlymeasuredsmall concentrationsofthisgasanditsslowergrowthratecomparedtoCO2 meanthatinabout2100it maycontributeabout10%toglobalwarming.
Chlorofluorocarbons(CFC)areentirelyman-madeproducts,becausetheyareproducedinchemical factoriesforuseasrefrigerants,propellantsinspraycans,foam-blowingagents,solvents,andso on.Byinternationalconventions,theyaregraduallybeingphasedoutofproduction.However, becauseoftheirslowventingfromexistingappliancesandfoaminsulationmaterials,coupledwith theirlonglifetimeintheatmosphere(hundredsofyears),theywillcontributetoglobalwarming foralongtimeaftertheyceasetobeproduced.In2100,chlorofluorocarbonsmaycontributeabout 5–10%toglobalwarming.
Inaddition,chlorofluorocarbonsreducetheconcentrationofozoneinthestratosphere(see Section9.2.5).
InChapter9wenotedthattherearetwolayersofO3 intheatmosphere:oneinthestratosphere (the“good”ozone),theotherinthetroposphere(the“bad”ozone).StratosphericO3 isproduced naturallyfrommolecularoxygenundertheinfluenceofsolarUVradiation.SometroposphericO3 hasdiffuseddownfromthestratosphere,andtherestisproducedfromanthropogenicprecursors, nitricoxides(NOx),andvolatileorganiccompounds(VOC),undertheinfluenceofsolarradiation. About10%ofthetotalcolumndensityofozoneresidesinthetroposphere.Becausetheupper troposphereandlowerstratosphereiscolderthantheearth’ssurface,ozonemoleculesresidingin thoselayersabsorbpartoftheoutgoingfar-infraredterrestrialradiationandthenre-radiateback tothesurface,thusaddingtoglobalwarming.
Ozonecolumndensitiesvarygreatlyasafunctionoflatitude,altitude,andseasons,and theyalsovaryfromurbanized-industrializedpartsofthecontinentstoremoteareas.Thus,itis difficulttoassignaglobal,annualaveragecolumndensityandaltitudeprofileforO3.Currently, thestratosphericozoneisbeingdepletedbychlorofluorocarbons,whichresultsinasmallnegative feedbacktoglobalwarmingbecauselessoftheoutgoingterrestrialinfraredradiationisabsorbed bystratosphericozone.WiththephasingoutofCFCproductionworldwide,itisestimatedthat stratosphericozoneconcentrationswillreturnslowly(tenstohundredsofyears)topre-CFCtimes. Ontheotherhand,troposphericozoneisontheincreasebecauseofincreasedemissionofthe ozoneprecursors,NOx andVOC(seeSection9.2.5).Intheuppertroposphere,whereambient temperaturesarelowerthanattheearth’ssurface,theanthropogenicozoneabsorbssomeofthe outgoingterrestrialradiation,causingapositivefeedbacktoglobalwarming.Onbalance,onemay assumethatintheforeseeablefuturethestratosphericozonedeficitandthetroposphericozone surpluswillcanceleachother,andnoappreciablecontributiontoglobalwarmingistobeexpected fromozone.
Inconclusion,bytheyear2100,CH4,N2O,andCFCmaycontributeaboutone-thirdtoglobal warming,withtheremainingtwo-thirdsbeingcontributedbyCO2.Inregardtomethane,effortscan bemadetolimititsleakagefromgaswells,transportpipelines,storagetanks,LNGtankers,coal mines,andothersourcesofanthropogenicCH4.TheproductionofanthropogenicN2Oispoorly understood;henceitwillbedifficulttocontrolitsemission.BecauseCFCproductionisbeing phasedoutworldwide,itwilleventuallydisappearfromtheatmosphere.Thegreatesttechnical andeconomicproblemwillbethereductionofCO2 emissions.Thisisthesubjectofthenext section.
GlobalwarmingcanbeamelioratedbyreducingtheemissionsofCO2 andothergreenhousegases intotheatmosphere.Inthissectionweshalldiscussthepossibilitiesofslowingthebuild-upof CO2 concentrationsintheatmosphere.
About86%oftheworld’spresentprimaryenergyusagecomesfromtheconsumptionof fossilfuels.Worldwidetheenergyconsumptioningeneral—and,concomitantly,fossilenergy consumption—isgrowingontheaverageby1.5%peryear(seeSection2.3).Asfossilfuelswill becomescarcerandmoreexpensivetorecoverandotherenergytechnologiesbecomeavailable, thefossilfuelportionofthetotalenergyconsumptionmaybecomesmaller.Inthenextdecades, however,weonlycanhopetoamelioratetherateofincreaseofglobaltemperaturesbyslowing downandthenreversingtherateofgrowthoffossilenergyconsumption.Also,sometechnologies arebecomingavailableforcapturingCO2 fromcombustionsourcesandsequesteringitinterrestrial anddeepoceanrepositories.EmissionreductionsofCO2 canbeaccomplishedbyacombination ofseveralofthefollowingapproaches:
• End-useefficiencyimprovementsandconservation
• Supplysideefficiencyimprovements
• CaptureandsequestrationofCO2 insubterraneanreservoirsorinthedeepocean
• UtilizationofCO2 forenhancedoilandnaturalgasrecoveryandforenhancedbiomass production(photosynthesis)
• Shifttononfossilenergysources.
Thesimplestandmostcost-effectiveapproachtoreducingcarbonemissionsisbyend-useefficiency improvementsandconservation.InChapter2wediscussedvariousend-usemeasuresthatwould resultincarbonemissionreductions.Intheresidential–commercialsector,theyrangefromlowering thethermostatinthewinter(lessheating),raisingitinthesummer(lessairconditioning),better insulation,lesshotwateruse,replacementofincandescentwithfluorescentlighting,replacement ofelectricclothesdryerswithgasdryers,andsoon.ItisestimatedthatintheUnitedStates,in
theresidential–commercialsector,bytheyear2010,carbonemissionscouldbereducedby10.5% below1990levelswithjudiciousandcost-effectiveconservationmeasures.11
Intheindustrialsectorthelargestsavingscouldcomefromreductionsindirectuseoffossil fuels(e.g.,coalforprocessheatorsmelting),processmodification,energy-efficientmotors,better heatexchangers,andsoon.A“high-efficiency–low-carbon”scenariopredictsthatasmuchas 12.5%energysavingscouldberealizedintheU.S.industrialsectorbytheyear2010,translating toa62-Mtcarbonemissionreduction.12
Inthetransportationsector,fossilfuelenergyconsumptionisgrowingbyleapsandbounds allovertheworld.Increasingpopulationandlivingstandards,coupledwiththemovementfrom agriculturaltourban-industrialsocieties,putsmoreandmorepeopleandcargoinautomobiles, trucks,trains,airplanes,andships.Themostconvenientfuelforthetransportationsectorisa fluidfuel(liquidorgaseous)—forexample,gasoline,diesel,jet-fuel(kerosene),alcohol,methane, propane,orsyntheticfluidfuels,whichusuallyarederivedfromfossilfuel.Becauseitisunrealistic toexpectthatthe number oftransportationvehicles,orthe distances covered,willdiminish,theonly chancesforreducingcarbonemissionsinthetransportationsectorlieinefficiencyimprovements. SuchimprovementsarediscussedinChapter8.Theyrangefromsmaller,lightweightautomobilesto hybridelectric-internalcombustionengineorfuel-cell-poweredvehicles.Itisestimatedthatinthe UnitedStates,intheyear2010,carbonemissionsfromthetransportationsectorwillbe26%higher thanin1997under“business-as-usual”conditions,whereasifpossibleefficiencyimprovements wereintroduced,theywouldbeonly5%higher.13
Bysupply-sideefficiencyimprovementswemeanprincipallyelectricitysupply.IntheUnited States,36%ofcarbonemissionscomefromelectricitygeneratingplants,andasimilarpercentage isapplicableworldwide(seeSection2.4).Theelectricityindustryhasmanyoptionstoreduce carbonemissionswhilesupplyinganever-increasingelectricitydemand.Theseoptions,discussed inChapter5,includethefollowing:
• Shiftfromcoaltonaturalgas.Perunitofenergy,gasemitsroughlyhalfasmuchcarbonas coal.
• Replacementofsingle-cyclegas-firedsteampowerplantswithcombinedcyclegasturbine plants(CCGT).Becausesingle-cyclepowerplantthermalefficienciesareintherange 35–40%,whereasthecombinedcycleplantscanachieve50–55%,thecarbonemission savingsareintherangeof10–20%.
• Replacementofsingle-cyclecoal-firedpowerplantswithgas-firedCCGT.Thecarbonemissionsavingsareintherange60–70%(50%onaccountofshiftfromcoaltogas,and10–20% onaccountofhigherefficiency).
• Replacementofsingle-cyclecoal-firedpowerplantswithcoal-derivedsyntheticgas-fired combinedcyclegasturbineplants.Theefficiencyofsuchplantsis40–45%basedonthe 11
coalinputenergy.Here,thecarbonemissionsavingswouldbeonlyontheorderof5–10%. WhileaCCGThasahigherefficiencythanasingle-cycleplant,coalgasificationrequires someofthecoalenergytobespentongasification.
Ingeneral,thevolumefractionofCO2 inthefluegasoffossilfuelelectricpowerplantsranges from9%to15%,dependingonfuel(e.g.,gasversuscoal)andexcessairusedforcombustion. Becausearelativelysmallfractionofonegas(CO2)needstobeseparatedfromthemajorityof othergases(N2,H2O,andexcessO2),thecaptureofCO2 isquitedifficultandexpensive,andit requiresextraenergy,whichreducesthethermalefficiencyofapowerplant.
ThecaptureofCO2 isonlyworthwhileinlargepowerplants,especiallythoseburningcoal (becausecoalemitsmoreCO2 thanoilorgas).A1000-MWcoal-firedpowerplantemitsbetween 6and8Mty 1 ofCO2.ThecaptureofCO2 fromalltheworld’slargecoal-firedpowerplants wouldmakeasignificantdentintheglobalcarbonemissions.ThefollowingtechnologiesforCO2 capturefrompowerplantsarebeingdeveloped:
• Airseparation–CO2 recycling
• Solventabsorption
• Membranegasseparation
Thismethodisbasedoncombustionofthefossilfuelinpureoxygen,insteadofair.Aplantusing thismethodrequiresanairseparationunit(ASU).Here,thegasseparationshiftstoprecombustion, ratherthanpostcombustion.Thisdoesnotsavemuchenergyingasseparation,butthereareseveral otherbeneficialeffectstothismethod.First,theASUproducesusefulbyproducts,suchasnitrogen andargon.Second,partoftheoxygenproducedintheASUcanbeusedforcoalgasification,thus enablingthepowerplanttooperateinacombinedcyclegasturbinemodewithasomewhathigher thermalefficiencythanasingle-cyclecoalcombustion–steamturbinemode.(Someefficiencyis lostonaccountofusingcoalenergyforgasification.)Third,thecombustionof“syngas”(amixof COandH2)withpureoxygenreleasesnoSO2,NOx,orparticulatematter.Allthecontaminantsin coalareremovedduringandafterthecoalgasificationprocess.Thecombustionproductsofsyngas withpureoxygenarealmostentirelyCO2 andH2O.Thewatervaporiscondensed,andCO2 is captured.Thus,thereisnoexhaustgas.Infact,thepowerplantitselfrequiresnosmokestack.
Aschematicofanintegratedairseparationcoalgasificationcombinedcyclepowerplantwith CO2 captureisshowninFigure10.9.TheASUisastandardcommercialunit,asemployedon alargescaleinthesteelindustryandforcoalgasification.Afternitrogenseparation(depending onuse,theseparatednitrogencanbeeitherliquidorgaseous),partoftheoxygenisusedforcoal gasification(seeChapter5),andtherestisusedforcombustion.Thefuel(syngas)comesfrom thegasificationunit.Becausethecombustionofsyngaswithpureoxygenwouldyieldtoohigh atemperatureforconventionalmaterials,theflameneedstobecooled.Therefore,apartofthe capturedCO2 isrecycledintothecombustionchamberinordertoachievetolerablecombustion temperatures.Thecombustiongasesexpandinagasturbine,producingapartofthepower.The residualheatisrecoveredinaheatrecoverysteamgenerator(HRSG).Thegeneratedsteamrunsa steamturbine,producingmorepower.AfterheatexchangeintheHRSG,wateriscondensedfrom
thecombustiongases.TheremainderconsistsalmostentirelyofCO2.TheCO2 iscondensedin aheatexchangerwithliquidoxygenthatcomesfromtheASU.ApartofthecondensedCO2 is recycledintothecombustionchamber,andtherestisstoredasaliquidforsubsequentsequestering.
Theestimatedthermalefficiencyofsuchaplantisabout37%,whichincludestheenergyspent onairseparationandcoalgasification.Thiscomparesto40–45%estimatedforaplantwithcoal gasification,aircombustion,andnoCO2 capture.Theplanthasathermalefficiencycomparable tomodernpulverizedcoalsingle-cyclesteamplants,whichemitnotonlythefullamountofCO2, butotherairpollutantsaswell.14
Obviously,thecostofanintegratedcoalgasificationcombinedcycleplantwithCO2 capture ishigherthanonewithoutcapture,andmuchhigherthanapulverized-coalsingle-cycleplant.The estimatedlevelizedcostofelectricitywouldincreaseby10–20%comparedtoacoalgasification plantwithoutCO2 capture,and20–30%comparedtoapulverized-coalplantwithfluegasdesulfurization.TheincrementalcostdoesnotincludethecostoftransportingandsequesteringofCO2, whichmayaddanother10–20%tothecostofelectricityovertheno-captureplant.
Carbondioxideissolubleinsomesolvents,notablyethanolamines;e.g.,monoethanolamine(MEA). Absorption–desorptionisareversibleprocess;absorptionproceedsatlowtemperatures,whereas desorptionoccursatelevatedtemperatures:
AflowsheetoftheMEAprocessisshowninFigure10.10.Thekeyprocessunitsarethe absorptiontowerandtheregeneration(stripper)tower.Theabsorptiontoweroperatesat40–65 ◦C, whichmeansthattheincomingfluegasmustbecooledbeforeenteringthetower.SomepressurizationofCO2 isnecessarytoovercomethepressuredropinthetower.Theregenerationtower operatesat100–120 ◦C,whichisthemajorsourceofefficiencylossforthepowerplantthat usesthismethod.Thereboilerprovidestheheatfortheregenerationtowerandforvaporizing water.
SolventabsorptionhasbeenusedfordecadesforproducingCO2 fromfluegas.Theproduced CO2 isusedfordryicemanufacturingandforcarbonateddrinks,anditisusedinlargequantities forenhancedoilrecoveryatsemi-depletedoilreservoirswheretheinjectionofhigh-pressureCO2 intothereservoirhelpstobringforthmoreoiltothesurface.However,foralltheseuses,CO2 is capturedfromthefluegasof naturalgas combustion.Thereasonisthatcoalandoilcombustion producecopiousquantitiesofSO2,NOx,andothercontaminantsthat“poison”thesolvent.Ifcoal oroilwereusedasthesourceofCO2,thefluegaswouldhavetobethoroughlypurifiedbefore enteringtheabsorptiontower,orthecoalwouldhavetobegasifiedbeforecombustion.
ThethermalefficiencyofacoalgasificationcombinedcyclepowerplantwithCO2 capture byMEAis30–35%comparedto40–45%withoutcapture,andthecostincrementofelectricity productionisaround50%.Thus,thismethodislessefficientandcostlierthanestimatedforair separation–CO2 recycling,butthetechnologyiswellestablished,whereastheoxygencombustion technologyisstillinthedevelopmentstage.
Gasseparationbymembranesreliesonthedifferentpermeationratesofgasesthroughthemembrane pores.Hydrogen,inparticular,becauseofitssmallmolecularsize,permeatesfasterthananyother gasthroughsmallpores.Polymermembranesarebeingusedcommerciallyinrecoveryofhydrogen fromapurgestreaminammoniasynthesis,methanolsynthesis,andoilrefineries.Typicalmembrane examplesarepolysulfone/silicon,celluloseacetate,polyphenyleneoxide,polyalkene,polyimide, polydimethylsiloxane,andpolyetherimide.
ThemembranemethodcouldbeusedforcapturingCO2 fromamixtureofCO2 andH2,which istheproductofcoalgasificationandthewatershiftreaction(seeSection5.3.2).Thisgasmixture issubjectedtomembraneseparation.Thehydrogenpermeatesmuchfasterthroughamembrane thandoesCO2,andonlyafewstagesofmembraneseparationwouldbenecessaryforalmost100% separationofthegases.TheseparatedH2 canbeusedasafuelinagasturbineorinafuelcellfor powerproduction.TheseparatedCO2 wouldbecompressedandsequestered.
ThemembraneseparationmethodforcapturingCO2 isfurthestfromrealizationcomparedto theothertwomethods.Preliminaryestimatespredictathermalefficiencyofapowerplantwith coalgasificationandCO2 capturebymembraneseparationof25–30%,alongwithanincreaseof electricityproductioncostover100%comparedtocoalgasificationcombinedcyclewithoutCO2 capture.15
Aftercapture,theCO2 needstobesequesteredinareservoirforanindefiniteperiod,soitwill notreemergeintotheatmosphere.Thefollowingreservoirsarebeinginvestigated,andinsome instancesalreadyemployed,forsequesteringCO2:
• Depletedoilandgasreservoirs
• Deepocean
• Deepaquifers
Oilandgasreservoirsareusuallycoveredbyanimpenetrablelayerofrock,sothatCO2 deposited intothereservoirswouldnotreemergeintotheatmosphere.InrespecttosequesteringCO2,oiland gasreservoirsbehavedifferently.WhereasCO2 canbeinjectedintooilreservoirswhiletheoilis beingpumpedoutofit,itcanbeinjectedintogasreservoirsonlyafterdepletionofthegas(because ofthemiscibilityofCO2 andmethane).Infact,injectingCO2 intosemi-depletedoilreservoirs isawell-establishedtechnology.ItisnotdoneforsequesteringCO2,butratherforenhancedoil recovery(EOR).
Worldwidetherearesome71oilfieldswherecarbon-dioxide-enhancedoilrecovery(CO2EOR)isused.ThemajorityofthesefieldsareintheUnitedStates,inTexasandColorado,whereas othersareintheNorthSea.IntheUnitedStates,totalproductionfromCO2-EORwellsisnot largecomparedtototaloilproduction(about2%).Otheroilwellsuse“waterflooding”—thatis, pressurizedwaterinjection.Water-EORaccountsforroughly50%ofU.S.oilproduction.
ForEOR,carbondioxideisinjectedaboveitscriticalpoint(31 ◦C,73atm).Itsviscosity islowerthantheoilitdisplaces.ThismeansthatCO2 flowsmoreeasilythroughthereservoir rock,causing“fingers”oftheinjectanttomovethroughtheoilandtooccasionallybypassthe oilaltogether.Therefore,CO2 mustberecoveredatthewellheadandreinjected.Ontheaverage, 0.1–0.3standardcubicmetersofCO2 areinjectedfortherecoveryofonebarrelofoil.
IntheUnitedStates,mostoftheinjectedCO2 comesfromnaturalsources,ratherthanfrom fluegascapture.ThenaturalsourcesaresubterraneanaquiferssaturatedwithCO2.Attwofieldsin Texas,CO2 comesfromfluegascaptureusingthesolventabsorptionmethod.SupercriticalCO2 is transportedfromagas-firedpowerplantoverlandadistanceof350kmina40-cm-diameterpipe. TheexploitationofCO2 forenhancedoilrecoveryislargelydependentonthepriceofcrudeoil. Carbondioxideinjectioncostsabout$5to$8perbarrelofoilproduced,soitisonlyworthitifthe priceofcrudeoilisabove$25/bbl.
Thepotentialstoragecapacityindepletedoilandgasreservoirsisabout40Gtcarbon.This compareswithanannualworldwideemissionof6.8Gtcarbonperyear.Thus,depletedoilandgas
reservoirshavealimitedcapacityforsequesteringCO2.However,thepotentialstoragecapacity oftheworld’sprovenoilandgasfieldsisabout140Gtcarbon,assumingtheyallwillbedepleted eventually(whichwilloccurinthenot-too-distantfuture,saywithin50–100years).Theproblem withusingoilandgasreservoirsforsequesteringCO2 isnotonlythelimitedcapacity,butalso thefactthatveryfewexistinglargecoal-firedpowerplantsarewithintransportdistancetothe reservoirs.Furthermore,urban-industrialareaswherenewpowerplantsaregoingtobebuiltare usuallyfarawayfromoilandgasfields.ThetransportcostofpipingsupercriticalCO2 issignificant. Currentlyitisestimatedat$2to$7permetrictonofCO2 per250-kmdistance,dependingonpipe diameter(thelargerthediameter,thelowerthecost).Thus,a1000-MWcoal-fueledpowerplant mayhavetospendintherangeof$12to$56millionperyearfortransportingtheCO2 toadepleted oilorgasfieldthatis250kmaway.Thiscostisinadditiontothecostofcapturingandcompressing theCO2 atthepowerplant.
SequesteringCO2 indepletedandsemi-depletedoilandgasreservoirscanplayarolein mitigatingglobalwarming,albeitonalimitedscaleandataneconomiccostthatcouldnotbe recoveredfromthepriceofelectricitypresentlychargedtocustomers.
TheoceanisanaturalrepositoryforCO2.Theoceanisvast:Itcoversabout70%oftheearth’s surface,andtheaveragedepthis3800m.ThereisacontinuousexchangeofCO2 betweenthe atmosphereandtheocean.WehaveseeninSection10.4.1thattheoceanabsorbsabout92Gty 1 ofcarbonfromtheatmosphere,whileitoutgassesintotheatmosphereabout90Gty 1.Thus,the oceanisanetabsorberofcarbon,whichprobablyispartofthereasonthatCO2 concentrations intheatmospheredonotincreaseasfastasexpectedfromanthropogenicemissions.Mostofthe ocean–atmospherecarbonexchangeoccurswithinthesurfacelayeroftheocean,whichisonthe averageabout100mdeep.ThislayerismoreorlesssaturatedwithCO2.Between100-and1000-m depththetemperatureoftheoceanissteadilydeclining(theso-called thermocline).Beneathabout 1000mdepth,thetemperatureisnearlyconstant,between2 ◦Cand4 ◦C,andthedensityincreases slightlybecauseofhydrostaticpressure.Thismakesthedeeperlayersoftheoceanverystable; andthe“turnover”time—thatis,thetimeittakesforthedeeplayerstoexchangewaterswiththe surfacelayer—islong,ontheorderofhundredstothousandsofyears.
Thedeeplayersoftheocean,1000mordeeper,arehighlyunsaturatedinregardtoCO2 TheabsorptivecapacityofthedeepoceanisestimatedontheorderofE(19)tonsofcarbon,so conceivablyallthecarbonresidinginfossilfuelsonearthcouldbeaccommodatedthere,without reachingevennearthesaturationlimit.BecauseCO2 emittedintotheatmosphereeventuallywill windupinthedeepocean,anartificialinjectionofCO2 atdepthwouldmerelyshort-circuitthe naturalcyclethattakeshundredstothousandsofyears.
CarbonbalancemodelspredictthattheatmosphericconcentrationsofCO2 willincreasemore orlessinproportiontotheamountoffossilfuelcombustion.Peakconcentrationswilloccur somewhereinthetwenty-thirdcentury,afterwhichtheywillslowlydeclinebecause(a)mankind willrunoutoffossilfuelsand(b)theoceanwillslowlyabsorbtheexcessCO2 thatbuiltupin theatmosphere.Inabouta1000years,anewequilibriumwillbereachedwithatmosphericCO2 concentrationsslightlyhigherthantoday.ThepurposeofdeepoceaninjectionofCO2 istoshave offthatpeakthatwouldbebuildingupinthenext200–300years.Figure10.11showshowthe peakcouldbeminimizedbyinjectingincrementalamountsofCO2 intothedeepocean.
AninjectionofCO2 at1000mordeeperisdeemednecessarynotonlybecausethedeep layersareunsaturatedwithregardtoCO2,butalsoonaccountofthephysicalpropertiesofCO2
Ifinjectedat500morless,liquidCO2 wouldimmediatelyflashintogaseousCO2 andbubbleup tothesurface.Between500and3000mtheliquidCO2 injectedfromadiffuserattheendofa pipewoulddisintegrateintodropletsofvariousdiameters,dependingonhydrostaticpressureof theliquidCO2 andthereleaseorifices’diameter.BecauseatthesedepthsthedensityofliquidCO2 islessthanthatofseawater,thedropletswouldascendduetobuoyancyandmayreachthe500-m level,wheretheywouldflashintogaseousCO2.Itisestimatedthataminimuminjectiondepthof 1000mandamaximuminitialCO2 dropletdiameterof1cmwouldbenecessaryforcomplete dissolutioninseawateroftheascendingCO2 dropletsbeforetheyreachadepthof500m,where theywouldflashintogaseousbubbles.Beneathabout3000m,liquidCO2 becomesdenserthan seawater,sotheinjecteddropletswouldsinktotheoceanbottom.
AnotherfeatureofCO2 isthatitformsaclathrate,alsocalledhydrate.Atahydrostaticpressure ofabout50atm(correspondingtoadepthofabout500m)andtemperaturesbelow10 ◦C,asolid CO2 hydrateisformed,thecrystallinestructureofwhichcontainsoneCO2 moleculesurrounded by5–7H2OmoleculestiedtoCO2 byhydrogenbonds.Laboratoryandpilot-scalereleasesofCO2 inthedeepoceanconfirmtheformationofCO2 hydrate.Atthistimeitisnotclearwhetherhydrate formationisgoodorbadforCO2 sequestration.Ifthehydratecrystalswereheavierthanseawater, theywouldsinktogreaterdepthfromthereleasepoint,therebyincreasingthesequestrationperiod. IfthehydratecrystalsweretooccludeliquidorgaseousCO2,theywouldascendbybuoyancyand wouldhinderthedissolutionofthereleasedCO2 inseawater.Thehydratesmayalsoclogupthe releasepipeanddiffuser.Furtherpilot-scalereleasesareplannedatvariousdepthstoascertainthe optimumdepthandreleaseconfigurationbeforelarge-scaleinjectionofCO2 inthedeepoceanis tobeimplemented.
Thelayingoflarge-diameterpipesonthecontinentalshelfreachingto1000-mdepthisa formidabletask,butpipeshavebeenlaidtooff-shoreoilwellsatsuchdepthsintheGulfof Mexico,theNorthSea,andelsewhere.Thecostofsuchpipelinesisestimatedbetween$1and$2 millionperkilometerlength.Therefore,itisdesirabletoreachdepthsof1000mormoreasclose
totheshoreaspossible.Potentialsitesareasfollows:
Americas
• HudsonCanyon,DelawareCanyon,andHatterasCanyon
• MississippiCanyon
• BajaCaliforniaTrench,MontereyCanyon,andColumbiaRiverCanyon
• SeveralcanyonsalongthecoastofMexicotowardtheGulfofMexicoandthePacific
• AlongthewestandeastcoastsofSouthAmerica
Europe
• OutflowoftheMediterraneanSeaatGibraltar
• CanyonsalongthecoastofPortugalandtheBayofBiscayne
• CoastofNorway
• FromwesternScotlandandIrelandovertheHebridianShelfintoseveralcanyons Asia,Australia,andOceania
• SeveralcanyonsfromthecoastofIndiaintotheArabianSeaandBayofBengal
• SeveralcanyonsfromthecoastofChinaintotheSouthChinaSea
• Japanissurroundedwiththedeepesttrenchesintheworld
• CanyonsleadingtotheJapanAbyssalPlainfromKoreaandeasternSiberia
• CanyonsalongthesoutheasterncoastofAustralia
• TrenchesalongthePhilippineandIndonesianislands
Altogethertheaccesstothedeeperlayersoftheoceanfromindustrial-urbanizedcontinentsis quitelimited.Forexample,theindustrialcountriesofcentralandeasternEuropearetoofarfrom thedeepocean.Becauseoverlandpipelineswouldbeevenmoreexpensivetolaythanunderwater pipes,itisunlikelythatpowerplantsinthosecountrieswouldutilizeoceansequestration.The sameistrueforpowerplantsinthemidwesternUnitedStatesandcentralCanada.Itisconceivable, though,thatnewpowerplantswillbebuiltalongthecoastsofcontinentswhereaccessisavailable tothedeepocean.Fromtheseplants, electricity canbetransmitteddeeperintothecontinents, becauseitischeapertotransmitelectricityincablesthantotransport carbondioxide inpipes overland.Nevertheless,thedeepoceanwillbeaccessibletoonlyalimitednumberofpowerplants; therefore,oceansequestrationcanbeonlyoneofseveraloptionstobeemployedintheamelioration ofthegreenhouseeffect.
Apartfromthetechnicalandgeographicalproblems,thereisaconcernabouttheenvironmental impactofdeepseasequestrationofCO2.EventhoughCO2 isnottoxic,large-scaleinjectionof CO2 intothedeepoceanwouldcreatelocalizedregionsofhighcarbonicacidconcentrations.Itis estimatedthatthedischargeofCO2 fromten500-MWcoal-firedpowerplantswillcreateavolume of100km3 inwhichthepHislessthan7.Inthatvolume,fishandothercreaturesmusteither escapeordie.However,theimpactedregionswouldbeminusculeincomparisontotheworld’s oceanvolume.Nevertheless,thereisageneralpublicoppositiontodisposingofanythinginthe ocean,soitisnotclearwhetheraninternationalagreementonoceansequestrationofCO2 canbe forged.
Deepaquifersmayunderlayvastareasunderthecontinentsandoceans.Suchaquifersusually containsalinewater(brine)andareseparatedfromshalloweraquifers—thesourceofmuchofthe drinkingwater—byimpermeablerock.Thedeepaquifersthemselvesconsistofpermeable,porous rock,suchassedimentaryshale-,lime-,orsandstone,theporesofwhicharesaturatedwithbrine. Suchaquifersarefoundatdepthsof800mordeeper.TheinjectedCO2 (inliquidorsupercritical phase)woulddissolveinthebrineascarbonicacid.Inthecaseoflimestoneformation,someof thecarbonate(CO2 3 )woulddissolveintobicarbonate(HCO3 ),furtheringtheabsorptioncapacity ofthereservoirandreducingtheriskofleakage.
ThereislimitedinformationavailableontheextentandCO2 absorptioncapacityofdeep aquifers.IntheUnitedStates,thestoragecapacityofsubterraneanaquifersrangesfrom5to500Gt carbon(comparedtoannualemissionratesfrompowerplantsof1.7Gty 1 ofcarbon).Other estimatesforworldwidecapacitiesrangefrom100to3000Gtcarbon.Theproblemwithdeep aquifersisnotsomuchtheircapacity,buttheirlocationvis-`a-vispowerplants,thedifficultyof drillinglargediameterpipesintotheoverlayingstrata,thecostofcompressingandpumpingliquid CO2 intothepipes,andconstructinganappropriatediffuserattheendofthepipe,sothatCO2 dispersesthroughouttheaquiferwithoutleakingthroughpossiblepermeableoverlayformations.16 Intensiveresearchisongoingtoestablishingthelocationandcapacityofthedeepaquifersfor potentialsequestrationofCO2 inthem.
OneofthesuboceanflooraquifershasbeenusedforCO2 disposalsince1996.AttheSleipner gasfieldsintheNorthSeaoffthecoastofNorway,naturalgascontains9.5%byvolumeCO2.The CO2 isseparatedbyMEAabsorption,compressedandinjectedintotheUtsiraunderseaaquiferata rateof1Mty 1.Thecostoftheinjectionisabout$15pertonCO2,whichcomparesfavorablywith ataxof$50pertonofCO2 thatthegovernmentofNorwaywouldlevyiftheCO2 wereemitted intotheatmosphere.AnotherplanforunderseaaquiferinjectionexistsfortheNatunagasfieldoff thecoastofBorneoinIndonesia,wherenaturalgascontainsabout70%byvolumeofCO2.
InSection10.4.4.1wediscussedtheuseoffluegasCO2 forenhancedoilorgasrecovery.Other useswouldbefordryicemanufacturing,forcarbonateddrinks,andasarawmaterialforchemical products,suchasurea,methanol,orotheroxygenatedfuels.Theproblemwithsuchpropositions istwofold:(a)mostofthecarbonintheproductwouldeventuallyburnupordecomposeback toCO2 andwouldwindupintheatmosphere;(b)thereductionofCO2 intotheusefulproduct requiresvirtuallythesameamountofenergyaswasgivenoffwhencarbonoxidizedintoCO2.Also, thepresentmarketforchemicalproductsthatcouldbebasedonCO2 isquitelimited,amounting perhapstolessthan50–70Mty 1,whereastheemissionofCO2 fromasingle1000-MWcoal-fired powerplantamountsto6–8Mty 1 .
LetustaketheexampleofconvertingCO2 tomethanol:
where(g)meansgaseousphaseand(l)meansliquidphase.Theminussignindicatesthatenergyis liberated;thatis,thereactionisexothermic,with171kJevolvedpermoleofCO2 reacted.However, thereactionaswrittenrequiresthreemolesofhydrogenforeachmoleofCO2 toproduceonemole ofCH3OH(l).Theproductionofonemoleofhydrogenfromdissociationofwaterrequires286kJ ofenergy;threemolesrequire858kJ.Thus,theenergybalanceofequation(10.6)isactually negative,requiring687kJmol 1 CH3OHproduced.TheproductionofmethanolfromCO2 andH2 wouldonlymakesenseifthathydrogenwerederivedfromnonfossilenergy,suchassolar(e.g., photodissociationofwater)ornuclear(e.g.,electrolysisofwaterusingnuclearelectricity).Evenif hydrogenisderivedfromnonfossilsources,thequestioniswhetheritshouldnotbeutilizeddirectly, suchasinfuelcells,ratherthanproducingmethanol.Furthermore,whenmethanolisburnedina heatengine,carbonisreoxidizedtoCO2,andnothinghasbeengainedintermsofglobalwarming mitigation.
AnotherexampleistheproductionofureafromCO2.Ureaisanimportantindustrialchemical, becauseitisusedinchemicalfertilizers,inpolyurethanefoamproduction,andasanintermediate inahostofotherchemicals.Theproductionofureacanbewritteninthefollowingsimplified reaction:
where(s)meanssolidphase.Thisreactionishighlyendothermic,with632kJofenergyrequired permoleofsolidureaproduced,includingthe858kJofenergynecessaryfortheproductionofthree molesofhydrogen.Thisexampleshowsagainthatunlesshydrogenisproducedfromnonfossil energysources,theutilizationofCO2 forconvertingtootherchemicalsmakesnosense.
NatureusesCO2 asarawmaterialforproducingbiomassbymeansofphotosynthesis:
where hν representsasolarphoton,andCn (H2O)m isabasicbuildingblockofbiomass.This reactionisendothermic;itrequires570.5kJofenergypermoleofCH2O(s)produced.Thatenergy comesfromthesun.Allthevegetationandphytoplanktonintheworldarebasedonreaction(10.8). Becauseplantsandplanktonsareatthebottomofthefoodchain,allanimalsandmankindare dependentonreaction(10.8)fortheirsustenance.Infact,allfossilfuelswerecreatedovertheeons bygeochemicalconversionofbiomasstocoal,oilandnaturalgas.
TheutilizationofbiomassforfuelinboilersorheatenginesisCO2 neutral.Everycarbon atomburntorutilizedfrombiomassisreabsorbedinthenextgenerationofplantsorplanktons. TheutilizationofbiomassasarenewableenergysourceisdiscussedinSection7.3.
Hereweshouldalsomentionthatfosteringbiomassgrowthwithoutitsutilizationwouldhave apositiveeffectonreducingCO2 concentrationsintheatmosphere.Itisestimatedthattypical coniferousandtropicalforestsabsorbbetween6and10metrictonsofcarbonperhectareperyear (tCha 1 y 1).Plantingnewforests,withoutusingthewooduntilatmosphericCO2 concentrations starttodeclinebecauseofdepletionoffossilfuelsorotherCO2 emissionabatementmeasures,would absorbpartoftheanthropogenicemissionsofCO2 duetothephotosynthesisreaction(10.8).Indeed, theKyotoConventionof1997andthesubsequentBuenosAiresConferencein1998envisaged thatpartofthegreenhouseeffectmitigationeffortswillcomebyafforestation.LargeCO2-emitting countriesareencouragedtoreduceglobalconcentrationsofCO2 byinvestinginothercountries
(mostlytropical,less-developedcountries)toplantnewtrees.Theemittingcountrieswouldobtain creditforCO2 emissionreductionsequivalenttotheamountofCO2 absorbedbythenewtrees. Thisiscalledemissiontrading.Theexactaccountingproceduresforsuchemissiontradinghave notyetbeenestablished.
Finally,onemustnotethatdeforestationhastheoppositeeffect.Everyhectareclearedof forestswillreducetheabsorptionofCO2 by6–10tCha 1 y 1.Andifthetreesareburned,as itisstillwidelypracticedintropicalcountriesoftheworld,thereisadoubleeffect:cessationof absorptionofCO2 andemissionofCO2 duetowoodburning.Itisestimatedthatforestburning aloneaddsabout1.5Gty 1 ofcarbontotheatmosphere.
ItgoesalmostwithoutsayingthattheCO2-causedclimatewarmingcanbeamelioratedbyshifting tononfossilenergysources.Intheprevioussectionwehaveseenthatashifttobiomasswouldbeat leastCO2 neutral;thatis,asmuchCO2 beingemittedintotheatmospherefrombiomassusewillbe reabsorbedinfuturegrowthoftreesandplantsthatproducethebiomass.Shifttononcarbonenergy sourceseliminatesCO2 emissionscompletely,exceptperhapsforthefossilenergy(mainlycoal) usedinsmeltingsteelandotherconstructionmaterialsusedinthenonfossilenergyconversion devices.
InSection2.3wehaveseenthatworldwideenergyconsumptionissuppliedbythefollowing sources:86%fossil,6.5%nuclear,and7.5%renewables,withthelatteralmostentirelyhydroenergy.Becauseashifttonuclearenergyappearsfortheforeseeablefutureunacceptabletothepublic andbodypoliticinmostcountries,theonlyrecoursewouldbeashifttorenewables.
Amongtherenewables,hydroenergyalsoappearstorunintopublicopposition.17 Thus,all expectationsareturnedtowardsolar,wind,geothermal,andoceanenergy.Thesetechnologies aredescribedindetailinChapter7.Theirsubstitutionforfossilenergyismostlydependenton economics.Theirsliceoftheenergypiewillonlyincreaseifthecostofrenewableenergyconversion devicesbecomescheaper,orthepriceoffossilenergybecomesgreater.
Globalwarmingiscausedbyincreasingconcentrationsoffar-infraredabsorbinggases,called greenhousegases(GHG),includingCO2,CH4,CFCs,N2O,andO3.Mostofthesegasesareof anthropogenicorigin,primarilyassociatedwithfossilfuelusage.Watervaporisalsoagreenhouse gas,butofcourseitisofnaturalorigin,althoughtheglobalhydrogeologiccyclemaybealteredto somedegreebyanthropogenicactivities.
ThepresenceofGHGintheloweratmospherecausestheoutgoingterrestrialfar-infrared radiationtobeabsorbedandpartiallyreradiatedtowardtheearth’ssurface.Thisradiationincreases theearth’ssurfacetemperature.Thereissubstantialevidencethattheaverageearth’ssurface temperaturealreadyhasincreasedbyabout0.5–1.0 ◦Csincethemiddleofthenineteenthcentury, andbytheendofthetwenty-firstcenturythesurfacetemperaturemayrisebyanother2–3 ◦C.This
17Note,forexample,thenationalandinternationalcriticismthatisaimedatthegovernmentofChinaforthe constructionofthe18-GWhydroelectricprojectontheYangtzeRiverattheThreeGorgesDam.
temperaturerisemaycauseassociatedclimaticeffects,suchaschangeinprecipitationpatterns, morefrequentandextensivetropicalstorms,glacierandice-sheetmelting,ocean–atmosphere interactionvariability,andariseinsealevel.
Globalwarmingcouldbeamelioratedbyslowing,orevenreversing,thetrendofGHGconcentrationincreasesintheatmospherebyreducingtheiremissions.Inthischapterwediscussedthe possibleoptionsforreducingCO2 emissions,thegasthatbearsthebulkofthegreenhouseeffect. Theoptionsincludethefollowing:
• Demand-sideconservationandefficiencyimprovements,includinglessspaceheatingand betterinsulation,lessairconditioning,fluorescentlighting,moreenergy-efficientappliances, processmodificationinindustry,and,veryimportantly,morefuel-efficientautomobiles. Suchmeasuresmayevenincuranegativecost(i.e.,consumersavingsbyusinglessenergy) oratleastarapidpaybackperiodfortheinvestmentinenergy-savingdevices.
• Supply-sideefficiencymeasures.Herewemeanprimarilyincreasingtheefficiencyofcoalfiredpowerplants.Coalgasificationcombined-cyclepowerplantshaveathermalefficiency inthe45–50%range,comparedwithsingle-cyclepulverized-coalplantsinthe35–40% range.However,coalgasificationpowerplantsaremoreexpensivethansingle-cycleplants.
• CaptureofCO2 fromthefluegasofpowerplantsandsequestrationinterrestrialordeep oceanreservoirs.Thisisanexpensiveoption,anditwillbeexercisedonlyifgovernments mandateorsubsidizeit.
• UtilizationofthecapturedCO2.Theutilizationforenhancedoilandnaturalgasrecoveryis economicallyattractive;theutilizationofCO2 asarawmaterialfortheproductionofsome fuelsandchemicalsrequiresextraenergyinputanddoesnotappeartobeeconomical.
• Shifttononfossilenergysources.Thechoiceshereareagonizing,becausethelargestimpact couldbemadebyshiftingtonuclearelectricityandhydroelectricity,bothpresentlyvery unpopularandfraughtwithenvironmentalandhealthconcerns.Theshifttosolar,wind, geothermal,andoceanenergyarepopular,butbecauseoftheirlimitedavailabilityand intermittencyandbecauseoftheirlargercostcomparedtofossilenergy,asubstantialshift totheseenergysourcescannotbeexpectedinthenearfuture.
• Greateruseofbiomass,especiallywood.TheuseofbiomassisCO2 neutral,becauseas muchCO2 thatevolvesinburningbiomassisreabsorbedinthegrowthofthenextgeneration ofvegetation.
• Afforestationwithoutusingthetreesfor100–200years,duringwhichperiodtheCO2 concentrationsintheatmospherewilldeclinebecauseofexhaustionoffossilfuelresources andshifttononfossilenergysources.
• Stoppingslashandburningpracticesofforests,especiallytropicalforests,whichareprodigiousabsorbentsofCO2,andtheburningofwhichreleasesCO2
Noneoftheseoptionscanameliorateglobalwarmingbyitself.Theyhavetobetakenin combinationandonanincrementalbasis,startingwiththeleastexpensiveonesandprogressing tothemoreexpensiveones.Evenifthepredictionsofglobalclimatechangeweretoturnoutto beexaggerated,thefactthatfossilfuelusageentailsmanyotheradverseenvironmentalandhealth effects,andthecertaintythatfossilfuelresourcesarefinite,makesitimperativethatwecurtail fossilenergyusageassoonaspossible.
Problem10.1
Calculatetheearth’sradiativetemperature(K)foralbedos α = 0 27,0.3,and0.33,assumingthe solarconstantisnotchanging.
Problem10.2
Calculatetheradiativetemperatures(K)oftheplanetsMarsandVenus,giventheirsolarconstants S0 = 589and2613Wm 2,respectively,andtheiralbedos α = 0 15and0.75,respectively.
Problem10.3
GiventheglobalsurfacetemperaturefluctuationsshowninFigure10.6,useastatisticalprogram toplotabest-fitcurvethroughthedata.Accordingtothisbest-fitcurve,byhowmuchdidthe temperature(◦C)increasefrom1860to2000?
Problem10.4
ThevolumefractionofCO2 intheatmosphereis370ppmV.Whatisthecarboncontent(Gt)of theatmosphereifCO2 istheonlycarrierofcarbon?(Theradiusoftheearthis6371km,andthe atmosphericmassperunitsurfaceareais1.033E(4)kgm 2.)
Problem10.5
GiventheCO2 concentrationsasshowninFigure10.8,calculatetherateofincrease(%/y)of thoseconcentrationsintheyears1960–2000.Useanenlargementofthe1960–2000segmentof Figure10.8,orpreferablythedataavailableontheinternetfromCDIAC,OakRidgeNational Laboratory.Useanexponential,notlinear,growth.
Problem10.6
ThepresentconcentrationsofCO2 andCH4 are370and1.7ppmV,respectively.Theformergrows by0.4%/y,thelatterby0.6%/y.Whatwillbetheconcentrations(ppmV)ofthesegasesin2100? Useexponential,notlinear,growth.
Problem10.7
A1000-MW(el)powerplantworkingat35%thermalefficiency100%ofthetime(baseload)uses coalwithaformulaC1H1 andaheatingvalueof30MJ/kg.HowmuchCO2 doesthisplantemit (metrictons/y)?
Problem10.8
ThisplantsubstitutesNG(formulaCH4)insteadofcoal,withaheatingvalueof50MJ/kg,ina combinedcyclemodehavingathermalefficiencyof45%.(a)HowmuchNG(m3/yatSTP)is consumed?(b)HowmuchCO2 (t/y)isemitted?
Problem10.9
InordertoamelioratetheCO2 causedgreenhouseeffect,apowerplantisbuiltthatenablesthe captureofCO2 fromthefluegas.Theplantrunsonpuremethaneandoxygen,sothefluegas consistsonlyofCO2 andH2O:
CH4 + 2O2 → CO2 + 2H2O 0.244kWh(th)/moleCH4
wheretheminussignmeansthattheprocessisexothermic;thatis,energyisevolved.Theplantmust produceitsownO2.Fromoxygensuppliersweknowthattheenergyrequirementforairseparation is250kWh(electric)permetrictonofO2.Anequalamountofelectricenergyisrequiredfor liquefactionof1metrictonofCO2.Theplanthasagrossthermalefficiency ηgross = 0 45(that is,thermalefficiencycalculatedbeforeelectricityissyphonedoffforO2 productionandCO2 liquefaction).(a)Whatpercentageoftheplant’selectricityoutputisavailablefordispatchintothe grid?(b)Whatisthenetthermalefficiency(electricityoutputperheatinputafterO2 production andCO2 liquefaction)?
Brown,M.A.,M.D.Levine,J.P.Romm,A.H.Rosenfeld,andJ.G.Koomey,1998.Engineering–Economic StudiesofEnergyTechnologiestoReduceGreenhouseGasEmissions:OpportunitiesandChallenges. Annu.Rev.EnergyEnviron., 23, 287–387.
Eliasson,B.,P.W.F.Riemer,andA.Wokaun,Eds.,1999. GreenhouseGasControlTechnologies. Amsterdam: PergamonPress.
Herzog,H.,D.Golomb,andS.Zemba,1991. Feasibility,ModelingandEconomicsofSequesteringPower PlantCO2 EmissionsintheDeepOcean.Environ.Prog., 10, 64–74.
Houghton,J.T.,1997. GlobalWarming.Cambridge:CambridgeUniversityPress.
Mahlman,J.D.,1998.ScienceandNonscienceConcerningHuman-CausedClimateWarming. Annu.Rev. EnergyEnviron., 23, 83–107.
Matthai,C.V.,andG.Stensland,Eds.,1994. GlobalClimateChange:Science,PolicyandMitigationStrategies. Pittsburgh:AirandWasteManagementAssociation.
Mitchell,J.F.B.,1989.TheGreenhouseEffectandClimateChange. Rev.Geophys., 27, 115–139.
Omerod,B.,1994. TheDisposalofCO2 fromFossilFiredPowerStations. Cheltenham:IEAPublications.
Ramanathan,V.,andJ.A.Coakley,1978.ClimateModelingthroughRadiative-ConvectiveModels. Rev. Geophys.SpacePhys., 16, 465–490.
Riemer,P.,1993. TheCaptureofCO2 fromFossilFiredPowerStations. Cheltenham:IEAPublications.
Schneider,S.H.,1989.TheGreenhouseEffect:ScienceandPolicy. Science, 243, 771–781.
Atthebeginningofthisbookwereviewedtheenergyresourcesavailabletomankindandthe usesoftheseresourcesinthevariouscountriesoftheworld;insubsequentchaptersweoutlined theenvironmentaleffectsassociatedwithenergyuse.Thesupplyanduseofenergyhasother importantconsequences:economicandpolitical.Energyisanecessaryandsignificantfactorof nationaleconomies;energyexpendituresamountto5–10%oftheGDPinindustrializednations. Theavailabilityofadequateenergytoenterprisesandindividualsisanationalgoalandisthereby affectedbygovernmentalpolicies.
Amongfossilenergyresources,coalappearstobeavailableinabundanceforatleasttwo tothreecenturies,whilethefluidfossilfuels,petroleumandnaturalgas,maylastforlessthana century.Theavailabilityoffluidfuelresourcescanbeextendedbymanufacturingthemfromcoal bycoalgasificationandliquefaction.(Themanufacturedfluidfuelsarecalledsynfuels.)Fluidfuels canalsobeobtainedfromunconventionalresources,suchasoilshale,tarsands,geopressurized methane,coalseammethane,andmethanehydrateslyingonthebottomoftheoceansandunderthe icecaps.Themanufactureofsynfuelsandtheexploitationofunconventionalfossilfuelresources willbemoreexpensivethantheexploitationofprovenreserves,andthemanufacturingandrecovery processeswillentailmoresevereenvironmentaleffectsthanthoseassociatedwithexploitationof conventionalreserves.
Electricityisanessentialenergycomponentofmodernindustrializedsocieties;itsuseis increasingworldwide.Electricityisasecondaryformofenergy;ithastobegeneratedfromprimary energysources.Presentlyabouttwo-thirdsoftheworld’selectricityisgeneratedfromfossilfuels whiletheotherthirdcomesfromhydroenergyandnuclearenergy,withveryminorcontributions fromwind,biomass,andgeothermalsources.
In1997,about17%oftheworld’selectricityand6.3%ofitsenergywassuppliedbynuclear powerplants.Theglobalresourcesoftherawmaterialfornuclearpowerplants—uraniumand thorium—wouldlastcenturies,atcurrentusagerates.Theseresourcescanbeextendedevenfurther intheso-calledbreederreactors,whereartificialfissileisotopescanbegeneratedfromnatural uraniumandthorium.Nuclearpowerplantsaremuchmorecomplexandexpensivetobuildand operatethanfossil-fueledplants.Also,therealandperceivedhazardsofnuclearpowerplants, includingtherisksoftheentirenuclearfuelcycle,fromminingtorefiningtoradioactivewaste disposal,militatesagainstbuildingnewnuclearpowerplantsinmanycountries.However,with depletingfossilfuelresourcesandtheassociatedenvironmentalrisksoffossil-fueledpowerplants, notablyglobalwarmingduetoCO2 emissions,itislikelythatinthefuturenuclearpowerwill againassumeasubstantialshareoftheworld’selectricitygeneration.
Hydropowerisarelativelycleansourceofelectricity,butmostofthehigh-gradientriversand streamsthatarenearpopulationcentershavealreadybeendammedupforpoweringtheturboelectric generators.Dammingupmoreriversisencounteringincreasingpublicresistance,becauseoftherisk tothewatershedecologyandbecauseitmayentailmassivepopulationdisplacement.Whileseveral newhydroelectricpowergeneratorsarebeingbuiltorplanned,notablythe18-GWhydroelectric stationontheYangtzeRiver,hydropowerisnotexpectedtoincreaseitssharesubstantiallyamong othersourcesofelectricity.
Otherrenewableenergysources,besideshydropower,holdthepromiseofoccupyinganincreasingshareamongelectricitygenerators.Renewablesourcesarebiomass,geothermal,wind, solarthermalandthermalelectric,photovoltaic,andoceantidalenergy.Biomassandgeothermal plantsareabletosupplyelectricpowerdependablyonadailyandannualbasis.Theothersources ofrenewableenergyhavediurnalandseasonalrhythmsthatdonotnecessarilymatchthedemand forelectricpower.Becauseelectricitycannotbedirectlystored,therenewablegeneratorsusually needtobebackedupbyconventionalpowersources.However,whenproducingelectricity,the renewablesourcescandisplacefossilfuelconsumptionandreduceairpollutantemissions.Renewableelectricitygeneratorsrequireagreatercapitalinvestmentthanfossilpowerplantsandare currentlynoteconomicallycompetitivewiththesepowerplants.
Mitigatingtheadverseenvironmentaleffectsofenergyusehasbeenachronicproblemafflicting nationsworldwide,becausenationaleconomiesdonotautomaticallyrespondtolimitenvironmental degradation.
Economistslabelthereleaseofpollutantsintotheenvironmentasanexternality,anactivity thatdoesnotenterintothecostofproductionofagoodorsupplyofaservice.Thecapacityofthe environmenttotoleratethedischargeofpollutantsisconsideredafreegood;thepolluterpaysno priceforitsuse.Buttheenvironmentalcapacitytoendurepollutionisfinite,andthecumulative effectsofpollutionfrommanysourcesdegradesitsquality,adverselyaffectingtheinterestsof societyasawholetoamuchgreaterextentthantheinterestsofoneorevenallthepolluters. Althoughthetotalsocialcostofbearingtheilleffectsofpollutionoutweighsthecostofeliminating thepollution,thepollutersshareofthesesocialcostsaretoosmalltooffsethisabatementcost,so thatabatementisuneconomicforeachpolluter,bothindividuallyandcollectively.
Acommonsolutiontothissocialandeconomicdilemmaisgovernmentregulationofpollutant producingactivities.Mostoftenthistakestheformofaperformancerequirement,suchasastandard ofmaximumemissionsperfuelinputfromenergyusingsources,orarequirementthatcertain pollutionreductiontechnologiesbeemployed.Lessoften,economicincentivestoabatementare used,suchasemissiontaxes,pollutantfines,ortaxdeductionsandcredits.Exceptforthecase ofdeductionsandcredits,thecostofabatementisbornebythepolluter,therebyinternalizingthe externalityofpollutionintotheproductionprocess.
Inalmostallcasesofpollutionofair,water,orsoil,theamountsoftoxicpollutantsemittedare onlyatinyfractionofthefuelburnedormaterialprocessed.Ingeneral,thecostofreducingordinary pollutantemissionsisonlyasmallfractionoftheeconomicvalueaddedtotheproductionprocess, butthecostperunitofpollutionremovedisoftenveryhigh,inevitablyhigherthananypossible
economicuseofthesequesteredpollutant.Itisexceedinglyrarethatanypollutant-producing processpaysforitself.
Thegoalofenvironmentalregulationistoachievesocialandenvironmentalgainsthataccrue tosocietyasawholebyregulatingtheactivitiesofpollutingenterpriseswithoutsubstantially vitiatingtheirsocietalbenefits.Theroleoftechnologyinthiseffortistoprovidetheleastcostly waytoachievethisgoal.IntheUnitedStates,forexample,theresponsibilityforprotectingthe publichealthandwelfarefromharmfulsubstancesintheenvironmentthatareofanthropogenic originislodgedwiththeEnvironmentalProtectionAgency(EPA).TheregulatorypoweroftheEPA isembodiedinaseriesoflegislativeactssettingforththeactivitiestoberegulated,therequirement forpromulgationofregulations,andtheirenforcementinfederalcourts.Frequently,legislation isquitespecificconcerninghowactivitiesaretoberegulatedandalsoconcerningtimetablesfor achievingprogress.Ingeneral,thelegislationrequiresnobalancingofcostsandbenefits;the economiccostsofabatingpollutionaretobepaidbythepolluters,notthegovernment,butfunds havebeenappropriatedtohelplocalmunicipalitiesrenovatemunicipalwastetreatmentplantsand asuperfundhasbeenestablishedtocleanupabandonedtoxicwastedumps.TheEPAaccomplishes itstaskbysettingnationallyuniformstandardsforairandwaterqualityandalsofortheprocesses thatleadtotheircontamination.Forexample,theEPAhaspromulgatedNationalAmbientAir QualityStandardsforseveralprominentairpollutantsassociatedwithfuelcombustion,andithas alsopublishedemissionorprocessstandardsforthesourcesofthesepollutants.TheEPAmay requireemissionlimitsortheuseofeffectivecontroltechnologyforspecificclassesofsources, suchasstationarysources(e.g.,powerplants)andmobilesources,ormayregulatethepropertiesof fuel,especiallymotorvehiclefuel.Thesemeanshavebeeneffectiveinreducingtheenvironmental effectsofenergyusedespitethesteadygrowthintheconsumptionofenergy.
Surprisingly,increasingtheefficiencyofenergyuseplaysnodirectroleinenvironmental regulationofurbanandregionalpollutantsbecausethedegreeofabatementneededisverymuch greaterthancanbegarneredbythemodestenergyefficiencygainsthatareeconomical,whilethe costoftherequisiteabatementtechnologyismoderate.Nevertheless,thereissomeenvironmental benefitthataccruestoenergyefficiencyimprovement.Reducingelectricpowerconsumptionby increasingtheefficiencyofitsusewouldreducetheairpollutantemissionsfrompowerplants, givenanylevelofcontroltechnology.Processmodificationcouldleadtolesseruseoffossilfuels inmanufacturingofindustrialgoods.Inthecommercialandresidentialsector,fossilenergyuse, andtherebypollutionabatement,couldbeachievedbybetterinsulationinbuildings,replacing incandescentwithfluorescentlighting,andusingsolarorgeothermalspaceandwaterheating.In thetransportationsector,greatsavingscouldbeaccomplishedinfossilfuelusageandconcomitant pollutantemissionsbytravelinginsmall,lightvehiclesorusingeither(a)hybridinternalcombustionenginesandelectricmotorsforvehiclepropulsionor(b)moreefficientfuel-cell-powered electricmotors.
Theaccumulationintheatmosphereofgreenhousegases(mostlycarbondioxide,butwithnonnegligiblecontributionsfromnitrousoxide,methane,andchlorofluorocarbons),whichthreatens tocausechangesintheglobalclimateandthushaveadverseenvironmentaleffects,hasgenerated internationalconcern.Noncumulativeurbanandregionalpollution,withbutrareexceptions,has
beenseenasanationalproblemtobesolvedwithintheconstraintsofnationaleconomies.However,globalclimatechangeisclearlyaglobalenvironmentalproblemrequiringthecoordinated actionofmanynationsoverlongtimeperiods,ontheorderofacentury.Theregulatoryregime usedbyanationtocopewithenvironmentaldegradationwithinitsbordersdoesnotexistinthe internationalcommunity.Therefore,itwillbenecessarytoseekmultilateralinternationalagreementsforGHGemissioncontrolbythemajoremittingnationsifthisgrowingproblemistobe ameliorated.
Anyeffectiveprogramforlimitingtheamountofclimatechangetobeexperiencedinthe twenty-firstandsubsequentcenturiesmustnecessarilyhavesignificantimpactsonthesupplyand consumptionofenergybynationsandontheireconomies.Themagnitudeandcomprehensiveness oftheneededadjustmentstotheenergyeconomywillbemuchgreaterthanwhathasbeenrequired fordealingwithurbanandregionalpollution.Thefirststepstowardseekinginternationalagreement forclimatechangecontrolweretakeninthe1990s.Theseincludedseekinganinternationalscientific consensusontheunderstandingofclimatechangeandtheprospectiveeffectsofremedialmeasures, alongwithaplanforallocationofnationalannualemissioncapstobeimplementedwithinthefirst twodecadesofthetwenty-firstcentury.ThisconsensusresultedintheKyotoprotocolof1997, whichaimstoreduceannualglobalGHGemissionsbyanaverageof5.5%below1990levels. However,asoftheyear2000,noneoftheindustrializednationshasratifiedtheKyotoprotocol. Nevertheless,individualcountriesareassessing(a)themeasurestheymayneedtosecuresome degreeofcontrolovertheirrespectivenationalGHGemissionsand(b)thepoliciesandprocedures thatwillbestmeettheirnationalobjectivesindealingwithclimatechange.
Theemissionsofnon-CO2 greenhousegasescanbereducedwithoutresourcetoheroicmeasures.Anthropogenicmethaneemissionscanberelativelyeasilyreducedbypreventingleakage ofthegasfromgaswells,pipes,tanks,tankers,coalmines,andlandfills.However,nitrousoxide emissioncontrolismiredinuncertaintybecausewedonotfullyunderstandthesourcesofemissionofthisgas.ThemanufactureofCFCisbeingphasedoutworldwideasaconsequenceofan internationaltreaty,theMontrealConventionof1987.Unfortunately,becauseoftheirverylong lifetimesintheatmosphere,CFCwillcontributetoglobalwarmingformanydecadestocome.
Thereductionofemissionsofcarbondioxideisaproblemofadifferentkindandmagnitude thanreducingemissionsoftheotherGHGpollutants.Eighty-eightpercentoftheworld’sprimary energysourcesand63%ofelectricitygenerationcomesfromfossilfuels.ReducingCO2 emissions totheatmospheresimplymeansloweringtherateofconsumptionoffossilfuels.Burninglessfossil fuelsorreplacingthembyotherenergysourceswouldinvolvearadicalchangeinourenergysupply structure.Traditionally,populationandeconomicgrowthwasalwaysassociatedwithincreaseof fossilfuelusage,nottheinverse.Providingaburgeoningworldpopulationwithenergyandbridging theenergyconsumptioninequalitiesthatnowexistbetweendevelopedandlessdevelopednations wouldnormallyrequiremorefossilenergyconsumption,notless.Therearenoclear-cutsolutions tothisdilemma.
Inthisbookwedescribedsomeofthealternativestoincreasedfossilfuelconsumption,suchas replacingfossil-fueledelectricityproductionbynuclearandrenewablesources,energyefficiency improvementsinfossilfuelusage,andsequestrationmethodsforcarbondioxide.Mostofthese alternativesrequiremuchgreatercapitalinvestmentsand/orhigherpricesforcommodities(includingelectricity),thatuseprimaryenergyfortheirproduction.Thesemeasuresimplygreatchanges inhowenergyissuppliedandutilizedandwillundoubtedlyrequiregovernmentinterventionin theenergymarketplace.
Inconclusion,whileurbanandregionalenvironmentalpollutionisstillamajorproblem, especiallyindevelopingnations,theexperienceinindustrializednationshasshownthatitis technicallyandeconomicallysolvableandpoliticallymanageableonthetimescaleofseveral decades.Itremainstobeseenwhetherthemuchgreaterproblemofglobalwarmingcanbesolved withcomparablemeasuressustainedoverthenextcenturies.
Energyinmaterials,suchasfossilornuclearfuels,andelectricalenergydeliveredbypowerlinesare commoditiesinindustrializedeconomies,beingtradedinthemarketplace.Theremustbestandards formeasurementoftheenergycontentandotherpertinentpropertiesofthesecommoditiesforthis markettooperateefficiently.Thesestandardsofmeasurementarederivedfromthedevelopment ofmodernscienceandtechnology,whereagreementamongresearchersabouthowtoquantifythe resultsoftheirexperimentsisessentialtocontinuedscientificprogress.
Bycommonagreementamongscientistsofallnations,asystemofunitsofmeasurementhas beenselected:theInternationalSystemofUnits,orSIforshort.TheSIsystemdefinessevenbase unitsofmeasurementwhicharemutuallyindependentofeachother,itbeingimpossibletomeasure oneunitintermsofanyother.Furthermore,allotherphysicalquantitiesmaybemeasuredinterms ofoneormoreoftheseunits.Themagnitudesofthebaseunitshavebeenarbitrarilychosen,butare clearlydefinedbyagreement.Thedefinedbaseunitsarethemeter(length),kilogram(mass),second (time),ampere(electriccurrent),kelvin(thermodynamictemperature),mole(amountofsubstance), andcandela(luminousintensity).Thefirstsixoftheseareusedinthistext.Theyarelistedinthe firstsectionofTableA.1ofthisAppendix,“Baseunits,”togetherwiththeirabbreviatedsymbols.1
Therearemanyphysicalquantitiesthatariseinscientificstudiesforwhichitisusefulto defineaunitofmeasurementthatisderivedfromthebaseunitsbyawell-knownphysicallaw. Forexample,theSIunitofforce,thenewton,isdefinedasthemagnitudeofforcewhich,when appliedtoa1-kgmass,willcausethemasstoexperienceanaccelerationof1m/s2.ByNewton’s lawofmotion(force = mass × acceleration),1newtonmustequal1kgm/s2.Forthephysicaland chemicalquantitiesofinterestinthisbook,TableA.1liststhesederivedunitsinitssecondsection, “Derivedunits.”
AmongthederivedSIunits,theunitofenergyisthejoule(J)andthatofpower,thetimerate ofenergyuse,isthewatt(W),whichequalsonejoulepersec(J/s).Intermsofmechanicalunits, ajouleequalsonenewtonmeter(Nm),orunitforcetimesunitdistance,andawattisonenewton meterpersecond(Nm/s),orunitforcetimesunitvelocity.Intermsofcommonelectricalunits,a jouleequalsonevoltamperesecond(VAs),orunitchargetimesunitelectricpotential,andawatt equalsonevoltampere(VA),orunitcurrenttimesunitelectricpotential.
Forvariouspracticalreasons,includingtheneedsofcommerceandhistoricalusagethat precededmodernscience,additionalSIunitshavebeendefined.Theonespertinenttothistextare
Lengthinchin. 2.54E( 2) m
Lengthfootft 3.048E( 1) m
Lengthmile(statute)mile5280ft = 1.609E(3)m
Areaacre 4.0469E(3)m2
Volumegallon(U.S.)gal3.7854E( 3)m3
Volumebarrelbbl42gal(US) = 1.5899E( 1)m3
Forcepound(force)lbf4.448N
Masspound(mass)lbm4.5359E( 1)kg
Masston(short) 2000lbm = 9.07185E(2)kg
EnergyBritishthermalunitBtu1.05506E(3)J
EnergyQuad(1E(15)Btu)Q1.05506E(18)J
Energythermtherm1.05506E(8)J
Powerhorsepowerhp 7.46E(2) W
Pressurepound(force)/squareinchpsi6.895E(3)Pa
TemperatureFahrenheit ◦F (5/9) K
a Boldfacevaluesareexact.
listedinthethirdsectionofTableA.1,labeled“Definedunits.”Amongthesewenotethenautical mile,whichisthedistancealongtheearth’ssurfacecorrespondingtoaminuteoflatitude,andthe velocityofaknot,oronenauticalmileperhour,theusualunitofwindspeed.Theunitforsmall geographicareasisthehectare,andthelaboratoryscalemeasureofvolumeistheliter(L).Large massesareusuallymeasuredinmetrictons(ton).Thechemist’sunitofenergyisthecalorie,which equalstheamountofheatrequiredtowarmagramofwaterbyonedegreecentigrade.
Unlikealltheotherindustrializednations,theUnitedStateshasnotadoptedthemetricsystem ofmeasurementfordomesticandcommercialpurposes,butcontinueswiththesystemofunitsit inheritedfromEngland.TofacilitateconversiontoSIunits,thevaluesofpertinentU.S.commercial unitsarelistedinTableA.2.
ManyoftheseunitsarecommonlyusedintheUnitedStates.Forexample,thegallon(gal)isthe unitvolumeforretailsalesofvehiclefuel,whereasthebarrelisthepreferredunitofinternational petroleumsuppliersandrefiners.Theunitofforceisthepoundforce(lbf),whiletheunitofmass isthepoundmass(lbm).Forlargeamountsofmass,theshorttonisused,tobedistinguishedfrom themetricton.TheenergyunitistheBritishthermalunit(Btu),theamountofheatrequiredto warmapoundmassofwaterbyonedegreeFahrenheit.Theunitofpoweristhehorsepower(hp). Acommonpressureunitisthepoundforcepersquareinch(psi).
Theconversionofquantitiesfromonesystemofunitsisstraightforward.Forexample,to convert x Btu/lbmtoSIunitsofJ/kg,multiplybytheconversionfactorsfromTableA.2,
Inexplainingthetechnologyofenergysystemsinthistextwehaveneedtoinvoketheprinciples ofphysics,chemistry,andthermodynamics.Thequantitativeapplicationofthesesciencesrequires themeasurementofcertainpropertiesofatomsandmoleculesthatareusedindefiningimportant
physicalconstants.SomeofthesethatweusearelistedinTableA.3.Amongthesearetheelectron volt(eV),theFaraday(F ),Avogadro’snumber(N0),andtheuniversalgasconstant(R),usedin analyzingelectrochemicalprocesses.
TheSIunitsofTableA.1areoftenofinconvenientsize.Justaspapercurrencycomesin differentdenominations,physicalquantitiesneedtohavedifferentsizestoaccommodatedifferent uses.TheSIsystemincludestheuseofprefixestochangethesizeofunitsbyfactorsof10,up ordown—forexample,kilometer(km),centimeter(cm),micrometer(µm).TableA.4liststheSI unitprefixesthatcoverarangeof30ordersofmagnitude,enoughformostpracticalpurposes. Occasionallyweusepractical,ifnotalwayslogical,unitssuchastheunitofelectricalenergy, thekilowatthour(kWh),whichequals3.6megajoules(MJ).Thekilowatthour,anamountof energythatwilllightakilowattbulbforonehour,isabetterunitforcommercialusethanthe megajoule.
Aciddeposition,104,109,231,247
acidity,231,247
modeling,251,254f
sourceapportionment,255
transfercoefficients,253,254f
Acidminedrainage,258
Adiabaticcombustiontemperature,42,43,47
Adiabaticprocess,37
Advancedcycles,213
Aerodynamicdrag,200,205,206
Aerosols,275
Afforestation,293
Airpollutants,5,234
hazeandvisibilityimpairment,256
healthandenvironmentaleffects,233
photochemicalsmog,10
primaryandsecondary,242
Airpollution,234
meteorology,235
modeling,234
areasource,241
Gaussianplume,238
linesource,240
plumerise,238
standards,228,231
ambient,231
emission,228
primary,231
secondary,231
U.S.ambient,231
U.S.NSPS,229t
U.S.vehicle,230t
Airqualitymodeling,234
Airseparationunit,114
Albedo,271
Alternatingcurrent. See Current,alternating Alternator,69
Ammoniaslip,111
Anode,59
Armature,74
Atmosphericdeposition,260
Availability,47
Avogadro’snumber,60
Baghouse,102
Baseload,88
Battery energyefficiency,83 properties,83t
storage,81
lead-acid,82
Bestavailablecontroltechnology,100,230
Biomassenergy,143,148–51,293
environmentaleffects,151
photosynthesis,149
Blackbodyradiation,269
Boiler,48,91
Bottomash,90
Braytoncycle,53
Breedingratio,133
Briggsplumerise,239
Burner,90
Capacitor,78
Carboncycle,279
Carbondioxide,284f
capture,285
concentration,273,280
control,284
hydrate,290
Carbondioxide(cont.)
sequestration,288 utilization,292
Carbonemissions,18,279 control,284
Carnotcycle,46
Catalyticconverter,318
Cathode,59
Chainreaction,122
Chlorofluorocarbons,282,292
Clausprocess,105,114
Clausiusinequality,36
CleanAirActAmendments,230
Climatechange,278
Coal,22f
anthracite,23
ash,90
bituminous,23 characteristics,23
gasification,104,285
heatingvalues,23
lignite,23 reserves,22,23 resources,23
washing,90,104
Collector. See Solarenergy
Condenser
refrigeration,57
steam,48,96
Cogeneration,70,115
Combinedcycle,53,55,105,113
Combustion,41–45
adiabatictemperature,42,43,47
chamber,53
powerplant,90
products,42
reactants,42
reciprocatingengines,193
thermodynamicproperties,44t
Controlrods,127
Coefficientofperformance,57
Compressionratio,52
Compressor,53
Coolant,reactor,127
Coolingtower,97
Coronadischarge,100
Criteriapollutants,231
Criticalpoint,50
Current,electric alternating,74,77,98 direct,77,98
DeLavalnozzle,93
Deutschequation,101
Dispersionmodeling,234
Districtheating,116
Dryadiabaticlapserate,235
Drydeposition,247
Dryscrubber,108
Earthradiance,270
Economizer,92
Efficiency
electrical,75
fuel,203–208
thermodynamic,46
fuelcell,60
ElNi˜no,278
Electric capacitance,78
current. See Current,electric efficiency,74
field,74 generator,72
induction,76 inverter,78
motor,72
permittivity,78 potential,74
power,7
demand,71
transmission,76–78
rectifier,78
resistance,75
Electrochemicalcell,58
battery,58
Electrochemicalenergystorage,81–83
Electrode,59
Electrolyte,59,81
Electrostaticprecipitator,100
Emissions,227,228
control,99f
standards,228
mobilesources,230
stationarysources,229
Empiricalkineticmodelingapproach (EKMA),244
Energy,6,31–33
chemical,32
conservation,6,32,283
consumption. See Energyconsumption
electric,33
gravitational,83
internal,32
kinetic,31
magnetic,33
nuclear,32,121
potential,31
renewable. See Renewableenergy sources. See Energysupply
storage,78
efficiency,85
electrochemical,81–83
electrostatic,78
flywheel,84
hydropower,83
magnetic,80
mechanical,83 properties,84,85t
supply. See Energysupply
thermodynamic,31
transportation,5,8
total,33
Energyconsumption
electricity,16–18
UnitedStates,16,17f
global,12,14t
UnitedStates,15,19–22
U.S.commercial,21
U.S.industrial,20
U.S.residential,21
U.S.transportation,22
Energysupply
coal,14,22
global,22–27
hydro-electric,14,16
naturalgas,14,25
nuclear,14,18
petroleum,14,24
renewable,14
Enhancedoilrecovery,288
Enthalpy,38
Entropy,36
Environment,10
Evaporator,57
Extinctioncoefficient,257
Faradayconstant,60,82
Feedwater,91
heater,92
Feedbackeffects,274f
Fertileisotope,122
Firstlawofthermodynamics,30,35
Fissileisotope,122
Fission,121
Fusion,121,138
Flame,90
temperature,95
turbulent,90
Fluegas,91
denitrification,91,230
desulfurization,107,230,259
Flyash,90,259
Forestburning,18
Fossilfuelpowerplant,88–116
advancedcycles,113–16
coalgasificationcombinedcycle,114
cogeneration,70,115
combinedcycle,53,55,113
fuelcell,58–61,116
boiler,48,91
superheater,50,92
burner,90
condenser,48,96
coolingtower,97,260
emissioncontrol,99f
electrostaticprecipitator,100
nitrogenoxide,109
particles,99
sulfur,102
fluegasdesulfurization,107,230,259
fluidizedbedcombustion,105
fuelstorageandpreparation,89
gasturbine,26,53,95,113
Fossilfuelpowerplant(cont.) generator,98
low-NOx burner,109
selectivereduction,111
steamturbine,48,93
wastedisposal,112
Freeenergy,38
Gibbs,38,58
Fuelconsumption,specific,62
Fueleconomy. See Highwayvehicles
Fuelefficiency,62
vehicle,203–208
Fuelcell,58,61,116
anode,59
cathode,59
electrode,59
electrolyte,59
Fuelheatingvalue,42–45,44t
higher,23,45 lower,43,198
Fuel,synthetic,63
efficiency,55t
Fuelrod,nuclear,127
Gasturbine,25,53,95,113
combinedcycle,16,113
Gaseousdiffusion,136
Gaussianplume,238
Generator,electric,69,72
Geopressurizedmethane,26
Geothermalenergy,143,152–54
environmentaleffects,154
heatpump,154
installedpower,152t
powerplant,153
Globalwarming,267–95,300
climatechange,278
effects,277
feedbackeffects,274
modeling,272
observedtrend,276
radiativeforcing,272
Greenhouseeffect,267,269
Greenhousegas,5,267,269
emissions,279
Gibbsfreeenergy. See Freeenergy
Hazeandvisibilityimpairment,104,233,256
Heat,33 exchange,39–41,95 interaction,35 pump,56,154
geothermal,154 transfer,35,39–41
coefficient,40
Heatengine,45
combinedcycle,53,55
idealcycles,45–56
Brayton,53
Carnot,46
Otto,51
Rankine,48
thermodynamicefficiency,46
Heating
regenerativefeedwater,50,91
reheating,50
superheating,50,91
Highwayvehicles,189
aerodynamicdrag,200,205,206 characteristics,197,198t emissions,190,214–22
catalyticconverters,318
federaltestprocedure,215 reduction,216–22
U.S.emissionstandards,214–16,216t electricdrive,208–214
battery-powered,208–210
hybrid,210
fuelcell,211–14
engineperformance,207
evaporativeemissions,220 fueleconomy,190,205–208
corporateaveragefueleconomy,204 drivingcycles,205
fuelefficiency,203–208
fuelcell,211–14
characteristics,213t fuelconsumption,190
hybrid,210
characteristics,210t
internalcombustionengine. See Internal combustionengine
mass,206
passengervehiclecharacteristics,198t
powerandperformance,199–203
rollingresistance,200,205,207
transmission,201
vehicleuse,190t
Hydrocarbons,41
Hydrogeneconomy,64
Hydropower,70,145–48
development,122t,146t
environmentaleffects,148
hydroturbines,147
pumpedstorage,72,83
efficiency,84
source,14
Inductance,80
Induction,80
Inversion,235
Ionizingradiation,123
Irradiance,269. Seealso Solarenergy
Isotope,121
Integratedgasificationcombinedcycle,114
Internalcombustionengine,45,188, 191–93
brakemeaneffectivepressure,196
brakepower,196
brakespecificfuelconsumption,197
combustion,193
compressionignition,191
efficiency,197–99
enginedisplacement,196
four-strokecycle,192
nitricoxideformation,194
powerandperformance,195–99
sparkignition,191
thermalefficiency,198
two-strokecycle,192
Landpollution,262
Laserenrichment,136
Leadpollution,261
Lighting fluorescent,21
incandescent,21
Liquefiednaturalgas,90
Linear-no-thresholdhypothesis,127
Magnetic energy,80
field,72
inductance,80
induction,80
inductor,80
permeability,80
Marketablepermits,231
Massdeficit,121,138
Maximumachievablecontroltechnology, 230,232
Mechanicalenergystorage,83
Membraneseparation,114
Methanation,114
Methane,25,267,281
hydrate,26
Mercury,112
emissions,112
deposition,261
Mesosphere,273
Mixinglayer,235
Moderator,127
beryllium,128
heavywater,128
graphite,128
lightwater,128
Motor,electric,72
NationalAmbientAirQualityStandard, 231,233
Naturalgas,22f
composition,24
compressed,90
heatingvalue,25
lifetime,26
liquefied,90
reserves,26
resources,26
unconventional,26
Neutron,121f
absorption,128
activation,124
economy,128
scattering,128
thermal,128
Nitricoxide,194
Nitrogenoxides,90f control,109
fuelNOx,109,243
nitrogendioxide,243
thermalNOx,109,243
Nuclearenergy,121–40
chainreaction,121
fertileisotope,122
fissileisotope,122
fission,122
fusion,121,138
laserfusion,136
magneticconfinement,135
Nuclearfuelcycle,134
enrichment,135
spentfuelreprocessing,136
wastedisposal,137
wastestorage,137
Nuclearreactor,127
boilingwater,129
breeder,132
breedingratio,133
CANDU,131
controlrods,127
coolant,127
critical,128
fuelrods,127
gascooled,132
moderator,127
pressurizedwater,130
Nucleons,121
Oceansequestration,289
Oceanthermalpower,143,180–81
Oceanwavepower,143,176–80
probabilitydistribution,179
Oildesulfurization,105
Oilshale,25
Oilspills,258
Opencycle,51
Ottocycle,51
Ozone,109,242,282
hole,242
stratosphere,242
troposphere,242
Particulatematter,99f control,99
emissionstandards,228
Pasquill-Giffordstability,236
Permeability,magnetic,80
Petroleum,122
composition,24
crude,24
heatingvalue,24
lifetime,24
reserves,24
resources,25
unconventional,25
Photochemicalsmog,10
Photo-oxidants,242
modeling,244
EmpiricalKineticModelingApproach, 244
RegionalOxidantModel,245
Photovoltaiccell,164–66
efficiency,165
Plutonium,122
Pollutant,231 criteria,231
toxic,231
Polycyclicaromatichydrocarbons,233,261
Powerplant efficiency,88 fossilfuel. See Powerplant nuclear,3. Seealso Nuclearreactor steam,3. Seealso Powerplant
Pumpedstorage,72
Pyriticsulfur,90
Quenching,114
Radiance,269
Radiatingheight,273
Radiation,122f
alpha,122
beta,122
biologicaleffects,126
dosage,125
gray,125
rad,125
doseequivalent,125
rem125
sievert,125
gamma,122
ionizing,122,125
protection,125
Radiativeforcing,272
Radiativetemperature,272
Radioactivity,122
decayrate,124
halflife,124
isotope,124
units,124
becquerel,124
curie,124
Radon,112
Rankinecycle,48,88
Receptormodeling,235
Refrigeration,21,56
Regionalhaze,256
Reheating,50
Renewableenergy,4,7,143
Seealso Biomassenergy,Geothermal energy,Hydropower,Oceanthermal power,Oceantidalpower,Ocean wavepower,Photovoltaiccell,Solar energy,Windpower
capitalcost,181–82
energyflux,145t
production,144t
source,14
Rollingresistance,200
Sealevel,277
Secondlawofthermodynamics, 30,36
Selectivecatalyticreduction,111
Selectivenon-catalyticreduction,111
Sequestration,65
SIunits,304t
prefixes,306t
Solarenergy,155–63
clearskyirradiance,158t
flatplatecollector,159
efficiency,160
focusingcollector,161
irradiance,155,156f,157,158t, 269,270f
spectraldistribution,156f
Solarspectrum,156f,270f
irradiance,269
Solidwaste,112,259
Soot,261
Sorbentinjection,107
Sourceapportionment,255
Source–receptormodeling,234
Specificfuelconsumption,62
Specificheat
constant-pressure,38
constant-volume,38
Stabilitycategories,235
Stackheight,238
Stackplume,237
Stagedcombustion,109
Stateimplementationplan,233
Steadyflow,39
Steampowerplant,92f
Stoichiometricratio,41,90
Stratosphere,242,273
Sulfuroxides,92f
emissioncontrol,104,230
emissionrate,229
emissionstandard,238
Superheating,50,90
Surfacemining,272
Syntheticfuel,63 efficiency,64
Tarsands,25
Temperature absolute,36
adiabaticcombustion,42,43,47
Terrestrialradiation,269
Terrestrialsequestration,292
Thermalefficiency,53
Thermalpollution,97,260
Thermodynamics,30
efficiency,46
fuelcell,60
heatengine,46
Thermodynamics(cont.) laws,30
firstlaw,30,35 secondlaw,30,36 properties,37–38
extensive,37 fuelcombustion,44t intensive,37 specificextensive,37 statevariables,32
Thermosphere,273
Thorium,121
Tidalpower,143,172–76
environmentaleffects,176
capacityfactor,175f
idealpower,174
plantcharacteristics,175t tidalperiod,173
Toxicpollutants,231,260
Transfercoefficients,253
Transformer,70
Transportation,157. Seealso Highway vehicles
energy,5,8
Troposphere,242,273
Turbine gas,53,95
steam,48,93 wind. See Windpower
Uranium,121f
hexafluoride,135
oxide,127,134
yellowcake,134
Urbanairshedmodel,245
U.S.commercialunits,305t
Vaporcompressioncycle,56
Visibilityimpairment,104,233,256
Volatileorganiccompounds,244
Watergasshiftreaction,114,287
Waterpollution,258
acidminedrainage,258
atmosphericdepositiontosurfacewaters, 260
coalwashing,258
solidwastefrompowerplants,259
thermalpollution,260
Wetdeposition,247
Wetscrubber,107
Windadvection,234
Windpower,143,166–72
energyflux,170
environmentaleffects,172
farm,171
probabilitydistribution,171
turbine,167
power,168
powercoefficient,169
Windstatistics,234
Windturbine. See Windpower
Work,33
interaction,34
Xrays,122
Zircalloy,127