Is Preface Thetitleofthisbookwillnodoubtattractcontroversy.Somemay deemitprovocative.Butadiscussionoftheevidencesupportingor inconsistentwithglobalwarmingistimelyandshouldnotfrighten anyone.All7.3billioninhabitantsofthisplanetdeservetoknow whatisgoingon.
AsIwasworkingonthismanuscript,oneofmychildrensaid; “Papa,thismaymakeyoupopularintheU.S.Republicanparty”. Thatindeedisaconcern,assomeoftheleadingcontendersinthe2016 presidentialcycleareespousingtrulyloonyideas.However,scientists mustbeguidedstrictlybyevidenceandshouldneverallowpoliticsto governtheirresearch.
WilliamArievanWijngaarden,April,2016
AbouttheAuthor: WilliamArievanWijngaardenattendedthe UniversityofWindsorfrom1978to1982wherehereceivedtwoundergraduatedegrees:anHonoursBScinPhysicsandaBScinComputerScience.HethenwenttoPrincetonobtainingaMScin1984 andaPhDinPhysicsin1986.Hehasbeenafacultymemberinthe PhysicsDepartmentatYorkUniversitysince1988whereheisknown forgivingverylucidlectures.Hisresearcharticlesareavailableat: www.wvanwijngaarden.info.yorku.ca
1WhyShouldWeCare?1
3.3SurfaceArcticTemperatureObservations........
4.3OutdoorSkating......................
5AreTheOceansChanging?75
6IsItWetterOrDrier?91
6.1PrecipitationObservations................. 94
6.2ExtremeRainfallEvents..................
6.3GreatLakes.........................
6.4ForestFires.........................
6.5FinalPrecipitatingRemark................
7ExtraordinaryClaims109
7.1Did9/11changetheclimate?...............
7.2TrulyExtraordinaryClaims................ 114
7.2.1OceanWaveHeights................ 114
7.2.2WindSpeed..................... 115
7.2.3HudsonBayWarming............... 116
8WhatShould/CanBeDone?117
8.1SummaryofEvidence...................
8.2EnergySustainability...................
8.3Whatshouldwedonow?.................
1 WhyShouldWeCare? Barelyaweekpasseswithoutanarticlewarningabouthumanity’s adverseeffectontheEarth’sclimate.Headlinesmentionhistoric droughts[1,2],catastrophicfloods[3,4],recordheatwaves[5,6, 7],risingsealevels[8],disappearingArcticseaice[9],increasing stormseverity[10,11],oceanacidification[12,13]etc.Predicted consequencesrangefromthewhimsicalsuchastheendangermentof Canada’shockeyprowessbecausechildrencan’tskateonpondsthat don’tfreeze[14,15]tothepossibleextinctionoficonicanimalspecies suchaspolarbears[16,17],thedestructionofscenicunderwatertreasuressuchasAustralia’sGreatBarrierReef[18]andthespreadof disease[19].
Thebasisfortheseconcernsismankind’sincreasinguseoffossil fuelsthatbeganwiththeindustrialrevolution.Coal,oilandnatural gasallproducecarbondioxide(CO2 )whenburned.CarefulmeasurementsshowasteadilyincreasingamountofCO2 intheatmosphere thatactsasathickeningblanketwarmingtheEarth[20].Beginningin
the1990s,agroupofinternationalscientistsestablishedbytheUnited Nations,theIntergovernmentalPanelonClimateChange(IPCC),has issuedvoluminousreports[21,22,23,24,25].Theirmostrecentwarningin2013,states“Warmingoftheclimatesystemisunequivocal,and sincethe1950s,manyoftheobservedchangesareunprecedentedover decadestomillennia.”Theyconcludethat“Humaninfluencehasbeen detectedinwarmingoftheatmosphereandtheocean,inchangesin theglobalwatercycle,inreductionsinsnowandice,inglobalmean sealevelrise,andinchangesinsomeclimateextremes.”
Politicalleadershavetakennote.Nolessthantheleaderofthe freeworld,PresidentObamaoftheUnitedStates,hasproclaimedthat “ClimateChangeissettledscience”[26,27].Wearetoldthereisan overwhelmingscientificconsensusthatmankind’suseoffossilfuels ischangingtheatmosphereresultinginawarmerclimatewithmany negativesideeffects.
However,questionshavebeenraisedabouttheIPCCreports.The 1990and2001reportspresentedgraphsshowninFigure1.1thatplot thechangeoftheEarth’saveragetemperatureoverthepast1,000 years.Theverticalaxisofthe1990graphdoesnothavenumeric labelswhichisnotrecommendedscientificpractice.Itshowstemperatureswerewarmerbetween1000and1300ADwhichisknown astheMedievalWarmPeriod.Thiswasfollowedbyacolderperiod calledtheLittleIceAgeandfinallyatemperatureincreaseoverthe mostrecentcentury.Incontrast,the2001graphdoesnotshowany MedievalWarmPeriod.Temperaturesdecreasedslightlyfrom1000to 1900ADbeforebeginningasteeprise[28].Theshapeofthiscurve resemblesa“HockeyStick”andwasprominentlyfeaturedinthemovie
“AnInconvenientTruth”starringformerVicePresidentAlbertGore [29].Onedoesn’thavetobereligioustonotethatacontinuation oftheincreasing20thcenturytemperaturetrendmeanstheEarthis headedstraighttohell.Theobviousquestiontoaskiswhyarethetwo graphssodifferent?Questionshavebeenraisedwhetherthehockey stickgraphiscorrect[30,31,32,33].Indeed,the2013IPCCreport showedthatafter2000thewarmingstoppedeventhoughtheclimate modelsallprojectedtemperaturestoincreasesharply.
TheIPCCdoesacknowledgesomemistakes.The2007IPCCreportwasamendedtowithdrawtheclaimthattheHimalayanglaciers wouldbecompletelymeltedby2035[34].Similarly,thestatement that55%oftheNetherlandsliesbelowsealevelwaslatercorrectedto theactual26%[35].Whyweren’ttheseerrorscaughtbytheapproximately2,500scientistsandexpertsinvolvedinproducingthevoluminousIPCCreports?Undoubtedly,thevariouschapterswerewritten bysmallsubcommitteesandtheentirereportwasonlyreviewedbya stillsmallernumberofindividuals.
Thecontroversyoverwhetherglobalwarmingiscausedbyhumansorsocalledanthropogenicactivities,isstrange.Scienceisnot normallyassociatedwithpassionateargument.Itisbasedonobjective mathematics.TherewasonlyonecorrectanswerwhenyourGradeone teacheraskedwhatwas8x6.Thisbookseekstoexplainwhatthe fussisabout.First,thebasicscienceisreviewed.Next,theevidenceis presented.IstheEarthexperiencingchangesintemperature,glaciers, sealevel,oceans,precipitationetc.aspredictedbytheglobalwarming theory?Finally,whatshouldmankinddotoensurethisworldremains habitableforourdescendants?
Figure1.1:a)ChangeinTemperatureaccordingtotheIPCCReports ina)1990andb)2001.Yellowindicatestherangeoftemperatureuncertaintyabouttheaverage(blackline).Redindicatestemperatures measuredbythermometerswhiletheblackdatarepresentstemperatureinferredfromthethicknessoftreeandcoralrings[21,23].The dashedlineshowsthetemperaturein1998was0.8 o Chigherthan 1,000yearsago.
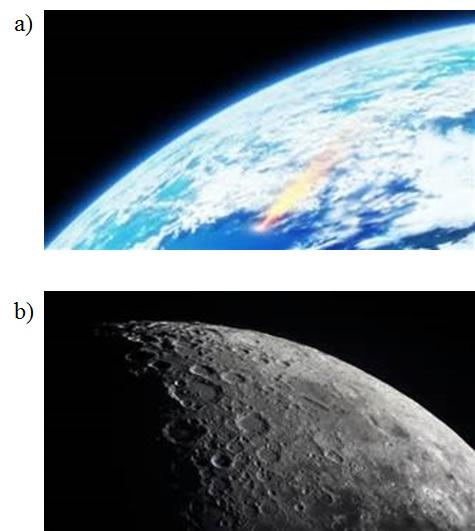
GlobalWarmingForPoets 1 Thesolarsystemisaharshenvironment.Onecanadmirethepretty photosofastronautsdancingontheMoonduringthe1970sorbe mesmerizedbyfascinatingpicturestakenbyroboticspacecraftlanding onMars,Venusandothermoredistantheavenlybodies.However, onlytheEarthhasanatmospherethatcansupportlife.Withoutit, temperaturesontheEarthwouldvarylikethoseontheMoon.Lunar temperaturesrangefrom100 o Cduringthedayto-173 o Catnight.
Figure2.1showsthesharpcontrastbetweentheEarthandthe Moon.TheatmosphereisthethinbluehazecoveringtheEarth’s surface.Itlooksespeciallyfragilewhencomparedtotheharshlunar
1 Poetisasomewhatderogatorytermusedbyphysiciststodescribesomeone whoisnotascientistnorevenanengineer.Theassignmenttoteachphysicsto non-scientistsisaformidabletoolinthearsenalofadepartmentalchair.That fatebefelltheauthoronesummer.Fortunately,hequicklyreturnedtotheChair’s goodgracesandtaughtSolidStatePhysicsthefollowingsemester.Thetemptation provedirresistible.Atthefirstclass,thePhysicsforPoetsexamwasgiventothe SolidStatestudents.Itwasnocontest.Thefirstyearpoetscreamedthesenior physicsmajors.
Figure2.1:Thereisaremarkablecontrastbetweenthea)Earthandb) Moonasviewedfromspace.ThemajordifferenceisduetotheEarth’s atmospherewhichappearsasathinbluehazeabovethesurface.
2.GLOBALWARMINGFORPOETS7 terrain.Theatmospherethinsoutrapidlyasoneincreasesinaltitude. Thatexplainswhyjetsmustbepressurizedorpassengerswilldiedue toalackofoxygen.Theatmospherehasathicknessofonlyabout 10kilometerswhichismuchlessthantheEarth’sradiusof6,400km. Yet,itistheatmospherethatsuppliestheessentialsoflife,fromthe airwebreathetothemoistureplantsandanimalsneedtogrow.
2.1HistoricalClimate TheEarth’satmospheregeneratestheweather,asourceofendless conversationasitchangesfromdaytoday.Forecasterscanpredict reasonablywelltomorrow’sweatheroreventwoorthreedayshence. Butaskthemtopredicttheweatherinoneortwoweeks,andeventhe bestforecastersfailabysmally.Fortunately,theweatherisstablewhen viewedonalongerterm.Seasonscomeandgowithregularity.Inthe NorthernHemisphere,wintersarecoldwhilesummersarewarm.It maybedifficulttopredicttheweathernextweekbutthelongterm weatherpatternsknownasclimateappeartobeconstantfromyear toyear.Ofcourse,theclimatemustbeconstantforhowelsewould humansandotherlifehavesurvivedonthisplanet.
Butistheclimateconstant?Theansweroverperiodsoftensof thousandsofyearsisno!Thiscanbestatedemphaticallybecause weallknowabouttheIceAges.Tenthousandyearsagothelast IceAgewasending.GlaciershadcompletelycoveredNorthAmerica asshowninFigure2.2aswellaslargepartsofEuropeandSouth America.Theselargeglaciersmeantthatthesealevelwasmuchlower. Themodernshorelinewasnotrecognizable.Britainwasconnectedto Europe.IceAgesarebelievedtohaveoccurredbecausetemperatures
werelowerduetochangesintheEarth’sorbitaroundthesun[36,37].
Figure2.2:GlacierscoveringNorthAmericaduringtheQuaternary IceAgefrom100,000to10,000B.C.
TheIceAgeshowstheEarth’sclimateisnotconstantontime scaleslongerthan10,000years.Thatisalongtimeandnotthesubject ofthisbook.Weareinterestedinclimatechangesonshortertime scales,thatwillaffectusoratleastourgrandchildrenin50years.Has theclimatebeenconstantthroughoutrecordedhumanhistory?The answerisno.TemperaturesintheNorthAtlanticregionwerewarmer duringthesocalledMedievalWarmPeriodfrom900toabout1300 AD.ThisallowedtheVikingstosettleinsouthernGreenlandandfarm!
2.GLOBALWARMINGFORPOETS9 Here,farmingrefersnottomoderndayaquaculturebuttraditional farmingwithsheepandcattle.Greenlandwassonamedbecauseparts ofthesouth,atleastduringsummer,weregreen.Twosettlements showninFigure2.3knownastheWesternandEasternSettlements, wereestablishedwhichattheirpeakhadatotalpopulationofseveral thousandinhabitants[38,39].TradewithEuropewasbriskinsuch thingsaswalrusivoryforseveralhundredyears.Thestoneruinsof aCatholicChurchatHvalsey,Greenlandareastrikingremnantof Norseculture.
Avisitingcleric,IvarBardarson,foundtheWesternSettlementdestroyedonavisitaround1350[39].Therewerewildhorses,cattleand sheep,butnoinhabitants.ThereasonsforthedemiseoftheWestern Settlementarenotclear.TherearesomeNorseaccountsoffighting asmallpeopletheycalledthe“Skraelings”.TheInuitareknownto havesettlednorthernGreenlandatthistime.ThelargerEasternSettlementexisteduntilthe15thcentury.In1410,thecrewofavisiting shiprecordedtheburningofawitch[40].TherealsoexistsacontemporaryIcelandicrecordofacouplewhomarriedinGreenlandand lateremigrated.ExcavationsofcemeteriesinGreenlandbyDanish archaeologistsinthe20thcenturyhavefoundevidenceofmalnourishmentoftheinhabitants.Itappearstherewasashifttoamarkedly coolerclimateintheNorthernHemisphereinthe1300sthatledtothe demiseoftheVikingsettlements.RadiocarbondatingofplantmaterialfoundbeneathglaciersonBaffinIslandandIcelandshowsglaciers begantogrowinthelate1300s[41]althoughtherehasbeenastudy thattemperaturesduringtheMedievalWarmperiodwerenothigher inGreenlandascomparedtotoday,butonlyinEurope[42].
Figure2.3:a)MapshowingtheWesternandEasternVikingsettlementsinGreenland.b)RemainsofHvalseyChurchlocatedinthe Easternsettlement.
2.GLOBALWARMINGFORPOETS11 Figure2.4:WinterDutchlandscapepaintedbyHendrikAvercampin1608.Acursoryexamination ofAvercamp’spaintingrevealsseveralindividualswithcurvedstickschasingapuck.Thisisheresy inCanadawhichrighteouslyregardsitselfasthebirthplaceofhockey.Canadianaudiencesare reassuredwhentoldtheseplayersaredistantrelativesofWayneGretzkyandBobbyOrr.
Theperiodfromabout1400to1700isknownastheLittleIce Age.TemperaturesinEuropewerecooler.Swissvillagersevenoffered prayerstostopadvancingglaciersfromdestroyingtheiralpinevillages [43,44].RiverssuchastheThamesandRhineregularlyfrozeduring winter,somethingthatseldomoccurstoday.Famouspaintings,such astheonebyHendrikAvercamp,showninFigure2.4,picturesthe Dutchpublicenjoyingawinterafternoonin1608ontheice.The LittleIceAgeendedaround1700.Thereafter,theEarthwarmedas indicatedbytheIPCCgraphsinFigure1.1.
2.2SolarIntensity Clearly,theEarth’sclimatehaschangedontimescalesofcenturies. Whydidthisoccur?Onepossibilityisthatthesun’sheatoutput changedovertime.Satellitemeasurementsofthesolarintensitymeasuredinwattspersquaremeterexistfrom1975onwardsasshown inFigure2.5[45].TheseNASAdatashowthesun’sintensityvaries byabout0.1%inacyclicfashionhavingaperiodof11years.This coincidesverycloselywiththewellknownsunspotcycle.Sunspotsare smalldarkspotsonthesun’ssurfacethatastronomershaveobserved forhundredsofyears.Modernsciencehasshowntheyareasbigas theEarthandaremagneticstorms.Thetemperatureisabout1,000 o Ccoolerthantheaveragetemperatureofthesun’ssurface.Sunspots thereforeproducelessheatthanotherpartsofthesunandappear darker.Thisisanalogoustohavingacampfire.Themostheatis generatedbythepartsofthefirethatarealsothebrightest.Itis thereforereasonablethatthesun’sintensitywillbereducedifthere aremoresunspots.
2.GLOBALWARMINGFORPOETS13 However,anexaminationofFigure2.5ashowsthattheexactoppositeoccurs,thesun’sintensityincreasesasthenumberofsunspots increases!Itturnsoutthatinadditiontodarksunspotsthereare brightspotscalledfaculae.Faculaearenotreadilyseenbecausethe brightnessofthesunsaturatestheeye.Theincreaseinsolarenergy producedbythefaculaeoutweighsthedecreasecausedbythesunspots producinganetincreaseinsolarpower.
Sunspotswerefirstobservedinabout1600.Thenumberofsunspots hasvariedovertimeasisshowninFigure2.5b.Thesharpdecreasesin sunspotnumberinthe1600sandimmediatelyafter1800areknownas theMaunderandDaltonMinima,respectively.Itisnotclearwhether theMaunderMinimumoccurredbecausethesunactuallyhadfewer sunspotsorbecausesolarobservationswereintermittentduringthis time.Thenumberofsunspotshasvariedcyclicallywithaperiodof 11yearsforoverthelast200years.Theaveragenumberofsunspots didincreaseduringthe1900s.Figure2.5givesrisetotheintriguing suggestionthatthesunmayindeedhavehadfewersunspotsduring the1600swhichmayhavecorrespondedtoareducedsolarintensity thatcontributedtotheLittleIceAge.
Otherevidenceofsmallvariationsofthesolarintensityexists[46]. Thesunspewsoutamessofelementaryparticlesknownasthesolar wind.AnincomingneutroncancollidewithnitrogenintheEarth’s atmospheretoproduce 14 C.Thisradioactiveisotopeofcarbonhasa halflifeof5,760yearsandisusefulforcarbondatinghistoricalobjects. Thisisdonebycomparingtheratioof 14 Ctoregularstable 12 Cin anoldobject,tothatofarecentlygrownbiologicalspecimen.The amountof 14 Cintheatmosphereisnotexactlyconstant.Thiswas
Figure2.5:Variationofa)thesolarintensityandb)thenumber ofsunspots[45].Theredcurveistheannualaverageofthedaily (yellow)measurementsofthesolarintensity.Thegreencurveshows thenumberofsolarflareswhilethepurplecurvegivesameasurement oftheradiowaveintensity.(b)showsthenumberofsunspots.The datainredmaybeunreliableasobservationsmayhavebeentaken intermittentlyasopposedtothelaterdatainblue.Theblackcurve isthesunspotnumberaveragedover10years.
2.GLOBALWARMINGFORPOETS15 discoveredbycarbondatingtheringsofBristleconepinetreesthat canliveforseveralthousandyears[28,37].
Itisreasonabletoconcludethatthesun’sintensityhasnotbeen constantovertime.Thismustbeconsideredwhencreatingaglobal computermodeloftheclimate.Therearenoobvioussignsthatthe Earth’stemperaturevarieswithaperiodcoincidingwiththesunspot cycle.Hence,itisunlikelythattheobservedvariationofthesolar intensityissolelyresponsibleforclimatechange.
2.3Atmosphere Doesthecompositionoftheatmosphereaffecttheclimate?Volcanic eruptionshaveshownthisisthecase.Figure2.6showsapictureof theeruptionofMountPinatubo,Philippinesin1991.Avolcanocan shootanenormousamountofgasesanddebrishighintotheatmosphere.TheheavierashmaterialsettlesbacktotheEarthrelatively quicklynearthevolcano.Finerparticlesremainintheatmosphere muchlonger.Theseparticlesascendhighintotheatmospherewhere thejetstreamdistributesthemaroundtheEarth.Theparticlesscatter incomingsunlightreducingthesun’sintensityattheEarth’ssurface. Bluelightisscatteredmuchmorethanredlightresultinginstrikingly beautifulredsunsets.Asimilareffectalsooccursinlargepolluted citiessuchasMumbai(formerlyBombay),India.
Somevolcanoesgeneratesufficientdebrisintheupperatmosphere tonoticeablyaffecttheEarth’ssurfacetemperature.Theyear1816 isknownasthe“YearWithoutaSummer”.Itfollowedtheeruption ofMountTambora,Indonesiatheprecedingyear.Thisisbelievedto havebeenthelargestvolcaniceruptioninover1,000years[48].Tem-
Figure2.6:a)EruptionofMountPinatubo,Philippinesin1991b) 1816SummerTemperatureAnomalyfollowingtheeruptionofMount Tambora,Indonesiatheprecedingyear[47].Theanomalyisdefined asthedifferenceofthe1816andthehistoricallyaveragedsummer temperature.
2.GLOBALWARMINGFORPOETS17 peraturesduringthesummerof1816werenoticeablylowerasshown inFigure2.6b.SnowfellonAlbany,NewYorkinJune!Cropsin NorthAmericaandWesternEuropefailed.Fortunately,theclimate returnedtonormalthefollowingyearasthevolcanicparticlesprecipitatedoutoftheatmosphere.Thisshowsthatthecompositionofthe atmospherestronglyaffectstheclimate.Italsoillustrateshowclimate instabilitycanadverselyaffecthumans.
ThecomponentsofdryairareshowninFigure2.7.About99%of theatmosphereconsistsofNitrogenandOxygenwhichareessential toanimalandplantlife.TheinertgasesArgon,NeonandHelium compriseabout1%ofthetotal.Carbondioxide(CO2 )andmethane (CH4 )areonlyfoundintraceamounts.Watervapourisanimportant atmosphericconstituent.Itsconcentrationvariesconsiderably,fromas highas4%inthewarmtropicsathighhumiditytominusculeamounts inthepolarregionsduringwinter.
Thepresentdayconcernaboutglobalwarmingisthatmankind ischangingthecompositionoftheatmospherebyburningfossilfuels thatgeneratecarbondioxide.Thegreatlyexpandeduseofoil,coaland naturalgas(methane)beganwiththeonsetoftheindustrialrevolution asisshowninFigure2.8[49].Theuseoftheseenergysourcescontinues toexpandasdevelopingcountriesseektoimprovetheirstandardof living.
Thereareseveralsignificantothersourcesofthesesocalledgreenhousegases.Asmuchasnearly20%oftheannualanthropogenicproductionofcarbondioxidehasbeenestimatedtoresultfromclearing forestsbyburningvegetation[50,51].ThemostnotabledeforestationhasoccurredinBrazilwhereabout10%,or400,000km2 ,ofthe
Figure2.7:Compositionofdryairbyvolume.
2.GLOBALWARMINGFORPOETS19 Figure2.8:Increaseduseoffossilfuelsovertime[49]
Amazonianrainforestwasdestroyedduring1988-2013[52].Another largepotentialsourceofgreenhousegasesistheArcticpermafrost whichpresentlytrapsagreatdealofcarbon.Increasedbiological activitywillproduceagreatdealofcarbondioxideandmethaneif warmingtemperaturesmeltthepermafrost[53,54].Thiswilladdto themethanealreadyinadvertentlyreleasedduringnaturalgasdrilling andfromleakypipelines[55].Anenormousamountofmethaneisalso trappedintheformofmethanehydratesatlowtemperaturesinocean sedimentswhichmaybereleasediftheoceanswarm[56].Inevitably, thepopularmediacannotrefrainfromwritingtitillatingstoriesabout methanegenerationbyfartingcows,kangaroos,etc.[57].
Theamountofcarbondioxideintheatmospherevaries.Itisrelativelyhigherinheavilyindustrializedregions.Measurementsofthe atmosphericCO2 concentrationhavebeenmadeatMaunaLoa,Hawaii since1958asshowninFigure2.9[20].Thislocationisdistantfrom largecitiesandthereforemorelikelyaccuratelyreflectstheaverage globalcarbondioxidelevel.Overthepast67years,theCO2 concentrationhasrisenfrom315to400partspermillion(ppm)pervolume oftheatmosphere.ThepreindustrialCO2 concentrationbefore1800 isestimatedtohavebeen280ppm.ThemeasurementsshowtheCO2 levelvariesthroughouttheyear.Itgoesdowninspringandsummer andincreasesduringfallandwinterbyabout6ppm.Thisiscaused bybiologicalactivity.MostoftheEarth’slandmassislocatedinthe NorthernHemisphere.Carbondioxideisabsorbedbyplantsduring springandsummer.Correspondingly,vegetationdecaysinthefall andwinterreleasingcarbondioxidebackintotheatmosphere.Nevertheless,therehasbeenasteadyupwardtrendofover1ppmperyear
2.GLOBALWARMINGFORPOETS21 since1958.
Figure2.9:ChangeinatmosphericcarbondioxiderecordedatMauna Loa,Hawaiiovertime[20].TheredcurveistheannualaveragedCO2 level.
Amuchlongerrecordofcarbondioxideconcentrationhasbeen foundusingicecoresobtainedatVostok,Antarctica[58].Eachyear alayerofsnowaswellasdustfallsontothesurface.Theweightof succeedinglayerscompressesthesnowwhicheventuallyturnstoice. Airisthennolongerfreetobeexchangedwiththeatmospherebutis trappedinsmallbubbles.Figure2.10showstheconcentrationofCO2 measuredasafunctionofthedepthoficeretrievedfromaborehole atVostok.Thedateoficeformationcanbedeterminedfrommeasurementsoftheconcentrationofvariousradioactiveisotopes.The temperatureisdeterminedbymeasuringtheabundanceoftheheavier isotopesofoxygenandhydrogenintheice[59].Regularoxygenhas
Figure2.10:Vostok,Antarcticaicecoredeterminationofa)Temperaturechangerelativetothepresentb)CO2 concentrationandc)Dust concentrationforthelast400,000years.[58]
2.GLOBALWARMINGFORPOETS23 eightprotonsandeightneutronsandislabelled 16 O.Afewoxygen atomshavetwoadditionalneutronsandarethuslabelled 18 O.Similarly,somehydrogenatomshaveanadditionalneutronandarecalled deuterium.Theseheavierisotopescausesomewatermoleculestobe slightlyheavier.Ithasbeenobservedthattheconcentrationofthese heavywatermoleculesinsnowdependsonthetemperature.Aheavierwatermoleculerequiresmoreenergytoevaporatethanaregular watermolecule.Hence,atcoldertemperatures,theabundanceofthe heavierisotopesinwatervapourisless,whichinturnlowerstheir concentrationinsnow.Thisallowsthetemperaturetobedetermined.
Figure2.10showsaverystrongcorrelationbetweenthetemperaturechangeandthecarbondioxideconcentrationalthoughlesssowith dustthatwouldbeproducedbyvolcanoes.Itisespeciallynoteworthy thatthepresentCO2 levelof400ppm,ismuchhigherthanthatoccurringatanytimeinthepast400,000years!Theobviousquestionto askiswhichhappenedfirst.Anumberofrecentcarefulexaminations haveshownthattheincreaseinCO2 appearstohaveoccurredabout 800yearsafterthetemperaturebegantoincrease[60].Theincreasein CO2 isbelievedtohavebeencausedbythereleaseofcarbondioxideby awarmerocean.Asimilareffecthappenswhenabottleofcocacolais warmedproducingbubblesofcarbondioxide.Itdoesnotappearthat increasingatmosphericcarbondioxidewasresponsiblefortheinitial riseintemperature.However,thepossibilityexiststhatincreasesin CO2 levelscausedadditionaltemperatureincreases.Thequestionremainsastowhattriggeredtheinitialriseintemperatureandwhythe temperatureatalaterdatebegantodecreaseeventhoughtheCO2 concentrationwaselevated?
2.4InteractionofSunlightwithAtmosphere Thetheoryofglobalwarmingnecessitatesunderstandinghowsunlight interactswiththeatmosphere.Sunlightconsistsofallcoloursofthe spectrum.ThisisshowninFigure2.11wherewhitelightisseparated intoitscomponentcoloursbyaprism.Thehumaneyeissensitiveto visiblecoloursrangingfrombluetoredthatcorrespondtowavelengths from0.4to0.6microns.Thisisonlyasmallpartofthelightor radiationthatcomprisessunlight.Wavelengthslongerthanredlight areknownasinfraredradiationorheat.Athermometerplacedbeyond theredspectrumshowsanincreasingtemperatureduetoabsorptionof thisinfraredradiation.Similarly,ultravioletradiationhaswavelengths shorterthanbluelight.Ultravioletraysareofspecialconcernbecause toomuchexposurecancauseskincancer.
Figure2.11:Separationofwhitesunlightintoitscolourcomponents byaprism.
2.GLOBALWARMINGFORPOETS25 Figure2.12illustrateshowincomingsolarradiationinteractswith theatmosphere.Here,radiationreferstoallpossiblewavelengthsof lightcomprisingtheinfrared,visibleandultraviolet.Itshouldcome asnosurprisethatthehumaneyeevolvedtobesensitivetothevisible partofthesun’sspectrumthatisnotabsorbedbytheatmosphere. Radiationatwavelengthsbelow0.3micronsisscatteredbyaprocess calledRaleighscatteringwhichisafancynamereferringtothescatteringoflightbyairmoleculesinalldirections.Bluelightscatters muchmorethanredlightwhichexplainswhytheskyisblue.
Oxygenandozoneareimportantabsorbersoflighthavingwavelengthsnear0.3microns,blockingthisUVlightfromreachingthe Earth’ssurface.Inthe1980s,thealarmwassoundedthatozonehigh intheatmospherewasbeingdestroyedduetothereleaseofchemicalcompoundsknownaschlorofluorocarbonsthencommonlyusedin aerosolspraycansandinrefrigeration[61].Thesecompoundsbreak downreleasingchlorinewhichcanaccumulateespeciallyincloudsin thestratosphere,thepartoftheatmospherebetweenabout10to50 kmabovetheEarth’ssurface.Chlorineactsasacatalystbreaking downozone.Theresultingozoneholeisparticularlyacuteinpolar regionsduringwinter.Fortunately,atmosphericchlorofluorocarbon concentrationsareslowlydecliningasaresultofthe1986Montreal Protocol,aninternationalenvironmentaltreatythatsharplylimited theiruse[62].Thishistoryshowshowunforeseenchemistryinvolving justoneclassofcompoundscanhaveadeleteriouseffectontheability oftheatmospheretoprotecthumans.
Manymoleculesabsorbthesun’sradiationatinfraredwavelengths. Eachmoleculehasitsownfingerprintofwavelengthsorspectrumthat
Figure2.12:InteractionoftheatmospherewithincomingsolarradiationandoutgoingthermalradiationproducedbytheEarth.Major greenhousegasesincludewatervapourH2 O,carbondioxideCO2 ,oxygenO2 ,ozoneO3 ,methaneCH4 andnitrogenoxidemoleculessuchas N2 O.
2.GLOBALWARMINGFORPOETS27 itcanabsorb.Itisbymeasuringtheseabsorptionwavelengthsthat astronomersdeterminethegascompositionofplanetaryatmospheres. Figure2.12showsmethaneabsorbslightatwavelengthsof1.7,3.3 and8micronswhilecarbondioxideabsorbsat2.7,4.3and15microns.Theexactwavelengthandhowstronglyamoleculeabsorbs lightdependsonanumberoffactorsincludingthetemperatureand airdensity.Somemoleculesabsorblightmorereadilythanothers.A singlemethanemoleculeabsorbslightabouttentimesmorestrongly thanacarbondioxidemolecule.Hence,methanecansignificantly absorbradiationeventhoughitsatmosphericconcentrationismuch lowerthancarbondioxide.
ThesunwarmstheEarth’ssurface.Everyobjectemitsradiation thatdependsonitstemperature.Thesunisveryhotandtherefore producesvisiblelight.Coolerobjectsgenerateheatorinfraredradiation.TheEarth’ssurfaceradiatesthermalradiationatinfraredwavelengths.Thisoutgoingradiationisstronglyabsorbedandscattered bytheatmosphere.Hence,theatmosphereactsasablankettrapping theEarth’sheatwhichisknownasthegreenhouseeffect.Increasing theconcentrationofgasessuchascarbondioxideislikelytoincrease thethicknessoftheatmosphericblanketwarmingtheEarth.This wasfirstrecognizedbySvanteArrhenius,aSwedishscientist,who estimatedin1896thatdoublingtheCO2 intheatmospherewould increasetheaverageglobaltemperaturebyabout2 o C[63] 2 .This estimateisremarkablyclosetorecentestimates.
2 Scientistsarerenownedforboringtalks.Chemistswakeupwhentoldthat Arrheniuswasaverygoodphysicist.Unfortunately,thereweresomanyexcellent physicistsmeritingtheNobelPrizeintheearly1900sthathereceivedtheNobel PrizeforChemistryasaconsolation.
Watervapourisanespeciallystrongabsorberofinfraredradiation.Theabilityofairtocontainwatervapour,increasesstrongly withtemperatureasweknowfromhotmuggysummerdays.Hence, theatmosphericwatervapourconcentrationvariesconsiderablywith latitudeandaltitude.Ariseintemperaturewouldespeciallyaffect theArctic.Reducedicecoverwouldexposeopenocean,increasing evaporation.Modelsofglobalwarmingestimatethatthisincreasein watervapourisresponsibleforabouthalfoftheforecasttemperature increase[64].Amajoruncertaintyinpredictingtheeffectofwater vapourareclouds.Itispossible,althoughithasnotbeenobserved, thatanincreaseinwatervapourincreasesthenumberandthickness ofclouds.Cloudsnotonlyreflectincomingsunlight,butalsoscatter infraredlightorheat,actingasablanket.Cloudynightsarewarmer thanclearnightswhilethetemperaturedropswhenacloudblocksthe sun.Itisdifficulttodeterminewhethercloudscauseanetcoolingor heating[65].Thevarioustypesofclouds;cumulus,cirrusorstratus mayhavedifferenteffects[66].The1997IPCCreportdescribedclouds as“thelargestsourceofuncertainty”inpredictionsofclimatechange.
Anothercriticalfactorwhenconsideringtheinteractionofthe EarthwithsunlightisthereflectivityoralbedooftheEarth’ssurface. Itismuchhotteronasummerdaywhenwalkingacrossablackasphalt parkinglotasopposedtostrollinginapleasantmeadow.Astheold sayinggoes,ifyoupaveparadisetomakeaparkinglot,youchange theclimate[67].Thesurfacecoveringcanalsovaryconsiderablyfrom seasontoseason.Snowandicereflectlightmuchmorestronglythan openoceanordarksoil.MankindhaschangedtheEarth’sreflectivity notjustbybuildingsprawlingurbancentersbutbyploughingmil-
2.GLOBALWARMINGFORPOETS29 lionsofsquarekilometersofpristineprairieandclearcuttingforests tomakefarmland.
2.5ClimateModelProjections Beginningabout50yearsago,extensiveeffortshavebeenmadeto producecomputermodelsoftheglobalclimate.Thesearemassive undertakingsdonebylargeteamsofscientists.Twoofthemostwidely knownarebasedattheNationalCenterforClimateResearch(NCAR) atBoulder,ColoradoandtheHadleyCentreforClimatePrediction andResearchintheUnitedKingdom.Thefundamentalphysicallaws governingthebehaviourofagasarewellunderstood.However,a modeloftheatmospheremusttakeintoaccountanumberofdifferent gaseswhoseconcentrationsvarywithaltitude,latitudeandlongitude. Onealsoneedstoconsidertemporalchangesnotjustfromdaytonight butduetotheseasons.Theresponseofeachgastothesun’sradiation mustbeconsideredatdifferentwavelengths.Cloudsmustbemodelled, especiallyifonewishestoexamineprecipitation.Thesurfaceofthe Earthmustbeconsidered.Thealbedoorsurfacereflectivityvaries considerablyoverland.Theoceanscanexchangeheataswellasgases withtheatmosphere.Oceanandwindcurrentsarecomplicated.Itis impossibletoconsideralloftheseeffectsexactlyasthepowerofeven theworld’sfastestsupercomputersiscompletelyinsufficient.Many simplifyingapproximationsareessential.Typically,aglobalclimate modelisrunwithmanyparametersthatareadjustedsothatthemodel accuratelypredictstheclimateobservedduringthe20thcentury.One thenletsthemodelproceedintothefuturetomakepredictions.
Figure2.13showstheresultsofanumberofdifferentmodelsthat
Figure2.13:a)Predictedtemperaturechangeforvariousglobalclimatemodelsandb)Temperaturechangein2050relativeto1971-2000 [68].
2.GLOBALWARMINGFORPOETS31 considervariousfutureclimatescenarios.Thetemperatureduring the21stcenturyispredictedtoincreaseataratebetween2and5 o Cpercentury.Thehigherestimateisobtainedforthecaseofhigher greenhousegasconcentrations.Thiswarmingisnotpredictedtooccur uniformlyovertheEarth.ThetemperatureincreaseovertheArctic isexpectedtobeaboutfivetimeslargerthanthatexperiencednear theequator.Themodelsalsomakepredictionsaboutprecipitation, storms,sealevels,meltingofthepolaricecaps,etc.
Modelsareessentialforscientificprogress.Itisimportantthat theybetestedbycomparingtheirpredictionstoobserveddata.Inevitably,onefindsdiscrepanciesbetweenmodelsandobservationsthat leadtoarefinementofamodel.Thatdoesnotmeanthattheoriginal modelwastotalnonsense,merelyourunderstandingwasincomplete. Inscience,therearetimeswhenwebelievesomethingiswellunderstoodbutacomparisonwithobservationsshowsthatisnotthecase. Thiscanbefrustrating.However,scientificprogressrequiresthatwe behumbleenoughtorecognizethathumanintuitionisnotinfallible. Thisbooklooksattheevidence.Howcloselydotheglobalwarming theorypredictedchangesintemperature,precipitation,storms,etc. agreewithobservations?
3 IsTheEarthWarmer? Moderntemperaturemeasurementiseasy.Digitalthermometersin ourcarsandwatchesroutinelydisplaythetemperaturetoonetenthof adegree.Theinclusionofadecimaldigitispointless.Itdoesn’taffect ourdecisiontowearacoatbutautomanufacturersbelieveitcausesus toswoonoveranewvehicle.Manythermometersmeasurethechange ofamaterial’svolumeduetoachangeintemperature.Thiseffect hasbeenknownforthousandsofyears.Asimplethermometercanbe constructedbyenclosingwaterinaglasstube.Addingacolourdye facilitatesreadingthewaterlevel.Finally,anumericscaleisadded. Thethermometercanbecalibratedusingconvenientreferencessuchas freezing/boilingwaterorthebodyofahopefullyhealthyhuman.An obviouscomplicationarisesattemperaturesbelowthefreezingpoint orabovetheboilingpointofthethermometerfluid.
DanielFahrenheit(1686-1736)wasthefirsttousethermometers withmercurywhichexpandssignificantlywhenheated[69].Ithas meltingandboilingpointsof-39 o Cand357 o Crespectively,mak-
3.ISTHEEARTHWARMER?33 ingitidealformeasuringterrestrialtemperatures.TheFahrenheit temperaturescaleisdefinedbysettingthefreezingandboilingpoints ofwaterto32and212 o F,respectively.Itisnolongerwidelyused exceptinafewundevelopedcountriesandtheUnitedStates.Ithas beenreplacedbytheCelsiusorCentigradescalewhichusescommon sensetosetthefreezingandboilingpointsofwaterto0and100 o C respectively,asmeasuredatsealevelpressure.
ThermometerreadingshavebeenrecordedatsomeplacesinEuropeforover300years.Longerrecordsoftemperaturecanbeinferred usingsocalled“proxydata”.Anexampleisthethicknessofatree orcoralring.Theassumptionmadeisthattreesgrowmoreina warmyearthanwhenitiscold.Acomparisonofringsgrownduringarecentperiodforwhichthermometerreadingsexistpermitsthe temperaturetobeestimatedforyearsextendingbackforupto5,000 yearsinthecaseoftheBristleconepinespecies[70].Ofcourse,other factorsalsogoverngrowth.Mostnotably,propertreenutritionincludessufficientmoisture.Thislimitstheaccuracyoftemperatures inferredusingproxydata.Inaddition,agedbiologicalspecimensare notfoundeverywhereonEarth.Thischapterfocussesontemperature datameasuredbythermometers.
3.1DataAnalysis Itisimportanttounderstandthelimitationsofanyclimatedata. Everymeasurementhasanuncertainty.Instrumentssometimesfail orareimproperlyused.Theresultmayhaveanimpressivenumber ofdigitsbutiscompletelymeaningless.Forexample,adietermay proudlyannounceadecreaseinweightfrom60to55kg(1kilogram
=2.54pounds).However,ifthescaleoperatesincorrectly,nouseful informationisconveyedandtheexuberanceispremature.
SomeexamplesofflaweddataareshowninFigure3.1.Thefirst graphshowstheaverageminimumandmaximumdailytemperature observedatMoruyaHeads,Australia.Thelargechangeinmaximum temperatureduringthefirsttwoyearsofthestation’soperationis unlikelytoreflectanactualclimatechange.Amorelikelyexplanationisthattheweatherobserverdidn’tquitehavethehangofthe job.Perhaps,she/hedidnottakemeasurementsduringwinterwhen itwasdeemedtoocoldtoventureoutside.Themaximumtemperaturedataremainedfairlystableuntilabout1910whentherewasa suddendownwardsstepofabout2o C.Thisismuchlargerthanthe yeartoyeartemperaturevariationandthereforesuspicious.Suchsuddenstepsarecalledinhomogeneities.Itisnotclearwhatcausedthe abruptdownwardshiftinmaximumtemperatureatMoruyaHeads. Thisiscommonlythecaseasdocumentationofstationprocedureslet alonepicturesoftheinstrumentsandstationsitearemissing.Many oftheoriginalinstrumentsmaynolongerexist.Thisexplainswhy theWorldMeteorologicalOrganizationissuesmanualstostandardize observationprocedures[71].ForthecaseofAustralia,itisknown thatstandardizationofweathermeasurementswasintroducedaround 1910[72].Onestipulationwasthatthermometersbehousedinawhite woodenboxcalledaStevensonScreen.Regulationsstatetheproper boxheight,thesurroundinggroundcover,distancefromnearbytrees, etc.Itisreasonabletoexpectthemaximumtemperatureinsidesuch aboxwouldbelowerthanthatfoundbyathermometerdirectlyexposedtothemiddaysun.Thismayaccountforthedownwardshift
3.ISTHEEARTHWARMER?35 inthemaximumobservedtemperaturein1910.Itisnotknownwhat causedthedipintheminimumtemperatureduring1895-1910butis unlikelytohavebeenanaturalclimaticeffect.
Figure3.1:a)Minimumandmaximumtemperaturesmeasuredat MoruyaHeads,Australiaandb)winterrelativehumiditymeasuredat ThePas,ManitobainCanada.Theredpointsaresuspectasdiscussed inthetext.
Figure3.1bshowsaninhomogeneitywheretherelativehumidity abruptlydecreasedbyover10%from1970to1971atThePas,Manitoba,Canada.Similardownwardstepswerefoundinrelativehumidity observationsatmanyCanadianairportsduringwinter[73].Meteorologicalstationsarefrequentlyfoundatairportsthatmonitortemperatureandhumidity.Asairrises,thetemperaturefalls.Eventually thealtitudeisreachedwheretherelativehumidityis100%andclouds form.Hence,airportsmeasurerelativehumiditytoestimatecloud height.Thisinformationisconveyedtothepilotwhothenknowsat whataltitudetherunwayshouldbevisible.
Thedatesoftheinhomogeneities,similartothatshowninFigure3.1b,coincidedwithasystemwidereplacementoftherelative humiditysensorintheearly1970s.Thenewinstrumentcalledadewcelreplacedthepsychrometerthatconsistedofsocalledwetanddry bulbthermometers.Thewetbulbthermometerreferssimplytoawet clothwrappedaroundastandardthermometer.Thepsychrometeris operatedbyswingingthetwothermometersinacircularfashionlike acowboytwirlingalassoatarodeo.Atlowhumidity,waterreadily evaporatesfromthewetragandthewetbulbthermometerreadsa lowertemperaturethanthedrybulbthermometer.Thisisanalogous tosteppingoutoftheshower.Onegetscoldaswaterevaporatesfrom one’sskin.Therelativehumidityisdeterminedbythetemperature differencebetweenthewetanddrybulbthermometers.Aproblem occursatverylowtemperatureswhichatThePascanreach-40 o C inwinter.Thewetragfreezesinstantaneouslyandthepsychrometer nolongerworks.Thedewcelconsistsofasolutionoflithiumchloridethatabsorbsmoisturewhichchangesitselectricalconductivity.
3.ISTHEEARTHWARMER?37 Theelectricalresistancethereforedependsontherelativehumidity. Animportantadvantageisthedewcelcanbemonitoredbyeithera computerorahumanoperatorwhoremainsinawarmbuilding.
Itisusefultoexaminealargenumberofstationswhenstudyingpossibleclimatechange.Onethenfindstheaveragetemperature changewhichisrelativelyinsensitivetoinhomogeneitiesormeasurementerrorsuniquetoeachstationthatoccurindifferentyears.However,systemicchangessuchasautomationortheintroductionofa newinstrumentsuchastheStevensonscreenordewcel,canseriously affectaveragedata.Itiscriticaltocheckifdatahaveinhomogeneities beforeevaluatingclimatechangetrends.Failuretodosomayresult inaconclusionofexaggeratedclimatechangewheninfactwhatis occurringisinstrumentalfailureorhumanerror.
Mathematicianshavedevelopedtechniquestodiscoverandcorrect forinhomogeneities.Typically,oneaveragesdataforperiodsoftime immediatelybeforeandafterasuspectedinhomogeneity.Oneconcludesaninhomogeneityexistsifthedifferenceofthetwoaveragesis largerthantheyeartoyeardatascatter[74,75].Someresearchers havecorrectedinhomogeneitiesusingdataatnearbysurroundingstationsthatdonotexperienceinhomogeneities.Thisisunrealisticin remotepartsoftheworldsuchastheArcticwherethecloseststation maybeover1,000kmdistantandexperienceaverydifferentclimate. Adjustmentstodatacanbecontroversial.Therehavebeeninstances wheredatawereadjustedduetoachangeofinstrumentseventhough therewasnoapparentdiscontinuity[76].
Itiskoshertocheckforachangeintemperatureoveraperiodofa timeonlyafterdatahavebeencheckedforinhomogeneities.Typically,
Figure3.2:Effectofnoiseonthedeterminationofatemperaturetrend. Thesedataweregeneratedbyconsideringalineslopingupwardsat arateof1.0 o Cpercenturytowhichwasaddedrandomnoise.The noiseoftheredtimeserieshassixtimestheamplitudeasthatofthe blacktimeseries.Theslopeoftheblack(red)dataisfoundtobe 1.0 ± 0.2(1.0 ± 1.2) o Cpercentury.Theuncertaintyofthetrend derivedusingtheblackdataislessthanthetrendmagnitude.The trendisthensaidtobestatisticallysignificant.Correspondingly,the uncertaintyofthetrendfoundusingthereddataexceedsthetrend whichisthereforenotstatisticallysignificant.
onefitsastraightlinetothedata.Thedataarescatteredaboutthis linewhichisnotsurprisingbecausetemperaturevariesslightlyfrom yeartoyear.Onecanconcludethereissignificantclimatechange iftheyeartoyeartemperaturefluctuationissmallcomparedtothe temperaturechangeovertheperiodinquestion.Figure3.2showsa sampleofartificialdatathatillustratesthispoint.Theslopeoftheline fortheblackandreddotsis1 o Cpercenturytowhichrandomnoise hasbeenadded.Thenoiseamplitudeoftheredpointsissixtimes largerthanfortheblackpoints.Statisticiansassignanuncertainty tothetrendthattakesintoaccountthedatascatter.Intheexample showninFigure3.2,theblack(red)datatrendisfoundtobe 1.0 ± 0.2 (1 0 ± 1 2) o Cpercentury.Thetrendissaidtonotbesignificantif theuncertaintyexceedsthetrendmagnitude.Theuncertaintyisthe sameasthemarginoferrorofasurvey.Apoliticalpollstatingparty Xhas40%supportwithamarginoferrorof4%nineteentimesoutof twentymeansthereisa95%probabilitythattherealvotersupport ofpartyXisbetween36%and44%.Similarly,atrendof 1.0 ± 0.2 o Cpercenturymeansthereisa95%probabilitytheactualtrendis between0.8and1.2 o Cpercentury.
3.2SurfaceTemperatureObservations ThelongesttemperatureobservationsexistforstationsinEuropeas showninFigure3.3.Thestationhistoriesofsomeofthesestations suchasDeBilt,Netherlandshavebeencarefullyanalyzedtotakeinto accountinevitablechangesinthestationsiting,instruments,etc[77]. Nevertheless,uncertaintiesremain.Temperaturedatainthe1700s likelyhaveanuncertaintyofabout ±1 o Cwhilethatof1800sdatais
Figure3.3:AveragetemperatureforJanuary(blue),July(red)and annual(black)atthreeEuropeanstations.TheJanuary,Julyand annualtrendsinunitsof o Cpercenturyare
and 0 3 ± 0 1 atDeBilt,Netherlands;
atGeneva,Switzerland;and
atSt. Petersburg,Russia.
about ±0.5 o C.Monthlyaveragedtemperaturescanbedownloaded fromtheGlobalHistoricalClimateNetwork[78]orfromnational databasesmaintainedbyEnvironmentCanada[79]andtheAustralian BureauofMeteorology[80].
Theannualaveragetemperaturewascomputedifdatawereavailableforeachmonthoftheyear.TheaverageJanuary,Julyandannual temperaturesareshownalongwiththefittedtrendlines.Someyears arecolderthanothers.ForSt.Petersburg,Russia,Januaryof1813 followingNapoleon’sinvasion,wasoneoftheelevencoldestmonths everrecorded.Similarly,Januaryof1942,afterHitlerinvadedthe SovietUnion,wasthecoldestJanuaryin150yearswithanaverage temperatureof-10.9 o C.ThisnotonlyprovesGodfavouredRussia butillustrateshowweatherhasaffectedhumanhistory.
Figure3.4showsthelocationsofstationsforwhichdatawereretrieved.Nearlyallofthestationshavingmorethan150yearsofobservationsarelocatedinEurope.ThecontinentalUnitedStatesand partsofAsiaandAustraliahavedatarecordsextendingforoveracentury.Stationsdonotexistformostoftheglobe.Theabsenceofdata isparticularlystrikingforthelesshabitablepartsofthecontinents suchastheSaharadesert,Amazonbasin,polarregions,etc.andespeciallyfortheoceanswhichcomprise71%oftheEarth’ssurface.It wasnotuntiltheadventofsatellitemonitoringbeginninginthe1980s thatdatabecameavailablefortheentireEarth.
Thetemperaturetrendswerefoundforeachstationasshownin Figure3.5providedatleast80%ofdatawerepresentforallyears duringtheperiodinquestion.Moststationsexperiencedsignificant warmingasisshowninTable3.1.ThenumberofstationsinFigure
Figure3.4:Stationswhosetemperatureobservationswereexamined. 68stations(bluedots)havemorethan150yearsofdata,379(green dots)have100-150yearsofdataand429(reddots)havelessthan100 yearsofdata.
3.5isconsiderablylessthanthatinFigure3.4.Thereasonisthat manystationsdidnotoperatecontinually.Dataaremissingduring periodsofseverecivilstrife.NotablesucheventsincludetheAmerican CivilWar,theRussianRevolution,WorldWarIIandthepostcolonial periodinAfricawhentherewasagreatdealofpoliticalupheaval.
TheplotsoftemperaturetrendsinFigure3.5donotshowhow climatechangeisaffectingallpointsontheEarth.Suchamapwould bedesirabletocomparetothatpredictedbytheclimatemodelsas showninFigure2.13.Itcanbegeneratedbyinterpolatingthetemperaturebetweenstations.Forexample,ifoneknowsthatNewYork
Figure3.5:Mapofstationtemperaturetrendsfortheperiodsof(a) 1850-2000,(b)1900-2000and(c)1950-2000.Red(yellow)dotsrepresentanincreasingtrendthatis(not)statisticallysignificantwhile blue(green)indicatesadecreasingtrendthatis(not)statisticallysignificant.Trendsareplottedforstationshaving80%ofdataforall yearsduringtheperiodinquestion.
Table3.1:Numberofstationshavingdecreasing/increasingtemperaturetrendsfordifferentintervals.Thenumberofstationshaving statisticallysignificanttrendsisinbrackets.Trendswereonlyfound forstationshavingdatafor80%ofallyearsinthetimeperiodin question.
Interval Numberstationswith Numberstationswith decreasingtrend increasingtrend 1850-2000
Cityexperiencedawarmingof1.0 o CpercenturywhilePhiladelphia experiencedawarmingofonly0.45o Cpercentury,thenitisreasonable toassumethataplacemidwaybetweenthetwocitieslikePrinceton, NewJerseywillexperiencetheaverageofthetwotrends,whichinthis casewouldbe0.725 o Cpercentury.Suchinterpolationschemesbecomemoresophisticatedwhenonehasdatafromhundredsofstations. Nevertheless,ahugelimitationisestimatingthetemperaturetrendat placesthousandsofkilometersfromthecloseststationwhichmayexperienceaverydifferentclimate.Forexample,estimatingtemperature trendsoveraregionsuchasthesouthernIndianorPacificOceansover theperiod1850-2000hasahugeerror.Sometimes,scientistsbecome tooimpressedwithcomputerswhichdisplayaconsiderablenumber ofdecimaldigits.InthecaseofaveragingtheNewYorkCityand Philadelphiatemperatures,itwouldbesillytoclaimthatPrinceton
3.ISTHEEARTHWARMER?45 experiencesawarmingof0.725 o Cpercentury.Archivaltemperatures aretypicallygivento0.1 o Caccuracy.Sophisticateddataprocessing cannotyielddatahavinghigheraccuracy!Seriouscautionshouldbe exercisedwhenseeingamapdisplayingtemperaturechangeeverywhereontheglobe.Thisconveysafalseimpressionthatdataare availableforeveryspotontheEarthandarehighlyaccurate.
Analternativeanalysisusesdatafromallstationstocalculatethe changeintemperatureinagivenregion.Thetemperaturechangeis calculatedrelativetoareferenceperiodwhichiscommonlytakentobe the30yearperiodfrom1961-1990.Figure3.6showsthetemperature changethatoccurredforthecontinentslocatedintheNorthernand SouthernHemispheres.Usingadifferentreferenceperiodsuchas19712000doesnotchangethecurveshape,butonlyshiftsitslightlyupor down.
Thereisconsiderablescatterofthedatabefore1850whenrelativelyfewstationsexisted.ThetemperaturesfortheNorthernHemispherecontinentsexhibitgreateryeartoyearvariabilitythanisthe casefortheSouthernHemispherecontinents.Thisisnotaltogether surprisinggiventhatAsia,EuropeandNorthAmericahaveanapproximately50%greaterareaandtheclimaterangesfromthepolar tothetropical.Manyofthestationsinthesoutherncontinentsarelocatednearthecoastwheretheoceansmoderatetheclimate.Allthree northerncontinentsexhibitawarmingofabout0.5 o Cfrom1850to the1940s.Thiswasfollowedbyacoolerperiodduringthe1960sand 1970s.Incontrast,temperaturesremainedrelativelyconstantinthe southernhemisphere.Allcontinentsshowamarkedincreaseintemperatureofabout1 o Cduringthe1990sfollowedbyalevellingoff
Figure3.6:Temperaturechangerelativeto1961-1990ina)Northern andb)SouthernHemisphere.Solidlinesare5yearaverages.
after2000whichisknownastheglobalwarminghiatus.
TheglobaltemperaturechangeisshowninFigure3.7.Thiswas calculatedintwoways.First,anaverageofthestationdatawastaken. ThispreferentiallyweightsNorthAmericaandEuropewherenearly halfofthestationsarelocated.Analternativewastocombinethe timeseriesforthecontinentsexcludingAntarctica,forwhichthereare verylittledata,usingweightingfactorsproportionaltothecontinental areas.Theresultingtwocurvesdonotdiffersignificantly.
Figure3.7:Globaltemperaturechangerelativeto1961-1990.The blackdotsrepresentdatafoundbyaveragingthedataoverallstations whilethecrosseswerefoundbyweightingthevariouscontinentaltime seriesbythecontinentalarea.Theredandgreencurvesarethe5 yearmovingaverageswhilethebluecurveindicatesthenumberof stations.Thegreencurvewasonlyfoundforyearswheredataexist forallcontinentsexcludingAntarctica.
Table3.2showsthetrendsdependstronglyonthetimeperiod
considered.Thecalculationofthetrendsoveranintervalendingin 2014insteadofonlythemoreaestheticallypleasing2000,wasdoneto avoidminimizingtheeffectofglobalwarming.Exclusionoftheyears after2000,reducesthetrendsasshowninTable3.2.Forexample, thelargesttrendof 1 4 ± 0 3 o Cpercenturywasfoundfortheinterval 1950-2014butatrendof 1.1 ± 0.5 o Cpercenturyoccurredduring 1950-2000.Thishighlightstheeffectoftemperaturevariationsona decadaltimescale.Itshouldbenotedthatthemostrecenttrendsfor 2000-2014and2005-2014arenotstatisticallysignificantwhichisnot surprisingastheseintervalsarerelativelyshort.
Table3.2:Globaltemperaturetrendswerecalculatedfordatashown inFig.3.7forvarioustimeintervals.
Interval Trend Interval Trend (o C/Century) (o C/Century)
ThesurprisingresultofFigure3.7andthetrendsshowninTable 3.2arethatglobalwarminghasnotoccurredaspredictedbythe
3.ISTHEEARTHWARMER?49 modelsinFigure2.13whichforecastanuninterruptedexponential likewarming.Theslightlycoolertemperaturesinthe1950s,1960sand 1970srelativetothe1940swerenotedbyscientistsandafewarticles evenappearedinthepopularpressaboutacomingiceage[81,82].The suddentemperatureincreaseinthe1990sisalarminganditsarrestor hiatusfollowing2000ismysterious.Therewasnodecreaseinfossil fueluseafter2000.Indeed,theirusecontinuedtoincrease.There hasbeendiscussionaboutoceansactingasareservoirtoabsorbheat [83].However,theoceansalsoexistedinthe1990s.Whydidthey suddenlystarttoabsorbheatafter2000?Thisbehaviourwasnot predictedbyanyoftheclimatemodelsandthereason(s)foritisas yetunknown.Recently,therewasaclaimthatthehiatusisnotfound ifoceantemperatureswerecorrectedusingbuoyasopposedtoship observations[83].Itisnotclearwhytheoceansurfacewouldwarm whilethelandtemperaturesremainunchanged.
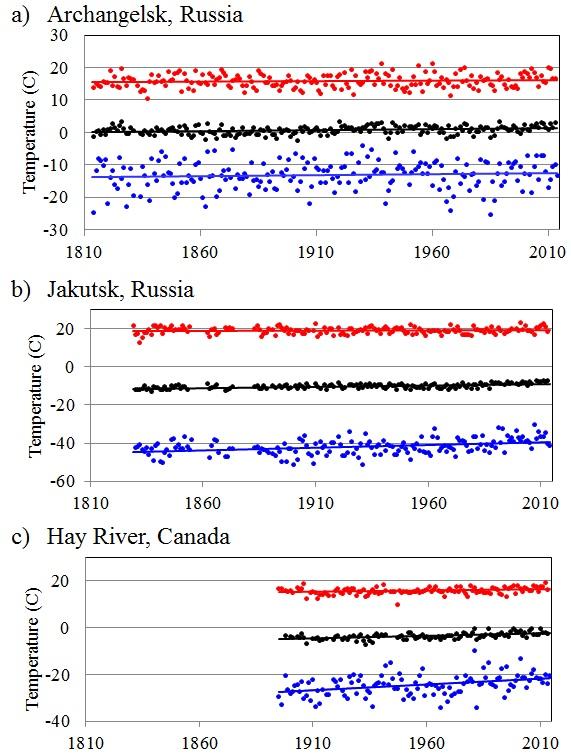
3.3SurfaceArcticTemperatureObservations TheArcticiswidelyconsideredtobethe“canaryinthecoalmine”1 asallthemodelspredictglobalwarmingshouldbemuchmorepronouncedinthisregionthanfortheEarthasawhole.ItisthereforeusefultoexaminetheArcticstationtemperaturesseparately[84].
Figure3.8showsobservationstakenatthreeArcticstationsthatexperienceverydifferentclimates.Archangelskislocatedinnorthern EuropeanRussiaontheWhiteSea.JakutskisinSiberiaandisoneof thecoldestplacesintheNorthernHemisphereinwinter.HayRiveris 1 Canarieswereusedincoalminesbeforetheadventofanimalrightstodetect odourlessmethanewhichishighlyexplosive.
Figure3.8:AveragetemperatureforJanuary(blue),July(red)and annual(black)atthreeArcticstations.TheJanuary,Julyandannual trendsinunitsof o Cpercenturyare 0.7 ± 1.0, 0.4 ± 0.5 and 0.6 ± 0.3 atArchangelsk,Russia; 2.9 ± 1.1, 0.1 ± 0.5 and 1.3 ± 0.3 atJakutsk, Russia;and 4 9 ± 2 2, 1 1 ± 0 8 and 2 4 ± 0 7 atHayRiver,Canada.
3.ISTHEEARTHWARMER?51 intheNorthwestTerritories,Canada.ThedatarecordforthesestationsismuchshorterthanthatfortheEuropeanstationsshownin Figure3.3.ThedataforJakutskalsoshowanumberofyearsofmissingdata.Thisisacommonoccurrenceforstationslocatedinremote regionshavinginhospitableclimates.
Figure3.9showsthelocationsof118Arcticstationsand50Europeanstationsforwhichtemperatureobservationswereexamined [85].Thetemperaturechangerelativetotheaverageoccurringduring 1961-1990wasfoundforeachstation.Thewarminghasbeengreaterin JanuarythaninJuly.Siberia,AlaskaandWesternCanadaappearto havewarmedslightlymorethanEasternCanada,Greenland,Iceland andNorthernEurope.Thewarminghasnotoccurredatasteadyrate. Muchofthewarmingindicatedbythetrendsfoundduring1800-2014 occurredinthelate1990s,andthedatashowtemperatureslevelled offafter2000.TheJulytemperaturetrendisevenslightlynegative fortheperiod1800-2014.
ThechangeinannualArcticandEuropeantemperaturesrelative to1961-1990isshowninFigure3.9b.TheEuropeandatainthe 1700sandtheArcticdataintheearly1800sshowconsiderablescatter becausedatawerepresentforrelativelyfewstations.Itisremarkable howcloselythetwocurvestrackeachother.Thisdoesnotagreewith thepredictionoftheglobalwarmingtheorythatArctictemperatures areincreasingmuchmorethanelsewhereontheplanet.Temperatures appeartohavebeenabitcoolerinthelater1800s,slightlywarmer around1940,coolerduringthe1950stothe1970sandwarmerduring the1990s.
Table3.3showsthetemperaturetrendsfortheEuropeanandArc-
Figure3.9:a)Mapof118Arctic(Red)and50European(Blue)stationsandb)Comparisonofannualtemperaturechangerelativetothat during1961-1990forEuropeanstations(blackdots)andArcticstations(openblacktriangles)[85].Thered(blue)curveisthemoving 5yearaveragefortheArctic(European)data.Thered(blue)dashed curvegivesthenumberofstationsfortheArctic(European)data.
3.ISTHEEARTHWARMER?53 ticstationscomputedforvarioustimeintervals.Thetwosetsoftrends agreeremarkablywell.Typically,theJanuarytemperaturesexhibit greaterwarmingthantheJulydata.Itisnotclearwhythisisthe case,althoughitcouldbeevidenceofashiftinglobalweathercirculationpatterns.Therearewellknownchangesinthejetstreamthat controlthelocationoflargehighandlowpressuresystems.Measurementsshowasmalldecreaseinwintersurfaceairpressureoccurred overnorthernCanadaduringthesecondhalfofthe20thcentury[86]. Thisislikelyduetoashiftinthepositionofthejetstreamwhich insomewintersbringsrelativelywarmairtoAlaskaandNorthern
Table3.3:ComparisonofEuropeanandArctictemperaturetrends inunitsof o Cpercenturycalculatedforvarioustimeintervals.The intervalsforJulyandAnnualtemperaturesendin2013.
Dataset
EuropewhilefrigidairreachesfarsouthintotheUnitedStates[87]. Inotherwinters,thejetsteambringsstormsfurthernorthcreating wetterweatherinAlaskaandNorthernEurope.Coldwinterairthen doesnotextendasfarintothemiddleofNorthAmerica[88].
TheclosecorrelationoftheArcticandEuropeantemperaturesis somewhatsurprisingsincetheEuropeanstationsarenearlyalllocated inlargemetropolitanareasthathaveexpandedsubstantiallyduring thepast250yearsastheirpopulationshavegreatlygrown.Citiesuse energyandalsochangethesurfacereflectivityoftheterrain.Studies haveshownthatthisurbanheatislandeffecthasincreasedtemperaturebyasmuchas1 o C,althoughthereissomeevidenceforcities suchasLondon,Englandthatithaslevelledoffsince1981[89].The urbanheatislandinducedincreaseinminimumtemperaturealsohas beenfoundtobetwicethatforthemaximumtemperature.Thisis consistentwiththeresultthattemperatureshaveincreasedmorein JanuarythaninJuly.
AirmassesinEurope,northernAsiaandNorthAmericadonot stopattheArcticCircle.Hence,itisreasonablethatiftemperaturesinEuropechange,temperaturesintheArcticchangesimilarly. TheSouthernHemispherehasdifferentweathersystemsandtherefore experiencesdifferenttemperaturetrends.Thus,thesuddenincrease intemperaturesinthe1990sintheNorthernHemisphereislesspronouncedintheSouthernHemisphere.AsPresidentKennedysaid, “Weallbreathethesameair”,atleastineachhemisphere[90].
3.4TroposphereTemperatureMeasurements Satellitesunlikestations,areidealformonitoringtheentireEarth. Theyalsomeasurethetemperatureoftheentireatmospherenotjust attheEarth’ssurface.Globalwarmingpredictsincreasestonotjust thesurfaceairtemperaturebuttoalloftheatmosphere.Beginningin 1979,scientistsbegantomeasurethetemperatureofthetroposphere [91,92].Thisistheregionoftheatmosphereextendingfromthe Earth’ssurfacetothetoplevelofclouds.Itsthicknessrangesfrom about7kminpolarregionstoashighas20kmaroundtheequator. Thetropospherecontainsabout75%oftheatmosphere’smassandis responsiblefortheweather.
Theheatradiatedbythetroposphereismeasuredbydetectorson satellitesthataresensitivetovariousmicrowavefrequencies.Therelativesizesofthedifferentmicrowavesignalsallowstheatmospheric temperaturetobedetermined.Thisissimilartomeasuringtheintensitiesofdifferentcoloursoflightemittedbyanobject.Inthecase ofthesun,moreyellowlightisproducedthanredorbluelight.An objectatamuchlowertemperaturesuchasthetroposphere,emits lightnotinthevisiblebutinthemicrowaveregionofthespectrum. Acomparisontomeasurementsmadeusinghighaltitudeballoonswas carriedouttovalidatethesatellitedeterminedtemperatures.Figure 3.10comparestheresultstothosepredictedbyclimatemodels.The measuredtropospheretemperaturehasincreasedbylessthan0.2 o C since1978whichisbelowthepredictionsofallclimatemodels.Indeed, theaverageincreasepredictedby102modelswasatemperatureincreaseof1 o C.Thisisaverylargediscrepancythatisnotunderstood atall.
Figure3.10:Comparisonofclimatemodelprojectedtropospheretemperatureswithsatelliteandballoonmeasurements[93].Variousclimatemodelprojectionsaregivenindashedcolouredlightlines.The averageof102climatemodelrunsisshownbythethickredline.The balloon(satellite)measurementsaregivenbytheblue(green)data points.
4 AreGlaciersShrinking? AwarmerEarthimpliestherewillbelessice.However,itisn’tnecessarilythatsimple.Aglaciertypicallymeltsduringthesummerand gainssnowduringwinter.Ifwinterprecipitationdecreases,glaciers canstillretreateveniftemperaturesremainconstant.Reportsabound thatmostglaciersbeganshrinkinginsizeaftertheendoftheLittle IceAge[94].ThefamousAthabascaGlacier,apartoftheColumbia IceFieldintheCanadianRockyMountains,hasretreatedby1.5kilometersoverthepast125years[95].Thisretreatrateof12meters peryearissignificantbutlessthanwhatoccurredattheendofthe lasticeage.TheretreatrateoftheNorthAmericanicesheetcan becrudelyestimatedbydividingitssizeofabout5,000kilometersby 10,000yearsyielding500metersperyear.
Glaciersarenotjustimportantscenicattractionsbutcriticalfor moderncivilization.RiverssuchastheGangesandColoradooriginate frommeltingglaciers.Theyarethelifebloodofagricultureandsupply drinkingwaterformillionsofpeople.Hence,theissueofshrinking
glaciersisofgreatconcern.
Figure4.1:MountKilimanjaro,Tanzania.GlaciersatopAfrica’shighestmountainhaverecededdramaticallyduringthelast100years.
OneofthefastestglacialretreatshasaffectedAfrica’stallestmountain,MountKilimanjaro,TanzaniashowninFigure4.1.Itisoneof thefewplaceswhereAfricanscanexperiencesnow.In2002,Mount Kilimanjaro’sglacierswerepredictedtobecompletelygonebetween 2015and2020[96].Asubsequentstudycomparedpicturesofthe mountainfrom1912to2011andconfirmedthatMountKilimanjaro haslost85%ofitsicecoveroverthelast100years[97]!However, theiceremainsasof2016.Interestingly,hikershavenotedverylittle meltwatercomingfromMountKilamanjaro.Itturnsoutthatmuch oftheicedoesn’tmeltbutturnsdirectlyintowatervapourorsubli-
4.AREGLACIERSSHRINKING?59 mates.Thedriertheair,themoresublimationoccurs.Itnowappears thatthedominantcauseoficeretreatisnotawarmingtemperature butdecreasinghumidityaroundthemountainduetodeforestationof thesurroundingarea[98].ThereductionofMountKilamanjaro’sice isduetohumanactivitybutnotinthewayexpectedbytheglobal warmingtheory.ThiscauseoftheretreatofMountKilimanjaro’s glaciersisundoubtedlyunique.Itillustratesthatthingsarenotalwaysassimpleastheyappearatfirst.Sometimescautioniscalledfor beforejumpingtoconclusions.
4.1ArcticIceCap Theworld’slargestglaciersareofcourselocatedattheNorthand SouthPoles.ThelargestvolumeofArcticiceiscontainedinthe Greenlandicesheet.Ithasavolumeofabout 2.6 millionkm3 and coversanareaofabout1.7millionkm2 withathicknessrangingupto threekilometers[99].TheremainingArcticiceisfloating.Socalled multiyearicehasatypicalthicknessbetweenthreetofourmeterswhile singleyeariceisonlyaboutonemeterthick[100].Thepolaricehas itsminimumextentinSeptemberandmaximuminMarchwhenit extendssouthtotheshoresofRussia,Alaskaandcompletelycovers HudsonBay,Canada.
Theextentofthepolaricecapshasbeenmonitoredsince1979by satellites.Figure4.2showstheArcticicecaphasbeensteadilyshrinking.ThereductionhasbeenespeciallynoticeablenorthofSiberiaand nearGreenlandinrecentyears[101].Thisisnotsurprisinggiven thatArctictemperaturesincreasedduringthatperiod.Theminimum iceextentobservedinSeptemberhasbeendecreasingfasterthanthe
Figure4.2:ArcticIceCap.a)ArcticIceinSept.2014.Thepinkline showstheaverageextentduring1979-2014andb)theareacovered byatleast15%iceduring1978-2015.Slopesofred(September), blue(March)andblack(annual)linesare 8.7 ± 1.7, 4.1 ± 0.9 and 5.2 ± 0.7 millionkm2 percentury.
4.AREGLACIERSSHRINKING?61 maximumiceextentwhichoccursinMarch.Thiscanbeexplained asadecreaseintheicethicknesswhichhasbeenfoundbyanalyzing datarecordedbysubmarines[100].ExtrapolationoftheSeptember trend,leadstoapredictionofnosummerArcticiceby2070.Thishas alarmedanumberofcountriesastheprospectofexpandedshipping intheArcticoceanincreasestheriskofoilspillsthatwoulddamage thefragileArcticecosystem[102].SailingbetweenEuropeandAsia viaanicefreeArcticoceanwouldsignificantlyshortenshippingtimes andtherebyreducecosts,especiallyforlargevesselsthataretoolarge touseeitherthePanamaorSuezcanals.
RecordsofwintericecoverfortheBalticSeaexistfornearly300 yearsasshowninFigure4.3[103].TheBalticSeaextendsfroma latitudeof53 o Nto66 o Nandhasanareaof420,000km2 .Itsice coveragevariesfromyeartoyear.NearlytheentireBalticisicecovered insomeyearssuchas1987.Theaveragemaximumextentofwinter icecoveredhalfoftheBalticduring1720to2013.Thetrendline slopesdownwardatarateof-4.8%percentury.Thereisnoticeable variationoftheicecoverageondecadaltimescales.Themaximum iceextentaveraged35%during1988-2013butwas54%duringthe preceding25yearperiod.Anotherexamplearetheperiods1868-1893 and1894-1919whichhadicecoveragesof55%and43%,respectively. Theicecoverageinrecentdecadesisthelowesteverrecordedbutstill notundulyso.Theaveragemaximumicecoverageforthewinters between1817and1826wasonly40%.
ThetrendinBalticicecoverageis-56%percenturyfortheperiod1979-2013.Extrapolationofthe1979-2013trendlineleadstoa predictionofzeroBalticicecoverin2073.Thiscloselymatchesthe
Figure4.3:a)VariationofmaximumextentofBalticSeaiceduring 1981-1991andb)MaximumfractionofBalticSeaicecoveredinwinter from1720to2013[103].Theredcurveisthe5yearmovingaverage ofthedata.
4.AREGLACIERSSHRINKING?63 recentchangeintheArcticicecoverage.Thisleadstothequestion ofwhetherthelast35yearsaretrulyrepresentativeoftheArcticclimate?TheNorthernHemispherewascoolerduringthe1950sto1970s aswasdiscussedinthepreviouschapter.Unfortunately,theArctic icedatarecordistooshorttoshowthepossibleeffectsofdecadal temperaturevariations.
ScientificinvestigationshavebeencarriedoutintheArcticfor aboutacentury.AninterestingarticledescribesaNorwegianexpeditiontoSpitzbergen[104].Itstates:“TheArcticseemstobewarming up.Reportsfromfishermen,sealhuntersandexplorerswhosailthe seasaboutSpitzbergenandtheeasternArcticallpointtoaradical changeinclimaticconditions,andhithertounheardofhightemperatures.”Itadds“whereformerlygreatmassesoficewerefoundthere arenowoftenmoraines,accumulationsofearthandstones.Atmany pointswhereglaciersformerlyextendedfarintothesea,theyhaveentirelydisappeared....Greatshoalsofwhitefishhavedisappearedand sealsarefewinnumber.”Thewatersformerly“heldanevensummer temperatureofabout3 o C;thisyearrecordedtemperaturesupto15 o C andlastwintertheoceandidnotfreezeoverevenonthenorthcoastof Spitzbergen.”Thearticlewaspublishedin1922[104].Thisindicates thatsomecautionmaybewarrantedbeforemakingpredictionsofan icefreeArcticinthenearfuture.
4.1.1PolarBears AnimportantquestioniswhetherthereductionofArcticiceduring thelastfewdecadeshasaffectedtheecosystem?Themajesticpolar bearhasbecomethesymbolofthisconcern.Figure4.4manifeststhe
effectofclimatechangeasoneseesalonelypolarbearclingingtoa residualiceflow.
Sealsaretheprimarystapleofthenaturalpolarbeardiet.These aretypicallyhuntedattheedgeoftheicepack.Polarbearshavetheir youngduringwinteronland.Inspring,mothersgorgethemselveson sealmeat.Theworryisthatastheicerecedes,mommypolarbears mustexpendcopiousamountsofenergyswimmingtotheirfoodsource. Thismaybeespeciallyhardonrecentlyborncubs.
Mankindhashadadevastatingeffectonpolarbearsprincipally byhunting.Inthe1960s,over1,000werekilledannuallylargelyfor sport.Legitimateconcernsaboutpossibleextinctionresultedinthe InternationalAgreementontheConservationofPolarBearsin1973, signedbyCanada,Denmark,Norway,theSovietUnionandtheUnited States[105].Commercialhuntingwassharplyrestricted.Anexception wasmadeforaboriginalpeoplesusingtraditionalmethodstohunt.
Thenumberofpolarbearsseemstohavereboundedsince1973 buttheexactpopulationisquiteuncertain,especiallyinnorthern Russia.ThebestestimatesprovidedbythePolarBearSpecialist Groupindicatethatthetotalpopulationofabout15,000bearsinthe 1970sincreasedtobetween20,000and25,000by1990[105].There hasnotbeenasignificantchangesincethen.Nineteensubpopulations occupyingdifferentgeographicareasoftheArcticarerecognized.Asof 2015,thereareinsufficientdatatojudgethepopulationsof9regions,6 areasappeartohaveastablepopulationwhile3(1)subpopulationsare decreasing(increasing).Theconclusionisthatmankindhasadversely impactedpolarbearpopulationsbutitisnotclearwhatroleifany climatechangehasplayed.Moreaccuratecensusdataareneeded.
Figure4.4:a)Iconicpictureofapolarbearclingingtoaresidualice floeandb)Polarbearsintheirnatural?habitatatthegarbagedump inChurchill,Manitoba,Canada.
4.2AntarcticIceCap TheAntarcticicesheetsaretheworld’slargestwithavolumeofabout 27millionkm3 [106].TheAntarcticicesheetisnearlyallonlandalthoughpartofitisbelowsealevel.Theicethicknessaveragesseveral kilometerswithamaximumthicknessofjustunderfivekilometers. TheAntarcticicesheetappearstobegrowingsomewhatasshownin Figure4.5.TheSeptember2014iceareawasthelargesteverrecorded sinceobservationsbeganin1979.Theicesheetappearstobeincreasingatarateofseveralmillionkm2 percenturyatallplacesaround thecontinentwiththeexceptionoftheAntarcticpeninsulathatjuts northwardtowardSouthAmerica.
ObservationaldatafromAntarcticstationsareverysparseasshown inFigure4.6.Lessthanadozenstationshaveexisted,operatedby variousnations.Allbuttwostationsarelocatedonthecoast.AstationattheSouthPoleisrunbytheUnitedStateswhiletheRussians haveastationatVostok,whichisnearthesoutherngeomagneticpole andisalsothecoldestplaceontheplanet.Moststationsonlybegan operationafter1955.
Figure4.6showstheaverageannualtemperatureforninestations. OnlyFaradayandRothera,bothontheAntarcticpeninsula,have experiencedastatisticallysignificantwarmingduringtheperiod19552014.Thisisconsistentwiththeobservedreductionoficeinthis areashowninFigure4.5.Allotherstationshavenotexperienced astatisticallysignificanttemperaturechange.FaradayandRothera areclosesttosomeglaciersinthewesternAntarcticthathavebeen reportedinrecentyearstobeincreasingtheirflowtowardthesea [107].Interestingly,theregionnexttotheAntarcticpeninsulaisone
4.AREGLACIERSSHRINKING?67 Figure4.5:AntarcticIceSheet.a)AntarcticIcesheetinJuly2014. Theorangelineshowstheaverageextentduring1979-2014.b)the areacoveredbyatleast15%iceduring1978-2015.Slopesofred (February),blue(September)andblack(annual)linesare 1 5 ± 1 2, 2 1 ± 1 2 and 2 2 ± 0 9 millionkm2 percentury.
Figure4.6:a)LocationofAntarcticstationsandb)Annualtemperaturesobservedduring1945-2014.Thetrendswerecomputedforthe period1955-2014.Areddotsignifiesastatisticallysignificantwarmingtrendwhileared(blue)crossdenotesaninsignificantwarming (cooling)trend.
4.AREGLACIERSSHRINKING?69 ofonlytwoareasthatarepredictedbytheclimatemodelstocoolby 2 o CasshowninFigure2.13.Itshouldbenotedthatthetimeseries forFaraday,Rotheraandseveralotherstationshavelargeamountsof missingdata.Thedatathatdoexistdonotshowconvincingevidence ofawarmingAntarcticclimate.
ThereisamarkedcontrastbetweentheArcticandAntarctic.The Antarcticissurroundedbyseasandinteractslesswiththeweather oftherestoftheSouthernHemispherethandoestheArcticwith themoresouthernpartsoftheNorthernHemisphere.Watervapour increasesintheArcticalsoenhancethewarming.Ithasalsobeen suggestedthatpollutionaffectstheArcticmorethantheAntarctic. Inrecentdecades,Arcticsnowisnotpristinewhitebutsometimesis greyincolour.ManyofthelargestpollutingcountriessuchasChina, whichrecentlypassedtheUnitedStatestobecomethelargestemitter ofgreenhousegases,arelocatedintheNorthernHemisphere.The largestsourcesofArcticsootpollutioninGreenlandnowappearto beSouthAsia[108].Thischangeinalbedomeansthatlesssunlight isreflectedandcanhaveasignificantwarmingeffect[109].Finally,it isinterestingthatrecentobservationsofmeltingglaciersinGreenland donotagreewiththeclimatemodelresultshowninFigure2.13which predictslesswarmingforGreenlandthanotherareasoftheArctic.
4.3OutdoorSkating InCanada,everycitizenlearnstoskate.Itisthedutyoffathersto makeanicerinkinthebackyard1 .Ourfamilyhaspursuedthistradi-
1 Thiscommentisclearlysexist.Alas,Messrs.H.Clinton,B.Friedanetal haven’texpressedanyinterestinjoiningthisprofession.
tionwithvigour,undoubtedlyenhancedbytalesofancestorsskating onfrozencanalsinHolland.GrowingupnearDetroit,myfatherwent outyearafteryearinthemiddleofthenighttowaterthebackyard rink.Ihaveinheritedthisabilityandhavemadeicerinksforthelast 20yearsbehindourhouseinTorontoasshowninFigure4.7.Itisalwaysinterestingtohearoldercolleagueswaxnostalgicallyabouttheir icerinkmakingdaysandlamentthatitisnolongerpossibledueto thewarmerwinters.NotthatwintersinTorontoarebalmy,butallof us“know”theyarewarmer.Butwhatdoesthetemperaturerecord show?
Figure4.7bshowsaplotoftheaverageJanuaryFebruarytemperatureinTorontoandDetroit.Therewasaclusterofparticularly coldwintersinthelate1970sandearly1980s.Onealsoseesthat theTorontowintertemperatureisincreasingmuchmorethanforDetroit.Thatissomewhatmysterious.Torontoislocated350kilometers eastofDetroit.Surely,theairisn’twarmedasitcrossestheinternationalborder.Table4.1showsthetemperaturetrendsatBuffalo, NewYorkandErie,Pennsylvania,twostationsmuchclosertoToronto thanDetroit.Toronto’swarmingclearlyisanomalous.Thisislikely anillustrationoftheurbanheatisland.Toronto’sweatherstation originallywaslikelylocatedinanareathatwasnotheavilyurbanized.AsTorontoexpanded,thelandsurfacechanged.Indeed,the differencebetweenthewintertrendsforTorontoandDetroitentirely disappearsifoneconsiderstheperiodafter1950.
TheregionaltemperaturedatadonotsupporttheclaimthatwintersinTorontohavebecomemuchwarmer.Thisisadifficultrational argumentforsometoaccept.Iregularlygetaccostedabouttheim-
4.AREGLACIERSSHRINKING?71 Figure4.7:a)Icerinkintheauthor’sTorontobackyardandb)average JanuaryFebruaryTemperatureinToronto(red)andDetroit(black) from1840to2014.Solidlinesarethetrendlines.
Table4.1:JanuaryFebruaryTemperatureTrends.
Cpercentury
possibilityofmakingoutdooricerinksandhavebeguntosuspect somethingotherthanscienceisgoingon.Inevitably,mygreyingmale interlocutorclaimsheismuchwarmerinrecentwinters.Theargumentisstronglybolsteredbyhisnearbyspouse.Perhapssherecalls beingwokenupinthemiddleofthenightbyahusbandreturningto bedafterwateringtherink.Hishugwasnotmeanttoinitiatearomanticencounterbuttodethaw.But,maybetheoldchapiswarmer. Afterall,heislikelyinsidehishousechattingtograndchildrenonthe cellphoneratherthanplayingwithtenyearoldsinthesnow.
Anothercountrywherewarmerwintertemperatureswouldaffect culturalskatingtraditionsistheNetherlands.TheAvercamppainting,showninFigure2.4,illustratesthatskatinghasbeenanational pastimeforcenturies.MyDutchcousinswhinethatthereasonthey skatepoorlyisnotalackofathleticprowessbutthatthecanalsseldomfreeze.Thisisconfirmedbymanyagedrelativeswhotalkabout skatingontheRhineRiverinMarch,1929andaboutthefamously
4.AREGLACIERSSHRINKING?73
coldwintersduringtheSecondWorldWar.ThelasttimetheRhine Rivercompletelyfrozeoverwas1963.
ThevalidityofthisfolklorecanbestudiedbyconsideringthetemperaturedatarecordedforDeBilt,Netherlandswhichcoverstheperiod1706-2014.Theaveragetemperaturewasfoundfortheprime skatingmonthsofJanuaryandFebruary.ThehistograminFigure4.8 showsonly49years,oraboutoneinsixwinters,hadanaverageJanuaryFebruarytemperaturebelow0 o C.ThenormforaDutchwinter isthatitdoesn’tfreezeforprolongedperiods.Therewereonly14 winterswithaJanuaryFebruarytemperaturebelow-2.5 o C 2 .Four ofthesewintersoccurredinthe1700s,andfiveeachinthe1800sand 1900s.Thetwocoldestwintersoccurredin1942and1963withaverageJanuaryFebruarytemperaturesof-4.7and-4.4 o C,respectively. Fourcoldwintersoccurredduringtheperiod1929to1947whichlikely accountsforthefamilialoralskatingtales,whereasnotasinglecold winteroccurredfrom1856to1928.
OnemayaskhowrepresentativetheAvercamppaintingwasof theDutchwinterclimate.Avercampmadehispaintingduringthe LittleIceAgein1608whentemperatureswereabitlower.Ashift of-2 o CinthehistogramgiveninFigure4.8wouldmorethandoublethefractionofwintershavingJanuaryFebruarytemperatureless than-2.5 o C,from4.5%to11%.Coldwinterswouldhavebeenmore likelybutstillnotadependableannualoccurrence.Inalllikelihood, HendrikAvercampwasapoorartist,strugglingtocompetewithcontemporariessuchasRembrandtvanRijn.Apaintingshowcasingthe relativelyunusualcoldwinterscenewouldbeeasiertosellthanone
2 Thesecoldwinteryearswere:1709,1740,1784,1795,1803,1814,1823,1838, 1855,1929,1940,1942,1947and1963.
documentingatypicallydrabdrearywetDutchwinter.
Figure4.8:HistogramshowingthepercentageofwinterswithaverageJanuaryFebruarytemperaturesin1 o CincrementsforDeBilt, Netherlandsduring1706-2014.
5 AreTheOceans Changing? 5.1SeaLevel Theobviousresultofmeltingglacierswouldbetoincreasesealevel. AnincreaseofaboutsixmeterswouldoccuriftheentireGreenlandice sheetweretomeltwhilethedemiseoftheAntarcticicesheetswould increaseoceanlevelsbyover60meters[99].Thiswouldinundate coastalareasdisplacinghundredsofmillionsofpeople.
Itisimportanttorealizethatsealevelsonlychangeifglaciers locatedonlandmelt.ThemeltingoftheentirefloatingArcticice capwouldhavenoeffect.Thereasonisthatfloatingicedisplacesa volumeofwaterthatexactlyequalsthevolumeitwouldoccupyifthe icecompletelymelted.Thisisreadilydemonstratedbyputtinganice cubeinaglassofcocacola.Drawalineatthewaterlevel.Thentalk toyourfrienduntiltheicemelts,withoutdrinking!Thecocacola
levelwiththeicefullymeltedwillbeunchanged.
Figure5.1ashowssealevelhasrisenover100meterssincetheend ofthelasticeage.Therateofsealevelrise10,000yearsagoexceeded 10mmperyear.Ancientsealevelscanbeestimatedusingfossilcoral reefs.Coralreefsgrowverticallyassealevelincreasessuchthatthe distancetotheoceansurfaceremainsapproximatelyconstant.The ageofsuccessivelevelsofcoralcanbedeterminedbymeasuringthe concentrationofvariousradioactiveisotopessuchas 14 C[111,112].
Modernsealevelmeasurementsaredeterminedbyaveragingthe lowandhightidelevels.Figure5.1bshowsthatsealevelroseatan averagerateofabout2mmperyearbetween1870and2000[113]. Thishasincreasedto3.5mmperyearforthemostrecentdatacoveringtheperiod1994-2008.Thiscoincideswiththetemperatureincreaseofnearly1 o CthatoccurredintheNorthernHemisphereas wasdiscussedinthepreviouschapter.Asignificantcomplicationin thisdeterminationisthelandmaybesubsidingorrebounding.The coastalareaborderingHudsonBayisrisingatarateofabout10mm peryear[114].Thissocalledisostaticreboundoccursbecausethe landnolongerisdepressedbytheweightofkilometerthickicesheets thatexistedduringthelastIceAge.
Theincreaseinsealevelsiscausednotjustbyadditionalwater suppliedbymeltingglaciersbutalsobythewater’sthermalexpansion.Themaximumdensityofwateroccursat4 o C.Thisisapproximatelytheoceantemperatureatdepthsbelow1000m[115].Mostof theocean’sheatiscontainedinthetopfewhundredmeters.A200 metercolumnofwaterwhosetemperaturechangesfrom20to21 o C wouldincreaseinheightby14mm.Sealevelshouldincreaseasthe
5.ARETHEOCEANSCHANGING?77 Figure5.1:a)SealevelchangesincethelastIceAgeandb)Observed sealevelchangefrom1870-2010[110].
oceanabsorbsheatfromawarmingatmosphere.Estimatesvarybut itappearsthatthissocalledthermostericcontributionisresponsible foranincreaseofsealevelthroughoutthe20thcenturyofabout1 mmperyear[116].Thiseffectisdifficulttoestimate,inpartbecause thetransferofheatviaoceancurrentsisnotwellunderstood.Itmay takedecadesorevencenturiesbeforeheatistransferredtothedeep oceandepths[117].Evenifglobalwarmingstoppedtoday,thetemperaturechangethathasbeenobservedtobeabout1 o Cduringthe 20thcenturywouldberesponsibleforfuturethermostericsealevel increases.
Sealevelriseisasignificantconcernandnowherehasthefight againsttheseabeenaslongstandingasintheNetherlands.Apopular sayingisthatGodcreatedtheworldbuthumansmadetheNetherlands1 .Figures5.2and5.3showhowthecoastlinehaschangedover time.Mostnotablehasbeentheappearanceofaninlandseaknownas theZuyderZee(SouthernSea)thathadadepthoffourtofivemeters beforepartsofitwerereclaimedinthe20thcentury.In500B.C.,this centralareawasamarshyregionconsistingofsmalllakescalledLacus FlevobytheRomans.Therewereseverallargefloodsinthe1100sand 1200sthatarebelievedtohaveseriouslybreachedthenortherncoastal sanddunesthatactedasadike.Thisinturnfacilitatedtheinland flowofseawaterwhichfurthererodedthepeatrichsoils.Itwasat thistimethatthenameZuyderZeecameintousage[119].Figures 5.2and5.3alsoshowthenorthernsanddunesoriginallyconnectedto themainlandarenowaseriesofislands.Similarly,theseahasmade
1 ThestruggleagainsttheseahasshapedtheDutchcharacter.Dutchpeople alsotendtoberathertall.Whenaskedwhythatisthecase,myresponseisthat theshortonesdrowned.
Figure5.2:ChangingcoastlineoftheNetherlandsa)500B.C.andb) 800A.D.[118]
Figure5.3:a)TopographicalmapoftheNetherlandsrelativetosea levelandb)Effectofsuccessivedikeraising.Thefarmhouseonthe leftsideofthedikewasbuiltseveralhundredyearsago.Ithasbecome embeddedinthedikewhichwassuccessivelyraisedtopreventflooding.
5.ARETHEOCEANSCHANGING?81 majorinroadsinthesouthwesternNetherlands.
AboutaquarteroftheNetherlandsisseveralmetersbelowsea levelandwouldnotexistwithoutdikes.Thesehavebeenprogressively raisedthroughoutthecenturiesasshowninFigure5.3b.Dividingasea levelriseoftwotofourmetersby2,000yearsimpliessealevelhasrisen between1and2mmperyear.Thisestimatewarrantscautionasthere hasbeennotablelandsubsidencethatoccurswhensoilsaredrainedof water.InthecaseoftheRhineandMaasdeltas,floodingisalsomore likelywhenlandisreclaimedleavinglessspacefortheRivers.This increasestheriskofriverfloodinginspringwhenmeltwaterfromthe Alpsisatamaximum.Dikeshavealsobeenstrengthenedtoprovide ahigherlevelofprotection.Afterextensivefloodingin1953,theso calledDeltaplanresultedindikesbeingraisedtoreducetheriskof floodingtolessthanonceinathousandyears[120].Nevertheless,it appearsreasonablethatasubstantialpartofpresentdaysealevelrise isthecontinuationofanaturalprocessthatbeganaftertheendofthe lastIceAge.
OtherlowlyingheavilypopulatedareasoftheworldsuchasFlorida, LouisianaandBangladesharealsosusceptibletorisingsealevels.In thecaseofLouisiana,locatedatthemouthoftheMississippi,the dammingoftheRiverduringthe20thcenturygreatlyreducedthe amountofsedimentdeposited[121].Thishasledtosubstantialloss ofcoastalwetlandswhichhasenhancedfloodingcausedbyhurricanes suchasKatrinathatstruckLouisianainAugust,2005[122].
Onerepeatedlymadeclaimisthatrisingsealevelsareincreasing theamountofhurricanestormdamage.LargehurricanessuchasKatrinaorSandythatstruckNewYorkandNewJerseyinOctober,2012
producestormsurgesthatcanreachheightsofsevenmetersormore. Theamountofsealevelincreaseduringtheentire20thcenturyis lessthan0.3meters.Therehashoweverbeenasignificantincreasein insuranceclaimsduetostormdamageascoastalpopulationshaveincreaseddramatically.TheU.S.populationresidingincoastalcounties increasedby39%or35millionfrom1970to2010[123].Inadequate zoninghasallowedhomestobebuiltnearbeachesorinotherflood proneareas.Theeffectofglobalwarmingiscomparativelyminuscule.
5.2Storms Onepredictionofglobalwarmingisthatwarmertemperatureswill increasetheseverityandfrequencyofstorms.Thismakessensefor hurricanesthatdevelopintropicalregionsandgettheirenergyfrom thewarmsurfaceoceanwater.Theirstrengthdissipatesquicklywhen theytraveloverland.Thispredictionmaybesimplistic.Animportant driveroftheEarth’sclimateisthetemperaturedifferencebetween theequatorialandthepolarregions.Theweathersystemstransfer energyawayfromthetropics.Globalwarmingpredictsthelargest temperatureincreaseswilloccurintheArctic.Hence,thetemperature differencebetweentheArcticandtheequatorwillbereduced,with presumablyasubsequentweakeningorshiftofwindpatternssuchas thejetstream[124].
Thegreateststormdamageaffectingthelargestareasiscausedby hurricanes,alsoknownascyclonesinthenorthernIndianOceanand typhoonsinthewesternPacificOcean.Thenumberofpeoplekilled canbeenormousnotjustbecausethehighwindscausebuildingsto collapseandcreateflyingdebrisbutduetostormsurgesintolow
5.ARETHEOCEANSCHANGING?83 lyingareas.TheBholacycloneinBangladeshinNovember,1970is estimatedtohavekilleduptohalfamillionpeople[125].Theamount ofdamageverystronglydependsonthemaximumsustainedwind speed.Hurricanesarecategorizedusingthe“SaffirSimpsonWind Scale”giveninTable5.1[126].Damagetowellconstructedhomes canbemajorevenforaCategory1hurricane.Largetreebranches maybreakandbrokenpowerlinesmayresultinpoweroutagesforup toseveraldays.Category5hurricanescanmakeanareauninhabitable formonths.
Table5.1:SaffirSimpsonHurricaneWindScale[126]anddefinitions ofTropicalStorm/Depression.
Hurricane SustainedWindspeed
Category km/hour(mphinbrackets)
Five ≥252(157)
Four 209-251(130-156)
Three 178-208(111-129)
Two 154-177(96-110)
One 119-153(74-95)
TropicalStorm 63-118(39-73)
TropicalDepression ≤62(38)
Figure5.4:NumberofHurricanesandTropicalStormsintheAtlanticOceannorthoftheequator during1851-2014[126].
Figure5.4showsthenumberofstormsthathaveoccurredinthe AtlanticOceannorthoftheequatorfrom1851-2014[126].Eachof thesestormswassufficientlylargetomeritanamethatwasassigned bytheU.S.NationalHurricaneCentre.Thenumberofstormsvaries significantlyfromyeartoyear.Theaveragenumberoftropicalstorms wasonly7.4during1851-1930and11.4for1931-2014.Thisincrease isundoubtedlyduetobetterdetectionusingplanesandsatellites.Indeed,notasingletrendcalculatedforthetwointervals1851-1930 and1931-2014isstatisticallysignificantfortropicalstorms,allhurricanesorCategory3-5hurricanes.Forexample,thetrendofCategory 3-5hurricanesfortheperiod1931-2014is +0.7 ± 1.6 hurricanesper century.Figure5.5showsthetotalnumberofglobalhurricanesand tropicalstormshasdecreasedslightlybetween1970-2014[127].The
Figure5.5:TotalNumberofGlobalTropicalStormsandHurricanes during1970-2014.NeitherthenumberofTropicalStormsnorHurricanesisincreasing[127].
evidencedoesnotsupportclaimsthateitherthenumberofhurricanes ortheirseverityisincreasing.
5.3OceanAcidification Anespeciallyinsidiousresultofclimatechangeisoceanacidification. AcidityismeasuredusingthesocalledpHscaleillustratedinFigure 5.6.DistilledwaterisneutralandhasapHof7.Substancessuch asbakingsoda,ammoniaandbleachhaveapHgreaterthan7and areknownasbaseswhilecoffee,orangejuiceandstomachacidhavea pHlessthan7andarecalledacids.Seawaterisslightlybasicdueto variousimpuritiesinthewater,mostnotablysalt.
Thecombustionoffossilfuelshasincreasedtheconcentrationof carbondioxideintheatmosphere.Abouthalfofthiscarbondioxideis believedtobeabsorbedintotheoceans[128].Itisestimatedthatone inathousanddissolvedcarbondioxidemoleculesreactswithseawater togeneratecarbonicacid[129].Carbonicacidisusedtomakecarbonatedbeverages.Theconcernisthatburningfossilfuelsisslowly turningtheoceanintopop.Estimatesarethatthishascausedthe pHofthesurfaceoceanwatertochangefrom8.25in1750to8.14in 2004[130].Itshouldbeemphasizedthatthisestimateisnotbasedon anymeasurementsofoceanwateraciditybutisaresultofmodelling oceanchemistryduetoanincreaseindissolvedcarbondioxidewhich isinferredfromtherecordoffossilfueluse.Actualobservationsofthe amountofdissolvedcarbondioxideandtheacidityofseawateronly beganinthe1980s.
Oceanchemistryiscomplex.Itcannotbesimplymodelledasa cleanglassofwaterintowhichonedissolvescarbondioxide.There
Figure5.6:pHAcidityScale
arereactionsthatbufferagainstachangeinacidity.Oneofthose reactionsinvolvescalciumcarbonate.Itisproposedthatincreasing oceanaciditymaydecreasetheamountofcalciumcarbonatewhich willhinderthegrowthofvariousmarineorganismssuchascorals, crustaceans,etc[131].Thishasledtoconcernaboutthehealthof themarineecosystemandclaimsthatchangesinaciditycausecoral bleaching[132].Itwouldbeashametodamagespectaculartreasures suchasAustralia’sGreatBarrierReefshowninFigure5.7.
Figure5.7:GreatBarrierReefoffthecoastofAustralia.
Theestimatedchangeofoceanacidityby0.1pHoverthepast 250yearsissmallerthanthechangeinpHobservedonfarshorter timescalesinvariouspartsoftheoceansasshowninFigure5.8[133]. ChangesofpHincoastalregionscanbeexplainedduetotheinfluxof inlandfreshwatercausedbythetides.Theextremelylargechangesof 1pHontimescalesshorterthanonedayobservedatPuertoMorelos, MexicoandIschia,Italyareduetothepresenceofnearbysubmarine CO2 vents.Thereisnoapparentadverseimpactontheecosystem. ThechangeofpHisobservedtobemuchlessintheopenocean,far fromland.
Itwouldbeincorrecttoassumethatorganismsthathaveadapted todailyacidityfluctuationsashighas1pHcantolerateacomparable
Figure5.8:Oceanaciditymeasurementsata)(blue)SantaBarbara and(black)LaJolla,Californiaandb)(blue)Ischia,Italyand(black) PuertoMorelos,Mexico[133].
longtermpHchange.Forexample,temperaturevariesbyabout10 o C fromdaytonightbuta10 o Cannualtemperatureincreasewouldhave direconsequencestolife.Thelongtermresponseoftheecosystemto achangeof0.1pHisunclearandisanimportantsubjectoffurther research.Anyeffectduetooceanacidificationonmarinelifewill notbeeasytodiscernasmankindhascertainlyadverselyaffected oceanhealth.Overfishinghasdecimatedmanyspecies.Theoceans havebeenusedasasewerandatoxicwastedump.Modellingocean chemistrytopredictsmallchangesinacidityisalsonosimpletask.It isfarfromobviousiffossilfuelshavecausedtheoceanstoacidifyand affectedtheglobalmarineecosystem.
6 IsItWetterOrDrier? Themaximumamountofwatervapourcontainedinairincreasesexponentiallywiththetemperature.Itisthereforereasonablethatprecipitationshouldincreaseinawarmerworld[134].Indeed,torrential downpoursoccuronhothumidsummerdays.Onestudyclaimed tohavedetectedhumaninfluenceontwentiethcenturyprecipitation trends[135].The2007IPCCreportstatedthatprecipitationhasincreasedinsomeregionsbyasmuchas1%ineachdecadeofthe20th century[24,136].Thesepredictionsassumethatrelativehumidity remainsconstant.However,recentworkhasfoundthatasmalldecreaseinrelativehumidity,especiallyininlandareasremotefromlarge bodiesofwater,hasoccurredduring1948-2010inNorthAmerica[75].
Severallargestudiesexaminedprecipitationrecordsfordecadesin thelastpartofthe20thcentury.Theresultsrangefromaglobally averagedprecipitationtrendthathaschangedby:-1[137];+3.5[138]; and+0.1mmperyear[139].Thesedifferencesarenotentirelysurprisinggiventhatprecipitationvariesconsiderablyovertimescalesof
decades[140].DataarealsoverysparseforlargeregionsoftheEarth includingtheSahara,Amazon,Oceansetc.Theresultingtrendsfrequentlyarenotstatisticallysignificant.
Theneedtobecautiousaboutconcludingprecipitationhaschanged significantlyisillustratedinFigure6.1.ThisshowswinterprecipitationobservedatMedicineHat,Alberta.Thereisasharplydecreasing trendfortheperiod1952-2006,butthetrendismuchlessifoneconsidersdataextendingbackto1884.The1930swereparticularlydry. ThecentralplainsofNorthAmericawereafflictedbyaterribledrought andtheregionwasknownastheDustBowl.Thelargefluctuationof precipitationontimescalesofyearstodecadesisespeciallycommon inrelativelydryareas.
Figure6.1:WinterprecipitationinMedicineHat,Albertafrom18802006.
Figure6.2:Sampleannualprecipitationforstationsina)Northern Hemisphere:KewGardens,UnitedKingdom;Seoul,SouthKorea; Boston,UnitedStates;Madras,IndiaandMarseilles,Franceandb) SouthernHemisphere:Melbourne,Australia;Fortaleza,Brazil;Alger, Algeria;RoyalObservatory,SouthAfricaandNoumea,Caledonia.
6.1PrecipitationObservations ThelongestprecipitationrecordsexistforEuropeanstationsaswas thecasewiththetemperaturedata.Allstationswerelocatedon land.Unfortunately,verylittleprecipitationdataareavailableover theoceans.Figure6.2showsobservationsmadeatstationslocatedin theNorthernandSouthernHemispheres.Ingeneral,stationsinthe NorthernHemispherehavealongerdatarecordthanthoselocatedin theSouthernHemisphere.Theannualprecipitationvariedsubstantiallyforstationsexperiencingwetversusdryclimatesasdidtheyear toyearfluctuations.
Figure6.3:Locationsofstationsexamined.Reddotsshowthe776 stationshaving100-149yearsofdata,greendotsthe184stations having150-199yearsofdataandbluedotsthe24stationshaving morethan200yearsofdata.
6.ISITWETTERORDRIER?95 Figure6.3showsthelocationsofstationsforwhichdatawere retrievedfromtheGlobalHistoricalClimateNetwork[141].Stationswereonlyconsideredifoveracenturyofobservationshadbeen recorded.Thelongeststationrecordof303yearswasavailableforKew Gardens,UnitedKingdom.Moststationdatawereavailablebeginningafter1850.Theresultingdatasetconsistedof984stationslocated in114countries.Theannualtotalprecipitationwasonlycomputed foryearsinwhichnomonthhadmissingdata.Thenumberofyears forwhichtheannualprecipitationcouldbecomputedwas116years whenaveragedoverallstations.
Thepercentageprecipitationchangerelativetotheaverageannualprecipitationoccurringduring1961-1990wascomputedforeach station.Figure6.4showsthelocationofstationsexperiencingeither increasingordecreasingprecipitation.Trendswereonlyfoundfor stationshavingobservationsforatleast80%oftheyearsfortheperiodinquestion.Table6.1liststhenumberofstationsexperiencing increasing/decreasingprecipitationtrendsfortheperiods1850-2000, 1900-2000and1950-2000.Mosttrendswerenotstatisticallysignificant duringanyofthetimeperiodsconsidered.Manystationsexperienced increasedprecipitationduringoneperiodbutdecreasedprecipitation duringanothertimeperiod.Onlyhalfofthe256stationsforwhich trendswerefoundforallthreeintervals,experiencedtrendsthateither allincreasedoralldecreased.Aboutonethirdofthe684stationshad oppositetrendsduring1900-2000and1950-2000.
Thepercentageprecipitationchangewasaveragedoverallstations inagivencountryorregionasshowninFigure6.5.Largevariationsof precipitationontimescalesofyearstodecadesareevident.Notably,
Figure6.4:Mapsofstationprecipitationtrendsfortheperiodsofa) 1850-2000,b)1900-2000andc)1950-2000.Blue(green)indicatesan increasingtrendthatis(not)statisticallysignificantwhilered(yellow)indicatesadecreasingtrendthatis(not)statisticallysignificant. Trendsareplottedforstationshavingatleast80%ofobservationsfor allyearsduringtheperiodinquestion.
Table6.1:Numberofstationshavingdecreasing/increasingprecipitationtrendsfordifferenttimeperiods.Thenumberofstationshaving statisticallysignificanttrendsisinbrackets.Trendswereonlyfound forstationshavingdatafor80%ofallyearsinthetimeperiodasis discussedinthetext.
Interval Numberstationswith Numberstationswith decreasingtrend increasingtrend
1850-2000 113(28) 179(67)
1900-2000 323(71) 530(162)
1950-2000 328(66) 388(68)
countriessuchasIndia/PakistanandSouthAfricaaswellasAfrica northoftheequatorandCaliforniaexperiencegreaterinterannual variabilitythandoeitherFrance,JapanortheUnitedKingdom.There arenotableoutlierpoints.Forexample,1900wasanexceptionallydry yearinIndia/Pakistan.Thisdroughtoccurredwhenthemonsoons failedtoarriveandcausedwidespreadstarvation.Estimatesofthe numberofdeathsrangeashighasafewmillion[142].Onecanwell imaginethatanthropogenicclimatechangewouldbeheldresponsible ifsomethingsimilarweretohappentoday.Longtermdroughtsarise duetoachangeofweatherpatternscausedbyashiftintheposition ofhighandlowpressuresystems[143,144].Thebestknownofthese shiftsisperhapsElNino,whichisbelievedtobecausedbyawarming oftheseasurfacetemperatureoftheeasternPacificOcean.Itis difficulttoforecastsuchevents.ThiswouldbeverydesirableasEl NinoisassociatedwithincreasedprecipitationinplaceslikeCalifornia.
Figure6.5:Percentageprecipitationchangerelativeto1961-1990for a)UnitedKingdomb)India/Pakistanandc)Lower48StatesofU.S. d)Australiae)AfricanorthoftheEquatorf)Lesotho,Swazilandand SouthAfricaandg)California.Theredcurveisthe5yearmoving averagewhilethebluecurveindicatesthenumberofstations.
Californiaexperiencedheadlinemakingdroughtsinthe1970sand againin2014.TheGovernorhasstatedthattherecentdroughtis causedbyclimatechange[145].ThedatashowninFigure6.5give somepausetothatclaim.Headlinesofhistoricdroughttypicallyrecedewhenrainsresumewhatisconsideredamore“normal”pattern. TheprobleminplaceslikeCalifornia,isthattheyarenaturallydry. SouthernCaliforniaisadesertandthetensofmillionsofinhabitantsrelyonimportedwaterthroughaseriesofhundredsofmilesof pipelinesandcanalstosurvive.Figure6.5showsthatprecipitation isfarlessdependablethaninplacesliketheUnitedKingdom.There alsodoesnotappeartobeanychangeintheyeartoyearordecadal variabilityoftheprecipitationtosupportclaimsthatclimatechange
6.ISITWETTERORDRIER?101 makesprecipitationmoreerratic[146].Foreachtimeseries,thedata pointslieclosetothehorizontallineshowingzeroprecipitationchange.
Figure6.6:Globalpercentageprecipitationchangerelativeto19611990.Theblackdotsrepresentdatafoundbyaveragingthedata overallstationswhilethecrosseswerefoundbyweightingthevarious continentaltimeseriesusingthecontinentalareas.Theredandgreen curvesarethe5yearmovingaverageswhilethebluecurveindicates thenumberofstations.Thegreencurvewasonlyfoundforyears wheredataexistforallcontinentsexcludingAntarctica.
Figure6.6showstheglobalpercentageprecipitationchange.This wascomputedintwoways.First,anaverageofthestationdatawas taken.ThispreferentiallyweightsNorthAmericaandEuropewhere abouthalfofthestationsarelocated.Analternativewastocombine thetimeseriesforthecontinentsexcludingAntarcticausingweightingfactorsproportionaltothecontinentalareas.Theresultingtwo curvesdonotdiffersignificantly.Table6.2showsthetrendsdepend stronglyonthetimeperiodconsideredillustratingtheeffectofdecadal variations.Mostofthetrendshaveuncertaintiesthatoverlapwithno
precipitationchange.Theannualprecipitationaveragedoverallstationswas850mm.Therefore,atrendof1%percenturycorresponds toachangeoflessthan0.1mmperyear.Suchanannualchangeis difficulttomeasureusingasimpleraingauge.
Table6.2:Globalprecipitationtrendswerecalculatedforthedata showninFigure6.6forvarioustimeintervals.
Interval Trend(%/Century) Thepercentageprecipitationchangewasalsofoundseparatelyfor stationslocatednorthof20o Nlatitude,within ±20o oftheequator andsouthof20o Slatitude.Therewasnosubstantialtrenddifferencebetweenthethreecurves.Similarly,nodifferencewasfoundfor stationsexperiencinglow(annualprecipitation<500mm),moderate (between500and1000mm)andheavy(annualprecipitation>1000 mm)precipitation.Thisindicatesdesertsandjunglesareneitherexpandingnorshrinking.Itisreasonabletoconcludethatlargechanges toglobalprecipitationhavenotoccurredduringthelast150years.
6.2ExtremeRainfallEvents Theprecedingdiscussiondoesnotconsiderwhetherextremeevents, suchasonceinacenturydownpours,arebecomingmorecommon.It isdifficulttostudysucheventsbecausetheyoccursorarely.Oneneeds atleastseveralcenturiesofdatatomakeanymeaningfulconclusions aboutwhetherthefrequencyofaonceinacenturyeventischanging. Dataforsuchextendedtimesdonotexist.Thatisnottosaythat heavyrainfalleventsdonotproducegreaterfloodingthaninthepast. Suchfloodingwithextensiveassociateddamageinvariablyoccursin urbansettingswherethelandsurfacehasbeengreatlymodifiedto accommodateconcreteroadways,parkinglots,buildings,etc.that makethelandsurfaceimpervioustowater[147].Whereasbeforeit wasdevelopedthelandwasabletosoakupmuchoftherainfalllike asponge,thewaternowrunsoffintocreeksturningthemintoraging torrents.
6.3GreatLakes Asignatureofchangingprecipitationwouldbeachangeinthelevels oflargelakes.ThefiveGreatLakesofNorthAmericacontainover onefifthoftheworld’sfreshwater.Theirsurfaceareaofnearlya quartermillionsquarekilometersmakesthemvastinlandseas.The maximumlakedepthsrangefrom406metersforLakeSuperiorto64 metersforLakeErie.TheGreatLakeswatershedisshowninFigure 6.7alongwiththewaterlevelsoftheLakeswhichhavebeencarefully monitoredsince1860.
ThelevelsoftheGreatLakesdependnotonlyontheamount
Figure6.7:a)GreatLakesBasinandb)WaterLevelsfrom1860-2014 [148].
6.ISITWETTERORDRIER?105 ofprecipitationbutalsoonthetemperature.Warmerwintertemperatureswoulddecreaseicecoverage.Thiswouldinturnincrease evaporationreducingthewaterlevels.TheGreatLakeshavealso beenaffectedbytheSt.LawrenceSeaway[149].Thisconsistsof aseriesoflocks,canals,anddredgedshippingchannelswhichallow oceangoingfreighterstonavigateallthewaytoChicago,Illinoisand Duluth,Minnesota,adistanceof3,700kilometersfromtheAtlantic Ocean.Shippingcompaniesdesirehigherlakelevelstoenablelarger shipsthatcancarrymorefreightandaremoreeconomical.
ThepresentSt.LawrenceSeawayopenedin1959.Sevenlocks liftvessels75metersbetweenMontrealandLakeOntario.Thelevel ofLakeOntarioisalsocontrolledbyahydroelectricdam.The44 kilometerlongWellandCanalconnectsLakeOntariotoLakeErie, allowingshipstobypassNiagaraFalls.ThefirstWellandCanalwas builtin1829.Ithasbeenprogressivelyenlargedtoaccommodate largershipsandpresentlyhaseightlockswhichliftships100meters. LakesErieandHuronareconnectedviatherelativelyshallowLake St.Clair,DetroitandSt.ClairRivers.Ashippingchannelwas dredgedtoadepthofeightmetersthroughLakeSt.Clairwhichhas anaveragedepthofjustoverthreemeters.LakesSuperiorandHuron areconnectedviatheSt.MarysRiver.Locksbypasstherapidsraising shipseightmeters.
Figure6.7bshowsthereisnocleartrendoftheLakelevelsoverthe periodfrom1860-2014.Therearesignificantvariationsfromyearto yearandoverdecades.Waterlevelswereparticularlylowinthe1960s. Thisresultedintheconstructionofmanycottagesnearthewaters edge.Widespreadfloodingoccurredintheearly1970saswaterlevels
returnedtomorenormallevels.Since2000,thelevelsofLakesErie andOntariohaveremainedstablewhilethethoseoftheotherLakes havedecreased.Thismaybetheresultofdredgingoftheshipping channelthroughLakeSt.Clairwhichactssimilartoadrainina bathtub.Morewaterpoursoutifthedrainopeningisenlarged.
6.4ForestFires Asignificantnegativeeffectofdecreasingprecipitationwouldbean increasedriskofforestfiresduetoextendeddroughts.Theconcernis thatclimatechangeisincreasingtheseverityofdroughts,makingfires morenumerousandlarger.Largeforestfiresoccurnearlyeveryyear especiallyduringthesummersinthewesternpartofNorthAmerica. Firehasalwaysbeenanaturalpartoftheecosystem.Manyfiresare startedbylightning.
Thenumberofforestfiresvariesfromyeartoyearandbetween locales.TheCanadianprovinceofBritishColumbiamayexperiencea largenumberofforestfiresoneyearwhiletheneighbouringprovince ofAlbertamayhavefewfires,andviceversathenextyear.Figure 6.8showsnoobviouschangeinthenumberofwildfiresinCanada during1960-2013.Therealsoisnoclearchangeinthenumberofacres affected.Thelackofanyobvioussignalissomewhatsurprisinggiven thatmankindhasstronglyinterferedintheforestecosystem.Policies toextinguishfireshaveallowedabuildupofflammablematerialto accumulateinNorthAmericanforestsduringthe20thcentury.One wouldexpectfiresthatdooccur,tobemuchlarger.Inaddition, humanshavealltoofrequentlyandinadvertentlystartedforestfires.
Figure6.8:WildfiresinCanadaduring1960-2013showingaffected areaandthenumberoffires[150].
6.5FinalPrecipitatingRemark Precipitationrecords,especiallywhenconsideredovertimesofacenturyormore,donotshowanysignificantchanges.Similarly,there isnoapparentchangeinthenumberofforestfiresorchangestothe GreatLakewaterlevelstosupportsuchclaims.Droughtshavebeen occurringatleastsincethetimeofElijahintheOldTestament.They haveseriousadverseconsequencesformoderncivilization.Indeed, onepresidentialcandidaterecentlysuggestedanthropogenicclimate changewasresponsibleforthedroughtintheMiddleEastthatin turncontributedtothecreationoftheIslamicStateofIraqandSyria (ISIS),aparticularlyreprehensibleterroristgroup[151].Thisisalso
notnew.GenesisrecordstheservantsofAbrahamandLotfought overaccesstoscarcewaterfortheirlivestock.
7 ExtraordinaryClaims Extraordinaryclaimsabouttheconsequencesofclimatechangeabound. Thereisnothingimproperaboutmakingsuchaclaim.Thatishow scientificbreakthroughsoccur.However,oneshouldacceptrigorous scientificscrutinyandrealizetheonusisonthepersonmakingthe claimtoprovidethesupportingevidence.Itgoeswithoutsayingthat anextraordinaryclaimrequiresextraordinaryproof.Thishasalways beenthescientificstandardandshoulddefinitelybemetbyanyone urgingtheEarth’s7.3billionpeopletodrasticallychangetheirwayof life.Thischapterdiscussestheclaimabout9/11changingtheclimate andpresentsthreeespeciallydubiousexamples.
7.1Did9/11changetheclimate? Abouttenyearsago,afteralongdayanalyzingclimatedata,Iturned onthetelevisiontorelax.TheAmericanPublicBroadcastingService scientificshowNOVAbeganwithdramaticfootageoftheterroristat-
tackontheWorldTradeCenteronSeptember11,2001[152].Three scientistsrealizedtheensuingthreedaybanofallcommercialflights acrossNorthAmericaprovidedauniqueopportunitytoexaminehow airplanecontrailsaffectthedailytemperature[153,154].Contrailsare thewhiteexhausttrailssometimesproducedbyaircraftseeninthe sky.Thescientistsfoundthediurnaltemperaturerange,definedasthe differencebetweenthedailymaximumminustheminimumtemperature,increasedoverthecontinentalUnitedStatesexcludingAlaska duringthethreedayswhencommercialflightsweresuspendedascomparedtothethreedayperiodsbeforeSept.11,2001andafterflights resumed.ThediurnaltemperaturerangeduringSept.8-17,2001was comparedtotheaveragevalueoccurringonthosedatesduring19712000.Itincreasedby1.1 o CforSept.11-14,2001ascomparedtothe valuefortheprevious30yearperiod.Thecorrespondingchangesfor Sept.8-11andSept.14-17were-0.2and-0.8 o C,respectively.This changewasattributedtoalackofcontrailswhichactlikecloudsreflectingsunlightduringthedayandradiationfromtheEarth’ssurface atnight[155].
Thesupposedeffectoftheabsenceofcontrailsafterthe9/11 tragedywashailedasamajorscientificdiscovery.TheIPCChad previouslypointedoutthatglobalwarmingofabout1 o Cpercentury hadoccurredduetogreenhousegasemissionsproducedbyhundredsof millionsofvehiclesandmillionsoffactories.The9/11contrailstudy nowrevealedthatacomparabletemperaturechangeoccurredwithin hoursafterafewhundredjetengineshadbeenturnedoff!Ifthiswere true,onecouldimagineasimplesolutiontoglobalwarming.Anadditivetoairplanefuelwouldhelpgeneratecontrailsthatwouldreflect
sunlightduringtheday.Theadditivewouldneedtobecarefullychosensocontrailswouldprecipitateoutoftheatmospherebeforesunset, eliminatinganynighttimewarmingeffect.Itsoundedtoogoodtobe true.
SeveralstudiesquestionedtheconclusionspointingoutthattheobservationscouldbeexplainedbyalackofcloudinessoverNorthAmericainthethreedaysfollowingSeptember11,2001[156,157,158].My groupexamineddataobservedatstationslocatedthroughoutCanada whereflightswerealsoprohibitedfollowing9/11[159].Nochangein thediurnaltemperaturerangecorrespondingtotheflightrestrictions imposedafterSept.11,2001wasobserved.Theseconclusionsdidnot changewhenonlystationsneartheU.S.borderwereconsidered.
Unfortunately,ittooksometimebeforetheAmericandatacould beaccessed1 .Eventually,datawerereceivedfor202stationslocated
Figure7.1:Diurnaltemperaturerangeaveragedoverthestationslocatedinthelower48U.S.statesasafunctionoftimethroughoutthe year.Theblackcurverepresentsdataaveragedfor1975-2005while theredcurveisdatafor2001.
inthelower48U.S.statesfortheperiod1975-2005.Thediurnal temperaturerangeaveragedoverallstationswasfoundforeachday in2001andcomparedtotheaveragevalueoccurringduring1975-2005 asshowninFigure7.1[160].TheSeptember,2001dataareveryclose tothe31yearaveragedvalues.Thelargestdeparturesofthe2001 datafromthe1975-2005averagedvaluesoccurinmonthsotherthan September.
Figure7.2showsthechangeofthediurnaltemperaturerangefor theperiodSept.8-17,2001relativeto1975-2005.ThediurnaltemperaturerangeincreasedduringeachofthefourdaysfromSept.811,decreaseduntilSept.14,whereafteritincreased.Thisdoesnot correlatewellwiththeflightban.Figure7.2alsodisplaysthethree dayaveragedvalues.Thechangesinthediurnaltemperaturerange averagedduringSept.8-10,11-13,14-16were-0.3,0.6and-0.5 o C,respectively.Theseresultsarecomparabletothosefoundintheoriginal 9/11contrailstudy[153].
ThechangeinthediurnaltemperaturerangeduringSeptember 8-17,2001experiencedbythedifferentstationswasalsoplottedona mapofNorthAmerica.Theresultsatagivenstationwerefoundto besimilartothoseatsurroundingstations.Themapsshowdayto daychangesconsistentwiththenaturalprogressionofweathersystemsacrossNorthAmerica.Thisagreeswithotherstudiesthatfound September11,2001tohavebeenanunusuallyclearday[156,157,158].
IthasbeenpointedoutthatOsamabinLadenwasunfortunately notstupid.Herealizedhisterroristpilotswerenotentirelyproficient
1 Climateobservationsarenotalwaysreadilyaccessible.Thisauthorhasbeen forcedtopayovera$1,000forafewyearsofclimatedatarecordedatpublicly fundedairports.Thisismostunfortunateasitseriouslyimpedesscientificinquiry.
Figure7.2:Changeindiurnaltemperaturerange.Thethreeday averagedvaluesshowninredareveryclosetothosefoundintheoriginal9/11contrailstudythatclaimedthediurnaltemperaturerange changedasaresultoftheflightbanfollowing9/11.Themorelikely explanationisthatskieswereclearimmediatelyfollowing9/11asis discussedinthetext.
inflyingincloudyweatherandwouldneedclearskiestonavigate thehijackedplanestotheirtargets.Thetragedyof9/11changedthe worldbutnottheclimate.
7.2TrulyExtraordinaryClaims 7.2.1OceanWaveHeights
2 Sometimeago,Iattendedatalkaboutthechangeofoceanwave heightsfrom1860tothepresentday.Thespeakerwashighlyregarded andhadpublishedextensivelyintherefereedliterature.Graphswere presentedshowinghowwaveheightshaddramaticallyincreased.The trendlinewasextendedto2100toemphasizethatwaveswouldbe muchhigheratthattime.Onewasleftwonderingwhethertsunamis wouldthenbeacommonoccurrence.
Ascientificpresentationnormallybeginsbydescribingtheapparatusandtheprocedureusedtomakethemeasurementsortakethe observations.Inthistalk,itwasdisconcertingthatnothingwassaid abouthowwaveheightsweredetermined.Today,waveheightmeasurementisrelativelystraightforward.Onecouldplaceaglobalpositioningtransponderonabuoy.Thepreciseverticalpositionofthe bobbingbuoyasafunctionoftimeisthentransmittedtoasatellite whichinturnsendstheinformationtothescientist.However,this technologyhasonlybeenavailableforthelastfewdecades.Itwas alsooddthatthedatapresenteddidnotshowanimprovedaccuracy astechnologyhasgreatlyimprovedoverthepastcenturyandahalf.
2 Theintentofthisbookistoenlightenthepublic,nottoembarrassindividuals. Referencesarethereforeomittedinthissection.
7.EXTRAORDINARYCLAIMS115 Afterthetalk,theobviousquestionwasposedaskinghowwave heightsweremeasuredin1860.Theresponsewasthatlogbookentries,madebycaptainssailingprimarilybetweenEuropeandNorth America,hadbeenstudied.Itisludicroustoclaimthatmeaningful quantitativeinformationcanbeextractedfromacommentsuchas “bigwavesobservedtoday”.
7.2.2WindSpeed Theimplicationsofclimatechangearebecomingpopularwithpoliticians.Oneconcernisthatthecivilinfrastructureisinadequatefor achangedclimate.Thiswasthethemeofanelectedofficialserving insomehamletnorthofToronto.Hebeganhispresentationbymentioningthathewasacorecipient,alongwithAlGore,ofthe2007 Nobelprize.HehadnotgonetoStockholmbutapparentlywasone ofthethousandsofauthorswhohadapaperreferencedinoneofthe voluminousIPCCreports.
Thespeakerwasconcernedaboutincreasingwindspeeds.“Data” werepresentedshowinghowwindspeedhadincreasedduringthe20th centuryinacountyjustnorthofToronto.Thisinturnhadsubstantiallyincreasedwinddamage.Afterthetalk,thequestionwasasked howtheaveragewindspeedwasmeasuredin1920.Today,eachhouse couldhaveananemometerthatisconnectedviatheinternettoa centralcomputeratEnvironmentCanadathatcalculatestheaverage windspeed.Theanswerwasthatnewspaperaccountsofwindreporteddamagehadbeenstudied.Itissillytoattempttoconvertan archivalaccountinanobscurecountypaperabout“FarmerJoe’sbarn losingitsroof”intoameaningfulaccuratenumericalvalueofthewind
speed.Thespeakerwentontovehementlyclaimthattheincreasein winddamagewasnotduetothehugeincreaseinthecounty’spopulationfromafewhundredfarmersacenturyagototensofthousands ofTorontosuburbanites.
7.2.3HudsonBayWarming TheconcernaboutrisingArctictemperaturesisapopulartopic.This washighlightedbyaninvitedspeakerataworkshop.Hewasintroducedasajournaleditorwhohadauthoredover200refereedpublications.Thespeakershowedhowtheglobalclimatemodelsforecast temperatureswillchangeoverNorthAmericainthemid21stcentury.
ThecenterofHudsonBayispredictedtowarm8 o Cby2050.This wouldcorrespondtoawarmingtrendofabout20 o Cpercentury. Whenaskedwhetherthiswasplausible,thespeakeremphasizedit was.The8 o Cestimatehadbeenderivedbyaveragingthepredictions ofseveralclimatemodels.OnemodelevenpredictedthatHudson Baywouldbeicefreeduringwinterin2050.Thisgottheattention ofevendozingmembersoftheaudience.Howisthispossibleifthe averageJanuarytemperatureataplacelikeChurchill,Manitobais lessthan-20 o C?Thespeakeransweredthathehaddoneacareful statisticalanalysis.Aparticularlycourageousaudiencemembersaid hewascertainthatwasthecase.However,garbageinfromafaulty climatemodelplusaperfectstatisticalanalysisstillproducesgarbage out.ItisunlikelysanepeoplewillbewaterskiingthroughoutHudson Bayin2050duringwinter.
WhatShould/CanBe Done? 8.1SummaryofEvidence Table8.1summarizestheevidence.TheEarth’saveragesurfacetemperaturehasincreasedbyabout1 o Csincethestartoftheindustrial revolution.However,theclimatemodelsarenotabletoaccountfor substantialdecadalvariations.Themostsignificantoftheseisthe abruptwarmingthatoccurredinthe1990sfollowedbythesocalled hiatusafter2000.Arctictemperaturesforthepasttwocenturieshave notincreasedaspredicted,butbeenstronglycorrelatedwithtemperaturechangesobservedelsewhereintheNorthernHemispheresuchas Europe.Itisespeciallydisconcertingthatthemeasurementsofthe tropospheredonotshowanysignificanttemperaturechange,insharp disagreementwithallmodelforecasts.
Therehasbeenasignificantreductioninglaciers,especiallyinthe
Table8.1:EvidenceSummary.
Quantity Status
Temperature -Globalaveragetemperatureincreasedbyabout 1 o Csince1850
-Climatemodelsdonotaccountfordecadal temperaturevariations
-ArcticandEuropehaveexperiencedsimilar warming,inconsistentwithclimatemodels -Nochangeintropospheretemperaturesinconsistentwithclimatemodels
Glaciers& -ReductioninArcticicecapduring1979-2013 consistentwithwarmingin1990s
PolarIceCaps -Insufficientdatatoconcludepolarbearpopulationsaredeclining
-IncreaseinAntarcticicecapduring1979-2013 notpredictedbyclimatemodels
Oceans -SealevelshaveincreasedsinceendoflastIceAge -Someevidenceofacceleratingsealevelrisein 1990sconsistentwithtemperatureincrease -Evidencedoesnotindicatechangeinnumber orseverityofhurricanes
-Oceanacidificationevidencenotoverwhelming -Claimofdamagetomarineecosystemsistenuous Precipitation -Evidencedoesnotsupportclaimsofanylarge precipitationchangeduringthe20thcentury -Evidenceofchangeinforestfirefrequencyor GreatLakelevelsduetoclimatechangeisweak
8.WHATSHOULD/CANBEDONE?119 Arcticicecap,thathasbeencommensuratewiththetemperatureincreaseinthatregionduringthe1990s.Thiscoincideswiththereduced icecoveroftheBalticSea.However,thelatterrecordexistsforthree centuriesandshowsamuchsmallertrendoverthatextendedtime period.Itisnotpossibletomakeanydefinitiveconclusionsabout whetherArcticwildlife,mostnotablypolarbears,havebeenaffected asthecensusdataareinadequate.UnliketheArcticicecap,the Antarcticicecapincreasedfrom1979-2014.Antarcticadoesnotseem tohavewarmedasmuchastheArctic,althoughobservationaldata aresparse.
Sealevelshaveincreasedthroughoutthe20thcenturyatarate ofabouttwommperyear.Thisislikelyacontinuationofanatural processthatbeganneartheendofthelastIceAge.Thereappears tobeasmallaccelerationofthesealevelrisewhichisconsistent withtheobservedtemperatureincreaseinthe1990sandassociated glacialmelting.Thereisnoevidencetosupportclaimsthatstorms haveincreasedineithernumberorseverity.Itisalsonotobvious thatoceanacidity,whichisestimatedtohaveincreasedby0.1pH since1750,hashadanyimpactonmarineecosystems.Mankindhas, however,hadamajornegativeimpactontheoceansduetopollution andoverfishing,whichshouldstopimmediately.
Therehasnotbeenanymajorchangeintheamountofprecipitationorprecipitationpatternsaroundtheworldsince1850.Extreme eventssuchasdroughtshaveoccurredsincetimeimmemorial.Evidencethatforestfireshaveincreasedinnumberorseverityisvery weakandmaskedbyhumaninterferenceinforestecosystemsduring thepastcentury.MajorwatershedssuchastheGreatLakesdonot
showsignificantchangecausedbyclimatechangeovertimesofacenturyormore.
Inconclusion,theevidencedoesnotvalidatetheclimatemodels. Thatdoesnotmeanthatglobalwarmingduetoincreasinggreenhouse gasesiscompletelywrong.Thisauthorfindsthetemperatureincrease inthe1990squitedisconcerting,eventhoughitdoesnotcoincidewith anydramaticincreaseinfossilfueluse.Similarly,fossilfuelusedidnot stopafter2000whichwouldhelpexplaintheglobalwarminghiatus. Infact,theproductionofoil,coalandnaturalgasincreasedtomeet therisingenergydemandindevelopingcountries.
Thefailureoftheclimatemodelsisuniversallyrecognized.The latestIPCCreportcontainsFigure8.1thatshowshowtheobserved temperatureislowerthanthatpredictedbynearlyallthemodelsthat considervariousscenariosforincreasinggreenhousegases[25].Itis notknownwhateffectsthemodelshaveinadequatelyconsidered.Possibilitiesincludechangesin:thesun’sintensity,cloudiness,absorption ofheatfromtheatmospherebytheoceans,carbonsootpollutionin theArctic,naturaldecadalvariations,etc.Thisisfrustrating.There mayverywellbenosinglecausebutacombinationoffactorswhich willmakethediagnosisastohowtofixtheclimatemodelsmorechallenging.
Thecreationofaglobalclimatemodelisnoeasytask.Highly competentcomputerprogrammersruncomplexcodeonthefastest supercomputersavailable.However,themodelscanonlyapproximate theEarthatmosphereandoceansystem.Itmaybetoocomplicated togenerateamodelthatisabletomakereliablepredictionsinthe foreseeablefuture.Amodelcanonlybevalidatedbycomparingpre-
Figure8.1:Comparisonofglobalclimatemodeltemperatureprojectionsforthe21stcenturyandobserveddata[25].
dictionsofseveraldecadestoobservations.Thistakesconsiderable time.Theconcernisthatbythetimeareliableclimatemodelfinallyexists,uncheckedgreenhousegasemissionswouldhavesetglobal warmingintomotiononsuchascalethattheEarth’sclimatewillbe unalterablychangedforcenturiestocome.TheproponentsoftheclimatechangeagreementreachedinDecember,2015,arguethataction isneedednowtoreduceandevenstopgreenhousegasemissions.The agreementsetsthegoaltolimitfutureglobaltemperatureincreasesto 2 o C.Eachnationwaslefttodecideitsowngreenhousegasemissions target.Thetreatydoesnothaveanyenforcementmechanisms.
8.2EnergySustainability Therearemanyreasonstoreduceorentirelyeliminatetheuseoffossil fuelsevenifglobalwarmingduetoincreasedgreenhousegasconcentrationswascompletelywrong.Figure8.2showsthedevastatingconsequencestowildlifeofanoilspill.Mamasealdoesnotlikeitwhen herpupscomehomecoveredincrudeoil.
Justhoweasywoulditbefortheworldtochangeitsenergyuse? Figure8.3showsthesourcesandsectorusersofenergyfortheUnited States.Asof2009,onlyabout8%ofthetotalenergywasgenerated renewably.Thisreferslargelytosolar,windandhydroelectricgeneration.Itshouldbenotedthatthesearenotwithoutenvironmental
Figure8.2:Oilcoveredduckasaresultofacrudeoilspill.
Figure8.3:U.S.energysourcesandusebysectorin2009[161].
consequences.Salmonarenottooamusedbydamsblockingtheir migratoryroutes.Similarly,windmillsplacedalongbirdmigratory routescankillbirds,althoughtheexactestimatesoffatalitiesvary wildly[162,163].Manyrenewableenergysourcesareheavilysubsidizedtocompetewithcheaperfossilfuels.TheprovinceofOntario, Canadapayssolarenergysuppliersover50centsperkilowatthour whereastraditionalplantsthatburnfossilfuelsproducepowerabout tentimesmorecheaply[164].Solarandwindenergyarealsonot reliableoncloudyorwindlessdays.Nuclearpowercangenerateenergywithoutproducinggreenhousegasesbutthisisalsonotwithout concernswhicharenotthesubjectofthisbook.Inshort,thereisno simplewaytogenerateelectricitywithoutsomeadverseenvironmental consequences.
Figure8.3showsNorthAmericanswouldneedtoreducetheirenergyusebyabout90%tostopgreenhousegasemissions.Thisis impossibletodobyconservationalone.EvensuchavantgardepoliticiansasCanada’snewlyelectedPrimeMinisterJustinTrudeauare notgoingtorestrictCanadianstoonlyheattheirhomesonedaya weekinwinter,andprohibitdrivingtoallbutafewdayseachmonth. Conservationisneverthelessimportant.IfMs.Toyotacanbuilda Priusthatusesonly4.6litersper100kilometers1 ,whycan’tthetraditionalNorthAmericanautomakersdoso?Itshouldbepointedout thataPriusisnomereexperimentalbicycle,butcomfortablyseats fouradults.
Othertechnologicalinnovationsalsoexist.Lightingefficiencycan besubstantiallyimprovedbyreplacingincandescentbulbsbylight
1 Thisisequivalenttoover60milesperimperialgallonor50milesperU.S. gallon.
8.WHATSHOULD/CANBEDONE?125 emittingsemiconductors.Thesedevicesgeneratelightproducingdrasticallylesswasteheatwhichinturnreducestheneedforairconditioning.Citiesalsoneedtoinvestinmasstransittogivecommutersa realisticoptiontogetoutoftheircars.Thesechangesarenotcheap andrequirepoliticalleadership.TheTorontocitycouncilhasargued fordecadesaboutthelocationofafewsubwaystations.MyChinesegraduatestudentspointoutthatinthetimeittakesTorontoto buildthreesubwaystations,Chinesecitiesstartandcompleteentire subwaysystems.Conservationmeasuresandinvestmentsinenergy reducingtechnologieswilldecreaseourneedforfossilfuelbutdonot comeclosetoreducingourenergydemandtothelevelthatfossilfuels canbeentirelyeliminated.
Moreover,thereisthedevelopingworld.PeopleinIndia,Africa andelsewhere,seetheEuropeanandNorthAmericanstandardof livingandwantit.AstarvingpersoninBangladeshorAfricaisconcernedabouttheirnextmealandisrelativelydeaftoWesternpleas regardingpossibleclimatechangeacenturyfromnow.Forthatreason,evenifdevelopedcountriesdrasticallyreducetheiruseoffossil fuels,globaldemandwillcontinuetoincrease.
Thehopeisthatfuturetechnologicalinnovationwillreduceoreven eliminatetheneedforfossilfuels.Researchprogresscanbepainstakinglyslow.Scientistshavebeenworkingtoenhancethepoweroflight emittingsemiconductorsforabout50years.Ithastaken35yearsto tripletheaverageautomotivefueleconomy[165].Thereweresignificantgainsinthe1970sfollowingtheAraboilembargobutthisslowed substantiallyinthe1980suntilrelativelyrecently.Thelessonisthat technologicalinnovationsarenotcheapanddonotcomequickly.A
sustainedinvestmentisrequiredinawidevarietyofresearchincluding fundamentalscience.Thismaynothavethepromiseofanimmediatetechnologicaldividendbutiscriticalforfutureprogresstodevelop stronglightweightmaterials,betterbatteries,hightemperaturesuperconductors,etc.
8.3Whatshouldwedonow? Theunlikelihoodofsignificantreductioninfossilfuelusehasledsome scientiststoproposemassivegeoengineeringschemes.Oneistospray smallparticlessuchassulfuroxidecompoundsfromafleetof747s highintheatmosphere[166,167,168].Theseaerosolparticleswould reflectsunlightandcooltheplanetcounteractingtheeffectofincreasinggreenhousegases.Thisinterventionwouldbemassiveand concernshavebeenraisedaboutpossibleunintendedadverseconsequences.Theseaerosolswouldlikelyaggravatetheeffectofpollutant particlesthatarealreadyestimatedtocausemorethanhalfamillion prematuredeathsperyearworldwide[169].Couldsuchsulfuroxide moleculesproduceacidrainandcontributetooceanacidification?Our understandingoftheEarthatmospheresystemiswoefullyinsufficient tocontemplatesuchschemes.
Itisnotclearwhetherglobalwarmingduetoincreasedgreenhouse gasescausedbyburningfossilfuelsistrue.Itisverypossiblethat onlypartofthetemperatureincreaseobservedespeciallyinthe1990s wasduetotheanthropogenicincreaseofgreenhousegases.Thepublicneedstobecorrectlyinformedaboutwhatisknownanduncertain. Figure8.4showsapagefromtheNationalOceanographicandAtmosphereAdministrationwebsitethatconvenientlygivesthemonthly
Figure8.4:NOAASouthPolemonthlyreanalysistemperaturesfrom1871to2015.Thetempera- tureisexpressedinunitsofKelvins.TheKelvinscalesetsthefreezingpointofwaterat273 o K andonedegreeKelvinequalsonedegreeCelsius[115].
averagedtemperatureatanypointontheEarthsince1871.The resultingtemperatureisgivenwithanaccuracyofonehundredthofa Celsiusdegree.“Data”areprovidedforallpointsontheEarth,even fortemperaturesattheSouthPolein1871!Thisisunbelievableasno humancamewithinthousandsofkilometersoftheSouthPoleuntil severaldecadeslater.TheSouthPoletemperaturewasundoubtedly extrapolatedfromobservationsmadeinSouthAmerica,SouthAfrica andAustralia.However,temperaturesinthe1800sweremadeusing simplethermometersthathadanaccuracyofatbest0.1 o C.Itissilly toclaimthatonecaninferatemperaturethathastentimesbetter accuracyataplacethousandsofkilometersdistant.Thepublicrightly becomesskepticalofsciencewhentheyseesuchnonsense.Thatis dangerous.Historyshowsthereareinstanceswhenscientistspoint outadangersuchasthatposedbythechlorofluorocarboncompounds inthe1970s,andthepublicneedstolistenandsupporturgentaction.
Scientificliteracymustimprovetoenablethegeneralpublicto digestthenearlydailydoseofnewsstoriespurportingtoshowthe adverseconsequencesofglobalwarming,particularlywhentheweather isunusual.Fourquestionsmaybehelpfulwhenconsideringascientific study.
1.Doesthestudyconsideronlyashortspanoftime?Therecord ofthepasttwocenturiesshowsthattemperatureandprecipitation trendshavevariedduetonaturallyoccurringdecadalfluctuations.
2.Istheaccuracyoftheresultsgivenorevendiscussed?Any20th centurytemperaturetrendclaiminganaccuracyof0.01 o Cislikely incorrectasitisimpossibletoreadamercurythermometertobetter than0.1 o C.
3.Doesthestudyhavetheinherentcapabilitytoobtainthepurportedresult?Forexample,supposeonewantedtostudythetemperatureofLakeEriewhichcoversanareaof25,000km2 andhasanaveragedepthof19meters2 .Placingathermometerevery100km2 andat depthsofevery5meters,wouldrequireover1,000thermometers.The temperaturewouldneedtobemonitoredseveraltimeseachday.This maybechallenginginwinter,whenlargepartsofLakeEriefreeze, andtheicecancrushathermometer.Thisisnosmallundertaking andshowshowchallengingitwillbetostudyoceantemperature.
4.Isthestudybasedonmodelledresultswhichalltoofrequently andmisleadingly arecalleddata?Onlymeasuredobservationsconstitutedataandcantestclimatemodels.
Whatisneededisnotmoreclimatehysteriabutqualityscientific research.Ahighpriorityshouldbetoimproveourunderstandingof theworld’soceans.Effortstomonitornotjustthetemperatureat variousdepthsbutalsothewatersalinity,acidity,currents,etc.only beganafter2000[170].Scientificunderstandinghasalwaysemerged fromaniterativeprocessoftrialanderror.Amodelisproposed.It makespredictionswhicharecomparedtoobservations.Discrepancies betweenpredictionsandobservationsleadtomodelimprovements. Theprocessthenrepeats.Inthecaseofclimatestudies,manyresearchershavestoppedquestioningwhethertheclimatemodelsare correct.Toomanypapersstartwiththepremiseoftheinfallibleword oftheclimatemodels,andgoontoforecastdoomandgloom.That isreligionnotscience.
Mankindfacesgreatchallengesinthecomingcentury.TheGlobal 2 Satellitescandeterminethesurfacetemperatureofabodyofwater.Thisdoes requirepropercalibrationchecksusingthermometermeasurements.
Warmingtheoryisfarfrombeingsettledscience.Indeed,afterworld temperaturesceasedtheirdramaticincreasein2000,thefavoured namebecameClimateChange.Changingthenamedoesnotaffect theconflictingscientificevidence.Itisnotalwayseasyforscientists toconveyourunderstandingoftheEarth’sclimateandthelimitsof ourknowledgetothepublic.But,ifscientistsexpecttheentireworld todrasticallychangeitsstandardofliving,ahardshipwhichmaybe especiallydevastatingfortheworld’spoor,weoweeveryoneadetailed explanation.Indeed,thepeopleshoulddemandit.
Acknowledgements Iwouldliketothankthosefriendsandcolleagueswhoencouragedme. Aspecialthanksisduemyfamily;mywifeTheresa,fivechildrenand parents.Theiraffection,supportandencouragementthroughoutmy careerisgreatlyappreciated.
Bibliography [1] A.Taylor.California’shistoricdrought. TheAtlantic,March 2014.
[2] U.S.DroughtMonitor.Nationaldroughtsummary. www.droughtmonitor.unl.edu,August2014.
[3] R.Lyman.CatastrophicfloodshitBalkans,raisingfearsforland minesandpowerplants. TheNewYorkTimes,May2014.
[4] NationalWeatherServiceWeatherForecastOfficeNewOrleans/BatonRouge.HighflowsandfloodhistoryontheLower Mississippiriver. NationalWeatherService,August2014.
[5] E.Leister.Record-settingheatwaveinAustralia. www.accuweather.com,January2014.
[6] T.Wilkes.AngerrisesasIndiasweltersunderrecordheatwave. www.in.reuters.com,June2014.
[7] E.Chung.EasternArctictemperatureslikelyat120,000year high. CBCNews,October2013.
BIBLIOGRAPHY133 [8] R.Marshall,B.Jacobs,andA.Shaw.AsLouisianasinksandsea levelsrise,theStateisdrowningfast. TheLensandProPublica, August2014.
[9] NationalSnowandIceDataCenter.Arcticseaicenewsand analysis. www.nsidc.org/arcticseaicenews,May2014.
[10] D.Rice.Stormwarning:Climatechangetospawnmorehurricanes. USAToday,July2013.
[11] J.McQuaid.Hurricanesandclimatechange. www.pbs.org/wgbh/nova,November2012.
[12] NationalGeographic.Oceanacidification:Carbondioxideis puttingshelledanimalsatrisk. www.nationalgeographic.com, August2014.
[13] NationalOceanandAtmosphericAdministration.Oceanacidification:Theothercarbondioxideproblem. www.pmel.noaa.gov, August2014.
[14] A.Thomson.Climatechangethreatensoutdoorhockeyin Canada. TheGlobeandMail,September2012.
[15] R.McLernan.RinkwatchwantsCanadianstokeeponskatingoutdoors. www.davidsuzuki.org,January2014.
[16] WorldWildlifeFund.Impactofclimatechangeonpolarbears: Smallerseaiceseasonmeanslesstimeforpolarbearstohunt. wwf.panda.org,August2014.
[17] PolarBearsIntenational.Climatechange. www.polarbearsinternational.org,August2014.
[18] GreatBarrierReefMarineParkAuthority.GreatBarrierReef outlookreport.2014.
[19] WorldHealthOrganization.Climatechangeandinfectiousdiseases. www.who.int/globalchange/climate,August2014.
[20] EarthScienceResearchLaboratory.Trendsinatmosphericcarbondioxide. www.esrl.noaa.gov,August2014.
[21] IntergovernmentalPanelonClimateChange.Climatechange 1990. FirstAssessmentReport,1990.
[22] IntergovernmentalPanelonClimateChange.Climatechange 1995. SecondAssessmentReport,1996.
[23] IntergovernmentalPanelonClimateChange.Climatechange 2001. ThirdAssessmentReport,2001.
[24] IntergovernmentalPanelonClimateChange.Climatechange 2007. FourthAssessmentReport,2007.
[25] IntergovernmentalPanelonClimateChange.Climatechange 2013. 5thAssessmentReport,2013.
[26] M.Bastasch.Obamacallsglobalwarminga“fact”,ignoresflat temps. DailyCallerNewsFoundation,January2014.
[27] C.Krauthammer.Themythof“settledscience”. Washington Post,February2014.
[28] M.E.Mann,R.S.Bradley,andM.K.Hughes.Global-scaletemperaturepatternsandclimateforcingoverthepastsixcenturies. Nature,392:779–787,1998.
BIBLIOGRAPHY135 [29] D.Guggenheim.Aninconvenienttruth. LawrenceBenderProductions,2006.
[30] M.E.Mann,R.S.Bradley,andM.K.Hughes.Corrigendum: Global-scaletemperaturepatternsandclimateforcingoverthe pastsixcenturies. Nature,430:105–106,2004.
[31] S.McIntyreandR.McKitrick.Hockeysticks,principalcomponentsandspurioussignificance. GeophysicalResearchLetters, 32:L03710,2005.
[32] M.Crok.Kyotobasedflawedprotocolonstatistics. Natuurwetenschap&Techniek,February2005.
[33] A.Montford.Thehockeystickillusion:Climategateandthe corruptionofscience. StaceyInternational,2010.
[34] D.Carrington.IPCCofficialsadmitmistakeovermeltingHimalayanglaciers. TheGuardian,January2010.
[35] D.Biello.IPCCerrorspromptareviewonclimatesciencedata. ScientificAmerican,April2010.
[36] M.Milankovitch.Kanondererdbestrahlungundseineanswendungaufdaseiszeitenproblem. KoniglichSerbischeAkademie ISBN86-17-06619-9,1941.
[37] D.C.Morton.Anastronomer’sviewofclimatechange. Journal ofRoyalAstronomicalSocietyofCanada,pages27–34,February 2014.
[38] D.MackenzieBrown.ThefateofGreenland’sVikings. ArchaeologicalInstituteofAmerica,ISBN0-7368-0939-2,February2000.
[39] N.Lynnerup.TheNorthAtlanticsaga. editedbyW.W.Fitzhugh &E.I.Ward,SmithsonianInstitutionPress(ISBN1-56098-9955),2000.
[40] J.Diamond.Collapse:Howsocietieschoosetofailorsucceed. VikingPress,2005.
[41] G.H.Miler,A.Geirsdottir,Y.Zhong,D.J.Larsen,B.L.OttoBliesner,M.M.Holland,D.A.Bailey,K.A.Refsnider,S.J. Lehman,J.R.Southon,C.Anderon,H.Bjornsson,andT.Thordarson.AbruptonsetoftheLittleIceAgetriggeredbyvolcanism andsustainedbysea-ice/oceanfeedbacks. GeophysicalResearch Letters,39,2012.
[42] N.E.Young,A.D.Schweinsberg,J.P.Briner,andJ.M. Schaefer.GlaciermaximainBaffinBayduringthemedieval warmperiodcoevalwithNorsesettlement. ScienceAdvances, 1:e1500806,2015.
[43] J.Cowie.Climatechange:Biologicalandhumanaspects. CambridgeUniversityPress,ISBN978-0-521-69619-7,2007.
[44] N.Squires.Swissvillagersprayforglacier. TheTelegraph,August72009.
[45] ActiveCavityRadiometerIrradianceMonitor(ACRIM). Totalsolarirradiancemonitoring1978topresent. www.science.nasa.gov,2012.
[46] I.G.Usoskin,S.K.Solanki,andG.A.Kovalsov.Grandminima andmaximaofsolaractivity:Newobservationalconstraints. Astronomy&Astrophysics,471,2007.
BIBLIOGRAPHY137 [47] J.Luterbacher,D.Dietrich,E.Xoplaki,M.Grosjean,and H.Wanner.Europeanseasonalandannualtemperaturevariability,trendsandextremessince1500. Science,303:1499–1503, 2004.
[48] C.Oppenheimer.Climatic,environmentalandhumanconsequencesofthelargestknownhistoriceruption:Tamboravolcano (Indonesia)1815. ProgressinPhysicalGeography,27:230–259, 2003.
[49] G.Marland,T.A.Boden,andR.J.Adres.Global,regional andnationalCO2 emissionsintrends:Acompendiumofdata onglobalchange. CarbonDioxideInformationAnalysisCenter, OakRidgeNationalLaboratory,U.S.Dept.ofEnergy,2007.
[50] R.E.Gullison,P.C.Frumhoff,J.G.Canadell,C.B.Field,D.C. Nepstad,K.Hayhoe,R.Avissar,L.M.Curran,P.Friedlingstein, C.D.Jones,andC.Nobre.Tropicalforestsandclimatepolicy. Science,316:985–986,2007.
[51] G.R.vanderWerf,D.C.Morton,R.S.DeFries,J.G.J.Oliver, P.S.Kasibhatla,R.B.Jackson,G.J.Collatz,andJ.T.Randerson.CO2 emissionsfromforestloss. NatureGeoscience, 2:737–738,2009.
[52] BrazilianNationalInstituteforSpaceResearch.Annualrateof Amazoniandeforestation. www.inpe.br,2009.
[53] H.King.Methanehydrate:Thenextenergy“gamechanger”? GeoscienceNewsandinformation,www.geology.com,2014.
[54] T.W.Drake,K.P.Wickland,R.G.M.Spencer,D.M.McKnight,andR.G.Striegl.Ancientlow-molecular-weightorganic acidsinpermafrostfuelrapidcarbondioxideproductionupon thaw. ProceedingsoftheNationalAcademyofSciencesofthe USA,112:13946–13951,2015.
[55] A.Karion,C.Sweeney,G.Petron,G.Frost,R.M.Hardesty, J.Kofler,B.R.Miller,T.Newberger,S.Wolter,R.Banta, A.Brewer,E.Dlugokencky,P.Lang,S.A.Montzka,R.Schnell, P.Tans,M.Trainer,R.Zamora,andS.Conely.Methane emissionsestimatefromairbornemeasurementsoverawestern UnitedStatesnaturalgasfield. GeophysicalResearchLetters, 40:4393–4397,2013.
[56] B.BuffettandD.Archer.Globalinventoryofmethaneclathrate: Sensitivitytochangesinthedeepocean. EarthandPlanetary ScienceLetters,227:185–199,2004.
[57] A.Taylor.Kangaroofartsnotasenvironmentallyfriendlyas previouslythought. WashingtonPost,November52014.
[58] J.R.Petit,J.Jouzel,D.Raynaud,N.I.Barkov,J.M.Barnola, I.Basile,M.Bender,J.Chappellaz,M.Davis,G.Delaygue, M.Delmotte,V.M.Kotlyakov,M.Legrand,V.Y.Lipenkov, C.Lorius,L.Pepin,C.Ritz,E.Slatzman,andM.Stievenard. Climateandatmospherichistoryofthepast420,000yearsfrom theVostokicecore,Antarctica. Nature,399:485–497,1999.
[59] H.Riebeek.Paleoclimatology:Theoxygenbalance. www.earthobservatory.nasa.gov,May2005.
BIBLIOGRAPHY139 [60] N.Caillon,J.P.Severinghaus,J.Jouzel,J.M.Barnola,J.Kang, andV.Y.Kipenkov.TimingofatmosphericCO2 andAntarctic temperaturechangesacrossterminationIII. Science,299:1728–1731,2003.
[61] S.CaginandP.Dray.Betweenearthandsky:HowCFCs changedourworldandthreatenedtheozonelayer. Pantheon Press,NewYork:412pp,1993.
[62] UnitedNationsEnvironmentalProgramme(UNEP).Montreal protocolonsubstancesthatdepletetheozonelayer.NewYork 1987.
[63] S.Arrhenius.Ontheinfluenceofcarbonicacidintheairupon thetemperatureoftheground. PhilosophicalMagazineand JournalofScience,41:237–276,1896.
[64] A.E.Dressler,Z.Zhang,andP.Yang.Watervaporclimatefeedbackinferredfromclimatefluctuations,2003-2008. Geophysical ResearchLetters,35:L20704,2008.
[65] D.Randall.Clouds:Thewildcardofclimatechange. National ScienceFoundationReportwww.nsf.gov,November2010.
[66] A.D.DelGenioandA.B.Wolf.Thetemperaturedependence ofliquidwaterpathoflowcloudsinthesouthernGreatPlains. JournalofClimate,13:3465–3486,2000.
[67] J.Mitchell.BigYellowTaxi. AlbumentitledLadiesofthe Canyon,1970.
[68] NOAAGeophysicalFluidDynamicsLaboratory(GFDL). NOAAGFDLclimateresearchhighlightsimagegallery:Patternsofgreenhousewarming. www.gfdl.noaa.gov,2012.
[69] H.A.M.GeurtsandA.F.V.vanEngelen.Fahrenheittemperaturescale. EncyclopediaBritannicaOnline, www.britannica.com,2015.
[70] P.M.Brown.Oldlist:Adatabaseofmaximumtreeagesedited byJ.S.Dean,D.M.MekoandT.W.Swetnam. Radiocarbon, pages727–731,1996.
[71] WorldMeteorologicalOrganization. www.wmo.int,2015.
[72] B.Trewin.AdailyhomogenizedtemperaturedatasetforAustralia. InternationalJournalofClimatology,NewYork:1510–1529,2013.
[73] W.A.vanWijngaardenandL.Vincent.ExaminationofdiscontinuitiesinhourlysurfacehumidityinCanadaduring19532003. JournalofGeophysicalResearch,110:D22102,2005.
[74] L.Vincent,W.A.vanWijngaarden,andR.Hopkinson.SurfacetemperatureandhumiditytrendsinCanadafor1953-2005. JournalofClimate,2010:5100–5113,2007.
[75] V.IsaacandW.A.vanWijngaarden.Surfacewatervapour pressureandtemperaturetrendsinNorthAmericaduring19482010. JournalofClimate,25:3599–3609,2012.
BIBLIOGRAPHY141 [76] W.A.vanWijngaarden.AnalysisofAustralianminimnum/maximumtemperaturesfrom1856to2014. Reportfor GlobalWarmingPolicyFoundation,2015.
[77] H.A.M.GeurtsandA.F.V.vanEngelen. KNMIPublication165-I,Geschiedenisvanweerkundigewaarnemingeninhet bijzonderinNederlandvoordeoprichtingvanhetKNMI,1983.
[78] RoyalNetherlandsMeteorologicalInstitute. www.knmi.nl,2014.
[79] EnvironmentCanadaDataArchive. http://climate.weather.gc.ca,2014.
[80] AustralianBureauofMeteorology. www.bom.gov.au/climate/data,2015.
[81] P.Gwynne.Coolingworld. Newsweek,April28,1975.
[82] Anothericeage? Time,June27,1974.
[83] T.R.Karl,A.Arguez,B.Huang,J.H.Lawrimore,J.R.McMahon,M.J.Menne,T.C.Peterson,R.S.Vose,andH.M.Zhang. Possibleartifactsofdatabiasesintherecentglobalsurface warminghiatus. Science,348:1469–1472,2015.
[84] W.A.vanWijngaarden.TemperaturetrendsintheCanadian Arcticduring1895-2013. TheoreticalandAppliedClimatology, 120:609–615,2014.
[85] W.A.vanWijngaarden.Arctictemperaturetrendsfromthe earlynineteenthcenturytothepresent. TheoreticalandApplied Climatology,122:567–580,2014.
[86] W.A.vanWijngaarden.Examinationoftrendsinhourlysurface pressureinCanadaduring1953-2003. InternationalJournalof Climatology,25:2014–2049,2005.
[87] D.J.ThompsonandJ.M.Wallace.TheArcticoscillationsignatureinthewintertimegeopotentialheightandtemperature fields. GeophysicalResearchLetters,25:1297–1300,2014.
[88] NationalClimateDataCenterofNationalOceanic andAtmosphericAdministration.Arcticoscillation. www.ncdc.noaa.gov/bams-state-of-the-climate/2010,March 2012.
[89] P.D.JonesandD.H.Lister.Theurbanheatislandincentral Londonandurban-relatedwarmingtrendsincentralLondon since1900. Weather,64:323–327,2008.
[90] J.F.Kennedy.AddresstoAmericanUniversity. WashingtonD. C.,June10,1963.
[91] R.W.SpencerandJ.R.Christy.Precisemonitoringofglobal temperaturetrendsfromsatellites. Science,pages4950–4954, 2471990.
[92] J.R.ChristyandR.T.McNider.Satellitebulktropospheric temperaturesasametricforclimatesensitivity. RemoteSensing, pagesISSN2072–4292,2015.
[93] R.T.McNiderandJ.R.Christy.WhyKerryisflatwrongon climatechange. TheWallStreetJournal,February19,2014.
BIBLIOGRAPHY143 [94] J.Oerlemans.Extractingaclimatesignalfrom169glacier records. Science,308:675–677,2005.
[95] R.Sandford.Columbiaicefieldshrinkingfast. RockyMountain Outlook,February4,2010.
[96] L.G.Thompson,E.Mosley-Thompson,M.E.Davis,K.A.Henderson,H.H.Brecher,V.S.Zagorodnov,T.A.Mashiotta,P.N. Lin,V.N.Mikhalenko,D.R.Hardy,andJ.Beer.Kilimanjaro icecorerecords:Evidenceofholoceneclimatechangeintropical Africa. Science,298:589–593,2002.
[97] N.J.Cullen,P.Sirguey,T.Mölg,G.Kaser,M.Winkler,and S.J.Fitzsimons.AcenturyoficeretreatonKilimanjaro:The mappingreloaded. TheCryosphere,6:4233–4265,2012.
[98] N.C.Pepin,W.J.Duane,andD.R.Hardy.Themontane circulationofKilimanjaro,Tanzaniaanditsrelevanceforthe summiticefields:Comparisonofsurfacemountainclimatewith equivalentreanalysisparameters. GlobalandPlanetaryChange, 74:61–75,2010.
[99] NationalSnowandIceDataCenter.Quickfactsonicesheets. www.nsidc.org/crosphere/quickfacts/icesheets,2015.
[100] R.KwokandA.Rothrock.DeclineinArcticseaicethickness fromsubmarineandICESatrecords:1958-2008. Geophysical ResearchLetters,36:L15501,2009.
[101] NationalSnowandIceDataCenter.2015Greenlandmeltseason inreview. www.nsidc.org/greenland-today,2015.
[102] InternationalChamberofShipping.Arcticshippingposition paper. www.ics-shipping.org,2014.
[103] FinnishMeteorologicalInstitute.Maximumextentofice coverintheBalticSea. www.eea.europa.eu/data-andmaps/daviz/maximum-extent-of-ice-cover,2015.
[104] G.N.Ifft.ThechangingArctic. MonthlyWeatherReview,page 589,November1922.
[105] InternationalUnionforConservationofNatureSpeciesSurvival Commission:PolarBearSpecialistsGroup.Agreementonthe conservationofpolarbears. www.pbsg.npolar.no,1973.
[106] P.Fretwell,H.D.Pritchard,D.G.Vaughan,J.L.Bamber, N.E.Barrand,R.Bell,C.Bianchi,R.G.Bingham,D.D. Blankenship,G.Casassa,G.Catania,D.Callens,H.Conway, A.J.Cook,H.F.J.Corr,D.Damaske,V.Damm,F.Ferraccioli,R.Forsberg,S.Fujita,Y.Gim,P.Gogineni,J.A.Griggs, R.C.A.Hindmarsh,P.Holmlund,J.W.Holt,R.W.Jacobel,A.Jenkins,W.Jokat,T.Jordan,E.C.King,J.Kohler, W.Krabill,M.Riger-Kusk,K.A.Langley,G.Leitchenkov, C.Leuschen,B.P.Luyendyk,K.Matsukoa,J.Mouginot,F.O. Nitsche,Y.Nogi,O.A.Nost,S.V.Popov,E.Rignot,D.M. Rippin,A.Rivera,J.Roberts,N.Ross,M.J.Siegert,A.M. Smith,D.Steinhage,M.Studinger,B.Sun,B.K.Tinto,B.C. Welch,D.Wilson,D.A.Young,C.Xiangbin,andZ.Zirizzotti. Bedmap2:Improvedicebed,surfaceandthicknessdatasetsfor Antarctica. TheCryosphere,7:375–393,2013.
BIBLIOGRAPHY145 [107] J.Mouginot,E.Rignot,andB.Scheuchl.Sustainedincreasein icedischargefromtheAmundsenseaembayment,WestAntarctica,from1973to2013. GeophysicalResearchLetters,41:1576–1584,2014.
[108] D.KochandJ.Hansen.DistantoriginsofArcticblackcarbon:A GoddardInstituteforSpaceStudiesmodelEexperiment. JournalofGeophysicalResearch,110:D04204,2005.
[109] M.Sand,T.K.Bemtsen,O.Seland,andJ.E.Kristánsson. Arcticsurfacetemperaturechangetoemissionsofblackcarbon withinArcticormidlatitudes. JournalofGeophysicalResearch: Atmospheres,118:7788–7798,2013.
[110] UnitedStatesEnvironmentProtectionAgency. Globalaverageabsolutesealevelchange,1880-2014. www.epa.gov/climatechange,2015.
[111] K.J.Mesollela.Zonationofupliftedpleistocencecoralreefson Barbados,WestIndies. Science,156:638–640,1967.
[112] A.Eisenhauer,G.J.Wasserburg,J.H.Chen,G.Bonani,L.B. Collins,Z.R.Zhu,andK.H.Wyrwoll.Holocenesea-leveldeterminationrelativetotheAustraliancontinent:U/Th(TIMS) and 14 C(ams)datingofcoralcoresfromtheAbrolhosIslands. EarthandPlanetaryScienceLetters,114:529–547,1993.
[113] B.C.Douglas.Globalsearise:Aredetermination. Surveysin Geophysics,18:279–292,1997.
[114] G.F.Sella,S.Stein,T.H.Dixon,M.Craymer,T.S.James, S.Mazzotti,andR.K.Dokka.Observationofglacialisostatic
adjustmentin“stable”NorthAmericawithGPS. Geophysical ResearchLetters,34:L02306,2007.
[115] NationalOceanicandAtmosphericAdministration.Whatisa thermocline? http://oceanservice.noaa.gov,2015.
[116] A.Lombard,T.A.Cazenavea,K.DoMinha,C.Cabanesb,and R.S.Neremc.Thermostericsealevelriseforthepast50years; comparisonwithtidegaugesandinferenceonwatermasscontribution. GlobalandPlanetaryChange,48:303–312,2005.
[117] S.Marcelja.Thetimescaleandextentofthermalexpansionof theglobaloceanduetoclimatechange. OceanScience,6:179–184,2010.
[118] RACM&TNOdevelopedforNationaleOnderzoeksagendaArcheologie.PaleontologymapoftheNetherlands. www.noaa.nl,2007.
[119] J.Buisman.Duizendjaarweer,windenwaterindelagelanden. Franeker,theNetherlands:VanWijnen.ISBN978-9-05194075-6,1995.
[120] DeltawerkenOnline.TheDeltaWorks. www.deltawerken.com, 2015.
[121] M.D.BlumandH.H.Roberts.DrowningoftheMississippi deltaduetoinsufficientsedimentsupplyandglobalsealevel rise. NatureGeoscience,2:488–491,2009.
BIBLIOGRAPHY147 [122] NationalWeatherServiceWeatherForecastOfficeNewOrleans/BatonRouge.HurricaneKatrina-alookback10years later. http://www.srh.noaa.gov,2015.
[123] NationalOceanicandAtmosphericAdministration.NOAA’sstateofthecoast. http://stateofthecoast.noaa.gov/population/welcome.html,2015.
[124] D.Zanchettin,S.W.Franks,P.Traverso,andM.Tomasino. OnENSOimpactsonEuropeanwintertimerainfallsandtheir modulationbytheNAOandthePacificmulti-decadalvariabilitydescribedthroughthePDOindex. InternationalJournalof Climatology,28:995–1006,2008.
[125] N.FrankandS.A.Husain.Thedeadliesttropicalcyclonein history? BulletinoftheAmericanMeteorologicalSociety,June, 1971.
[126] NationalHurricaneCenter.Saffir-SimpsonHurricaneWind Scale. http://www.nhc.noaa.gov,2015.
[127] R.Maue.Recenthistoricallylowglobaltropicalcycloneactivity. GeophysicalResearchLetters,38:L14803,2011.
[128] C.L.Sabine,R.A.Feely,N.Gruber,R.M.Key,K.Lee, J.L.Bullister,R.Wanninkhof,C.S.Wong,D.W.R.Wallace, B.Tilbrook,F.J.Millero,T.H.Peng,A.Kozyr,T.Ono,and A.F.Rios.TheoceanicsinkforanthropogenicCO2 Science, 305:367–371,2004.
[129] A.L.SoliandR.H.Byrne.CO2 systemhydrationanddehydrationkineticsandtheequilibriumCO2 /H2 CO3 ratioinaqueous NaClsolution. MarineChemistry,78:65–73,2002.
[130] M.Z.Jacobson.Studyingoceanacidificationwithconservative, stablenumericalschemesfornonequilibriumair-oceanexchange andoceanequilibriumchemistry. JournalofGeophysicalResearch,110:D07302,2005.
[131] J.C.Orr,V.J.Fabry,O.Aumont,L.Bopp,S.C.Doney, R.A.Feely,A.Gnanadesikan,N.Gruber,A.Ishida,F.Joos, R.M.Key,K.Lindsay,E.M.Reimer,R.Matear,P.Monfray, A.Mouchet,R.G.Najjar,G.Plattner,K.B.Rodgers,C.L. Sabine,J.L.Sarmiento,R.Schlitzer,R.D.Slater,I.J.Totterdell,M.Weirig,Y.Yamanaka,andA.Yool.Anthropogenic oceanacidificationoverthetwenty-firstcenturyanditsimpact oncalcifyingorganisms. Nature,437:681–686,2005.
[132] K.R.N.Anthony,D.I.Kline,G.Diaz-Pulido,S.Dove,and O.Hoegh-Guldberg.Oceanacidificationcausesbleachingand productivitylossincoralreefbuilders. ProceedingsoftheNationalAcademicofSciences,105:17442–17446,2008.
[133] G.E.Hofmann,J.E.Smith,K.S.Johnson,U.Send,L.A.Levin, F.Micheli,A.Paytan,N.N.Price,B.Peterson,Y.Takeshita, P.G.Matson,E.D.Crook,K.J.Kroeker,M.C.Gambi,E.B. Rivest,C.A.Frieder,P.C.Yu,andT.R.Martz.High-frequency dynamicsofoceanpH:Amulti-ecosystemcomparison. PLoS ONE,6:e28983doi:10.1371/journal.pone.0028983,2011.
[134] F.Wentz,L.Ricciardulli,K.Hilburn,andC.Mears.Howmuch morerainwillglobalwarmingbring? ScienceExpress,317:233–235,2007.
[135] X.Zhang,F.W.Zwiers,G.C.Hegerl,F.H.Lambert,N.P. Gillett,S.Solomon,P.A.Stott,andT.Nozawa.Detection ofhumaninfluenceontwentieth-centuryprecipitationtrends. Nature,448:doi.10.1038,2007.
[136] A.Dai,I.Y.Fung,andA.D.DelGenio.Surfaceobservedglobal landprecipitationvariationsduring1900-88. JournalofClimate, 10:2943–2962,1997.
[137] P.XieandP.A.Arkin.Globalprecipitation:A17-yearmonthly analysisbasedongaugeobservations,satelliteestimatesandnumericalmodeloutputs. BulletinoftheAmericanMeteorological Society,78:2539–2558,1997.
[138] R.Kistler,W.Collins,S.Saha,G.White,J.Woollen,E.Kalnay, M.Chelliah,W.Ebisuzaki,M.Kanamitsu,V.Kousky, H.vandenDool,R.Jenne,andM.Fiorino.TheNCEP-NCAR 50-yearreanalysis:Monthlymeans. BulletinoftheAmerican MeteorologicalSociety,82:247–268,2001.
[139] R.F.Adler,G.J.Huffman,A.Chang,R.Ferraro,P.P.Xie, J.Janowiak,B.Rudolf,U.Schneider,S.Curtis,D.Bolvin, A.Gruber,J.Susskind,P.Arkin,andE.Nelkin.Theversion 2globalprecipitationclimatologyprojectmonthlyprecipitation analysis(1979-present). JournalofHydrometeorology,4:1147–1167,2003.
[140] W.A.vanWijngaarden.ExaminationofarchivaldataforinhomogeneitiesanddeterminationofclimatechangeinNorthAmerica. JournalofEarthScienceandEngineering,3:776–783,2013.
[141] W.A.vanWijngaardenandA.Syed.Changesinannualprecipitationovertheearth’slandmassexcludingAntarcticafrom the18thcenturyto2013. JournalofHydrology,531:1020–1027, 2015.
[142] D.Fieldhouse.Forricher,forpoorer? P.J.MarshallThe CambridgeIllustratedHistoryoftheBritishEmpire,Cambridge UniversityPress,1996.
[143] J.I.Lopez-Moreno,S.M.Vicente-Serrano,E.Moran-Tejeda, J.Lorenzo-Lacruz,A.Kenawy,andM.Beniston.Effectsof theNorthAtlanticOscillation(NAO)oncombinedtemperatureandprecipitationwintermodesintheMediterraneanmountains:Observedrelationshipsandprojectionsforthe21stcentury. GlobalandPlanetaryChange,77:62–76,2011.
[144] M.K.Davey,A.Brookshaw,andS.Ineson.Theprobabilityof theimpactofENSOonprecipitationandnear-surfacetemperature. ClimateRiskManagement,1:5–24,2014.
[145] J.Brown.“Thisisthefuture:”Gov.Brownsaysclimatechange,historicdroughtcontributingtoextremefire. http://www.nbcbayarea.com/news/local,September14„2015.
[146] D.MedvigyandC.Beaulieu.Changesindailysolarradiation andprecipitationcoefficientsofvariationsince1984. Journalof Climate,25:1330–1339,2012.
BIBLIOGRAPHY151 [147] A.Bronstert,D.Niehoff,andG.Bürger.Effectsofclimateand land-usechangeonstormrunoffgeneration:presentknowledge andmodellingcapabilities. HydrologicalProcesses,16:509–529, 2002.
[148] NationalOceanicandAtmosphericAdministrationGreatLakes EnvironmentalResearchLaboratory.GreatLakeswaterlevel observations. www.glerl.noaa.gov/data/wlevels,2015.
[149] TheSt.LawrenceSeawayManagementCorporation.Great LakesSt.LawrenceSeawaySystem. www.greatlakesseayway.com,2015.
[150] NationalForestryDatabase.Forestfires:Areaburned,19702013. www.nfdp.ccfm.org/data/graphs,2015.
[151] B.Sanders.InterviewwithJ.Dickerson. FacetheNation, November15,2015.
[152] D.Sington.Dimmingthesun. PublicBroadcastingService,April 18,2006.
[153] D.J.Travis,A.M.Carleton,andR.G.Lauritsen.Contrails reducediurnaltemperaturerange. Nature,418:601,2002.
[154] D.J.Travis,A.M.Carleton,andR.G.Lauritsen.RegionalvariationsinU.S.diurnaltemperaturerangeforthe11-14September 2001aircraftgroundings:Evidenceofjetcontrailinfluenceon climate. JournalofClimate,17:1123–1134,2004.
[155] J.Q.DeGrand,A.M.Carleton,D.J.Travis,andP.J.Lamb. Asatellite-basedclimaticdescriptionofjetaircraftcontrailsand
associationswithatmosphericconditions. JournalofApplied Meteorology,39:1434–1459,2000.
[156] A.J.KalksteinandR.C.Balling.Impactofunusuallyclear weatheronUnitedStatesdailytemperaturerangefollowing 9/11/2001. ClimateResearch,26:1–4,2004.
[157] G.Hong,P.Yang,Y.X.Hu,andG.North.Docontrailssignificantlyreducedailytemperaturerange? GeophysicsResearch Letters,35:L23815,2008.
[158] S.Dietmüller,M.Ponater,R.Sausen,andK.Hoinka.Contrails,naturalcloudsanddiurnaltemperaturerange. Journalof Climate,21:5061–5075,2008.
[159] W.A.vanWijngaarden.ExaminationofCanadianclimateimmediatelyafterSept.11,2001. ProceedingsofAmericanMeteorologicalSocietyMeeting,NewOrleans,Louisiana,2008.
[160] W.A.vanWijngaarden.Examinationofdiurnaltemperature rangeatstationsincontinentalU.S.duringSept.8-17,2001. TheoreticalandAppliedClimatology,109:1–5,2012.
[161] U.S.EnergyInformationAdministrationDepartmentofEnergy.U.S.primaryenergyconsumptionbysourceandsector. www.eia.doe/gov/energyexplained/images/charts,2009.
[162] R.Eveleth.Howmanybirdsdowindmillsreallykill? The Smithsonian,www.smithsonianmag.com,2013.
[163] M.Duchamp.HowmuchwildlifecanUSAaffordtokill? Save
theEagleInternational,http://savetheeagleinternational.org, 2014.
[164] G.Morgan.Thesorrylessonsofgreen-powersubsidies. The GlobeandMail,April292012.
[165] ThePewEnvironmentGroup.Historyoffueleconomy. www.PewEnvironment.org/CleanEnergy,2015.
[166] P.J.Crutzen.Albedoenhancementbystratosphericsulfurinjections:Acontributiontoresolveapolicydilemma? Climatic Change,77:211–219,2006.
[167] K.CaldeiraandL.Wood.GlobalandArcticclimateengineering: numericalmodelstudies. PhilosophicalTransactionsoftheRoyal SocietyA,366:4039–4056,2008.
[168] J.R.Pierce,D.K.Weisenstein,P.Heckendom,T.Peter,and D.W.Keith.Efficientformationofstratosphericaerosolforclimateengineeringbyemissionofcondensiblevaporfromaircraft. GeophysicalResearchLetters,37:L18805,2010.
[169] A.Nel.Airpollution-relatedillness:Effectsofparticles. Science, 308:804–806,2005.
[170] S.C.Riser,H.J.Freeland,D.Roemmich,S.Wijffels,A.Troisi, M.Belbeoch,D.Gilbert,J.Xu,S.Pouliquen,A.Thresher, P.LeTraon,G.Maze,B.Klein,M.Ravichandran,F.Grant, P.Poulain,T.Suga,B.Lim,A.Sterl,P.Sutton,K.Mork, P.Velez-Belchi,I.Ansorge,B.King,J.Turton,M.Baringer, andS.R.Jayne.Fifteenyearsofoceanobservationswiththe globalArgoarray. NatureClimateChange,6:145–153,2016.