
Published by SET Publisher
Journal of Basic & Applied Sciences
ISSN (online): 1927-5129


Published by SET Publisher
ISSN (online): 1927-5129
1The Lightfoot Institute, Canada
2Professor Emeritus, McGill University, Canada
Article Info:
Keywords: Condensation of water vapor, energy from Earth to space, global energy balance, photosynthesis, storms, Sun energy to Earth.
Timeline:
Received: May 15, 2024
Accepted: June 14, 2024
Published: June 24, 2024
Citation: Lightfoot HD, Ratzer G The sun evaporates water to cool the earth for life to flourish J Basic Appl Sci 2025; 21.
*Corresponding Author
E-mail: dlightfo@aei.ca, contact@thelightfootinstitute.ca
Abstract:
This study analyzes the role of water vapor in keeping the Earth cool and the role of the Sun in providing food and oxygen. The Sun sends enormous amounts of energy daily to the Earth about one-half of the world's annual energy consumption. This energy heats the surface, evaporates water, and creates a rising thermal column of warm, moist air. When the air reaches an altitude where the dew point causes the evaporated water to condense, the heat released eventually escapes to space as infrared radiation. Enough heat is released to space to maintain the Earth’s temperature suitable for current life forms. The level of carbon dioxide in the atmosphere is adequate for the photosynthesis process to provide food and oxygen for the life forms. The water cycle shows how the system works. Storms such as thunderstorms and hurricanes are powerful and essential to the water cycle. They provide most heat removal. No component of the Earth’s atmosphere other than water vapor has a significant cooling effect. A tiny but essential part of the Sun’s energy powers photosynthesis, providing oxygen and food at the bottom of the food chain on land and in the sea.
© 2025 Lightfoot and Ratzer; Licensee SET Publisher. This is an open-access article licensed under the terms of the Creative Commons Attribution License (http://creativecommons.org/licenses/by/4.0/), which permits unrestricted use, distribution, and reproduction in any medium, provided the work is properly cited.
Throughout history, people have been interested in the weather and climate. They have made observations and recorded them to learn how the weather system works. As a result, we know much about how the Earth’s atmosphere operates. We have hourly temperature and relative humidity measurements at millions of weather stations around the Earth. AccuWeather uses this information for weather forecasts at 3.5 million locations [1].
We know specific facts about the Earth’s atmosphere, such as how it functions to maintain a temperature suitable for current lifeforms. The Sun is the primary temperature controller, and its energy output goes up and down in cycles, followed by the Earth’s temperature [2]. The amount of the Sun’s energy reaching Earth also depends on the Milankovitch cycles [3] that result from the Earth’s orbit changing from almost circular to strongly elliptical and the tipping of the Earth away from the Sun.
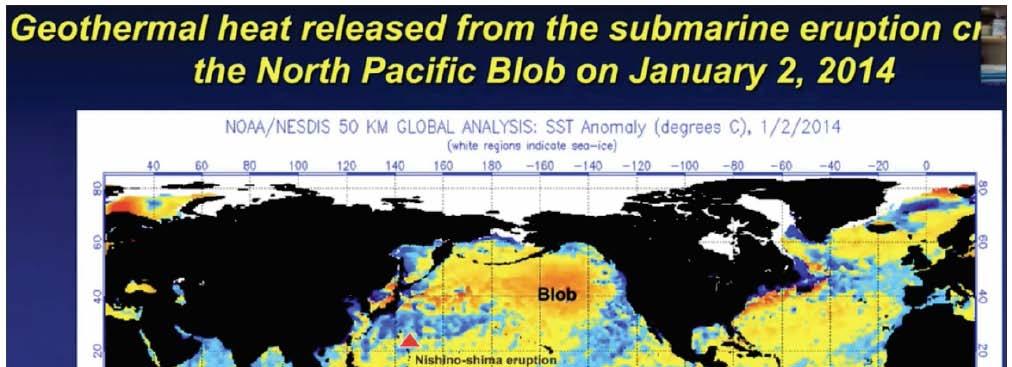
Underwater volcanism is a secondary heat input to the Earth’s atmosphere, as shown in Figure 1 [4]. Some volcanism is intermittently cyclical, such as the cause of El Niño, which sends warm water eastward to the west coast of North America every two to seven years.
Observations indicate that the Sun sends enormous amounts of energy daily to the Earth. The theoretical
energy input to Earth from the Sun daily is 89,300 TW, i.e., 321.48 x 10^18 = 321.48 Exajoules (EJ) [5]. The World consumed 620 EJ of energy in 2023 [6]. Thus, the Sun supplied approximately one-half of the total energy consumed by the World in one hour in 2023. The Earth needs a robust cooling system to compensate for the Sun’s enormous daily input energy to the Earth to keep it cool. For reference, one Joule is the heat required to raise the temperature of one gram of water by one degree Celsius. One kilojoule (kJ) is the heat needed to raise the temperature of one kilogram of water by one degree Celsius.
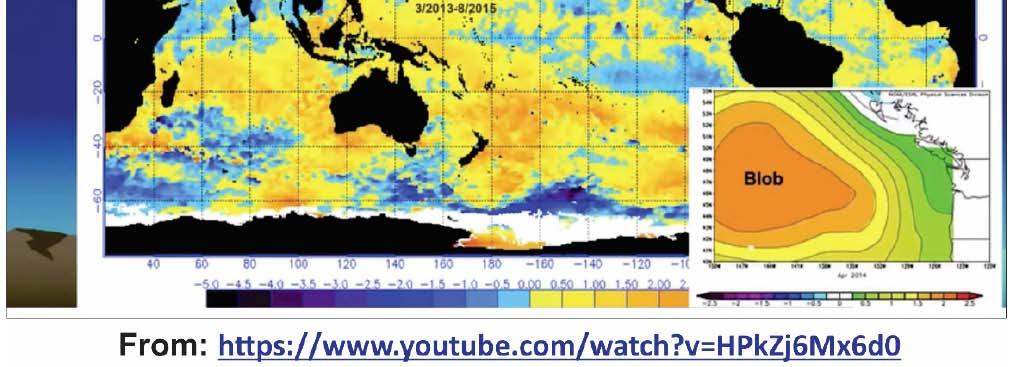
Figure 2 is from page 55 of a book published in 2008, Climate Confusion [7], by meteorologist Dr. Roy Spencer. Meteorologists rely on observations of the Earth’s atmosphere in their work. Thus, they conclude that without sufficient cooling, the Earth’s temperature would be an estimated 60oC rather than the current 14 to 15oC. The diagonal solid line represents observed values and cooling by water. The diagonal dashed line estimates the Earth’s temperature without cooling by water.
Dr. Spencer states that heat is moved from where there is more to where there is less, including around the Earth and into space. This is done through a dynamic system, the water cycle, and keeps the Earth’s temperature within a reasonable range for current life forms.
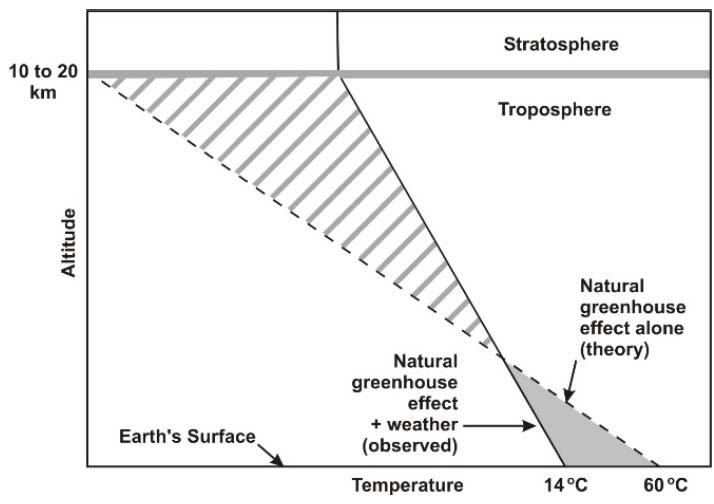
The Earth’s water cycle in Figure 3 [8] is adapted to show that heat is released to flow to space when water vapor condenses and forms clouds of water droplets or ice crystals. The heat flows to space as infrared radiation. The amount of heat sent to space equals the amount of heat from the Sun absorbed by the Earth to maintain the Earth's temperature at a habitable level for current life forms to exist. Underwater volcanic action also supplies heat that must be removed to keep the temperature balanced.
The various observed water and water vapor flows are identified. Storm action is included in “Precipitation.”
Thunderstorms are dynamic, generate much power in potent winds, and, on average, last approximately an hour. According to Reference [9], approximately 40,000 occur daily worldwide.
In Figure 4, a thunderstorm starts to form on the left side. A rising column of warm, moisture-laden air in the Towering Cumulus Stage is beginning to form, carrying
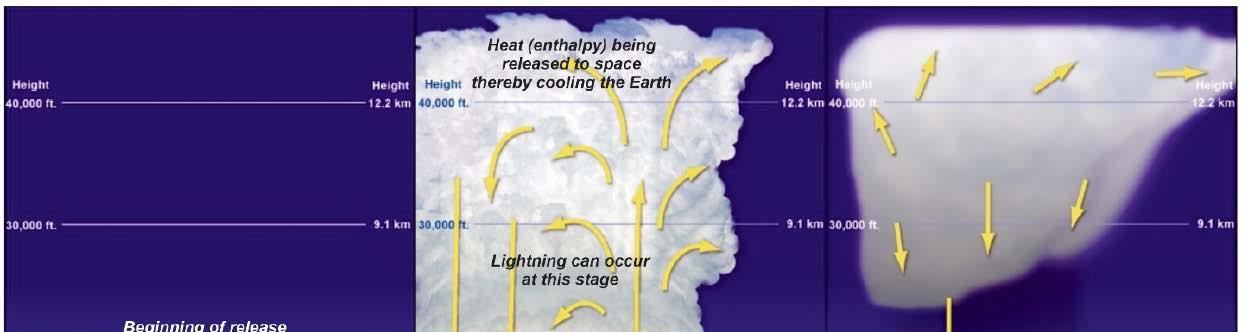
the air to an elevation cold enough to condense the water vapor. The dew point where condensation starts is approximately 4,000 feet (1219 meters). As the water vapor condenses in the Mature Stage, it releases heat that further enhances the updraft and carries the top above 40,000 feet (12.2 km). As the updraft continues in the Mature stage, the air in the updraft is replaced by strong winds that bring air in at the surface to replace that in the updraft. Water from the condensation is beginning to coalesce into drops of water that fall as rain. The heat (enthalpy) of the water vapor condensing
is released and flows to space. This heat release to space reduces the upward driving force, and the thunderstorm moves into the Dissipating stage. The cloud disperses as the water drops as rain. Often, the rainfall is heavy during the last two stages [4].
Precipitation indicates that water vapor has condensed, and the heat released has been sent to space to keep the Earth cool.
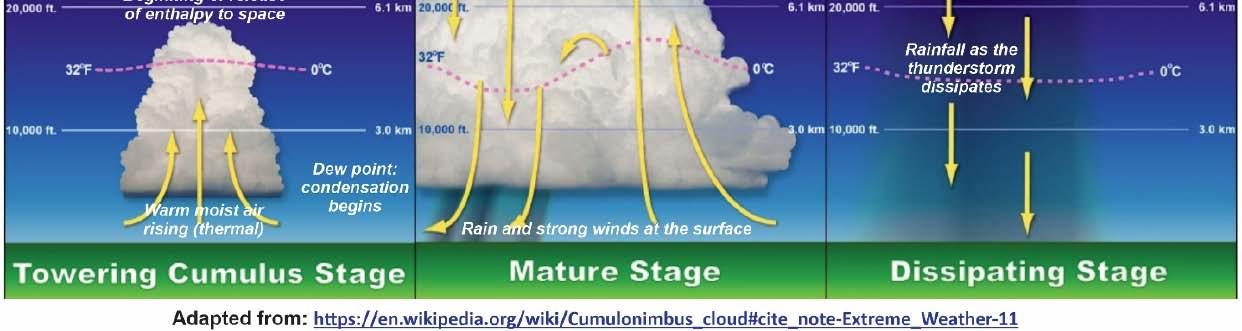
Figure 5 is another more straightforward graphic of a thunderstorm [10]. It shows “Virga” on the right side.
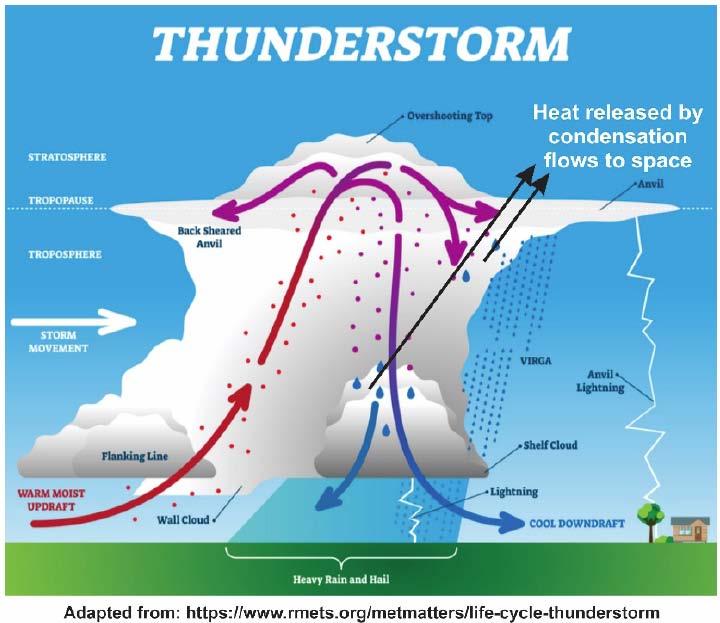
Virga is falling precipitation that evaporates before it hits the ground because it falls into dry air.
The complete thunderstorm cycle in Figures 4 and 5 takes an average of an hour with less than half an hour of thunder and lightning.
As a column of air rises in a thunderstorm, somewhere, a falling column of air replaces the rising column. This is the cause of the strong winds that occur.
Thunderstorms are crucial to life on Earth. We show two different figures about thunderstorms to help the reader to understand them better.
Tornados develop from severe thunderstorms associated with black skies, strong winds, lightning, thunder, and heavy rain or hail. Sometimes, the sky turns an unusual green, and the wind sounds like a freight train [11].
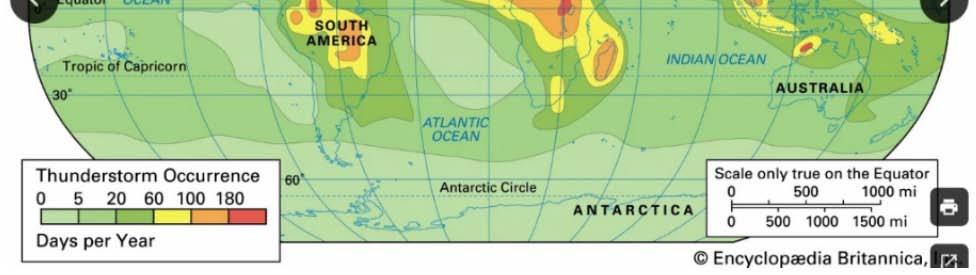
The Tropics are defined as 23.5oN (Tropic of Cancer) to 23.5oS (Tropic of Capricorn). Their area represents 39.8% of the Earth’s surface and almost three-quarters of the atmosphere’s water vapor. The ratio in this area of water vapor molecules to carbon dioxide (CO2) molecules is approximately 100:1. In contrast, the Arctic and Antarctic areas at the Poles have an estimated 0.9% of the atmosphere’s water vapor.
An estimated 40,000 thunderstorms occur daily worldwide [12]. Each thunderstorm recycles water and
sends an enormous amount of energy to space. This is evident because it rains daily in many parts of the tropics, hence the term “Tropical rainforest.” There is a rainforest on the northwest coast of North America. The mountains stop the eastern flow of moisture-laden air, which must drop its moisture before it rises above them.
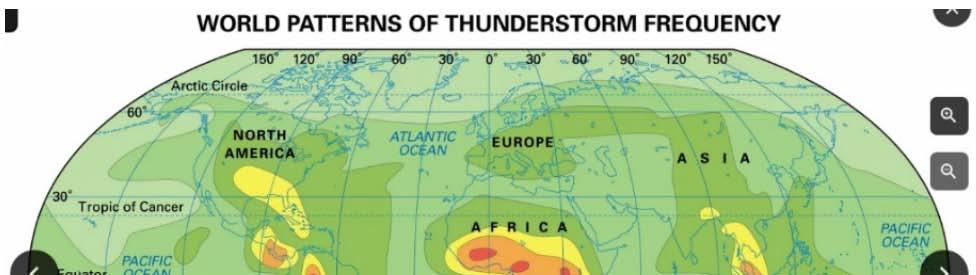
Most of the Earth’s thunderstorms occur in the Tropics [13], as in Figure 6
OF HEA T REMOVED FROM EARTH BY THE EVAPORA TION OF WATER BY HURRICANE HELENE
There does not appear to be an estimate of the average amount of heat released to space by the average thunderstorm. However, it is estimated that the recent Hurrica ne Helene dropped 40 trillion U.S. gallons of rain on the southeast corner of the U.S. [8]. Knowing the latent heat of water evaporation is 2256 kilojoules/kg, there are 3.78 liters per U.S. gallon, and each liter of water weighs one kilogram, the calculation for the heat released to space is:
40,000,000,000,000 x 3.78 x 2256 x 1000= 341,107,200,000,000,000,000 Joules (1)
This number is 341.107 x 10¹⁸ Joules = 341.1 EJ. Most of this energy sent to space by Hurricane Helene occurred over two days [14 ]. The amount of 341.1 EJ is slightly more than the daily input by the Sun of 321.48 EJ [4]. This amount is somewhat over one-half the 620 EJ of total energy the World consumed in 2023. These
examples show large storms send enormous heat to space to cool the Earth.
The accuracy of the estimate of the amount of water dropped by Hurricane Helene is not known. Nevertheless, it shows the immense heat sent to space by water condensing to keep the Earth cool by just one hurricane. If the 40,000 daily thunderstorms removed the heat from the Sun's daily input, they would remove approximately 0.008 EJ each. From Figure 6, most thunderstorms occur in the Tropics, where most heat is removed. This is unsurprising because most of the Earth’s water vapor is in the Tropics [15].
Hurricane Helene generated a lot of power that created robust and destructive winds.
At the current CO2 level of ap proximately 420 ppm, CO2's cooling and warming effects are insignificant compared to water vapor. Its heat content (enthalpy) per kilogram is defined by (kg/kg dry air x specific heat x ΔT). Thus, one kilogram of CO2 raised by 1oC has 0.833 kilojoules, i.e., (1 x 0.833 x 1) = 0.833 kJ. CO2 is above its boiling point in the Earth’s atmosphere and has no phase change. In contrast, one kg of water in phase change can emit or absorb 2256 kJ. Thus, the warming or cooling effect of one kg of CO2 is (0.833/2256) = 0.037% of that of one kg of water. This is insignificant.
The role of CO2 in warming the Earth is too small to measure, i.e., undetectable at less than 0.01oC [14].
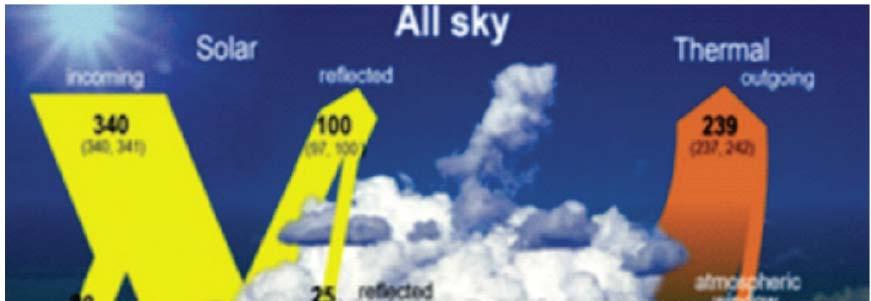
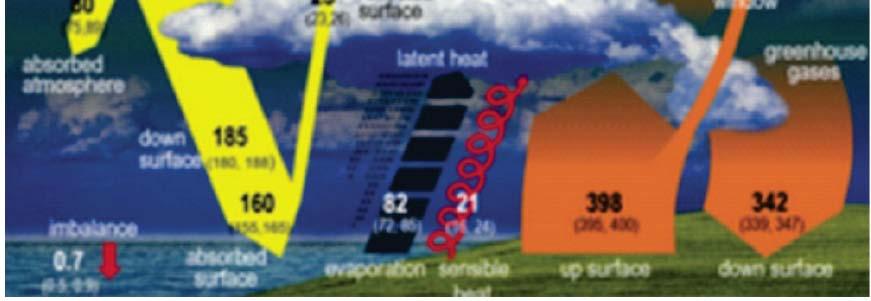
Now that we know the role of water vapor in cooling the Earth, the amount of the Sun’s energy used to evaporate water must be very close to the amount of energy sent to space. In Figure 7 , the energy to evaporate water is 82 W m-2, and the energy sent to space is 239 W m-2. This vast difference indicates something is seriously wrong with the structure in Figure 7 , Figure 7.2 from the IPCC Sixth Assessment Report (AR6).
We know that the Total Solar Irradiance is around 1366 Watts per square meter at the top of the atmosphere [16]. Thus, the amount of energy leaving the Earth to keep the temperature balanced is more than 1366 Wm-2, including the warming caused by underwater volcanism.
The role of sunlight in photosynthesis is not mentioned, probably because it is numerically insignificant. Nevertheless, photosynthesis provides all of our food and oxygen without these, there would be no life on Earth.
The structure for a revised global mean energy balance is given in Figure 10
Figure 8 shows how sunlight interacts with the green chlorophyll inside plant leaves to convert CO2 and water into simple sugars and release oxygen into the atmosphere. The plant converts the simple sugars into
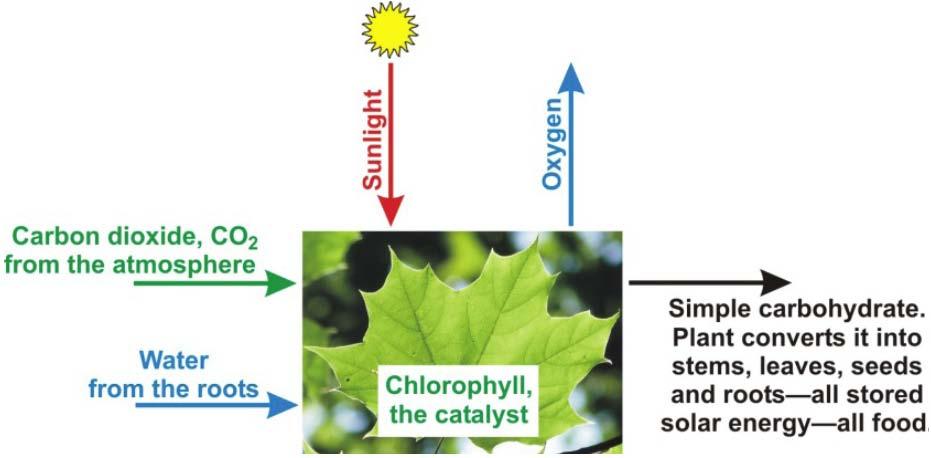
leaves, stems, flowers, and seeds, all food for life on Earth.
The carbon cycle in Figure 9 [17] allows us to determine the amount of plant material grown annually on land and in the oceans. The total carbon content is 120 Gigatons (Gt) on land and 90 Gt in the sea for a total carbon of 210 Gt. 210 Gt is 210,000,000,000 tons = (210,000,000,000 x (2000/2.205)) = 190,476,190, 476,190 kilograms of carbon. Assuming the average chemical composition of the solid biomass of plant growth is cellulose, C6H10O5, the molecular weight is ((6 x 12) + (10 x 1) + (5 x 16)) = (72 + 10 + 80) = 162.
The amount of plant growth material is the total molecular weight divided by the molecular weight of CO2 = (162/72) = 2.25. Thus, 2.25 x 190,476,190, 476,190 = 428,571,428,571,427 kilograms of biomass.
Assuming the average calorific value of the plant material is 1500 Joules/kilogram [18], there are
42,857,142,857,1 41,000 Joules = 0.643 EJ. This is 0.643/321.48 = 0.20% of the Sun’s hourly input to the Earth. Thus, the amount of the Sun’s energy is tiny compared to the Sun's hourly input and could be considered negligible. Nevertheless, it is vitally important because it is the source of all food and oxygen for life on Earth.
The calculation that only 0.20% of the Sun’s energy goes to photosynthesis might not be accurate. Still, it does indicate that it is tiny compared to the Sun’s energy input to Earth.
The estimated values on the structure in Figure 10 are from the calculations under Section 9, “Photosynthesis and the carbon cycle.” They record the size of the Sun’s energy input for photosynthesis. It is tiny but essential for life on Earth.
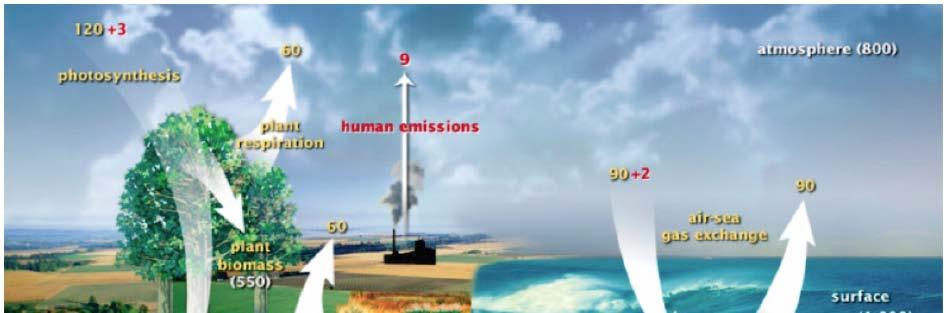
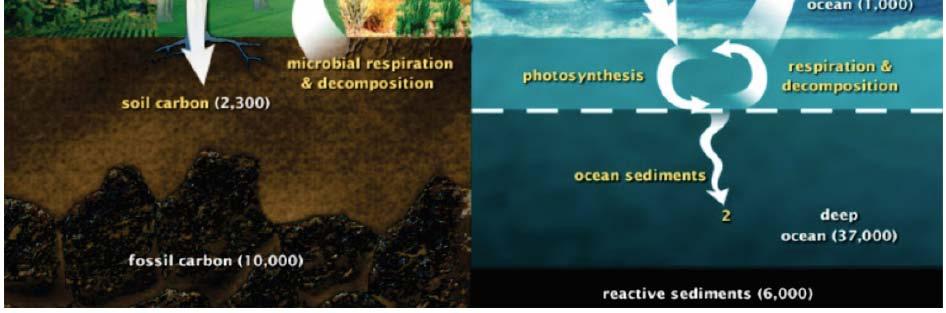
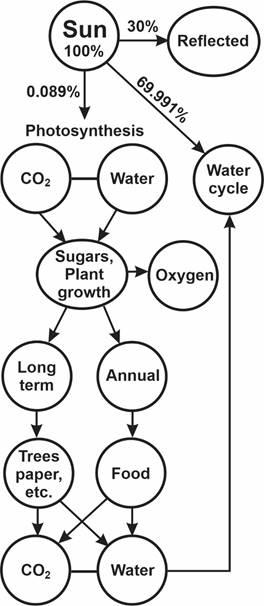
Figure 10 shows how the daily energy from the Sun of 321.48 EJ is distributed. An estimated 30% is reflected as the albedo of the Earth. Almost 70% goes to evaporate water, and 0.20% goes to photosynthesis. In plant leaves, sunlight converts CO2 and water into simple sugars and releases oxygen into the atmosphere. The plant converts the simple sugars into leaves, stems, flowers, and seeds. These are consumed as food for people, animals, fish, and microbes in an annual cycle in which the food is generated by photosynthesis from May to September in the Northern Hemisphere. Some of the sugars converted to the wood of trees are stored over several years until the trees are harvested by people, destroyed by insects, or consumed by forest fires, all of which return CO2 and water to the atmosphere.
10. SUMMARY AND CONCLUSIONS
The Sun is the primary source of energy that warms the Earth. Underwater volcanism is a secondary source. El Niño is an example of the latter.
The Sun sends short-wave radiation to the Earth. The amount of energy forwarded daily is about half of the world's annual energy consumption. This energy heats the surface, evaporates water, and creates a rising thermal column of warm, moist air. When the air reaches an altitude where the dew point causes the evaporated water to condense, the heat released eventually escapes to space as infrared radiation.
Storms such as thunderstorms and hurricanes are vital contributors to sending energy to space. There are approximately 40,000 thunderstorms daily around the Earth, most of which are in the Tropics. Hurricanes in North America start on the west coast of Africa as the warm air coming off the Sahara Desert evaporates water, and they move west to North America. This robust mechanism keeps the Earth’s temperature balanced and cool enough for the current life forms. The amount of the Sun’s energy that powers photosynthesis is 0.20% of the energy the Sun sends to Earth daily.
Water's phase change properties accomplish the cooling effect. CO2 and the other 61 greenhouse gases identified by the IPCC have no properties that would allow them to have a measurable impact on the Earth’s temperature. Peer-reviewed published papers provide the evidence [19].
Water keeps the Earth cool enough for current life forms, and photosynthesis provides them with food and oxygen. Both are essential and are required together for life to grow and flourish on Earth.
The current concep t promoted by the media and the IPCC, concerned that rising CO2 levels in the atmosphere are causing dangerous warming of the earth’s atmosphere, has no credible scientific basis.
[1] AccuWeather. Available at: https://corporate.accuweather.com/
[2] Lightfoot HD, Ratzer G. The Sun versus CO 2 as the cause of climate change projected to 2050. J Basic Appl Sci 2022; 18: 16-25.
https://doi.org/10.29169/1927-5129.2022.18.03
[3] NASA Explore, Feb 27, 2020. Available at: https://geologyscience.com/geology-branches/historicalgeology/milankovitch-cycles/#google_vignette
[4] Yim W, Video, Volcanic eruptions, a driver of climate variability – ignored by IPCC, Available at: https://www.youtube.com/watch?v=HPkZj6Mx6d0
[5] Cornell cooperative extension. Available at: https://yates.cce.cornell.edu/energy/about-solar-energy
[6] Energy institute. Regional Overview – access to energy and sustainability, Global primary energy consumption, Exajoules
(EJ) 2023. Available at: https://www.energyinst.org/statisticalreview
[7] Spencer RW, Climate Confusion, Encounter Books, First Edition 2008.
[8] Water cycle available at: https://www.sciencefacts.net/watercycle.html
[9] Bureau of Meteorology, The Science of Thunderstorms: How They Form and Why They Matter. Available at: https://bureauofmeteorology.org/blogs/weather-science/thescience-of-thunderstorms-how-they-form-and-why-theymatter
[10] MetMatters, Royal Meteorological Society, Life cycle of a thunderstorm. Available at: https://www.rmets.org/metmatters/life-cycle-thunderstorm
[11] Government of Canada, Public Safety Canada, Tornadoes. Available at: https://www.publicsafety.gc.ca/cnt/mrgncmngmnt/ntrl-hzrds/trnd-en.aspx
[12] National Oceanic and Atmospheric Administration (NOAA), U.S. Department of Commerce, Thunderstorms, Introduction to thunderstorms. Available at: https://www.noaa.gov/jetstream/thunderstorms
[13] World patterns of thunderstorm frequency. Available at: https://www.britannica.com/science/thunderstorm
[14] National Weather Service, NOAA, Hurricane Helene: RecordBreaking Rainfall and Historic Flooding. Available at: https://www.weather.gov/mrx/Hurricane_Helene
[15] Lightfoot HD, Ratzer G, Laws of Physics Define the Insignificant Warming of Earth by CO2 J Basic Appl Sci 2023; 19: 20-28. https://doi.org/10.29169/1927-5129.2023.19.02
[16] NCAR Climate Science Guide. Total Solar Irradiance (TSI) datasets: An overview. Available at: https://climatedataguide.ucar.edu/climate-data/total-solarirradiance-tsi-datasets-overview
[17] NASA Earth Observatory, The Carbon Cycle. Available at: https://earthobservatory.nasa.gov/features/CarbonCycle
[18] The Engineering Tool Box. Available at: https://www.engineeringtoolbox.com/specific-heat-capacity-d_391.html
[19] Lightfoot HD, Ratzer G. Only the Greenhouse Gas, Water Vapor, Measurably Warms the Earth. J Basic Appl Sci 2023; 19: 20-28. https://doi.org/10.29169/1927-5129.2023.19.02