SCIENTIFIC DISCUSSION
Carbon is the chemical element of life
Balanced nutrition has always been a requirement for life on Earth. Human beings, animals, agricultural crops, forests, and all living things are made of many chemical elements. The most abundant chemical elements in humans are shown in Fig. 2.
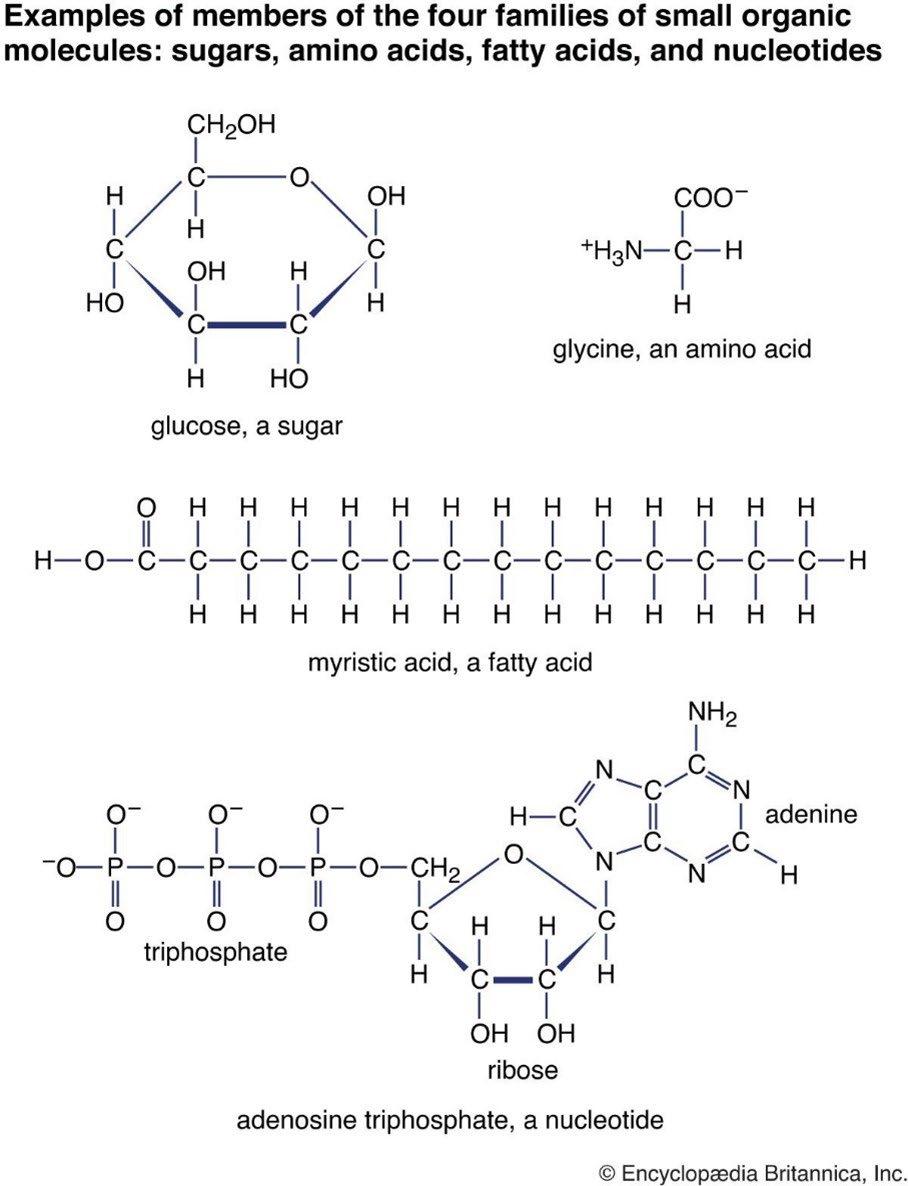
The largest fraction of body weight of a “standard human,” about 65%, comes from oxygen, O, with the majority contained in water, H2O, as 70 to 80% of the human body consists of water. As shown in Fig. 3, there is also a substan�al amount of oxygen in most of the other important organic molecules of life: for example, the 6-carbon sugar glucose [5] shown at the top left or the 5-carbon sugar ribose [6] a component of the ATP molecule shown at the bottom. Glucose can be polymerized into the energy storage polymers glycogen [7] in the human body or starch in plants [8]. Plants also polymerize glucose
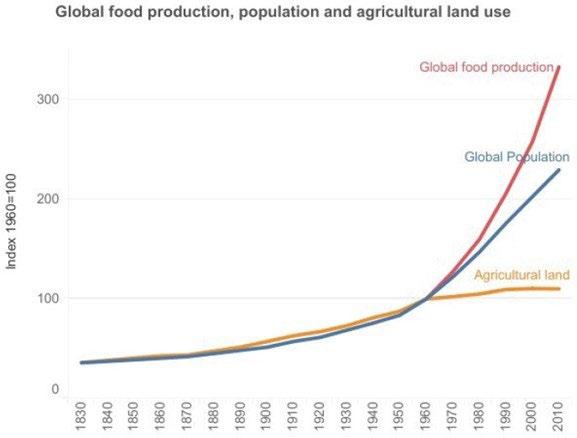
Figure 1: Important factors in the “green revolution,” the dramatic increase in food production shown here, have been increased atmospheric CO2, which along with water and sunlight is a key raw material for life, the development of greatly improved plant varieties [2], and intelligent use of mineral fertilizers. From OECD (2023) [3].
into the structural polymer cellulose [9] or hemicellulose. In fact, cellulose is the most abundant substance in the biosphere. Unlike calorie-rich carbohydrates like starch, most animals cannot directly metabolize cellulose. Humans derive no nutri�onal benefit from the fiber (cellulose) of vegetable foods,
5
although the fiber does help to maintain proper func�oning of the diges�ve system. Ruminants, like catle [10] or sheep, can use cellulose as a principal source of nutrition with the aid of specialized rumen microbiota. Ruminants transform the cellulose in the herbage from at least one quarter of Earth’s land surface to high-value human food, like milk and meat.
The much-demonized element carbon, C, is the second largest contributor to the weight of the human body with about 18.5% (Fig. 2). Ill- informed media constantly urge us to reduce our “carbon footprint” and to “decarbonize” our lives and ac�vi�es. Let’s be very clear: carbon is not a pollutant but is the basis for all life on Earth, including human life. Carbon atoms dominate the structure of all biological macromolecules that are essen�al for our very existence: proteins, lipids, carbohydrates and nucleic acids. A few building blocks for those are shown in Figure 3. For instance, the faty acid known as myris�c acid, is nearly a pure “hydrocarbon” with minimal amounts of oxygen in its structure.
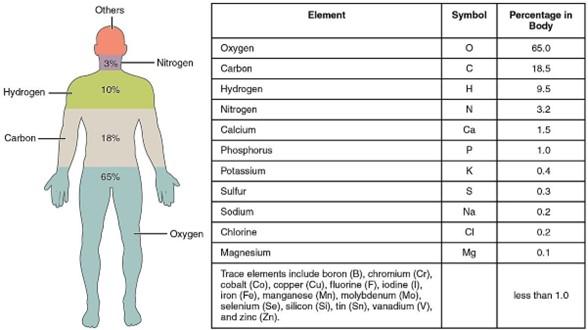
Third in abundance is hydrogen, H, at about 9.5% of body weight. Much of the hydrogen is in water, but there are also substan�al amounts bound in almost all the biological macromolecules of life.
Fourth in abundance in the human body is nitrogen, N, which makes up about 3.2% of body weight. Most of that weight is from the nitrogen atoms in amino acids. As shown in Fig. 3, amino acids [11], like the glycine molecule on the top right of Fig. 3, contain at least one N atom, and in some cases more than one. The amino acid arginine has four N atoms [11]. Nitrogen is also used in chi�n, a structural material made by shrimp, insects, fungi and other forms of life, and second only to cellulose as a biopolymer.
Many nitrogen atoms are also contained in the “bases”, the building blocks of deoxyribonucleic acids DNA, the “operating instructions” for living cells, and in closely related molecules of ribonucleic acid RNA. An example of a base is the double -ring molecule of adenine, one of the three cons�tuents of the
6
Figure 2: Chemical elements in the body of an “average” human. Adapted from reference [4]
adenosine triphosphate molecule (ATP) of Fig.3. ATP [12] is the ubiquitous carrier of free energy that drives the biochemical machinery of living things. The adenine base contains 5 nitrogen atoms. The other components of ATP are a short triphosphate chain, and the 5 -carbon sugar ribose. ATP molecules are like litle rechargeable batteries that circulate through the tissue of living creatures. In the process of transferring free energy for some biological need, ATP loses one of the phosphate groups and becomes an adenosine diphosphate molecule (ADP), the discharged form of the battery. ATP can be regenerated (the battery can be recharged) by using some source of energy to attach a phosphate group PO3- to an ADP molecule and transform it back to an ATP molecule. Using energy from sunlight, the chloroplasts of green plants convert large quantities of ADP to ATP as part of photosynthesis. But animals, too, which are unable to use the energy of sunlight directly, transform ADP to ATP during respira�on and other metabolic processes. Most of the energy for manufacturing ATP in animals (or in plants at night when no solar energy is available) comes from the oxida�on of sugar back to the CO2 and H2O molecules from which it was originally synthesized.
Most of the nitrogen in plants or animals is contained in proteins [13], which are long polymers of nitrogen-containing amino acids. The proteins of both plants and humans are assembled from about 20 amino acids that differ from the representa�ve glycine molecule of Fig. 3 by having one of the hydrogens that is atached to the central carbon atom C replaced by a more complicated “side chain.” Some proteins enzymes catalyze otherwise impossible biochemical reactions. The most abundant protein in the world (and one of the most ancient) is ribulose-1,5-bisphosphate carboxylase/oxygenase, or rubisco for short [14]. Rubisco enzymes in plants incorporate CO2 and H2O molecules into simple sugars that are the raw materials from which most other biological molecules are made. The carbon fixa�on cycle, also called the Calvin cycle [15], also requires other nitrogen-containing enzymes and chemical energy from ATP molecules. Parts of the cycle require the addi�on or removal of hydrogen atoms, which are transported by molecules similar to ATP, most notably by hydrogenated nicotinamide adenine dinucleotide phosphate (NADPH), which includes 7 nitrogen atoms. Govindjee and Krogmann (2004) [16] summarized the fascina�ng 300-year history of scien�fic discoveries in oxygenic photosynthesis and assimila�on of CO2 by plants.
Proteins also cons�tute the muscles of the human body and of animals. Human hair and fingernails are made of the structural protein kera�n, and so are animal horns and claws and the feathers of birds.
Scare stories about food from plants grown in higher than pre-industrial concentrations of atmospheric CO2 (eCO2) being less nutri�ous focus on protein (nitrogen) deficiencies. As we will discuss in more detail below, crops will in fact be much more abundant with eCO2 and they will provide all the nitrogen needed by humans and animals that consume them.
The phosphates of ATP are just one example of the important role of phosphorus in cell biochemistry. Phosphorus and calcium, in the form of the mineral apatite [17], are a major part of teeth and bones. Calcium at about 1.5% body weight, and phosphorous, at about 1% of body weight are essen�al for life.
7
As illustrated in Fig. 2, potassium (K) makes up only about 0.4% of body weight. But potassium ions (K+), along with sodium ions (Na+ ), are essen�al for the opera�on of the human nervous system, the regula�on of heart rhythm, and many other func�ons. And potassium, along with nitrogen and phosphorus, are often too scarce in agricultural soils for optimum plant growth. A typical bag of “allpurpose” fertilizer might have the label, 5-10-5. The numbers indicate that the weight of the ingredients comes 5% from N atoms, 10% from phosphorus pentoxide “molecules”, P2O5 (actually half of the tetrahedral anhydride of phosphoric acid, P4O10), and 5% from potassium oxide molecules, K2O.
A key concept of soil fertility is Liebig’s Law of the Minimum: “Plant growth is controlled not by the total nutrients available, but by the one in shortest supply, the limiting factor” [18]. “Liebig’s barrel,” shown in Fig. 4 is o�en used to illustrate the Law of the Minimum. For tens of millions of years one of the most important plant nutrients, atmospheric CO2 , has been falling further and further below optimum concentrations for plant growth. Now that CO2 concentrations are beginning to recover to more optimum levels for growth, other nutrients will have to increase to sustain the more vigorous growth of plants.
8
Figure 3: Representative small biological molecules from the human body that contain carbon and are the building blocks for large biomolecules. These same molecules occur in all forms of animal and plant life on Earth.
Which fer�lizers are needed to maintain a high nutri�onal value of crops depends on local condi�ons. With a few excep�ons, like very young volcanic soils, naturally humid regions have less fertile soils than drier regions because essential minerals are leached out of the soil by rain and are carried by runoff to streams and eventually to the oceans. Some minerals, like nitrogen, phosphorus and potassium, are needed in large, “macro,” amounts. Other equally essential minerals like iron, zinc, manganese, copper or iodine, are needed in only trace, “micro,” amounts. All nutrients, whether macro or micro, are subject to Liebig’s Law of the Minimum.
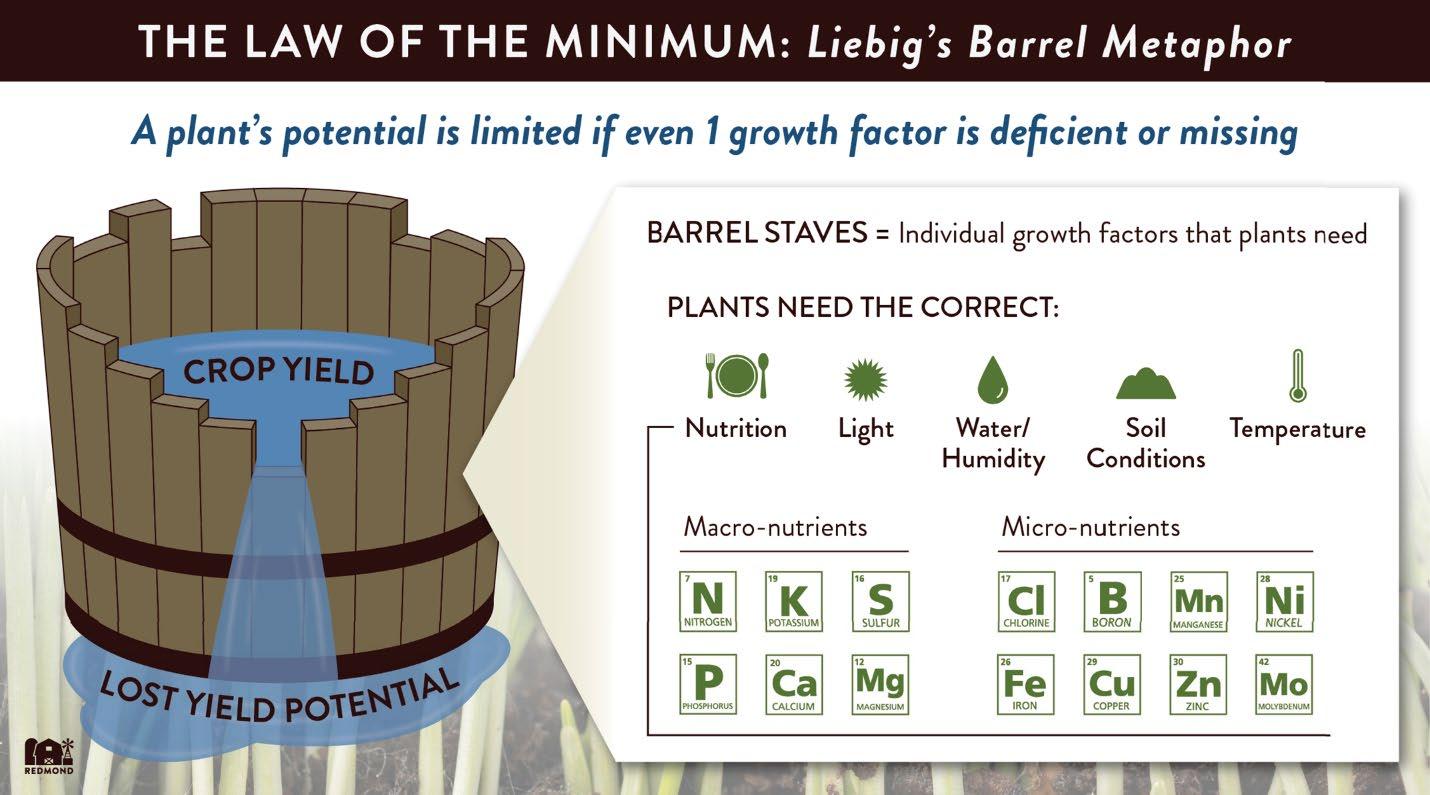
Figure 4: Liebig’s barrel [18]. The yield of a crop is constrained by the scarcest nutrient or growth factor. Note that one of the three most important growth factors or nutrients, CO2, is not illustrated along with the other two, sunlight and water. At the time of Liebig’s pioneering work, in the mid 1800’s, the CO2 supply was seen as constant, and not something that could be influenced by humans.
Plant Growth in E nhanced CO2 (eCO2)
It is common knowledge that CO2 is the sole source of carbon atoms in photosynthesis, where it is combined with water molecules (H2O) to make simple sugars. These are then used to generate thousands of organic molecules, some of them exceedingly complex. In fact, CO2 is the only source of the chemical element carbon for all life on Earth be it for plants, animals or fungi and bacteria through photosynthesis and food chains. Even chemotrophic microorganisms living, for example, in hydrothermal vent communi�es in the dark depths of the oceans [19] where no sunlight penetrates use CO2 as their carbon source. On a dry weight basis, all biomass consists of almost 50% carbon. Therefore, CO2 is clearly the most important nutrient of life. As explained later, CO2 is, however, deficient in nature.
9
The increase of CO2 since the beginning of the industrial era has greatly benefited plants of all types, including agricultural crops and entire ecosystems. This includes (i) > 30% increase in terrestrial Gross Primary Produc�on as reported by Campbell et al. (2017) [20] and Haverd et al. (2020) [21]), (ii) higher leaf area index, that is, greening of parts of the vegetated terrestrial surface as published by Zhu et al. (2016) [22] and NASA (2016) [23], (iii) desert greening as shown in Fig. 5, (Donohue 2015) [24], (iv) a decrease in Global Bare Ground Cover by 3% since 1982 as reported by Song et al. (2018) [25], (v) and many more beneficial impacts as summarized by Goklany (2015) [26] and Idso and Moore (2019) [27].
Recently, Chen et al. (2024) [28] confirmed the ongoing greening of the Earth and found the increase of CO2 to be the dominant driver of the positive so-called Leaf-Area-Index-trend on most of the global land surface.
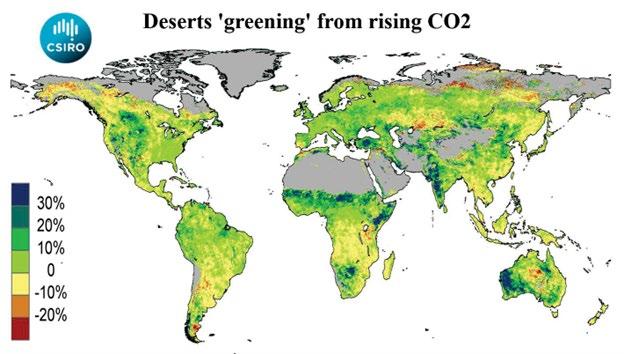
Figure 5: The greening of planet Earth because of increased concentrations of atmospheric CO2. Donohue/CSIRO (2015) [24]. This was determined from satellite data recorded between 1982 and 2012. Note greening by 20-30% in India, West Australia, the Sahel zone in Africa and the Anatolian highlands (Turkey).
Enhanced plant growth due to eCO2 is generally accompanied by a reduced concentration of nutrient minerals in the plant tissue. Loladze (2014) [29] performed a meta-analysis of 7,761 observations, including 2,264 observations at state-of-the-art FACE (free-air CO2 enrichment) centers, covering 130 species/cultivars and 25 minerals. He observed an average decline of mineral concentration by about –8% under eCO2, typically at 550 ppm (95% confidence interval 9.1% to 6.9%). The meta-analysis statistics reveal that this shift is systemic and global. Increases in mineral concentration under eCO2 were rarely observed and had (very) low statistical significance, see Loladze (2014), Fig.1 [29]. Therefore, these values can be safely considered as outliers.
The observed decline in mineral concentration under eCO2 has logically been interpreted as a dilution effect due to enhanced photosynthetic activity producing more non-structural carbohydrates, like sugar and starch, as well as structural carbohydrates like cellulose and hemicellulose. On the other hand, the content (total acquisi�on per plant or per unit area) of the various minerals con�nues to increase as
10
plants grow more vigorously under eCO2 This is an iden�cal patern (higher content but less concentra�on of the various nutrients) to what is routinely observed (under ambient CO2) in growing plants as their physiological stage advances and the plant gets older. An example of the decline of nitrogen concentration in winter wheat is shown in Fig. 6. Note that the differences in nitrogen (N) concentra�on are greater between growth stages than between different N-supply levels.
Ferguson (2024) [30] es�mated the influence of associa�ve factors on the yield per hectare for eight major cereal crops ( Barley, Maize, Millet, Oats, Rice, Rye, Sorghum, Wheat) using a SAS regression model (Sta�s�cal package for Agricultural Sciences). He used worldwide sta�s�cal data provided by the FAO (Food and Agriculture Organiza�on of the United Na�ons) from 1961 to 2019 [31]. The associa�ve factors analyzed were Nitrogen Fer�lizer Intensity, moisture class of the countries’ climate, temperature anomaly across the years, mean CO2 concentra�on (Mauna Loa – data, NOAA) and year (which served as a proxy for uniden�fied agronomic prac�ces that influence yield, such as hybrid selec�on, technical advances in agronomic prac�ces, biocide applica�on, and other fer�lizer applica�on such as phosphorus and potassium). He found a total increase of average yield (over all observed cereals and 156 countries) in the 59 years of observa�on of 1853 kg ha-1 to which the rise of CO2 by 94 ppm contributed 26.5% (or 499 kg ha-1), or a linear yield efficiency of 5.31 +/ - 1.24 kg ha-1 per 1 ppm of CO2 increase, respec�vely.
In this context, it is important to men�on that cereal varie�es with higher yield poten�al react with considerably higher yield increases to eCO2 than low-yielding varie�es (Ainsworth and Long (2021) [32]). We can expect more efficient cereal varie�es to emerge over �me as plants are exposed to the hidden selec�on pressure of gradually increasing concentra�ons of CO2
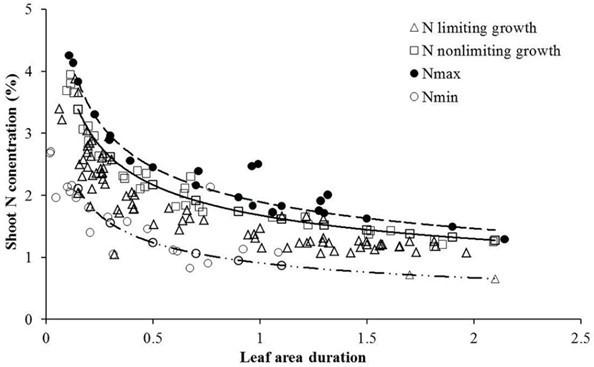
Figure 6: Nitrogen concentration dilution curves for winter wheat as the growth stage advances, described as leaf area duration, for different nitrogen supply levels (open circles: no nitrogen fertilization). Leaf area duration is the integral of leaf area over the growth period and comprehensively incorporates the size of photosynthetic area and the duration of photosynthetic activity and is therefore an indirect measure for cumulative dry matter formation. The natural N-dilution in the plant tissue as the plants mature and develop more structural fiber is too great to be compensated with N fertilization even at the highest N-level (375 kg N ha 1), Wang et al. (2017), Fig. 2 [33].
11
As far as the current nutrient concentra�ons of protein and minerals for major cereal crops are concerned, they are extremely variable in nutrient composi�on in the grains. Local condi�ons, soils, water availability, cul�var, and agronomic prac�ces all contribute to this varia�on. According to Ferguson (2024) [30], the changes reported to occur under eCO2 fall well within the current ranges reported by NASEM (2021) [34] and Feedipedia [35]. Therefore, the nutrient content of crops grown under eCO2 is not likely to exacerbate the nutrient imbalances across the globe, which are associated with an insufficient diversity of food groups and a lack of nutrient supplements.
The decline in mineral concentration and the increase in mineral content under eCO2 do vary in their extent, depending on the type of mineral, the plant species etc. It is common knowledge that many factors influence the mineral content of plants. These include nutrient availability in the soil, chemical fixation and mobilization processes, root exudates, mycorrhiza, soil water poten�al, transpira�on rate, resistance to the nutrient flow in the soil and the root cortex, ac�ve and passive absorp�on and transporta�on mechanisms of minerals (in the xylem and phloem), general stress condi�ons of the plant, incorpora�on of nutrients into the metabolism or deposi�on of minerals, e.g., in the cell vacuole, Rengel (2023) [36]. The complexity of plant nutrient acquisi�on and transporta�on might explain the diverse observed responses to eCO2 which ranged from zero to strong negative effects on mineral concentra�on, as reported by Broberg et al. (2017) [37].
Besides the obvious dilu�on effect men�oned above, another contributor to reduced plant mineral content is the reduced transpira�on of water caused by the reduc�on of stomatal conductance, of plants growing in eCO2, as published by Soussana and Hartwig (1995) [38], Ainsworth and Long 2004)[39], Taub and Wang (2008) [40], McGrath and Lobell (2012) [41], and Kimball (2016) [42]. Fig. 7 shows the strong inverse correla�on between stomatal conductance and water use efficiency (WUE). Transpira�on of water might be reduced by up to 30% by eCO2. The combina�on of a higher photosynthe�c ac�vity and lower transpira�on due to eCO2 , along with a CO2- induced reduc�on of photorespira�on (see Lim et al. (2020) [43]), inevitably improves “water use efficiency,” (WUE), or “instantaneous transpira�on efficiency,” or “crop water produc�vity” in plants, as reported by Eamus (1991) [44], Allen et al. (2011) [45], Keenan et al. (2013) [46], and Deryng et al. (2016) [47]. In addi�on to inducing a higher WUE, eCO2 also s�mulates root growth for improved access to sub-soil water (see Uddin et al. (2018) [48]), both of which can drama�cally increase wheat yields in semi-arid environments and buffer against heat waves, as suggested by Fitzgerald (2016) [49]. Ainsworth and Long (2004) [39] have also reported an increase in photosynthe�c light use efficiency by eCO2
It is obvious that lower transpira�on will also reduce mass flow in the soil towards the roots as well as nutrient accumula�on in shoots through diminished transloca�on via the xylem sap, see Gifford et al. (2000) [50]. As this applies also for nitrate, the most common nitrogen source in the soil, it is not surprising that energy-demanding nitrate reductase ac�vity is down- regulated in the leaves as the substrate (NO 3 ) concentra�on is reduced, see Gojon et al. (2022) [51].
In addition to a reduction in the mineral concentration in plants, there are also reports of an impairment of the carotenoid metabolism by eCO2, see Loladze et al. (2019) [52]. A more than doubling of the CO2 supply to tomatoes led to a reduc�on in the carotenoid concentra�on in the plant �ssue of up to one third, as reported by Boufeldja et al. (2022) [53]. Carotenoids are a precursor of vitamin A. In parts
12
of southeast Asia and Africa, where carotenoid- free white rice is a major part of the diet, vitamin A deficiencies are already common. Further reductions of vitamin A would exacerbate an already serious problem. However, the use of golden rice, which is rich in carotenes and an excellent source of vitamin A, would quickly correct this nutrient deficiency [54]. Unfortunately, demonization of golden rice, much like the demonization of CO2 by extreme environmentalists, has hindered its adoption in countries where it is most needed.
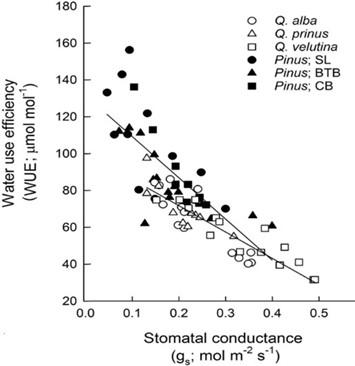
Figure 7: Inverse correlation between water use efficiency (WUE, µmol CO2 captured per mol H2O lost), and stomatal conductance (gs; mol H2O m 2 s 1) for oaks (Quercus, y = −143 x +100.3; r2 = 0.79) and pines (Pinus, y = 224 x +131.6 ; r2 = 0.54), Renninger et al. (2013), Fig. 3, adapted [55]. In this experiment, the reduction of stomatal conductance was drought induced. However, we also observe a reduced stomatal conductance under eCO2, when a higher photosynthetic rate even more enhances water use efficiency.
In plant metabolism carotenoids play a role in the photosynthesis apparatus in that they protect chlorophyll from photo-oxida�on. As the photosynthe�c ac�vity is significantly increased under eCO2, downregulating the biosynthesis of carotenoids could be a resource-saving measure for plants, as fewer carotenoids might be needed to maintain the same level of photosynthesis. While eCO2 can somewhat suppress the content of major nutrients and carotenoids, it may have a favorable impact on the accumula�on of carbon-based phytochemicals in food crops. “Elevated CO2 and nitrogen-limiting conditions have been known to favor the accumulation of carbon-based secondary metabolites which have a key role in healthfulness of food crops and in plant defense against herbivory in many species. While the effect of elevated CO2 on the health-promoting phytochemical accumulation in food crops is variable, a great number of studies support the fact that elevated CO2 may favor the accumulation of carbon-based phytochemicals. Thus, although elevated CO2 can diminish the contents of major nutrients, it may enhance certain groups of health-promoting phytochemicals in food crops,” Rajashekar (2018) [56]. Boufeldja et al. (2022) [53] also conclude that eCO2 can produce a decrease of nutri�onal
13
poten�al but at the same �me an increase of properties beneficial to health through the enhanced biosynthesis of antioxidant and an�- inflammatory compounds.
In legumes the reduced N assimilation due to the reduced NO3 -uptake and the down-regulated nitrate reductase ac�vity is compensated for by an increased N fixa�on ac�vity in the nodules as reported by Guo et al. (2013) [57] and Jin et al. (2019) [58]. Nitrogen fixa�on depends on the energy supply from the respiration of non-structural carbohydrates, like sugars and starch, which are photosynthesized in abundance under eCO2, as published by Taub and Wang (2008) [40] and Loladze (2014) [29]. It is for this reason that legumes generally do not suffer from a reduced N-acquisi�on or even from reduced Nconcentra�on in the plant �ssue despite increased biomass produc�on under eCO2 , as reported by Ainsworth and Long (2004) [39] and Guo et al. (2013) [57]. For soybeans, Li et al. (2017) [59] found that increased yield in response to eCO2 correlated highly (r2 = 0.95) with an increase in symbio�cally fixed nitrogen between the ini�al seed filling stage and full maturity, as shown in Figure 8. In contrast, eCO2 only led to small increases in the uptake of fertilizer-derived and soil-derived N, and these increases did not correlate with enhanced yield.
Feng et al. (2015) [60] explored the ecosystem-scale relationship between responses of plant produc�vity and nitrogen acquisi�on to eCO2 in free-air CO2 enrichment (FACE) experiments in grassland, cropland and forest ecosystems. They found that in all three types of ecosystems, this rela�onship was posi�ve, linear and strong (r2 = 0.68) but exhibited a nega�ve intercept such that plant acquisition of N was decreased by 10% when eCO2 caused neutral or modest changes in produc�vity. Whenever plants hardly react or do not react at all with increased productivity to the supply of a deficient nutrient, this reliably indicates according to Justus Liebig’s minimum law that another nutrient or another growth factor such as light, water (drought or waterlogging) or temperature (too high or too low) is limiting plant growth. It is not surprising that a plant (community) under stress can only provide inadequate metabolic performance and may react unpredictably to environmental changes (including eCO2). This is in line with Feng et al. (2015) [60] who found a higher response to nitrogen fertilization in stress-free plants under eCO2.
Elevated CO2 does increase the C/N ratio in non-leguminous plants and plant residues, without external addition of nitrogen fertilizer, owing to enhanced photosynthesis of carbohydrates, as suggested by Runion et al. (1999) [61], Gill et al. (2002) [62], Taub and Wang (2008) [40], and Loladze (2014) [29]. This could promote temporary N-immobilization which might also reduce the availability of soil nitrogen. In addi�on, an increased N demand for the decomposi�on of plant residues with a large C/N ra�o will result, under elevated CO2 , in a larger nitrogen sink of the whole ecosystem, as suggested by Soussana and Hartwig (1995) [38]. However, as both the percentage and the amount of fixed N increases for legumes grown under elevated CO2, and the contribution of fixed N to the nitrogen nutrition of co-occurring nonlegumes also improves (Soussana and Hartwig (1995) [38], Lee et al. (2003) [63]) in the long run, over en�re ecosystems and at a global scale, the nitrogen supply to plant communi�es and soils seems to catch up under eCO2. While there are reports of a higher soil organic matter mineralization rate (Hasegawa et al. (2016) [64]) and of litle or no change in soil carbon pools under eCO2 (Ross et al. (2004) [65], and van Groenigen et al. (2017) [66]) in many ecosystems an increase of not readily degradable soil organic carbon (SOC) due to higher above-ground and below-ground biomass under increasing CO2 is expected and has been shown (e.g., by Scurlock and Hall (1998) [67], Smith (2006) [68], Eclesia et al. (2012) [69], Kell (2012) [70], Grüneberg et al. (2014) [71], Chambers et al. (2016) [72], Jonard et al. (2017) [73], Xu et al. (2018) [74], Viglizzo et al. (2019) [75], and Koyama et al. (2019) [76]).
14
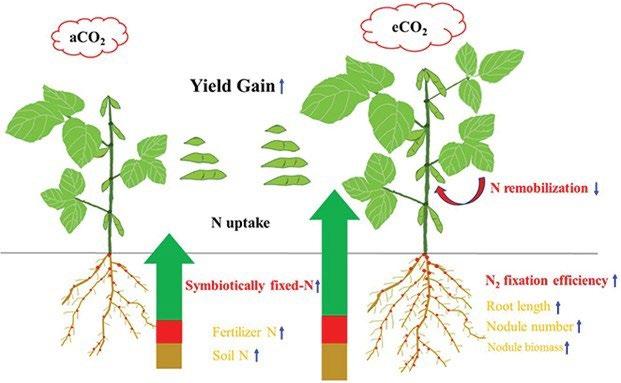
Figure 8: Diagram illustrating the N origins, root morphology, N remobilization, and yield gain of soybean in response to elevated CO2 (eCO2 at 550 ppm) as compared to ambient CO2 (aCO2 at 390 ppm). The measurements that were significantly correlated with yield gain (P< 0.05) are indicated in red-bold, while the measurements responding to eCO2 but not correlated with yield gain are shown in orange. Upward and downward arrows indicate increase and decrease under the eCO2 condition, respectively (Li et al. (2017), Fig. 7 [59])
Given this premise, it is plausible and has been partly demonstrated that nitrogen also is steadily increasing in the world’s ecosystems. Enhanced photosynthesis, due to eCO2, of non-structural carbohydrates like sugars and starch, which are readily broken down by respira�on by all kinds of primary and secondary consumers, and of reasonably easily degradable structural carbohydrates, such as pec�n and cellulose, leads to greater energy-requiring nitrogen fixa�on in legumes and soils on an ecosystem level (Guo et al. (2013) [52], Ainsworth and Long (2004) [39], Feng et al. (2014) [60], and Koyama et al. (2019) [76]).
Furthermore, the easy degradability of most carbohydrates gives us reasons to assume that the general turnover rate of carbohydrates is higher than that of nitrogen compounds at a global level. According to Zheng et al. (2020) [77], global mean Gross Primary Produc�on between 1982 and 2017 was about 106 Pg C yr 1 with an annual increase of about 0.15 Pg C yr 1 due to rising CO2. Given a total of atmospheric carbon of about 750 Pg (in the form of CO2), this means an enormous annual turnover of about oneseventh of total atmospheric CO2 through photosynthesis and respira�on.
Ammonia liberated from biomass degrada�on (mineraliza�on) is much less vola�le. At a global scale, losses by NH3 vola�liza�on do not occur, as it will be washed back eventually into the soil or the oceans by rainfall. The only major pathway for nitrogen compounds to be recycled to elementary N2 is denitrifica�on. Large scale denitrifica�on in soil requires a loca�on with alterna�ng aerobic and anaerobic condi�ons. Nitrifica�on takes place and nitrate is produced by oxidizing ammonia in aerobic soils. In anaerobic soils, nitrate serves as an electron acceptor to be finally reduced to N2. This later process requires easily degradable carbohydrates as an energy source.
15
In summary, it is unlikely that the Earth’s biosphere will be depleted of nitrogen in an eCO2 atmosphere. To the contrary, there are reasons to believe that over �me extra CO2 has caused an increase of nitrogen in the biosphere. Li et al. (2012) [78] found a significant correla�on between soil carbon and nitrogen stocks following afforesta�on in a global meta-analysis. This correla�on is corroborated by satellite images like that of Fig. 5 which show a greening of the Earth due to increasing CO2. The greening is caused by more chlorophyll, a molecule where a Mg++ ion is held by 4 nitrogen atoms in a porphyrin prosthe�c group surrounded by a large photosynthe�c apparatus, consis�ng of nitrogencontaining protein enzymes. So, there is good reason to assume that our CO2 emissions since the beginning of industrializa�on have not only increased CO2 in the atmosphere and therefore photosynthe�c ac�vity of the vegeta�on cover but also increased the nitrogen content of the biosphere. The no�ceable increases in atmospheric nitrogen deposi�on generated by the worldwide expansion of industry and agriculture likewise contribute to this development, as suggested by Zhu et al. (2017) [79].
The more-or-less na�ve ecosystems of the Earth do not seem to suffer from a greater deficiency of nitrogen than in pre-industrial �mes. To the contrary, today the Earth’s vegeta�on cover has a higher leaf area index, in accord with Fig. 5, and has become greener under increasing CO2 (Zhu et al. (2016) [22], Chen et al.(2024) [28]). This indicates a greater nitrogen content of the vegeta�on. Any experienced cereal producer can judge the adequacy of nitrogen by the dark or light green color of the cereal crop. Also, in rela�on to the extended rangelands and grasslands on large propor�ons of the Earth’s land surface no addi�onal nitrogen deficit problem is likely to occur in the long run due to gradually rising CO2, par�cularly when there are co-occurring legumes, as suggested by Soussana and Hartwig (1995) [38], Lee et al. (2003) [63], Guo et al. (2013) [57], and Koyama et al. (2019) [76]. In any case, grazing animals try to compensate for any nutri�onal deficiencies by making use of their “nutri�onal wisdom”, for example, by selec�ve browsing of higher quality leaves or legumes (Glatzle (1990) [80]). Furthermore, there are economical means for catle herders and managers of lowintensity grazing systems to help compensate for possible protein deficiencies. Ruminants can synthesize protein themselves through their rumen bacteria when they have a sufficient energy supply and access to a suitable nitrogen source such as urea-molasses lick blocks or even ammonium-rich chicken manure.
In efficient modern agriculture, huge quan��es of nutrients, and especially nitrogen, are extracted with each harvest. So, nitrogen remains the most deficient nutrient, the shortest stave in Liebig’s barrel, with the highest yield response. Whenever cropping has been intensified in the past and yields rose, the nutrients removed with the harvest had to be replaced. Since Malthus’ �mes, average cereal yields in Central Europe rose about tenfold. To maintain these high yields and sa�sfactory nutri�onal values, mineral fer�lizers were used intensively, in accordance with Liebig’s fundamental findings. Modest extensions of these rou�nely prac�ced and constantly perfected uses of fer�lizer will ensure that there will be s�ll more abundant and nutri�ous yields from crops grown in eCO2.
Indeed, commonly observed reduc�ons in mineral concentra�on under eCO2 are �ny compared to what nature, agriculture, livestock and humans cope with daily. In their long- term FACE study, Jin el al. (2019) [53] reported far more significant effects on nutrient concentra�ons in grain from soil condi�ons than from eCO2. Under water shortage, irriga�on leads to considerable yield increases. It is obvious that this has an enormous impact on mineral acquisi�on and concentra�on in the plants, as well as
15
nutrient extrac�on and deple�on in the soil. Similar effects on rangeland produc�vity and grass quality have been found by Breman and de Wit (1983) [81] along the rainfall gradient, from the Sahara via the Sahel to the West African Savanna, as shown in Fig. 9. More rain produces much more herbage, but the nitrogen (protein) concentra�on of the herbage decreases enormously due to nitrogen dilu�on in the plant �ssue and nutrient leaching from soils in a weter (more humid) clima�c zone.

Figure 9: Mean rangeland production (tons of above ground dry matter ha 1) and the protein content in the biomass (percentage at the end of September) in relation to mean annual rainfall along the gradient from the Sahara, via the Sahel to the West African Savanna. Note the enormous increase in biomass production along with a decline of protein content as the most deficient growth factor, rainwater, gets less and less limiting, and the soils get poorer in the average. This is a natural phenomenon, with little, if any, human influence, Breman and de Wit (1983), Fig. 3 [81].
For more than 100 years, modern agricultural and nutri�on technologies, most importantly mineral fer�lizer, improved crop varie�es, as well as nutrient supplements have been used to compensate for mineral and other deficiencies in soils, food and animal feed. Those same technologies can ensure that large yield increases from eCO2 will provide nutri�ous food for livestock and people. For many decades, it has been common prac�ce to increase the yield of vegetables by growing them in greenhouses that are highly enriched with CO2. This provides high quality food at affordable prices for millions of consumers. Yes, flawless, mass-produced tomatoes or cucumbers from greenhouses rarely have the unique flavor of the heirloom varieties that our grandparents grew in backyard gardens. Nonetheless, we are unaware of complaints about nutritional deficiencies in these greenhouse-grown vegetables, nor is there a reason to expect any.
CO2 and Climate History
Although the focus of this paper is on the nutri�onal value of crops grown in enhanced CO2 concentra�ons (eCO2 ), we include two more sec�ons because some readers may not be familiar with
16
the geological history of plants and atmospheric CO2 or of how litle even large changes of CO2 concentra�ons affect the thermal radia�on emited by Earth to space.
Geological history is relevant to how the nutri�onal value of plants will be affected by more CO2. Abundant plant fossils first appear when there were much greater concentra�ons of CO2 than those of today, or than those of the next few centuries if human society con�nues the ra�onal use of fossil fuels. It is generally accepted that the CO2 content of the atmosphere was very high in the early era of Earth’s geological history (Archean). Oxygen (O2) was nearly absent. About 3 billion years ago, cyanobacteria (Demoulin et al. (2019) [82]) developed the first form of oxygenic photosynthesis, where the energy of sunlight is used to synthesize organic mater from CO2 and H2O, resul�ng in the release of waste O2 to the atmosphere. Due to burial in sediments, the fixed carbon in dead organisms could not be oxidized by the O2 in the air. So, the O2 content of the atmosphere steadily rose over hundreds of millions of years as atmospheric CO2 levels fell and fossil organic carbon increased in sediments.
When land plants with a rela�vely modern photosynthe�c apparatus first appeared about 470 million years ago, the CO2 content in the atmosphere was s�ll around 5,000 ppm (more than ten �mes the current level). In the millions of years that followed, the atmospheric CO2 content con�nued to decrease, with significant fluctua�ons. The fluctua�ons had litle correla�on with the considerable temperature changes during numerous, extended geological eras. Modern seed plants (angiosperms) appeared at the beginning of the Cretaceous period about 140 million years ago. At that �me, the CO2 content was s�ll at least 5 �mes higher than today. From this point onwards, the CO2 content declined con�nuously un�l it leveled off to its current order of magnitude around 2 million years ago (the beginning of the Pleistocene). The first primates appeared in the fossil record some 50 million years ago, with s�ll rela�vely high CO2- levels in the atmosphere. This history is summarized in Fig. 10.

Figure 10: History of temperature and atmospheric CO2 concentrations during the Phanerozoic eon, when abundant fossils first appear in the geological record. There is insufficient correlation between temperature (blue) and CO2 concentrations (purple) to imply a cause-effect relationship. The systematic decline of average CO2 concentrations during this time, indicated by the green line, has limited the productivity of plants, Moore (2016) [83].
For the last 720,000 years, the CO2 content (averaged by nature over several decades) can be determined rela�vely accurately from air inclusions in ice cores obtained from Antarc�ca and
17
Greenland. An example is shown in Fig. 11. This was the period in which con�nental glacia�ons, las�ng almost 100,000 years, alternated with warmer interglacial periods las�ng about 10,000 years. Mean temperature differences between con�nental glacia�ons and interglacial periods were considerable –up to 12 °C. During the last glacial advance, the regions where Hamburg or New York are located today were at least one mile under ice. “Findlinge” or glacial erra�cs can be found in northern Germany today. These are rocks from the Scandinavian mountains that were transported by glaciers and deposited close to Hamburg. The sea level fluctuated by at least 400 feet (120 m) between glacial and interglacial periods, just to give an idea of the magnitude of the effects of these natural climate changes.
The most recent glacial maximum ended only 18,000 years ago, and the rela�vely stable climate of the Earth over the past 10,000-year interglacial period is an excep�on to the much more unstable climate that characterizes most of Earth’s geological history. The enormous temperature fluctua�ons of the past 2.6 million years or so are believed to have been triggered by Milankovitch cycles [84]. These result from the precession of the Earth’s spin axis (axis of rota�on), the inclina�on (obliquity) of the Earth’s spin axis to the axis of orbital precession around the Sun, the eccentricity (non-circularity) of the Earth’s orbit and the intensity of solar radia�on (solar forcing). The orbital parameters change with �me due to gravita�onal interac�ons with the Moon, Jupiter and other planets. This results in complicated cyclic varia�ons of the solar energy Earth receives at various la�tudes and seasons. The cycle periods range from as short as 26,000 years for the precession of Earth’s spin axis to a hundred thousand years or more for changes in the ellip�city.
The mean CO2 concentra�on of the atmosphere was about 280 ppm during the warm interglacial periods and about 180 ppm during the glacial maxima, not far above the threshold of 150 ppm where plants begin to starve from inadequate CO2 (Temme (2019) [86]). During the younger Pleistocene when periods of con�nental glacia�on alternated with warm interglacials, a strong correla�on between CO 2 and temperature can be seen in Fig. 11.
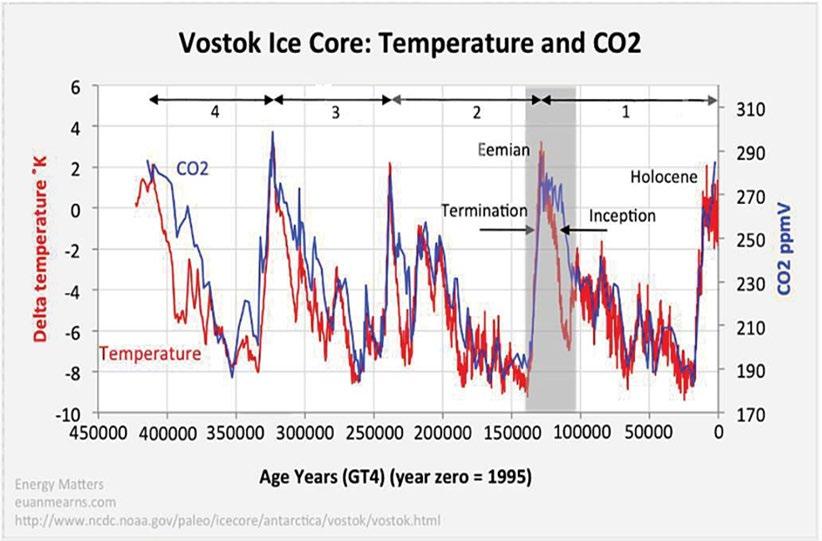
Figure 11: Temperature (red) and atmospheric CO2 concentration (blue) during the late Pleistocene, as determined by analyses of East Antarctic ice cores [85]. Temperature changes are inferred from variations of the fractions of the oxygen isotope 18O in the ice. Atmospheric CO2 changes are inferred from variations in the composition of air bubbles. Glacial maxima alternate with warmer interglacial periods. The fluctuations seem to be driven by changes of the tilt and orientation of Earth’s spin axis and by changes of its orbital eccentricity, as first suggested by Milutin Milankovitch in the early 20th century [84]
18
However, the temperature increases or decreases always preceded the CO2 increases and decreases by several centuries. An example is shown in Fig. 12. The colder oceans absorbed more CO2 and the warmer ocean outgassed more CO2. This alterna�ng reten�on and release of CO2 by the oceans determined the CO2 content of the atmosphere. The change of CO2 concentra�on was therefore always the result and not the cause of the temperature change (Caillon et al. (2003) [87], Koutsoyiannis et al. [88]).
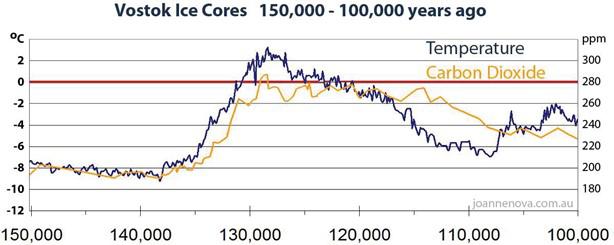
Figure 12: Proxy temperature and CO2 from Vostok Ice Cores 150,000 – 100,000 years ago, redrawn from J. R. Petit. et al. (1999) [89] by J. Nova [90]. Changes in CO2 concentration follow changes in temperature, not vice versa, so the orbital changes first affect temperature. Increasing or decreasing temperatures then cause CO2 concentrations to increase and decrease, probably as a result of warming or cooling of the oceans.
The present warm, interglacial period (Holocene) began around 10,000 years ago. Es�mated changes of temperature during the Holocene are shown in Fig. 13. During this period, CO2 concentrations were low (between about 260 ppm and 270 ppm) by the standards of geological history shown in Fig. 10 un�l the mid-19th century (Alley (2000) [91], Alley (2004) [92]). Then CO2 concentrations began to increase by much more than the small (a few ppm) increases and decreases recorded from bubbles in ice cores for the previous 10,000 years. It is natural to ascribe most of the recent increase of atmospheric CO2 to the greatly increased burning of fossil fuels that began with steam engines and the Industrial Revolu�on a�er 1800. As we write this in the year 2024, CO2 concentra�ons measured at the Scripps Mauna Loa Observatory are about 420 ppm. There is good evidence that there has been a modest warming of the Earth since the year 1800, and climate alarmists have been quick to ascribe all this warming to the increase of CO2 from human ac�vi�es.
But there is a serious problem with this narra�ve. As shown in Fig. 13, during the past 10,000 years there have been many similar warmings, as large or larger than the current one, when there was very litle change in the atmospheric concentra�ons of CO2. During the Medieval Warm Period, Norse setlers established successful farms in the southern part of Greenland, where they grew grain and raised catle. During the Roman Warm Period, Hannibal traversed the almost ice-free Alps with his elephants.
During the Minoan Warm Period, the great an�que civiliza�ons of Crete and Egypt reached peaks of prosperity. In fact, ancient tree trunks preserved and recovered well above modern days’ tree lines in the Alps (Fischer and Patzelt (2018) [93]), in Alaska [94] and other glacial areas around the world are
19
clear evidence of many periods during the Holocene that were warmer than today but had lower concentra�on of CO2. Most notable was the Holocene Climate Op�mum during the Early and Middle Neolithic (Kalis (2003) [95]).
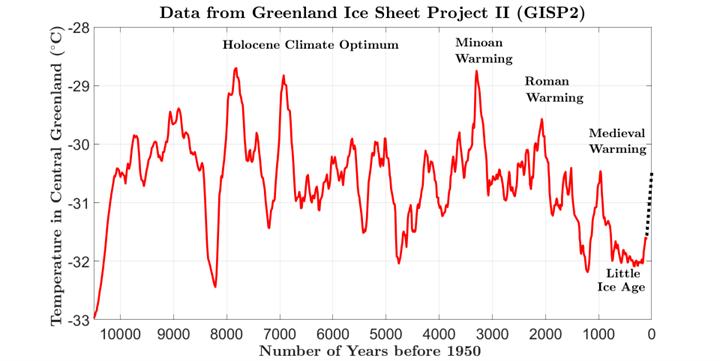
Figure 13: Estimates of the temperatures in central Greenland during the current interglacial period up to the year 1855. Even during this relatively stable climatic period, there are relatively large century-to-century variations of temperature. The large temperature variations could not have been caused by CO2, since ice core bubbles show that CO2 concentrations varied by no more than a few percent until about the early 1800s when a rapid increase of atmospheric CO2 concentrations coincided with the use of fossil fuels. The estimated 1.1 °C temperature increase since 1855, shown as the black dotted line, does not differ from past temperature changes in either magnitude or duration. (Alley (2000) [91], Alley (2004) [92]). Based on Alley (2000) [91], the "present" time in the data refers to 1950. Because the data only go as far as about 95 years before the "present", then, taking the difference, the data go only as far as 1855.
The Medieval Warm Period was followed by substan�al cooling which led to the Litle Ice Age and to the final abandonment of Norse setlements in Greenland in the mid -1400s. The Litle Ice Age, from about 1250 to 1850, was not a good �me for humanity in northern Europe, where crop failures and plagues decreased the popula�on by nearly 50%. During that period, somewhere between 200,000 and 500,000 people, 85% women, were cruelly executed as “witches” in Continental Europe (Ben-Yehuda (1980) [96]). They were blamed for bad weather and poor harvests. The end of the Litle Ice Age (when Christmas markets in London used to be held on the frozen Thames) coincided more or less with the beginning of the industrial era.
20
Many people point to the con�nuous rise of CO2 since the start of the Industrial Revolu�on as the cause of the modest warming during that �me. But “correla�on is not necessarily causa�on!” Much of the warming has probably been due to natural processes a�er the end of the Litle Ice Age. The current warming in no way differs from the many warmings and coolings that have occurred throughout the Holocene (Fig. 13). The greenhouse gas CO2 has probably contributed some of the warming of the past 170 years, but it has certainly not been the primary cause. The (rather poor) correla�on between CO 2 and temperature rise is the dominant jus�fica�on for today’s misguided climate policy in many countries. Apparently, in order to “save the planet,” governments will be obliged to control all areas of people’s lives and force them to minimize their “carbon footprint.” But as we have outlined above, more CO2 brings great benefits to agriculture and forestry. And as we will briefly review in this sec�on, the effects of CO2 on climate will be trivial compared to the natural fluctua�ons that have characterized Earth’s climate throughout geological history and will con�nue to do so in the future. However, proposed policies to combat this nonexistent threat from greenhouse gases are bad news for those who s�ll believe that every person has an inalienable right to “life, liberty and the pursuit of happiness.”
Because of fundamental radia�on-transfer physics, it is hard to make a persuasive scien�fic case that more CO2 will cause harmful warming. The basic reason is “satura�on” of the effects of CO2 , a phenomenon illustrated in Fig. 14, which shows the spectra ⟨Z ⟩ of the thermal radia�on emited by Earth to space (van Wijngaarden and Happer (2022) [97]). The jagged black curve is the calculated spectral flux at a CO2 concentra�on of 400 ppm, close to the concentra�on of 420 ppm at the �me we are wri�ng this paper. Fluxes measured from satellites can hardly be dis�nguished from the black curve of Fig. 14. The areas under these curves,
are the total fluxes to space carried by radia�on of all frequencies. These fluxes must dump the heat Earth has absorbed from sunlight back into cold space. The red, jagged curve is the spectral flux that would be emitted if CO2 concentrations were “instantaneously” doubled to 800 ppm, with no changes of any other atmospheric proper�es like temperature, or the concentra�ons of other greenhouse gases. The flux difference, δZ = 3.0 W m 2 is called “the instantaneous radiative forcing at the top of the atmosphere.” The rela�ve forcing for doubling CO2 concentra�ons, a 100% increase, is very small
21 Trivial climate effects of more CO2
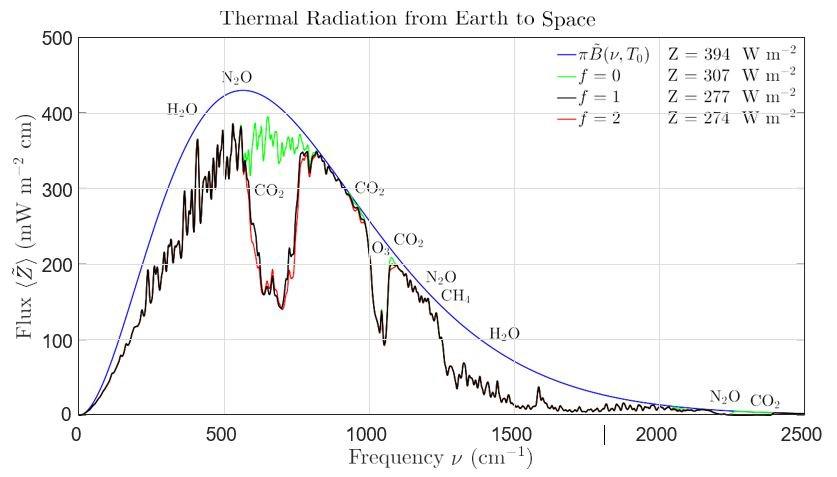
Figure 14: Representative spectra of radiative fluxes from Earth to space. The total fluxes Z of (1) are the areas under the curves. For no greenhouse gases at all, the flux Z would be the area under the blue curve, the StefanBoltzmann flux of Z = σT 4 = 394 W m-2 for an assumed surface temperature of T = 288.7 K. This would be the cooling flux to space if the Earth’s atmosphere had no greenhouse gases. Absorption and reemission of thermal radiation by the five most important greenhouse gases, near the frequencies marked for water vapor H 2O, carbon dioxide CO2, ozone O3, methane CH4 and nitrous oxide N2O, reduces the flux from 394 W m-2 to 277 W m-2, a decrease of 117 W m-2, to 70% of the initial value. Doubling the CO2 concentration from the 400 ppm assumed for the black curve to 800 ppm, gives the red curve with a slightly smaller area of 274 W m-2 This is a decrease of only δZ = 3.0 W m-2 or 1.1 % from the previous value
To es�mate the feedback-free warming we note that calcula�ons like those of Fig. 14, done at absolute surface temperatures (in degrees Kelvin or K) somewhat larger or smaller than the value,
used in the figure, show that flux depends very nearly on the fourth power of the temperature
The feedback-free temperature increase, δT needed to restore the 277 W m 2 of flux to space and stabilize Earth’s temperature with the same solar hea�ng is therefore given by
Using the previous numbers, we see that the feedback-free warming should be
22
T = 28 8. 7 K. (3)
Z ∝ T 4 . (4)
The jagged green curve of Fig. 14 shows the modeled radia�on to space if all the current 400 ppm of CO2 could be instantaneously removed from the atmosphere. As can be seen from the legend, this would increase the radia�on to space from the current 277 W m 2 to 307 W m 2 , a nega�ve forcing 30 W m 2 . So, by star�ng from an atmosphere with no CO2 and only the other naturally occurring greenhouse gases H2O, O3, CH4 and N2O and adding 400 ppm of CO2 , radia�on to space decreases by a substan�al 30 W m 2 , about 10%. But adding another 400 ppm of CO2 to bring the concentra�on to 800 ppm, only decreases radia�on to space by 3 W m 2, a factor of 10 less. To decrease radia�on to space by another 3 W m 2 would require another doubling of the CO2 concentra�on to 1600 ppm, which would require an addi�on of 800 ppm. Every doubling of CO2 , for concentra�ons from about 1 ppm to 10,000 ppm, reduces the radia�on to space by 3 W m 2 , a regularity first recognized by the Swedish chemist Arrhenius in 1896 [98]. Satura�on does not mean that adding more CO2 to the current atmosphere will have no effect; it means that there are “diminishing returns.” The term satura�on was first introduced in astrophysics, Gussman (1967) [99] to describe how the emission or absorp�on lines of atoms or ions radiated by stars change less and less as the densi�es of the emi�ng/absorbing species increase.
The Intergovernmental Panel on Climate Change (IPCC) touts much larger warmings the δT = 0 8 °C of (6), typically around δT = 3 °C, or larger. These large numbers come from assuming huge (modelled, not measured) posi�ve feedbacks. But most feedbacks in nature are nega�ve, not posi�ve, in accord with Le Chatelier’s Principle, “A change in one of the variables that describe a system at equilibrium produces a shift in the position of the equilibrium that counteracts the effect of this change” [100]. Just one example: When a litle heating (for whatever reason) causes more evaporation of water, the resulting water vapor (a greenhouse gas) could theoretically accelerate the heating. However, there are other aggregate states of gaseous water vapor: water droplets and ice crystals, into which more water vapor in the air readily transforms and thus sets in ac�on the “cloud-sunlight-reflectivity-thermostat-mechanism” In fact, all practical experience shows us that the atmosphere works like a thermostat and not like a warming accelerator.
We have no doubt some who promote ruinous social and economic policies to counter a nonexistent climate threat are sincere, if misguided. But “the road to hell is paved with good intentions.” And it is worth remembering Upton Sinclair’s famous and true remark: “It is difficult to get a man to understand something, when his salary depends on his not understanding it” [101]. With no sense of irony, Albert Gore used this quote in his book “An Inconvenient Truth,” where his lack of any real understanding of science is on full display.
23
SUMMARY
The significant enhancement of plant growth due to increasing CO2 in the atmosphere is o�en accompanied by a slight dilu�on of some nutrients, notably nitrogen, in plant �ssues if no atempts are made to make up for the increased demands for these nutrients with appropriate fer�lizers. However, we have shown that the deficiencies in nutrients, and especially nitrogen, caused by eCO2 are small, compared to the nutrient shortages that agriculture and livestock face because of natural phenomena, such as severe soil fertility differences, nutrient dilution in plants due to more rainfall or irriga�on, and even in aging crops. These problems have been routinely dealt with for generations through adequate fertilization, proper species and cultivar selection, and food supplements for livestock and humans.
Other observed reac�ons to eCO2 (such as reduced nitrate reductase ac�vity, reduced photorespiration and reduced carotenoid biosynthesis) can be understood as a resource saving response mechanism of the plant metabolism. Generally, the additional inputs required for the correc�on of the nutri�onal deficits are �ny compared to the benefits of the higher photosynthe�c rate due to eCO2 and the associated yield increases. Moreover, there are reports that elevated CO2 favors the accumula�on of health-promo�ng carbon- based secondary metabolites such as an�oxidants.
In addi�on, eCO2 clearly promotes the efficiency of water use in plants and nitrogen fixation in legumes, which adds beneficial nitrogen to terrestrial ecosystems. Together, these two factors have led to a significant greening of Earth, par�cularly in arid regions. There is published evidence that gradually rising CO2 levels have caused no additional nutrient deficiencies in the quarter of Earth’s land surface that is covered with mostly arid rangelands, suitable only for grazing animals, and where fer�lizer usage is ruled out for economic reasons. Grazing animals have innate “nutritional wisdom” that enables them to compensate for nutritional deficiencies by selective browsing of higher quality leaves or legumes. In addition, there are other economical ways to compensate for mineral or protein deficiencies in livestock nutrition.
In conclusion, field studies of plant growth with eCO2, and the geological history of CO2 and Earth’s climate show that:
• Plants first appeared in the fossil record when atmospheric CO2 levels were much higher than today. Therefore, one can be confident that plants are gene�cally equipped to cope with the moderate increase in CO2 levels since the beginning of the industrial era and with addi�onal increases of CO2 in the future. The greening of Earth (Fig. 5) is only the beginning of benefits from more CO2 for plants and for healthy and abundant human nutri�on.
• Today’s low concentration of atmospheric CO2 is not typical of Earth's climate history, and this gaseous trace compound has not determined the fluctuations of temperature in the past and will not in the future.
• Man-made CO2 emissions are not capable of triggering dangerous future warming. Its global warming potential is almost saturated.
24
• The numerous desirable and beneficial effects of more CO2 in the atmosphere greatly outweigh “climate-damaging” or “nutrient-damaging” impacts, to the extent that these even exist. There is no “social cost of carbon,” as is unfortunately and incorrectly claimed in numerous recent publica�ons. In fact, there is a social benefit from more CO2 in the air.
• Working in conjunc�on with the essen�al growth factors of H2O and sunlight, CO2 is the most important nutrient for plants and for all living organisms depending on food chains. For too long, inadequate atmospheric CO2 has been the shortest stave of Liebig’s barrel (see Fig. 4).
• Rising atmospheric concentra�ons of CO2 have clearly been beneficial for the biosphere, agriculture, humanity, and particularly for global food security at very low additional cost. S�ll higher concentra�ons of CO2 will bring addi�onal benefits.
25
ACKNOWLEDGEMENTS
The following CO2 Coali�on members contributed to this paper: Albrecht Glatzle (Asociación Rural del Paraguay), James D. Ferguson (University of Pennsylvania School of Veterinary Medicine), William Happer (Department of Physics, Princeton University and CO2 Coali�on Chairman), Patrick Moore (Ecologist, Ecosense Environmental Inc. and CO2 Coali�on Director), Gary Ritchie (Consultant in Forest and Environmental Sciences [ret.]), Frits Byron Soepyan (Research and Science Associate, CO2 Coali�on), and Gregory Wrightstone (Execu�ve Director, CO2 Coali�on).
The authors are grateful to Dr. Patrick Baeuerle for carefully reviewing an early version of this paper and making many helpful sugges�ons for improvement. Furthermore, we are indebted to Gordon Tomb for his thorough proofreading work and to Angela Wheeler for her indispensable forma�ng services.
About The CO2 Coali�on
The CO2 Coali�on was established in 2015 as a non-par�san educa�onal founda�on opera�ng under Sec�on 501(c)(3) of the IRS code for the purpose of educa�ng thought leaders, policy makers and the public about the important contribu�on made by carbon dioxide to our lives and the economy. The Coali�on seeks to engage in an informed and dispassionate discussion of climate change, humans’ role in the climate system, the limita�ons of climate models and the consequences of mandated reduc�ons in CO2 emissions.
In carrying out our mission, we seek to strengthen the understanding of the role of science and the scien�fic process in addressing complex public policy issues like climate change. Science produces empirical, measurable, objec�ve facts and provides a means for tes�ng hypotheses that can be replicated and poten�ally disproven. Approaches to policy that do not adhere to the scien�fic process risk grave damage to the economy and to science.
The Coali�on is comprised of more than 160 of the top experts in the world who are skep�cal of a theore�cal link between increasing CO2 and a pending climate crisis while embracing the posi�ve aspects of modest warming and increasing CO2. They include physicists, chemists, meteorologists, geologists, biologists, ecologists, agronomists, engineers, economists and more. Within the Coali�on, more than 70% of the members hold doctorates or commensurate degrees and include members of the Na�onal Academy of Sciences as well as a Nobel Laureate.
26
REFERENCES
[1]Taylor, C. and Schlenker, W., Environmental Drivers of Agricultural Produc�vity Growth: CO2 Fer�liza�on of US Field Crops, Na�onal Bureau of Economic Research (2023), https://www.nber.org/papers/w29320
[2] Norman Borlaug, The Nobel Prize, (1970), htps://www.nobelprize.org/prizes/peace/1970/ borlaug/biographical/
[3]OECD - How we feed the world today, Organiza�on for Economic Co-opera�on and Development, (2023), https://www.oecd.org/agriculture/understanding-the-global-food-system/how-we-feedthe-world-today/
[4]Elements in the human body, htps://en.wikipedia.org/wiki/Composi�on_of_the_human_body
[5]Glucose, htps://www.alimentarium.org/en/fact-sheet/glucose,htps://www.britannica.com/ science/glucose
[6]Ribose, htps://en.wikipedia.org/wiki/Ribose
[7]Glycogen, htps://en.wikipedia.org/wiki/Glycogen
[8]Starch, htps://en.wikipedia.org/wiki/Starch
[9]Cellulose, htps://en.wikipedia.org/wiki/Cellulose
[10]Ruminants, htps://www.fda.gov/animal-veterinary/animal-health- literacy/how-cows-eat-grass
[11]Amino acids, htps://en.wikipedia.org/wiki/Amino_acid
[12]Adenosine triphosphate, htps://en.wikipedia.org/wiki/Adenosine_triphosphate
[13]Proteins, htps://www.nature.com/scitable/topicpage/protein-structure-14122136/
[14]Rubisco, https://www.ncbi.nlm.nih.gov/pmc/articles/PMC7610757/#:~:text=Ribulose%2D1% 2C5%2Dbisphosphate,in%20the%20global%20carbon%20cycle
[15]The Calvin cycle, https://bio.libretexts.org/Bookshelves/Microbiology/Microbiology_(Boundless)/ 05%3A_Microbial_Metabolism/5.12%3A_Biosynthesis/5.12C%3A_The_Calvin_Cycle
[16]Govindjee & Krogmann, D., Review Discoveries in oxygenic photosynthesis (1727–2003): A perspec�ve. Dedicated to the memories of Mar�n Kamen (1920–2002) and William A. Arnold (1904–2001). 2004 Photosynthesis Research 80, 15–57 (2004), htps://www.life.illinois.edu/govindjee/Electronic%20Publica�ons/2006/2006_gov_krogmann.pdf
[17]Apa�te, htps://www.sciencedirect.com/topics/engineering/bone-apa�te
[18]Liebig’s Law of the Minimum, htps://blog.redmondagriculture.com/the- law-of-theminimum
[19]Hydrothermal vent communi�es, htps://php.radford.edu/~swoodwar/ biomes/?page_id=1027
[20]Campbell, J.E., Berry, J.A., Seibt, U., Smith, S.J., Montzka, S.A., Launois, T., Belviso, S., Bopp, and Laine, M., Large historical growth in global terrestrial gross primary produc�on, Nature 544, 84 –87 (1917), https://www.nature.com/articles/nature22030
27
[21]Haverd, V., Smith, B., Canadell, J.G., Cuntz, M. et al., Higher than expected CO2 fer�liza�on inferred from leaf to global observa�ons, Global Change Biology, 26(4) 2390-2402 (2020), htps://onlinelibrary.wiley.com/doi/full/10.1111/gcb.14950
[22]Zhu, Z., Piao, S., Myneni, R.B. et al., Greening of the Earth and its drivers, Nature Climate Change, 6, 791–795 (2016), htps://doi.org/10.1038/nclimate3004
[23]NASA, Na�onal Aeronau�cs and Space Administra�on, Carbon Dioxide Fer�liza�on Greening Earth, Study Finds, (2016), htps://www.nasa.gov/technology/carbon-dioxide-fer�liza�ongreening-earth-study-finds/
[24]Donohue/CSIRO [Commonwealth Scien�fic and Industrial Research Organiza�on] (2015); private communica�on from R. Donohue to W. Happer
[25]Song, X.P., Hansen, M.C., Stehman, S.V., and Potapov, P., Global land change from 1982 to 2016, Nature Research, 560, 639–643 (2018), htps://doi.org/10.1038/s41586 -018-0411 -9
[26]Goklany, I.M., Carbon Dioxide: The good news, The Global Warming Policy Founda�on, Report 18, (2015), htp://www.thegwpf.org/content/uploads/2015/10/benefits1.pdf
[27]Idso, C.D. and Moore, P., Chapter 5. Environmental Benefits, Climate Change Reconsidered, Nongovernmental Interna�onal Panel on Climate Change, The Heartland Ins�tute, (2019), htp://climatechangereconsidered.org/wp -content/uploads/2018/12/5- Environmental-Benefitsfinal.pdf
[28]Chen, X., Chen T., He, B., Liu, S., Zhou, S. and Shi, T., The global greening con�nues despite increased drought stress since 2000, Global Ecology and Conserva�on 49, e02791 (2024), htps://doi.org/10.1016/j.gecco.2023.e02791
[29]Loladze, I., Hidden shi� of the ionome of plants exposed to elevated CO2 depletes minerals at the base of human nutri�on. eLife, 3, e02245, (2014), htps://elifesciences.org/ar�cles/02245
[30]Ferguson, J.D., Influence of CO2 on Global Cereal Crop Produc�on 1961 to 2019, report in process of publica�on (2024).
[31]Food Agriculture Sta�s�cal Data Base, htps://www.fao.org/faostat/en/#data
[32]Ainsworth, E.A. and Long, S.P., What have we learned from 15 years of free-air CO2 enrichment (FACE)? A meta-analy�c review of the responses of photosynthesis, canopy proper�es and plant produc�on to rising CO2, Global change biology, 27(1), 27- 49, (2021), htps://doi.org/10.1111/ gcb.15375
[33]Wang, X., Ye, T., Ata-Ul-Karim, S.T., Zhu, Y., Liu, L., Cao, W. and Tang, L., Development of a Cri�cal Nitrogen Dilu�on Curve Based on Leaf Area Dura�on in Wheat, Fron�ers in Plant Science 8, 1517 (2017), https://doi.org/10.3389/fpls.2017.01517
[34]NASEM (Na�onal Academy of Sciences, Engineering and Medicine), Nutrient Composi�on of Feeds, in Nutrient Requirements of Dairy Catle, eight edi�on, Academic Press, Washington, Chapter 19, 360- 413, (2021), htps://doi.org/10.17226/25806
[35]Feedipedia, Animal feed resources informa�on system, https://www.feedipedia.org/
28
[36]Rengel, Z., Cakmak, I. and White, P.J., Marschner’s Mineral Nutri�on of Plants. Fourth Edi�on. Academic Press (2023)
[37]Broberg, M.C., Högy, P., and Pleijel, H., CO2 -Induced Changes in Wheat Grain Com- posi�on: Meta-Analysis and Response Func�ons, Agronomy 7(2), 32 (2017), htps://doi.org/10.3390/agronomy7020032
[38]Soussana, J.F. and Hartwig, U.A., The effects of elevated CO2 on symbio�c N2 fixa�on: a link between the carbon and nitrogen cycles in grassland ecosystems, Plant and Soil, 187, 321–332 (1995), htps://doi.org/10.1007/BF00017097
[39]Ainsworth, E. A. and Long, S. P., What have we learned from 15 years of free-air CO2 enrichment (FACE)? A meta-analy�c review of the responses of photosynthesis, canopy proper�es and plant produc�on to rising CO2, New Phytologist, 165(2), 351-372 (2004), https://doi.org/10.1111/j.14698137.2004.01224.x
[40]Taub, D.R. and Wang, X., Why are nitrogen concentra�ons in plant �ssues lower under elevated CO2? A cri�cal examina�on of the hypotheses, Journal of Integra�ve Plant Biology, 50(11), 13651374 (2008), htps://doi.org/10.1111/j.1744 - 7909.2008.00754.x
[41]McGrath, J.M. and Lobell, D.B., Reduc�on of transpira�on and altered nutrient al- loca�on Contribute to nutrient decline of crops grown in elevated CO2 concentra�ons, Plant, Cell and Environment 36 (3), 697- 705 (2012), htps://doi.org/10.1111/pce.12007
[42]Kimball, B.A., Crop responses to elevated CO2 and interac�ons with H2O, N, and temperature, Current Opinion in Plant Biology 31, 36-43, (2016), htps://doi.org/10.1016/j.pbi.2016.03.006
[43]Lim, SL., Voon, C.P., Guan, X. et al., In planta study of photosynthesis and photorespi- ra�on using NADPH and NADH/NAD+ fluorescent protein sensors Nat Commun 11, 3238 (2020), htps://doi. org/10.1038/s41467-020- 17056-0
[44]Eamus, D., The interac�on of rising CO2 and temperatures with water use efficiency, Plant, Cell and The Environment, 14(8), 843- 852 (1991), https://onlinelibrary.wiley.com/doi/abs/10.1111/j.13653040.1991.tb01447.x
[45]Allen, L.H., Kakani, V.G., Vu, J.C.V. and Boote, K.J., Elevated CO2 increases water use efficiency by sustaining photosynthesis of water- limited maize and sorghum, Journal of Plant Physiology, 168(16), 1909-1918 (2011), htps://doi.org/10.1016/j.jplph.2011.05.005
[46]Keenan, T.F., Hollinger, D.Y., Bohrer, G., Dragoni, D., Munger, J.W., Schmid, H.P. and Richardson, A.D., Increase in forest water-use efficiency as atmospheric carbon dioxide concentra�ons rise, Nature 499(7458), 324- 327 (2013), doi:10.1038/nature12291
[47]Deryng, D., Elliot, J., Folberth, C. et al., Regional dispari�es in the beneficial effects of rising CO 2 concentra�ons on crop water produc�vity, Nature Climate Change, 6(8), 786-790 (2016), htps://doi.org/10.1038/nclimate2995
[48]Uddin, S., Löw, M., Parvin, S., Fitzgerald, G.J., Tausz-Posch, S., Armstrong, R., O’Leary, G. and Tausz, M., Elevated [CO2] mi�gates the effect of surface drought by s�mula�ng root growth to access sub-soil water, PLoS ONE 13(6), e0198928 (2018), htps://doi.org/10.1371/journal.pone.0198928
29
[49] Fitzgerald, G.J., Tausz, M., O’Leary, G., Mollah, M.R. et al., Elevated atmospheric [CO2] can drama�cally increase wheat yields in semi-arid environments and buffer against heat waves, Global Change Biology 22(6) , 2269-84 (2016), htps://doi.org/10.1111/gcb.13263
[50] Gifford, R.M., Barret, D.J., Lutze, J.L., The effects of elevated [CO2] on the C:N and C:P mass ra�os of plant �ssues, Plant Soil 224, 1– 14 (2000), htps://link.springer.com/ar�cle/10.1023/ A:1004790612630
[51] Gojon, A., Cassan, O., Bach, L., Lejay, L., Mar�n, A., The decline of plant mineral nutri�on under Rising CO2: physiological and molecular aspects of a bad deal, Trends in Plant Science 28(2), 185198 (2022), htps://doi.org/10.1016/j.tplants.2022.09.002
[52] Loladze, I., Nolan, J.M., Ziska, L., Knobbe, A.R., Rising Atmospheric CO2 Lowers Concentra�ons of Plant Carotenoids Essen�al to Human Health: A Meta-Analysis, Molecular Nutri�on and Food Research, 63(15), 1801047 (2019), htps://doi.org/10.1002/mnfr.201801047
[53] Boufeldja L., Brandt, D., Guzman, C., Vitou, M. et al., Effect of Elevated Carbon Dioxide Exposure on Nutri�on -Health Proper�es of Micro-Tom Tomatoes, Molecules, 27(11), 3592 (2022), htps://doi.org/10.3390/molecules27113592
[54] Golden Rice Project, Vitamin A Deficiency-Related Disorders (VADD), htps://www.goldenrice.org/ Content3-Why/why1_vad.php
[55] Renninger, H., Carlo, N.J., Clark, K.L. and Schäfer, K.V.R., Resource use and efficiency, and stomatal responses to environmental drivers of oak and pine species in an Atlan�c Coastal Plain forest, Fron�ers in Plant Science 6(103), 1-16 (2015), htps://doi.org/10.3389/fpls.2015.00297
[56] Rajashekar, C., Elevated CO2 Levels Affect Phytochemicals and Nutri�onal Quality of Food Crops, American Journal of Plant Sciences, 9(2), 150 -162 (2018), doi:10.4236/AJPS.2018.92013
[57] Guo, H., Sun , Y., Li, Y., Liu X., Ren, Q., Zhu-Salzman, K. and Ge, F., Elevated CO2 Modifies N Acquisi�on of Medicago truncatula by Enhancing N Fixa�on and Reducing Nitrate Uptake from Soil, PLoS ONE, 8(12), e81373 (2013), htps://doi.org/10.1371/journal.pone.0081373
[58] Jin, J., Armstrong, R. and Tang, C., Impact of elevated CO2 on grain nutrient con- centra�on varies with crops and soils - A long-term FACE study, Sci. Total Environ., 651(2), 2641 -2647 (2019), doi:10.1016/j.scitotenv.2018.10.170
[59] Li, Y., Yu, Z., Liu, X., Mathesius, U., Wang, G. et al., Elevated CO2 Increases Nitrogen Fixa�on at the Reproduc�ve Phase Contribu�ng to Various Yield Responses of Soybean Cul�vars, Fron�ers in Plant Science 8, 1546 (2017), htps://doi.org/10.3389/fpls.2017.01546
[60] Feng, Z., Rü�ng, T., Pleijel, H. et al., Constraints to nitrogen acquisi�on of terrestrial plants under elevated CO2, Glob. Change Biol. 21(8), 3152 -68 (2015), doi:10.1111/gcb.12938
[61] Runion, G.B., Entry, J.A., Prior, S.A., Mitchell, R.J., Rogers, H.H., Tissue chemistry and carbon Alloca�on in seedlings of Pinus palustris subjected to elevated atmospheric CO2 and water stress, Tree Physiology 19, 329 -335 (1999), htps://www.ars.usda.gov/ARSUserFiles/60100500/ csr/researchpubs/runion/ runion_99a.pdf
30
[62] Gill, R. A., Polley, H.W., Johnson, H.B., Anderson, L.J., Maherali, H., Jackson, R.B., Nonlinear grassland responses to past and future atmospheric CO2, Nature 417, 279–282 (2002), doi:10.1038/417279a
[63] Lee, T.D., Reich, P.B., and Tjoelker, M.G., Legume presence increases photosynthesis and N concentra�ons of co- occurring non- fixers but does not modulate their responsive- ness to carbon dioxide enrichment, Ecophysiology 137, 22–31 (2003), htps://doi.org/10.1007/s00442-003-1309-1
[64] Hasegawa, S., Macdonald, C.A., Power, S.A., Elevated carbon dioxide increases soil ni- trogen and phosphorus availability in a phosphorus-limited Eucalyptus woodland, Global Change Biol. 22(4), 1628- 43 (2016), htps://doi.org/10.1111/gcb.13147
[65] Ross, D.J., Newton, P.C.D., Tate, K.R., Elevated [CO2] effects on herbage produc�on and soil carbon
And nitrogen pools and mineraliza�on in a species-rich, grazed pasture on a seasonally dry sand, Plant and Soil, 260, 183– 196 (2004), htps://link.springer.com/ar�cle/10.1023/B:PLSO. 0000030188.77365.46
[66] Van Groenigen, K.J., Osenberg, C.W., Terrer, C., Carrillo, Y., Dijkstra, F.A., Heath, J., Nie, M., Pendall, E., Phillips, R.P., Hungate, B.A., Faster turnover of new soil carbon inputs under increased atmospheric CO2, Global Change Biology, 23, 4420– 4429 (2017), htps://doi.org/10.1111/ gcb.13752
[67] Scurlock, J.M.O. and Hall, D.O., The global carbon sink: a grassland perspec�ve, Global Change Biology, 4, 229–233 (1998), htps://doi.org/10.1046/j.1365-2486.1998.00151.x
[68] Smith, P., Soils as carbon sinks: the global context, Soil Use and Management, 20, 212– 218 (2006), htps://doi.org/10.1111/j.1475- 2743.2004.tb00361.x
[69] Eclesia, R.P., Jobbagy, E.G., Jackson, R.B., Biganzoli, and Piñeiro, G., Shi�s in soil organic carbon for planta�on and pasture establishment in na�ve forests and grasslands of South America, Global Change Biology, 18, 3237–3251 (2012), htps://doi.org/10.1111/j.1365- 2486.2012.02761.x
[70] Kell, D.B, Large-scale sequestra�on of atmospheric carbon via plant roots in natural and agricultural ecosystems: why and how, Philosophical Transac�ons of the Royal Society B, 367, 1589–1597 (2012), https://doi.org/10.1098/rstb.2011.0244
[71] Grüneberg, E., Ziche, D. and Wellbrock, N., Organic carbon stocks and sequestra�on rates of forest soils in Germany, Glob. Chang. Biol., 20, 2644 –2662 (2014), htps://doi.org/10.1111/gcb.12558
[72] Chambers, A., Lal, R. and Paus�an, K., Soil carbon sequestra�on poten�al of US croplands and grasslands: implemen�ng the 4 per Thousand Ini�a�ve, J. Soil Water Conserva�on, 71, 68A–74A (2016), htps://doi.org/10.2489/jswc.71.3.68A
[73] Jonard, M., Nicolas, M., Coomes, D.A., Caignet, I., Saenger, A., and Ponete, Q., Forest soils in France are sequestering substan�al amounts of carbon, Science of the Total Environment, 574, 616–628 (2017), htps://doi.org/10.1016/j.scitotenv.2016.09.028
[74] Xu, L., Yu, G., He, N., Wang, Q., Gao, Y. et al., Carbon storage in China’s terrestrial ecosystems: a synthesis, Scien�fic Reports, 8, 1–12 (2018), https://doi.org/10.1038/s41598-018-20764-9
31
[75]Viglizzo, E.F., Ricard, M.F., Taboada, M.A., Vázquez-Amábile, G., Reassessing the role of grazing lands in carbon-balance es�ma�ons: Meta-analysis and review, Science of the Total Environment, 661, 531–542 (2019), htps://doi.org/10.1016/j.scitotenv.2019.01.130
[76]Koyama A., Harlow, B. and Evans, R.D., Greater soil carbon and nitrogen in a Mojave Desert ecosystem a�er 10 years exposure to elevated CO2, Geoderma, 355, Ar�cle 113915 (2019), htps://doi.org/10.1016/j.geoderma.2019.113915
[77]Zheng, Y., Shen, R., Wang, Y., Li, X., Liu, S., Liang, S., Chen, J.M., Ju, W., Zhang, L. and Yuan, W., Improved es�mate of global gross primary produc�on for reproducing its long-term varia�on, 1982–2017, Earth System Science Data, 12 (4), 2725– 2746 (2020), https://doi.org/10.5194/essd12 -2725- 2020
[78]Li, D., Niu, S. and Luo, Y., Global paterns of the dynamics of soil carbon and nitrogen stocks following afforesta�on: a meta-analysis, New Phytologist, 195, 172–181 (2012), htps://doi.org/ 10.1111/j.1469-8137.2012.04150.x
[79]Zhu, J., He, N., Zhang, J.,Wang, Q., Zhao, N., Jia, Y., Ge, J., Yu, G., Es�ma�on of carbon sequestra�on in China’s forests induced by atmospheric wet nitrogen deposi�on using the principles of ecological stoichiometry, Environmental Research Leters, 12, 114038 (2017), htps://doi.org/10.1088/1748-9326/aa94a4
[80]Glatzle, A., Weidewirtscha� in den Tropen und Subtropen, Ulmer, Stutgart (1990)
[81]Breman, H. and de Wit, C.T. , Rangeland Produc�vity and Exploita�on in the Sahel, Science, 221, 1341 -7 (1983),https://www.researchgate.net/publication/6081311_Rangeland_Productivity_ and_Exploita�on_in_the_Sahel
[82]Demoulin, C. F. et al., Cyanobacteria evolu�on: Insight from the fossil record, Free Radic Biol Med. 20(140), 206-223 (2019), htps://www.ncbi.nlm.nih.gov/pmc/ar�cles/PMC6880289/
[83] Moore, P., The Posi�ve Impact of Human CO2 Emissions on the Survival of Life on Earth, The Fron�er Centre for Public Policy (2016), https://fcpp.org/sites/default/files/documents/Moore %20%20Posi�ve%20Impact%20of%20Human%20CO2%20Emissions.pdf
[84]Milu�n Milankovich, htps://www.britannica.com/biography/Milu�n-Milankovitch
[85]Mearns, E, The Vostok Ice Core and the 14,000 Year CO2 Time Lag, Energy Maters, June (2017), htp://euanmearns.com/the-vostok-ice -core- and-the-14000-year-co2-�me- lag/
[86]Temme, et al., Hungry and thirsty: Effects of CO2 and limited water availability on plant performance, Flora, 254, 188- 193 (2019), htps://doi.org/10.1016/j.flora.2018.11.006
[87]Caillon et al., Timing of atmospheric CO2 and Antarc�c temperature changes across termina�on III, Science bf 299 (5613), 1728-31 (2003), doi:10.1126/science.1078758
[88]Koutsoyiannis, et al., On Hens, Eggs, Temperatures and CO2: Causal Links in Earth’s Atmosphere, Sci. 2023, 5(3), 35 (2023), htps://www.mdpi.com/2413-4155/5/3/35
[89]Pe�t, J. R. et al., Climate and atmospheric history of the past 420,000 years from the Vostok ice core, Antarc�ca. Nature 399, 429-436, (1999), htps://doi.org/10.1038/20859
32
[90] Nova, J., (2020), htps://joannenova.com.au/global- warming-2/ice-core-graph/
[91] Alley, R.B., The Younger Dryas Cold Interval as Viewed from Central Greenland Qua- ternary Science Reviews 19 (1-5), 213 -226 (2000), htps://doi.org/10.1016/S0277 -3791(99)00062-1
[92] Alley R.B., GISP2 Ice Core Temperature and Accumula�on Data, IGBP PAGES/World Data Center for Paleoclimatology Data Contribu�on Series #2004- 013, NOAA/NGDC Paleoclimatology Program, Boulder CO, USA, (2004), https://www.ncei.noaa.gov/access/metadata/landing-page/bin/iso? id=noaa- icecore-2475
[93] Fischer, A. and Patzelt, G., Gletscher im Wandel: 125 Jahre Gletscher-Meßdienst des Alpenvereins. Springer (2018)
[94] Glacier Bay’s Glacial History, htps://www.nps.gov/glba/learn/nature/glacier- bay-s-glacialhistory.htm
[95] Kalis, A.J. et al., Environmental changes during the Holocene clima�c op�mum in central Europe –Human impact and natural causes, Quat. Sci. Rev. 22, 33 -79, (2003), htps://doi.org/10.1016/ S0277- 3791(02)00181 -6
[96] Ben-Yehuda, N., The European Witch Craze of the 14th to 17th Centuries, The University of Chicago Press, American Journal of Sociology 86(1), 1 -31(1980), htps://www.jstor.org/stable/ 2778849
[97] Van Wijngaarden, W. and Happer, W., Infrared Forcing by Greenhouse Gases,(2019), https://co2coalition.org/wp-content/uploads/2022/03/Infrared-Forcing-by-Greenhouse-Gases2019- Revised-3-7 -2022.pdf
[98] Arrhenius, S., On the Influence of Carbonic Acid in the Air upon the Temperature of the Ground, Phil. Mag. S. 5. 4, No. 251, p. 237- 276 (1896), htp://www.rsc.org/images/Arrhenius1896_tcm18 - 173546.pdf
[99] Gussman, A.E., Satura�on in Fraunhofer Lines, The Observatory, 87, 233 -236 (1967), htps://ar�cles.adsabs.harvard.edu/full/seri/Obs../0087//0000236.000.html
[100] Le Chatelier’s Principle, htps://chemed.chem.purdue.edu/genchem/topicreview/bp/ch16/ lechat.php
[101] Upton Sinclair, htps://en.wikipedia.org/wiki/Upton_Sinclair
33