GeoscienceFrontiers14(2023)101650
Contentslistsavailableat ScienceDirect

GeoscienceFrontiers
journalhomepage:www.else vier.com/locate/gsf

GeoscienceFrontiers14(2023)101650
Contentslistsavailableat ScienceDirect
journalhomepage:www.else vier.com/locate/gsf
DepartmentofEarthSciences,EnvironmentandGeoresources,UniversityofNaplesFedericoII,ComplessoUniversitariodiMonteS.Angelo,viaCinthia,21,Naples80126,Italy
articleinfo
Articlehistory:
Received6March2023
Revised5June2023
Accepted8June2023
Availableonline14June2023
HandlingEditor:R.D.Nance
Keywords:
Solaractivitychanges
Solarvariabilityclimaticimpact
Globalclimatechangeandmodeling
Equilibriumclimatesensitivity
TheroleoftheSuninclimatechangeishotlydebated.Somestudiessuggestitsimpactissignificant, whileotherssuggestitisminimal.TheIntergovernmentalPanelonClimateChange(IPCC)supports thelatterviewandsuggeststhatnearly100%oftheobservedsurfacewarmingfrom1850–1900to 2020isduetoanthropogenicemissions.However,theIPCC’sconclusionsarebasedsolelyoncomputer simulationsmadewithglobalclimatemodels(GCMs)forcedwithatotalsolarirradiance(TSI)record showingalowmulti-decadalandsecularvariability.ThesamemodelsalsoassumethattheSunaffects theclimatesystemonlythroughradiativeforcing–suchasTSI–eventhoughtheclimatecouldalsobe affectedbyothersolarprocesses.InthispaperIproposethree‘‘balanced”multi-proxymodelsoftotal solaractivity(TSA)thatconsiderallmainsolarproxiesproposedinscientificliterature.Theiroptimalsignatureonglobalandseasurfacetemperaturerecordsisassessedtogetherwiththoseproducedbythe anthropogenicandvolcanicradiativeforcingfunctionsadoptedbytheCMIP6GCMs.Thisisdonebyusing abasicenergybalancemodelcalibratedwithadifferentialmulti-linearregressionmethodology,which allowstheclimatesystemtorespondtothesolarinputdifferentlythantoradiativeforcingsalone, andtoevaluatetheclimate’scharacteristictime-responseaswell.Theproposedmethodologyreproduces theresultsoftheCMIP6GCMswhentheiroriginalforcingfunctionsareappliedundersimilarphysical conditions,indicatingthat,insuchascenario,thelikelyrangeoftheequilibriumclimatesensitivity (ECS)couldbe1.4 Cto2.8 C,withameanof2.1
C(usingtheHadCRUT5temperaturerecord),which iscompatiblewiththelow-ECSCMIP6GCMgroup.However,iftheproposedsolarrecordsareusedasTSA proxiesandtheclimaticsensitivitytothemisallowedtodifferfromtheclimaticsensitivitytoradiative forcings,amuchgreatersolarimpactonclimatechangeisfound,alongwithasignificantlyreduced radiativeeffect.Inthiscase,theECSisfoundtobe0.9–1.8 C,withameanofaround1.3 C.Lower ECSranges(upto20%)arefoundusingHadSST4,HadCRUT4,andHadSST3.Theresultalsosuggeststhat atleastabout80%ofthesolarinfluenceontheclimatemaynotbeinducedbyTSIforcingalone,but ratherbyotherSun-climateprocesses(e.g.,byasolarmagneticmodulationofcosmicrayandotherparticlefluxes,and/orothers),whichmustbethoroughlyinvestigatedandphysicallyunderstoodbefore trustworthyGCMscanbecreated.Thisresultexplainswhyempiricalstudiesoftenfoundthatthesolar contributiontoclimatechangesthroughouttheHolocenehasbeensignificant,whereasGCM-basedstudies,whichonlyadoptradiativeforcings,suggestthattheSunplaysarelativelymodestrole.AppendixA (SupplementaryDataText)includestheproposedTSArecords.
2023ChinaUniversityofGeosciences(Beijing)andPekingUniversity.PublishedbyElsevierB.V.on behalfofChinaUniversityofGeosciences(Beijing)ThisisanopenaccessarticleundertheCCBY-NC-ND license(http://creativecommons.org/licenses/by-nc-nd/4.0/).
Abbreviations: GCM,GlobalClimateModel;ECS,EquilibriumClimateSensitivity;TCR,TransientClimateResponse;TSA,TotalSolarActivity;TSI,TotalSolar Irradiance.
E-mailaddress: nicola.scafetta@unina.it
https://doi.org/10.1016/j.gsf.2023.101650
TheSun’scontributiontoclimatechangeisahotlydebatedand controversialtopic:empiricalstudiesusuallyclaimthatithasa significantimpact,whileothers,usuallybasedonglobalclimate model(GCM)simulations,claimthatithasamodesteffect.Inthis workIaddressthiscriticalissueandproposeasolution.The conundrumappearstostemfromtwosortsofuncertainties:(i)
1674-9871/ 2023ChinaUniversityofGeosciences(Beijing)andPekingUniversity.PublishedbyElsevierB.V.onbehalfofChinaUniversityofGeosciences(Beijing) ThisisanopenaccessarticleundertheCCBY-NC-NDlicense(http://creativecommons.org/licenses/by-nc-nd/4.0/).
thehistoricalsolaractivitymultidecadalandsecularvariationsare notpreciselyknown;and(ii)theSunlikelyinfluencestheEarth’s climatethroughavarietyofphysicalmechanismsthatarenotfully understoodyetand,therefore,aremissingintheavailableGCMs. Thisintroductionoutlinesthemostimportantopenissuesand uncertaintiesonthistopic.
Totalsolarirradiance(TSI)canonlybemeasuredusingsatellites,andtheavailableTSIrecordsbeganin1978(Willsonand Mordvinov,2003;Dewitteetal.,2004;Fröhlich,2009;deWit etal.,2017).Asaresult,inearliertimes,TSIproxymodelshave beendevelopedusinginformationthatcouldbeassociatedwith variationsinsolaractivitysuchassunspotnumberrecords,faculae indices,cosmogenic 14Cand 10Berecords,solarcyclelengths,etc. However,theproposedTSIproxymodelsdiffergreatlyfromone another(HoytandSchatten,1993;Leanetal.,1995;Wangetal., 2005;Krivovaetal.,2007,2010;Shapiroetal.,2011;Coddington etal.,2016;Egorovaetal.,2018;Wuetal.,2018;Scafettaetal., 2019;Penzaetal.,2022).Themainreasonisthatthebrightness evolutionoftheso-called‘‘quiet”regionsoftheSunisstillpoorly understood.Moreover,ithasalsobeenratherchallengingtocalibrateandvalidatesolarproxymodelsagainstthe+40yearsof TSIsatellitemeasurements.
TSIsatelliteradiometersnormallyworkforadecadeoralittle more,theiraccuracyvariessignificantly,andreadingsfromdifferentradiometersrequirestatisticalcross-calibrationsbeforethey canbeintegratedintoasuitablelongcomposite.Sofar,theTSI satellitecompositescontinuetobecontentious.
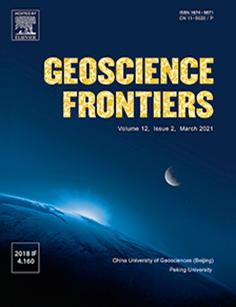
ThereisamajorTSI-compositecontroversythathasnotbeen solvedyet,whichhasalsoshapedthediscussionregardingtherole oftheSuninclimatechange.Twodifferentscienceteams,the ActiveCavityRadiometerIrradianceMonitor(ACRIM)andthe Physikalisch-MeteorologischesObservatoriumDavos(PMOD), cametodivergentresultsconcerningtheTSImultidecadaltrend throughoutthesolarcycles21–23(roughlyfrom1980to2000). ThePMOD-recommendedTSIsatellitecompositeshowsaslight TSIdecrease(FröhlichandLean,1998;Fröhlich,2009),whilethe ACRIMoneshowsanincrease(Willson,1997;Willsonand Mordvinov,2003):see Fig.1.Alsotheso-calledinstrument-based ‘‘Community-ConsensusTSIComposite”showsamoderateTSI increasefrom1980to2000,followedbyaslightTSIdecrease(de Witetal.,2017).
ThemainreasonforthisuncertaintyisthattheACRIM-2experimentwasdelayedduetothe1986SpaceShuttleChallengerincident,whichpreventedthenewdatafromoverlappingwiththe ACRIM-1measurements.OnlylesspreciseTSIrecordsfromtwo alternativeexperiments(Nimbus/ERBandERBS/ERBE)–which weredesignedforEarthRadiationBudget(ERB)investigations ratherthanforhighprecisionTSImonitoringliketheACRIMones thatemployedelectricallyself-calibratingcavitysensors–could bridgetheso-called‘‘ACRIM-gap”from1989.5to1991.75,and cross-calibratetheACRIM-1andACRIM-2TSIrecords.Theproblem wasthatduringtheACRIM-gap,theNimbus/ERBrecordtrended upwardwhiletheERBS/ERBEdatamoderatelytrendeddownward (ScafettaandWillson,2014).
TheACRIMscienceteamsreasonedfromanexperimental standpointandsuggestedthatthetrendshownbytheNimbus/ ERBdatahadtobeconsideredthemostlikelyaccurateonebecause NIMBUS7/ERBresultswereexpectedtobemoreprecisethanERBS/ ERBE(e.g.,theinstrumentwasmeasuringmuchmorefrequently) andtheACRIM-gapoccurredduringthepeakofsolarcycle22. Onthecontrary,theERBS/ERBEradiometerwasexpectedto degradeduringthissolarcyclemaximumbecauseofitsfirstexposuretohighUVradiations,whereasNimbus/ERBwaslaunchedin 1978anditsfirstUVexposurehappenedduringthemaximumof solarcycle21.Asaresult,duringthemaximumofcycle22,the
Nimbus/ERBradiometerwasexpectedtobemorestable (Willson,1997;WillsonandMordvinov,2003).
ThePMODteam,ontheotherhand,arguedprimarilyfroma modelingstandpoint,andclaimedthattheupwardtrendindicated bytheNimbus/ERBrecordduringtheACRIM-gapwasfictitious becauseitappearedtodivergefromthepredictionofsomeTSI proxymodelsbasedonsunspotandfaculaeindices.Thelatter, however,onlyrepresenttheso-called‘‘active”solarregions(see thedetaileddiscussionin Scafettaetal.,2019).Onspecificoccasions(e.g.,onSeptember29,1989),radiometer‘‘glitches”were alsohypothesizedtoexplaintheobserveddivergencesofthedata fromtheadoptedTSIproxymodels.Ingeneral,theNimbus/ERBTSI recordwasclaimedtobeaffectedbyspurioustrendsandjumps thatrequiredanumberofad-hocadjustments(Fröhlichand Lean,1998;Fröhlich,2009).
Consequently,ACRIMcross-calibratedACRIM-1andACRIM-2 usingtheactualNimbus/ERBTSIsatellitepublisheddata,while PMODdiditbyusingaNimbus7/ERBrecordthatwassignificantly modifiedtoreplicatetheslightlynegativetrendsoftheERBS/ERBE TSIrecordandofsomeTSIproxymodels.PMODalsoappliedcalibrationmodelsbuilttorectifytheconsiderabledegradationofthe PMO6Vradiometer(onVIRGO)totheHFradiometer(onNimbus7/ ERB),assumingthatthetwoinstrumentsperformedsimilarly.
However,usinghypotheticalmethodstoalterexperimental resultsundertheguiseofadjustingthemisalwaysquestionable. Forexample,thehypothesizedinstrumental‘‘glitches”wereinvestigatedanddismissedbytheoriginalNimbus/ERBexperimental teambecausetheywerefoundphysicallyincompatiblewiththe experimentalequipment.DouglasHoyt,theprincipalinvestigator fortheNimbus7/ERBTSIsatelliteexperiment,remarked:‘‘ThecalibrationsbeforeandaftertheSeptembershutdowngavenoindicationofanychangeinthesensitivityoftheradiometer Fröhlich’sPMODTSIcompositeisnotconsistentwiththeinternal dataorphysicsoftheNimbus7cavityradiometer”(supplementary of ScafettaandWillson,2009).Seealsotheindependentreviewby Zacharias(2014)
TheIPCCacknowledgedtheACRIM-PMODdisagreementinits 2007and2013publications(Solomonetal.,2007;Stockeretal., 2014).ThemostrecentAR6report(Masson-Delmotteetal., 2021),however,omittedtomentionit,whichcouldgivetheerroneousimpressionthatthePMOD’sadjustmentsoftheexperimentalTSIdatahadbeenvalidated.Infact, ScafettaandWillson(2014) and Scafettaetal.(2019) presentedseveralpiecesofevidencethat corroboratedtheACRIMTSIcompositeand,morespecifically,the risingtrendoftheNimbus/ERBTSIrecordduringtheACRIM-gap, suchas:(i)from1989to1992thestrengthofthesolarmagnetic fieldcontinuouslyincreased;(ii)onSeptember29,1989,when theHFinstrumentwasswitchedoff,no‘‘glitch”intheNimbus7/ ERBrecordcouldbeidentifiedbydirectcomparisonwiththe ERBS/ERBETSIrecord;(iii)the1974–2009TSIreconstructionby Balletal.(2012) showedaTSIincreaseduringtheACRIM-gapthat isbettercorrelatedwiththeACRIMTSIsatellitecompositethan withthedownwardtrendofthePMODone;(iv)theTSIproxy modelsusedtosupportthePMODmultidecadaldecreasingtrend (Krivovaetal.,2010;Coddingtonetal.,2016)werefoundincompatiblewiththeACRIM-1andACRIM-2TSIsatellitedatafrom 1985to2000,whichareconsideredtobehighlyaccurate.
ThedebateoverthemultidecadaltrendintheTSIsatellitecompositehasinfluencedboththeTSIandsolarspectralirradiance (SSI)proxymodelreconstructions.Ingeneral,theACRIMTSIcompositeimpliesagreatermultidecadalTSIvariabilityincontrastto thelowonesuggestedbythePMODTSIcomposite.Thus,TSIproxy modelswithdrasticallydifferentmultidecadalandsecularvariabilityhavebeenpublished(HoytandSchatten,1993;Lean etal.,1995;Wangetal.,2005;Shapiroetal.,2011;Vieiraetal.,
(cyan),andVIRGO(orange).(Forinterpretationofthereferencestocolourinthisfigurelegend,thereaderisreferredtothewebversionofthisarticle.)
2011;Coddingtonetal.,2016;Egorovaetal.,2018;Wuetal.,2018; Penzaetal.,2022).TheyestimatethatfromtheMaunderminimum (1645–1715)tothepresent,TSImighthaveincreasedfrom0.75W/ m2 to6.3W/m2 (Yeoetal.,2020).Thislargeuncertaintyclearly underminesanyattempttoassesstheSun’sroleinclimatechange duringthelastcenturiesusingGCMswhoseoutputsonlydepends onradiative-basedforcings.
SomeoftheseTSIproxymodels,suchasSATIRE(Krivovaetal., 2007,2010;Wuetal.,2018)andNRLTSI2(Coddingtonetal., 2016)),exhibitaverymodestTSImultidecadalandsecularvariability,andwerevalidatedagainstthePMODTSIsatellitecomposite.However,thelatterwaspartiallycreatedbyusinganearly versionoftheNRLTSI2model(FröhlichandLean,1998).Thus, thefoundagreementisnotsignificant.TheACRIMTSIcomposite contradictsthe1980–2000downwardtrendofthesemodels.In particular, ScafettaandWillson(2014,2019) and Scafettaetal. (2019) demonstratedthatSATIREandNRLTSI2disagreewiththe TSIsatelliterecordsevenwhenthemeasurementsarenotindispute,asthroughouttheperiodscoveredbyACRIM-1andACRIM2from1985to2000.Also deWitetal.(2017) foundconsiderable differencesbetweentheseTSIproxymodels(inparticularwith SATIRE)andtheirproposedCommunity-ConsensusTSIsatellite composites.Indeed,itwasdiscoveredthatifSATIREandNRLTSI2 wereempiricallyadjustedtooptimallyagreewiththeactualTSI satellitedataduringtheuncontroversialperiodsoutsidethe ACRIM-gap,theadjustedTSImodelswouldfittheACRIMrising trendfrom1980to2000(ScafettaandWillson,2014;Scafetta etal.,2019).
NRLTSI2alsoappearsnonphysicalbecausethisTSIproxyrecord wascreatedonlyusingsunspotblockingandfaculaeemission indices,whiletheluminosityoftheso-called‘‘quiet”solarareas wassupposedtobeconstant(Coddingtonetal.,2016).Asaresult, themodestTSImultidecadalandsecularvariationofNRLTSI2
mightbetheproductofthephysicalassumptionsofthemodel itself.
Otherscienceteamsusedalternativesolarmodelingmethodologiestorecreatethenetworksolarluminosityoutputfromthe allegedly‘‘quiet”solarareas,andtheyconcludedthatsolaractivity couldbecharacterizedbyalargemultidecadalandsecularvariability. HoytandSchatten(1993),forexample,developedacomplexTSIproxymodelbasedonseveralsolarindices,whichis discussedbrieflyinAppendixA(SupplementaryDataText).This TSIproxymodelaccountedforapproximately71%ofthedecadal varianceoftheNorthernHemispheretemperatureanomaliesfrom 1700to1992. Shapiroetal.(2011) and Egorovaetal.(2018) also usedamulti-proxyapproachandassumedthatthequiet-Sun brightnessvariesintimeproportionallytothesecular(22-year averaged)variationofthesolarmodulationpotential.AconsiderableTSIvariabilityappearstobealsosupportedbycertainastrophysicalevidence.Forexample, Judgeetal.(2020) examineda sampleof72Sun-likestarsandsetalimitonthesolarforcingof Earth’satmosphereequalto4.5W/m2 since1750.
Yeoetal.(2020) estimatedthatthedimmeststateoftheSun mightbe2.0±0.7W/m2 belowthe2019level,whichismorethan 1W/m2 lowerthanwhatNRLTSI2andSATIREshowduringthe Maunderminimum(1645–1715)relativetopresentsolarcycle minima.However,suchanestimatewasobtainedusingmodeling anddatafrommodern-daysolarimages,whichmayunderestimatethetruedimmestlevelofsolarluminositybecause,inrecent decades,solaractivityappearstobeoscillatingaroundagrand solarmillenniummaximum(Scafetta,2012a;Scafettaand Bianchini,2022). Yeoetal.(2020) wasalsoquestionedby Schmutz(2021),whoobservedthatatoolowTSIsecularvariabilitycouldnotexplainthestrongcorrelationdiscoveredbetween solarandclimaticrecordsoverthelastcenturies.Accordingto hiscalculations,thefoundempiricalcorrelationcouldrequirea
TSIvariationsincetheMaundersolarminimumoftheorderof 10W/m2
Penzaetal.(2022) recentlyproposedanalternativeTSIproxy modelcoveringthelastfivecenturies.Italsoexhibitsanimportant secularvariability,withaTSIincreasefromtheMaunderminimum tothepresentequaltoabout2.5W/m2,whichis1.5–2.0W/m2 morethantheTSIincreaseshownbyNRLTSI2andSATIREduring thesameperiod.
Despitetheaboveconsiderations,NRLTSI2andSATIREwere usedby Matthesetal.(2017) tocreatetheTSIforcingfunctionthat wasadoptedbytheGCMsofthesixthCoupledModelIntercomparisonProjectPhases(CMIP6)oftheWorldClimateResearch Programme.Thus,onlylow-variabilityTSIrecordswereused toassesstherelativeanthropogenicversusnatural(solarand volcanic)contributionstoclimatechangefrom1850to2014 (Eyringetal.,2016;Masson-Delmotteetal.,2021).Moreover,the GCMsalsoassumedthattheSuncouldonlyaffecttheEarth’sclimatethroughchangesinitsluminosity.Asaresult,byusingthe estimatedhistoricalforcings,theCMIP6GCMsconcludedthatthe Sunwouldhavemadeanegligiblecontributiontotheobserved globalwarmingbetween1850and2014.
TheIPCC(Masson-Delmotteetal.,2021,AR6page957)ignored thehighsecular-variabilityTSIproxyreconstructionsonthe groundsthattheyrest‘‘onassumptionsaboutlong-termchanges inthequietSunforwhichthereisnoobservedevidence”.However,suchanargumentisquestionablebecausethereisnoexperimentalevidenceforeithersupportingorrejectingthesecular high-variabilityTSIproxyreconstructionssincetheTSIsatellite observationsbeganin1978and,asdiscussedabove,thereiseven disagreementovertheircomposites.
Forexample, LockwoodandBall(2020) concludedthatsolar activityvarieslittle,buttheydidsobyanalyzingtheTSIrecords since1995andbyhypothesizingthatagrandsolarmaximum occurredin1985,asimpliedbythePMODTSIcomposite.However, accordingtotheACRIMTSIcomposite,agrandsolarmaximum mighthaveoccurredduringsolarcycle23,whichbeganinAugust 1996andendedinDecember2008.Also Scafetta(2012a) suggestedthatasolargrandmaximummighthaveoccurredaround 2000usingasolarmodelingbasedontidalforcingfromplanetary harmonics.Ifso,duringsolarcycle23,thederivativeofthemultidecadalmodulationofsolaractivitycouldhavebeenatitsminimum,and,therefore,theTSItrendingfrom1995to2020could underestimatetherangeofthelikelyTSImultidecadalvariations.
Asfurtherdiscussedbelow,understandinghowmuchTSI changesatthemultidecadalandsecularscalesmaynotbesufficientforclimatechangeresearch.Correctlyreconstructingthe actualpatternsoftheTSItime-evolutionisalsoessentialforproperlycorrelatingspecificsolaractivitychangestoobservedclimatechangepatterns,whichcouldbeotherwisemistakenasonlyaproductofthechaoticinternalvariabilityoftheclimatesystem.In fact,theproposedTSIproxymodelsshowcomparablebutnot identicalmulti-decadalpatterns.Asaresult,certainTSIproxy modelsappeartobebettercorrelatedwiththeglobalsurfacetemperaturerecordsthanothers.
Anothersourceofconsiderableuncertaintyisthatsolaractivity doesnotappeartoinfluencetheEarth’stemperaturebyradiative changesalone.ThisisacrucialphysicalfeatureoftheSun-climate relationshipthatmustbeconsidered.Indeed,avastnumberofpaleoclimaticevidencessuggeststhatitistheSun’smagneticfieldthat mostlyregulatestheEarth’sclimate(Easterbrook,2019).
Forexample,cosmicraysareoneexampleofacorpuscularforcingmodulatedbysolarmagneticactivitythathasbeenclaimedto directlymodulatecloudformation(SvensmarkandFriisChristensen,1997;ToddandKniveton,2001;Shaviv,2002; ShavivandVeizer,2003;Kirkby,2007;Svensmarketal.,2016; Svensmark,2022).Changesincloudcoverdirectlyinducedby
somekindofsolar/astronomicalforcingscanhaveasignificant impactonclimatechangebecausethecloudsmodifylocalandglobalalbedos,resultinginmorebrighteningordarkeningperiods (Scafetta,2013a;Hoferetal.,2017;Pfeifrothetal.,2018; Pokrovsky,2019),whichcouldalsoeasilyaltertheatmosphere–oceancirculation.ChangesinUVirradiancearealsoknowntohave achemicalimpactonthestratospherebychangingozoneconcentration,andtheremightbemanyothermechanisms.
Ingeneral,changesinsolaractivityareexpectedtohaveawide rangeofeffectsontheclimatesystembecausetheyalterthespace weatherconditionsaroundtheEarth(Moldwin,2022).Severalof thesemechanismsarestillpoorlyunderstoodandotherscouldstill beunknownand,therefore,theycannotbeincorporatedintothe present-dayGCMs.Thus,thetotalclimaticsignaturecausedby changesintotalsolaractivity(TSA),asopposedtothatcausedby TSIfluctuationsalone,iswhatmatters.
Itisthusevidentthatthesignificantuncertaintyregardingthe realmulti-decadalandsecularchangesinTSI,andthephysical unknownregardingthebroadarrayofSun-climatemechanisms andtheirfeedbacksimplythattheGCMsareunlikelytoaccurately assesstheoverallclimaticimpactofsolaractivitychangesby solelyconsideringTSIradiativeforcing,andevenaspecificonethat wasderivedfromtwolow-variabilityTSIproxymodels.
Furthermore,changesinsolaractivityaffectallclimaticsystems aswell,includingthegreenhousegasconcentrationsintheatmosphere.Forexample,theatmosphericconcentrationofCO2 also variesbecauseitssolubilityintheoceandependsontheseasurfacetemperature,whichisalsomodulatedbysolaractivity changes.However,theIPCC(Solomonetal.,2007;Stockeretal., 2014;Masson-Delmotteetal.,2021)assumedthat,besidewater vaporthatistreatedasaclimaticfeedback,alltheothergreenhousegasvariationsandavarietyofotherclimatefactorsthat couldhaveforcedtheclimatesystemsince1750areentirely anthropogenic.Bydoingso,itispossibletoerroneouslyattribute someofthesolareffectontheclimatetohumans.Somestudies haveevensuggestedthatthefrequencyofearthquakesandvolcaniceruptionsslightlyincreasesassolaractivitydecreases (MazzarellaandPalumbo,1989;Stothers,1989;Herdiwijaya etal.,2014;Bragato,2015;ScafettaandMazzarella,2015).Ifthis isthecase,itmaybenecessarytotakeintoaccountothertypes ofgeophysicalfeedbacksthatcouldfurthermagnifytheeffectof solaractivitychangesontheclimate.Thus,severalclimaticforcingsthattheIPCC(Solomonetal.,2007;Stockeretal.,2014; Masson-Delmotteetal.,2021)assumedtobeindependentofsolar activitychangescould,instead,bepartiallyinfluencedbytheSun itself,andsuchaportion,evenifsmall,shouldbecorrectlyattributedtosolaractivitychanges.
Theunresolvedcomplexityofthephysicalproblemrequires empiricalmethodologiestoassesstheactualsolarcontributionto climatechange.Thishasbeentypicallyattemptedusinganumber ofstatisticaltoolssuchascross-correlations,spectralfilteringand coherencespectralandwaveletanalysis,multi-linearregression analysis,andsoon.Whenthisisdone,strongcorrelationsand coherentpatternsareoftenfoundbetweensolaractivityreconstructionsandclimaterecordscoveringtimeperiodsrangingfrom monthlytomulti-millennialscales(HoytandSchatten,1993, 1997;Cliveretal.,1998;Bondetal.,2001;Kerr,2001;Neffetal., 2001;Fleitmannetal.,2003;Huetal.,2003;ShavivandVeizer, 2003;Scafettaetal.,2004;ScafettaandWest,2006;Kirkby,2007; Eichleretal.,2009;Scafetta,2009,2011;MuftiandShah,2011; Steinhilberetal.,2012;Scafetta,2013a;SoonandLegates,2013; VahrenholtandLüning,2013;Easterbrook,2019;Miyaharaetal., 2018;Connollyetal.,2021;Schmutz,2021;Tariccoetal.,2022; andmanyothers).
TheACRIM-PMODcontroversyonthelong-termTSItrendfrom 1980to2000alsoresultedinadisagreementregardinghowmuch
thechangeinsolaractivitycontributedtotheglobalsurfacewarmingbetween1970and2000(ScafettaandWest,2005,2008,2006; Scafetta,2009).AccordingtoPMOD,onlyanthropogenicactivity couldhavecausedsuchawarming.Onthecontrary,theincreased trendoftheACRIMTSIsatellitecompositesuggeststhattheSun playedaroleinit,whichraisesthephysicalchallengeofevaluating suchacontribution(ScafettaandWest,2008).
Ingeneral,thePMODTSIsatellitecompositeimplies(i)asmall TSImultidecadalvariabilityandtheanthropogenicglobalwarming hypothesis,and(ii)astrongclimatesensitivityresponsetogreenhousegasvariationsandthephysicsalreadyimplementedinthe present-dayGCMsthatpredictalarmingclimateconditionsfor thenearfuture.TheACRIMTSIcomposite,ontheotherhand,suggests(i)alargerTSImultidecadalandsecularvariability,and(ii) thatthesolareffectonclimateneedstobecarefullyinvestigated inordertoaccuratelyassessthenaturalversusanthropogeniccontributionstoclimatechange.Inthelattercase,theanthropogenic contributionmustbemoremoderatethanwhattheGCMsclaim.
Someresearchers’publiccommentsmayevenimplythatthe developmentofthePMODTSIrecordandtheIPCC’scurrent endorsementofitarepartiallymotivatedbypoliticalconcernson theglobalwarmingissue.Forexample,JudithLean(whoin1998 createdthePMODTSIcompositetogetherwithFröhlich)explained that‘‘ThefactthatsomepeoplecoulduseWillson’sresults(the ACRIMTSIcomposite)asanexcusetodonothingaboutgreenhouse gasemissionsisonereasonwefeltweneededtolookatthedata ourselves”(Lindsey,2003).Also Zacharias(2014) demonstrateda similarpoliticalbiaswhenconcludedthat:‘‘AconclusiveTSItime seriesisnotonlydesirablefromtheperspectiveofthescientific community,butalsowhenconsideringtherisinginterestofthe publicinquestionsrelatedtoclimatechangeissues,thuspreventingclimateskepticsfromtakingadvantageofthesediscrepancies withintheTSIcommunityby,e.g.,puttingforthapresumedsolar effectasanexcuseforinactiononanthropogenicwarming”.
Inconclusion, Matthesetal.(2017) proposedthatclimate researchshouldonlyuseasolarforcingmadewithlowsecularvariabilityTSIproxyreconstructions(NRLTSI2andtheSATIRE) doesnotappeartobeappropriate.SuchproxymodelsdonotrepresenttheentirescientificliteratureonthistopicandtheyimplicitlyassumecorrectthePMODTSIcomposite,whichis questionable.Severalscientificteamshaveclaimedthatsolar activityhaschangedsignificantlymore(HoytandSchatten, 1993;WillsonandMordvinov,2003;Shapiroetal.,2011; Egorovaetal.,2018;Scafettaetal.,2019;Schmutz,2021;Penza etal.,2022).EachTSIproxymodelcapturesdistinctaspectsof observedchangesinsolaractivity.Allofthemshouldbetheoreticallyconsideredandallofthemcouldbeimportantforclimate studiesaswell.Infact, Connollyetal.(2021) providedabroader overviewoftheongoingdebateonsolaractivityanditsimpact onclimatechange,arguingthatthecontributionoftheSuntoclimatechangesignificantlydependsonthesolarandclimatic recordsspecificallyusedfortheanalysis.
Herein,inadditiontotheCMIP6GCMs’specificlow-variability TSIrecord,themostcomplementary,significant,andeasilyaccessibleTSIproxymodelsfrom1700to2022arealsoadopted.These modelsarecharacterizedbylowandhighmulti-decadalandsecularvariability(Fig.2).IcombinethemtocreatethreenovelmultiproxyTSArecordsthat,whilenotperfect,areexpectedtoprovidea morebalancedassessmentofthevariationsinsolaractivity reportedinthescientificliterature.
Lastly,Iuseabasicenergybalancemodelcalibratedusingadifferentialmulti-linearregressionanalysistoassesstheeffectiveness oftheproposedTSArecordsinmodelingavarietyofglobaland oceansurfacetemperaturerecordsfrom1850to2020,together withtheanthropogenicandvolcaniccomponents.Theproposed methodologyisinspiredbyandimprovesontheauthor’spast
research(ScafettaandWest,2005,2006;Scafetta,2009)andon thoseofotherresearchers(e.g.: Soonetal.,2000;LeanandRind, 2008,andothers).AcomparisonwiththeTSIforcingfunctionused bytheCMIP6GCMsisalsoexamined.
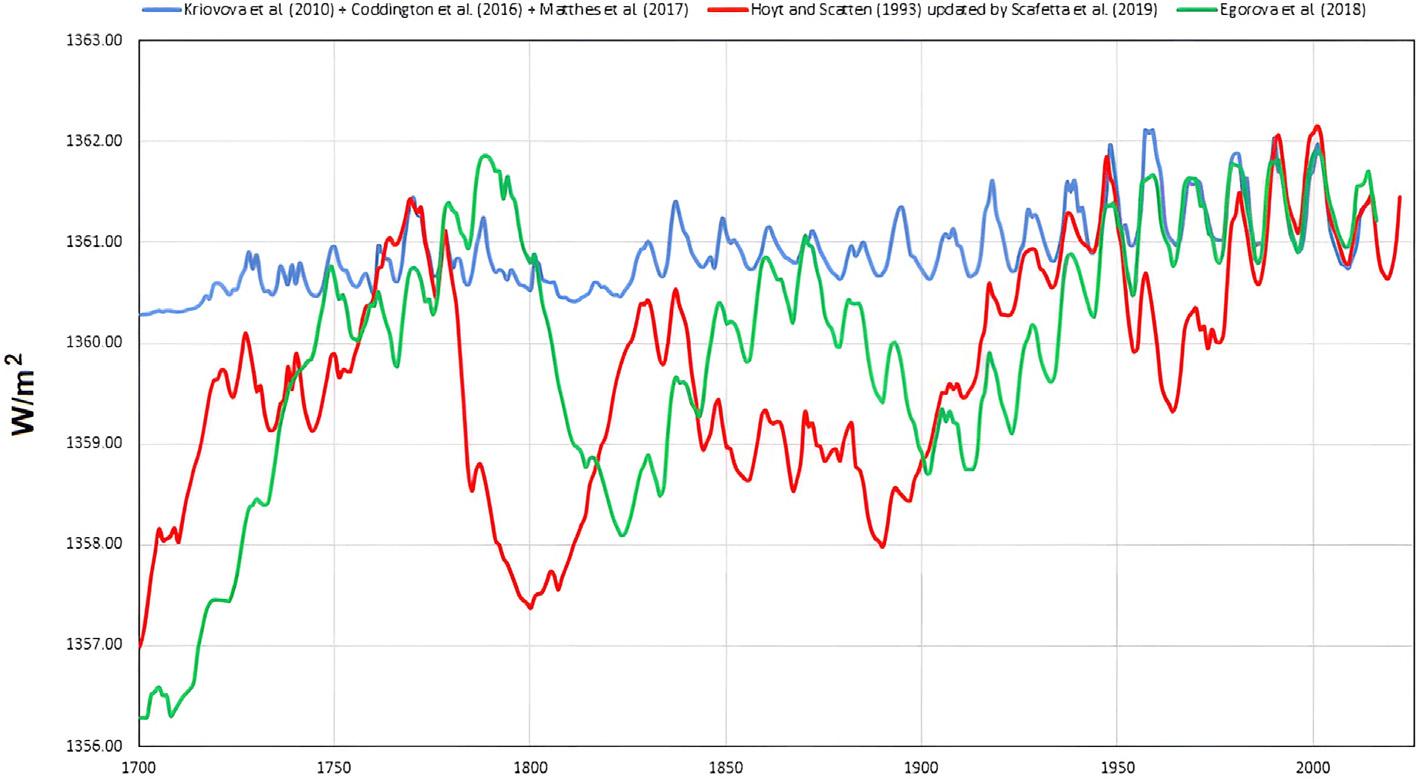
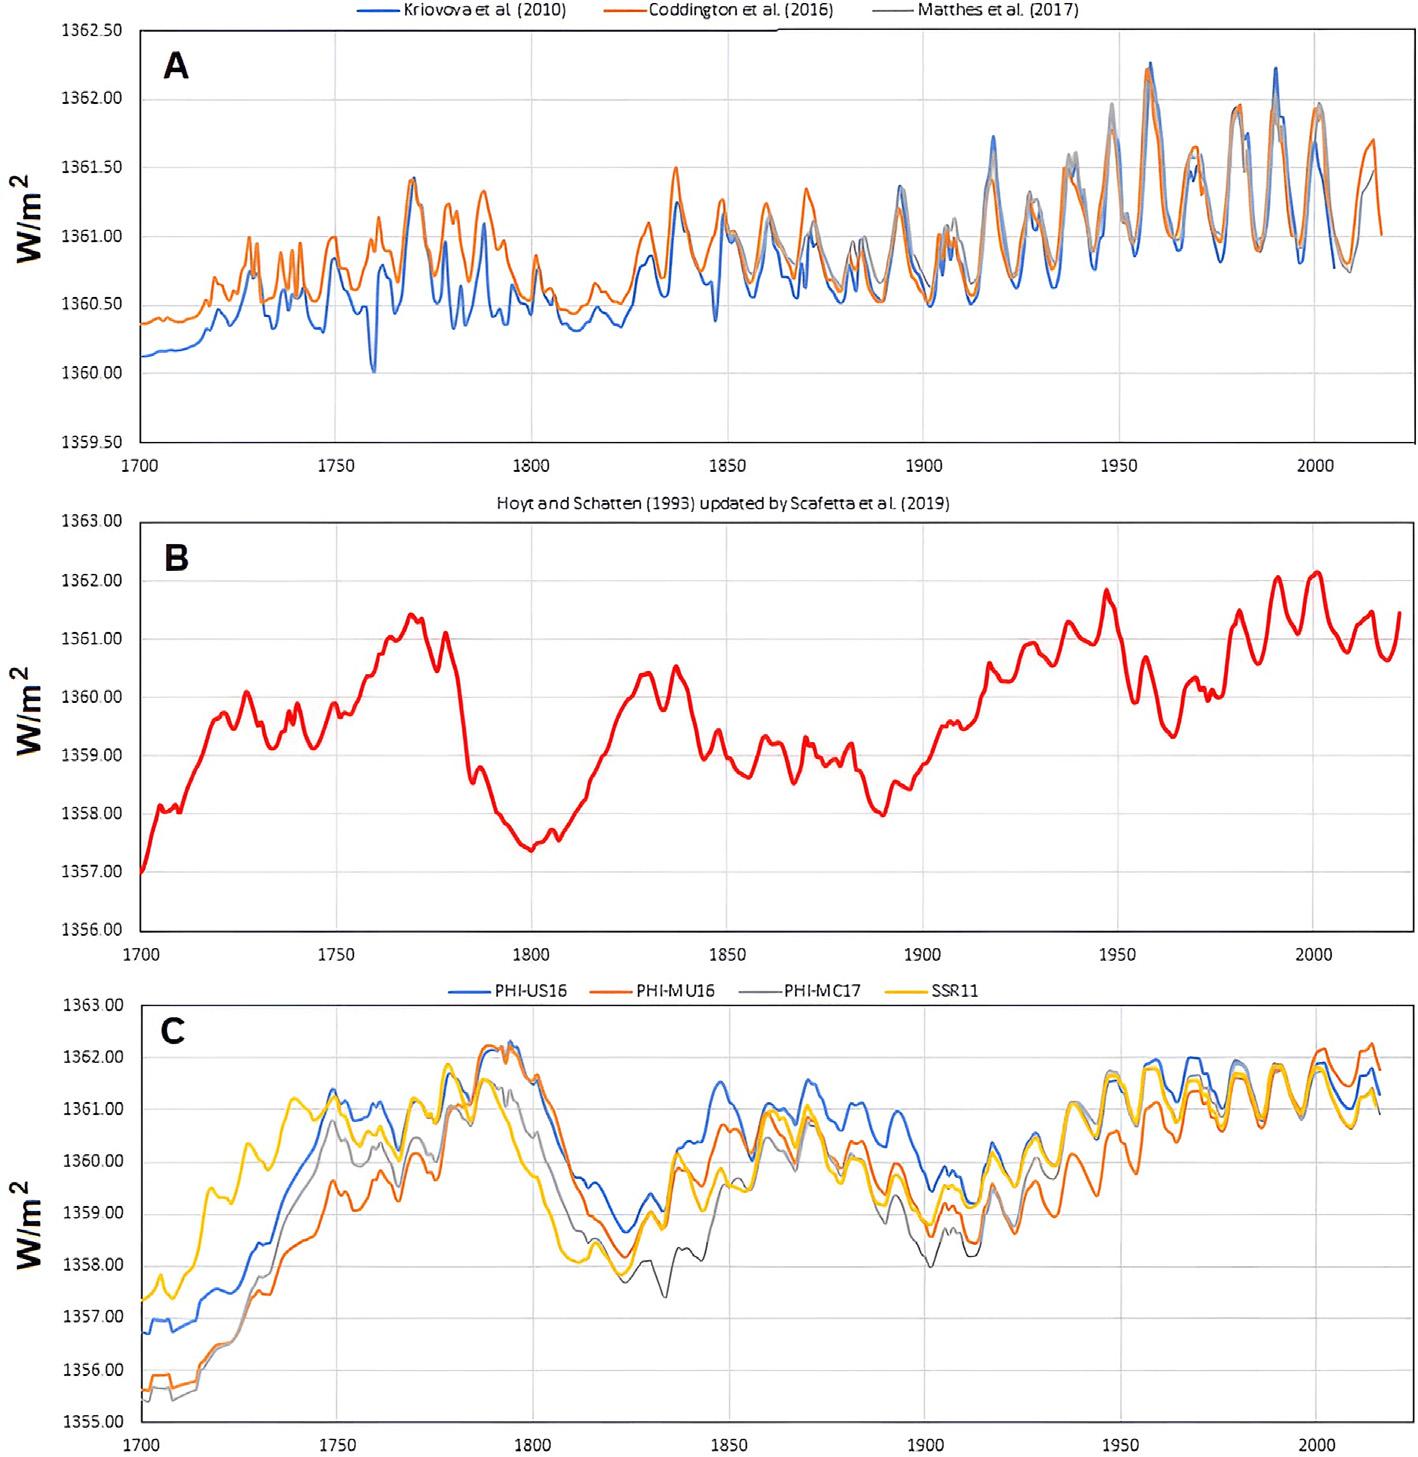
ThreenovelTSIproxyrecordsfrom1700to2022werecreated usingeightTSIrecordsproposedintheacademicliterature(Fig.2) thatarecommonlyusedalsoforclimatechangestudies.Three recordshavelowmultidecadalvariability(Krivovaetal.,2007, 2010;Yeoetal.,2015;Coddingtonetal.,2016;Matthesetal., 2017)(Fig.2A).Onerecordwasproposed30yearsagoby Hoyt andSchatten(1993) usingspecificsolarconstructorsandpresents ahighmultidecadalandsecularvariability.ThisTSIrecordwas recentlyextendedwiththeACRIMTSIsatellitecomposite (Fig.2B)(ScafettaandWillson,2014;Scafettaetal.,2019).Other fourTSIrecordswereproposedby Egorovaetal.(2018),presenting ahighmultidecadalandsecularvariability(Fig.2C).Inthefollowing,allrecordsarerescaledtotheACRIMTSIsatellitecomposite meanfrom1981to2001.Thesetwoyearsrepresentthemaxima ofsolarcycles21and23.Asaresult,theTSIaveragefrom1981 to2001issetto1361.41W/m2 forallthefollowingTSIrecords.
Matthesetal.(2017) developedtheirTSImodelbymerging NRLSSI2(Coddingtonetal.,2016)andSATIRE(Krivovaetal., 2010;Yeoetal.,2015)TSImodels.TheoriginalTSIrecordsrange from1700to2015,however,therecordprovidedby Matthes etal.(2017) beginsin1850liketheCMIP6GCMsimulations.Thus, theTSIrecordrepresentingthelowmultidecadalvariabilityoption andthePMODTSIsatellitecompositeishereinmadeoftheTSI recordby Matthesetal.(2017) linearlycombinedwiththeaverage oftheothertworecordsfrom1700to1850.ThethreeoriginalTSI recordsareshownin Fig.2A.
TheTSIrecordrepresentativeofahighmultidecadalvariability withtheACRIMTSIcompositeismadeoftheoriginalTSIproxy modelby HoytandSchatten(1993) extendedwiththeACRIM TSIsatellitecomposite(WillsonandMordvinov,2003)from1980 to2012,theaveragebetweenVIRGO-PMOD(Fröhlich,2012)and SORCE-TIM(KoppandLean,2011)TSIsatelliterecordsfrom 2013to2019,andbetweenPMODandTSIS(Richardetal.,2020; Coddingtonetal.,2021)recordsfrom2020to2022.ThisTSIrecord isdepictedin Fig.2Bandisprovidedin SupplementaryData TableS1 intheSupplement.
AveragingthefourTSIreconstructions(PHI-US16,PHI-MU16, PHI-MC17,andSSR11)proposedby Egorovaetal.(2018) provides thethirdTSIrecordrepresentativeoftheseotherhighmultidecadalvariabilitymodels.Thesedataarebasedalsoonacombinationofcosmogenic 10Beand 14Cabundancerecordsthatare moredirectlyconnectedwithcosmicrayfluxes.
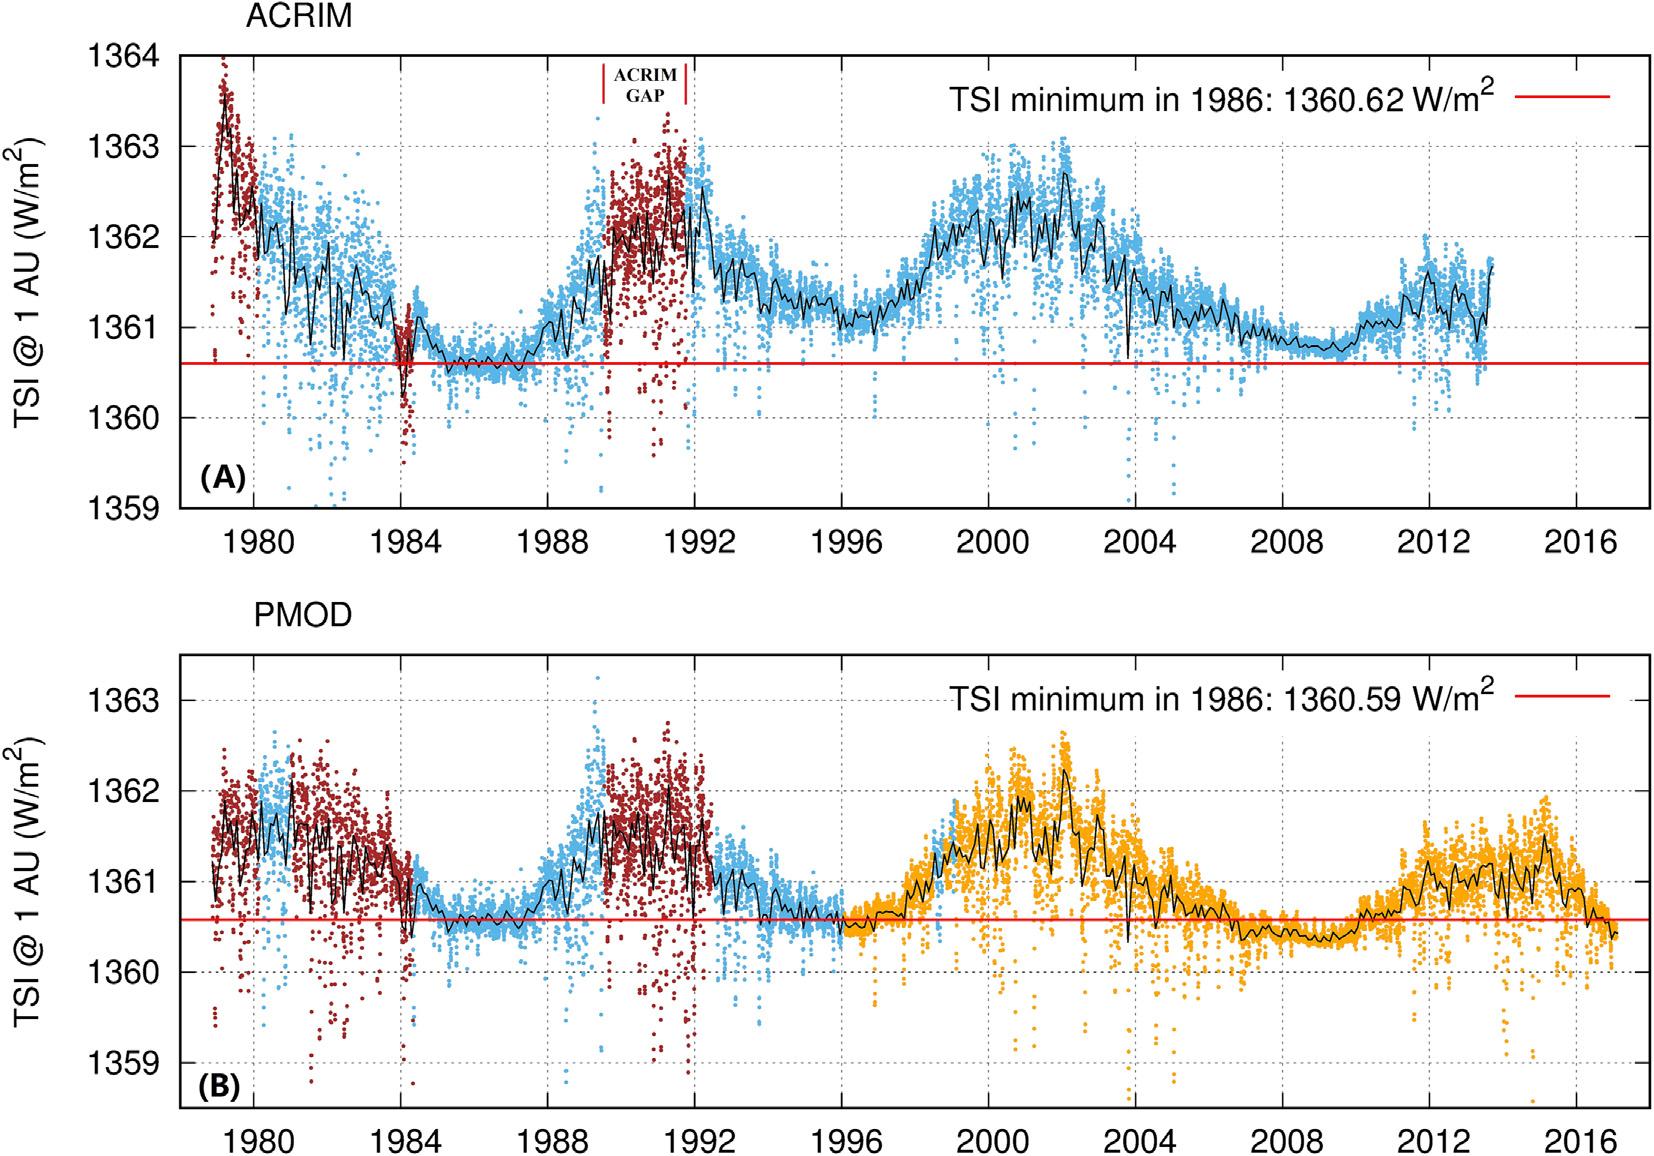
Fig.3 comparesthethreeproposedTSIaveragerecordsdiscussedabove.Severaldifferencesbetweenthemcanbeobserved. Inparticular,thegreencurvepresentsapeakinthe1870s,which isnotclearlyobservedintheothertwocurves;theredcurvepresentsapeakin1945–1950whilethebluecurvepeaksaround 1960;theredcurvealsoclearlyincreasedfromthe1970sto 2000,whichisnotclearlyobservedintheothertwocurves.
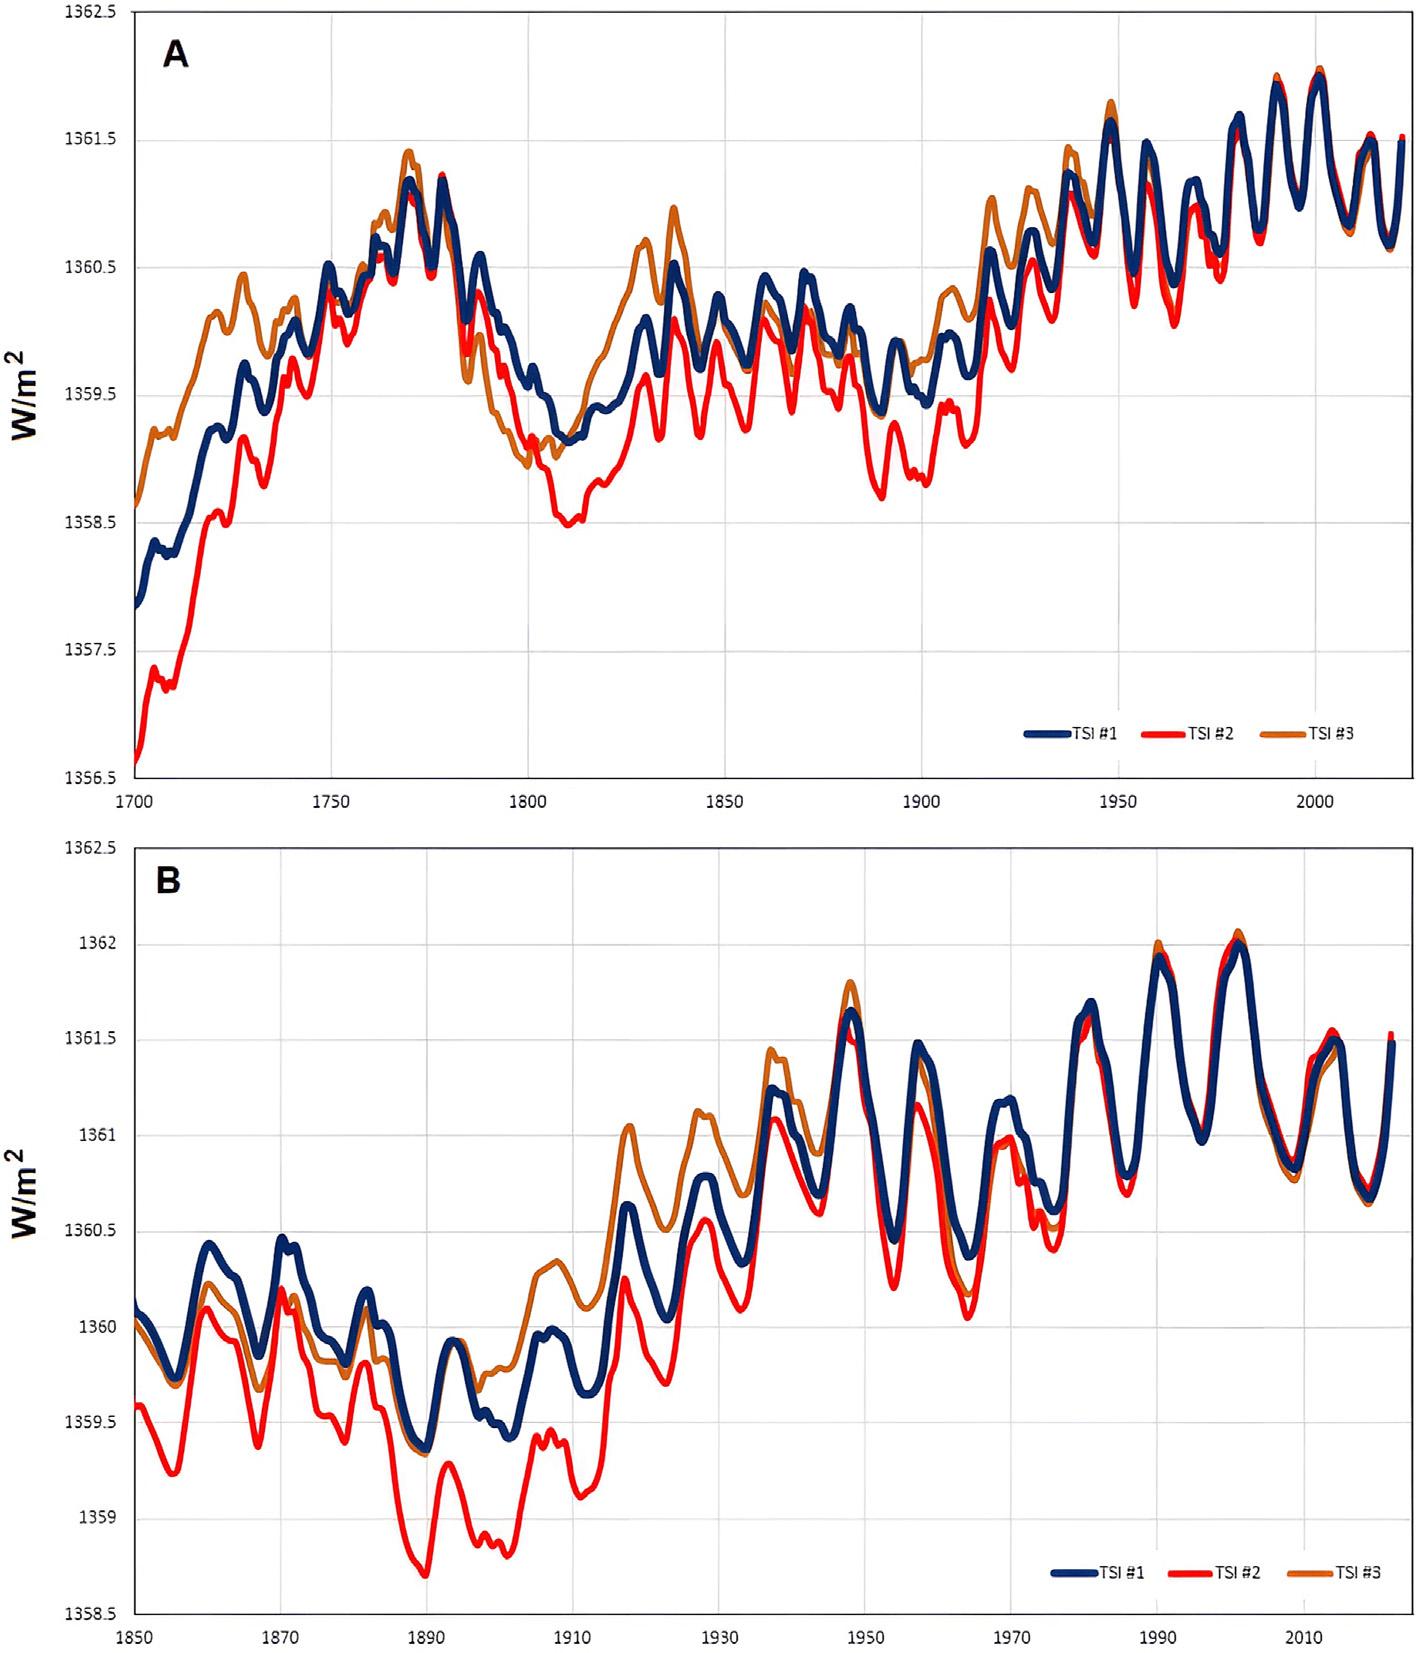
Fig.4 depictsthethreeproposed‘‘balanced”multi-proxyTSI reconstructions:modelTSI#1wasmadebyaveragingallthree TSIrecords(blue,greenandredcurves)displayedin Fig.3;model TSI#2ismadebyaveragingthegreenandredrecords;andmodel TSI#3ismadebyaveragingtheblueandredrecords.Thesesolar modelsarereportedin SupplementaryDataTablesS2,S3andS4 From1980to2020,thethreeTSIrecordsdisplayedin Fig.4 roughlyreplicatethetrendsoftheCommunity-ConsensusTSI satellitecompositeproposedby deWitetal.(2017)
Fig.2. TSIreconstructions:(A)Lowmultidecadalvariability(after Krivovaetal.,2010;Coddingtonetal.,2016;Matthesetal.,2017);(B)highmultidecadalvariabilitywith ACRIMandothersatelliteTSIrecordssince1980(SupplementaryDataTableS1)(after HoytandSchatten,1993;Scafettaetal.,2019);(C)highmultidecadalvariability(after Egorovaetal.,2018).
Inthefollowingsections,IhypothesizethattheproposedTSI solarmodelsalsorepresentidealTSArecords,althoughstill expressedinTSIunits.Essentially,itissupposedthatTSAcanbe representedbyafunctionthatislinearlyrelatedtotheproposed TSIproxyfunctions.
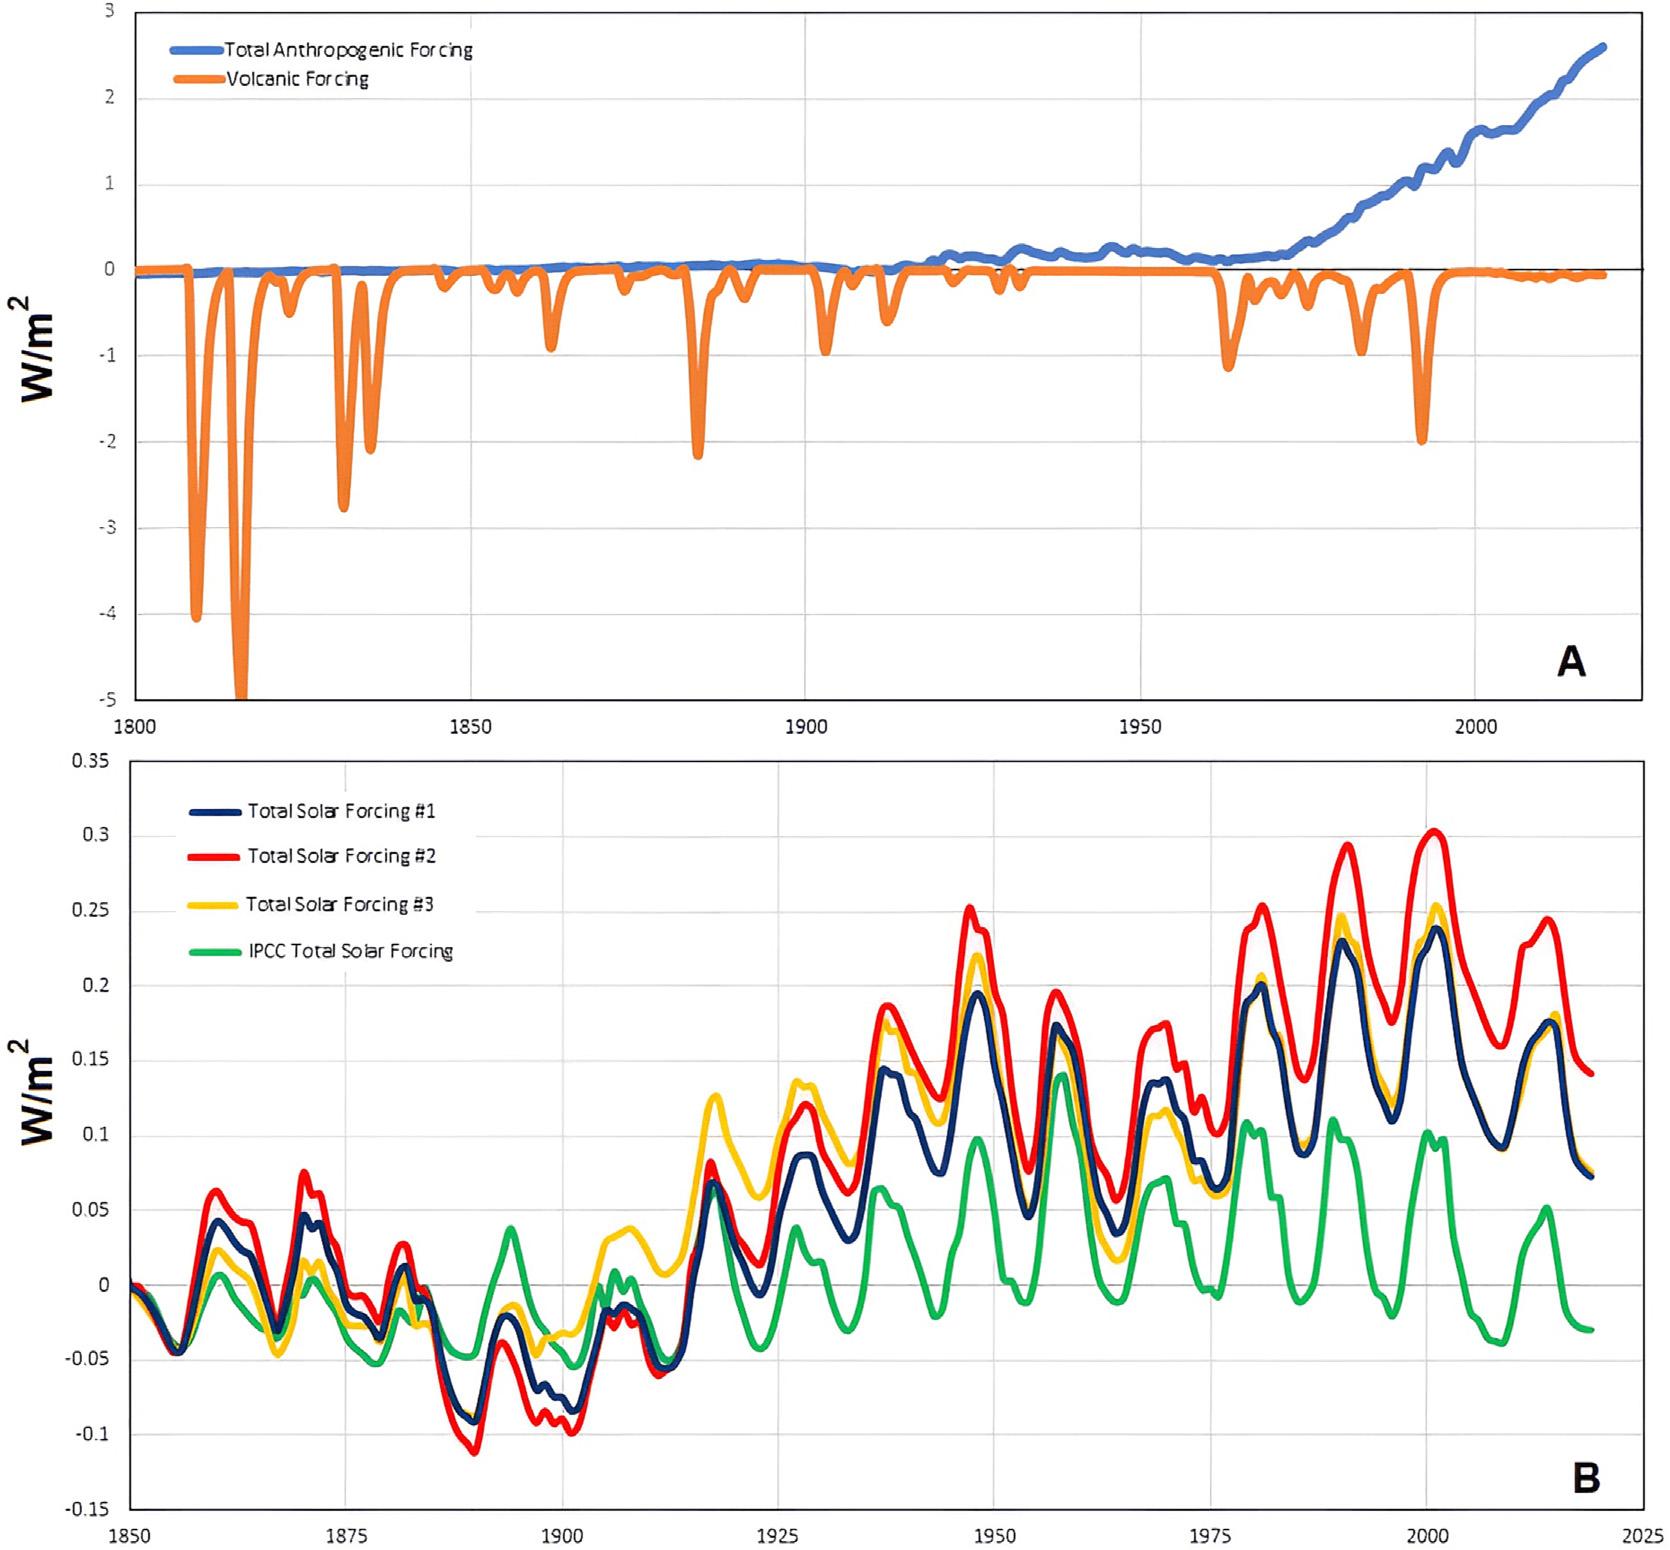
Fig.5AdepictstheanthropogenicandvolcaniceffectiveradiativeforcingfunctionsusedbytheCMIP6GCMs,whicharereported intheAnnexIIIoftheIPCC-AR6tablesofhistoricalandprojected
well-mixedgreenhousegasmixingratiosandeffectiveradiative forcingofallclimateforcing(Masson-Delmotteetal.,2021).These recordsarereportedin SupplementaryDataTableS5
ThesolareffectiveradiativeforcingfunctionusedbytheCMIP6 GCMsisshownin Fig.5B(greencurve). Fig.5Balsodepictsthe threeproposedbalancedsolarforcingfunctionsderivedfromthe TSIrecordsshownin Fig.4 (SupplementaryDataTableS5).All recordsarescaledbythestandardfactorof0.5/4=0.125,where 0.5isthepercentageofsolarradiationthatreachesthesurface, whichconsidersthemeanalbedoandtheatmosphere’ssolarlight absorption,and4istheratiobetweentheareaoftheEarthand thatofthediskoftheincomingsolarradiationfluxatthetopof theatmosphere.AlldepictedTSIrecordsrangefrom1850to 2019andareanomaliesrelativetotheir1850values.
Thesolarforcingfunctionsdepictedin Fig.5Bdifferinseveral respects.Justaverymodestseculartrendcanbeseenforthesolar forcingfunctionusedbytheCMIP6GCMs,whichhasremained nearlyconstantforabout200years.Althoughnotdepictedin Fig.5B,theTSIforcingadoptedbytheCMIP6GCMsissoflatthat eventhe1790–1830Daltongrandsolarminimumalmostcoincideswiththe1890–1910solarminimumandthe2019solarcycle minimum(SupplementaryDataTableS5).Furthermore,because
thisrecordisalsobasedonSATIREandthePMODTSIsatellitecomposite,itssolareffectiveforcingfunctiondecreasedprogressively from1970to2020.Thus,byusingthisTSIrecord,theCMIP6GCMs couldonlyconcludethatsolarforcingdidnotaccountforalmost anyofthewarmingobservedafterthepre-industrialperiod (1850–1900),and,particularly,from1980to2020(MassonDelmotteetal.,2021).
Onthecontrary,theotherthreeTSIrecordsrevealamultidecadaloscillationaswellasaclearincreasingseculartrend fromtheDaltonsolarminimumto2000.Morespecifically,they suggestthattheTSIforcingsignificantlyincreasedfromthe Daltonminimum(1810–1815)toaround1870–1876,then declineduntilaround1890–1905; itincreasedrapidlybetween 1910andthe1940s,anddeclinedagainbetween1950and 1975.TheTSIforcingthenincreasedagainuntil2000,whenit begantograduallyfalluntil2022.Thisoscillatingpatternis especiallynoteworthybecause,asdemonstratedbelow,itis closelycorrelatedwiththechangesobservedintotalsurface temperaturerecords,whichsh owaverysimilarincreasing trendandmulti-decadalmodulation(cf.:
Scafettaetal.,2004; ScafettaandWest,2006,2008;Scafetta,2009;Scafetta,2010, 2012b,2013a,2021b ).Fig.5. (A)Anthropogenic(blue)andvolcanic(orange)effectiveradiativeforcingfunctionsadoptedbytheCMIP6GCMs(Masson-Delmotteetal.,2021).(B)Comparison betweenthesolareffectiveradiativeforcingfunctionfromTableAnnexIIIoftheIPCC-AR6(green)(after Masson-Delmotteetal.,2021)andthethreeTSIforcingfunctions deducedfromtheTSIrecordsshownin Fig.4.Allrecordsareanomaliesrelativetotheirvaluesin1850.(Forinterpretationofthereferencestocolourinthisfigurelegend,the readerisreferredtothewebversionofthisarticle.)
4.Modelingglobalandseasurfacetemperaturerecords
Theglobalandseasurfacetemperature(SST)recordsare hereinmodeledbyusingasimple1-Denergybalancemodel ( Scafetta,2009 ).Itisassumedthateachtemperaturerecord,T (t),ismadeofthreecomponents—TA(t),TV (t),andT S (t)—generatedbytheanthropogenic,volcanicandsolarforcings—FA (t), F V (t),andF S (t)—plusotherfastfluctuations n (t)(e.g.,theENSO), whicharehereinconsideredasrandomnoiseandarenotreconstructedbytheproposedmodel.Forsimplicity,theanthropogenicandvolcanicforcingsaresupposedtobeindependent ofthesolarforcing,which,asdiscussedintheintroduction, shouldslightlyunderestimatet hesolarcontributiontoclimate changes.
Thus,T(t)issupposedtobegivenbytheEq. (1)
Alltheabovefunctionsaresupposedtobeanomaliesrelativeto t0 =1850,thatis,itisassumedthatT(t0)=0 CandF(t0)=0W/m2. TA(t)isexpectedtobemonotonicallyincreasing,TV(t)isexpected tobemadeofspikesthatoccasionallycooltheclimateforafew years(Thompsonetal.,2009;Marshalletal.,2020),andTS(t) shouldpresentsacomplexmodulationthatisalsotrending upward.
T(t)issupposedtovaryintimeaccordingtothefollowingdifferentialEq. (2)
dTtðÞ dt ¼ kFtðÞ F 0 ðÞ ½ TtðÞ T 0 ðÞ ½ s ; ð2Þ whereF(t)theradiativeforcingand s isthecharacteristictime responseofthesystemtoaradiativeperturbation.Eq. (2) assumes thatthetemperatureandforcingfunctionsareexpressedasanomaliesrelativetogivenreferencevalues,andtheequationcanbesimplifiedbyassumingT(0)=0 CandF(0)=0W/m2
Theeffectiveheatcapacityofthesystem,whichincludesthe oceanbufferingeffect,maybethoughtofasbeingrepresented bythesystemresponsetime s.Thecoefficientkrepresentsthe sensitivityofthesystematequilibriumperunitofradiativeforcing because,asEq. (2) implies,forastepforcingincreaseequaltoF (t)=1W/m2 thetemperatureT(t)ofthesystemmustrisebyk toreachthenewthermalequilibrium.
Eq. (2) ishereinusedinitsdiscreteform.Thus,foreachforcing, thefunctionsarecomputedwiththeEqs. (3)–(5):
ThecoefficientskA,kV andkS aretheclimaticsensitivitiesassociatedwithanthropogenic,volcanicandsolarforcings,respectively.Thecharacteristictimeresponse s issupposedtobethe sameforallforcings.Itcouldalsobenoticedthattheclimatesystemcouldbecharacterizedbyseveralcharacteristictime responses(Scafetta,2008,2009),buthereinthiscomplicationis ignored.Finally, Dtistheintegrationtimeinterval.
TheEqs. (3),(4)and(5)describe,infirstapproximations,how thetemperatureofasystemwithagivenheatcapacitychanges intimeifexternallyperturbedbyagivenradiativeforcing.
Asanticipated,Eqs. (2) impliesthata DFstepincreasecauses thesystemtoreachanewequilibriumtemperaturecharacterized byachangeequalto DT=k DF.Thus,sinceadoublingofatmosphericCO2 concentrationfrom280ppmto560ppmamountsto aforcingof DF 2 CO2 =3.7W/m2 (Rahmstorf,2008),thequantity
solarwindforcing,othermagneticandsolar-relatedinterplanetary corpuscularforcings,andothers.Asaresult,changesinTSAmay haveafarstrongeroverallimpactontheclimatethantheTSIforcingalone.ArealisticGCMshouldaccountforallSun-climateinteractionstoproperlyassesstherealroleoftheSuninclimate change.
Inthisscenario,theproposedTSIproxyforcingfunctionsare viewedasgeneralizedTSAfunctions.Thus,thesolarinputfunction isnolongeranactualradiativeforcingbutratherafunctionthat representsTSA,albeititisstillrepresentedinradiativeunits.Eq. (5) automaticallyconsiderstheTSIfunctionsasTSAproxieswhen kS isallowedtodifferfromtheclimatesensitivities,kA =kV,tothe anthropogenicandvolcanicradiativeforcings.
Morespecifically,itisassumedthat
ECS ¼ DT 2 CO2 ¼ kA DF 2 CO2 ¼ 3 7 kA
ð6Þ iswhatiscommonlydefinedasthe‘‘equilibriumclimatesensitivity”(ECS).Thealternativeclimatesensitivedefinitionknownas ‘‘transientclimateresponse”(TCR)isgivenbythewarminginduces byincreasingtheatmosphericCO2 concentrationat1%peryear untilitdoubles.Thismeanstocalculatethewarminginducedby aradiativeforcingfunctionthatlinearlyincreasesintimeasF (t)=3.7t/70W/m2 fromt=0tot=70years,whichcanbeeasily calculatedbyintegratingEq. (3):
TCR ¼ 3 7 kA 3 7 70 kA s 1 e 70=s < ECS
7Þ
TCRissmallerthanECSduetoits‘‘transient”nature.BelowIdiscuss twowaysofdoingthecalculations.
Theanthropogenic,volcanic,andsolarforcingscanbeassumed tobephysicallyequivalent,implyingthattheclimatesystem respondstotheminthesamewayasradiativeforcings.GCMsprocessclimateforcingsinthismannerbecauseallforcingsaresupposedtoberadiative.Thus,kAVS =kA =kV =kS andEq. (2) canbe directlyusedas
aAVS F AVS t ðÞ b Tt Dt ðÞ ð8Þ where aAVS =kAVS/s, b =1/s,and Dt=1year.Thetworegression parametersofEq. (8), aAVS and b,canbecalculatedusingamultilinearregressionalgorithmbecausethefunctions H(t),T(t),andFAVS(t)=FA(t)+FV(t)+FTSI(t)areknown.
Finally,thetemperaturesignatureinducedbythetotalforcing canbecalculatedbyintegratingtheequation
wherecisaconstant.Consequently,byusinginEq. (5),FS =(1+c) FTSI,IgetkS =(1+c)kAV / kAV,wherekAV =kA =kV isthesensitivity totheradiativeforcingalone.
Thus,theEqs. (3)–(5)canbecombinedasEq. (11)
pogenicandvolcanicradiativeforcing,whiletheScomponentevaluatestheroleplayedbytheTSAchanges.
Eq. (11) canberewrittenasEq. (12)
H t ðÞ¼ aAV F AV t ðÞþ aS F TSI t ðÞ b Tt Dt ðÞð12Þ whereFAV(t)=FA(t)+FV(t).Thethreefreeparameters aAV =kAV/s, aS =kS/s,and b =1/s ofEq. (12) canbeevaluatedbyusinga multi-linearregressionalgorithmbecausethefunctions H(t),T(t), FAV(t),andFTSI(t)areknown.Inthiscase, aAV = aA = aV – aS and kAV =kA =kV – kS.
Oncetheregressioncoefficientsaredetermined,TA(t),TV(t),and TS(t)canbeevaluatedbyrecurrentintegrationsas
4.2.Case2:Solarforcingphysicallydiffersfromanthropogenicand
Theclimate’sresponsetoTSAchangesincludes,butitlikely doesnotequal,thattoTSIchangesalone.Infact,asmentioned intheIntroduction,TSIforcingislikelyonlyoneofthesolarmechanismsinfluencingtheclimateoftheEarth.Changesinsolaractivitycouldaffecttheclimatesystemthroughseveralcorrelated mechanisms,includingTSIforcing,UVforcing,cosmicrayforcing,
where
t =1yearistheintegrationtime-step.Thetemperaturesignatureinducedbythethreecomponentsis
ThemodelECSis3.7 aAV/b becauseitisdefinedasafunctionof radiativeforcingalone.However,itisalsopossibletodefinethe quantity3.7 aS/b thatmustbeinterpretedasaformof‘‘proxy” ECSbecauseitisrelativetoTSAchangesalbeitgiveninTSIproxy units.Asaresult,theratio aS/aAV illustrateshowmuchgreater influencetheTSAinputhasontheclimatethanjusttheTSIeffect alone.
4.3.Comments
Eq. (12) mightbeextendedfurtherbyseparatingthevolcanic andanthropogenicforcings,butitisunclearwhytheclimatesensitivityshoulddifferbetweenthem.Consequently,kA andkV canbe treatedasequal.
ItshouldbeagainnotedthataportionofFAV(t)couldbeafeedbacktothesolarforcingFS(t).Thus,thesolarsignatureobtained fromtheproposedmulti-linearregressionalgorithmmaypartially underestimatethetruesolareffectontheclimatebecauseapor-
tionofthesolarsignaturecouldbeembeddedinsideTAV(t)= TA(t)+TV(t). Connollyetal.(2021) attemptedtoaccountforthis partialdependencyoftheanthropogenicandvolcanicforcingson thesolarforcingbyfittingthetemperaturerecordswiththesolar recordfirst,ratherthanusingasimultaneousregressionofthe solarandanthropogenic/volcaniccomponents,asdonehere.However,theirmethodologycouldbeproblematicbecauseofthe collinearity,althoughmodest,betweenthesolarandanthropogenicconstructorssincetheybothtrendupfrom1900to 2020.Thus,theiralgorithmwouldmaximizethesolarcontribution relativetotheanthropogeniconeand,thus,overestimatingit.
Actually,thislimitationwasexplicitlyacknowledgedby Connollyetal.(2021) onpage52oftheirpaperandwaslateralso highlightedin RichardsonandBenestad(2022)’scritique. Scafetta (2013b) demonstratedthatthecollinearityproblembetweenthe solarandanthropogenicforcingscanonlybesolvedbyanalyzing atleast1000-year-longtemperaturerecords(fromtheMedieval WarmPeriodtotheCurrentWarmPeriod)becausebothsolarand temperaturerecordsshowamillennialcyclethatisnotpresentin theanthropogenicforcingrecord.Byusingsuchamethodology, Scafetta(2013b) showedthatabouthalfofthewarmingfrom 1900to2020couldbeassociatedwithsolaractivitychangesusing theproxytemperaturemodelproposedby Mobergetal.(2005) and theavailableglobalsurfacetemperaturerecordssince1850.
Theabovecomplexitiesarehereignored,andthetwoconstructors,FAV(t)andFS(t),areassumedtobephysicallyandgeometricallysufficientlyindependentofeachotherandareprocessed concurrentlybythemulti-linearregressionalgorithm,although, aspreviouslyexplained,inthiswaythesolareffectmaystillbe partiallyunderestimatedbecauseaportionofFAV(t)couldbephysicallygeneratedbyTSAchanges.
Theproposedmethodologyupgradespreviousworksbythe author(ScafettaandWest,2005,2006;Scafetta,2009)andadopts differentialmultilinearregressionalgorithms(Eqs. (8) and (12) by takingintoaccountthattheforcingfunctionsshouldbeprocessed bysomekindofclimatemodel,evenaverysimpleoneasEq. (2) proposes,beforetheycanbeusedastemperatureconstructorsin amulti-regressionalgorithm.Infact,oneoftheregressioncoefficients, b =1/s,isrelatedtothecharacteristictimeresponseof theclimatesystem,whichisadynamicalfeatureofthesystem. Thus,theproposedmethodologycorrectsthesimplisticmultiregressionmethodologiesusedinotherstudies(Douglassand Clader,2002;GleisnerandThejll,2003;Connollyetal.,2021; RichardsonandBenestad,2022),inwhichtheradiativeforcing functionsthemselves,oreventheirgeneratingfunctions,areerroneouslyconsideredtorepresentdirectregressionconstructorsof thetemperaturerecord.Infact,iftheforcingfunctionsarenotlinearlyrelatedtotheirtemperaturesignatures,anylinearsuperpositionofthemisphysicallyinappropriate,or,atleastnotoptimal,for representingtheirassociatedtemperaturechanges.
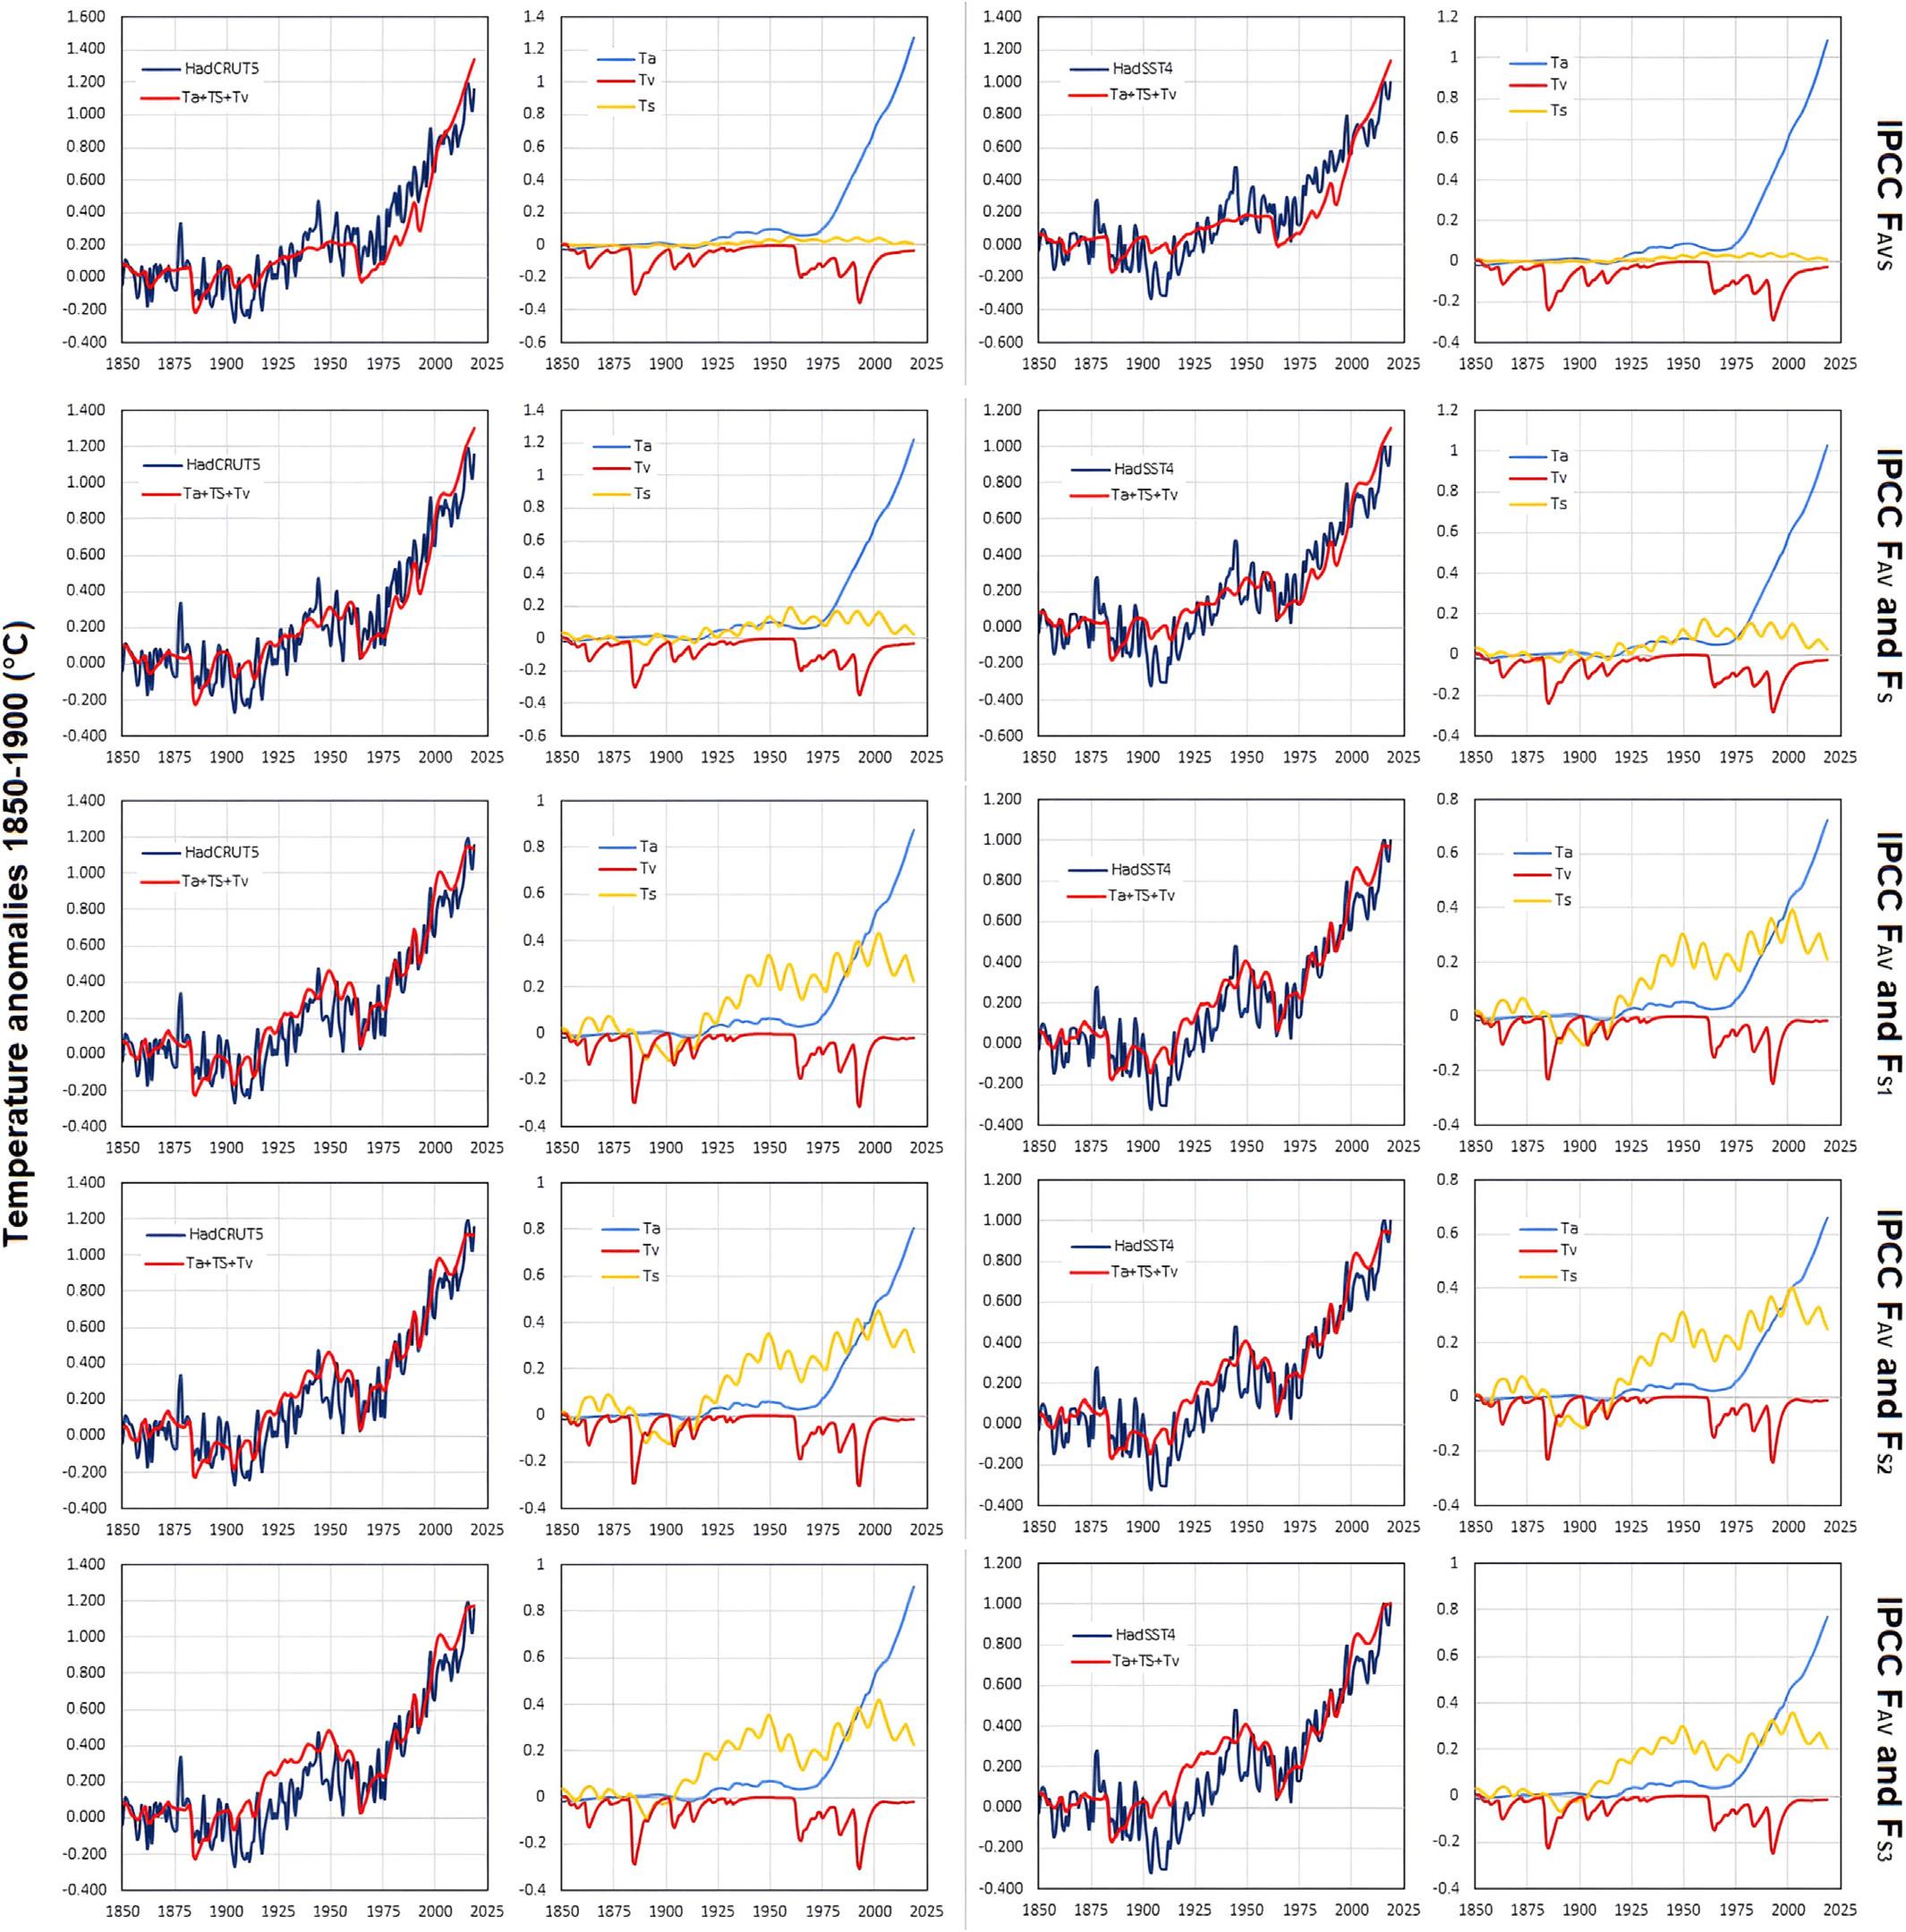
Thehindcastsofthemulti-linearregressionanalysisusingEqs. (8)and(12) areshownin Figs.6and7,andreportedin Table1.The procedureisrepeatedforfourclimaticrecords:twoglobalsurface temperaturerecordsHadCRUT4(Moriceetal.,2012)andHadCRUT5(non-infilleddata)(Moriceetal.,2021),andtwoglobal seasurfacetemperaturerecordsHadSST3(Kennedyetal.,2011a, b)andHadSST4(Kennedyetal.,2019)(SupplementaryData TableS6).Thelatterareusedalsobecausethelandrecordscould besignificantlyaffectedbynon-climaticwarmbiasesdue,for example,toinsufficientlycorrectedurbanheatisland(UHI)trends (Connollyetal.,2021;Scafetta,2021a,2023a,b);thus,theSST recordscouldprovideanalternativeevaluationofthesensitivities.
Thefirstlineof Figs.6and7 showtheresultsofEq. (8) withthe anthropogenic,volcanic,andsolarforcingfunctionsemployedin theCMIP6GCMs.IftheSunonlyactsontheclimatesystem throughtheTSIchangesproposedby Matthesetal.(2017),nearly allofthewarmingobservedfrom1850to1900to2020isdueto anthropogenicforcingbecausethesolarcontributiontothe observedglobalandseasurfacetemperaturerecordsisextremely small.Infact,theSuncouldhavecontributedonlyabout2%–3% ofthewarmingfrom1850–1900to2010–2019.Thisisalsowhat theIPCCadvocates(Solomonetal.,2007;Stockeretal..,2014; Masson-Delmotteetal.,2021).
Theanalysismadeusingtheglobalsurfacetemperaturerecords, HadCRUT4(Moriceetal.,2012)andHadCRUT5(Moriceetal.,2021), suggestthatthelikelyvalueoftheactualECScouldbebetween 1.4 Cand2.8 Cwithameanof2.1 C,whichroughlycorresponds towhathasbeenfoundinotherstudies(LewisandCurry,2018; Scafetta,2021c,2022,2023a,2022; Lewis,2023)andwouldagree withtheCMIP6GCMsthatpredictanECSbetween1.8 Cand 3.0 C.ThecalculationsmadeusingHadSST3(Kennedyetal., 2011a,b)andHadSST4(Kennedyetal.,2019)suggestanECSvalue between1.1 Cand2.4 Cwithanaverageof1.75 C.
Thepanelsonthefirstlineof Figs.6and7 alsoshowthatthe modeledtemperatureTAVS(t)reconstructslessthanhalfofthe warmingobservedfrom1900to1945,whichwasnearlyasstrong asthatobservedbetween1970and2000(Scafetta,2010,2013a; Loehle,2014),despitetherelativelylowanthropogenicforcingpresentinthefirsthalfofthe20thcentury.Indeed,thewarmingfrom 1900to1950ispoorlyreproducedbytheGCMs(Scafetta,2012b, 2013a),implyingthatthesemodelseitherusedanincorrectsolar forcingfunctionorareunabletoreproduceanimportantquasi 60-yearnaturaloscillationoftheclimatesystem(Scafetta,2010, 2012b,2013a,2013c;LoehleandScafetta,2011;Wyattand Curry,2013;Loehle,2014).
Althoughhereinnotshowninanyfigureortable,thesame analysiswasrepeatedbysubstitutingtheGCM-adoptedTSIforcing withthethreebalancedTSIrecords.Thesolareffectwasfoundto beapproximately3–4timeslargerthanintheformercase,while theanthropogeniccontributiondiminishedbyabout10%.Using theglobalsurfacerecords,theECSloweredalittlebit,andwasestimatedtobe1.85±0.6 C.ECSwasestimatedtobe1.55±0.6 C usingtheseasurfacetemperaturerecords.Byadoptingthenew proposedTSIrecordsshowingalargersecularvariability(Figs.4 and5B),iftheSuninfluencestheclimatesystemthroughTSI changesalone,itcouldhavebeenresponsibleforroughly10%,or less,ofthewarmingfrom1850–1900to2010–2019.Thus,substitutingtheTSIforcingoftheGCMswiththenewoneswouldonly slightlymitigatetheIPCC’sconclusionthatnearlyallwarming observedfrom1850to2020wascausedbyhumanactivity.However,onlytheCMIP6GCMswiththelowestECSwouldstillbecompatiblewiththedataaccordingtotheproposedmodelling.
Thesecondlineof Figs.6and7 showstheresultsobtainedwith Eq. (12) processedwiththeanthropogenic,volcanic,andsolarforcingfunctionsusedbytheCMIP6GCMs.Inthissecondscenario,the solarforcingfunctionissupposedtobeaproxyforTSAchanges. Thus,itisassumedthattheclimatesensitivitykS candifferfrom theclimatesensitivitytoradiativeforcingalone,whichisgiven bykAV =kA =kV.
Theclimaticsignatureoftheanthropogenicforcingwasfound tobe5%–15%smallerthaninthescenarioinvestigatedin Section5.1,whereasthesolarsignaturewasfoundtobesubstantially bigger.kS wasfoundtobe4.3±2.5and5.0±3.0timesgreaterthan
kAV usingtheglobalandseasurfacetemperaturerecords, respectively.
ThisresultsuggeststhatmostoftheSun’sinfluenceontheclimatecouldbecausedbymechanismscomplementarytotheTSI forcingalone.Thisalsoimpliesthat,byassumingthattheSun’s roleislimitedtoTSIradiativeforcingalone,theGCMsareexpected todrasticallyunderestimatethesolareffectonclimatechange.
Insuchascenario,theECSwasfoundtobealittlebitlowerthan determinedin Section5.1:1.95±0.6 CforHadCRUT4andHadCRUT5,and1.6±0.6 CforHadSST3andHadSST4.Thus,alsointhis case,thesolarclimaticsignaturewouldbestillmodestrelativeto theanthropogenicone,asthefiguresshow.However,onlythe
5.3.CMIP6GCMsanthropogenicandvolcanoforcings,thethree ‘‘balanced” TSIrecordsandadditionalsolareffects
Thepanelsinthethird,fourth,andfifthlinesof Figs.6and7 showtheresultsofEq. (12) withthethreebalancedTSIrecords depictedin Fig.4B,togetherwiththeanthropogenicandvolcanic effectiveforcingfunctionsusedbytheCMIP6GCMs.
Inthisscenario,thesolarcontributiontoclimatechangeis foundtobesubstantiallylargerthaninthecasesanalyzedin Sec-
 CMIP6GCMswiththelowestECSwouldbecompatiblewiththe data.
tions5.1and5.2.Furthermore,theproposedTSIinputfunctions providetemperaturesignaturesthatmorecloselymatchthesurfacetemperaturerecords:seethevaluesreportedinthecorrelationlinein Table1
Thesolarandclimaticrecordsshowaconsistentlyincreasing trendandavirtuallysynchronousmultidecadalmodulation.Both functionsapproximatelyrisefrom1850to1880,declinefrom 1880to1905,considerableincreasefrom1910tothe1940s,moderatelydeclinefrom1950to1975,andagainincreasefrom1980to 2000.Between2000and2014,anthropogenicwarmingappearsto havebeenoffsetbythecoolingcausedbythe11-yearsolarcycle
minimum.Thepeakofsolarcycle24,whichoccurredbetween 2012and2014,appearstohavecontributedtothetemperature risebetween2015and2020,togetherwithsomeanthropogenic warming.Thistemperaturerisewasfurtherstressedbytwostrong El-Niñoevents,asbettershownin Fig.8Band8B’.Infact,theestimatedtimeresponse s is3–4years.Thissuggeststhattheminimumbetweensolarcycles24and25(whichoccurredin December2019),mayhavebeenresponsiblefortheslightglobal coolingobservedfrom2016to2022. Scafetta(2021b) showeda similarresultusingaharmonicmodeloftheglobalsurfacetemperaturerecord.
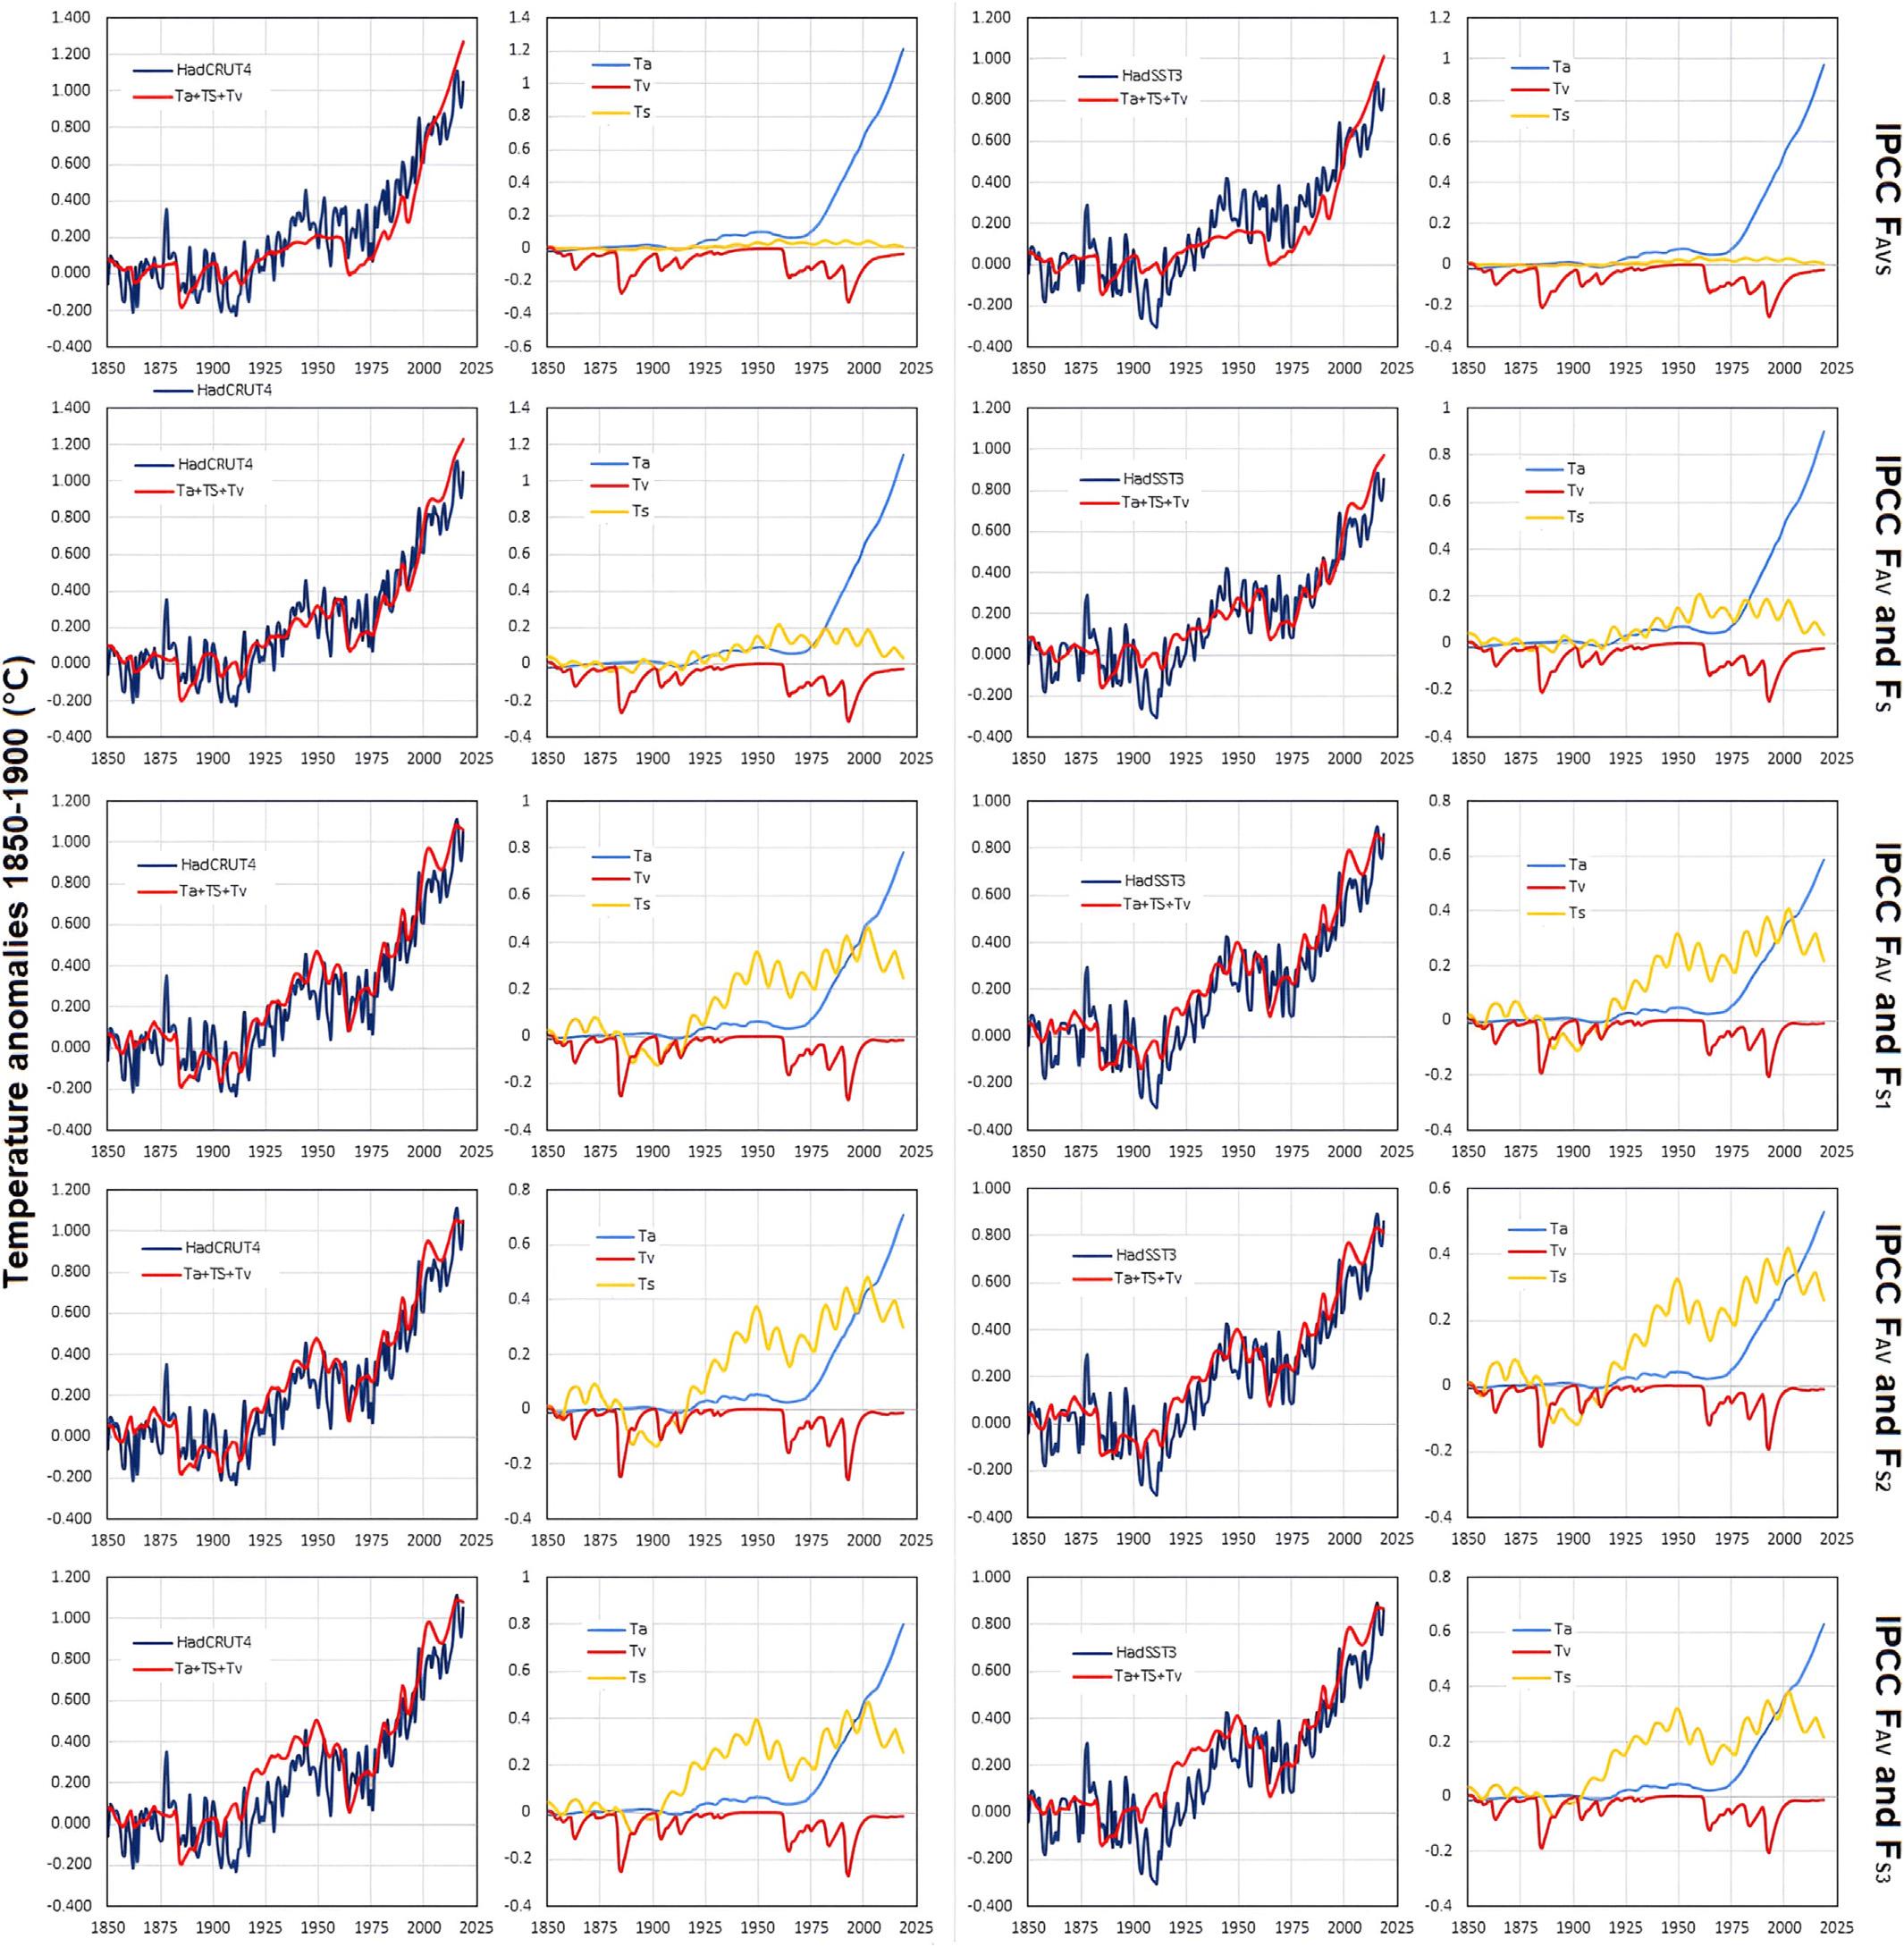
Table1
EvaluationofthemultilinearregressionparametersofEqs. (8)and(12).The‘‘IPCCForcings”columnassumesEq. (8) andthetotaleffectiveforcingFAVS(t)=FA(t)+FV(t)+FS(t)as providedbytheIPCC(after Masson-Delmotteetal.,2021).TheotherfourcolumnsassumeEq.(12),theeffectiveforcingFAV(t)=FA(t)+FV(t)asprovidedbytheIPCC(after Masson-Delmotteetal.,2021),andthefoureffectivesolarforcingsdepictedin Fig.5B.Thecharacteristictimeresponseofthesystemis s =1/b.ECSis3.7kA =3.7 aA/b and3.7 kS =3.7 aS/b isthe‘‘proxy”equilibriumclimatesensitivitytosolaractivitychangesrelativetotheadoptedTSIproxy;TCRvaluesarecalculatedusingEq. (7).Finally,thecoefficient ofcorrelationbetweenthetemperaturerecordandthemodeledtemperaturerecord,TAVS(t)=TA(t)+TV(t)+TS(t),isgivenbycorr.
Table1 alsoreportsthePearsoncorrelationcoefficients betweentheactualtemperaturerecordsandthemodeledtemperaturerecords,TAVS(t)=TA(t)+TV(t)+TS(t).Thehighestcorrelation coefficientsarefoundfortheTSIproxymodels#1and#2,indicatingthatthe Matthesetal.(2017) lowsecular-variabilityTSIrecord, whichwasusedintheCMIP6GCMsandwhoseweightislargerin theTSIproxymodel#3,couldbearatherpoorchoiceforreconstructingthemulti-decadalclimaticpatternsseenintheglobal andseasurfacetemperaturerecords.
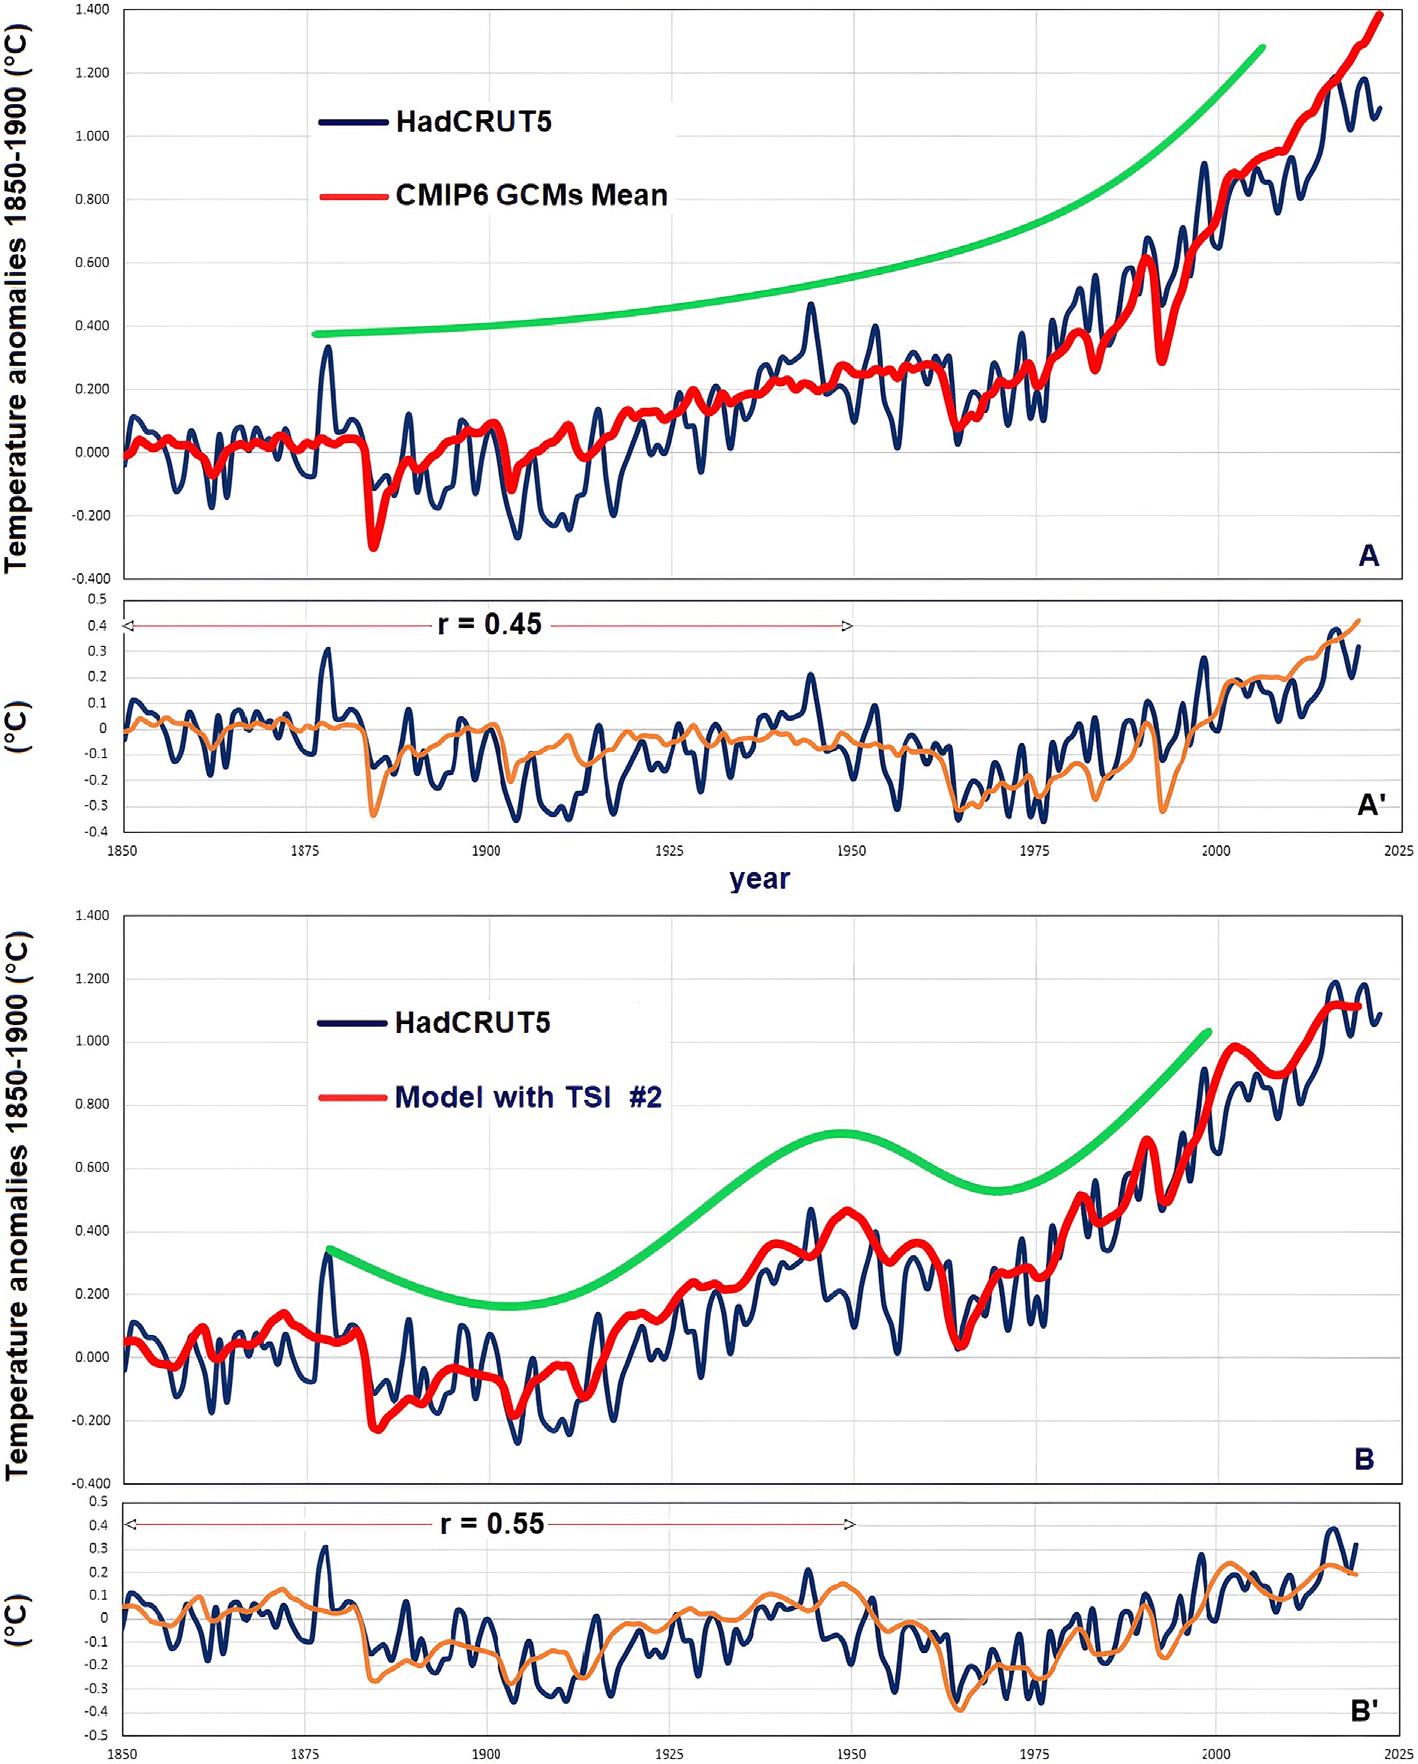
Fig.8 comparestheHadCRUT5globalsurfacetemperature recordto(A)theCMIP6GCMensemblemeanrecordand(B)the energybalancemodel(Eq. (16))usingtheproposedTSIproxy model#2,whichdoesnotusetheGCMs’lowsecular-variability TSIrecord.TheGCMsimulationdepictedin Fig.8Amonotonically warmsup,althoughoccasionalvolcaniceruptionsmomentarily causecoldspikes;themonotonicwarmingtrendproducedby themodelissimulatedbythegreencurve.Onthecontrary,the modelprovidedin Fig.8Bindicatesanoscillatingpatterndevelopingaroundawarmingtrend.Theglobalsurfacetemperature recordshowsasimilargrowingtrend,regulatedbyanapproximately60-yearoscillation:theperiod1880–1910experienceda globalcooling;theperiod1910–1940wascharacterizedbyconsiderablewarming;andtheperiod1940–1970experiencedanother
globalcooling.From1880to1970,themodelin Fig.8Breproduces thisoscillatingpatternmoreprecisely(corr.coeff.r=0.79)than theCMIP6GCMensembleaveragesimulationdepictedin Fig.8A (corr.coeff.r=0.74).Thus, Fig.8 illustratesthatthesuggested model(redcurve, Fig.8B)exhibitsamultidecadalmodulationthat correlatessignificantlybetterwiththetemperaturerecord(blue curve)thantheGCMensembleaveragesimulation(redcurve, Fig.8A).
ThedifferentperformanceoftheCMIP6GCMensembleaverage simulationandoftheproposedregressionmodelinreproducing thetemperaturepatternfrom1850to1950becomesmoreevident ifaquadraticupwardtrendisdetrendedfromtherecords.Thecorrelationcoefficientisr=0.45usingtheGCMensembleaverage simulation(Fig.8A’),andr=0.55usingtheproposedregression model(Fig.8B’).Thisresultsuggeststhattheobservedmultidecadalmodulationofthetemperaturerecordscouldhavebeen mostlydeterminedbysolarforcings,andnotbychaoticinternal oscillationsoftheclimatesystem.
Additionally,alsofrom2000to2020themodelindicatedbythe redcurvein Fig.8BreproducesthetemperaturerecordmorecloselythantheGCMredcurvein Fig.8A.Infact, Fig.8Ashowsthat theCMIP6GCMsimulationrapidlywarmsup,whereas Fig.8B showsthatthemodeledtemperaturepresentsastandstillbetween
(A)HadCRUT5globalsurfacetemperatureversustheCMIP6GCMensembleaverage;(A’)thetworecordsaredetrendedwiththefunctionf(t)=a(x 1850)2.(B) HadCRUT5globalsurfacetemperatureversustheenergybalancemodel(Eq. (16))usingtheTSIproxymodel#2;(B’)thesameasabove.Thegreencurvesin Fig.8AandBare sketchesthathighlightthedifferentmulti-decadalmodulationoftheredcurvesin Fig.8A(monotonicallyincreasing,liketheanthropogenicforcingfunction)andin Fig.8B (oscillating,likethetemperaturerecords).(Forinterpretationofthereferencestocolourinthisfigurelegend,thereaderisreferredtothewebversionofthisarticle.)
2000and2014beforerisingagainsince2016(duetothewarming causedbythe11-yearsolarcyclemaximumbetween2012and 2014andastrongEl-Niñoevent),whichisapatternthatbetter correlateswiththetemperaturerecord(bluecurve).
Relativetothescenariodiscussedin Section5.1,theECSdrops by45%fromarangeequalto1.4–2.8 Cwithameanof2.1 C,toa rangeequalto0.8–1.8 Cwithameanof1.2 CusingtheHadCRUT4andHadCRUT5records.WhentheHadSST3andHadSST4 recordsareutilized,theECSdecreasesfrom1.1 Cto2.4 Cwith ameanof1.75 C,to0.6–1.6 Cwithameanof1.0 C.
Thus,ECSsignificantlydecreases(by40%–50%)bysimplysubstitutingtheTSIrecordusedintheCMIP6GCMswiththeproposed balancedTSIrecordsandbyusingthelatterasTSAproxies.The foundnewECSrangeissignificantlylowerthantheonereported byallCMIP6GCMs,whichrangesbetween1.8 Cand5.7 C (Masson-Delmotteetal.,2021;Scafetta,2023a).Asaresult,the CMIP6GCMsarefoundtosignificantlyoverestimatetheinfluence ofanthropogenicforcingwhilefailingtorevealthetrueimpactof solaractivitychangeontheclimate.ThisismostlybecausetheSun
likelyinfluencestheclimatethroughavarietyofmechanisms, someofwhicharenotdirectlyrelatedtoTSIforcingalone.
Theanalysisalsorevealsthat,especiallyafter1950,whenthe solarcycleisstronger,thepeak-to-troughamplitudeoftheestimatedtemperaturesignatureforthe11-yearsolarcycleisaround 0.1 C.Actually,manyempiricalstudies(DouglassandClader, 2002;LeanandRind,2008;ScafettaandWest,2008;Shaviv, 2008;Scafetta,2009)wouldagreewiththishindcast,whichwas alsoacknowledgedbytheIPCC(Solomonetal.,2007,p.674).By contrast,whenestimatedasin Section5.1,thesamecyclehasa peak-to-troughamplitudeof0.02–0.03 C,whichiswhatisgenerallyhindcastedbytheGCMs(Scafetta,2013b)andbyenergybalancemodelsthatassumethattheSunonlyaffectstheclimateby meansofTSIforcingalone.
Lastly,thekS/kA ratiofortheseasurfacetemperaturerecordsis 10%–20%greaterthanfortheglobalsurfacetemperaturerecords. Thisfindingimpliesthattheglobalsurfacetemperatureonland maybewarm-biasedduetocontaminationfromurbanheatand othernon-climaticwarmingmechanisms(ScafettaandOuyang,
2019;Connollyetal.,2021;Scafetta,2021a,2023a).Infact,ifnonclimaticwarmbiasesarenotproperlycorrected,theclimaticsensitivitytoanthropogenicradiativeforcingkA wouldbeoverestimatedrelativetokS
TheSunprovidesalmostalltheenergythatwarmstheEarth’s surface.Changesinitsactivityareexpectedtocorrelatewith changesintheEarth’sglobalsurfacetemperature.Suchastrong correlationhasbeenobservedbyseveralauthors(Eddy,1976; HoytandSchatten,1997;SvensmarkandFriis-Christensen,1997; Bondetal.,2001;Kerr,2001;DouglassandClader,2002;Kirkby, 2007;Eichleretal.,2009;Scafetta,2009;Steinhilberetal.,2012; VahrenholtandLüning,2013;Svensmarketal.,2016;Miyahara etal.,2018;Easterbrook,2019;ScafettaandWillson,2019; Connollyetal.,2021;Schmutz,2021;Svensmark,2022).Nonetheless,therearemanyunansweredquestionsandambiguitiesabout howandtowhatextentchangesinsolaractivityinfluencetheclimate.Usually,empirically-basedstudiesfindthatsolaractivity changeshaveaconsiderableclimaticimpact,whilststudiesbased onpresent-daycontemporaryGCMssuggestthattheSun’sroleis modest.ThedichotomybetweenempiricalandGCM-basedstudies isverychallenginganditiscrucialforcorrectlyinterpretingclimatechange.
SeveralTSIproxymodelshavebeendeveloped(Hoytand Schatten,1993;Krivovaetal.,2007,2010; Steinhilberetal., 2012;Coddingtonetal.,2016, 2021; Egorovaetal.,2018; Matthesetal.,2017;Wuetal.,2018;Penzaetal.,2022,and others),andtheTSIsatellitecompositessince1978havebeendisputed(WillsonandMordvinov,2003;Dewitteetal.,2004; Fröhlich,2009;deWitetal.,2017).Furthermore,changesinsolar activityarenotlimitedtototalluminosityoutputs,whichdefine theTSIvariable,butalsoincludevariationsinspectrumfrequencies(e.g.,UVvariesdifferentlythanvisiblelight),magneticactivity variations,solarwindvariations,andmodulationoffluxesofgalacticcosmicraysandinterplanetarydust.Solaractivitychangesalter thespaceweathersurroundingtheEarth(Moldwin,2022)andcan influencetheclimatesystemthroughoutavarietyofphysical mechanismssuchasdirectTSIforcing,directcloudsystemmodulation,stratosphericozonelayermodulation,globalatmospheric andoceaniccirculationmodulation,biospheremodulation,and soon.
TheIPCC(Solomonetal.,2007;Stockeretal.,2014;MassonDelmotteetal.,2021)conclusionthattheSun’sroleinclimate changehasbeennegligiblesincethepre-industrialperiod(1850–1900)derivesfromthefactthatthisorganizationonlyconsider thesolarclimaticsignatureproducedbythepresent-dayGCMs. Thesemodels,however,arecomputerprogramsthatcanonly employequationsdescribingphysicalmechanismsthatarealready wellknown.Anythingunknownorambiguouscannotbeincluded intheGCMsoftware.Iftheclimaticinfluenceofneglectedphysical processesissignificant,thereductionistapproachemployedinthe GCMsforassessingclimatechangeattributionsmaybeseverely inappropriateforthetask.
Furthermore,theCMIP6GCMsusedtheTSIsolarforcingfunctionproposedby Matthesetal.(2017),whichexhibitsaverymodestmultidecadalandsecularvariability,and,consequently, concludedthatanthropogenicemissionsaccountfornearlyallof theobservedglobalwarmingsincethepre-industrialperiod (1850–1900).Thus,accordingtotheIPCC,solaractivityvariations havebeenirrelevantforreproducingtheobservedglobalsurface temperaturechangesofthelast150years(Masson-Delmotte etal.,2021).
However,itcannotbeignoredthatseveralempirically-based studieshavefoundarobustassociationbetweenvariationsinsolar activityandclimaterecordsthroughouttheHoloceneatmultiple timescales(Eddy,1976;HoytandSchatten,1997;Svensmark andFriis-Christensen,1997;Bondetal.,2001;Kerr,2001; DouglassandClader,2002;Kirkby,2007;Eichleretal.,2009; Scafetta,2009;Steinhilberetal.,2012;VahrenholtandLüning, 2013;Svensmarketal.,2016;ScafettaandWillson,2019; Connollyetal.,2021;Schmutz,2021;Svensmark,2022; Easterbrook,2019;andmanyothers).
Indeed,theTSImodelusedbytheCMIP6GCMsisnottheonly TSIrecordavailableinscientificliterature.ThereareadditionalTSI proxyreconstructionsthatshowadistinctmodulationandasignificantmultidecadalandsecularvariability(HoytandSchatten, 1993;ScafettaandWillson,2014;Egorovaetal.,2018;Scafetta etal.,2019).StudiesonSun-likestars(Judgeetal.,2020),the ACRIMTSIsatellitecomposite(WillsonandMordvinov,2003; Scafettaetal.,2019),whichisbasedontheactualpublishedTSI satelliteobservationsfrom1978to2013,andothertypesofsolar modelingbasedonplanetarytidalforcingappeartosupportthem (Scafetta,2012a,2014;ScafettaandBianchini,2022).
Iproposedtoreplace Matthesetal.(2017)’s TSIproxymodel withthreenewTSIproxyrecordsbasedondifferentpairingsof themostpopularlowandhighsecular-variabilityTSIproxymodelscurrentlyavailable:see Fig.3.Thesedatasetswereinterpreted asTSAfunctionsandclimateforcingsinasimpleenergybalance modelthatwascalibratedusinganoveldifferentialmulti-linear regressionanalysismethodology,whichcouldinfirstapproximationassesstheclimaticinfluenceofTSAchangesandtheirimportancerelativetoTSIforcingalone.Thekeyfindingswerethe following.
(i)IftheTSIforcingusedbytheCMIP6GCMsisadoptedandthe climatesystemisassumedtobesolelysensitivetoradiativeforcings,theproposedmodelingconfirmstheIPCC’sconclusion (Masson-Delmotteetal.,2021)thatanthropogenicemissions accountforsubstantiallyalloftheobservedglobalwarmingsince thepre-industrialperiod(1850–1900)andthatchangesinsolar activityarepracticallyirrelevant.Inthisscenario,theECSwasestimatedtobe2.0±0.7 C(byaveragingtheresultsobtainedwiththe fouranalyzedtemperaturerecords),whichroughlycorrespondsto whathasbeendiscoveredbysomerecentstudies(LewisandCurry, 2018;Scafetta,2021c,2022,2023a;Lewis,2023).Thisrangeis roughlycoveredbytheCMIP6GCMswithECSbetween1.8and 3.0 C.Underidenticalphysicalconditions,iftheTSIforcingis replacedwiththethreebalancedTSIfunctions,theSuncouldhave contributednomorethan10%oftheobservedwarming.Asa result,ineithercase,TSIforcingdoesnotappeartohaveasignificantinfluenceonclimatechange.Todoso,TSIsecularvariations shouldbedemonstratedtobesubstantiallylargerthanwhatiscurrentlyshownevenbythehighsecular-variabilityTSIproxymodels,asrecentlysuggestedby Schmutz(2021).
(ii)IftheTSIforcingadoptedbytheCMIP6GCMsisemployed, butitissupposedtorepresentaproxyforTSAchangesthatmight influencetheclimateinavarietyof(knownandunknown)ways, theproposedmodelingimpliesthattheTSAimpactontheclimate couldbe4.3±2.5timesbiggerthantheTSIeffectalone.Thisfindingimpliesthatmostofthesolareffectonclimatecouldbecaused bymechanismsotherthanTSIforcingalone.Possiblecandidates arecorpuscularforcingsmodulatedbysolarmagneticactivity(cosmicrays,solarwind,etc.)orsomeotherkindofcorpuscularforcing (e.g.interplanetarydustfluxes)modulatedbyplanetaryresonances(whichmayalsosynchronizesolaractivitychanges)that coulddirectlyinfluencethecloudsystem(SvensmarkandFriisChristensen,1997;Shaviv,2002;Svensmarketal.,2016;Scafetta etal.,2020;Svensmark,2022).Inthisscenario,theECSisfound tobeonlyslightlysmallerthaninthepreviouscase,onaverage
1.8±0.6 C,becausetheadoptedsolarrecord(Matthesetal.,2017) hasaverysmallmulti-decadalandsecularvariability,whichisalso poorlycorrelatedwiththeclimaticrecords.
(iii)Ifthesolarrecordby Matthesetal.(2017) isreplacedwith thethreeproposedbalancedTSIforcingfunctions(see Fig.4),and thesefunctionsareassumedtobeproxiesforTSAchangesthatcan influencetheclimateinvarious(knownandunknown)ways,the proposedmodelingsuggeststhatthesolartotalimpactontheclimatecouldbe4–7timesgreaterthanitsTSIeffectalone.Solar activitychangescouldhaveaconsiderableclimaticimpactthat couldbealmostcomparablewiththeanthropogeniccomponent (comparetheyellowandbluecurvesin Figs.6and7).Moreover, themodeledtemperaturehindcastsarebettercorrelatedwithglobalandseasurfacetemperaturerecords. Figs.6and7 alsodemonstratethatthesolarmodels#1and#2(SupplementaryDataTables S2andS3)outperformthemodel#3(SupplementaryData TableS4),whichgivesmoreweighttothelowsecular-variability TSIproxymodels.Inthesescenarios,theECSconsiderably decreasesfromanaverageof2.0±0.7 C(seecase1),toanaverage of1.1±0.3 C:adropof45%.ThisECSrangeismuchlowerthanthe ECSvaluespredictedbytheCMIP6GCMs(whichrangesfrom 1.8 Cto5.7 C),butitisneverthelessconsistentwithanumber ofindependentstudies(Scafetta,2009,2010,2013a;Lindzenand Choi,2011;Harde,2014;Loehle,2014;Moncktonetal.,2015; Bates,2016;McKitrickandChristy,2020;Stefani,2021).Theresult largelysupportsthehypothesisadvancedby Scafetta(2012b, 2013a),iftheclimatesystemischaracterizedbya(presumably solar-generated)quasi60-yearnaturaloscillation(likelygenerated bysolar/astronomicalforcings)thattheGCMscannotreproduce, theactualECSmustbeabouthalfofthatpredictedbytheGCMs thatbetterhindcasttheglobalwarmingfrom1970to2020.Since Scafetta(2022,2023a,b) showedthatthemostaccurateCMIP6 GCMsubsetappearstobetheonemadewithGCMswithECS between1.8 Cand3.0 C,halvingthisrangeyields0.9–1.5 C, whichapproximatelymatchestheaforementionedfinding.
Theclimate’srealsensitivitytoTSAchanges,kS,isfoundtobe 4–7timesgreaterthanthesensitivitytoradiativeforcingalone, denotedbykAV =kA =kV.Moreover,thesignificantpositivecorrelationbetweensolarproxyandclimaticrecordsobservedduring theHolocene(HoytandSchatten,1993,1997;Cliveretal.,1998; Kerr,2001;Neffetal.,2001;Fleitmannetal.,2003;Huetal., 2003;ShavivandVeizer,2003;Scafettaetal.,2004;Scafettaand West,2006;Kirkby,2007;Eichleretal.,2009;Scafetta,2009, 2011;MuftiandShah,2011;Steinhilberetal.,2012;Scafetta, 2013a;SoonandLegates,2013;VahrenholtandLüning,2013; Connollyetal.,2021;Schmutz,2021;Bondetal.,2001; Easterbrook,2019;Tariccoetal.,2022,andmanyothers)canbe explainedonlyiftheSun’sroleinclimatechangeissignificant. Hence,eitherTSIvariationsaresubstantiallybiggerthanhowthey arenowreconstructed,as Schmutz(2021) suggested,orthereare keysolar-climatemechanismscomplementarytoTSIforcingthat arestillpoorlyunderstoodand,therefore,ignoredinthepresentdayGCMs.
Theseresultsapproximatelyagreeandexplaintheresultsof Soonetal.(2000) whofoundthattheclimateappearstobehypersensitivetosolarforcing,withthoseof Shaviv(2008) whoanalyzed thesignatureofthe11-yearsolarcycleintheoceanandconcluded thatitcouldbeabout5–7timeslargerthanjustthatassociated withtheTSIvariationsalone,andof ZiskinandShaviv(2012) whofoundthatthetotalsolarcontributiontothe20thcenturyglobalwarmingappearstobemuchgreaterthancouldbeexpected fromvariationinthetotalsolarirradiancealone.
Table1 alsoreportstheestimatedTCRvaluesinallcases,which werecalculatedwithEq. (7).TCRisusuallyfoundtobeslightly smallerthanthecorrespondentECSvalues(1.1±0.3 C)because theevaluatedcharacteristictimeresponses s arejustafewyears:
s isfoundtobeonaverage6.7±1.7yearsbyusingtheGCMTSI record,and3.6±0.6yearsbyusingthenewproposedTSIrecords asTSAproxies.
TheproposedanalysissuggeststhatiftheactualTSIsecular variationsarecomparablewiththethreesuggestedbalancedTSI functionsandTSAissufficientlyproportionaltothem,thenthe actualTSAeffectontheclimatecouldbeabout5timesgreater thantheTSIeffectalone.
7.Conclusion
TheIPCC(Masson-Delmotteetal.,2021)assertionthatthe warmingobservedsincethepre-industrialperiod(1850–1900)is almostentirelyduetoanthropogenicemissionsisbasedsolely ontheresultsofcertainGCMsthatassumethatvariationsinsolar activitycanonlyhaveanimpactontheclimatethroughtotalsolar irradiance(TSI)andsolarspectralirradiance(SSI)radiativeforcings.Furthermore,theseGCMsusearadiativeforcingfunction derivedfromthelowsecular-variabilityTSIproxymodelsproposedinthescientificliterature(Matthesetal.,2017).Thischoice minimizesthesolarcomponentofclimatechangewhilemaximizingtheanthropogenicone.
Undertheaforementionedconditions,theactualECSshould rangefrom1.4 Cto2.8 Cwithameanof2.1 C,implyingthat onlytheCMIP6GCMscompatiblewithsuchalow-ECSrangecould besafelyusedforpublicpoliciesthataimtomitigatefutureclimatechangehazards,as Scafetta(2022,2023a,2023b) already indicated.ThisECSrangeisalsocompatiblewiththerecentresults by Lewis(2023),whoutilizedthesameforcings.
However,thescientificliteraturealsoprovidesTSIproxymodelswithsubstantiallylargermulti-decadalandsecularvariability. TheseTSIproxymodelsshouldnotbeignoredinclimatechange research.IntegratingthemostpopularTSIrecordsmadeitpossible totakeintoconsiderationallcommonproxiesusedtorecreate solaractivitychanges.Followingthat,threeuniqueTSImultiproxymodelswereproposed.TheyshowagreaterTSIvariability aswellasauniquetemporalmodulationthatmatchesmorecloselythetemperaturerecords.
Toassesstheirclimaticrelevance,Iappliedadifferentialmultilinearregressionmodelthatapproximatesthethermodynamic responseoftheclimatesystemwhilealsoaccountingfortheclimaticeffectsofbothanthropogenicandvolcanicactivities.The adoptedmodelingalsoallowsforamorecomplexresponseof theclimatetochangesinsolaractivitythancouldbeachievable withjustradiativeforcing.Thispropertyiscrucialbecausethe SunlikelyinfluenceEarth’sclimatebymeansofbothradiative andnon-radiativeforcings,withthelattermostlylinkedtoits magneticactivitythatcandirectlymodulatecosmicrayfluxes andgeneratespaceweatherperturbations.
Theobtainedclimatesimulationsfrom1850to2020arefound tobebettercorrelatedwiththeavailableglobalandseasurface temperaturerecords,especiallyiftheTSIrecords#1and#2are used.Inparticular,theTSI#2excludesthelowsecularvariabilityTSIproxymodelsby Matthesetal.(2017) andappears tobethebestperformingsolarmodel.Theanthropogenicimpact wasfoundtobesubstantiallylower,andthesolareffectonclimate wasfoundtobemuchmoresignificantthanwhattheIPCC acknowledged(Solomonetal.,2007;Stockeretal.,2014; Masson-Delmotteetal.,2021).TheECSwasdeterminedtobe 0.8–1.8 Cwithameanofroughly1.2 Cusingtheglobalsurface temperaturerecords,and0.6–1.6 Cwithameanofroughly 1.0 Cusingtheseasurfacetemperaturerecords.
ThefoundECSrangeissignificantlylowerthaneitherwhatpredictedbytheCMIP6GCMs(1.8–5.7 C)andthelikelyECSrange claimedbytheIPCCAR6(2.5–4.0 C).However,lowECSestimates
areconsistentwithseveralindependentempiricalinvestigations thathavehighlightedanimportantroleoftheSunandofthenaturalvariabilityindeterminingwhathascausedclimatechanges since1850.Inparticular,thefoundlowrangeforthelikelyECS iscompatiblewiththeECSrangesrecentlyestimatedby McKitrickandChristy(2020),whofoundapervasivewarmingbias inallCMIP6GCMswhentheirhindcastsarecomparedagainstthe tropospheretemperaturerecords,andby Stefani(2021).Thelatter authorusedaregressionalgorithmfinalizedtoassessthesolarand anthropogenicinfluencesonclimatebasedonthegeomagneticaaindexrecord,whichapproximatelyexhibitsalong-termvariability likethatofthethreeTSArecordshereinproposed.Thisagreement mightalsoprovideastrongposteriorargumentfortheplausibility oftheproposedTSAmodels.
ECSvaluesnearto1.0 Cwouldimplythatthepositiveandnegativefeedbackstoradiativeforcingareroughlybalanced.Infact, doublingtheconcentrationofCO2 intheatmospherefrom 280ppmto560ppmmighttheoreticallygenerate,byalone,a warmingofroughly1.0 C(Rahmstorf,2008).Thus,anotherkey resultofthisstudyisthat,onaverage,thetotalclimaticfeedback toCO2 changescouldonlybeslightlypositive.Moreover,itshould alsobetakenintoaccountthatpartofthewarmingshownbythe officialsurfacetemperaturedatamaybefictitiousbecauseitcould resultfromurbanheatislandsandothernon-climaticbiases (Connollyetal.,2021;Scafetta,2021a,2023b).Thus,perhaps,the ECSvaluesevaluatedwiththeSSTrecords(around1 C)might bemorerealistic.
TheCMIP6GCMsappeartogreatlyunderestimatetheSun’srole inclimatechangebecauseoftwomajorlimitations:(i)erroneous solarforcingshavelikelybeenintegratedintothemodels;and (ii)TSIaloneappearstolikelybenotthemostimportantsolarforcing.Additionalsolar-magnetismrelatedforcingsandassociated mechanismsarenotincludedintheGCMsbecausetheyarecurrentlypoorlyunderstood,despitethefactthatthereareseveral empiricalindicationsthattheymightsufficientlymodulatethe cloudcoversystem(by5%orless)toexplainasignificantcomponentoftheobservedclimaticchanges(SvensmarkandFriisChristensen,1997;Shaviv,2002;Svensmarketal.,2016; Easterbrook,2019;Svensmark,2022).Infact, Table1 showsthat theactualclimatesensitivitytoTSAvariations,whichisexpressed bykS,canbe4–7timesgreaterthantheclimatesensitivityto radiativeforcingalone,whichwasdenotedbykA
Thus,atleastabout80%ofthesolarinfluenceontheclimate couldbegeneratedbyprocessesotherthandirectTSIforcing.If thisresultiscorrect,severalsolar-climatemechanismsmustbe thoroughlyinvestigatedandfullyunderstoodbeforereliableGCMs canbedeveloped.
NicolaScafetta: Conceptualization,Formalanalysis,Methodology,Writing–originaldraft,Writing–review&editing.
Theauthordeclaresthathehasnoknowncompetingfinancial interestsorpersonalrelationshipsthatcouldhaveappearedto influencetheworkreportedinthispaper.
Theforcingdatausedinthepapercanbedownloadedfrom(accessedon05/05/2023):EffectiveRadiativeForcings: https://zenodo.org/record/5705391/files/table_A3.3_historical_ ERF_1750-2019_best_estimate.csv, https://github.com/chrisroadmap/ar6/blob/main/data_output/ AR6_ERF_1750-2019.csv;
RegressItPC: https://regressit.com/regressitpc.html
Supplementarydata1and2tothisarticlecanbefoundonline at https://doi.org/10.1016/j.gsf.2023.101650
Ball,W.T.,Unruh,Y.C.,Krivova,N.A.,Solanki,S.,Wenzler,T.,Mortlock,D.J.,Jaffe,A. H.,2012.Reconstructionoftotalsolarirradiance1974–2009.Astron.Astrophys. 541,A27
Bates,J.R.,2016.Estimatingclimatesensitivityusingtwo-zoneenergybalance models.EarthSpaceSci.3(5),207–225
Bond,G.,Kromer,B.,Beer,J.,Muscheler,R.,Evans,M.N.,Showers,W.,Hoffmann,S., Lotti-Bond,R.,Hajdas,I.,Bonani,G.,2001.PersistentsolarinfluenceonNorth Atlanticclimateduringtheholocene.Science294(5549),2130–2136 Bragato,P.L.,2015.Italianseismicityandvesuvius’eruptionssynchronizeonaquasi 60yearoscillation.EarthSpaceSci.2(5),134–143
Cliver,E.W.,Boriakoff,V.,Feynman,J.,1998.Solarvariabilityandclimatechange: Geomagneticaaindexandglobalsurfacetemperature.Geophys.Res.Lett.25 (7),1035–1038
Coddington,O.,Lean,J.L.,Pilewskie,P.,Snow,M.,Lindholm,D.,2016.Asolar irradianceclimatedatarecord.Bull.Am.Meteorol.Soc.97(7),1265–1282
Coddington,O.M.,Richard,E.C.,Harber,D.,Pilewskie,P.,Woods,T.N.,Chance,K.,Liu, X.,Sun,K.,2021.TheTSIS-1hybridsolarreferencespectrum.Geophys.Res.Lett. 48(12).e2020GL091709
Connolly,R.,Soon,W.,Connolly,M.,Baliunas,S.,Berglund,J.,Butler,C.J.,Cionco,R. G.,Elias,A.G.,Fedorov,V.M.,Harde,H.,Henry,G.W.,Hoyt,D.V.,Humlum,O., Legates,D.R.,Lüning,S.,Scafetta,N.,Solheim,J.-E.,Szarka,L.,vanLoon,H., Herrera,V.M.V.,Willson,R.C.,Yan,H.,Zhang,W.,2021.Howmuchhasthesun influencednorthernhemispheretemperaturetrends?Anongoingdebate.Res. Astron.Astrophys.21(6),131
deWit,T.D.,Kopp,G.,Fröhlich,C.,Schöll,M.,2017.Methodologytocreateanew totalsolarirradiancerecord:Makingacompositeoutofmultipledatarecords. Geophys.Res.Lett.44(3),1196–1203
Dewitte,S.,Crommelynck,D.,Mekaoui,S.,Joukoff,A.,2004.Measurementand uncertaintyofthelong-termtotalsolarirradiancetrend.Sol.Phys.224(1–2), 209–216
Douglass,D.H.,Clader,B.D.,2002.Climatesensitivityoftheearthtosolarirradiance. Geophys.Res.Lett.29(16).33.1–4
Easterbrook,D.J.,2019.SolarMagneticCauseofClimateChangesandOriginofthe IceAges.IndependentlyPublished
Eddy,J.A.,1976.Themaunderminimum.Science192(4245),1189–1202
Egorova,T.,Schmutz,W.,Rozanov,E.,Shapiro,A.I.,Usoskin,I.,Beer,J.,Tagirov,R.V.,Peter, T.,2018.Revisedhistoricalsolarirradianceforcing.Astron.Astrophys.615,A85 Eichler,A.,Olivier,S.,Henderson,K.,Laube,A.,Beer,J.,Papina,T.,Gäggeler,H.W., Schwikowski,M.,2009.TemperatureresponseintheAltairegionlagssolar forcing.Geophys.Res.Lett.36(1),L01808
Eyring,V.,Bony,S.,Meehl,G.A.,Senior,C.A.,Stevens,B.,Stouffer,R.J.,Taylor,K.E., 2016.Overviewofthecoupledmodelintercomparisonprojectphase6(CMIP6) experimentaldesignandorganization.Geosci.ModelDev.9(5),1937–1958 Fleitmann,D.,Burns,S.J.,Mudelsee,M.,Neff,U.,Kramers,J.,Mangini,A.,Matter,A., 2003.Holoceneforcingoftheindianmonsoonrecordedinastalagmitefrom southernOman.Science300(5626),1737–1739
Fröhlich,C.,2009.Evidenceofalong-termtrendintotalsolarirradiance.Astron. Astrophys.501(3),L27–L30
Fröhlich,C.,2012.Totalsolarirradianceobservations.Surv.Geophys.33(3–4),453–473
Fröhlich,C.,Lean,J.L.,1998.Thesun’stotalirradiance:Cycles,trendsandrelated climatechangeuncertaintiessince1976.Geophys.Res.Lett.25(23),4377–4380
Gleisner,H.,Thejll,P.,2003.Patternsoftroposphericresponsetosolarvariability. Geophys.Res.Lett.30(13),1711
Harde,H.,2014.Advancedtwo-layerclimatemodelfortheassessmentofglobal warmingbyCO2.OpenJ.Atmos.Clim.Change2014(3),1–51
Thisresearchreceivednoexternalfunding.
Herdiwijaya,D.,Arif,J.,Nurzaman,M.Z.,2014.Ontherelationbetweensolarand globalvolcanicactivities.In:Proceedingsofthe2014InternationalConference onPhysics.AtlantisPress,pp.105–108
Hofer,S.,Tedstone,A.J.,Fettweis,X.,Bamber,J.L.,2017.Decreasingcloudcover drivestherecentmasslossontheGreenlandicesheet.Sci.Adv.3(6),e170058
Hoyt,D.V.,Schatten,K.H.,1993.Adiscussionofplausiblesolarirradiancevariations, 1700–1992.J.Geophys.Res.SpacePhys.98(A11),18895–18906
Hoyt,D.V.,Schatten,K.H.,1997.TheRoleoftheSuninClimateChange.Oxford UniversityPress
Hu,F.S.,Kaufman,D.,Yoneji,S.,Nelson,D.,Shemesh,A.,Huang,Y.,Tian,J.,Bond,G., Clegg,B.,Brown,T.,2003.Cyclicvariationandsolarforcingofholoceneclimate intheAlaskanSubarctic.Science301(5641),1890–1893.
Judge,P.G.,Egeland,R.,Henry,G.W.,2020.Sun-likestarsshedlightonsolarclimate forcing.Astrophys.J.891(1),96
Kennedy,J.J.,Rayner,N.A.,Smith,R.O.,Parker,D.E.,Saunby,M.,2011a.Reassessing biasesandotheruncertaintiesinseasurfacetemperatureobservations measuredinsitusince1850:1.Measurementandsamplinguncertainties.J. Geophys.Res.116(D14)D14103
Kennedy,J.J.,Rayner,N.A.,Smith,R.O.,Parker,D.E.,Saunby,M.,2011b.Reassessing biasesandotheruncertaintiesinseasurfacetemperatureobservations measuredinsitusince1850:2.Biasesandhomogenization.J.Geophys.Res. 116(D14)D14104
Kennedy,J.J.,Rayner,N.A.,Atkinson,C.P.,Killick,R.E.,2019.Anensembledatasetof seasurfacetemperaturechangefrom1850:ThemetofficeHadleycentre HadSST.4.0.0.0dataset.J.Geophys.Res.Atmos.124(14),7719–7763
Kerr,R.A.,2001.Avariablesunpacesmillennialclimate.Science294(5546),1431–1433
Kirkby,J.,2007.Cosmicraysandclimate.Surv.Geophys.28(5–6),333–375
Kopp,G.,Lean,J.L.,2011.Anew,lowervalueoftotalsolarirradiance:Evidenceand climatesignificance.Geophys.Res.Lett.38(1)L01706
Krivova,N.A.,Balmaceda,L.,Solanki,S.K.,2007.Reconstructionofsolartotal irradiancesince1700fromthesurfacemagneticflux.Astron.Astrophys.467 (1),335–346
Krivova,N.A.,Vieira,L.E.A.,Solanki,S.K.,2010.Reconstructionofsolarspectral irradiancesincetheMaunderminimum.J.Geophys.Res.SpacePhys.115(A12)
A12112.
Lean,J.L.,Beer,J.,Bradley,R.,1995.Reconstructionofsolarirradiancesince1610: Implicationsforclimatechange.Geophys.Res.Lett.22(23),3195–3198
Lean,J.L.,Rind,D.H.,2008.Hownaturalandanthropogenicinfluencesalterglobal andregionalsurfacetemperatures:1889to2006.Geophys.Res.Lett.35(18)
L18701
Lewis,N.,2023.Objectivelycombiningclimatesensitivityevidence.Clim.Dyn.60, 3139–3165
Lewis,N.,Curry,J.,2018.Theimpactofrecentforcingandoceanheatuptakedataon estimatesofclimatesensitivity.J.Clim.31(15),6051–6071
R.LindseyUnderavariablesun:4)whyissuchasmallincreasesuchabigdeal?
2003 https://earthobservatory.nasa.gov/features/VariableSun/variable4.php Lindzen,R.S.,Choi,Y.-S.,2011.Ontheobservationaldeterminationofclimate sensitivityanditsimplications.Asia-Pac.J.Atmos.Sci.47(4),377–390
Lockwood,M.,Ball,W.T.,2020.Placinglimitsonlong-termvariationsinquiet-sun irradianceandtheircontributiontototalsolarirradianceandsolarradiative forcingofclimate.Proc.RoyalSoc.A:Math.Phys.Eng.Sci.476(2238) 20200077
Loehle,C.,2014.Aminimalmodelforestimatingclimatesensitivity.Ecol.Model.
276,80–84
Loehle,C.,Scafetta,N.,2011.Climatechangeattributionusingempirical decompositionofclimaticdata.OpenAtmos.Sci.J.5(1),74–86
Marshall,L.R.,Smith,C.J.,Forster,P.M.,Aubry,T.J.,Andrews,T.,Schmidt,A.,2020. Largevariationsinvolcanicaerosolforcingefficiencyduetoeruptionsource parametersandrapidadjustments.Geophys.Res.Lett.47(19).e2020GL090241. Masson-Delmotte,V.etal.,2021.ClimateChange2021ThePhysicalScienceBasis: AssessmentWorkingGroupIContributiontotheIPCCSixthAssessmentReport.
CambridgeUniversityPress
Matthes,K.,Funke,B.,Andersson,M.E.,Barnard,L.,Beer,J.,Charbonneau,P.,Clilverd, M.A.,deWit,T.D.,Haberreiter,M.,Hendry,A.,Jackman,C.H.,Kretzschmar,M., Kruschke,T.,Kunze,M.,Langematz,U.,Marsh,D.R.,Maycock,A.C.,Misios,S., Rodger,C.J.,Scaife,A.A.,Seppälä,A.,Shangguan,M.,Sinnhuber,M.,Tourpali,K., Usoskin,I.,vandeKamp,M.,Verronen,P.T.,Versick,S.,2017.Solarforcingfor CMIP6(v3.2).Geosci.ModelDev.10(6),2247–2302
Mazzarella,A.,Palumbo,A.,1989.Doesthesolarcyclemodulateseismicand volcanicactivity?J.Volcanol.Geoth.Res.39(1),89–93
McKitrick,R.,Christy,J.,2020.PervasivewarmingbiasinCMIP6troposphericlayers. EarthandSpace.Science7(9).e2020EA001281
Miyahara,H.,Kataoka,R.,Mikami,T.,Zaiki,M.,Hirano,J.,Yoshimura,M.,Aono,Y., Iwahashi,K.,2018.Solarrotationalcycleinlightningactivityinjapanduringthe 18–19thcenturies.Ann.Geophys.36(2),633–640
Moberg,A.,Sonechkin,D.M.,Holmgren,K.,Datsenko,N.M.,Karlén,W.,2005.Highly variablenorthernhemispheretemperaturesreconstructedfromlow-andhighresolutionproxydata.Nature433(2),613–617
Moldwin,M.,2022.IntroductiontoSpaceWeather.CambridgeUniversityPress Monckton,C.,Soon,W.-W.-H.,Legates,D.R.,Briggs,W.M.,2015.Whymodelsrun hot:resultsfromanirreduciblysimpleclimatemodel.Sci.Bull.60(1),122–135
Morice,C.P.,Kennedy,J.J.,Rayner,N.A.,Jones,P.D.,2012.Quantifyinguncertainties inglobalandregionaltemperaturechangeusinganensembleofobservational estimates:TheHadCRUT4dataset.J.Geophys.Res.Atmos.117(D8)D08101.
Morice,C.P.,Kennedy,J.J.,Rayner,N.A.,Winn,J.P.,Hogan,E.,Killick,R.E.,Dunn,R.J. H.,Osborn,T.J.,Jones,P.D.,Simpson,I.R.,2021.Anupdatedassessmentofnearsurfacetemperaturechangefrom1850:TheHadCRUT5dataset.J.Geophys. Res.Atmos.126(3).e2019JD032361 Mufti,S.,Shah,G.,2011.Solar-geomagneticactivityinfluenceonearth’sclimate.J. Atmos.Sol.Terr.Phys.73(13),1607–1615
Neff,U.,Burns,S.J.,Mangini,A.,Mudelsee,M.,Fleitmann,D.,Matter,A.,2001.Strong coherencebetweensolarvariabilityandthemonsooninOmanbetween9and6 kyrago.Nature411(6835),290–293
Penza,V.,Berrilli,F.,Bertello,L.,Cantoresi,M.,Criscuoli,S.,Giobbi,P.,2022.Total solarirradianceduringthelastfivecenturies.Astrophys.J.937(2),84 Pfeifroth,U.,Sanchez-Lorenzo,A.,Manara,V.,Trentmann,J.,Hollmann,R.,2018. Trendsandvariabilityofsurfacesolarradiationineuropebasedonsurface-and satellite-baseddatarecords.J.Geophys.Res.Atmos.123(3),1735–1754. Pokrovsky,O.M.,2019.Cloudchangesintheperiodofglobalwarming:Theresults oftheinternationalsatelliteproject.Izv.Atmos.Ocean.Phys.55(9),1189–1197
Rahmstorf,S.,2008.AnthropogenicClimateChange:RevisitingtheFacts.Brookings InstitutionPress,pp.34–54.Ch.3,pp.34–54.http://www.jstor.org/stable/ 10.7864/j.ctt127xgs.7
Richard,E.,Harber,D.,Coddington,O.,Drake,G.,Rutkowski,J.,Triplett,M., Pilewskie,P.,Woods,T.,2020.SI-traceablespectralirradianceradiometric characterizationandabsolutecalibrationoftheTSIS-1spectralirradiance monitor(SIM).RemoteSens.(Basel)12(11),1818
Richardson,M.T.,Benestad,R.E.,2022.Erroneoususeofstatisticsbehindclaimsofa majorsolarroleinrecentwarming.Res.Astron.Astrophys.22(12)125008 Scafetta,N.,2008.Commenton‘‘heatcapacity,timeconstant,andsensitivityof earth’sclimatesystem”bys.e.Schwartz.J.Geophys.Res.113(D15)D15104
Scafetta,N.,2009.Empiricalanalysisofthesolarcontributiontoglobalmeanair surfacetemperaturechange.J.Atmos.Sol.Terr.Phys.71(17–18),1916–1923
Scafetta,N.,2010.Empiricalevidenceforacelestialoriginoftheclimateoscillations anditsimplications.J.Atmos.Sol.Terr.Phys.72(13),951–970
Scafetta,N.,2011.Totalsolarirradiancesatellitecompositesandtheir phenomenologicaleffectonclimate.In:Evidence-BasedClimateScience. Elsevier,pp.289–316
Scafetta,N.,2012a.Multi-scaleharmonicmodelforsolarandclimatecyclical variationthroughouttheholocenebasedonJupiter-Saturntidalfrequencies plusthe11-yearsolardynamocycle.J.Atmos.Sol.Terr.Phys.80,296–311.
Scafetta,N.,2012b.Testinganastronomicallybaseddecadal-scaleempirical harmonicclimatemodelversustheIPCC(2007)generalcirculationclimate models.J.Atmos.Sol.Terr.Phys.80,124–137
Scafetta,N.,2013a.Discussiononclimateoscillations:CMIP5generalcirculation modelsversusasemi-empiricalharmonicmodelbasedonastronomicalcycles. EarthSci.Rev.126,321–357
Scafetta,N.,2013b.Discussiononcommonerrorsinanalyzingsealevel accelerations,solartrendsandglobalwarming.PatternRecogn.Phys.1(1), 37–57
Scafetta,N.,2013c.Multi-scaledynamicalanalysis(MSDA)ofsealevelrecords versusPDO,AMO,andNAOindexes.Clim.Dyn.43(1–2),175–192
Scafetta,N.,2014.Discussiononthespectralcoherencebetweenplanetary,solar andclimateoscillations:areplytosomecritiques.Astrophys.SpaceSci.354(2), 275–299
Scafetta,N.,2021a.Detectionofnon-climaticbiasesinlandsurfacetemperature recordsbycomparingclimaticdataandtheirmodelsimulations.Clim.Dyn.56 (9–10),2959–2982
Scafetta,N.,2021b.Reconstructionoftheinterannualtomillennialscalepatternsof theglobalsurfacetemperature.Atmosphere12(2),147
Scafetta,N.,2021c.TestingtheCMIP6GCMsimulationsversussurfacetemperature recordsfrom1980–1990to2011–2021:HighECSisnotsupported.Climate9 (11),161 Scafetta,N.,2022.Advancedtestingoflow,medium,andhighECSCMIP6GCM simulationsversusERA5-t2m.Geophys.Res.Lett.49(6).e2022GL097716. Scafetta,N.,2023a.CMIP6GCMensemblemembersversusglobalsurface temperatures.Clim.Dyn.60,3091–3120
Scafetta,N.,2023b.CMIP6GCMvalidationbasedonECSandTCRrankingfor21st centurytemperatureprojectionsandriskassessment.Atmosphere14(2),345 Scafetta,N.,Bianchini,A.,2022.Theplanetarytheoryofsolaractivityvariability:A review.Front.Astron.SpaceSci.9937930
Scafetta,N.,West,B.J.,2008.Variationsonsun’sroleinclimatechange.Phys.Today 61(10),14–16
Scafetta,N.,Willson,R.C.,2009.ACRIM-GAPandTSItrendissueresolvedusinga surfacemagneticfluxTSIproxymodel.Geophys.Res.Lett.36(5)L05701 Scafetta,N.,Willson,R.C.,2014.ACRIMtotalsolarirradiancesatellitecomposite validationversusTSIproxymodels.Astrophys.SpaceSci.350(2),421–442 Scafetta,N.,Willson,R.C.,2019.Comparisonofdecadaltrendsamongtotalsolar irradiancecompositesofsatelliteobservations.Adv.Astron.2019,1–14
Scafetta,N.,Grigolini,P.,Imholt,T.,Roberts,J.,West,B.J.,2004.Solarturbulencein earth’sglobalandregionaltemperatureanomalies.Phys.Rev.E69(2)026303
Scafetta,N.,Mazzarella,A.,2015.Spectralcoherencebetweenclimateoscillations andtheM 7earthquakehistoricalworldwiderecord.Nat.Hazards76(3), 1807–1829
Scafetta,N.,Ouyang,S.,2019.DetectionofUHIbiasinchinaclimatenetworkusing tminandtmaxsurfacetemperaturedivergence.Glob.Planet.Change181 102989
Scafetta,N.,West,B.J.,2005.Estimatedsolarcontributiontotheglobalsurface warmingusingtheACRIMTSIsatellitecomposite.Geophys.Res.Lett.32(18) L18713
Scafetta,N.,West,B.J.,2006.Phenomenologicalsolarsignaturein400yearsof reconstructednorthernhemispheretemperaturerecord.Geophys.Res.Lett.33 (17)L17718
Scafetta,N.,Willson,R.,Lee,J.,Wu,D.,2019.Modelingquietsolarluminosity variabilityfromTSIsatellitemeasurementsandproxymodelsduring1980–2018.RemoteSens.(Basel)11(21),2569
Scafetta,N.,Milani,F.,Bianchini,A.,2020.A60-yearcycleinthemeteoritefall frequencysuggestsapossibleinterplanetarydustforcingoftheearth’sclimate drivenbyplanetaryoscillations.Geophys.Res.Lett.47(18).e2020GL089954
Schmutz,W.K.,2021.Changesinthetotalsolarirradianceandclimaticeffects.J. SpaceWeatherSpaceClim.11,40.
Shapiro,A.I.,Schmutz,W.,Rozanov,E.,Schoell,M.,Haberreiter,M.,Shapiro,A.V., Nyeki,S.,2011.Anewapproachtothelong-termreconstructionofthesolar irradianceleadstolargehistoricalsolarforcing.Astron.Astrophys.529,A67
Shaviv,N.J.,2002.Cosmicraydiffusionfromthegalacticspiralarms,iron meteorites,andapossibleclimaticconnection.Phys.Rev.Lett.89(5)051102
Shaviv,N.J.,2008.Usingtheoceansasacalorimetertoquantifythesolarradiative forcing.J.Geophys.Res.SpacePhys.113(A11).A11101
Shaviv,N.J.,Veizer,J.,2003.Celestialdriverofphanerozoicclimate?GSAToday13 (7),4–10
Solomon,S.etal.,2007.ClimateChange2007ThePhysicalScienceBasis: AssessmentWorkingGroupIContributiontotheIPCCFourthAssessment Report.CambridgeUniversityPress
Soon,W.,Legates,D.R.,2013.Solarirradiancemodulationofequator-to-pole(arctic) temperaturegradients:Empiricalevidenceforclimatevariationonmultidecadaltimescales.J.Atmos.Sol.Terr.Phys.93,45–56
Soon,W.,Posmentier,E.,Baliunas,S.,2000.Climatehypersensitivitytosolar forcing?Ann.Geophys.18(5),583–588
Stefani,F.,2021.Solarandanthropogenicinfluencesonclimate:Regressionanalysis andtentativepredictions.Climate9(11),163
Steinhilber,F.,Abreu,J.A.,Beer,J.,Brunner,I.,Christl,M.,Fischer,H.,Heikkilä,U., Kubik,P.W.,Mann,M.,McCracken,K.G.,Miller,H.,Miyahara,H.,Oerter,H., Wilhelms,F.,2012.9,400yearsofcosmicradiationandsolaractivityfromice coresandtreerings.Proc.Natl.Acad.Sci.U.S.A.109(16),5967–5971.
Stocker,T.F.etal.,2014.ClimateChange2013ThePhysicalScienceBasis: AssessmentWorkingGroupIContributiontotheIPCCFifthAssessment Report.CambridgeUniversityPress Stothers,R.B.,1989.Volcaniceruptionsandsolaractivity.J.Geophys.Res.94(B12), 17371
Svensmark,H.,2022.Supernovaratesandburialoforganicmatter.Geophys.Res. Lett.49(1).e2021GL096376
Svensmark,J.,Enghoff,M.B.,Shaviv,N.J.,Svensmark,H.,2016.Theresponseof cloudsandaerosolstocosmicraydecreases.J.Geophys.Res.SpacePhys.121 (9),8152–8181
Svensmark,H.,Friis-Christensen,E.,1997.Variationofcosmicrayfluxandglobal cloudcoverage–amissinglinkinsolar-climaterelationships.J.Atmos.Sol.Terr. Phys.59(11),1225–1232
Taricco,C.,Arnone,E.,Rubinetti,S.,Bizzarri,I.,Agafonova,N.Y.,Aglietta,M., Antonioli,P.,Ashikhmin,V.V.,Bari,G.,Bruno,G.,Dobrynina,E.A.,Enikeev,R.I., Fulgione,W.,Galeotti,P.,Garbini,M.,Ghia,P.L.,Giusti,P.,Kemp,E.,Malgin,A.S., Molinario,A.,Persiani,R.,Pless,I.A.,Ryazhskaya,O.G.,Sartorelli,G., Shakiryanova,I.R.,Selvi,M.,Trinchero,G.C.,Vigorito,C.F.,Yakushev,V.F.,A. z.,,2022.Explorationofthestratospherewithcosmic-raymuonsdetected underground.Phys.Rev.Res.4(2)
Thompson,D.W.J.,Wallace,J.M.,Jones,P.D.,Kennedy,J.J.,2009.Identifying signaturesofnaturalclimatevariabilityintimeseriesofglobal-meansurface temperature:Methodologyandinsights.J.Clim.22(22),6120–6141
Todd,M.C.,Kniveton,D.R.,2001.Changesincloudcoverassociatedwithforbush decreasesofgalacticcosmicrays.J.Geophys.Res.Atmos.106(D23),32031–32041
Vahrenholt,F.,Lüning,S.,2013.Theneglectedsun-whythesunprecludesclimate catastrophe.StaceyInternational
Vieira,L.E.A.,Solanki,S.K.,Krivova,N.A.,Usoskin,I.,2011.Evolutionofthesolar irradianceduringtheholocene.Astron.Astrophys.531,A6
Wang,Y.-M.,Lean,J.L.,Sheeley,N.R.,2005.Modelingthesun’smagneticfieldand irradiancesince1713.Astrophys.J.625(1),522–538
Willson,R.C.,1997.Totalsolarirradiancetrendduringsolarcycles21and22. Science277(5334),1963–1965
Willson,R.C.,Mordvinov,A.V.,2003.Seculartotalsolarirradiancetrendduringsolar cycles21–23.Geophys.Res.Lett.30(5),1199
Wu,C.-J.,Krivova,N.A.,Solanki,S.K.,Usoskin,I.G.,2018.Solartotalandspectral irradiancereconstructionoverthelast9000years.Astron.Astrophys.620, A120
Wyatt,M.G.,Curry,J.A.,2013.RoleforEurasianarcticshelfseaiceinasecularly varyinghemisphericclimatesignalduringthe20thcentury.Clim.Dyn.42(9–10),2763–2782.
Yeo,K.L.,Ball,W.T.,Krivova,N.A.,Solanki,S.K.,Unruh,Y.C.,Morrill,J.,2015.UVsolar irradianceinobservationsandtheNRLSSIandSATIRE-smodels.J.Geophys.Res. SpacePhys.120(8),6055–6070
Yeo,K.L.,Solanki,S.K.,Krivova,N.A.,Rempel,M.,Anusha,L.S.,Shapiro,A.I.,Tagirov, R.V.,Witzke,V.,2020.Thedimmeststateofthesun.Geophys.Res.Lett.47(19). e2020GL090243
Zacharias,P.,2014.Anindependentreviewofexistingtotalsolarirradiancerecords. Surv.Geophys.35(4),897–912
Ziskin,S.,Shaviv,N.J.,2012.Quantifyingtheroleofsolarradiativeforcingoverthe 20thcentury.Adv.SpaceRes.50(6),762–776