SCIENTIFIC JOURNAL
AGRICULTURAL, FOREST AND TRANSPORT MACHINERY AND TECHNOLOGIES Volume VII – Issue 1, 2020
Journal of the Agrarian and Industrial Faculty, University of Ruse “Angel Kanchev”
ISSN: 2367–5888 © Ruse University Press Agrarian and Industrial Faculty Ruse, 2020
Editorial Office: Scientific Journal Agricultural, Forest and Transport Machinery and Technologies Ruse University Press 8 Studentska str., 7017 Ruse, Bulgaria e-mail: aftmt@uni-ruse.bg
Agricultural, Forest and Transport Machinery and Technologies (ISSN: 2367– 5888) Volume VII – Issue 1, 2020
Editorial Board Hristo Beloev, University of Ruse “Angel Kanchev”, Bulgaria Plamen Kangalov, University of Ruse “Angel Kanchev”, Bulgaria Zdenko Tkac, Slovak University of Agriculture in Nitra, Slovakia Vladimir Krocko, Slovak University of Agriculture in Nitra, Slovakia Jan Marecek, Mendel University in Brno, Czech Republic Vladimir Jurca, Czech University of Life Sciences Prague, Czech Republic Valerii Adamchuk, Institute of Mechanization and Electrification of Agriculture, Ukraine Pavel Machal, Mendel University in Brno, Czech Republic Jan Turan, University of Novi Sad, Serbia Stanislaw Sosnowski, University of Rzeszow, Poland Stepan Kovalyshyn, Lviv National Agrarian University, Ukraine Djemal Katzitadze, Agricultural University of Georgia, Georgia Petar Dimitrov, Institute of Soil Science, Agrotechnologies and Plant Protection “Nikola Poushkarov”, Bulgaria Eva Hvizdova, Mendel University in Brno, Czech Republic Georgi Tasev, University of Forestry – Sofia, Bulgaria Miho Mihov, Institute of Soil Science, Agrotechnologies and Plant Protection “Nikola Poushkarov”, Bulgaria Georgi Komitov, Agrarian University – Plovdiv, Bulgaria Pavol Findura, Slovak University of Agriculture in Nitra, Slovakia Mitko Nikolov, University of Ruse “Angel Kanchev”, Bulgaria Kaloyan Stoyanov, University of Ruse “Angel Kanchev”, Bulgaria Miroslav Pristavka, Slovak University of Agriculture in Nitra, Slovakia Volodimir Kyurchev, Tavria State Agrotechnological University, Ukraine Iurie Melnic, State Agrarian University of Moldova, Moldova
-3-
Agricultural, Forest and Transport Machinery and Technologies (ISSN: 2367– 5888) Volume VII – Issue 1, 2020
Page
CONTENT 1. Carbon Dioxide Emissions from Soil in the Application of Conventional and Soil Protection Technologies for Growing Wheat on Sloping Arable Land, Gergana Kuncheva, Petar Dimitrov, Hristo Beloev, Iliana Ivanova
5
2. Possibilities to Reduce Methane and Hydrogen Sulphide Emissions in Pig Farming By Application of Zeolite, Stefan Bodo, Roman Galik, Katarina Kollarova, Plamen Kangalov
12
3. A Comparative Study of the Sensitivity of Herbicides, Dimitriya Ilieva
17
Maize Lines to Some
4. Soil CO2 Emissions in the Application of Conventional and Erosion Control Technologies for Growing Maize on Sloping Terrains, Gergana Kuncheva, Petar Dimitrov, Hristo Beloev, Iliana Ivanova
25
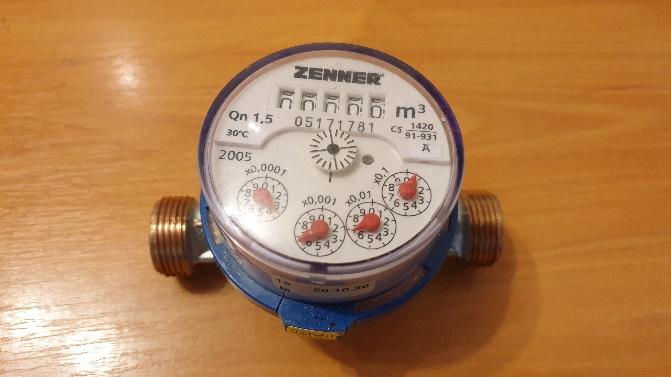
5. Water Flow Meters - Meeting the Requirements In Use and Subsequent Metrological Control of Meters, Radovan Filo, Rudolf Palencar, Jan Zitnansky, Vladimir Krocko, Ivan Beloev
32
6. Standardization of Cooperation between Production and Supply Quality in Production Organization, Miroslav Pristavka, Hristo Beloev, Plamen Kangalov, Mitko Nikolov, Pavol Findura, Petr Bartos, Olga Urbanovicova
41
7. Use of Balanced Scorecard Method in Project Management as Support of Technical Development of the Company, Pavel Machal, Maksym Stankevych, Hristo Beloev, Miroslav Pristavka, Pavol Findura
48
8. Variants of Solution and Evaluation of FMEA in Practice, Marian Bujna, Plamen Kangalov
57
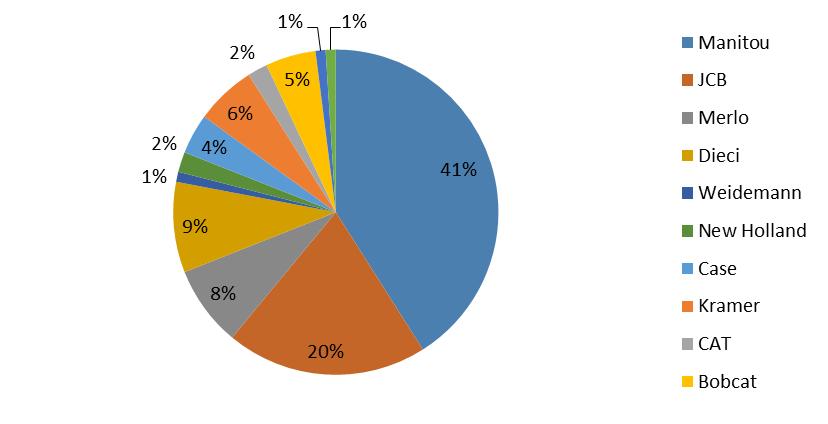
9. Current Situation of Selling Telehandlers, Due To Ukrainian and Slovakian Markets Conditions, Maksym Stankevych, Pavol Findura, Miroslav Pristavka, Volodymyr Kyurchev, Volodymyr Nadykto, Olga Urbanovicova, Vladimir Krocko
64
10. Influence of Cutting Speed to Vibrations and Roughness of Machined Surface during Turning, Martin Barath, Jan Zitnansky, Hristo Beloev
70
11. Resistance Assessment of Materials to Abrasive Wear, Martin Kotus, Jan Lilko, Plamen Kangalov, Juraj Balazi
75
-4-
Agricultural, Forest and Transport Machinery and Technologies (ISSN: 2367– 5888) Volume VII – Issue 1, 2020
Carbon Dioxide Emissions from Soil in the Application of Conventional and Soil Protection Technologies for Growing Wheat on Sloping Arable Land Gergana Kuncheva, Petar Dimitrov, Hristo Beloev, Iliana Ivanova Abstract: Soil tillage has a great impact on soil CO2 emissions and is one of the main agro-technical activities that is thought to reduce organic carbon stocks in the soil. For this reason, much was done to develop agricultural practices combining appropriate tillage with the application of organic soil amendments that will lead to an increase of organic matter in the soil, to improve plant development and to a reduction in greenhouse gas emissions from the agricultural sector. This work examines the results of studies conducted with such conventional and soil conservation practices for minimum and unconventional tillage using manure, as mulching material, in wheat cultivation, on sloping terrain, and determines their impact on soil carbon flows. Keywords: soil water erosion, loss of soil organic matter, minimum soil tillage, surface mulch, vertical mulch, soil CO2 emissions, labile soil organic carbon.
INTRODUCTION Climate change is mainly caused by the changing concentration of greenhouse gases in the Earth's atmosphere. Concentrations of these gases have increased compared to preindustrial times, especially in recent decades, mainly due to industrialization, agricultural production and urbanization [2, 4, 5,11]. The agricultural sector is responsible for approximately 10–13% of global anthropogenic greenhouse gas emissions. The net CO2 exchange from agricultural soils is approximately in equilibrium and has significant mitigation potential for the sequestration of atmospheric CO2 [16]. Soil tillage has a major impact on soil CO2 emissions and is one of the main agro-technical activities that is thought to reduce organic carbon stocks in the soil [9, 14, 15]. Another significant source of greenhouse gases in the agricultural sector is related with it productions, and in particular the production of mineral fertilizers. In 2017, 11.6 million tons of nitrogen fertilizers were used in EU agriculture [6]. The production of these fertilizers is associated with significant greenhouse gas emissions. Therefore, reducing their use by substitution with organic residues can contribute to environmental protection. Organic fertilizers in the form of composts, manure and cover crops are a source of nutrients for the plants, and they also improve soil quality, improve volume and density, moisture retention capacity, electrical conductivity, increase soil organic matter, soil biological activity [8, 1, 15]. Exploring the potential of organic residues and their application to different crop technologies can improve soil quality and lead to economic benefits. Although increasing the amount of organic amendments leads to higher CO2 emissions, but linear increases in total organic carbon are observed (P <0.05). The CO2 flux expresses the amount of carbon lost and depends on the applied amounts of organic soil amendments [16]. Therefore, the application of organic materials should be made according to the available nutrients in the soil and the needs of the plants in order to prevent the application of excessive amounts of nutrients leading to unnecessary increases in CO2 emissions. Reduced CO2 emissions from soil obtained from low nitrogen organic fertilizers such as organic compost indicate that there is less aerobic microbial activity in soil than in cultivated soils with high nitrogen content [1]. All these studies indicate that it is necessary to develop such agricultural practices that combine the appropriate cultivation and application of organic soil amendments, to increase of soil organic matter, to improve plant development and to reduction of greenhouse gas
-5-
Agricultural, Forest and Transport Machinery and Technologies (ISSN: 2367– 5888) Volume VII – Issue 1, 2020
emissions from the crop production. For the last ten years, the Institute of Soil Science, Agrotechnology and Plant Protection "Nikola Pushkarov" - Sofia together with the University of Rousse "Angel Kanchev" have been working on this problems and have been developed advanced soil protection technologies for minimum and unconventional soil tillage, which have been tested in our country and show good results when applied for growing wheat on sloping arable land. They were created in relation with the reduction of the impact of water erosion, which is the most significant soil degradation process in the Republic of Bulgaria. It affects to about 80% of our agricultural land. Another important degradation process that is closely related to water erosion and depends on its impact is the loss of soil organic matter. These two processes of soil degradation cause considerable damage to our native agriculture [3, 14]. The protection of agricultural land from water erosion and the loss of soil organic matter can be accomplished with so-called erosion control agro-technology, including various soil-protection agro-technical methods and technologies. Such are minimum tillage and unconventional tillage such as surface and vertical (intra soil) mulching, using manure as mulching material, which can be co-applied, as is the case with advanced soil protection technologies. The purpose of the present study is to determine influence of applied advanced soil protection technology for minimum and unconventional soil tillage with manure application as mulching material for growing wheat on sloping terrain, on soil carbon dioxide fluxes. MATERIAL AND METHODS The study was carried out in the period 2018-2019 yr., in the experimental field of the Institute of Soil Science, Agrotechnology and Plant Protection "Nikola Pushkarov" - Sofia, in the territory of the village of Trustenik, Ruse region, under non irrigation conditions, on middle eroded calcium chernozem on slope with inclination 5o (8.7%). The field of the village of Trustenik, Rousse district is located in the northern climatic region of the Danube hilly plain and is characterized by a temperate continental climate, with a sharper continence than the rest of the country. Autumn and spring are short. Winter is cold, with a minimum amount of rainfall and hot summers with a high maximum of rainfall. The field experiment with wheat was performed using the block method, in four variants, in four replicates. The variants of the experiments are: b0 variant - wheat plots, grown by conventional technology, applied along the slope control; b1 variant - wheat plots, grown by conventional technology, applied across the slope; b2 variant - wheat plots, grown by soil protection technology including the erosion control measure - surface mulching with manure, applied across the slope. b3 variant - wheat plots, grown under advanced soil protection technology including erosion control measures vertically mulching with manure and direct sowing, as well as some plant protection operations for weed control, pests and plant diseases, all applied across the slope. During the study period, annually, all technological operations performed in variants b0 and b1 are conventional and identical, with the difference between them being only in the direction of their implementation. In the control they are made along the slope, and in variant b1 in the transverse direction. In the same direction, the operations of variant b2 were carried out pre-sowing anti-erosion method surface mulching with manure (4500-5000 kg / ha) was carried out, using the fertilizer trailer 1PTU-6 for this purpose. In the last b3 variant, pre-sowing, transversely on the slope, was carried out vertical (internal soil) mulching with manure, as mulching material, according to a tape scheme (distance between slots 1.4 m and interval between the strips in the field 3 m) at a depth of 0,
-6-
Agricultural, Forest and Transport Machinery and Technologies (ISSN: 2367– 5888) Volume VII – Issue 1, 2020
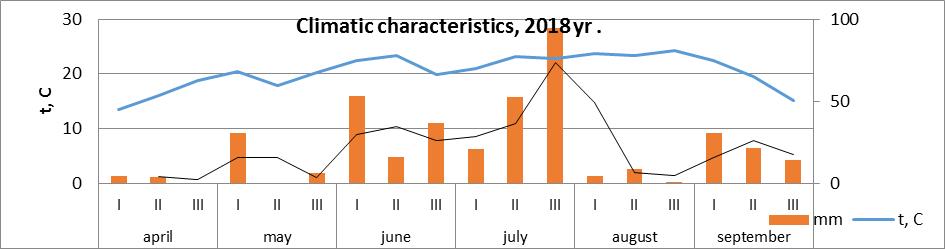
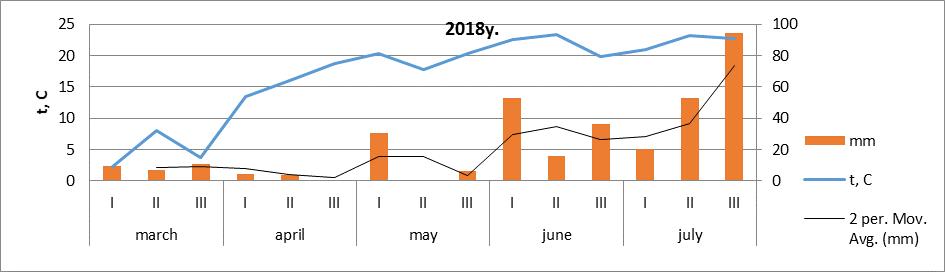
40 m with the help of the reconstructed pruner SHN - 2 - 140 with a mulch. During the experiment, erosion studies of the applied technologies were carried out, as well as carbon emissions were measured every month during the growing season, as well as the content of labile carbon (oxidisable by potassium permanganate) [18], soil moisture content was determined in the 0-10 cm layer and soil electrical conductivity. RESULTS AND DISCUSSION Climate observations, soil moisture, and carbon dioxide emissions over the study period are shown in Fig. 1, Fig. 2 and Fig. 3. Fig. 1 shows the average day-and-night temperatures as well as the sum of the precipitation for ten days periods. They show that March 2018 is very cold, with average temperatures in the first and third ten days of the month between 2o and 4o C, while April in the same year has average daily temperatures between 15o and 20o C. Unlike in 2018, in March and March 2019 average daily temperatures are 10 degrees Celsius, rising to 15o, only in the third ten days of April.
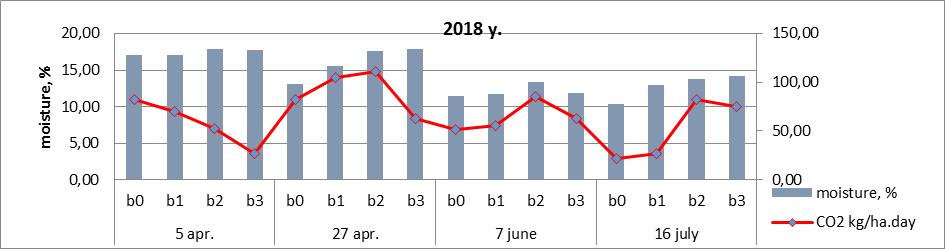
Fig. 1 Climatic characteristics of the biennium (2018 - 2019) Accordingly, this has resulted in significant CO2 emissions in April 2018y. due to the sharp warming and high humidity, while in April 2019y. there were more moderate carbon dioxide emissions. There were higher CO2 emissions in June for both years, dropping in late July of 2019y, because of low humidity. There was slow rise in temperatures in May, 2019y. The temperatures settled at about 15 degrees by the third ten days of May, reflecting a lower intensity of soil respiration. Soil moisture and soil temperature do not affect carbon emissions as separate factors. They have an impact on CO 2 emissions jointly in our experiments. CO2 emissions depend most on applied technologies for cultivation. Generally, during the growing season, variant with manure surface application have the highest carbon dioxide emissions. In contrast to these variants, the organic carbon incorporated by vertical mulching, combined with minimum tillage, results in lower carbon emissions.
-7-
Agricultural, Forest and Transport Machinery and Technologies (ISSN: 2367– 5888) Volume VII – Issue 1, 2020
ANOVA NS (CO2); moisture NS
ANOVA NS (CO2); moisture NS
Fig. 2 Soil moisture content (0-10 cm),% and CO2 emissions, kg / ha day
Fig. 3 CO2 emissions, kg / ha day In relation with the fluxes of CO2 from the soil, the quantities of labile carbon (Fig. 4) and electrical conductivity (Fig. 5) were measured. The results show higher quantities of labile carbon, total carbon, and electrical conductivity for surface and vertical manure applications. Higher amounts of nutrients are present in the presence of high values of electrical conductivity. All this leads to a more intensive separation of CO2 from the soil in the variant with manure surface application and conventional treatments, while the minimal disturbance of the soil surface and the introduction of organic matter into the slits leads to lower emission values than traditional the variants processed.
-8-
Agricultural, Forest and Transport Machinery and Technologies (ISSN: 2367– 5888) Volume VII – Issue 1, 2020
ANOVA: 2018- p= 0.0982; 2019 – NS
Fig. 4 Labile carbon content, mg/g
ANOVA: 2018- NS; 2019 – p= 0.0795
Fig. 5 Electrical conductivity, µS / cm The CO2 emissions of b2 variants with conventional tillage and surface mulching are highest. Accordingly, in this variants the highest levels of labile organic carbon are also observed. In variant with surface mulching in 2018y., CO2 emissions are 83.01 kg/ha day in 2019y. - 72,93 kg/ha day Emissions of the last variant b3, applying minimum tillage and vertical mulching, are significantly lower, with an average of 56,88 kg/ha day and 54 in 2018y and 2019y respectively, 02 kg/ha day, while in the case of conventional treatments applied to the slope of the slope, they are 64,41kg/ha day and 63,69 kg/ha day, which shows the effect of minimum treatments on soil emissions, and is an organic substance imported. The effect is stronger at the beginning of the growing season and the differences in emissions there are much larger. The carbon emissions of the conventional control variant applied along the slope are 59.54 kg / ha day and 60.55 kg / ha day. CONCLUSION From the results obtained in the studies conducted, the following conclusions can be made: ̶ Carbon dioxide emissions from soil in the present experiments show a dependence on climate factors and their combined action, but are most strongly influenced by the applied technologies for wheat cultivation on sloping arable land. ̶ The highest CO2 emission values as well as the highest quantities of labile carbon are observed in the variant grown with surface application of manure. The application of organic soil amendments leads to an increase in labile organic matter as well as carbon dioxide emissions. ̶ Soil CO2 emissions are lower for the minimum tillage with vertical mulching variant, and they are 28.88% lower than the surface mulching variant, which means that it is much higher of the incorporated organic matter remains in the soil. The carbon emissions in this variant are 13.40% on average lower than the variant by applying conventional (traditional)
-9-
Agricultural, Forest and Transport Machinery and Technologies (ISSN: 2367– 5888) Volume VII – Issue 1, 2020
tillage across the slope. Due to compaction and lower humidity, the emissions of the variant using conventional technologies along the slope are lower than those using the same technology transverse to the slope. ̶ Advanced soil protection technology for minimum and unconventional tillage for growing wheat on sloping terrains has not only high erosion efficiency but is also a way of incorporating organic matter into the soil without observing significant carbon emissions from the soil. Minimum operations also contributes to reducing emissions from both the processing itself and the use of fossil fuels. REFERENCES [1] Abbas, F., Fares, A., Valenzuela, H., Fares, S., (2012) Carbon Dioxide Emissions from an Organically Amended Tropical Soil Journal of Sustainable Agriculture 36:3–17 [2] Butterbach-Bahl, K., Kahl, M., Mykhayliv, L., Werner, C., Kiese, R., Li, C., (2009) European-wide inventory of soil NO emissions using the biogeochemical models DNDC/Forest-DNDC. Atmos. Environ. 43 (7), 1392–1402. [3] Dimitrov, P., (2016) Technology and System of Machines for Soil Protection. Dissertation for Acquisition of degree Doctor of Science", "Angel Kanchev" University of Rousse, Rousse, 375 p. [4] Dunne, J., Harte, J., (2001) Greenhouse Effect, Encyclopedia of Biodiversity, Edition: 1, Chapter: volume 3, Academic Press [5] Dutaur, L., Verchot, L., (2007) A global inventory of the soil CH4sink. Glob. Biogeochem. Cycles 21 (n/a), http://dx.doi.org/10.1029/2006GB002734. [6] Eurostat, https://ec.europa.eu/eurostat/statistics-explained/index.php/Agrienvironmental_indicator_-_mineral_fertiliser_consumption [7] Gundersen, P., Christiansen, J.R., Frederiksen, P., Vesterdal, L.(2012). Influence of hydromorphic soil conditions on greenhouse gas emissions and soil carbonstocks in a Danish temperate forest. For. Ecol. Manage. 284, 185–195. [8] Nagano H., Kato, S., Ohkubo, S., Kazuyuki, I., (2012) Emissions of carbon dioxide, methane, and nitrous oxide from short- and long-term organic farming Andosols in central Japan, Soil Science and Plant Nutrition, 58:6, 793-801, DOI: 10.1080/00380768.2012.739550 [9] János, P., J., Rádics, I., Jóri, J., Fenyvesi L., (2014). Soil CO2 Emission Induced by Tillage Machines. Hungary International Journal of Applied Science and Technology Vol. 4, No. 7. [10] Jarvis, P., Rey, A., & Petsikos, C., Wingate, L., Rayment, M. & Pereira, J., Banza, J., David, J., Miglietta, F., Borghetti, M., Manca, G., Valentini, R., (2007) Drying and wetting of Mediterranean soils stimulates decomposition and carbon dioxide emission: The "Birch effect". Tree physiology. 27. 929-40. 10.1093/treephys/27.7.929. [11] Jungkunst, H., Fiedler, S., (2007) Latitudinal differentiated water table control of carbon dioxide, methane and nitrous oxide fluxes from hydromorphic soils: feedbacks to climate change. Glob. Change Biol. 13, 2668–2683. [12] Kollarova K., Pogran S., Kangalov, P., (2015) Precision Tillage: On the Way from Information to Decisions - Scientific Monograph. University of Ruse “Angel Kanchev”, ISBN 978-954-712-656-5. [13] Kuncheva, G., (2016) Author of the dissertation thesis for the award of educational and scientific degree "Doctor" on topic "Soil protection and agricultural efficiency of advanced minimal and unconventional erosion control tillage when growing crops on slope lands ". Sofia, 147 pp.
- 10 -
Agricultural, Forest and Transport Machinery and Technologies (ISSN: 2367– 5888) Volume VII – Issue 1, 2020
[14] Lee, J., Hopmans, J., Kessel C., A. King, A., Evatt, K., Louie, D., Rolston, D., Six, J., (2009) Tillage and seasonal emissions of CO2, N2O and NO across a seed bed and at the field scale in a Mediterranean climate. Volume 129, Issue 4, Pages 378-390. [15] Oertela, C., J. Matschullata, K. Zurbaa, F. Zimmermanna, S. Erasmib (2016) Greenhouse gas emissions from soils—A review. Chemie der Erde 76, 327–352. [16] Romaniw J., João Carlos de Moraes Sá, Ademir de Oliveira Ferreira, Thiago Massao I. (2016) Organic Fertilizers - From Basic Concepts to Applied Outcomes C‐CO2 Emissions, Carbon Pools and Crop Productivity Increased upon Slaughterhouse Organic Residue Fertilization in a No‐Till System, chapter 10, http://dx.doi.org/10.5772/63123 [17] Smith W., Grant, B., Desjardins, R., Qian, B., Hutchinson, J., Gameda, S., (2009) Potential impact of climate change on carbon in agricultural soils in Canada 2000–2099, Climatic Change 93:319–333 [18] Speir, W., Kettles, H., More, R., (1995). Aerobic emissions of N20 and N2 from soil cores: factors influencing production from 13N-labelled NO3 and NH4: Soil Biol. Biochem. Vol. 27. No. 10, pp. 1299-1306. [19] Strosser, E., (2010) Methods for determination of labile soil organic matter: An overview Journal of agrobiology, 27(2): 49–60 CONTACTS Gergana Kuncheva, Institute of Soil Science, Agricultural and plant protection “Nikola Poushkarov” Sofia,, Laboratory of soil analysis and soil erosion research, University of Ruse, 8, Studentska Str., 7017 Ruse, Bulgaria, e-mail: g1nikolova@abv.bg Petar Dimitrov, Institute of Soil Science, Agricultural and plant protection “Nikola Poushkarov” Sofia, Experimental Station for Erosion Control, University of Ruse, 8, Studentska Str., 7017 Ruse, Bulgaria, e-mail: pddimitrov@dir.bg, Hristo Beloev, Department of Agricultural Machinery, Agrarian and Industrial Faculty, University of Ruse “Angel Kanchev”, 8 Studentska str., 7017 Ruse, Bulgaria, e-mail: hbeloev@uni-ruse.bg Iliana Ivanova, Institute of Agriculture and Seed Science "Obraztsov Chiflik" – Ruse, 1, Prof. Ivan Ivanov Str., 7007 Ruse, Bulgaria, e-mail: tri_dve@abv.bg
- 11 -
Agricultural, Forest and Transport Machinery and Technologies (ISSN: 2367– 5888) Volume VII – Issue 1, 2020
Possibilities to Reduce Methane and Hydrogen Sulphide Emissions in Pig Farming By Application of Zeolite Stefan Bodo, Roman Galik, Katarina Kollarova, Plamen Kangalov Abstract: This paper deals with the possibility of using environmentally friendly materials applied to the floor in pig housing to reduce the emission of greenhouse gases. We have focused on the possibility of reducing the methane (CH4) and hydrogen sulphide (H2S) emissions by application of zeolite. That has been applied at the rate of 1.2 kg on the floor. The results show that temperature and relative humidity have an impact on H2S and CH4 emissions. With zeolite treatment, we obtained a statistically significant difference in H2S emissions (P = 0.00 < α = 0.05) and CH4 (P = 0.00 < α = 0.05) between the zeolite-treated and untreated sections. Keywords: fattening pigs, greenhouse gases, reduction, zeolite, CH4, H2S
INTRODUCTION Pig housing on farms poses a risky business for the farmer. The risk of swine fever from neighbouring countries, low feed-in tariffs, outdated technology and the lack of funds for the construction of new farms has resulted in end for many farms. Gas emissions from livestock farming result in fees due the production of harmful substances. Around 20–35 % of greenhouse gas emissions come from agriculture (IPCC, 2001). The globally, pork production is estimated to emitabout 668 million tonnes CO2-eq, representing 9 percent of the livestock sector emissions (Food and Agriculture Organization of the United Nations, 2013). The methane (CH4) greenhouse gas is involved in global warming and climate change (IPCC, 2007). Global concentrations of these two gases have increased significantly over the last 150 years (IPCC, 2001) and are affecting the environment – increased greenhouse gas emissions (Zavattaro et al., 2012), as well as animal housing where straw is used as litter (Brown et al., 2001). The warming potential of nitrous oxide is 290–310 times higher than that of carbon dioxide (IPCC, 2007). It can usually be estimated that the carbon dioxide produced by livestock is compensated by photosynthesis of plants (Philippe et al., 2011). Carbon dioxide emissions differ from the pig rearing, weaning and fattening systems (Dubeňová et al., 2011; Dubeňová et al., 2013; Philippe et al., 2007a; Philippe et al., 2007b; Cabaraux et al., 2009). Manure removal methods affect the production of harmful gases in pig fattening (Mihina et al., 2011). The process of releasing greenhouse gases into the atmosphere depends on livestock housing, nutrition, manure management, its storage and land application (Palkovičová et al., 2009). The number and weight of animals, manure removal method and time of its removal, temperature, humidity, pH, litter reaction, C:N ratio and ventilation system performance have a significant impact on gas emissions in the farm (Topisirovic et al., 2010a; Topisirovic et al., 2010b). Many factors have to be considered for a successful emission assessment, including the season time and amount of litter, animal density, type of floor area, feeding and watering procedures, ventilation, temperature and relative humidity (Brouček 2018; Philippe et al., 2016). Changing manure management from liquid systems to solid/liquid separation systems together with mitigation measures could simultaneously reduce greenhouse gas emissions (Wang et al., 2017). The emissions of gases from animal housing are thus dependent on breeding technology (Cabaraux et al., 2009). However, there is also the possibility of reducing greenhouse gas emissions with biological agents (Jelínek et al., 2004). As reported by Galajda et al. (2000), the use of zeolite as bio-filter to eliminate greenhouse gases and ammonia is suitable. MATERIAL AND METHODS In the farm, we investigated the possibilities of harmful gases reduction by applying the natural raw material zeolite. It is used for cleaning natural and other gases CO2, H2S, SO2, and
- 12 -
Agricultural, Forest and Transport Machinery and Technologies (ISSN: 2367– 5888) Volume VII – Issue 1, 2020
NH3. The seller recommends dosing by 10 % of the consumed feed. In the housing, pigs were fattened in a hall with two sections, each with ten pens. The measurement was realized in winter time. The windows were closed as well as all the doors. The air was exchanged naturally through the chimney in the roof of the section with a diameter of 500 mm. There was one chimney in each section. During feeding and cleaning of the pens, fans were turned on to extract the air from the farm. After that, the section was closed and the fans turned off to maintain the temperature in. In one part of the section, we applied 150 kg of zeolite over two weeks at an average of 1.2 kg per pen and per day. The zeolite was preferably applied to the sites from which the excrements were removed. Subsequently, we measured pollutant emissions. In the first part of the section, where zeolite was not applied, a total of 72 pigs with an average live weight of 85 kg were placed. In the second part of the section, where zeolite was applied, there were a total of 89 pigs with an average live weight of 40 kg. During 24 hours, we monitored the emission of pollutants in the buildings as well as the speed of air flow in the exhaust chimney. To measure the H2S and CH4 emissions, we used the INNOVA 1412 gas analyser and the INNOVA 1309 multipoint sampler together with Comet R3120 to record the temperature both inside and outside the housing. We used the Almemo 2190–2 anemometer to measure the air flow rate. The data were processed using the statistical program Excel and ANOVA. The level of significance was α = 0.05. RESULTS AND DISCUSSION We found that the average values of H2S in the untreated and treated sections were 1587.7 mg·m-3 and 1241.7 mg·m-3, respectively. This represents a decrease of 21.8 %. The measured and calculated values for H2S are shown in Table 1. There was a statistically significant difference in H2S emission between the untreated section and the zeolite-treated section (P = 0.00 < α = 0.05). Table 1 Measured and calculated values for H2S
Measuring
N
Air velociy (m3·s-1)
No. 1
139
0.06
untreated
No. 2
139
0.16
zeolite
Applied agent
Temperature (°C)
Relative air humidity (%)
Average concentration of H2S (mg·m-3)
14.9 ±1.9 14.1 ±2.35
61.8 ±5.5 63.5 ±6.5
1587.7 ±1651.7 1241.6 ±266.5
Emission factor H2S (kg H2S·animal place·year -1) 253.1 223.9
When comparing the effect of air temperature on H2S emission, we noticed a statistically significant difference in the section with and without treatment with zeolite (P = 0.002 < α = 0.05) resp. (P = 0.00 < α = 0.05). When comparing the effect of relative humidity on H2S emission with and without treatment with zeolite, we also noted a statistically significant difference (P = 0.00 < α = 0.05 resp. P = 0.00 < α = 0.05). Table 2 Measured and calculated values for CH4
Measuring
N
Average air velocity (m3·s-1)
No. 1
139
0.06
untreated
No. 2
139
0.16
zeolite
Applied agent
Average temperature (°C)
Average relative air humidity (%)
Average concentration of CH4 (mg·m3)
14.9 ±1.9 14.1 ±2.35
61.8 ±5.5 63.5 ±6.5
12.4 ±6.3 7.1 ±2.6
- 13 -
Emission factor CH4 (kg CH4 ·animal place·year -1 ) 2.0 1.3
Agricultural, Forest and Transport Machinery and Technologies (ISSN: 2367– 5888) Volume VII – Issue 1, 2020
When monitoring the CH4 emission, an average value of 12.4 mg·m-3 was recorded. An average of 7.1 mg·m-3 was measured with zeolite. This represents a decrease of 42.7 %. The measured and calculated values for CH4 are shown in Table 2. There is a statistically significant difference in the CH4 emission between the untreated section and the zeolite-treated section (P = 0.00 < α = 0.05 and P = 0.029 < α = 0.05). When comparing the effect of temperature on the CH4 concentration with and without treatment with zeolite, we observed a statistically significant difference (P = 0.00 < α = 0.05 and P = 0.00 < α = 0.05). When comparing the effect of relative humidity on CH4 emission without and with zeolite treatment, we also noted a statistically significant difference (P = 0.00 < α = 0.05 and P = 0.00 < α = 0.05).
Fig. 1 Behaviour of CH4 emission in the section untreated and treated with zeolite When testing the dependence between qualitative characteristics (the effect of temperature and relative humidity on H2S and CH4 emissions), we observed the mean value of the coefficient of determination between temperature and H2S when treated with zeolite (R2 = 0.47). The determination coefficient R2 indicates that the selected regression model (linear regression line) explains the variability in this case at 47 %. When testing the dependence between qualitative features of zeolite exposure time on CH4 emission (Fig. 1), the equation is y = 0.0213x + 5.6064. The regression relationship shows that every seven minutes the CH4 emission increases by 0.0213 mg·m-3. The determination coefficient is R2 = 0.579. The results show that temperature and relative humidity have an impact on H2S and CH4 emissions. In comparison, we noticed a statistically significant difference in H2S and CH4 emissions in the zeolite-treated section and the untreated section. In this case, we observed a reduction in the emission of harmful substances H2S and CH4 in the zeolite-treated section, as reported by Galajda et al. (2000) versus the untreated section. Our measurements show that air temperature and humidity have a large impact on pollutant emissions, as reported by Topisirovic et al. (2010a; 2010b). In conclusion, as mentioned by Jelínek et al. (2004), the emissions of harmful substances can be reduced by means of biotechnological products. CONCLUSION Our measurements show that one of the possibilities of reducing the emission of harmful substances in pig farming is the application of biotechnological products. By zeolite application, H2S emissions decreased by 21.8 % and CH4 emissions by 42.7 %. There was a - 14 -
Agricultural, Forest and Transport Machinery and Technologies (ISSN: 2367– 5888) Volume VII – Issue 1, 2020
statistically significant difference in the emissions of noxious gases between the section without zeolite treatment and with zeolite treatment. We can assume that it is possible to achieve a reduction in greenhouse gas emissions by the above-mentioned biotechnological product and thus to meet the EU requirement for reducing greenhouse gas emissions. It would be advisable to repeat the measurement, but on a bigger farm which is engaged in intensive rearing of pigs. An important aspect in the use of biotechnological products is the cost and carbon footprint of the product, especially for such small farms. ACKNOWLEDGEMENTS We would like to express our thanks to Jakos a.s. company for their willingness for this experiment in pig farm. REFERENCES [1] Brouček, J., (2018) Nitrous oxide release from poultry and pig housing. Polish Journal of Environmental Studies 27(2), 467–479. [2] Brown, L., Armstrong, Brown, S., Jarvis, S., Syed, B., Goulding, K., Phillips, V., Sneath, R., Pain, B., (2001) An inventory of nitrous oxide emissions from agriculture in the UK using the IPCC methodology: emission estimate, uncertainty and sensitivity analysis. Atmospheric Environment 35, 1439-1449. https://www.journals.elsevier.com/atmospheric-environment [3] Cabaraux, J., Philippe, F., Laitat, M., Canart, B., Vandenheede, M., Nicks, B., (2009) Gaseous emissions from weaned pigs raised on different floor systems. Agriculture, Ecosystems and Environment 130, 86–92. [4] Dubeňová, M., Gálik, R., Mihina, Š., Boďo, Š., Šima, T., (2011) Vplyv hmotnosti ošípaných na koncentráciu amoniaku vo vybranom objekte počas zimného obdobia. Technics in Agrisector Technologies 2011: Proceedings of Scientific Works. FE SUA in Nitra, 20–24. [5] Dubeňová, M., Gálik, R., Mihina, Š., Šima, T., (2013) Ammonia concentration in farrowing pens with permanent limited range of motion for lactating sows. Research in Agricultural Engineering 59 (special issue), S9–S14. [6] EEA, 2011, Greenhouse gas emissions in Europe: A retrospective trend analysis for the period 1990-2008, EEA Report No 6/2011, European Environment Agency (https://www.eea.europa.eu/publications/ghg-retrospective-trend-analysis-1990-2008) accessed 4 January 2019 [7] Galajda, R., Novák, P., Krajňák, M., Ondrašovič, M., Ntimpirangeza, M., (2000) Redukcia amoniaku z odvádzaného vzduchu z objektov ustajnenia zvierat. Available at:http:docplayer.net/39299133-Redukcia-amoniaku-z-odvadzaneho-vzduchu-z-objektovustajnenia-zvierat-reduction-of-ammonia-in-the-waste-air-from-animal-housings.html [8] Food and Agriculture Organization of the United Nations. (2013) Tackling climate change through livestock. A global assessment of emissions and mitigation opportunities, Rome - 2013, E-ISBN 978-92-5-107921-8 (PDF). http://www.fao.org/3/ai3437e.pdf [9] IPCC. 2001. Climate Change 2001: The Scientific Basis [Houghton, J. T. et al. (Eds.)]. Cambridge University Press, Cambridge, UK. [10] IPCC. 2007. Climate Change 2007: The Physical Science Basic. Contribution of Working Group I to the Fourth Assessment Report of the Intergovernmental Panel on Climate Change. Cambridge University Press, Cambridge, United Kingdom/New York, NY, USA.
- 15 -
Agricultural, Forest and Transport Machinery and Technologies (ISSN: 2367– 5888) Volume VII – Issue 1, 2020
[11] Jelínek, A., Dědina, M., Plíva, P., Souček, J., (2004) Research of biological agents effects on reduction of ammonia concentration in stables of intensive farm animals breeding. Research in Agricultural Engineering 50(2): 43–53. [12] Mihina, Š., Karandušovská, I., Lendelová, J., Boďo, Š., (2011) Produkcia škodlivých plynov v objektoch pre výkrm ošípaných s rôznym spôsobom odstraňovania hnoja. Rural Buildings 2011: Proceedings of Scientific Works. FE SUA in Nitra, 84–92. [13] Palkovičová, Z., Knížatová, M., Mihina, Š., Brouček, J., Hanus, A., (2009) Emissions of greenhouse gases and ammonia from intensive pig breeding. Folia Veterinaria 53, 168– 170. [14] Philippe, F., Laitat, M., Canart, B., Vandenheede, M., Nicks, B., (2007a) Comparison of ammonia and greenhouse gas emissions during the fattening of pigs, kept either on fully slatted floor or on deep litter. Livestock Science 111, 144–152. [15] Philippe, F., Laitat, M., Canart, B., Vandenheede, M., Nicks, B., (2007b) Gaseous emissions during the fattening of pigs kept either on fully slatted floors or on straw flow. Animal 1, 1515–1523. [16] Philippe, F., Cabaraux, J., Nicks, B., (2011) Ammonia emissions from pig houses: influencing factors and mitigation techniques. Agriculture, Ecosystems and; Environment 141, 245–260. [17] Philippe, F., Laitat, M., Wavreille, J., Nicks, B., Cabaraux, J., (2016) Floor slat openings impact ammonia and greenhouse gas emissions associated with group-housed gestating sows. Animal 10(12), 2027–2033. [18] Topisirovic, G., Radojičic, D., Dražic, M., (2010a) Mogućnosti poboljšanja efektada rada ventilacionog sistema u odeljenjima prasilište i odgajalište na farmi svinja ‘Farkaždin’. Poljoprivredna tehnika 35, 5–16. [19] Topisirovic, G., Radojičic, D., Radivojevic, D., (2010b) Predlog poboljšanja ambijentalnih uslov u objektima za tov svinja na farmi ‘Vizelj’. Poljoprivredna tehnika 35, 17–25. [20] Zavattaro, L., Grignani, C., Acutis, M., Rochette, P., (2012) Mitigation of environmental impacts of nitrogen use in agriculture. Agriculture, Ecosystems and Environment 147, 1– 3. [21] ZEOLIT – Zeocem a.s. Mechanizmus účinku vlastností zeolite. http//zeocem.com/sk/zeolit [22] Wang, Y., Dong, H., Zhu, Z., Gerber, P., Xin, H., Smith, P., Opio, C., Steinfeld, H., Chadwick, D., (2017) Mitigating greenhouse gas and ammonia emissions from swine manure management: A system analysis. Environmental science & Technology 51(8), 4503–4511. CONTACTS Štefan Boďo, Department of Building Equipment and Technology Safety, Faculty of Engineering, Slovak University of Agriculture in Nitra, Tr. A. Hlinku 2, 949 76 Nitra, Slovak Republic, e-mail: stefan.bodo@uniag.sk Roman Gálik, Department of Building Equipment and Technology Safety, Faculty of Engineering, Slovak University of Agriculture in Nitra, Tr. A. Hlinku 2, 949 76 Nitra, Slovak Republic, e-mail: roman.galik@uniag.sk Katarína Kollárová, Information and Coordination Centre of Research, Faculty of Engineering, Slovak University of Agriculture in Nitra, Tr. A. Hlinku 2, 949 76 Nitra, Slovak Republic, e-mail: katarina.kollarova@uniag.sk Plamen Kangalov, Agrarian and Industrial Faculty, University of Ruse Angel Kanchev, 8, Studentska Str., 7017 Ruse, Bulgaria, e-mail: kangalov@uni-ruse.bg
- 16 -
Agricultural, Forest and Transport Machinery and Technologies (ISSN: 2367– 5888) Volume VII – Issue 1, 2020
A Comparative Study of the Sensitivity of Maize Lines to Some Herbicides Dimitriya Ilieva Abstract: In 2008-2010, on a soil type highly leached chernozem, a field experiment was conducted on the effects of herbicides for johnsongrass control rimsulfuron (Titus 25 DF) and nicosulfuron (Mistral 4 CK), administered at an optimal dose, once and twice, within an interval of 14 to 20 days. The sensitivity and yield of four maize lines - RM 619, MO 17, 61/31 and 302/12 was tested. The aim of the current experiment is to obtain information on the impact of the herbicides rimsulfuron and nicosulfuron on the sensitivity and yield of inbred maize lines.The most sensitive to herbicides for johnsongrass control with the highest percentage of perishing plants is line RM 619, and the most resistant one is MO 17. The grain yield reported in the test lines treated with herbicides for johnsongrass control was lower than the control variants of the relevant genotype. Only МО 17 and 302/12 lines treated twice with herbicide Titus 25 DF reported yield increase of 7% and 6 % against the control group. Ke words: maize, inbred, herbicides, rimsulfuron, nicosulfuron, yield
INTRODUCTION Maize belongs to the group of cereal crops grown in Bulgaria. They determine the structure of the Bulgarian wholesale agriculture. It is a major crop providing 62,4% of the grain used for animal food. The biological potential of each plant is not only genetically predetermined but it is influenced by the conditions of cultivation (Bazitov, Ret all., 2010; Христов и др. 2010; Кунева и др. 2014). The elements of high yield and quality of the agricultural crops are a complex of interconnected factors such as appropriate crop rotation, soil quality, selection of appropriate for the particular agroecological region variety and hybrid, as well as the usage of high quality seeds (Делибалтова В. и кол., 2009; Митков А. и кол., 2009; Мънгова М. и кол., 1986). The plant protection activities and fertilization are an integral part of these factors, as evidences by a large number of scientific studies (Титянова М. и кол., 2007; 2010). Green and Ulrich (1993), Molnar et al. (2001) and Milivojevic et al. (2003) examine more than 100 maize hybrids that showed resistance to rimsulforon, nicosulforon, primisulforon and tidensulforon. In maize fields with mixed weeds, both grass-like and broadleaf weeds, the highest level of herbicide efficacy has the combined usage of the herbicides Titus + Arat Titus + Harmony (Kopmanis and Gailе, 2008 и 2010). In their study, Waligora et al. (2008) investigated the herbicides atrazine, formasulfuron + iodosulfuron, S-metolachlor, MCPA + dicamba, fluroxypyr + 2.4-D, florasulam + 2.4-D, rimsulfuron, bromoxynil, isoxaflutol + flufenacet, petoxamide, and flumidioxin cyflidoxidine. The herbicides were applied individually and in combination, according to the doses recommended by the manufacturers, in phase 3th- 4th leaf of the crop, showing high selectivity, with the exception of the administered rimsulfuron. The highest yields (cobs) were obtained from the combination of formasulfuron + iodosulfuron and fluroxypyr + 2.4-D, and the lowest yield was reported after the application of the herbicides S-metolachlor and MCPA + dicamba. Ivanovic et al. (1998) reported that leaf herbicides rimsulfuron, primsulfuron-methyl, prosulfuron + prsulfuron-methyl and nicosulfuron have a retardant effect - they increase grain yield but also reduce plant height. However, Stefanovic et al. (2001 and 2006) reported an increase in corn height under the influence of nicolsulfuron, rimsulfuron and primsulfuron-methyl.
- 17 -
Agricultural, Forest and Transport Machinery and Technologies (ISSN: 2367– 5888) Volume VII – Issue 1, 2020
The aim of the current study is to obtain information on the impact of the johnsongrass control herbicides - rimsulfuron and nicosulfuron on the sensitivity and yield of inbred maize lines. MATERIAL AND METHODS In 2008 – 2010, a field experiment on maize was carried out with the perpendicular method of Shanin in four replications with a size of the experimental plot of 10 m2 ((Shanin, 1977) in the experimental field of the Institute of Agriculture and Seed science "Obraztsov Chiflik" - Rousse, on a soil type highly leached chernozem, low humus content (1.98%), low mineral N content(10.75 mg.1000 g-1 soil) and mobile P2O5 (6.31 mg.1000 g-1 soil) and good reserve of K2O (22.50 mg.1000 g-1 soil) in the layer 0 – 40 cm. The sensitivity of four inbred maize lines was examined – РМ 619 , МО -1 7 , 61/31 and 302/12 to the herbicides rimsulforon and nicosulforon. The sowing was carried out within the optimal period for the region (first 10 days of April) with crop density 5500 plants per da (Popov and Pavlov, 1966). The application of the rimsulforon and nicosulforon herbicides was done during 4th th 5 leaf phase with a backpack sprayer and concentration of work solution of 20 l.da-1. It was applied in optimal doses, once and twice at intervals of 14 to 20 days (Table 1). The experimental field was maintained weed free for the entire maize growing season through two inter-row treatments. The maize was grown without inter-row cultivation after a precursor wheat. It was fertilized with N10 P8 K8. The fertilizers were applied as follows: phosphorus (superphosphate) and potassium (potassium chloride) imported with the main autumn tillage, and all the nitrogen fertilizer (ammonium nitrate) before sowing. Table 1 Variants of the experiment Doses - herbicides, g.da-1 (ml.da-1)
Variants 1 2 3 4 5
Control - untreated Titus 25DF (250 g.kg-1rimsulfuron) Titus 25DF (250 g.kg-1rimsulfuron Mistral 4SК (40 g.l-1 nicosulfuron) Mistral 4SК (40 g.l-1 nicosulfuron)
3+2 5 100+50 150
Doses active substance, g.da-1 0.75+0.50 1.25 4+2 6
The following indicators were reported for the realization of the experiment: phytotoxicity of the herbicides on the 7-th, 17-th and 30-th day after their application (according to logarithmic scale (1-9 points) of EWRS at score 1 - no damage and at score 9 the crop was completely destroyed and seed yield kg.da-1. Statistical processing of the experimental data was performed using the method of disperse analysis of Shanin. RESULTS AND DISCUSSION The experimental field of the Institute belongs to a region with moderate continental climate. For the period of the study (2010-2008), the agrometeorological conditions in terms of temperature and precipitation amounts vary by month, both in individual years and in comparison with the multiannual averages (climate normals) for the period 1896 - 2005. The period 2008 – 2009 was moderately favorable for maize (Figure 1). In 2008, the amount of precipitation in April (51.6 mm) and May (58 mm) was close to the climate norm (51.1 mm and 66.2 mm). In 2009, the monthly precipitation for the same period was 12.7 mm (April) and 29.8 mm (May), which were respectively 25% and 45% below the multi-annual
- 18 -
Agricultural, Forest and Transport Machinery and Technologies (ISSN: 2367– 5888) Volume VII – Issue 1, 2020
rate (51.1 mm and 66.2 mm). The average monthly air temperature for the period April September ranges from 12.79 to 25.03 ⁰C (for 2008) and from 12.37 to 25.13 ⁰C (for 2009) at the multiannual rate of 11.39 to 23, 86 ⁰C. Extremely high temperatures and significant water stress did not adversely affect maize development. The soil moisture content was better in 2010. The precipitation in April (38.4 mm) and May (81.7 mm) created favorable conditions for the emergence, growth and development of the maize plants. Precipitation in June (81.5 mm) was decisive for the yield. In terms of temperature, 2009 (for the entire maize growing season) differs in temperatures (589.6 ⁰C) around the norm (572.2⁰C). In August, higher temperatures (25.13 ⁰C) were recorded than the multiyear norm of 23.86 ⁰C, which is a characteristic of the global warming observed in recent years.
Fig. 1 Average monthly air temperatures and precipitation by month for period 2008 - 2010 On average, for the three-year test period, line RM 619 showed the highest sensitivity, where the rate of plant loss reached 46.6% with the use of Mistral 4CK administered twice at the optimal dose (Table 2). In the variant with the application of the Titus 25DF herbicide at the optimal dose once, the percentage of dead plants was 26.8%, and administered in a system, respectively 21.3%. The next most sensitive to johnsongrass control herbicides is line 61/31, with the highest rate of dead plants of 25.0% reported after a single treatment of Titus 25 DF at the optimal dose, followed by the single-dose treatment with Mistral 4CK at the optimal dose - 20.8%. The third most susceptible line to herbicides is 302/12 line, with a mortality rate ranging from 10.9% to 21.3%. The highest resistance to the administered johnsongrass control herbicides Titus 25DF and Mistral 4CK+, administered in optimal doses, both once and in a system, was observed in line MO 17 where the percentage of dead plants varied from 0.4% to 2.3%. The disperse analysis shows that there are differences between the compared factors (emerged and perished plants) with a difference of the examined factor of 5% and 0,1%.
- 19 -
Agricultural, Forest and Transport Machinery and Technologies (ISSN: 2367– 5888) Volume VII – Issue 1, 2020
Table 2 Effect of herbicides Titus 25DF and Mistral 4СК on the growth of maize lines RM 619, MO 17, 61/31 и 302/12 Variants
Number of plants emerged RM 619
Control - untreated Doses - active substance Titus 25DF (250 g.kg-1rimsulfuron) Титус 25ДФ (250 g.kg-1 римсулфорон) Titus 25DF (250 g.kg-1rimsulfuron Mistral 4СК (40 g.l-1 nicosulfuron) Mistral 4СК (40 g.l-1 nicosulfuron)
Number of plants perished
%
47
0
0
49
10.4*
21.3
48
12.9*
26.8
48 47
22.2* 1.2*
46.6 2.5
45
0
0
46 47 44 46
0.2* 0.5* 1.0* 0.2*
0.4 1.0 2.3 0.5
47
0*
0
48 48 48 46
7*** 12*** 5*** 10***
14.6 25.0 10.4 20.8
0
0
5*** 9*** 6*** 10***
10.9 18.8 12.8 21.3
MO 17 Control-untreated Doses - active substance Titus 25DF (250 g.kg-1rimsulfuron) Titus 25DF (250 g.kg-1rimsulfuron Mistral 4СК (40 g.l-1 nicosulfuron) Mistral 4СК (40 g.l-1 nicosulfuron) 61/31 Control –untreated Doses - active substance Titus 25DF (250 g.kg-1rimsulfuron) Titus 25DF (250 g.kg-1rimsulfuron Mistral 4СК (40 g.l-1 nicosulfuron) Mistral 4СК (40 g.l-1 nicosulfuron) 302/12 Control-untreated 47 doses - active substance Titus 25DF (250 g.kg-1rimsulfuron) 46 -1 Titus 25DF (250 g.kg rimsulfuron 48 Mistral 4СК (40 g.l-1 nicosulfuron) 47 -1 Mistral 4СК (40 g.l nicosulfuron) 47 Legend: *, **, ***, where GD < 5 %; 1 % and 0.1%.
Both herbicides, Titus 25DF and Mistral 4CK, showed no phytotoxicity when used once and twice in the optimal dose, based on the phonological observations carried out on 7-th, 17th and 30-th day after the treatment of МО 17 and 302/12 lines (table 3). Sensitivity was observed to the used johnsongrass control herbicides Titus 25DF and Mistral 4CK in lines RM 619 and 302/12. It was expressed in tumor-like formations (EWRS score 3-5) which lead to the suppression of the plants and some of them perished.
- 20 -
Agricultural, Forest and Transport Machinery and Technologies (ISSN: 2367– 5888) Volume VII – Issue 1, 2020
Table 3 Herbicide selectivity for maize lines RM 619, MO 17, 61/31, 302/12
Day of report Herbicide
7th day
17th day
30th day
4 5 3 1
3 4 2 1
1 1 1 1
1 1 1 1
4 5 3 1
3 4 2 1
1 1 1 1
1 1 1 1
RM 619 Titus 25DF Mistral 4СК
Titus 25DF Mistral 4СК
Titus 25DF Mistral 4СК
Titus 25DF Mistral 4СК
3+2 g.da-1 5 g.da-1 100+50 ml.da-1 150 ml.da-1 3+2 g.da-1 5 g.da-1 100+50 ml.da-1 150 ml.da-1 3+2 g.da-1 5 g.da-1 100+50 ml.da-1 150 ml.da-1 3+2 g.da-1 5 g.da-1 100+50 ml.da-1 150 ml.da-1
4 5 5 3 MO 17 1 1 2 1 61/31 4 5 5 3 302/12 1 1 2 1
For the research period the maize realized its productive potential through the grain yield to varying degrees under the influence of the studied factors – climate, genotype and herbicides. The negative influence of herbicides on the number of plants, their growth and development had also affected the yield of seeds (table 4). On average for the period of research, the highest decrease in yield is reported when the herbicides are used twice. The yield in line RM 619 treated with Titus - 3+2 g.da-1 is 25 % lower than the control crop in comparison with Mistral 4 CK - 100+50 ml.da-1 – 31%. The Mistral 4 CK herbicide had a more suppressing effect on the grain yield in comparison to Titus 25 DF. On average for the reported period, the yield of RM 619 line treated twice with Titus 25 DF was 227 kg.da-1, and Mistral 4 CK was 209 kg.da-1. The trend is similar in line 61/31, where in the variant treated with Titus 25 DF twice had a decrease in the yield of 21 % compared to the control crop. In relation to the yields МО 17 and 302/12 lines showed better resistance to the double treatment with herbicides in optimal dose. There is a similar trend in the single application of the examined herbicides in relation to the yield. Lines RM 619 and 61/31 showed higher sensitivity towards the herbicides. The proof of difference in the analysis of variance is reported in the following factors: genotype and dosa. There are no proven differences in relation to the impact of the examined herbicides.
- 21 -
Agricultural, Forest and Transport Machinery and Technologies (ISSN: 2367– 5888) Volume VII – Issue 1, 2020
Table 4 Grain yields (kg.da-1) of maize inbred lines treated with the herbicides Titus 25DF and Mistral 4CK Grain yields (kg.da-1) of maize
Variants Inbred lines control RM619 once R6M19 twice RM619 control MO17 once MO17 twice MO17 control 61/31 once 61/31 twice 61/31 control 302/12 once 302/12 twice 302/12 control RM619 once RM619 twice RM619 control MO17 once MO17 twice MO17 control 61/31 once 61/31 twice 61/31 control 302/12 once 302/12 twice 302/12
Herbicides untreated Titus - 5 g.da-1 Titus - 3+2 g.da-1 untreated Titus - 5 g.da-1 Titus - 3+2 g.da-1 untreated Titus - 5 g.da-1 Titus - 3+2 g.da-1 untreated Titus - 5 g.da-1 Titus - 3+2 g.da-1 untreated Mistral - 150 ml.da-1 Mistral - 100+50 ml.da-1 untreated Mistral - 150 ml.da-1 Mistral - 100+50 ml.da-1 untreated Mistral - 150 ml.da-1 Mistral - 100+50 ml.da-1 untreated Mistral - 150 ml.da-1 Mistral - 100+50 ml.da-1
ANOVA (analysis of variance) F- Fisher’s coefficient Dose 7,245
2008г. 221 200 314 251 292 368 105 201 165 88 247 248 221 301 200 251 355 292 427 127 48 88 180 128
2009г. 384 272 222 208 239 248 427 336 250 423 355 339 384 367 272 208 291 239 269 362 360 423 357 398
2010г. 311 155 144 273 166 169 269 148 221 338 228 311 311 157 155 273 88 166 267 104 161 338 136 258
Average for the period 305 209 227 244 232 262 267 228 212 283 277 299 305 275 209 244 245 232 267 198 190 283 224 261
Degree of freedom 6
mistake
probability - p
30,000
0,000076
Line
3,056
9
36,657
0,007852
Herbicides
2,015
3
15,000
0,155103
CONCLUSIONS 1. The highest sensitivity to the examined herbicides was reported in line RM 619, followed by line 61/31, where the highest percentage of mortality rate of 25% was reported when Titus 25 DF was applied in optimal dose once, followed by the variant treated once with Mistral 4 CK in optimal does – 20.8%. Third most sensitive one was 302/12 line where the percentage of dead plants varies from 10.9 % to 21.3%. 2. The percentage of mortality rate in МО 17 and 302/12 lines as a result of the applied herbicides Titus 25 DF and Mistral 4 CK was lower that the relevant untreated control line. - 22 -
Agricultural, Forest and Transport Machinery and Technologies (ISSN: 2367– 5888) Volume VII – Issue 1, 2020
3. Based on the experiment’s results we do not recommend the usage of johnsongrass control herbicides in seed production. 4. The yield of grain in the experimental lines treated with johnsongrass control herbicides is lower than the control variant of the relevant genotype. Only МО 17 and 302/12 lines, treated with Titus 25 DF twice, reported an increase in yield of 7% and 6% against the control crop. REFERENCES [1] Bazitov, R., Ganchev, G., Bazitov, V., Michailova, M., (2010) The role of processing and soil fertilizacion on changes in chemical composition of pea-wheat mixture. International scientific online journal “Science & Technologies”, Plant studies (6):205-208. [2] Beloev H., Dimitrov, P., Kuncheva, G., (2018) Comparative Research on Advanced Technologies for Minimum and Unconventional Soil Tillage with Application of Different Mulching Materials, for Growing Maize for Grain, on Sloping Agricultural Lands. Agricultural, Forest and Transport Machinery and Technologies (ISSN: 2367– 5888) Volume V – Issue 1, 2018, pp. 38 – 48. [3] Delibaltova, V., Jeliazkov, Il., Tonev, T. (2009) Vlianie na niakoi herbicidi varhu zaplevelenostta i produktivnostta na obiknovenata pshenica (Triticum aestivum L.), Agrarni nauki, № 2, str. 19-25. [4] Green, J., Ulrich, J., (1993) Response of corn (Zea mays L.) inbreds and hybrids to sulfonylurea herbicides. Weed science, 41(3), 508- 516. [5] Hristov, I., Davidov, E., Georgiev, D., Angelov, V., Petrov, P., Cvetanova, G., (2010) Dobiv na suha masa i energiina efektivnost na kulturite v petpolno seitboobrashtenie v zavisimost ot toreneto International scientific on-line journal “Science & Technologies”, Plant studies (6), 154-159. [6] Ivanovic, M., Jelicic, Z., Markovic, S., Dragovic, G., Martic, M., (1998) Reactions of inbred lines of maize on herbicides from the sulfonilurea group. Zbornik naucnih trudove, 4(1), 87-93. [7] Kuncheva, G., Dimitrov, P., Beloev, H., (2018) Determination of Mineral Nitrogen Losses under the Action of Water Erosion Processes in Maize Growing on Sloping Terrains. Agricultural, Forest and Transport Machinery and Technologies (ISSN: 2367– 5888) Volume V – Issue 1, 2018, pp. 61 – 66. [8] Kuncheva G., Beloev, H., Dimitrov, P., (2018) Losses of Mineral Nitrogen under the Influence of Water Erosion Processes in the Wheat Cultivation on Sloping Agricultural Lands. Agricultural, Forest and Transport Machinery and Technologies (ISSN: 2367– 5888) Volume V – Issue 1, 2018, pp. 67 – 73. [9] Kuneva, V., Kalaidjieva, R., Matev. Al., (2014) Korelacionni zavisimosti mejdu strukturnite elementi na dobiva pri soiata, otglejdani pri razlichen poliven rejim, Nauchni trudove, Rusenski universitet, tom 53, seria 1.1., Ruse, 40-43, ISSN 1311-3321. [10] Kopmanis, J., Gaile, Z., (2008) Use efficiency of herbicides in maize. Latvijas Lauku konsultaciju un izglitibas centrs, Ozolnieki, Jelgava reg. (Latvia), Ozolnieki (Latvia), 58233. [11] Kopmanis, J., Gaile, Z., (2010) Efficacy of weed control in maize for silage. Raksti Latvijas Lauksaimniecibas universitate, 24 (319), 1- 11. [12] Kollarova K., Pogran, S., Kangalov, P., (2015) Precision Tillage: on the Way from Information to Decisions - Scientific Monograph. University of Ruse “Angel Kanchev”, ISBN 978-954-712-656-5. [13] Mitkov, A., Titiyanova, M., Tonev, T., (2009) Selektivnost na herbicidniya preparat Uidmaster uam zarneno-jitni kulturi, Treti nacionalen simpozium „ Ekologichni podhodi pri proizvodstvoto na bezopasni hrani „, str. 245-252.
- 23 -
Agricultural, Forest and Transport Machinery and Technologies (ISSN: 2367– 5888) Volume VII – Issue 1, 2020
[14] Milivojevic, M., Stefanovic, L., Husic, I., Simic M., Hojka, Z., (2003) Selectivity of the sulfonylurea herbicide group in the crop of maize inbred lines. Pesticides, 18(3), 187-194. [15] Molnar, I., Toth, E., Somlyay, I., Pakurar, M., (2001) Effects of environmental conditions on sensitivity of corn cultivars to herbicide treatments. Novenyvedelem Area of plant protection, Hungary, 3710, 483-489. [16] Mangova, M., Veleva. V., (1986) Prouchvane vlianieto na herbicida tricilin varhu tehnologichnite kachestva na razlichni po sila sortove zimna pshenica, Rastenievadni nauki, № 4, str. 11-14. [17] Popov, A., Pavlov, K., (1966) Plant growing. Cereal crops, Volume І. In: Maize, Zemizdat, Sofia, 413-461. [18] Shanin, Y., (1977) Methodology of field experiment. In: Perpendicular method. Zemizdat, Sofia, 96-97. [19] Stefanovic, L., Simic, M., Milivojevic M., Misovic, M., (2001) Effects of some herbicides on plant height and yield of commercial inbred lines of ZP maize hybrids. Pesticides, 16(3), 173-384. [20] Stefanovic, L., Simic, M., Milivojevic, M., Misovic, M., (2006) The manifestation of symptoms of herbicide (sulfonylurea) phytotoxic effects in their application in seed maize crop. Acta Herbologica, 15(1), 35-45. [21] Titiyanova, M., Tonev, T., Mitkov. A., (2007) Novi vazmojnosti za efektiven himicheski control na plevelite pri pshenicata, Rastenievadni nauki, 49, str. 154-160. [22] Waligora, H., Szulc, P., Skrzypczak, W., (2008) Effectiveness of chemical weed control in sugar maize cultivation without triazyne. Acta Scientiarum Polonorum. Agricultura, 7(1), 111-118. CONTACTS Dimitriya Ilieva, Department of Agricultural Machinery, Agrarian and Industrial Faculty, University of Ruse, 8, Studentska Str., 7017 Ruse, Bulgaria, e-mail: dilieva@uni-ruse.bg
- 24 -
Agricultural, Forest and Transport Machinery and Technologies (ISSN: 2367– 5888) Volume VII – Issue 1, 2020
Soil CO2 Emissions in the Application of Conventional and Erosion Control Technologies for Growing Maize on Sloping Terrains Gergana Kuncheva, Petar Dimitrov, Hristo Beloev, Iliana Ivanova Abstract Soil tillage of agricultural lands is a basic practice in agricultural management. Conventional soil tillage systems include more tillage operations, including plowing with reversing the layer, which results in higher CO2 emissions and also requires higher amounts of fuels. In contrast, soil protective agricultural practices have great potential for increasing soil organic carbon and reducing carbon dioxide and other greenhouse gas emissions. This work defines the impact of some conventional (traditional) technologies and advanced technology for minimum and unconventional tillage for growing grain maize on soil organic matter and CO2 emissions. Keywords: soil water erosion, loss of soil organic matter, minimum soil tillage, surface mulch, vertical mulch, soil CO2 emissions, labile soil organic carbon, maize.
INTRODUCTION Soil contains twice as much carbon as the atmosphere and three times more than vegetation [9]. Soil respiration has been found to be 68–80 PgC/yr, which is the world's second largest carbon flux between ecosystems and the atmosphere [16, 18]. This amount is 10 times higher than current carbon emissions from burning fossil fuels. For this reason, small changes in soil respiration, covering large areas, can have a significant effect on atmospheric CO2 concentrations [19]. Therefore, information is needed on soil CO2 emissions and the factors that affect these flows, in order to limit organic matter losses in ecosystems and to determine soil response to changing land use and global climate change. Crop production is a source of greenhouse gas emissions due to disturbance of the soil during cultivation, improper management of harvest residues, application of fertilizers, but also due to the use of equipment in various technological operations (these are emissions from energy sources necessary for soil cultivation, as in the production of mineral and organic fertilizers, etc.) [8]. CO2 emissions from fossil fuels used in agricultural machinery operations are estimated at 0.4-0.6 Gt CO2 eq. annually in 2010 [1]. The production of nitrogen fertilizers contributes to the release of 410 Tg CO2 eq. per year, equivalent to 0.8% of global greenhouse gas emissions [2]. Other types of fertilizers and pesticides are considered not to have a significant contribution to increasing atmospheric CO2. Soil tillage is a basic practice in agricultural management. Conventional soil tillage systems include more and more tillage, including plowing with reversing the layer, which results in higher CO2 emissions and also requires more fuel to be consumed. In contrast, soil protection technologies are based primarily on reducing impacts on soil by limiting all soil tillage activities, shallower operations, and eliminating soil inversion while maintaining and managing crop debris [6]. Also, reducing the passes of equipment across the field results in lower emissions from the use of fuels. According to Carmo et al. (2014), the introduction of organic materials into soil increases carbon dioxide emissions, with a strong relationship between soil temperature and CO2 emissions observed in all treatments. However, the loss of C-CO2 from the soil amended with sludge and composted sludge, and the amount of carbon contained in these residues, conclude that more organic carbon is left in the soil [5]. Organic farming tend to have higher CO2 emissions and lower N2O emissions than conventional systems. Lower N2O emissions are likely to be related to lower nitrogen inputs,
- 25 -
Agricultural, Forest and Transport Machinery and Technologies (ISSN: 2367– 5888) Volume VII – Issue 1, 2020
while higher CO2 emissions could be due to more organic matter applied by organic fertilizers and due to the higher autotrophic respiration of live mulch [4]. Improved agricultural practices have great potential for increasing soil organic carbon and for reducing carbon dioxide and other greenhouse gas emissions. On the other hand, agricultural production systems, which involve intensive cultivation, lead to soil degradation and erosion, which negatively affects soil quality and has a major impact on climate change. The average altitude of the territory of Bulgaria is 470 m. The erosion assessment of the relief of the country shows that 16% of the total territory is inclined from 0 to 3 °, while more than half (55.3%) are inclined from 3 to 12 °, and 23.9% of the area is inclined from 12 to 18°. According to Ruseva (2010), 60.1% of the soils in our country are of medium, strong or very strong erosion susceptibility (over 0.03 ha h / ha MJ mm) [17]. On sloping terrain, the application of already established traditional (conventional) technologies does not solve the problems of degradation, and even according to Dimitrov (2008), can accelerate its appearance and development, especially if the operations are carried out along the slope [7]. For this reason, it is necessary to use appropriate soil protection technologies on sloping agricultural land sown with maize for the purpose of limiting or completely preventing degradation processes - water erosion of the soil, compaction and loss of soil organic matter. One of them is the advanced soil protection technology for minimum and unconventional tillage for growing maize on inclined terrains. It includes both combined systems for reduced tillage and erosion method of vertical (intra-ground) mulching using manure. This technology was developed and tested by the Institute of Soil Science, Agrotechnology and Plant Protection "Nikola Pushkarov" - Sofia, in cooperation with the University of Rousse "Angel Kanchev". The purpose of the present study is to determine the impact of conventional and soil protection tillage systems using manure with surface mulching and advanced technology for minimum and unconventional soil tillage for grain maize cultivation on sloping terrain, including vertical mulching on soil CO2 emissions. MATERIAL AND METHODS The experimental field is located in the northern climatic region of the Danube hilly plain and is characterized by a temperate continental climate, with a sharper continence than the rest of the country. Autumn and spring are short. Winter is cold, with a minimum amount of rainfall and hot summers with a high maximum of rainfall. The study was conducted in the period 2018-2019 yr., in the experimental field of the Institute of Soil Science, Agrotechnology and Plant Protection "Nikola Pushkarov" - Sofia, in the territory of the village of Trustenik, Ruse region, under non irrigation conditions, of medium eroded calcium chernozem with inclination of the slope of 5o (8.7%). A single factor field experiment with grain maize based on the block method, in four variants, in four replicates, was conducted. The variants of the experiment are: c0 - maize plots, grown by conventional technology, applied along the slope - control; c1- maize plots, grown by using conventional technology applied across the slope; c2 - maize plots, grown by erosion control technology, including surface mulching with manure, all operations applied across the slope; c3 - maize plots, grown by erosion control technology, including soil tillage without reversing the layer - loosening and soil protection operation vertical mulching with manure, forming slits with ducts, along with sowing and digging and furrowing along the hilling (advanced technology for minimum unconventional soil tillage) applied across the slope. During the two-year study period, annually, all technological operations performed under variants c0 and c1 are traditional (conventional) and identical, the difference between them is only in the direction of their realization. In the control they were applied along the
- 26 -
Agricultural, Forest and Transport Machinery and Technologies (ISSN: 2367– 5888) Volume VII – Issue 1, 2020
slope, and in variant c1 in the transverse direction. In the same direction, the operations of variant c2 were carried out and, prior to the pre sowing tillage, the anti-erosion method of surface mulching with manure (4500-5000 kg / ha) was carried out, using the fertilizer trailer 1PTU-6 for this purpose. The last c3 variant includes erosion control methods of loosening, such as basic tillage, vertical mulching with manure, forming slits with ducts, along with sowing and digging, and furrowing along the hilling. Loosening in this case replaces the plowing with the reversal of the soil layer. It is carried out, across the slope, at a depth of 0.40 m, with cultivator CP – 9, aggregated with tractors with a nominal power of 120 to 150 kW. Vertical mulching is also carried out across the slope, before sowing with a specialized device for incorporation of organic matter into the soil, by a band scheme (with interval between the slits of 0.60 m and the interval between bands 3 m in the field), at a depth of 0.40 m. In these operations were used specialized soil machine for incorporating organic materials, combined device mounted on the frame of the SPC-6 pneumatic seed drill and a soil cultivator KRN-4,2 and a combined tillage, for making cuttings with slits and ducts. During the study period, climatic observations, erosion studies of the applied technologies were carried out, as well as the carbon emissions for each month during the growing season, as well as the content of labile carbon (oxidized by potassium permanganate), was determined, soil moisture of 0-10 cm and soil electrical conductivity. RESULTS AND DISCUSSION Data on fig.1 shows the average day-and-night temperatures as well as the sum of the precipitation for ten days periods. Precipitation in the area is unevenly distributed throughout the year. The highest rainfalls in 2018 yr. has fallen in the warm months - June and July, and in 2019 yr. the precipitation peak is in April, May and June. In 2018 yr. there is very low rainfall in April and August, and in 2019 yr. - August and September. Figure 1 shows the average day-and-night temperatures. There is a slightly cooler April in 2019, associated with more heavy rainfall in the second ten days of the month.
Fig. 1 Climatic characteristics of the two-year study period (2018 - 2019)
- 27 -
Agricultural, Forest and Transport Machinery and Technologies (ISSN: 2367– 5888) Volume VII – Issue 1, 2020
Figure 2 shows soil surface moisture and CO2 emissions (kg/ ha day). Figures 1 and 2 show that temperature and rainfall have a combined effect on carbon emissions. They in April 2018 yr. are lower than those in April 2019 yr. due to lower rainfall and cooler March’ 2018. At the end of April and May 2019 yr. it can be seen lower temperatures compared to the same period in 2018 yr., which has led to lower CO2 emissions. In both years, the drought in August is observed, that in 2019 yr. was particularly severe and combined with high temperatures. In both years, this has led to low CO2 emissions in August. Low temperatures, high humidity, and high temperatures combined with low humidity suppress soil respiration. Another reason for the different peaks in carbon fluxes is the systems of tillage and the organic substances applied. In September 2019 yr. after a prolonged period of soil drying, low rainfall in September leads to enhanced mineralization of organic matter with higher CO2 emissions, known as the Birch effect [3,11]. Precipitation after prolonged dry periods causes the Birch pulsating effect. Emissions increase within minutes or hours after the onset of rainfall and return to background levels within a few days [14].
ANOVA NS (CO2); moisture p=0,3137 ANOVA NS (CO2); moisture NS
Fig. 2 Soil moisture content (0-10 cm),% and CO2 emissions, kg / ha day The direct relationship between soil moisture and carbon emissions is not observed, as can be seen from Figure 2. Only the difference in humidity does not cause a change in the intensity of soil respiration. Soil moisture combined with other factors causes such changes. The intensity of soil respiration depends on applied system for soil tillage. At the beginning of the growing period, before sowing, higher CO2 emissions were measured in conventionally tilled variants. Total for the season, in variant with surface manure application, emissions are the highest. In contrast, the organic matter incorporated by vertical mulching, combined with minimum tillage, results in lower carbon dioxide emissions.
- 28 -
Agricultural, Forest and Transport Machinery and Technologies (ISSN: 2367– 5888) Volume VII – Issue 1, 2020
Fig. 3 CO2 emissions, kg / ha day In relation with the fluxes of CO2 from the soil, the quantities of labile carbon (Fig. 4) and electrical conductivity (Fig. 5) were measured. The results show higher amounts of labile carbon and electrical conductivity for variants with surface application of the manure and for minimum tillage with vertical mulching. Higher amounts of nutrients are available in the presence of high EC values. Consequently, nutrient content in soil, as with the application of manure or mineral fertilizers, plays an important role in the formation of carbon emissions.
ANOVA; P=0.037793 HSD[.05]=0.27; HSD[.01]=0.35
Fig. 4 Labile carbon content, mg/g
ANOVA; P= 0.046323; HSD[.05]=113.3; HSD[.01]=143.58
Fig. 5 Conductivity, µS / cm ,%
- 29 -
Agricultural, Forest and Transport Machinery and Technologies (ISSN: 2367– 5888) Volume VII – Issue 1, 2020
The CO2 emissions of c2 variants with application of conventional tillage and surface mulching are the highest. Accordingly, in this variant, the highest levels of labile organic matter are also observed. When applying surface mulching in 2018 yr., CO2 emissions are 54.46 kg/ha day in 2019 yr. - 76,30 kg/ha day. Emissions of the last variant c3, with the application of minimum tillage and vertical mulching, are significantly lower, and in 2018 yr. and 2019 yr. respectively the average are 29,50 kg/ha day and 43,79 kg/ha day, whereas in the case of conventional tillage applied along the slope, they are 33.11 kg/ha day and 47.69 kg/ha day, which also shows the impact of minimum tillage on soil emissions, and is an organic substance incorporated. The effect is stronger at the beginning of the growing season and the differences in emissions there are much higher. The carbon dioxide emissions of the control variant conventionally grown along the slope are 31.25 kg/ha day and 46.53 kg/ha day. CONCLUSION ̶ Soil CO2 emissions depend on a number of factors; temperature, humidity, soil cultivation, application of organic amendments, nutrient content. ̶ The highest CO 2 emission values as well as the highest quantities of labile carbon are observed in the variant grown with soil protection technology with surface application of manure. The application of organic fertilizers inevitably leads to an increase in labile organic carbon as well as higher carbon dioxide emissions. ̶ Carbon dioxide emissions are lower for the minimum tillage in combination with vertical mulching, and they are 43.95% lower than the surface mulching variant, which means that much more the imported organic material remains in the soil. The carbon emissions of this variant are on average 9.28 % lower than the variant using conventional tillage system applied across the slope. ̶ Advanced soil protection technology for minimum and unconventional tillage for growing maize on sloping terrains not only has high erosion efficiency but is a way of incorporating organic matter into the soil without observing significant carbon emissions from the soil. Minimizing operations also contributes to reducing emissions from both the processing itself and the usage of fossil fuels. REFERENCES [1] AR5 Synthesis Report: Climate Change 2014 — IPCC; https://www.ipcc.ch/report/ar5/wg2/ [2] Brentrup, F. (2009) The impact of mineral fertilizers on the carbon footprint of crop production. The Proceedings of the International Plant Nutrition Colloquium XVI [3] Birch, H., (1958) The effect of soil drying on humus decomposition and nitrogenavailability. Plant Soil 10, 9–31. [4] Bosco S., Volpi, I., Antichi, D., Ragaglini, G., Frasconi, C. (2019) Greenhouse Gas Emissions from Soil Cultivated with Vegetables in Crop Rotation under Integrated, Organic and Organic Conservation Management in a Mediterranean Environment Agronomy, 9, 446; doi:10.3390/agronomy9080446 [5] Carmo, J., Danilo Ignácio de Urzedo, Pedro José Ferreira Filho, Elisabete Alves Pereira, Leonardo Machado Pitombo. (2014) Bragantia, Campinas, v. 73, n. 3, p.312-318 [6] Cunningham, H., Chaney, K., Bradbary, R, Wilcox, A., (2004) Non-inversion tillage and farmland birds: a review with special reference to the UK and Europe Ibis 146 (Suppl. 2), 192 – 202 [7] Dimitrov, P., (2008) Erosion control agrotechnical methods, technologies and systems for cultivation of wheat and grain maize on sloped terrains. Habilitation work for acquisition the title of "senior research fellow I degree", "Nikola Pushkarov" Institute, Sofia.
- 30 -
Agricultural, Forest and Transport Machinery and Technologies (ISSN: 2367– 5888) Volume VII – Issue 1, 2020
[8] FAO, Rome (2017) Global database of GHG emissions related to feed crops. Methodology. [9] Granier, A., Ceschia, E., Damesin, C., Dufrene, E., Epron, D., Gross, P., Lebaube, S., (2000) The carbon balance of a young Beech forest Functional Ecology 14, 312 – 325 [10] Hollinger, D., Goltz S., Davidson, E, et al. (1999) Seasonal patterns and environmental control of carbon dioxide and water vapor exchange in an ecotonal boreal forest. Global Change Biology, 5, 891–902. [11] Jarvis, P., Rey, A., Petsikos, C., Wingate, L., Rayment, M., Pereira, J., Banza, J., David, J., Miglietta, F., & Borghetti, M., Manca, G., Valentini, R., (2007) Drying and wetting of Mediterranean soils stimulates decomposition and carbon dioxide emission: The "Birch effect". Tree physiology. 27. 929-40. 10.1093/treephys/27.7.929. [12] Jenkinson, D., Harkness D., Vance E., et al., (1992) Calculating net primary production and annual input of organic matter to soil from the amount and radiocarbon content of soil organic matter. Soil Biology and Biochemistry, 24, 295–308.\ [13] Kollarova K., Pogran, S., Kangalov, P., (2015) Precision Tillage: on the Way from Information to Decisions - Scientific Monograph. University of Ruse “Angel Kanchev”, ISBN 978-954-712-656-5. [14] Oertela, C., Matschullata, J., Zurbaa, K., Zimmermanna, F., Erasmib, S., (2016) Greenhouse gas emissions from soils—A review. Chemie der Erde 76, 327–352. [15] Raich, J., Schlesinger W., (1992) The global carbon dioxide flux in soil respiration and its relationship to vegetation and climate. Tellus [16] Raich, J., Schlesinger W., (1992) The global carbon dioxide flux in soil respiration and its relationship to vegetation and climate. Tellus, 81–99. [17] Ruseva, S., Lozanova, L., Nekova, D., Stefanova, V., Jodzhov, H., Tsvetkova, E., Malinov I., and others. (2010) Risk of Soil Erosion in Bulgaria and Recommendations for Soil Use of Agricultural Land, Part I. Public SiteSet-Eco, Sofia [18] Schlesinger, W., (1977) Carbon balance in terrestrial detritus, Annual Review of Ecology and Systematics,Vol. 8:51-81 [19] Schlesinger, W., Andrews, J., (2000) Soil respiration and the global carbon cycle, Biogeochemistry, 48, 7–20p. CONTACTS Gergana Kuncheva, Institute of Soil Science, Agricultural and plant protection “Nikola Poushkarov” Sofia,, Laboratory of soil analysis and soil erosion research, University of Ruse, 8, Studentska Str., 7017 Ruse, Bulgaria, e-mail: g1nikolova@abv.bg Petar Dimitrov, Institute of Soil Science, Agricultural and plant protection “Nikola Poushkarov” Sofia, Experimental Station for Erosion Control, University of Ruse, 8, Studentska Str., 7017 Ruse, Bulgaria, e-mail: pddimitrov@dir.bg, Hristo Beloev, Department of Agricultural Machinery, Agrarian and Industrial Faculty, University of Ruse “Angel Kanchev”, 8 Studentska str., 7017 Ruse, Bulgaria, e-mail: hbeloev@uni-ruse.bg Iliana Ivanova, Institute of Agriculture and Seed Science "Obraztsov Chiflik" – Ruse, 1, Prof. Ivan Ivanov Str., 7007 Ruse, Bulgaria, e-mail: tri_dve@abv.bg
- 31 -
Agricultural, Forest and Transport Machinery and Technologies (ISSN: 2367– 5888) Volume VII – Issue 1, 2020
Water Flow Meters - Meeting the Requirements In Use and Subsequent Metrological Control of Meters. Radovan Filo, Rudolf Palencar, Jan Zitnansky, Vladimir Krocko, Ivan Beloev Abstract: Household water meters as a subset of water flow meters, i.e. water meters that are used as designated meters, belong to one of the most numerous groups of meters. These meters are subject to requirements in accordance with the applicable EU metrological legislation in terms of their placing on the market (making available on the market or putting them into use), but also the national legislation of the Slovak Republic in use during the period of their valid verification. The subject of this paper is to analyze how water meters behave at the end of the verification interval with the evaluation of compliance with the maximum permissible errors after performing accuracy tests in the verification of these meters in the laboratory of the authorized person with reference to specifics and possible effects that may affect the accuracy of these meters when using them, or drawing conclusions that may be of a recommendatory nature in terms of the possible elimination of some effects. Keywords: Water Meters, Gauges, Flow of Water, Accuracy, Verification, Validity of Verification, Conformity.
INTRODUCTION The subject of the analysis in this paper were water meters, which were used to measure the flow of cold and hot water as a designated meter in accordance with Directive 2004/22 / EC of the European Parliament and of the Council of 31 March 2004 on meters (EP Directive) and § 11 of Act no. 157/2018 Coll. on Metrology and on Amendments to Certain Acts, as amended by Act no. 198/2020 Coll., (Hereinafter referred to as the Metrology Act). The aim is to evaluate compliance with the permissible error in the subsequent verification of water meters in connection with the maximum permissible error in use in accordance with § 16 of the Metrology Act [5] and draw conclusions related to the duration of verification of these meters, or draw conclusions pointing to their accuracy at the end of their use. To measure the flow of water in closed pipes (water supply networks), meters belonging to the group of speed meters of the flowed amount of water are used and we most often refer to them as water meters [1, 7]. In the conditions of Slovakia, the history of the use of water meters as specified meters or gauges intended for calibration or calibrating (note: in this context the word „calibration“ used as a synonym for the Slovak colloquial „ciachovanie“ or „cajchovanie“), dates back to the period of 1909, when the verification of water meters in the period of Austria-Hungary was carried out by employees of state calibration authorities. Legislation relating to water meters in the intentions of the Austro-Hungarian legal system survived until the mid-1930s, when the existing legislation was replaced by Government Decree no. 107/1934 Sb. from. a n. on the official calibration of water meters [2]. After the year 2000, the requirements for these measuring instruments were regulated by the Decree of the Office for Standardization, Metrology and Testing of the Slovak Republic No. 210/2000 Coll. on metrological control meters, as amended, which separately in two annexes specified the technical metrological requirements for cold water meters and especially for hot water meters. With the accession of the Slovak Republic to the EU, there was a gradual approximation of the legal regulations of the Member States, which also apply to measuring instruments, which resulted in the issuance of the Regulation of the Government of the Slovak Republic no. 294/2005 Coll. on meters, which specified the requirements and procedures for meters that are subject to its adjustment when they are placed on the market in the EU Member - 32 -
Agricultural, Forest and Transport Machinery and Technologies (ISSN: 2367– 5888) Volume VII – Issue 1, 2020
States, which also affected water meters [8]. In the transitional period bounded by the years 2006 to 2016, water meters could be placed on the market in the Slovak Republic in two ways [8]. At present, water meters are covered by two legal regulations governing their placing on the market (making available on the market or putting them into use) and their use and metrological control during their use, which transposes the EP Directive [7] in the Slovak Republic into Government Regulation no. 145/2006 Coll. on making measuring instruments available on the market, as amended by Government Regulation of the Slovak Republic no. 328/2019 Coll. [11] and Decree of the Office for Standardization, Metrology and Testing of the Slovak Republic no. 161/2019 Coll. on measuring instruments and metrological control [9]. Water meters for measuring clean cold and hot water according to their use and from the point of putting them on the market are divided into: a) water meters for measuring in households, for commercial purposes or in light industry, (b) water meters for measuring in heavy industry [4]. This division according to the Decree of the Office for Standardization, Metrology and Testing of the Slovak Republic no. 161/2019 Coll. is given by how these meters are made available on the market or put into use in accordance with the applicable legislative requirements. Water meters for measuring in households, for commercial purposes or in light industry are available on the market or put into use in accordance with harmonized EU legislation [4] the so-called "new approach" legislation represented in the Slovak Republic Act no. 56/2018 Coll. on the conformity assessment of a product, making a specified product available on the market and on the amendment of certain laws and, subsequently, for the field of measuring instruments, it is the Regulation of the Government of the Slovak Republic no. 145/2006 Coll. on making measuring instruments available on the market, as amended by Government Regulation of the Slovak Republic no. 328/2019 Coll [10]. Conformity assessment procedures for water meters (MI-001) are specified in Annex no. 3 of the EP Directive [10], whereby the manufacturer may use the B + F or B + D or H1 procedure for the purposes of conformity assessment under this Directive. We also refer to these procedures as conformity assessment modules. MODULE B: The EU-type examination is the part of the conformity assessment procedure whereby a notified body examines the technical design of a measuring instrument and verifies and confirms that the technical design of the measuring instrument meets the requirements of this Government Regulation applicable to that technical design of the measuring instrument [7]. MODULE D: Conformity to type based on quality assurance of the manufacturing process is the part of the conformity assessment procedure by which the manufacturer fulfills the obligations and ensures on his own responsibility that the relevant instrument conforms to the type described in the EU-type examination certificate and meets the requirements of this Regulation that applies to the relevant measure [7]. MODULE F: Conformity to type based on instrument verification is the part of the conformity assessment procedure whereby the manufacturer fulfills the obligations and ensures and declares on his own responsibility that the instrument concerned is in conformity with the type as described in the EU-type examination certificate, and meets the requirements of this Government Decree that apply to the relevant instrument [7]. MODULE H1: Conformity based on full quality assurance and design examination is a conformity assessment procedure whereby the manufacturer fulfills the obligations set out in the second and sixth paragraphs and ensures and declares on his own responsibility that the
- 33 -
Agricultural, Forest and Transport Machinery and Technologies (ISSN: 2367– 5888) Volume VII – Issue 1, 2020
instrument meets the requirements of this Government Regulation applicable to the instrument it applies to [7]. Water meters for measuring in heavy industry are placed on the market by performing a pre-market metrological inspection, which includes national type approval and initial verification in accordance with the Metrology Act [4], a procedure carried out in accordance with national legislation, which we refer to as legislation The "old approach". If a water meter is used as a specified gauge, i. in accordance with § 11 of the Metrology Act, must be used in accordance with the provisions of § 16 of the Metrology Act. Water meters used in the Slovak Republic as designated meters are subject to subsequent metrological control - subsequent verification in accordance with Section 16 of the Act on Metrology. According to the law, the user of this measuring instrument is obliged to submit the used specified measuring instruments for subsequent metrological control. By using a designated meter we mean measurement by a specified meter by the user [5] (eg. using the results read from a specified meter for the purpose of billing the price of the amount of water consumed in the household - apartment). Water meter user as a designated meter in means of a public authority or entrepreneur who uses a specified meter or a value indicated by a specified meter in a measurement related to payments, where there may be a conflicting interest in the measurement result or where an incorrect measurement result may harm the interest of a natural person, legal entity or persons of the wide public, is provided by special regulations [5] (eg the Public Water Supply Act). Subsequent verification of water meters in the Slovak Republic is carried out in accordance with § 25 of the Metrology Act, when a water meter test is performed, during which the water meter error(s) is detected and conformity with the specification for the maximum permissible error is evaluated in accordance with Annex no. 10 Decree of the Office for Standardization, Metrology and Testing of the Slovak Republic no. 161/2019 Coll. on measuring instruments and metrological control [10] or special regulations in force at the time of conformity assessment of a water meter, e.g. Regulation of the Government of the Slovak Republic no. 145/2006 Coll. on making measuring instruments available on the market, as amended by Government Regulation of the Slovak Republic no. 328/2019 Coll [6,7]. The instrument must be in conformity with the approved type during verification and must meet the technical and metrological requirements, in particular the permissible error, as already mentioned above. Verification of water meters can be performed by the Slovak Institute of Metrology (SMÚ), Slovak Legal Metrology n.o. (SLM), or persons (entrepreneurs or other legal entities) authorized in accordance with § 31 of the Metrology Act [5]. If a natural or legal person suspects that the water meter does not meet the metrological parameters when using a water meter, they have the right to ask the user of the specified meter to detect the error of the specified meter in accordance with § 16 of the Metrology Act. at SMÚ or SLM in means of a written request of the user of the specified meter (water meter). [5] The meter is considered satisfactory if it does not exceed the maximum permissible error in use set for water meters by Annex no. 10 Decree of the Office for Standardization, Metrology and Testing of the Slovak Republic no. 161/2019 Coll., which is determined as twice the maximum permissible error during verification. From a legislative point of view, the maximum permissible error in use can be assessed no later than the last day of validity of the verification of the specified meter. [5] The validation interval of the verification of selected water meters is shown in Table 1.
- 34 -
Agricultural, Forest and Transport Machinery and Technologies (ISSN: 2367– 5888) Volume VII – Issue 1, 2020
Table 1 Validity period of verification for water meters according to Annex No.1. Decree of the Office for Standardization, Metrology and Testing of the Slovak Republic no. 161/2019 Coll item 1.3.1
1.3.2
Type of determined gauge Household water meter a) cold water b) hot water Water meter a) cold water b) hot water
Verification validity period (in years) 5 5 6 4
MATERIAL AND METHODS Subsequent verification of water meters used as designated meters is one of the standard obligations of users of designated meters as mentioned above. The Act on Metrology [5] in the Slovak Republic specifies who is authorized to perform subsequent verification of specified measuring instruments. In the case of water meters, these are to a large extent (estimated at about 80% to 90% of water meters of the total number of water meters used as distribution meters) authorized persons to perform the verification of specified meters according to the Act on Metrology [5]. The procedure used in the Slovak Republic prior to the actual verification of water meters is such that the water meters are cleaned and adjusted, or repaired and then delivered for verification to an authorized person to perform the verification. In accordance with the Metrology Act [5], an authorized repairer, ie a person registered under the Metrology Act [5], is required to carry out repairs and repairs to specified meters, namely those specified in the registration decision. Repair and cleaning of household water meters is primarily performed only in Slovakia and the Czech Republic, in other EU countries this is not a trend and water meters are discarded after the first verification interval (ie after their first placing on the market or putting into use) and do not verify. The user is always obliged to order the verification of specified meters in writing. In this paper, we want to examine the metrological characteristics of water meters at the end of the validity period (after its expiration) in terms of meeting the requirements for the permissible error during verification and the permissible error in use. An authorized person (metrological laboratory) was selected for the implementation of the experiments, who also performs the verification of water meters. For the purpose of performing the experiment, the usual procedure before the actual testing (verification) was omitted and the gauges after disassembly were immediately tested as if the tests were performed to determine the water meter error in use, ie. the gauges were not cleaned, adjusted or repaired. The purpose of this experiment was to find out how the sample of selected water meters will behave, while the evaluation was aimed at evaluating the compliance of metrological requirements, ie permissible error in verification and permissible error in use and quantification of compliant and non-compliant water meters in the sample. For the purposes of the experiment, a sample of household mechanical water meters of dimension DN 15 in the number of 815 pieces was used. A household water meter is a water meter located in household and non-household premises behind a joint water meter, which is used to determine the price for the supply of water to an apartment building [5]. These are meters of cold water flow (cold water meters). They are mechanical meters
- 35 -
Agricultural, Forest and Transport Machinery and Technologies (ISSN: 2367– 5888) Volume VII – Issue 1, 2020
with mechanical counters based on direct mechanical action when using measuring chambers with movable walls, or when the speed (flow) of water affects the speed of rotation of the moving part (turbine, a wheel, etc.) with a counter that works on the mechanical principle by means of rotating gears or other rotating components, [3] shown in Fig. 1.
Fig. 1 Household water meter This sample of water meters was delivered to the laboratory of the authorized person as standard, while the verification of these water meters was ordered by their user in order to perform their subsequent metrological control, ie subsequent verification in accordance with the Act on Metrology. The basis of the experiment was an accuracy test, which analyzes (determines) the error of the water meter δ in%. This accuracy test was performed on a Standard device (water meter line) connected to the flow standards of the Slovak Institute of Metrology. The accuracy test for the subsequent verification was performed at three flow rates in the order Qmax; Qt; Qmin. Maximum flow (Qmax,) - the highest flow at which the meter can operate for a limited time without damage and without exceeding the maximum permissible errors and the maximum allowable pressure loss. Nominal flow (Qn) - is equal to half the maximum flow Qmax and is used to identify the meter; at nominal flow Qn, the meter must be able to operate in normal use, meaning under constant and intermittent working conditions without exceeding the maximum permissible errors. Transient flow (Qt,) - the flow that divides the upper and lower sections of the flow range and is the flow at which the limits of the maximum permissible errors occur. Minimum flowrate (Qmin,) - flowrate above which the maximum permissible accuracy errors must not be exceeded. The fixed start mass method according to [3] was used to perform the accuracy test. It is a method in which the conventional true value of the flow rate is carried out by reference weights and the liquid is at rest at the beginning and end of the test on the test scale, this method being considered static because the liquid is at rest at the beginning and end of the test in the standard [3]. The test equipment used (water meter track) for the mass method with scales is a device that is mechanically operated - the fixed start method. This device can be used for one meter under test or for several meters connected in series. The basic parts of the test equipment are: a) flow source with storage tank, b) measuring part for mounting gauges, c) flow control branches with flow meters and weighing system, (d) evaluation equipment. The used test equipment (water meter line) is supplemented by software for automation
- 36 -
Agricultural, Forest and Transport Machinery and Technologies (ISSN: 2367– 5888) Volume VII – Issue 1, 2020
of the testing process with the possibility of controlling the whole process, flow setting for the test, automatic measurement of test time, weight reading, control of valves (control branches, start stop valves), pump control, control of line input valves and archiving of measured values into the database.
Fig. 2 Principle of a test rig operating by the mass balance method [3] 1 - storage tank, 2 – filter, 3 – pump, 4 - height tank, 5 - supply line, 6 - calibrated gauge, 7 - control valve, 8 - flow meter, 9 - sight glass, 10a - control branch, 10b - control branch, 11 - switching flap, 12 - metering tank, 13 – scales, 14 - vent valve, 15 - drain valve, 16 - shut-off valve RESULTS AND CONCLUSIONS 815 water meters were tested (verified) at three flows according to the established approved work procedure, while data on the detected error of the tested water meters were collected, with the result being presented as an expression of compliance with the maximum permissible error verbally as "Pass" or "Fail" and the numbers of water meters are determined for these categories. At the same time, these numbers of water meters are also determined for individual test flows. Evaluation of compliance with the maximum permissible error as follows: 1. confirmation of the conformity of the specified measuring instrument with the metrological requirements for the type of the verified specified measuring instrument in accordance with § 25 para. 1 of the Metrology Act [5] as follows: % and in the lower section (Qt to Qmax,) + 2% for cold water [4] shown in fig. No.4, 2. determination of the number of compliant specified measuring instruments according to par. 6 and 7 §16 of the Metrology Act, the error of which does not exceed the maximum permissible error in use, which is equal to twice the maximum permissible error determined during the verification of water meters [5,9] shown in Fig. 4. It must be said that a water meter is considered unsatisfactory if its error exceeds the maximum permissible error, even with just one flow. The Fig. 3 graphically shows the numbers of compliant and non-compliant meters with
- 37 -
Agricultural, Forest and Transport Machinery and Technologies (ISSN: 2367– 5888) Volume VII – Issue 1, 2020
respect to the permissible error in verification after the expiration of the validity period (i.e. without repair and cleaning). Fig. 3 testifies to the error of the meter without repair and cleaning and indicates the need for repair and cleaning, or deployment in the use of new meters.
Fig. 3 Quantification of the number of water meters that passed / failed the accuracy test after the expiration of the validity period with the evaluation of compliance with the permissible error in the verification of the meter From Fig. 3, it is clear that, applying the requirement for compliance with the maximum permissible error in verification, 585 of the total number of water meters 815 would not satisfy, which represents approximately 72% of the water meters in the sample. If we select a group from non-compliant water meters that did not comply with Qmin when applying the requirement for compliance with the maximum permissible verification error and look at how these water meters in this group behaved at other flows, we would find that about 2/3 of this group did not comply with other test flows t. j. at Qt and Qmax, as documented in Fig. 4. There appears to be a strong correlation of the magnitude of the error of the meter at different flow rates. If the criterion of double permissible error, ie. permissible error in use, were taken into account in the conformity assessment, the results of this analysis would be as shown in Fig. 5, which means that out of the total number of tested water meters in the number of 815 pieces, 134 pieces did not meet this criterion, which represents approximately 16.5%. At present, in the Slovak Republic, the period of validity of the verification is set for household water meters as for specified meters in the length of 5 years [9]. The sample of household water meters that were analyzed should meet the required metrological characteristics during this period of validity. It is clear from the results that this is not the case. However, it must be said that in the usual procedure, testing of uncleaned and unadjusted meters is not performed during the subsequent verification after the expiration of the verification, and this testing was performed as a "model". From the above results, it can be deduced that the water meters are affected during use mainly by the measured medium itself,
- 38 -
Agricultural, Forest and Transport Machinery and Technologies (ISSN: 2367– 5888) Volume VII – Issue 1, 2020
meaning water, which can cause them to become clogged and thus affect their accuracy, especially in the case of water of a higher degree of hardness.
Fig. 4 Quantification of the number of non-compliant water meters at Qt and Qmax from a sample of non-compliant water meters at Qmin under conditions as in Fig. 3
Fig. 5 Quantification of the number of water meters that passed / failed in the accuracy test with the evaluation of compliance with the permissible error when using the meter In practice, however, in cases of dispute, the double permissible error is taken into account when assessing instruments in use, testing uncleaned and unadjusted instruments and - 39 -
Agricultural, Forest and Transport Machinery and Technologies (ISSN: 2367– 5888) Volume VII – Issue 1, 2020
the requirement that the verification of these instruments should not expire must be complied with. From the results evaluated in this way, it is clear that even the % of unsatisfactory water meters is significantly lower, but even so, 1/6 (16.5%) of water meters will not ensure compliance with satisfactory metrological characteristics. The question is whether the interval of validity of the verification of this type of meters in the Slovak Republic is sufficient, even taking into account that these meters are mostly not verified abroad for the most part. It is worth mentioning that in the past the length of validity of the verification of these meters has also changed in the Slovak Republic, in the older stages it was 4 years and in the recent past it was 6 years. REFERENCES [1] Chudý, V., Palenčár R., Kureková E., Halaj M., (1999) Meranie technických veličín.1.vyd. BRATISLAVA: STU Bratislava 688 s. ISBN 80-227-1275-2 [2] Časopis METROLOGIE., Tematická príloha č.4/2016 Metologie prutoku a protečeného množství kapalin a vodní páry v ČR, ÚNMZ Praha 40s. ISSN 1210-3543 [3] Mikulecký, I., Benková M., Drozda F., (2016) Príručka pre používateľov meradiel prietoku a pretečeného množstva kvapalín Kalibračné združenie SR.2016 [4] Príloha č. 10 k vyhláške č. 161/2019 Z. z. VODOMERY, Dostupné na: https://www.slovlex.sk/pravne-predpisy/SK/ZZ/2019/161/20190801 [5] Zákon č. 157/2018 Z. z. o metrológii a o zmene a doplnení niektorých zákonov v znení zákona č. 198/2020 Z. z. [6] Dostupné na: https://www.slov-lex.sk/pravne-predpisy/SK/ZZ/2019/161/20190801 [7] Nariadenie vlády Slovenskej republiky č. 145/2016 Z. z. o sprístupňovaní meradiel na trhu v znení nariadenia vlády Slovenskej republiky č. 328/2019 Z. z. [8] Directive 2004/22/EC of the European Parliament and of the Council of 31 March 2004 on measuring instruments (Smernica Európskeho parlamentu a Rady 2004/22/ES z 31. marca 2004 o meradlách), [9] Filo, R., Drozda F., (2016) Požiadavky na starostlivosť o meranie vyplývajúce z platnej legislatívy, starý a nový prístup, Zborník KZ SR, Kurz „Abeceda firemného metrológa“ november 2016, Bratislava [10] Vyhláška Úradu pre normalizáciu, metrológiu a skúšobníctvo Slovenskej republiky č. 161/2019 Z. z. o meradlách a metrologickej kontrole [11] Nariadenia vlády Slovenskej republiky č. 145/2006 Z. z. o sprístupňovaní meradiel na trhu v znení nariadenia vlády Slovenskej republiky č. 328/2019 Z. z. CONTACTS Radovan Filo, Department of Quality and Engineering technologies, Faculty of Engineering, Slovak University of Agriculture in Nitra, Slovakia, Tr. A. Hlinku 2, 949 76 Nitra, Slovakia Rudolf Palencar, Slovak Technical University of Bratislava, Department of Automation, Measurement and Applied informatics, Faculty of Mechanical Engineering, Namestie slobody 17, 813 21, Bratislava, Slovakia Jan Zitnansky, Department of Quality and Engineering technologies, Faculty of Engineering, Slovak University of Agriculture in Nitra, Slovakia, Tr. A. Hlinku 2, 949 76 Nitra, Slovakia, e-mail: jan.zitnansky@uniag.sk Vladimir Krocko, Department of Quality and Engineering Technologies, Faculty of Engineering, Slovak University of Agriculture in Nitra, Tr. A. Hlinku 2, 949 76 Nitra, Slovakia, e-mail: vladimir.krocko@uniag.sk Ivan Beloev, Department of Transport, Faculty of Transport, University of Ruse, 8, Studentska str., 7017 Ruse, Bulgaria, e-mail: ibeloev@uni-ruse.bg
- 40 -
Agricultural, Forest and Transport Machinery and Technologies (ISSN: 2367– 5888) Volume VII – Issue 1, 2020
Standardization of Cooperation between Production and Supply Quality in Production Organization Miroslav Pristavka, Hristo Beloev, Plamen Kangalov, Mitko Nikolov, Pavol Findura, Petr Bartos, Olga Urbanovicova Abstract: Standardization of processes is currently an essential part of manufacturing organizations. It is a very effective way to increase efficiency in achieving the desired goals, making organizations more competitive. However, it is important that processes are standardized at all levels without exception. It is enough that a few processes do not have clearly defined duties and responsibilities and the performance of the whole system is noticeably reduced. The standardization of the cooperation process between production and supplier quality departments was carried out in an unnamed organization. The basic activity in which these two departments worked together was to solve the problems with the supplied material. Production quality gave impulse from production about the problem with the supplied material and the supplier quality solved this problem by issuing a complaint to the supplier. However, this process often led to inadequate analysis, loss or misunderstanding of the information, or to the issuing of complaints with considerable delay. These problems stemmed from insufficiently defined responsibilities and from a non-standardized process of cooperation between these departments. The aim of the article was to define responsibilities for both departments, to create a flow chart for the procedure for managing nonconforming input material and to create a form for submitting the information needed for opening of claim to the supplier. Subsequently, the proposed methods were applied to a specific complaint, which confirmed, that thanks to standardization, the process of opening and resolving supplier complaints was significantly streamlined and the cooperation between these two departments was significantly improved. Keywords: organization, production quality, standardization
INTRODUCTION Standardization as a process is a very effective tool to reach sustainability, prosperity and competitiveness. Its basic advantage is that it clearly defines the borders, responsibilities and competencies. If we manage an organization and have no standards, procedures and documents, based on which we could clearly determine who and how to do things, we cannot speak of organized management (Bujna et al., 2019, Korenko et al., 2015). One of the basic aspects of each organization is a quality. Quality in an organization does not only include visibly reliable products and their properties. There is also a large number of processes that control and influence quality. Thus, these processes can directly influence finished products, their compliance with customer requirements and it is therefore necessary to manage these processes. Standardization in this case is crucial because it has a significant impact on the future of an organization [Bujna-Kielbasa, 2019, Lilko et al., 2019). MATERIALS AND METHODS The main objective of the paper was to standardize cooperation between departments of production and supply quality. To fulfil the objective, it was necessary to create a form, which was a basis of creation and solution of a claim against supplier. The created standard, including responsibilities and procedures together with a form to transfer information, was applied to the issue and we confirmed whether cooperation between departments is more effective (Bujna et al., 2015). We monitored two objects, department of supply quality, responsible for input material in the processes and department of production quality, serving for providing information about problems with the material. Both departments worked on the common objective, that is ensuring smooth running of production with an input material without different variations.
- 41 -
Agricultural, Forest and Transport Machinery and Technologies (ISSN: 2367– 5888) Volume VII – Issue 1, 2020
Standardization process: ̶ selection of a workplace, ̶ analysis of the current state of realization and conditions of process on a workplace, ̶ proposal and implementation of rationalized measures, ̶ creation of working standard (Cvíčela, 2020). Form for information necessary to create supply claim The form (Table 1) was established based on needs of department of supply quality. This form included all the necessary information, which an employee of supply quality needs, to be able to provide a claim for supplier (Cvíčela, 2020). Table 1 A sample form for information necessary to open a supply claim: FORM FOR INFORMATION NECESSARY TO OPEN SUPPLY CLAIM
Number of material + index: Supplier: When did the problem occur for the first time? Who identified the problem? Where was the problem identified? How many mismatched pieces were found and produced?
xxxxxx-xxx Name of supplier Date, time, shift Quality engineer, operator, controller on the line Before/ after process on the line, control at the end of line, audit Raw material: amount Unfinished production: Finished products:
amount
Suspicious material:
amount
amount
Trend: Description of a problem: What causes it? Immediate reaction on the line:
Random, specific side, cavity Brief results of internal analysis Consequence of the deviation Exchange of boxes Exchange of production charges Change of produced model Immediate reaction to ensure production: Classification on the line Classification by external company Replacement delivery Need to check stock NO Analysed mismatched parts for supplier as a YES proof: If yes, number: amount Date, time Form submission date: For the production of quality department: Name, Surname For department of supplier quality: Name, Surname Appendix: 1) Supplier information tag 2) Technical drawing/ documentation 3) Results of measurement 4) Photo documentation of deviation
Enclosed photo or a scan of a tag A clipping from a drawing that relates to a parameter that is out of specification Results of measuring equipment/ protocol In case of visible deviations e.g. sprays, underwear, visible mechanical damages
RESULTS Application of established procedures within solution of a specific claim In production organizations, into which a large amount of materials enters, we often find their deviations. No process is perfect, thus there are deviations from specification on the - 42 -
Agricultural, Forest and Transport Machinery and Technologies (ISSN: 2367– 5888) Volume VII – Issue 1, 2020
input materials time to time. Effort to solve these deviations and minimize their amount is directly proportional to supplier quality. Some suppliers have better run processes, some do not, but in general it is always inevitable to solve the problem so that it does not repeat and that the corrective action is effective and lasting. This is ensured by 8D methodology (Fig. 1), which is processed by the supplier who happened to have the problem. The whole process of problem solution is under control of department of supplier quality (Cvíčela, 2020). Impuls from production to department of supplier quality
Opening claim on supplier
Acceptance of a claim and solution of problem by 8D methodology
8D report sent for approval until accepted – consequently the claim can be closed
Fig. 1 Scheme of information flow within solution of problem on a supplied component Characteristics of a supplier A supplier is primarily specialist to metal forming (pressing, shaping, fine cutting), hybrid plastic injection, assembly of sets, it also focuses on other production technologies. It produces highly quality components and sets for customers especially from the area of automobile industry, they also supply telecommunications, home appliances and lighting. Among specific products there are for example: locking systems, fastening and hinge systems, suspension and damping systems, or exhaust and propulsion systems. Characteristics of a supplied part The electronics cover (Fig. 2) is a component, which is created by a process of plastic injection. Basic functions of plastic cover are: ̶ protection of electronics of finished product against mechanic damage, ̶ closure of functional space of finished product and protecting it against pollution, ̶ ensuring tightness of finished product.
Fig. 2 3D model of electronics cover Internal analysis in the process Finished products are in final stage of production subjected to several types of tests. One of various characteristics which must be fulfilled by our product according to
- 43 -
Agricultural, Forest and Transport Machinery and Technologies (ISSN: 2367– 5888) Volume VII – Issue 1, 2020
specification, is to tightness. During testing at the end of production line, we came across a problem with insufficient tightness. The parts are tested for tightness, so that pressure is introduced into them through a special membrane and it is monitored for a certain time whether it decreases. In our case we noticed a decrease of pressure. We selected 10 mismatching parts which were discarded by the line and we analysed them. To determine leaking, we used a simple test – finished product was put in a box with water. From the edge of the electronics cover we noticed air leaking. Next step was to uninstall the cover from the product. After disassembly we found imperfectly injected (damaged) edge of the cover which caused leaking (Fig. 3). To eliminate the impact of the process, we controlled the raw pieces in packaging, which did not enter the production line. After random control of some pieces, we found a similar error on raw parts, based on which we concluded that the problem is on the supplier´s side.
Fig. 3 Imperfectly injected edge of the electronics cover To ensure production, we withdrew a new packaging from the stocks with new production charge. However, the problem did not disappear with the new packaging and the covers with an imperfect edge were also there. Therefore, it was necessary to start internal classification on the line, to minimize number of mismatching finished products. Table 2 Fulfilment of the form for submission of the necessary information to open a claim against the supplier FORM FOR INFORMATION NECESSARY FOR OPENING SUPPLIER CLAIM
Number of materials + index: Supplier: When did the problem occur for the first time? Who identified the problem? Where was the problem identified? How many mismatching pieces were found and produced?
A64078-114 12.6.2020 Line controller At the station of the final control in production line Raw material: 8 pcs. Unfinished production:
0 pcs.
Finished products:
30 pcs.
- 44 -
Agricultural, Forest and Transport Machinery and Technologies (ISSN: 2367– 5888) Volume VII – Issue 1, 2020
Suspicious material:
28 800 pcs.
Random Missing material on the edge of electronics cover Imperfection in tightness of finished product Exchange of boxes Exchange of production charges Change of produced model Classification on the line Immediate reaction to ensure Classification by external company production: Replacement supply Need to check stock YES NO Analysed mismatching parts for a supplier as a proof: If yes, number: 5 pcs. 26.6. 2020 Date of submission of the form: For the department of production quality: For the department of supplier quality: Appendix: 1) Supplier information tag Trend: Description of a problem: What causes it? Immediate reaction on the line:
2) Technical drawing/ documentation
3) Results of measurements
It is not necessary to give results of measurement, as deviation is unquestionable.
4) Photo documentation of deviation
- 45 -
Agricultural, Forest and Transport Machinery and Technologies (ISSN: 2367– 5888) Volume VII – Issue 1, 2020
Due to standardization of processes and cooperation between departments of supplier and production quality, there has been a significant improvement and streamlining of the solution of claims to the supplier. This streamlining was encouraged by defining of responsibilities of individual departments, creation of development diagram for the procedure of managing non-conforming input material and creating a form for submitting data to open a claim to the supplier. These individual steps were successfully applied to a specific complaint, which resulted in a prompt analysis of the problem and its flexible transfer to the supplier, who could respond in the shortest possible time by sending a replacement delivery and solving the problem in its essence. Thanks to this, the production could run without problems and the customer´s orders could be reliably delivered. The form (Table 2) for submitting the necessary information to open a claim against the supplier is used mainly in organizations to which material from external suppliers enters. It is an effective tool for quick summarizing of inevitable information and actions to solve a problem with a supplied material (Cvíčela, 2020). CONCLUSION Standardization as a part of production organizations has its significance. Its basic impact on organization reflects especially in effectiveness of processes, which directly results in higher competitiveness and prosperity of organizations. The objective was to standardize process of cooperation between departments of production and supplier quality in favour of streamlining the solution of non-conforming input material. Defining individual duties solved a question of „who should do and what? “. Thanks to clearly defined responsibilities on both parties, there have been cases where the problem has remained with both parties waiting for the other to take a step. Creation of the form for effective submission of information supported speed of response and ensured that the necessary data were collected and transmitted at once. All the steps of standardization led to a common goal – to ensure smooth running of production with material which fulfils requirements of specification. As a result, the organization can work with higher efficiency and higher assurance that the material from which they produce, is in the required condition and fulfils all the criteria to ultimately meet the customer´s needs with the utmost satisfaction. REFERENCE [1] Bujna, M., Beloev, H., (2015) Tools of risk management in production processes. 1st ed., Ruse : Angel Kanchev University of Ruse, 2015. pp. 105. ISBN 978-954-712-654-1. [2] Bujna, M., Kangalov, P., Nikolov, M., (2019) The influence of the depositio rate of application on the thickness of the molybdenum layer. In Agricultural, forest and transport machinery and technologies. Rousse: Angel Kanchev University of Rousse, 2019, p. 38--43. [3] Bujna, M., Kielbasa, P., (2019) Objectification of FMEA method parameters and their implementation on production engineering. In Trends in agricultural engineering. Praha: Česká zemědělská univerzita, 2019, p. 75--80. ISBN 978-80-213-2953-9. [4] Bujna, M., Kotus, M., Matušeková, E., (2019) Using the DEMATEL model for the FMEA risk analysis. In System Safety: Human - Technical Facility - Environment. 1, 1 (2019), p. 550--557. ISSN 2657-5450. [5] Cvíčela, M., (2020) Standardization of cooperation between production and supplier quality in a manufacturing organization. [Diploma thesis], Nitra, 2020. [6] Gáher, F. - Marko, V., (2017) Method, problem and task. Publisher UK, Bratislava, p. 44. ISBN 978-80-223-4242-1.
- 46 -
Agricultural, Forest and Transport Machinery and Technologies (ISSN: 2367– 5888) Volume VII – Issue 1, 2020
[7] Hrubec, J. - Cservenáková, J., (2016) Engineering of quality production. Publisher SUA, Nitra. ISBN 978-80-552-1536-5. [8] Hučka, M., (2017) Models of company processes. C.H. Beck, Praha, p. 512. ISBN 97880-7400-468-1. [9] Korenko, M., Prístavka, M., Drlička, R., (2015) Management of quality processes. Publisher SUA, Nitra. ISBN 978-80-552-1316-3. [10] Lilko, J., Kotus, M., Dobiaš, P., Ponjican, O., (2019) Hardfacing electrodes resistance in laboratory conditions. In Trends in agricultural engineering. Praha: Česká zemědělská univerzita, 2019, s. 337--340. ISBN 978-80-213-2953-9. [11] Mateides, A., (2006) Management of quality. ISBN 80-8057-656-4, [12] Paulová, I., (2009) Approaches to quality management in educational organization/schools. Methodological- pedagogical centre, Bratislava, ISBN 978-808052-346-6. [13] Paulová, I., (2013) Complex quality management. Iura Edition,Ltd., Bratislava. ISBN 978-80-8078-574-1. [14] STN EN ISO 9000: 2016. Quality management system. Basics and vocabulary. [15] STN EN ISO 9001: 2016. Quality management system. Requirements. [16] STN EN ISO 9004: 2010. Management of the organization´s lasting success. Approach based on quality management. [17] Závadský, J., (2004) Process management in managerial practice. SP Synergia, Trnava. ISBN 80-968734-8-2. CONTACTS Miroslav Prístavka, Department of Quality and Engineering technologies, Faculty of Engineering, Slovak University of Agriculture in Nitra, Tr. A. Hlinku 2, 949 76 Nitra, Slovakia, e-mail: miroslav.pristavka@uniag.sk Hristo Beloev, Department of Agricultural Machinery, Agrarian and Industrial Faculty, University of Ruse, 8, Studentska Str., 7017 Ruse, Bulgaria e-mail: hbeloev@uni-ruse.bg Plamen Kangalov, Department of Repair and Reliability, Agrarian and Industrial Faculty, University of Ruse, 8, Studentska Str., 7017 Ruse, Bulgaria, e-mail: kangalov@uni-ruse.bg Mitko Nikolov, Department of Repair and Reliability, Agrarian and Industrial Faculty, University of Ruse, 8, Studentska Str., 7017 Ruse, Bulgaria, e-mail: mnikolov@uni-ruse.bg Pavol Findura, Department of Machines and Production Biosystems, Faculty of Engineering, Slovak University of Agriculture in Nitra, Tr. A. Hlinku 2, 949 76 Nitra, Slovakia, e-mail: pavol.findura@uniag.sk Petr Bartoš, Department of Agricultural Machinery and Services, Faculty of Agriculture, University of South Bohemia in České Budějovice, Na sádkách 1780 370 05 České Budějovice, Czech Republic, e-mail: bartos@zf.jcu.cz Oľga Urbanovičová, Department of Machines and Production Biosystems, Faculty of Engineering, Slovak University of Agriculture in Nitra, Tr. A. Hlinku 2, 949 76 Nitra, Slovakia, e-mail: olga.urbanovicova@uniag.sk
- 47 -
Agricultural, Forest and Transport Machinery and Technologies (ISSN: 2367– 5888) Volume VII – Issue 1, 2020
Use of Balanced Scorecard Method in Project Management as Support of Technical Development of the Company Pavel Machal, Maksym Stankevych, Hristo Beloev, Miroslav Pristavka, Pavol Findura Abstract: Project management is in itself a philosophy of thought that goes far beyond the boundaries of science or science. The main reason is the complexity and dynamism of securing project results. Other no less important factors contributing to the growing importance of project management are global competition, the explosion of knowledge and customer orientation. Current project management tools allow you to respond quickly and efficiently to unavoidable project changes, using sophisticated procedures and tools for time-limited scheduling of several different types of projects simultaneously in conditions of limited resources. These tools include the Balanced Scorecard method. Project management is therefore one of the basic components of organizational management. Project management is considered by many experts to be the most important activity of the future. Among other things, in the field of technical development. Keywords: Project Management, Technical development, Balanced Scorecard method
INTRODUCTION 21st century has come, the world has reached the edge of a new era. Project management is one of the standard ways of working for successful companies in Western countries, and Western management considers project management knowledge to be an integral part of the skills of managers and executives (Michels, 2015; Bea, Scheurer and Hesselmann, 2011). The trends of the last few years, commanded by ubiquitous globalization, growing complexity, dynamic markets, technical and environmental changes, reveal the background of the shift in social paradigms and give rise to new visionary ideas about the future direction of contemporary society in connection with the new scientific discipline project management. Therefore, the project management has recently received the attention it deserves, which is becoming the company's macroeconomic strategy. The main reason is the complexity and dynamism of securing project results. Other no less important factors contributing to the growing importance of project management are global competition, the explosion of knowledge and customer orientation. Current project management tools allow you to respond quickly and efficiently to unavoidable project changes, using sophisticated procedures and tools for time-limited scheduling of several different types of projects simultaneously in conditions of limited resources. Project management is therefore one of the basic components of organizational management. Project management is considered by many experts to be the most important "management" activity of the future (Pinto, 2013). Especially in today's dynamically changing market environment, it is becoming increasingly important and good management can bring any organization a significant competitive advantage. This is the main reason why more and more emphasis is being placed on it. Project management can also be understood as the process of making change itself (Drucker, 2006; Pugh, 1993). Managing change is one of the managerial skills that is essential for a successful move forward. In addition to the change management process itself, the ability also includes anticipating change, adapting in a timely manner, preparing for it, and responding quickly. It is for these reasons that project management is also linked to the changes. According to Lewin (1998), the basic mechanisms for managing change are as follows: thawing dismantling the current stable balance that supports existing behaviors and attitudes. This process must take into account the potential threats that change poses to people and the need to motivate those affected by change to achieve a natural state of balance by accepting change; change - creating new responses based on new information; freezing - stabilizing change by introducing and fixing new reactions to the personality profile of those affected.
- 48 -
Agricultural, Forest and Transport Machinery and Technologies (ISSN: 2367– 5888) Volume VII – Issue 1, 2020
An effective project manager anticipates and anticipates the need for change and is not the only one to respond to an event that could improve the functioning of the organization; and instead of wandering from crisis to crisis, it manages the process of change over time to be effective and acceptable. MATERIALS AND METHODS The aim of this work is to provide a comprehensive view of one of the important supporting methods of project management development, which can be applied in order to gain a competitive advantage, It is a balanced scorecard (BSC). The work is based on a quality theoretical basis related to domestic and foreign bibliographic sources, the above method is specified as a perspective for project management. Methods of analysis, abstraction, synthesis, induction, deduction and comparison were used in the work. The quality and numerical number of bibliographic sources is an attempt to describe the current state of the issue, which is extremely interesting for us and to predict its developmental perspectives. RESULTS Due to the dynamics of change, project management has growing importance in all types of organizations. The project helps us to solve fundamental transformational changes, product quality planning, introduction of new technologies, order management, development of new products, etc. Knowledge of the principles of project management becomes a mandatory part of every manager's professional equipment. Mastering successful project management is often described as a competitive advantage or as a necessary equipment for the survival of the organization. Projects are not only tools for solving complex problems, but are also a new strategic option for designing the company's organizational structure. A project-oriented company is one that: considers project management as an organizational strategy, uses temporary organizations to implement complex processes, manages a portfolio of projects of various types, has specific permanent organizations for integration functions, applies a "new management paradigm", has an explicit project management culture and considers itself project-oriented (Hrazdilová and Novotný, 2010). One of the important supporting methods of project management development that can be applied in order to gain a competitive advantage is - balanced scorecard (BSC). This approach is based on the fact that the market value of the company differs from the book value of the company. Only financial indicators to measure the company's performance cannot capture the "intangible value of the company",- it also consists of knowledge, skills, employee motivation, business processes, innovation and customer relationships. The concept of a balanced scorecard is often compared with the approach of stakeholders. The organization first defines the important interest groups that affect it - customers, suppliers, the public, etc. Subsequently, the requirements that each group (independent of the other) imposes are recorded. The task of the organization is to meet all these often conflicting expectations as optimally as possible, or. to align them. With the help of BSC, company management can measure how its business units create value for both current and future customers. BSC can be a basic pillar of a modern system of strategic business management (project management with an appeal to the HRM dimension). It enables the creation of a strategyoriented company, as it (as well as its organizational units) brings it a holistic focus. Strategic management systems can be divided into four levels. The first is to clarify and translate the vision and strategy into concrete goals. This is where the creation of the BSC begins, which is the teamwork of the company's top management. Concretizing and clarifying
- 49 -
Agricultural, Forest and Transport Machinery and Technologies (ISSN: 2367– 5888) Volume VII – Issue 1, 2020
the strategy is crucial for the creation of BSC (Kaplan and Norton, 2005). The next part is communication and connection about vision and strategy. At this stage, the strategy is communicated to the following hierarchical levels and further specified. The goals of a specific area and individual goals are harmonized, which enables all employees to live with long-term goals. The third part is the process of planning and setting goals, including the alignment of strategic initiatives. Goals should be set for three to five years, and once they are achieved, the business can be transformed. BSC also enables the combination of strategic planning with the creation of corporate budgets. This process allows you to: ̶ quantify the long-term outputs that the organization wants to achieve, ̶ identify the mechanisms and resources needed to achieve outputs, ̶ set short-term targets for both financial and non-financial benchmarks. The last part is to improve the feedback and learning process. This process is the most important and innovative in the entire BSC, as it allows monitoring and continuous adjustment of implemented strategies and, if necessary, completely changes them (Kaplan and Norton, 2005). The Balanced Scorecard, a system of balanced business performance indicators, is a method in management that creates a link between strategy and operational activities with an emphasis on measuring performance. It is one of the most comprehensive models of a strategic performance measurement system. The BSC method was created in response to the finding that a number of strategic goals were not put into practice. Many companies have a problem with the real connection of strategies with operational activities, when the strategy is implemented in all business areas and it is possible to measure the achievement of strategic goals. One of the reasons for this is that the basis of operational plans are usually only financial indicators that cannot sufficiently characterize the entire company. Therefore, it is necessary to monitor and balance all metrics - in addition to financial indicators also indicators focused on customers, business processes and employees. The origin of the Balanced Scorecard dates back to the early 1990s. However, the idea of measuring and evaluating in some way the performance of parts of a business is much older. Specifically, this method was developed by the research company Nolan Norton Institute. In 1990, the company sponsored a twelve-month study called "Measuring Performance in the Organization of the Future." The study was funded by the institution to make sure that existing metrics based on financial ratios are outdated. The study leader at Nolan Norton Institute was David P. Norton. Robert S. Kaplan of Harvard University held the position of Academic Consultant. In the United States, in the study, they analyzed several companies, in the order of dozens. One of the companies was Analog Devices, which used the Corporate Scorecard tool to measure performance and included: financial metrics, metrics related to customer lead times, quality and number of cycles in the production process, and new product development efficiency. The Analog Devices manager provided Norton and Kaplan with information on the practical use of the Corporate Scorecard, which resulted in modifications to the first Scorecard. The name has also been changed to Balanced Scorecard. These findings were summarized in the late 1990s, but the Balanced Scorecard was not fully developed until early 1992. Norton and Kaplan published an article on BSC, which referred to the method as a performance-enhancing metric. As part of their practice in companies, they understood the limited ability of financial indicators to determine, measure and control the success of the implementation of corporate strategy. They also recognized the need to create a comprehensive model that would allow for real objective measurements The Balanced Scorecard is therefore a tool for measuring business performance.
- 50 -
Agricultural, Forest and Transport Machinery and Technologies (ISSN: 2367– 5888) Volume VII – Issue 1, 2020
Specifically, it is a tool for strategic business management. In the analysed companies, there were often errors in the shift, which began with the preparation and went through the summarization of the strategic plan to the actual implementation. It is therefore important for the company to be able to measure the shift that aims to increase performance and quality, and also on the basis of the achieved values leads to conclusions and necessary changes in strategy. The company's strategies are important for the use of the BSC method. The strategies are as follows: set the direction in which the company will be oriented and the goals it should achieve. Then the company derives sub-goals and sets metrics according to which the evaluation of whether it is approaching the set overall and sub-goals, or how many she achieved. These metrics can also lead to financial evaluation of employees. Each company sets metrics individually, as they are based on its strategy and goals. If he chooses the wrong metrics, the BSC method may not work or may go wrong. BSC is used only in the very end. It cannot be used unless, for example, the company's strategy or goals are specified. The set of tools provided by BSC thus measures the company's performance using four perspectives (Fig. 1): ̶ finance and financial indicators, ̶ internal business processes, ̶ customers, ̶ learning and growth (innovation). Each measure should be an element of a chain of context that will lead to an increase in the company's financial performance. To understand an important aspect of BSC, namely its dynamism, it is necessary to be aware of the causality between different perspectives (Fig. 2). The BSC should report on a strategy that begins with long-term financial goals linked to a sequence of actions in financial and internal processes, in the areas of customer and employee care, in order to achieve long-term economic performance. In most companies, financial plans such as increasing turnover, reducing costs, reducing risk, or increasing productivity allow the necessary interconnection of all four BSC perspectives. Financial goals must play a dual role. They define the financial performance expected from the strategy and serve to evaluate the objectives and benchmarks of all other BSC perspectives. Financial goals can vary greatly in different phases of a company's life cycle. There are several types of strategies from which business units can choose. For simplicity, we list only 3 of them: growth, retention, and highest returns. As part of its internal business process, the company examines emerging or hidden customer needs and then, based on the survey, adjusts products or services to meet those needs. The second step of the basic internal value chain is the operational process. This process begins when products and services are already created and delivered to customers. The third main step of the internal value chain is customer service after the sale of a product or delivery of a service, such as fast service in response to a current failure and downtime. In the BSC customer perspective, companies identify customer and market segments. In the past, companies have focused on their internal capabilities and focused on technological innovation. If they did not understand the needs of customers in time, they were surprised by the competition, which came up with a more advantageous offer of products and services. That is why companies are trying to shift their interest to customers. In general, customers have different preferences and different ratings of product and service characteristics. The basic group of customer output measures is applicable to all types of businesses and includes the following: market share, customer retention, customer acquisition, customer satisfaction and customer profitability. The fourth and final perspective of the BSC develops benchmarks and goals that support learning and growth. The goals set in the perspectives of financial, customer and
- 51 -
Agricultural, Forest and Transport Machinery and Technologies (ISSN: 2367– 5888) Volume VII – Issue 1, 2020
internal processes determine where the company should achieve a breakthrough in performance. Objectives in perspective and learning are enabled in order to achieve the objectives in the previous three perspectives. BSC emphasizes the importance of investing in the future. And not just in traditional areas of investment, such as new equipment or research and development of new products. A company must also invest in its infrastructure - people, systems and procedures if it wants to achieve long-term goals. The three basic areas of the learning and growth perspective are: employee skills, information system skills, motivation and commitment. Perspectives make it possible to monitor not only financial results, but also how companies are able to provide the tangible and intangible assets needed for their growth and competitiveness; and how they create value for current and future customers and how the quality of human resources, systems and working methods that are necessary to increase future performance must be improved.
Learning Innovatio
Finance
Internal bussines processes
BSC Customers
Fig. 1 Perspective of Balanced Scorecard conception, Source: Horváth & Partners, 2002
Learning and growing Knowlage of workers
Internal processes
Customers Customer satisfaction
Process quality
Finance ROCE, EVA
Fig. 2 BSC Perspective, Source: Horváth & Partners, 2002 It is human nature to trust and pay more attention to hard factors (that is, to all variables that can be measured, calculated, or weighed) than to soft factors. However, the success of an organization does not depend only on hard factors. At least as strongly (if not even more strongly) the success of a company is determined by "soft" factors such as: image, employee satisfaction and the quality of the management system.
- 52 -
Agricultural, Forest and Transport Machinery and Technologies (ISSN: 2367– 5888) Volume VII – Issue 1, 2020
Balancing in relation to benchmarks means not only using quantitative, easily measurable indicators, but also causal, qualitative measurement systems. In recent years, there have been significant changes in the understanding of the needs of employees and their management. The image of an attractive employer again means a competitive advantage, especially in recruiting the best employees - the so-called high potentials - with high potential. The more important employees are in terms of strategy implementation, the more important is the connection of BSC with the employee management system. In most cases, employees are most important in the implementation of the strategy (Horváth & Partners, 2002). The effectiveness of the BSC increases with the degree of mutual integration with the employee management system: individual goals are agreed with the employees, which increases the level of personal commitment, strengthens their awareness of the need to achieve goals and responsibility. According to Kaplan and Norton (2005), the goal of each measurement system is to motivate managers and employees to successfully implement the strategy. Companies that are able to transform their strategy into a measuring system then implement this strategy much more easily. They can communicate their goals and intentions. The three basic principles of linking BSC benchmarks with strategy are: cause-andeffect relationships, performance drivers, and financial links. Building a new strategic management system, the framework of which consists of BSC, is its main goal of the project. The project is divided into two basic stages: Stage 1: building a basic BSC, as a strategic system for measuring company performance; the implementation period of the first stage is 46 months. Stage 2: use of the basic BSC as a framework for creating a new strategic management system. The implementation period is estimated at approximately two years. Grasse et al. (2010) formulated the implementation of the BSC method into the following seven steps: specifying specific objectives, setting indicators and plan of target groups, compiling a strategic map, deciding on perspectives, discussing and approving the results of previous activities, identifying strategic activities and expanding BSC. Horváth & Partner (2001) present four steps of implementing the BSC concept: Phase 1: creation of organizational preconditions for implementation - in this phase it is a matter of defining conceptual rules, which will later apply to all organizational units in which the BSC will be implemented. The perspectives of the BSC and the organizational units for which it will be created must be set out. In addition to the basic BSC perspectives, so-called above-standard perspectives can be selected. At this stage, it is also important to lay down rules concerning project management. This includes, among other things, determining the organization of the project, the progress of the project and the provision of information. BSC should be created for strategic business units, which should include all activities from the value chain. These activities are innovation, operation, marketing, distribution, sales and service. A strategic business unit should have its strategy, produce its own products and have its customers. Phase 2: Clarifying the Strategy - The BSC process begins with management teamwork and translating the strategy into specific strategic goals. Therefore, it is necessary that the company's strategy is clearly defined and known to all employees of the company. At this stage, therefore, the strategy must be clarified. The company should clarify its vision. Where he is heading and how he wants to be perceived. This is followed by an update of the strategy and an introduction to all levels of management with the strategy. Phase 3: creation of a BSC - after setting the organizational prerequisites and clarifying the strategy, a BSC can be created for a selected strategic business unit. In this phase, the following steps will be taken: specification of strategic goals - strategic goals can be considered those that are really important. They are the basis of the creation of the BSC and all the further steps for its creation are based on them. The strategy is concretized and strategic goals are assigned to individual perspectives. Each perspective should contain 4 to 5
- 53 -
Agricultural, Forest and Transport Machinery and Technologies (ISSN: 2367– 5888) Volume VII – Issue 1, 2020
strategic goals. Linking strategic objectives through a cause-and-effect relationship - Creating a cause-and-effect relationship is most often based on the objectives of the financial perspective, which are the first to be linked. Then it is good to ask the question: "What subordinate goals lead to the achievement of a superior?" Furthermore, the goals of the financial perspective are linked to the goals of the customer perspective, process perspective and learning and growth perspective. Selection of benchmarks - it is necessary to set financial and non-financial benchmarks for individual goals, by means of which we can monitor how the strategic goals are met. No more than two benchmarks should be set for each objective. Most of them should be quantitative, but it may happen that a qualitative measure is set. Setting target values for scales - a target value should be set for each scale. This should be challenging and difficult to achieve, but not unrealistic. Target values are set in the horizon of 3 to 5 years. First, the value to be achieved over the entire time horizon is determined, and then it is broken down into target values for individual years of the time horizon. Finding strategic actions to strategic goals - Strategic actions must then be set for strategic goals, which are ways in which the company wants to achieve the fulfillment of strategic goals. For strategic actions, it is necessary to identify the persons who will be responsible for their implementation. (Kaplan and Norton, 2005) Phase 4: roll-out expansion process - in this phase, the creation of the BSC is extended from the selected strategic unit to other organizational units of the company. The procedure is the same as in phase 3. The roll-out process in a company proceeds in two directions. Horizontally, when business units are interconnected at the same organizational level, and vertically, when individual levels of BSC management are interconnected, it emphasizes the communication of the corporate vision to lower levels. Common goals, their evaluation, revision, creation and control lead to more open communication and force mutual cooperation. The BSC methodology thus leads to a mental unification of the company's management and employees over the vision, strategy and strategic goals. The BSC management method represents a thoughtful approach to integrating corporate know-how into a comprehensive management system. Just as this method is important for society as a whole, it can also be used to manage individual organizational units. Its principles are generally valid and it therefore depends on each organization how it implements its own BSC methodology and how it connects it with the existing strategy and uses the synergy effect. BSC means: clarification and transfer of vision and strategy into specific goals (through the company to organizational units and departments), thought unification of management and employees of the company in terms of visions, goals and procedures for achieving goals, implementation of the strategy as a whole, a comprehensive system for monitoring the company's performance, planning and setting goals, harmonization of strategic initiatives, communication and interconnection of strategic plans and benchmarks, ensuring measurability and updating the corporate vision and strategy, correcting the corporate strategy based on measuring the efficiency and profitability of key processes and the principle of feedback, improving feedback and the learning process. The novelty or rather today's topicality of the BSC method lies mainly in the fact that it forces managers to change their way of thinking and managerial procedures. Successful implementation of BSC can help eliminate a number of shortcomings that suffer from the management practice of many Czech companies. These are mainly three of them (Houser, 2005). First of all: our companies often completely lack strategy, or have a formal character or it is not implemented in the end. Operative moments of management and unwanted improvisation get the word out. BSC allows you to break away from the operation and focus on key issues of long-term development and competitiveness. Second, managers tend to be "looking back." They do not pay adequate attention to the achieved results, which, moreover,
- 54 -
Agricultural, Forest and Transport Machinery and Technologies (ISSN: 2367– 5888) Volume VII – Issue 1, 2020
are not confronted with the goals. You can't drive according to the rearview mirror. The BSC methodology requires a windshield. In the BSC concept, the focus of managerial work becomes a corporate perspective. Thirdly, drowning is another ailment of Czech managerial practice in information details. Managers take a microscope rather than binoculars in their hands. The BSC forces decisions to be made comprehensively, in a long-term context and balancing goals. Management methods are deployed today more or less successfully. However, it is always necessary to think about the basic principles of the method and the benefits of its application for society. BSC is a tool for promoting strategic change. It is used to "turn the strategic helm" of the company. Thus, BSC is not a multi-year business plan focused on inertia and continuity, nor a fashionable term for operational reporting, for which this method is sometimes issued. We consider such BSC degradation to be inadequate. CONCLUSION The Western world considers project management knowledge to be the standard knowledge that every manager needs to have. The use of project management is a best practice that successful organizations use to ensure good competitiveness. If organizations want to succeed in the market, whether local, European or global, they must learn to use project management well. ACKNOWLEDGEMENT The article was published with the support of the Visegrad Grants no. 22020162 Training of farmers V4 in techniques for environmental protection and soil water management. REFERENCE [1] Bea, F., Scheurer, S., Hesselmann, S., (2011) Projektmanagement. UTB GmbH: Munchen. ISBN 978-382-5223-885. [2] Drucker, P., (2008) Management podle Druckera. Odkaz zakladatele moderního managementu. Management Press: Praha. ISBN 978-80-7261-181-2. [3] Grasseová, M., (2010) 33 nejpoužívanějších metod strategického řízení. 1. vyd. Brno: Computer Press. ISBN 978-80-251-2621-9. [4] Horváth & Partners, (2001) Balanced Scorecard v praxi. Stuttgard: Schäffer – Poeschel. ISBN 3-7910-1813-2. [5] Hrazdilová, K., Novotný, J., (2010) Kultura projektově orientované společnosti. Journal of Competitiveness, 1(2010), 74-84. ISSN 1804-171X. [6] Kangalov P., (2013) Designed for repair and dealer enterprises. Ruse: University of Ruse "Angel Kanchev”, ISBN: 978-619-90013-4-9 [7] Kaplan, R., Norton, D., (2005) Balanced scorecard: strategický systém měření výkonnosti podniku. 4. vyd. Praha: Management Press. ISBN 80-726- 1124-0. [8] Lewin, K., (1998) Resolving Social Conflicts and Field Theory in Social Science. American Psychological Association. ISBN 978-15-5798-415-9. [9] Michels, B., (2015) Projektmanagement Handbuch - Grundlagen mit Methoden und Techniken für Einsteiger. CreateSpace Independent Publishing Platform. ISBN 978-1518706578. [10] Pinto, J., (2013) Project Management. Prentice Hall: USA. ISBN 978-013-6065-616. [11] Pristavka, M., Findura, P., Kangalov, P., Malaga-Tobola, U., Kubon, M., (2018) Using the EFQM Model in Selected Organization. Agricultural, Forest and Transport Machinery and Technologies, 2018, Vol. V – Issue 1, pp. 74-82, ISSN: 2367 – 5888 [12] Pugh, D., (1993) Understanding and managing organizational change. London: Open University. - 55 -
Agricultural, Forest and Transport Machinery and Technologies (ISSN: 2367– 5888) Volume VII – Issue 1, 2020
CONTACTS Pavel Máchal, Institute of Lifelong Learning, Mendel University in Brno, Zemědělská 5, 61300 Brno, Czech Republic, pavel.machal@mendelu.cz Maksym Stankevych, Department of Machines and Production Biosystems, Faculty of Engineering, Slovak University of Agriculture in Nitra, Tr. A. Hlinku 2, 949 76 Nitra, Slovakia, xstankevych@gmail.com Hristo Beloev, Department of Agricultural Machinery, Agrarian and Industrial Faculty, University of Ruse “Angel Kanchev”, 8 Studentska str., 7017 Ruse, Bulgaria, e-mail: hbeloev@uni-ruse.bg Miroslav Prístavka, Department of Quality and Engineering technologies, Faculty of Engineering, Slovak University of Agriculture in Nitra, Tr. A. Hlinku 2, 949 76 Nitra, Slovakia, miroslav.pristavka@uniag.sk Pavol Findura, Department of Machines and Production Biosystems, Faculty of Engineering, Slovak University of Agriculture in Nitra, Tr. A. Hlinku 2, 949 76 Nitra, Slovakia, pavol.findura@uniag.sk
- 56 -
Agricultural, Forest and Transport Machinery and Technologies (ISSN: 2367– 5888) Volume VII – Issue 1, 2020
Variants of Solution and Evaluation of FMEA in Practice Marian Bujna, Plamen Kangalov Abstract: Failure Mode and Effects Analysis (FMEA) is a model used to prioritize potential defects based on their severity, expected frequency, and likelihood of detection. An FMEA can be performed on a design or a process and is used to prompt actions to improve design or process. There is an uncertainty from manufacturers at present that the setting of criteria’s of FMEA is subjective. There is another problem in determining the priority of resolving failure modes. The paper provides various options for prioritizing failure modes. At the same time, the individual methods specify the parameters for calculating the Risk priority number (RPN). We achieve objectification of criteria’s for RPN calculation in FMEA. These are time-consuming and cost-effective designs. The proposed innovations are an extended RPN, including the creation of an extended FMEA and the use of the DEMATEL model. Keywords: Risk management, FMEA, Objectivization of criteria, Extended FMEA, DEMATEL
INTRODUCTION Problems and defects are expensive. Customers understandably place high expectations on manufacturers and service providers to deliver quality and reliability (Polák et al., 2015; Prístavka et al., 2014, Korenko et al., 2015). Often, faults in products and services are detected through extensive testing and predictive modeling in the later stages of development. However, finding a problem at this point in the cycle can add significant cost and delays to schedules. The challenge is to design in quality and reliability at the beginning of the process and ensure that defects never arise in the first place (Kotus et al., 2019; Girmanová et al., 2017; Žitňák et al., 2014). Industries dealing with the production and maintenance of machines have to be reliable in order to meet the market demand and maintain integrity. To achieve reliability of the functional working machines, FMEA suggests a structured procedure for preventing failures or to reduce the effect of their consequences. FMEA is used in preventative activities for the most important maintenance planning. However, the high-risk components must be inspected and maintained frequently rather than components with a lower risk (Alrifaey M. et al. 2019). The aim of the paper is to show different variations of the results of FMEA analyzes, the right prioritization before proposing actions. The second aim is to objectively determine the resulting RPN. MATERIALS AND METHODS 1. To prepare the paper we used an example of a process with failures F1, F2, F3, F4 and F5. 2. Creation of a classical conventional FMEA. - Identification of causes, consequences and determining the method of control. - Determination of severity of consequences, occurrence of failures and detection according to IATF 16 949: 2016. - Calculation of RPN – RPN = S.O.D Where: S -Severity, O – Occurrence, D - Detection. 3. Prioritization by RPN. 4. Prioritization by severity. 5. Creation of extended FMEA. - Include costs and calculate new parameters S, O, D. - Calculation of extended RPN. - Prioritization by extended RPN 6. Use of the DEMATEL method to specify severity. - Evaluation of the use of DEMATEL. - 57 -
Agricultural, Forest and Transport Machinery and Technologies (ISSN: 2367– 5888) Volume VII – Issue 1, 2020
RESULTS AND DISCUSSION Classical conventional process FMEA (PFMEA): ̶ the globally most widely used method for risk analysis in the production process, ̶ the aim is to define possible failures in relation to functional requirements, to estimate the probability of occurrence of the causes of failures and their detection and to take actions for the most significant risks, ̶ importance in quality management systems. Table 1 Basic information about process and failures Proces X
Failure Nf IFC [€] F1 200 10 F2 30 20 F3 20 20 F4 20 30 F5 5 200 Where: Nf – number of failures, IFC – internal failure costs, WoC - no-casualty costs.
WoC [€] 20 40 30 40 280
Creating a process FMEA. The occurrence is determined based on the number of causes of the failures. The severity is determined based on the consequence of the failure. The detection is determined based on the control method. Table 2 Conventional FMEA – prioritization by RPN Failure F1 F2 F3 F4 F5
Cl I II III IV V
Consequences Co1 Co2 Co3 Co4 Co5
S 2 4 4 5 9
Causes Ca1 Ca2 Ca3 Ca4 Ca5
O 9 3 2 2 2
Current process Cp1 Cp2 Cp3 Cp4 Cp5
D 5 4 5 4 5
RPN 90 48 40 40 90
Cl I/II III IV/V IV/V I/II
The classification based on the priority risk number is in the last column. This is a classic conventional evaluation based on RPN and the actions are taken according to the prioritization. The VDA approach is often focused on the severity of the failure consequence. The prioritization changes in this case as follows: Table 3 Conventional FMEA – prioritization by severity Failure F1 F2 F3 F4 F5
Cl I II III IV V
Consequences Co1 Co2 Co3 Co4 Co5
S 2 4 4 5 9
Causes Ca1 Ca2 Ca3 Ca4 Ca5
O 9 3 2 2 2
Current process Cp1 Cp2 Cp3 Cp4 Cp5
D 5 4 5 4 5
RPN 90 48 40 40 90
Cl V III/IV III/IV II I
Here we can already see that failure F5 will be solved first, but the priority of solving failure F1 has changed, because it has high occurrence despite the minor consequence. Some manufacturers consider RPN as a cosmetic number. What matters most is how important the consequence is. Therefore, many practitioners require clarification of the individual FMEA criteria, as we can see the double interpretation brings uncertainty in serious decisions. Costs are very important for every manufacturer. If we include them in the FMEA, we can refine the determination of severity and thus reduce the subjectivity of the evaluation of these criteria. Nguen and Bujna are dealing with this (Nguyen et al., 2016; Bujna et al., 2019, Holota et al., 2016).
- 58 -
Agricultural, Forest and Transport Machinery and Technologies (ISSN: 2367– 5888) Volume VII – Issue 1, 2020
We can consider prevention costs, internal and external costs.Internal costs (IFC) were the costs of scrap, rework, retest, failure analysis, downtime and yield losses, etc. External costs (EFC) will not be considered in the study. They represent complaints to customers. If they existed, we would add them to the study. WoC represents "no-casualty costs" and are mainly in the form of complaints and handling these complaints. IFCs and WOCs are in Table 1. then: PO (occurrence probability of the mode) is based on the classical O (occurrence) parameter: O 9 (1) PO = = = 0 ,9 10 10 The PD (detection probability of the mode) is based on the conventional D (detection) parameter of the conventional PFMEA. In its determination there is already a significant difference compared to PFMEA. We calculate it according to the formula: ( 10 − D ) ( 10 − 5 ) (2) = PD = = 0 ,56 9 9 For SI (severity level of internal failure costs), we start from already mentioned internal costs (IFC) and their share in the minimum costs of FCmin . It should be added that we are talking about the costs that make up the smallest entry of all costs (IC, EC, SC) for all failures listed in the PFMEA. IFC 10 (3) SI = = = 1, 0 FC min 10 For SE (severity level of external failure costs), we start from the already mentioned external costs (EFC), in our case from WoC, and their share to the minimum costs of FCmin. WoC 20 (4) SE = = = 0 ,5 FC min 14 If we do not take into account the full external costs, we do not take into account the probability of a casualty caused = 0. Final ERPN calculation for extended FMEA is calculated according to: (5) = ERPN PO.ST .[ PD.SI + ( 1 − PD ).( poc.SC + ( 1 − poc ).SE )] = ERPN 0 ,9.2.[ 0 ,56.1, 0 + ( 1 − 0 ,56 ).( 0.0 + ( 1= − 0 ).0 ,5 )] 3, 68
Table 4 Extended FMEA Failure F1 F2 F3 F4 F5
Conventional FMEA - RPN S(ST) O D RPN Cl. I II III IV V
2 4 4 5 9
9 3 2 2 2
5 4 5 4 5
90 48 40 40 90
I/II III IV/V IV/V I/II
PO
Extended FMEA - ERPN PD SI SE poc ERPN
0.9 0.3 0.2 0.2 0.2
0.56 0.67 0.56 0.67 0.56
1 2 2 3 20
0.5 0.8 0.6 0.8 28
0 0 0 0 0
1.4 1.9 1.1 2.3 42.4
Cl. IV III V II I
Benefits ̶ inclusion of the cost of materiality of the failure, ̶ objectification of the severity criteria, ̶ objectification of RPN, ̶ time, cost, and human capacity saving. Another way to refine the results is to consider that one failure can cause multiple
- 59 -
Agricultural, Forest and Transport Machinery and Technologies (ISSN: 2367– 5888) Volume VII – Issue 1, 2020
failures. Also, we mean that there is an interaction between the failures. One failure can cause several other failures. We can use various analyzes. As an example, I will use the DEMATEL matrix (Tsai et al, 2017; Bujna et al., 2019). In our study, failures 1 and 5 are independent of other failures, but there is a relationship between failures 2, 3 and 4. The intensity of relation is in Table 5. Table 5 Comparison square of the DEMATEL method Numeral 0 1 2 3 4
Definition No influence Low influence Medium Influence High influence Very high influence
The team of experts involved in the creation of the FMEA assesses the interrelationships between failures (or causes of failures). Table 6 Step 1 - generating the direct-relation matrix (A) Index A F1 F2 F3 F4 F5
F1 0 0 0 0 1
F2 0 0 3 4 1
F3 0 3 0 4 1
F4 0 3 4 0 1
F5 0 0 0 0 0
Calculating the normalized direct-relation matrix (N). Use the column vectors and maximum values as the baseline for normalization (k). 1 (6) k= n max1≤i ≤ n ∑ j =1 xij N = k.A
(7)
Table 7 Use the column vectors and maximum values as the baseline for normalization ΣNi 0 6 7 8 4
ΣNij 8
A 0.125
Table 8 Step 2 - Normalized direct-relation matrix N Index N F1 F2 F3 F4 F5
F1 0 0 0 0 0.125
F2 0 0 0.375 0.5 0.125
F3 0 0.375 0 0.5 0.125
F4 0 0.375 0.5 0 0.125
F5 0 0 0 0 0
We calculate the total relation matrix T. Matrix T is an n x n matrix and it is calculated as follows:
T= lim( N + N 2 + ... + N k = ) N .( 1 − N ) n →∞
where I represent the identity matrix.
- 60 -
(8)
Agricultural, Forest and Transport Machinery and Technologies (ISSN: 2367– 5888) Volume VII – Issue 1, 2020
Table 9 Step 3 - Calculate the total-relation matrix Index N F1 F2 F3 F4 F5
F1 0 0 0 0 0.1250
F2 0 1.9091 2.4242 2.6667 1
F3 0 2.1818 2.1515 2.6667 1
F4 0 2.1818 2.4848 2,3333 1
F5 0 0 0 0 0
We calculate the values in each row and column. We sum the values in each row and column in the total-relation matrix (T). We let Di be the sum of the i-th column and Rjj be the sum of the j-th row. Thus, the Di and Ri values comprise both indirect and direct influences. = Di = Ri
∑ ∑
n
t ( i + 1, 2 ,...,n )
(9)
t ( i + 1, 2 ,...,n )
(10)
j =1 ij
n
j =1 ij
Table 10 Summary of the prominence and relation D 0 6.2727 7.0605 5.3334 3.1250 Average
R 0.1250 8 8 5.6666 0
D+R 1.1250 14.2727 15.0605 11 3.1250 8.92
D-R -0.1250 -1.7273 -0.9395 0.3332 3.1250 0.13
Fig. 1 Relational diagram The division of causes of failures according to their significance: 1. High prominence and high relation. Failure F4 is the actuating factors for solving problems. 2. Low prominence and high relation. Failure F1 is relatively independent. 3. Low prominence and low relation. Failure F5 is relatively independent. 4. High prominence and low relation. Failures F2 and F3 are effect factors, and thus they cannot be directly improved. DEMATEL's results showed the need to include these results in determining the severity category S, as DEMATEL determined three errors of similar severity F2, F3 and F4 with different meanings. - 61 -
Agricultural, Forest and Transport Machinery and Technologies (ISSN: 2367– 5888) Volume VII – Issue 1, 2020
CONCLUSION The conventional FMEA method has several shortcomings. For instance, the severity (S), occurrence (O), and detection (D) indicators are discrete ordinal scales of measure; the calculation by multiplication is inappropriate and it ignores the relative importance between S, O, and D and assumes that they are assigned equal weight, which might not be true in practice. (Chang, Cheng, 2011). Therefore, the aim of the paper was to point out the possibility of specifying individual indicators. The paper shows various variations of the solution to this problem. Applying the extended FMEA analysis offers a refinement of the results of the conventional PFMEA, which has a significant effect on improving the quality of the resulting products, time savings, improving overall safety and, last but not least, reducing operating costs. We will mainly achieve the objectification of parameters for the creation of extended RPN. Applying the DEMATEL model will provide us with an overview of binding identified failures through their bonds. Failures are sorted by their bindings to other failures in the prioritization of whether they affect other failures more in proportion to how they are influenced by other failures. REFERENCES [1] Alrifaey, M., Hong, T., Supeni E., et al. (2019) Identification and Prioritization of Risk Factors in an Electrical Generator Based on the Hybrid FMEA Framework. February 2019. Energies 12(4):649. DO - 10.3390/EN12040649. [2] Bujna, M., Kiełbasa, P., (2019) Objectification of fmea method parameters and their implementation on production engineering. In 7thTAE2019. Trends in agricultural engineering 2019. Praha: Česká zemědělská univerzita, 2019, s. 75--80. ISBN 978-80213-2953-9 [3] Bujna, M., Kotus, M., Matušeková, E., (2019) Using the DEMATEL model for the FMEA risk analysis. Cz OTO 2019, 1(1),550-557. SCIENDO [4] Chang, K., Cheng, C., (2011) Evaluating the risk of failure using the fuzzy OWA and DEMATEL method. J Intell Manuf, 22 (2) (2011), pp. 113-129. DO - 10.1007/s10845009-0266-x. [5] Girmanová, L., Šolc, M., Kliment, J., et al. (2017) Application of Six Sigma Using DMAIC Methodology in the Process of Product Quality Control in Metallurgical Opeeration. Acta Technologica Agriculturae.20(4). 104-109. [6] Holota T., Hrubec J., Kotus M., et al. (2016) The management of quality costs analysis model. Ser-bian journal of management. 11(1),119-127.ISSN 1452-4864. [7] Korenko, M., et al. (2015) Risk analysis at work in manufacturing organization. Acta Universitatis Agriculturae et Silviculturae Mendelianae Brunensis,63(5), 1493-1497. [8] Kotus, M., Drlička, R., Mikuš, R., Žarnovský, J., (2019) Hazard analysis and risk assessment in metal cutting process. In MAPE - Multidisciplinary aspects of production engineering. Part 1. Zabrze: Wydawnictwo Panova, 2019, s. 382--391. ISBN 978-3-11067482-8 (brož.). [9] Polák, P., Prístavka, M., Kollárová, K. (2015) Evaluating the effectiveness of pro-duction process using pareto analysis. Acta technologica agriculturae. 18(1)18-21. ISSN 13352555. [10] Prístavka, M., Beloev, H., Kročko, V. (2014) Quality control in production processes. Angel Kanchev University of Ruse, Bulgaria. [11] Prístavka, M., Beloev, H., (2015). Engineering of Products Quality. 1. vyd., Ruse: Angel Kanchev University of Ruse, 2015. 186s . ISBN 978-954-712-655-8
- 62 -
Agricultural, Forest and Transport Machinery and Technologies (ISSN: 2367– 5888) Volume VII – Issue 1, 2020
[12] Nguyen, T., Shu, M., Hsu, B., (2016) Extended FMEA for sustainable manufacturing: An empirical study in the non-woven fabrics industry. Sustainability, 8(9), 939 [13] Tsai, S., Zhou, J., Gao, Y., et al. (2017) Combining FMEA with DEMATEL models to solve production process problems. Deng Y, ed. PLoS ONE. 2017. 12(8):e0183634. doi:10.1371/journal.pone.0183634. [14] Žitňák, M., Macák, M., Korenko, M., (2014) Assessment of risks in implementing automated satellite navigation systems.Research in agricultural engineering. 60, 16-24. CONTACT Marián Bujna, Department of Quality and Engineering Technologies, Faculty of Engineering, Slovak University of Agriculture in Nitra, Tr. A. Hlinku 2, 949 76 Nitra, Slovak Republic, marian.bujna@uniag.sk Plamen Kangalov, Department of Repair and Reliability, Agrarian and Industrial Faculty, University of Ruse, 8, Studentska Str., 7017 Ruse, Bulgaria, e-mail: kangalov@uni-ruse.bg
- 63 -
Agricultural, Forest and Transport Machinery and Technologies (ISSN: 2367– 5888) Volume VII – Issue 1, 2020
Current Situation of Selling Telehandlers, Due To Ukrainian and Slovakian Markets Conditions Maksym Stankevych, Pavol Findura, Miroslav Pristavka, Volodymyr Kyurchev, Volodymyr Nadykto, Olga Urbanovicova, Vladimir Krocko Abstract: The main target is to explain the system of marketing sources of selling telescopic handlers due to the conditions of Slovakian and Ukrainian markets. The first part of this article consists of general information about handlers and the second part has an information about technical parameters and characteristics of telescopic handlers and also, analytical information about marketing opportunities in Slovakia and Ukraine. From available sources as Moreau Agri s.r.o and Agromax Group s.r.o, we analyzed the situation about sold Manitou on Slovakian and Ukrainian markets accompanied with needed images. The information, which included in this article, can help potential customers to choose the telescopic handler based on brand, price and technical parameters. During the research of the total amount of sold telescopic loaders in year 2019, we have found that there were 728 loaders sold in Ukraine and only 222 telescopic in Slovakian Republic. Keywords: marketing processes, Telescopic handlers, Slovakian market, Ukrainian market
INTRODUCTION Today’s time is not only modern, but also rapidly changing. Every day we observe changes in the development of different types of production. We can see the same in the production of machinesin our situation telescopic loaders. Loaders, according to Abraham et al., (2017) are machines which designed for taking over materials, relocating, storing and transferring them. Due to NOVÁK Michal. (2019) telescopic loaders it’s a multisector machinery whether in agriculture, construction and increasingly now in municipal sphere too. Telescopic loaders are known not only by performing a huge number of different types of work, but also by modernization the whole structure of human activities. Now, to do a small amount of work, we don’t need to work hard whole day any more, even when it’s rainy or freeze outside. Telescopic handler will need just few hours to do it operator work from a comfortable cabin with clean air from the air conditioning and listening music from the radio. It follows that development has paved the way for the improvement and modernization of farms and agricultural holdings, the construction, development of villages, small towns and metropolises. According to Vaněk, A. (2003) telescopic loaders today perform more than 20 different tasks. That’s why sellers are constantly trying to promote and innovate their products in order to succeed in the market. That's why we have many different modifications of loaders, a number of work equipment and different types of adapters. MATERIALS AND METHODS To reach the target of this problematic, we need to use methods, which are based on defined and predetermined goals. To fulfil the goal, the work procedure was determined: ̶ study of available professional domestic and foreign literature, use of knowledge acquired at the Technical Faculty in Nitra, use of magazines, websites, etc. ̶ Selection of specific companiessellers, ̶ obtaining company data through personal contacts with company directors and their employees, company websites, internal regulations, promotional materials and through the actual observation and analysis of the company. ̶ Processing and analysis of the data obtained, ̶ Processing and evaluation of marketing tools used by companies, ̶ Graphic processing of sold manipulators for the year 2019 ̶ Graphic comparison of Manitou machine markets in Slovakia and Ukraine.
- 64 -
Agricultural, Forest and Transport Machinery and Technologies (ISSN: 2367– 5888) Volume VII – Issue 1, 2020
The following methods were used in this article: ̶ Decomposition of units, their components ̶ Analysis, ̶ combining the components ̶ Synthesis, ̶ Logical consequence of thought reasoning ̶ Deduction ̶ Assessment of the strengths and weaknesses of the markets of Slovakia and Ukraine Analyzing will be made based on information from two companies in Slovakia and Ukraine, which both are dealers of telescopic handlers Manitou “Moreau Agri” and Agromax group”. RESULTS AND DISCUSSION To fully explain the current situation in selling telescopic telehandlers in Ukraine and Slovakia we should take a look deeply to the range of country, population and amount of agriculture land, Table1. Table 1 Main metrics of selected countries Ukraine 603 628 km² 42 418 235 42,4 mln. ha
Range of county Population Amount of Agriculture land
Slovakian Republic 49 035 km² 5 457 873 1,9 mln.ha
So we can see, that all of mentioned points are totally different, that why it will be hard to clearly compare amount of sold machines and will be even harder to forecast the next selling seasons in these countries. First of all we need to say that, the "customer mentality" plays an important role in characterizing the sales process of machines in individual countries. The common feature of Slovakia and Ukraine is the conservatism of customers, which the seller must gradually acquire. On the contrary, if he has their trust, likely seller will have a long term customer. 800
728
700 600 500 400 300
222
200 100 0 Ukraine
Slovakia
Fig. 1 Amount of sold telescopic handlers in Ukraine and Slovakia in 2019 As you can see the results are really different. Mostly it’s because of mentioned metrics of selected countries and also because farms in Ukraine are larger and have more "land in one hand", so the number of machines needed to fulfill work plans is higher. Enterprises in Slovakia are smaller (a mediumsized enterprise has about 1500 ha), but they still maintain a high quality of products, so they need quality machines on their cooperatives. Producers of - 65 -
Agricultural, Forest and Transport Machinery and Technologies (ISSN: 2367– 5888) Volume VII – Issue 1, 2020
telescopic handlers as Manitou, JCB, Merlo, Bobcat etc. meets all the requirements of presale, sale and aftersales, so that each customer gets the most suitable machine for their working conditions. The customer is different and conditions of work are different too. Sometimes we need telescopic handler just for 1 type of work, but mostly it does what it can and a bit more, that’s why each customer need to pay attention and go deeply to characteristics of each producer and type of machine. Now let’s take a look show how handlers are perceptually divided in selected countries.
Fig. 2 Percentage contrast of different producers new machines, sold in Slovakia in 2019 As we can see Slovakian market are mostly choosing Manitou machines, customers are sure that Manitou are one of the best producer of telescopic handler and based on practical refers are one of the best manipulator for working in such climate conditions as Slovakian Republic has. JCB and Merlo are also high in the list, the quality and power, which these manipulators has let them be still top 3.
Fig. 3 Percentage contrast of different producers new machines, sold in Ukraine in 2019
- 66 -
Agricultural, Forest and Transport Machinery and Technologies (ISSN: 2367– 5888) Volume VII – Issue 1, 2020
That’s the situation in Ukraine. The main player on Ukrainian market is JCB 35,9%. JCB has range dealers network. It invests in marketing a lot, exhibition and promotion of the machines. Second place has Manitou with 28,4%, that means, that Manitou is still fighting for the 1 place quality and long life period are one of big advantages of Manitou machines. The third one is Dieci last years they are fully hard pushing the market with their machines. Italian quality and good price are able to fight for the market percent with such a big player as JCB and Manitou.
Fig. 4 Exhibition Grain Technology 2019, Kyiv To understand the market you should look not only to the new machinery but also used one, now I want to show you a table with all mentioned telescopic handlers (new and used one) of 2019 year.
Fig. 5 Amount of new and used telescopic handlers which were registered in Ukraine From the customers references we can understand, that machine has long life period, but need to be serviced on time and only with original part, which are in comparing with Manitou costs 1020% more, what sometimes play a big role for customer. Manitou is on the second placeManitou has bring the first machine in Ukraine only in 2007, what’s make Manitou a really strong player. And Dieci they use the same tactic as at new machines, they have lover prices with good quality, cheaper spare parts and service. - 67 -
Agricultural, Forest and Transport Machinery and Technologies (ISSN: 2367– 5888) Volume VII – Issue 1, 2020
CONCLUSION Based on the processed information, literature and cooperation with agricultural enterprises, we have made a survey of the Slovak and Ukrainian market of telescopic loaders by processing technical parameters and practical performances of loaders. The described machines were selected based on the farmer’s experiences and dealers recommendation in Ukraine and Slovakia. The sales situation of telescopic loaders in the two countries was compared. The situation analyzed not only with new but also used loaders. We have shown the representatives and compared the number of sold pieces of each of them. We discussed the reasons for the low level of sales of agents and described the situation in the markets of Ukraine and Slovakia. We take the issue of a representative's recommendation seriously, so we determine indicators as: service network, procurement and availability of spare parts. An important indicator is the environment where the telescopic loader will work and the industry of its use. When choosing a loader, the dealer would need to be familiar with this information in order to be able to select the most suitable machine for the conditions specified by the customer and to correctly recommend the required loader. Based on the processed analysis, we can recommend Manitou and JCB to customers in Slovakia, which are high quality and have large service support network. In Ukraine, we recommend Manitou, JCB and Dieci due to high working period, quality and a good price. Also we need to remember, that one of the best recommendation, its recommendation based on the own experience, so stay online on the market and communicate with farmers, that the best way to be informed as a first. REFERENCES [1] Abraham, R., Majdan, R., Hujo, Ľ., (2017) Manipulačná technika. Nitra: Slovenská poľnohospodárska univerzita. ISBN: 9788055217567. [2] Agromax Group. (2020) Agri products [online] [cit. 20201001] Availible on: agromaxgroup.com.ua [3] Agropravda. (2019) Manitou NewAg [online] [cit. 20201003] Availible on: http://agropravda.com/news/specialtechnik/11240manitounovogopokolenijaoficialnovysh elnarynokukrainy [4] Bauer, F., et al. (2013) Traktory a jejich využitie. Praha. Ceska Zemedelska Univerzita. ISBN: 9788086726526. [5] DIECI. (2020) Agri loaders DIECI.[online] [cit. 20201012] Availible on: http://dieci.com.ua/ [6] Novák, M., (2019) Využití teleskopického manipulátoru v komunální sféře [online]. Brno, 2019 [cit. 20201017]. Dostupné z: <https://theses.cz/id/cbxcl7/>. [7] Piskaninova, V., (2013) Analýza systému marketingových nástrojov využívaných v obchodnej činnosti vybraného podniku. Master Thesis. Slovenska poľnohospodárska univerzita. 43s. [8] Píša, O., (2019) Využití teleskopického manipulátoru [online]. Brno, 2019 [cit. 20201017]. Dostupné z: <https://theses.cz/id/vl99uj/>. [9] Přibyl, M., (2017) Srovnání výkonnosti teleskopických nakladačů při rozdílných pracovních operacích [online]. České Budějovice, 2017 [cit. 20201017]. Dostupné z: <https://theses.cz/id/90tj9r/>. [10] Prístavka, M., Beloev, H., Kročko, V., (2014) Quality Control in Production Processes. : scientific monograph. 1. vyd. Ruse : Angel Kanchev University of Ruse, ISBN 978-6197071-62-7.
- 68 -
Agricultural, Forest and Transport Machinery and Technologies (ISSN: 2367– 5888) Volume VII – Issue 1, 2020
[11] Sailer, J., at al. (2008) Influence of using time of selected agricultural machines and tractors on residual market price, repair costs, and annual utilisation. Research in Agricultural Engineering, ISSN 12129151. [12] Slisko, D., (2016) Analýza konkurencieschopnosti vybranej spoločnosti. Bakalárska práca. Univerzita Tomase Bati ve Zline. 23 s. [13] Stankevych, M., (2018) Súčasný stav vo výrobe malých smykom riadených nakladačov na Slovensku. Bachelor Thesis. Nitra. Slovenska poľnohospodárska univerzita. 16 s. [14] Ukrstat (2020) Agriculture situation 19912020 [online] [cit. 20200321] Availible on: http://www.ukrstat.gov.ua/ [15] Vaněk, A., (2003) Moderní strojní technika a technológie zemných prací. Praha: Akadémia, 2003, 1.vydanie, 563 s., ISBN 8020010459. CONTACTS Maksym Stankevych, Department of Machines and Production Biosystems, Faculty of Engineering, Slovak University of Agriculture in Nitra, Tr. A. Hlinku 2, 949 76 Nitra, Slovakia, xstankevych@gmail.com Pavol Findura, Department of Machines and Production Biosystems, Faculty of Engineering, Slovak University of Agriculture in Nitra, Tr. A. Hlinku 2, 949 76 Nitra, Slovakia, pavol.findura@uniag.sk Miroslav Prístavka, Department of Quality and Engineering technologies, Faculty of Engineering, Slovak University of Agriculture in Nitra, Tr. A. Hlinku 2, 949 76 Nitra, Slovakia, miroslav.pristavka@uniag.sk Volodymyr Kyurchev, Dmytro Motornyi Tavria State Agrotechnological University, 18 B.Khmelnytsky Ave, Melitopol, Zaporizhzhia obl., 72312, Ukraine Volodymyr Nadykto, Dmytro Motornyi Tavria State Agrotechnological University, 18 B.Khmelnytsky Ave, Melitopol, Zaporizhzhia obl., 72312, Ukraine Oľga Urbanovičová, Department of Machines and Production Biosystems, Faculty of Engineering, Slovak University of Agriculture in Nitra, Tr. A. Hlinku 2, 949 76 Nitra, Slovakia, olga.urbanovicova@uniag.sk
- 69 -
Agricultural, Forest and Transport Machinery and Technologies (ISSN: 2367– 5888) Volume VII – Issue 1, 2020
Influence of Cutting Speed to Vibrations and Roughness of Machined Surface during Turning Martin Barath, Jan Zitnansky, Hristo Beloev Abstract: This paper deals with influence of cutting parameters to vibration during turning of steel on metal lathe. We observed the effect of changing cutting speed to machine vibration and the quality of the machined surface. Cutting parameters was changed in five steps. We used piezoelectric accelerometer MMF KS78.100 to sense vibrations, data acquisition unit Adlink USB 2405 was used for recording and processing signals from accelerometers. Recorded signals were transformed by Fast Fourier Transform from time domain to frequency domain. Software Visual Signal DAQ Express was used to perform this transformation. Keywords: vibration, turning, cutting parameters, roughness, acceleration
INTRODUCTION The theory of vibrations and chatter has been known for long time. However, new transducers and their improvements have occurred, as well as new possibilities in data acquisition and computing equipment, which make methodologies and approaches to avoid vibrations more reliable and suitable for industrial application (Kuljanić et al., 2008). Vibrations have negative effect to whole process of chip machining. Badiola et al. (2019) determine these problems: Chatter vibration is a common problem in almost all cutting operations which limits productivity of machining processes. Chatter vibrations cause poor workpiece surface finishing, premature tool wear, and breakage of cutting tools. Furthermore, due to this phenomenon, the machine tool life, reliability, and safety of the machining operation are affected negatively. Chatter vibrations have been researched for more than a century and it is still a major obstacle in achieving automation for most of the machining processes. MATERIALS AND METHODS For the purposes of our experiments we used measuring device which consist from accelerometers MMF KS78.100 connected to signal acquisition module Adlink USB 2405 and PC with software Visual Signal DAQ Express. Block diagram of this device is shown in Fig.1.
Fig. 1 Block diagram of measuring device Adlink USB 2405 The USB-2405 shown in Fig.2 is a 24-bit high-performance dynamic signal acquisition USB module equipped with 4 analog input channels providing simultaneous-sampling at up to 128 kS/s per channel. The USB-2405 also features software selectable AC or DC coupling input configuration and built-in high precision 2 mA excitation current to measure integrated electronic piezoelectric (IEPE) sensors such as accelerometers and microphones. The USB2405 is USB bus powered and equipped with BNC connectors and removable spring terminals for easy device connectivity (Adlink, 2020).
- 70 -
Agricultural, Forest and Transport Machinery and Technologies (ISSN: 2367– 5888) Volume VII – Issue 1, 2020
Fig. 2 Adlink USB 2405 signal acquisition module (Adlink 2020) Accelerometer Piezoelectric accelerometers use piezoelectric material in their design to create a charge proportional to the mechanical stresses caused by acceleration. Piezo crystal charge is measured either directly by external electronics with a high input impedance value, or more often the internal sensor electronics converting the charge to a low impedance voltage output. The disadvantage of these accelerometers is that they cannot be used to measure frequencies below 0.1 Hz. One side of the piezoelectric material is attached to a solid sensor base. The part named as seismic mass is attached to the piezo-sensor. If the accelerometer is exposed to acceleration (vibration, shock), the generated force F, which acts on the piezoelectric element, will generate a charge, respectively voltage at the sensor output (Hudák, 2009). We used two accelerometers MMF Ks78.100 shown in Fig.3.
Fig. 3 Accelerometer MMF KS 78.100 Visual Signal DAQ Express software Visual Signal is a signal processing software developed to provide time-frequency analysis solutions in an intuitive way. The design eliminates the complicated ways of writing a program to produce visual process control components, and instead provides a variety of visual process control components to be utilized. This gives users the ability to create a presentation of their own ideas for analysis without the limitation of needing to be able to code it (http://www.ancad.com/VisualSignal/overview.html). Mitutoyo Surftest 301 Mitutoyo Surftest 301 is a portable measuring instrument that allows you easily and accurately measure surface roughness. It performs roughness analyses conform to various international standards (EN ISO, VDA, ANSI, JIS) and customized settings. Display range: Ra, Rq: 0.01 µm - 100 µm; Ry, Rz, Rt, Rv, R3z, Rk, Rpk, Rvk, R, Rp, Rx, AR, W, Wx, Wte: 0.02 µm - 350 µm; S, Sm: 2 µm - 4000 µm; HSC, Pc: 2.5/cm - 5000/cm; Ppi: 6.35 12700/inch; dc: - 350 µm - + 350 µm; Lo: 0.1 mm - 99999 mm; mr, Mr 1, Mr 2: 0 - 100 % ;A1, A2: 0 – 15000; (https://shop.mitutoyo.eu/web/mitutoyo/en/mitutoyo/$catalogue/mitutoyoData/PR/178952-4D/datasheet.xhtml;jsessionid=C93A6E5D8F471B473B5680F42FF833CE). - 71 -
Agricultural, Forest and Transport Machinery and Technologies (ISSN: 2367– 5888) Volume VII – Issue 1, 2020
Metal lathe TOS SUI 40-1 Vibration measurements were performed on metal lathe presented on Fig. 4. Technical parameters of the machine: ̶ Maximum turning diameter above support - 200 mm ̶ Maximum turning diameter above the bed - 400 mm ̶ Spindle passage - 56 mm ̶ The maximum length of turning with chuck - 1000 mm
Fig. 4 Metal lathe TOS SUI 40 RESULTS As a specimen of the material for turning we used a shaft made from STN 11 600 steel with a diameter of 39 mm. During measurements we changed only cutting speed, keeping other cutting parameters unchanged. We changed cutting speed in five steps. Cutting parameters are shown in Table 1. Table 1 Cutting parameters Step number
Cutting speed [m.min-1]
RPM [min-1]
Depth of cut [mm]
Feed [mm.rev-1]
1 2 3 4 5
13.72 27.44 55.13 110.26 137.22
112 224 450 900 1120
0.5 0.5 0.5 0.5 0.5
0.09 0.09 0.09 0.09 0.09
In Fig. 5 is shown an example of vibrations during turning with cutting speed 13.72 m.min-1 and in Fig. 6 with cutting speed 137.22 m.min-1 On Y-axis is acceleration of vibration an on X-axis is frequency of vibration. We measured vibrations on three parts of machine, on cutting tool upper graph, on tailstock middle graph and on spindle bottom graph in Fig. 5.
- 72 -
Agricultural, Forest and Transport Machinery and Technologies (ISSN: 2367– 5888) Volume VII – Issue 1, 2020
Fig. 5 Vibrations during turning with cutting speed 13.71 m.min-1
Fig. 6 Vibrations during turning with cutting speed 137.22 m.min-1
- 73 -
Agricultural, Forest and Transport Machinery and Technologies (ISSN: 2367– 5888) Volume VII – Issue 1, 2020
Roughness of machined surfaces, created during turning with different cutting speed is shown in Table 2. Table 2 Roughness of machined surfaces Cutting speed [m.min-1]
Roughness Ra [µm]
13,72 27,44 55,13 110,26 137,22
4,35 4,07 3,53 1,53 1,48
CONCLUSION In this paper we researched the influence of cutting speed on vibration and quality of machined surface during turning on metal lathe. We changed the cutting speed in five levels. From the graphs of measured vibrations and the measured roughness of the machined surface, it can be concluded that changing the cutting speed had significant effect to roughness of machined surface and vibrations. From Table 2 we can clearly see that increase of cutting speed from 13.72 m.min-1 to 137.22 m.min-1 brought almost 3 time better quality of machined surface. On the other hand increasing of cutting speed brought increasing of level of vibrations. The most significant was increase of vibrations on cutting tool. It can be caused by the fact that cutting tool has many times smaller weight than spindle or tailstock. Also it can be caused by type of cutting tool clamping. For the future, it would be useful to research the influence of cutting speed in a wider range and in more levels. REFERENCES [1] Adlink. 2020. USB 2405 datasheet [online]. 2020 [cit. 25 March 2020]. Available from: <https://www.adlinktech.com/Products/Data_Acquisition/USBDAQ/USB2405?lang=en> [2] Badiola, X., Iturrospe, A., Abete J., (2019) State–space analysis of mode-coupling workpiece chatter. In The International Journal of Advanced Manufacturing Technology [online], vol 103, pp 2773 – 2781 [cit. 2019-03-17]. ISSN: 0268-3768. Available from: <https://doi.org/10.1007/s00170-019-03737-8>. [3] Bejaxhin, A., Paulraj, G., (2019) Experimental investigation of vibration intensities of CNC machining centre by microphone signals with the effect of TiN/epoxy coated tool holder. In J Mech Sci Technol [online], vol 33, pp. 1321–1331 [cit. 25 March 2020]. ISSN 1976-3824. Available from: <https://doi.org/10.1007/s12206-018-1232-3> [4] Kangalov, P., Beleva, D., (2016). A Research about Roughness of Sliding Friction Surfaces of Couples Working in a Field with Modificators of Friction. Proceedings of University of Ruse, 2016, vol. 55, book 1.1., pp. 84-89, ISSN:1311-3321 [5] Kuljanić, E., Totis, G., Sortino, M., (2008) AMST'08 Advanced Manufacturing Systems and Technology. Udine: International Centre for Mechanical Sciences. 666 s. ISBN 97888-85137-22-9 [6] Nikolov, M., Kangalov, P., (2014). Research Methods for Tribological Properties of Restorative and Preventive Coatings in Different Lubricating Media at Sliding Friction. (2014) Acta technologica agriculturae, No 3, pp. 70...74, ISSN 1335-2555. - 74 -
Agricultural, Forest and Transport Machinery and Technologies (ISSN: 2367– 5888) Volume VII – Issue 1, 2020
[7] Nikolov, M., Kangalov, P., (2019) Surface Roughness of Reconditioned Details Having Different Materials of Frictional Pairs // Proceedings – Agricultural Machinery, Year III, Vol. 1/5, June 2019, pp. 26 – 28, ISSN: 2535-0269 (Print), ISSN: 2535-0277 (Online) [8] Vasilko, K., (2009) Teória a prax trieskového obrábania. Prešov: Fakulta výrobných technológií Technickej univerzity v Košiciach, so sídlom v Prešove. 532 s. ISBN 978-80553-0152-5 CONTACTS Martin Baráth, Department of Quality and Engineering technologies, Faculty of Engineering, Slovak University of Agriculture in Nitra, Tr. A. Hlinku 2, 949 76 Nitra, Slovakia, xbarath@is.uniag.sk Ján Žitňanský, Department of Quality and Engineering technologies, Faculty of Engineering, Slovak University of Agriculture in Nitra, Tr. A. Hlinku 2, 949 76 Nitra, Slovakia, jan.zitnansky@uniag.sk Hristo Beloev, Department of Agricultural Machinery, Agrarian and Industrial Faculty, University of Ruse “Angel Kanchev”, 8 Studentska str., 7017 Ruse, Bulgaria, e-mail: hbeloev@uni-ruse.bg
- 75 -
Agricultural, Forest and Transport Machinery and Technologies (ISSN: 2367– 5888) Volume VII – Issue 1, 2020
Resistance Assessment of Materials to Abrasive Wear Martin Kotus, Jan Lilko, Plamen Kangalov, Juraj Balazi Abstract: This paper deals with the evaluation of the resistance of weld deposit materials to abrasive wear. Abrasive wear is one of the degradation processes of metallic materials. Intensive manifestation of abrasive wear is on the tools of agricultural machinery working in soil conditions (e.g. plow tine, etc.). We determined the relative resistance to wear on the basis of a tribological test defined by the standard ČSN 01 5084. For selected additional materials, we state the suitability of their use in conditions where abrasive wear prevails. By creating weld deposit on the working parts of the machines, it is possible to reduce wear and thus extend the technical life of the machines. Keywords: relative resistance, abrasive wear, additive material, weld deposit
INTRODUCTION Agricultural machinery in operation is exposed to the various types of wear. Specific wear conditions cause imbalances in the service life of individual machine parts. This mainly applies to tools, which are exposed not only to the influence of the soil itself (type, grain size), but also to the chemical aggressiveness (pH, humidity). The wear mechanism is a complex phenomenon due to the connection with factors whose intensity of interaction depends on the working conditions in the environment in which the mechanical parts are used on the working parameters of the device and on the material properties of the contacting surfaces. (Zdravecká, 2011). The basic precondition for the prevention of degradation processes caused by abrasion is the appropriate choice of technical material intended for conditions with increased wear. The internal microstructure of the material is also important, which should withstand the dynamic influences and the action of external forces on the tillage tools. With increased dynamic stress, damage to the entire tool can occur due to the low toughness of the material. For this reason, it is possible to apply the abrasion-resistant layer only in the area of the greatest abrasive wear. (Novák et al., 2015; Votava et al., 2019). By creating the abrasion-resistant layer on the functional part of the tool, it is possible to reduce wear and thus extend the technical life of the agricultural machine. Use of weld deposit is the most affordable and economically advantageous way to reduce wear on the functional surfaces of the work tool. There are currently a large number of hardfacing materials with different mechanical properties on the market. It is possible to determine which additive material resists abrasive wear during the laboratory or the operational tests. The operational tests correspond to the actual operation of the agricultural machine in specific soil conditions. The laboratory tests can simulate operating conditions or define prescribed parameters that characterize certain material properties. The aim of the paper is to define the resistance of the selected additional materials used in welding to conditions of intensive abrasive wear. We evaluate the resistance of additional materials on the basis of measuring the hardness of welds and determining the relative resistance to the abrasive wear according to the relevant standards. MATERIAL AND METHODS We have selected five additional materials for laboratory testing, which are commonly available on our market. Selection of the additional materials was based on the achievable hardness of the created weld deposits stated by the manufacturer. We also took into account the chemical composition of the additional materials, especially the effect of carbon and chromium on the resulting structure of the weld deposit. Many authors (Bujna et al., 2013; Kalincová et al., 2016; Kováč – Mikuš et al., 2014) have concluded in their work that the - 76 -
Agricultural, Forest and Transport Machinery and Technologies (ISSN: 2367– 5888) Volume VII – Issue 1, 2020
increased hardness of weld deposit has an effect on the increased resistance of materials to the abrasive wear. The hardness of HRC and the chemical composition of the materials according to the manufacturer are given in Table 1. Electrode E-B 518 is suitable for weld deposit functional surfaces resistant to wear while simultaneous impact stress. The Fluxofil 59 electrode is a tubular wire with a basic filling characterized by higher toughness and resistance to severe shocks and impacts. The rutile-basic electrode E-660 is suitable for weld deposit with medium resistance to compressive stress and metal-to-metal friction wear. The basic hardfacing weld deposit electrode Hard Fro 600 is suitable for functional surfaces resistant to the mineral abrasion and wear. The rutile-basic electrode HB 60 is resistant to medium wear due to the abrasion, impact and pressure. Table 1 Indicative chemical composition of electrodes and hardness HRC Material / Chemical element, %
E-B 518 Fluxofil 59 E-660 Hard Fro 600 HB 60
C
Cr
Si
Mn
Ni
Mo
V
W
3.5 0.7 1.0 0.5 1.0
29.0 7.0 4.5 7.5 4.5
< 1.5 < 0.7 0.5 0.75 0.5
< 1.5 < 1.1 1.5 0.45 1.3
– <1 – – –
– < 2.5 – 0.45 –
– – – 0.7 –
– <2 – – –
Hardness HRC 54÷58 53÷59 55÷60 55÷57 55÷60
HRC hardness measurement was performed in accordance with STN EN ISO 6508 Rockwell hardness test with hardness scale C (diamond cone, loading force 1471 N). The suitability of the use of the mentioned electrodes in the conditions of the abrasive wear is determined on the basis of the standard ČSN 01 5084 - Determination of the resistance of metallic materials against abrasive wear on a device with an abrasive cloth. The given standard for the calculation of relative resistance defines as a standard material - steel class 12 014.20. The conditions for the test itself were as follows: ̶ friction speed - max. 0.5 m.s-1 ̶ transverse feed per revolution - 3 mm ̶ diameter of the friction path - 480 mm ̶ friction path length - 50 m ̶ pressing pressure level - 0.32 MPa ̶ abrasive cloth - Globus 100 ̶ sample length - 50 mm of diameter 10 mm The evaluation criterion for determining the resistance under laboratory conditions is the "relative resistance to the abrasive wear (ψabr.)", which is calculated according to the formula: W ψ abr . = hE Wh (1) Where: WhE – average weight loss of standard test specimens, g Wh – average weight loss of test specimens of test material, g The creation of weld deposits and the tests themselves were performed in the laboratory conditions of the Department of Quality and Engineering Technologies at Faculty of Engineering at Slovak University of Agriculture in Nitra, Slovakia. RESULTS AND DISCUSSION The determined average values of weight loss, relative wear resistance and hardness of HRC are given in Table 2. A graphical representation of the detected values is shown in Figures 1 to 3. - 77 -
Agricultural, Forest and Transport Machinery and Technologies (ISSN: 2367– 5888) Volume VII – Issue 1, 2020
Table 2 Measured and calculated average values when testing samples Electrode / weld deposit E-B 518 Fluxofil 59 E-660 Hard Fro 600 HB 60 Etalon 12014.20
Weight loss, g 1st layer 2nd layer 0.1466 0.1226 0.1129 0.1035 0.1389 0.1269 0.1829 0.1402 0.1805 0.1714 0.3655 0.3566
Wear resistance ψabr. 1st layer 2nd layer 2.49 2.91 3.24 3.45 2.63 2.81 2.00 2.54 2.02 2.08 1 1
Hardness HRC 1st layer 2nd layer 53.4 56.1 55.4 57.3 55.3 56.4 54.0 56.5 56.9 59.1 20.4 20.7
Based on the obtained data, we state that the highest relative resistance and thus the smallest weight loss were achieved by the Fluxofil 59 deposit in both methods of weld deposit formation. The lowest value of relative resistance was achieved by the Hard Fro 600 material with a single-layer weld deposit. HB 60 achieved the lowest relative resistance in the twolayer weld deposit. It should be noted that Fluxofil 59 and Hard Fro 600 had comparable carbon and chromium contents, but different molybdenum contents, with a certain nickel and vanadium content. For all tested additive materials, we recorded lower values of weight loss in the twolayer weld deposit. This is probably due to the different mixing of the filler material with the base material during welding deposit. It can be assumed that in the case of a two-layer weld deposit, the proportion of the additive material is higher than in the base material. By comparing the dependence between the weight loss and the hardness of the weld deposits, a different order of the additional materials can be seen with respect to the abrasion wear resistance. This is due to the percentage of individual chemical elements in the weld deposit metal structure. The influence of individual elements on the resulting microstructure of the created weld deposits is the subject of further research.
Fig. 1 Weight loss of samples in 1- and 2-layer welding deposit
- 78 -
Agricultural, Forest and Transport Machinery and Technologies (ISSN: 2367– 5888) Volume VII – Issue 1, 2020
Fig. 2 Hardness HRC welding deposit The value of relative resistance to abrasive wear has a comparative significance not only between the additional materials tested by us, but also with the results of other authors. Votava et al. (2020) achieved a relative resistance ψabr.=1.5÷2.2 for electrodes with a basic coating. For electrodes with rutile coating, they achieved a relative resistance ψabr.=3.6. Kováč et al. (2014) achieved values of relative resistance in the range of ψabr.=1.5÷1.7 when saturating the surface with boron. Muller et al. (2011) achieved relative resistance ψabr.=1.9÷3.1 when monitoring martensitic deposits. And when monitoring ledeburitic weld deposits, it reached a relative resistance ψabr.=2.7÷3.1. He evaluated the relative resistance of stellites as well, while reaching the relative resistance ψabr.=1.9÷2.7.
Fig. 3 Relative wear resistance ψabr.
- 79 -
Agricultural, Forest and Transport Machinery and Technologies (ISSN: 2367– 5888) Volume VII – Issue 1, 2020
The laboratory tests against the abrasive wear have a significant comparative character between individual additional materials. The main advantage is the constant conditions during the entire test. The test can be one of the primary indicators of the suitability of a given material for use in the specific operating conditions, e.g. in the case of the abrasive wear. (Votava et al., 2020) Based on the testing of the samples, it is generally possible to state that with increasing hardness of the weld (from 1-layer to 2-layer weld) we achieved a reduction of wear in all weld deposits. Reducing weight loss in operation will result in greater resistance to the abrasive wear and thus longer service life of the tillage implements. CONCLUSION Agricultural machinery and their parts are exposed to the various degradation processes during operation. Each production organization is looking for different ways to reduce unwanted repair costs and extend the technical life of work tools. One possibility is to create functional layers on the wear-resistant surface tools. There are several ways to form the abrasion resistant layers on various tools of agricultural machinery, e.g. Kováč et al. (2014), Čičo et al. (2019), Kalincová et al. (2016). In this paper, we dealt with the assessment of the resistance of the additional materials to abrasive wear. We assessed the suitability of the use of additional materials on the basis of hardness and determination of the relative resistance to the use of individual weld deposits. The results obtained by the weld deposits tested by us are similar to those achieved by other authors in their scientific works. Therefore, we consider the given additional materials to be suitable for use in the formation of wear-resistant layers. By creating the abrasion-resistant layers, you can significantly extend the technical service life of the tillage parts of agricultural machinery. In the future, it is necessary to continue in this area of the research and constantly look for new ways to reduce wear and thus reduce operating costs. REFERENCES [1] Bujna, M., Prístavka, M., Kaplík, P., (2013). Impact of insufficient cleaning on the quality of molybdenum layer applied by thermal spraying. In Materials, technologies and quality assurance. (2013), pp. 35-40. ISBN 978-30-382-6720-1. [2] Čičo, P., Drlička, R., Šoška, R., Róna, Z., (2019). Soil tests of renovated ploughshare points. In TAE 2019 - Proceeding of 7th International Conference on Trends in Agricultural Engineering 2019, 2019, pp. 99-102. ISBN 978-80-213-2953-9. [3] Kalincová, D., Ťavodová, M., Hnilicová, M., Veverková, D., (2016). Machinery for forest cultivation – Increase of resistance to abrasive wear of the tool. In MM Science Journal, November 2016, pp. 1269-1272. ISSN 1805-0476. [4] Kotus, M., (2010). Stanovenie odolnosti prídavných materiálov pri vytvorení jednovrstvových návarov. In Technická diagnostika strojů a výrobních zařízení „DIAGO 2010“. Ostrava : Vysoká škola baňská – Technická univerzita, 2010. pp.196-201. ISSN 1210-311X. [5] Kováč, I., Mikuš, R., Žarnovský, J., Drlička, R., Žitňanský, J., Výrostková, A., (2014). Creation of wear resistant boride layers on selected steel grades in electric arc remelting process. In Metallic materials, 2014, 52(6), pp. 387-394. ISSN 1338-4252. [6] Kováč, I., Vanko, N., Vysočanská, M., (2014).Verification of the working life of a ploughshare renovated by surfacing and remelting in the operation. In Research in Agricultural Engineering, 2014, 60, pp.98-103. ISSN 1805-9376.
- 80 -
Agricultural, Forest and Transport Machinery and Technologies (ISSN: 2367– 5888) Volume VII – Issue 1, 2020
[7] Müller, M., Valášek, P., Novák, P., Hrabě, P., Paško, J., (2011). Overlays and composites application in technology of sugar beet cultivation and harvest. In LCaŘ 127, num. 9–10, 2011, pp.304-307. ISSN 1210-3306. [8] Novák, P.; Müller, M.; Hrabě, P., (2015). Application of overlaying material on surface of ploughshare for increasing its service life and abrasive wear resistence. In Agronomy Research, 13, 2015 (1), pp. 158-166. ISSN 1406-894X. [9] Prístavka, M., Dostál, P., Beloev, H., Bujna, M., (2014) Manufacturing Machines in Production Process//. Agricultural, Forest and Transport Machinery and Technologies, Vol.1, ISSN 2367-5888, 2014, pp. 41-46. [10] Votava, J., Fajman, M., Polcar, A., Kumbár, V., (2019). Using hard-metal deposits in sugar beet harvesters. In LCaŘ, 2019, 135(9-10), pp. 297-302. ISSN 1210-3306. [11] Votava, J., Šmak, R., Polcar, A., Kumbár, V., (2020). Using hard metal to eliminate abrasive wear of passive parts of sugar beet harvesters. In LCaŘ, 2020, 136(9-10), pp. 313-317. ISSN 1210-3306. [12] Zdravecká, E., 2011. Možnosti riešenia abrazívneho opotrebenia v technickej praxi. In TriboTechnika, Roč. IV, č.1, 2011. ISSN 1338-0524. CONTACT Martin Kotus, Department of Quality and Engineering Technologies, Faculty of Engineering, Slovak University of Agriculture in Nitra, Tr. A. Hlinku 2, 94976 Nitra, Slovak Republic, e-mail: martin.kotus@uniag.sk Ján Lilko, Department of Quality and Engineering Technologies, Faculty of Engineering, Slovak University of Agriculture in Nitra, Tr. A. Hlinku 2, 94976 Nitra, Slovak Republic, e-mail: xlilko@uniag.sk Plamen Kangalov, Department of Repair and Reliability, Agrarian and Industrial Faculty, University of Ruse, 8, Studentska Str., 7017 Ruse, Bulgaria, e-mail: kangalov@uni-ruse.bg Juraj Baláži, Department of Quality and Engineering Technologies, Faculty of Engineering, Slovak University of Agriculture in Nitra, Tr. A. Hlinku 2, 94976 Nitra, Slovak Republic, e-mail: juraj.balazi@uniag.sk
- 81 -