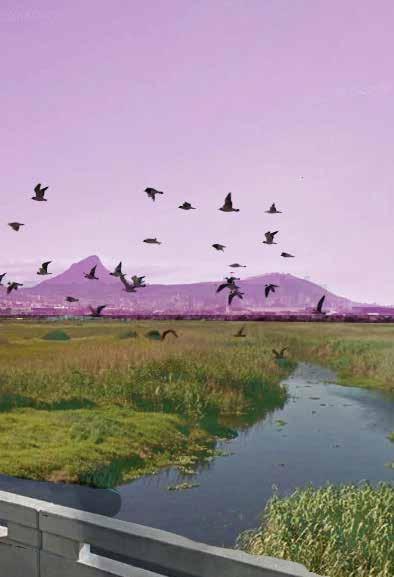
Salt River estuary restoration
Restoration methods for urban rivers on the example of the Salt River in Cape Town, South Africa
Master thesis by Kathrin Krause in Water and Environment, Department of Civil engineering, at the Bauhaus University, Weimar, Germany, 2020
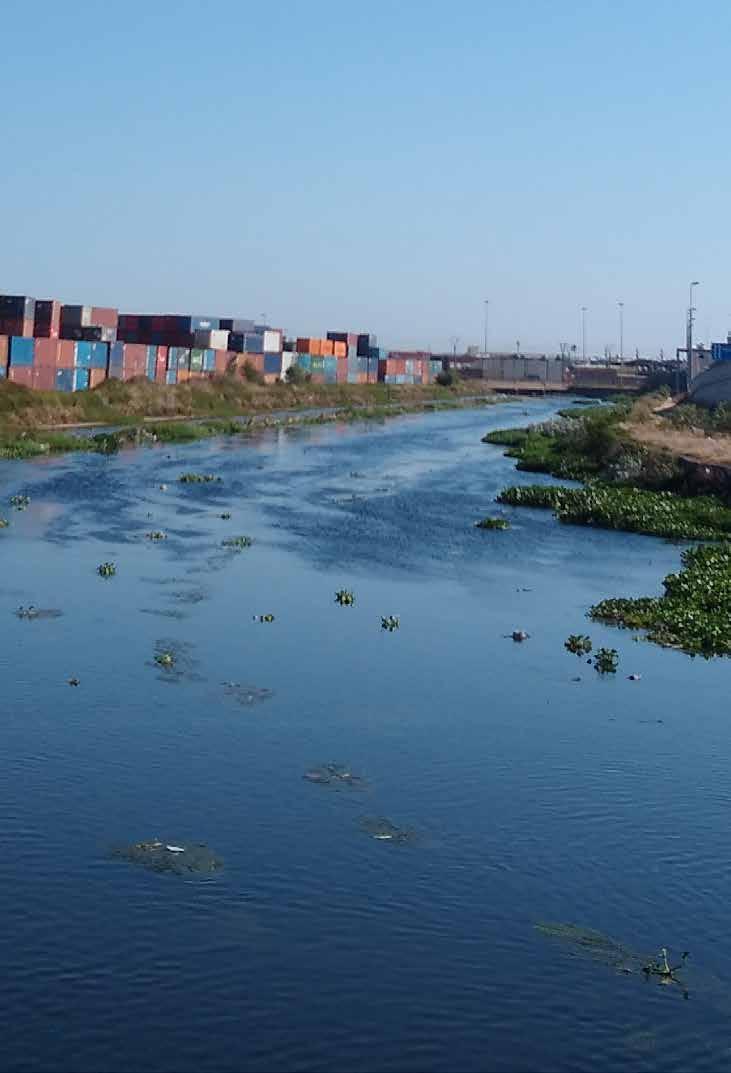
5.6 The Salt River Canal today
The Salt River canal is best described by dividing it into 4 different reaches, see diagram across.
5.6.1 Reach 1
Reach 1 stretches from the mouth to bridge number 5, is 1500m long and has 9 bridges crossing. It is a uniform concrete canal of 46m width.
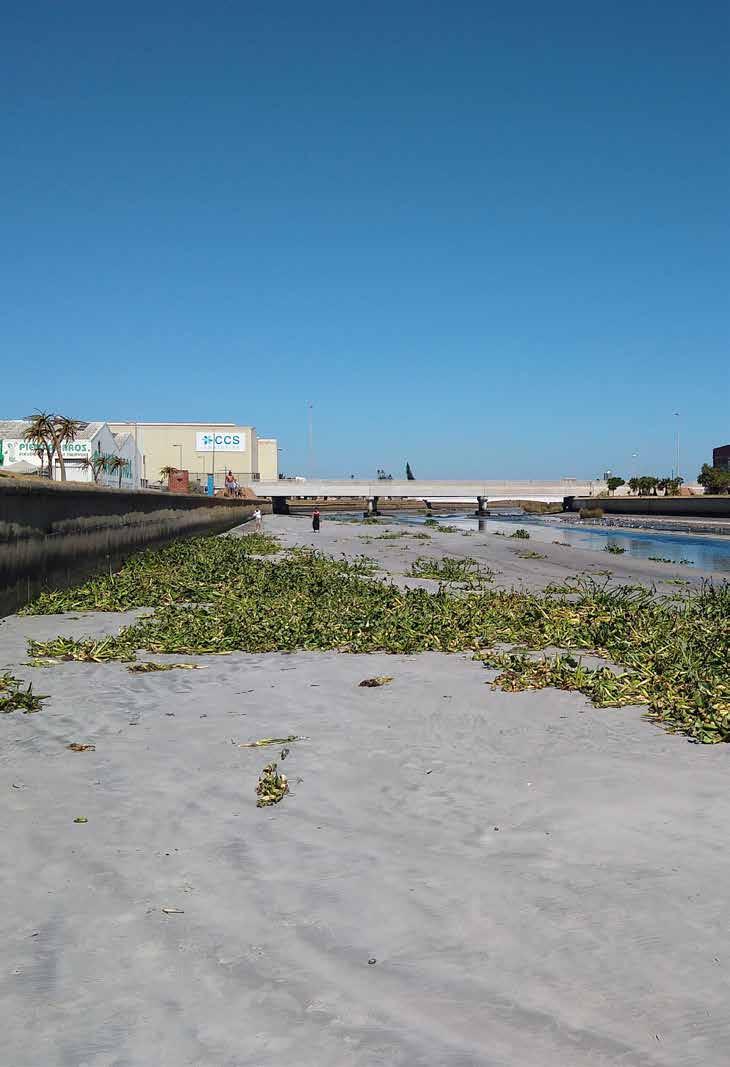
In this reach the tidal influence on the water level can be observed on the flow direction and the flow height. While in summer the canal is almost empty, reduced to a small channel during low tide, water level rises significantly during high tide.
The concrete is formed into a trapeze shape with a low flow channel in the centre. Both embankments are at almost 90 degree, +/- 3m high.
The first 200 meter of the channel are covered in sediment deposits from the tides mostly on the northern side of the channel and form a small delta. That leaves a small outlet channel for the river at low tide on the southern side of the canal along the armoured seawall.
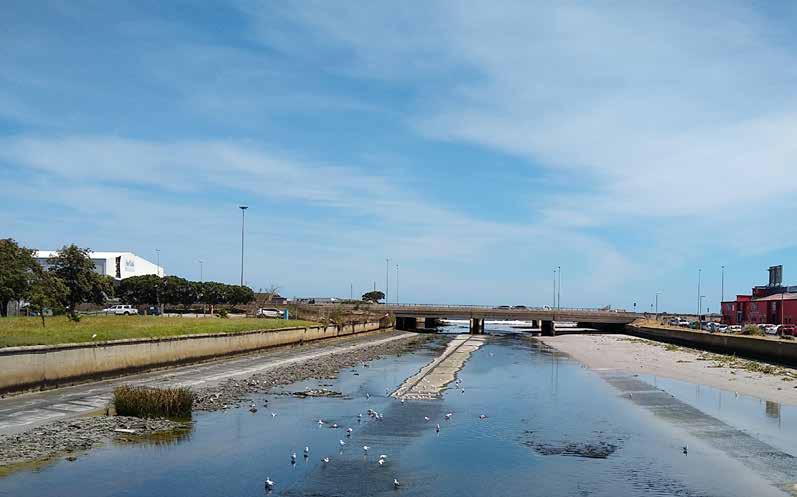
The nature of the canal doesn’t allow for riparian vegetation. An exemption are the reeds, that were introduced into the channel between bridge 2 and 7 from an unknown source at an unknown time. Alien vegetation in the reach includes Water hyacinth floating and Parrots feather submerged at the bottom of the river bed. The channel is polluted with rubbish and rubble, probably
transported here from upstream or directly dumped. The banks on either side are boarded by open land in different width, that could allow for a widening or connected wetlands.
The surrounding land use is mainly light industrial with a strong connection to the harbour.
In summer the canal is used at low tide to enter the hidden beach by dog walkers, fisher men and beach goers.
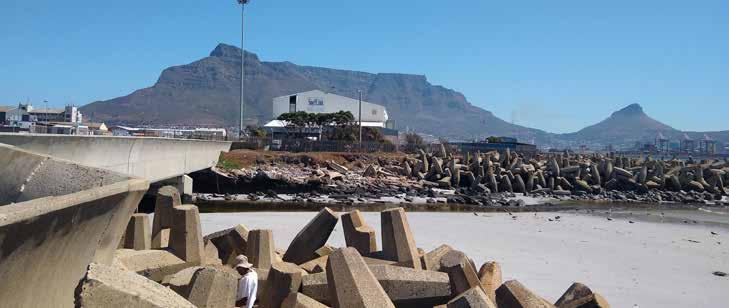
5.6.2 Reach 2
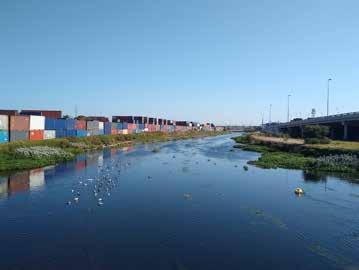
Reach 2 between the railway bridges 9 and the Vortrekker road crossing was modified for the construction of the M5 Highway in 2009. During that construction, the complete stretch was moved 5m to the west and instead of the concrete embankments, 3-meter-high gabion walls were constructed to frame the channel.
The gabions are filled with a dark local stone. Within the gabions are no spaces for riparian vegetation. The bottom is kept in concrete. No other visible improvements were done to this reach.
This reach is also infested with alien vegetation, of Water hyacinth and Parrot feather.
The character of this reach is strongly influenced by the containers, that are stored on the open land west of the canal since 2015. This land is still classified as an wetland. The eastern side is dominated or overshadowed by the new elevated M5. There is no allowance for pedestrian movement on the site.
5.6.3 Reach 3
Reach 3 between Bridge 10 and 11 (Vortrekker road and the railway crossing for the central line) is a concrete lined trapezoid channel.
The western bank has an immediate approximately 2.5m high fibre-crete wall along the adjacent properties and the eastern edge is slightly undulating open land under the elevated highway bridge. This land is used for storing Golden arrow buses during the day.
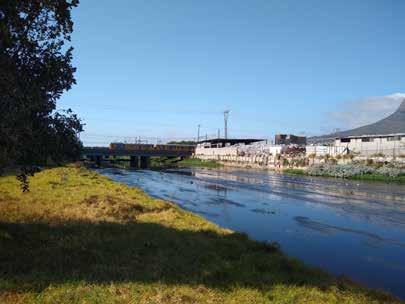
This reach has the same alien vegetation as the reaches downstream.
That short reach has an industrial character with very high noise levels from the above road, the railway and the Vortrekker road traffic.
5.6.4 Reach 4
Reach 4 between bridge 11 and the confluence of the Black and Liesbeek river, is an earth channel, that is eroded at the bottom and on the sides.
It is infested with alien vegetation and polluted with rubbish from immediate and upstream sources.
This is the only part of the canal were the water level is directly impacted by groundwater levels. The railway bridges are dominating the character of this reach, with some bridges permanently used for parking trains on it. The embankments are steep and eroded, the western embankment holds breeding spaces for Kingfishers.
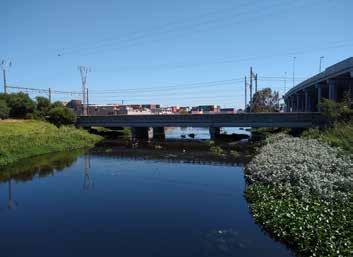
Erosion of the bottom of the river are a sign of scour, that could be caused by the high infestation with Water hyacinth in front of bridge 11, that can be traced on aerial photographs back 20 years and more.
5.6..5 Zoarvlei wetland
The Zoarvlei wetland receives stormwater from the surrounding areas. It is infested with Phragmites, like most wetlands in Cape Town. There are two outflows, that could also be inflows, one south and a culvert to the Milnerton Lagoon in the north. The wetland is protected within the Cape West �oast Biosphere �eserve and as Critical Biodiversity area.
5.6.6 Old Salt River canal
The canal is a remnant of the original Salt River. Where the Salt River mouth discharged in to the sea a pipe drains into the harbour. The canal is completely concrete lined and receives stormwater from the suburbs of Salt River and Paarden Eiland. Two mountain streams from Devil’s Peak discharge into the canal. Rubbish and litter are polluting the canal. The canal is the most hidden system of the three and not easy to access or find.
4.6.7 Conclusion
Salt River canal, the Zoarvlei wetland and the Old Salt River canal are not connected. Reach 1-3 are very similar with a canalized bed and fragmentation of the lateral and interstitial connectivity. Reach 4 is a eroded earth channel. In all sections the riparian vegetation is disturbed or non existent. The Salt River canal is receiving stormwater from adjacent areas in all reaches. Sedimentation happens only at the river mouth. The entire canal is polluted with rubbish , litter and alien vegetation.
Hydro-morphogical
Assessment categories
Channel
Generic features Examples of attributes assessed Salt River canal
Planform
Braiding, sinuosity Straight, enineered Modification to natural planform highly modified, new bed and decoupling from original river
Channel geometry
Longitudinal section Gradient, long-section profiles very low gradient
Cross section
Variations in cross section shown by depth, width, bank profiles, etc.
• canal with vertical embankments
• canal with gabbion embankments
• earth channel
Artificial Concrete, bed-fixing Concrete canal
Gabbion embankments in parts
Embedded (boulders, bedrock, etc.) N/A
Large (boulders and cobbles) N/A
Substrates
Channel vegetation and organic debris
Natural substrate types
Coarse (pebble and gravel) N/A
Fine (sand) At the mouth
Cohesive (silt and clay) N/A
Organic (peat, etc.) N/A
Management/catchment impacts
Structural form of macrophytes
Leafy and woody debris
Degree of siltation, compaction N/A
Emergent, free-floating, broad leaved submerged, bryophytes, macro-algae -
Type and size of feature/ material
free floating Water Hyacinth and Submerged Parrots feather
Tapestry of flloating water hyacinth in places
Weed cutting not observed
Erosion/deposition character
Features in channel and at base of bank
Point bars, side bars, mid-channel bars and islands (vegetated or bare)
Stable or eroding cliffs, slumped or terraced banks
N/A
steep banks at upstream end of channel, vegetated
Flow
Longitudinal continuity as affected by artificial structures
Flow patterns
Flow features
Free-flow, rippled, smooth smooth fluvial flow wavy tidal flow, ebbing up from downstream to upstream
Effect of artificial structures (groynes, deflectors) major effects from bridges could not be observed
Pools, riffles, glides, runs N/A
Discharge regime Off-takes, augmentation points, water transfers, releases from hydropower dams
Artificial barriers affecting continuity of flow, sediment transport, and migration for biota
Weirs, dams, sluices across beds, culverts
discharges from WWTW from the upstream catchment
tidal inflow
conitnuity of flow , no barriers sediment transport disturbed migration of biota difficult to observe
Hydro-morphogical
Assessment categories
Riverbanks/riparian zone
Bank structure and modifications
Generic features
Bank materials
Types of revetment/bank protection
Structure of vegetation
Examples of attributes assessed
Gravel, sand, clay, artificial artificial
Sheet piling, stone walls, gabions, rip-rap
Vegetation types, stratification, continuity
Salt River canal
concrete walls and gabions
no riparian vegetation
lateral connectivity cut off, terrestrialised
Vegetation type/ structure on banks and adjacent land
Vegetation management Bank mowing, tree felling Alien plant removal (Water hyacinth)
Top of banks planted in parts with terrestrial vegetation and irrigated
Floodplain
Types of land use, extent, and types of development
Agriculture, urban development
urban development, industrial, residential and transport use
Adjacent land use and associated features
Degree of
(a) lateral connectivity of river and floodplain
(b) lateral movement of river channel
Types of land use, extent, and types of development
Floodplain forest, agriculture, urban development
Ancient fluvial/floodplain features (cutoff meanders, remnant channels, bog)
Urban development: rail yards, open space, highway
cut off old river, Zoarvlei wetland and Old Salt River canal;
Types of open water/wetland features
perched wetlands at the end of storm water pipes and next to canal wall
Degree of constraint to potential mobility of river channel and water flow across floodplain
Continuity of floodplain
Artificial water features (irrigation channels, fish ponds, gravel pits)
Embankments and levees (integrated with banks or set back from river), flood walls, and other constraining features
Any major artificial structures partitioning the floodplain
N/A
(a) Floodplain disconnected through canal walls
(b) lateral movement of river not possible, due to constraint of the fixed canal
C Table of Hydro-morphological assessment: Source: adapted from by author from (Schmutz,S., 2018)
5.7 Hydro-morphological assessment
The hydro-morphological assessment above describes a critically modified canal, which was engineered to use the least space and shortest route to sea. It has a very low gradient and the variations in cross section are between a canal with gabion or concrete walls and an eroded earth channel. The substrate is mainly artificial. Channel vegetation consist of alien invasive species, which are infesting the canal for decades and are an indicator for nutrient rich water. Tidal and fluvial flow are interchanging, while the fluvial flow is low in summer supplemented by treated effluent from the two WWTW's from upstream. Longitudi-
nal continuity is not interrupted by barriers, only sediment transport is disturbed. The riparian banks are artificial concrete walls or gabions with no riparian vegetation. Lateral connectivity is decoupled, the land next to the canal is terrestrialized. The former floodplain was reclaimed for urban development. All three remaining water features are decoupled from each other. Lateral connection and movement between canal and floodplain is disconnected.
5.8 Bridge crossings
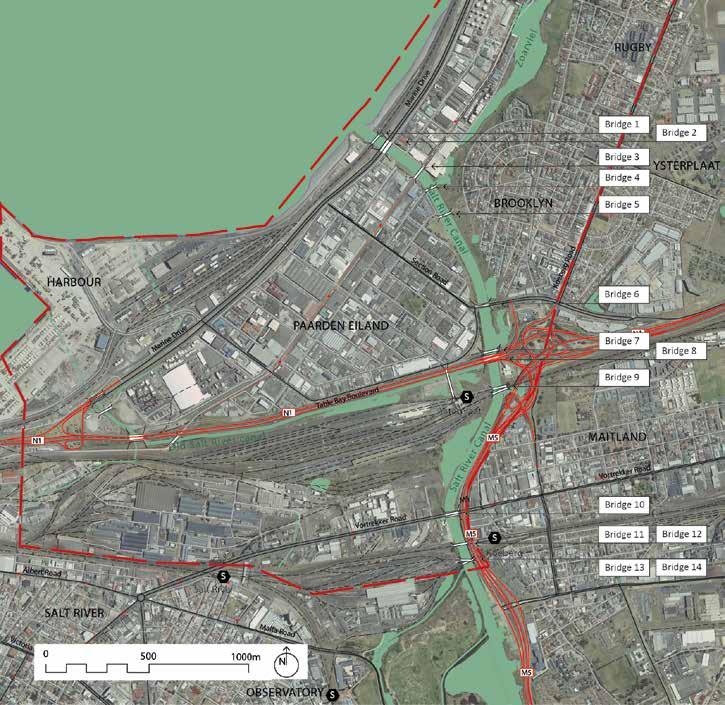
The bridges were numbered from the coast upstream, grouping some bridges that serve the same service like bridge 9 and 11. Up to reach 4 the canal is uniformly 46m wide. With the construction of the canal 13 of today’s 14 bridges were built in the 1950’s and since then only 2 were reconstructed to allow for wider roads.
Froude’s and Reynold’s numbers give insight into variability of flow in a stream. Froude’s number indicates subcritical or supercritical flow. Reynold’s number is a measure
of turbulence. Variety in the numbers and the amount of change at transition points indicate variability of stream flow. (Matlock and Morgan, 2011) A Froude Number below 1 indicates critical flow, which is not the case on the bridges within the Salt River Canal under normal conditions, foreign materials or sediment accumulation around bridges could decrease the flow area and increase the Froude number.
90 Salt River Canal long section continued from previous page, Source: created by author
92 Salt River Canal Bridge 1 - 3, Source: created by author
5.8.1 Bridge 1
This bridge is a rail bridge that serves exclusively the harbour, since its extension in the 1980’s. It stretches 37m over the coastal inlet and has a maximum height of 3.36m
over the canal. This height is often compromised by sediment build up, visible in yellow on the drawing above.
5.8.2 Bridge 2
With the construction of Marine Drive in the 1950’s bridge 2 was constructed as a 4 lane vehicular bridge and the 2 lane service road bridge that spans 37m over the canal
mouth at a height of 2.9m. This bridge actually comprises of two separate bridges, identical in form and structure, only different in width, the Marine Drive bridge and the smaller service road bridge.
5.8.3 Bridge 3
With the metropolitan wide rollout of the MyCiti Bus system, the former rail bridge was replaced 2009 with a new
bridge for the MyCiti Bus route to Atlantis. The new bridge was built with a 3,5m clearance.
5.8.4 Bridge 4
This service bridge is one of the original bridges, that was built during the construction of the canal. It’s the most narrow bridge over the Salt River canal and completely
enclosed, so that it can not be used for pedestrian or bicycle traffic.
5.8.5
Bridge 5
5
Built to connect Paarden Eiland with the suburb of Brooklyn for pedestrians before 1980. This bridge is the second narrowest and third lowest bridge with a height of 2.1m
over the Salt River canal and is therefore a mayor flood cause/obstruction.
5.8.6
Bridge 6
6
bridge 6
Station road bridge connects Paarden Eiland with the northern suburbs and the N1 highway, built during the
construction of the canal it spans 21m and has a clearance of only 2.3m.
5.8.7 Bridge 7
The pedestrian bridge was built 2009 as part of the N1/M5 project for the 2010 World Cup. It gives pedestrians access to the Salt River Station from Brooklyn.
5.8.8 Bridge 8
The N1 Highway crosses the Salt River canal over this bridge at a clearance of only 2.1m. Rebuilt in 2009 this bridge spans 42m and 6 lanes of traffic on one of the main
highways into the city centre. Attached on the western side is a water main connection.
5.8.9 Bridge 9
Comprising of 3 bridges, bridge 9 is the widest bridge over the Salt River canal. Built for the passenger rail traffic on
the northern line. It is unclear, if all 3 bridges are still in use or only the centre bridge.
5.8.10 Bridge 10
Vortrekker Road was the first road connection to the north, previously over the tributary to the Salt River and the Black River. “In 1845, Colonel Charles Michell constructed a bridge across the Black River on the alignment of the present Vortrekker Road. This was the first step in building a hard road across the sandy, windblown and often impassable Cape Flats. The bridge was known as the
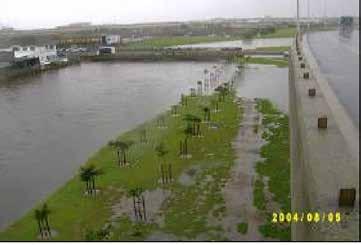
Montagu Bridge” (Cate Brown and Rembu Magoba, 2009). This bridge was rebuilt with the construction of the canal and is the lowest bridge of all 14 bridges, which makes it a mayor cause for flooding during storm events. In the 2004 event reportedly, the canal over topped its banks at this point, see photograph below.
4.8.11 Bridge 11 and 12
These 2 passenger rail bridges are almost identical and were built in the 1950’s. They give rail access from and to
town to
station, on the central line.
4.8.12
This rail bridge is affiliated with the railyard and plays no mayor role in passenger transport.
14
4.8.13 Bridge 14
With the highest clearance, the most upstream bridge of the Salt River canal is the entrance to the canal. This rail bridge is affiliated with the railyard and plays no mayor role in passenger transport.
14
4.8.14 General observations
All rail bridges are part of the original set crossing the canal and are in need of maintenance. The last 4 bridges (11,12,13,14) are in need of structural tests, due to the bed lowering at this point.
The high density of crossings over the Salt River Canal will affect any modification of the canal like widening or rehabilitating. Currently the bridges only allow for the width of the canal.
Bridge number 10 - Vortrekker Road - needs to be upgraded urgently as part of flood protection. Due to its low height it is a major flood obstruction, that will result in flooding further upstream.
The abutment of bridges 11-13 lies within the flood zone, which in case of a flood is unfavourable for the structural stability.
In the long section of the canal the changes in height of the canal bed and the discharge height of the bridges are visible in relation to each other. It shows also clearly the drop in bed level below 0 after bridge 13, which indicates a scour in this area. Reason for the scour could be the change from earth channel to concrete lined canal with a disturbed sediment transport, or the constant infestation with water hyacinth in the Black River close to bridge 14. The scour between bridges 13 and 14 can result in exposure of the footings and needs to be checked to assure the structural stability of these bridges.
This analyses is based on information from 2015 as it was not possible to obtain newer information due to the lock down and the closure of all administrative offices during the Covid-19 pandemic.
5.9 Flooding and flood models for the area
Because of its topography and proximity to the sea, the study area is prone to flooding. Flooding in Paarden Eiland is being a major risk for the CoCT. Land use being mainly industrial the financial risk of floods is great, as many properties have warehouses on site.
The last 17 years various flood studies were done for the Salt River catchment or parts of it. These include the following studies: Ninham Shand (2003), SRK (2010), (DiMP,2005), RH-DHV (2016) and AURECON (2019).
There has been a lack of consistency in the modelling methods and in the resolution at which the upstream catchment area has been modelled, due to inconsistencies and accuracy in data. In addition, the more recent models have incorporated climate change considerations. Therefore, undertaking comparisons between the different results is not possible
Ninham Shand (2003)
As part of a study commissioned by the City and undertaken with input from a number of consulting engineering companies, Ninham Shand developed flood lines for the Black and Salt Rivers.
“vThe peak flow from the Salt River Catchment, including the Liesbeek River Catchment is approximately 240 m3/s for a 1:100 year recurrence interval storm event” (Shand, 2003).
2004 Flood event
After a flood event in 2004, the CoCT commissioned a Post Flood Assessment to understand impact and causes. The multidisciplinary team came to the following outcomes. “The minor stormwater system is typically designed to cope with runoff events of between 2 and 5 year return periods, while the major system must cope with events up to and possibly exceeding 100 year return. Many of the older areas of Cape Town were not designed on this basis, with obvious inherent deficiencies in dealing with extreme rainfall events. Within the municipal area of Cape Town most flood incidents occur when storm water runoff flow rates exceed the capacity of the storm water system. This applies predominantly in the formally developed areas and flood waters usually recede within hours” (DiMP, 2005).
“The 5 August 2004 rainfall event, resulted in widespread and serious flooding in the Nyanga, Guguletu, Athlone, Bonteheuwel, Langa, Pinelands, Observatory, Maitland, and Woodstock areas. Peak rainfall intensities for storm durations exceeding 3 hours, approached the 1 in 100 year return statistical maximum within a very confined geographic area, centred over the general Athlone area” (DiMP, 2005). This means the main rainfall was over the centre of the catchment.
“Flooding is normally a result of blocked gullies and pipes. In Cape Town the river systems are generally small with small catchment areas and as a result the rivers respond
very quickly. The rainfall on the 5 August 2004 was very concentrated and thus the flood event was very localised. During this event peak intensities approached the 1:100 year return period” (DiMP, 2005).
“The flood resulted in many of the canals and rivers bursting their banks as the capacity of the canals were exceeded. For example, the high intensities of water in the Liesbeek and Black Rivers resulted in a bottleneck which caused the Salt River Canal to burst its banks” (DiMP, 2005).
“The August flood was concentrated over the central Cape Flats areas of Langa, Pinelands, Athlone, Guguletu and Bonteheuwel. For storms in excess of two hours duration, the average concentration time for these water courses, rainfall intensities were in excess of the 1 in 20-year statistical maximums. The rainfall intensities decreased sharply away from the affected areas” (DiMP, 2005).
“The flood was the result of the level of water in the Salt River rising very quickly over a short period of time which back flooded up the Liesbeek River causing the river to burst its banks” (DiMP, 2005).
Tidal information at Table Bay on 5 August 2004
Tide Time Sea Level
Low Tide 00:22 -0.465m below mean sea level
High Tide 06:20 0.645m above mean sea level
Low Tide 12:20 -0.425m below mean sea level
High Tide 18:44 0.775m above mean sea level
“There was also speculation as to whether the flooding occurred as a result of the high tide in Table Bay. It is apparent from the tide information displayed in Table …that the flooding did not coincide with high tide in Table Bay. The primary impact of the flooding was experienced along the tributaries of the Salt River, which drains into Table Bay at Paarden Eiland. Peak outflow from the catchment is estimated at 210m3/s with a return period of 50 years (viz. 2% probability of occurrence in any year).
A sporting facility and associated car park in Observatory was inundated due to reverse flow up the Liesbeek River from the Salt River. Initial claims that this resulted from exceptional tides in Table Bay proved unfounded. Factories in Beach Road Maitland were inundated due to over-bank flow from the Salt River under the Black River Parkway flyover” (DiMP, 2005).
Instead the reversed flooding was caused by the low Vortrekker road bridge, as described earlier, this bridge is the lowest in the Salt River canal with the smallest opening. It caused a blockage that resulted in flooding of the adjacent and upstream area. An additional cause for the blockage could have been the accumulation of Water hyacinth in the Black River. No further flooding in the study area occurred during this event.
Salt River Catchment
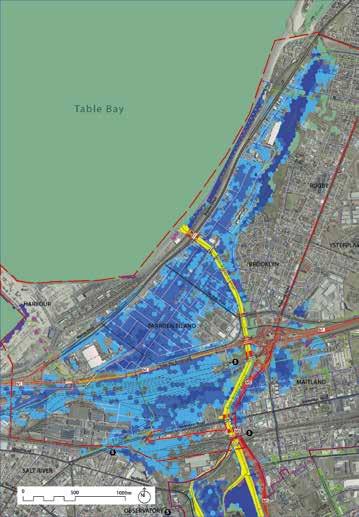
1:100year Floodline SRK
SRK (2010)
SRK Consulting South Africa (Pty) Ltd (SRK) was appointed in July 2009 by the CSRM(Catchment Stormwater Rivers Management Department) to consolidate and analyse the rainfall data for the CoCT Metropolitan area and prepare High Level Stormwater Masterplans for the Salt River Catchment.(SRK Consulting, 2012)
Additionally SRK was to develop standardised modelling techniques and parameters to guide future projects as well as determine flood risks for use in disaster management planning. The catchment GIS data used in this study comes mostly from this report. The 1:100 year flood line
within the catchment is shown above. SRK created GIS data as part of the masterplans. The storm water system is still incomplete as it does not correlate with the catchment boundaries.
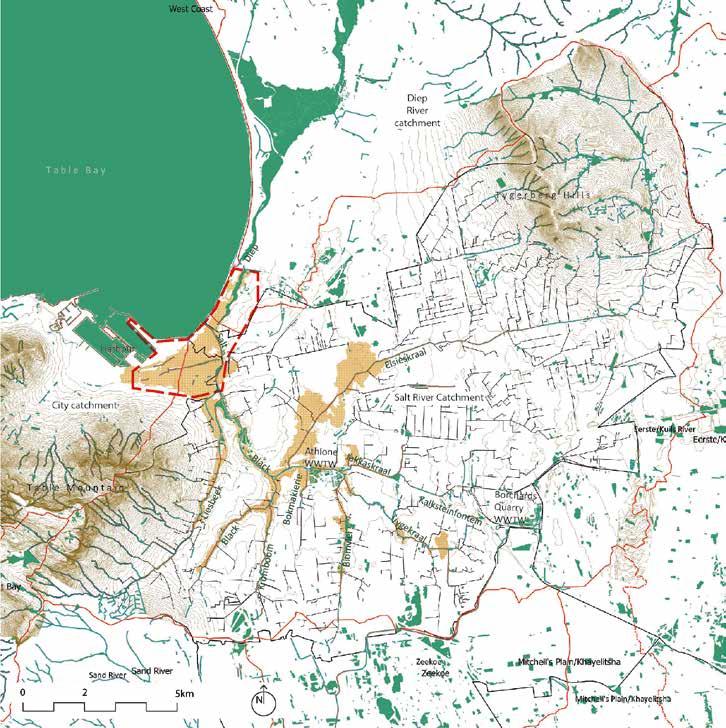
Study area
RH-DHV (2016)
In 2016 Royal Haskoning DHV (RH-DHV) did a flood modelling exercise as part of the Trup study. “This model preceded the 2010 model done by SRK. The client CoCT insisted on a model in their preferred software PCSWMM against the recommendation of the experts running the model” (Groen(RHDHV), 2016).
Their first model adjustments focused on the tidal boundary condition.
“Where the river enters the ocean, the water level is equal to the sea level, and the river flow has no influence on the flood levels. The flood water level is equal to extreme sea levels occurring at a defined frequency. For flood modelling computations a choice has to be made on a combination of river flow and sea level during floods. The tidal component is unrelated to weather conditions, and extreme storms can occur at any tide level. Both the timing of the flood peak relative to the twice daily tidal
cycle and the tidal range of that cycle are important. The tidal boundaries (the locations were the flooded area interacts with the ocean) were more extensive than originally thought. Therefore, a new computational mesh was generated and a tidal boundary was also added in the area near the Northern end of the Zoarvlei where there appeared to be some overflow into the ocean. Levels include the 90th percentile high tide plus the best estimate sea level rise for 2060”(Groen(RHDHV), 2016).
“There is a very marginal increase in flood extent when the peak inflow to the modelled area coincides with the lowest tide, most likely because the travel time from upstream of TRUP to the ocean is of the same order of magnitude as the 6h required for the tide to rise. The extended duration of the peak outflow limits the impact of the timing of the tide, and the timing of the peak outflow is itself influenced by the timing of the tide. Based on these findings, it was decided to time the tide peak at 9 h and 21 h after the start of the simulation, i.e. so that the low tide coincides approximately with the inflow to the modelled area for all further modelling” (Groen(RHDHV), 2016).
“Flow in the Salt, Black and Liesbeek Rivers occurs almost entirely in the channel, with the floodplain providing storage, but with negligible active flow, as is concluded from the velocity maps in the 2D model. Flood levels are controlled by the downstream tide level plus the change in level from downstream to upstream. Widening or raising of bridges within the Salt River canal was briefly considered. Raising or widening of bridges is costly. In particular rail bridges are very difficult to raise due to the vertical alignment requirements for railways”(Groen(RHDHV), 2016).
“Flow along the channel naturally follows and also causes a slope from upstream to downstream. Change in level due to flow along the channel is dependent on flow area, channel roughness, the ground area in contact with the flow and the channel length” (Groen(RHDHV), 2016).
“Water from the Salt River spills over into the Zoarvlei. The Zoarvlei discharges to the Mouth of the Diep River through a stormwater culvert, which is reportedly often blocked. Water levels in the Zoarvlei could be reduced by improving the capacity of this outlet, by connecting the Zoarvlei to the Century City outfall” (Groen(RHDHV), 2016).
“The long-section suggests that the high ground between the Salt River Canal and the Zoarvlei has more influence on flow into the Zoarvlei than the water levels in the Zoarvlei. This assertion is also evidenced by the large change in predicted flood extents in the Zoarvlei depending on the initial water level. Therefore, a reduction in flood water levels in the Zoarvlei would not affect TRUP, unless an alternative lower level inlet to the Zoarvlei is also constructed. This would cause the Salt River to flow into the Zoarvlei more often, dependent on the design. This mix of Salt and Zoarvlei could interfere with the ecological functioning of the Zoarvlei as it is now (notwithstanding that the connection might historically have been there). For the above reasons, it was decided not to model changes to the Zoarvlei outlet”(Groen(RHDHV), 2016).
Aurecon (2019)
Aurecon was appointed to undertake a flood model for the proposed development of the River club, on the Liesbeek River just upstream from the Salt River. Because of building in the 1:20 year floodplain, the study hat to model the flood consequences.
“This study has reviewed seven relevant studies, and has undertaken extensive modelling with both HEC-RAS and PCSWMM 2D and with that was the most comprehensive of all studies util now. In 2004 Ninham Shand undertook a study on behalf of City which investigated the possible widening of the Salt River Canal” (Aurecon 2018).
“The TRUP study (RH-DHV, 2017) also considered widening of the Salt River Canal. The study examined the potential benefit of widening the canal by modelling an additional 25 m wide rectangular canal in parallel with the Black River channel and the existing Salt River Canal, together with widening of the bridges crossings. RH-DHV found that immediately downstream of the N2, there would be a predicted reduction of 0.83 m in the water level due to the 15 m widening. The RH- DHV report noted that canal enlargement would involve significant capital costs” (Aurecon 2018).
“The City, none the less requested that this study also consider the possible effect of widening the canal and removing any restrictions (e.g. bridges). The following assumptions were made:
▪ The bridges could be engineered / re-engineered to not affect the flow in the Salt River – i.e. span the river.
The canal was assumed to be a 61m rectangular cross-section – with the same invert levels as the existing canal. Aurecon modelled the 10 year storm surge with a 100 year flood event. These results are not entirely surprising as the tidal levels make provision for 0.55 m to account for sea level rise as a result of climate change and a storm surge which together add more than 0.8 meters to the Mean High Water Spring tidal level – which was used for previous studies. This larger sea level rise would seriously constrain the capacity at the outfall, likely contributing to the flooding. Another reason for the limited differences, regardless of the tidal levels, is that a significant portion of the flooding is as a result of the Salt River exceeding its capacity” (Aurecon 2018).
Conclusion
Initially it was planned to undertake a flood model exercise as part of this thesis, the model application which the CoCT prefers was acquired. The necessary data could not get obtained from the CoCT in time due to the Covid-19 lock down of all administrations.
There are six recognised sources of flooding in the study area:
Tidal Flooding - “both sea and river defences may be overtopped or breached by a combination of low pressure weather systems and peak high tides. Storms with high wind speeds cause tall and powerful waves and low pressure fronts cause sea levels to rise above normal levels. High tide levels vary through the lunar and solar cycle and when superimposed upon other tidal variations exceptionally high tides result. The onset of flooding from the sea and tidal rivers is often sudden and the extreme forces driving it present a significant danger to life. It is often possible to forecast this type of flooding with reasonable accuracy, due to the predictability of the tide and trackability of low pressure systems. The duration of this type of flooding is also limited by the cycle of the tides where drainage is available”(RIBA, no date). The tidal flooding in the study area would only occur in the river and storm water outlets, the land is protected by a high enough seawall within the harbour and along the coast north of the Salt River canal mouth. Within the canals is no space for tidal flooding, which would result of flooding of the adjacent areas. It needs to be tested how the stormwater system
would be impacted by a storm surge.
Fluvial Flooding “occurs in the floodplains of rivers when the capacity of water courses is exceeded as a result of rainfall within catchment areas further upstream. Blockages of water courses and flood channels or tide locking may also lead to ponding and rising water levels. River defences may then be overtopped due to increased water levels, or breached by large objects of debris carried at high water velocities. The onset can be quite slow in some catchments with steadily rising water levels. However, flash flooding can occur in steep catchments and is far more immediate. Flooding from rivers, particularly in recognised floodplains, can usually be predicted with good accuracy. However flash floods from sudden downpours continue to challenge the capability of detection and forecasting systems. Water over about 250mm in depth may carry debris particularly in urban locations and can also be very cold. Even travelling at low speeds this can make it extremely hazardous to people caught in it”(RIBA, no date). The Salt River canal is prone to flooding due to its spatial constraints within the lined canal, it has no floodplain, where water could expand to. Fourteen bridges and some of them low are a great obstruction during flood events as proven in the 2004 flood event. The amount of floating alien vegetation, debris and rubbish in the canal is concerning and apart from the environmental risk it is also a risk for blockages during floods.
Ground Water - “low lying areas sitting over aquifers may periodically flood as ground water levels rise. This type of
flooding is often seasonal and therefore can be forecasted with good accuracy. It is often slow in its onset” (RIBA, no date). Groundwater flooding was not taken into account in all the studies mentioned above. It is considered plausible, that the water table sits close to the surface, due to the low topography and close proximity to the sea.
Pluvial Flooding - “Surface water flooding is caused by rainwater run-off from urban and rural land with low absorbency. Increased intensity of development in urban areas has given rise to land with a larger proportion of non-permeable surfaces, a problem often exacerbated by overloaded and out-dated drainage infrastructure. These circumstances, combined with intense rainfall, can give rise to localised flooding. This sort of flooding often occurs outside of recognised floodplains and because it is caused by quite localised weather conditions it is very difficult to forecast. Its onset can also be very rapid, and the level of flooding very severe” (RIBA, no date). Paarden Island together with the harbour are “sealed” surfaces in a former estuary. This causes a high rate of surface water run off. Due to its place in the catchment, it can drain before the flood from upstream comes during short rainfall events, if the tide is low.
Flooding from Sewers “can occur where there are combined storm and foul sewers and their capacity is exceeded due to large amounts of surface water run-off in a short time. Poor cleaning and maintenance can lead to blockages that can also cause local flooding. This type of flooding is hard to predict, has significant sanitary consequences
for those affected, and can occur very rapidly” (RIBA, no date). Sewers and storm water should be separate systems in Cape Town , but a combination in places can’t be excluded.
Flooding from Man-made Infrastructure - “Canals, reservoirs and other man-made structures can fail causing flooding to areas downstream. Industrial activities, water mains and pumping stations can also give rise to flooding due to failure”(RIBA, no date). Canals built to prevent flooding have only a limited capacity and are subject to blockages at lateral contractions. The answer to the limited capacity until now was widening.
The reviewed flood studies are focusing on fluvial and pluvial flooding in combination with tidal influences. There were no flood attenuation suggestions made. The only design change that was modelled by all, was the widening of the channel from 46 to 61m, which would not be enough for the predicted sea level rise. The harbour and Marine Drive are in the SRK and RH-DHV model sparred from flooding during the 1:100 year flood. The low lying areas behind get flooded depending on their topographical height it seems. There is no flooding next to where the Old Salt River canal gets piped, which seems to be a mistake.
The main continuous finding through all studies is that the capacity of Salt River canal is too small to handle floods, which results in flooding further upstream in the catchment.
5.10 Run-off calculation
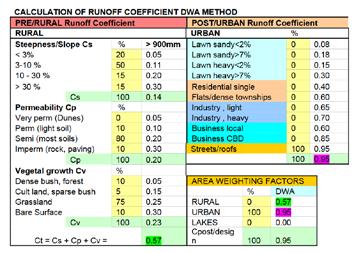
Run off calculation of the study area with the rational method.
This method was chosen, because of the limited amount of information available at the time of this study. The rational method is widely used to determine peak flows from small catchments. The basis is the conservation of mass and the hypothesis that the flow rate is directly proportional to the size of the contributing area and rainfall intensity.
The rational method is based on the following assumptions:
• rainfall has a uniform area distribution
• the rainfall has a uniform time distribution
• the peak discharge occurs, if the whole catchment contributes
• the run-off coefficient remains constant during the storm
• the return period of th peak flow is the same as that of the rainfall intensity
L24L25L26L27L28L29L30L31L32L33L34L35L36L37L38L39L40L41L42L43L44L45L46
5.11 What is lost?
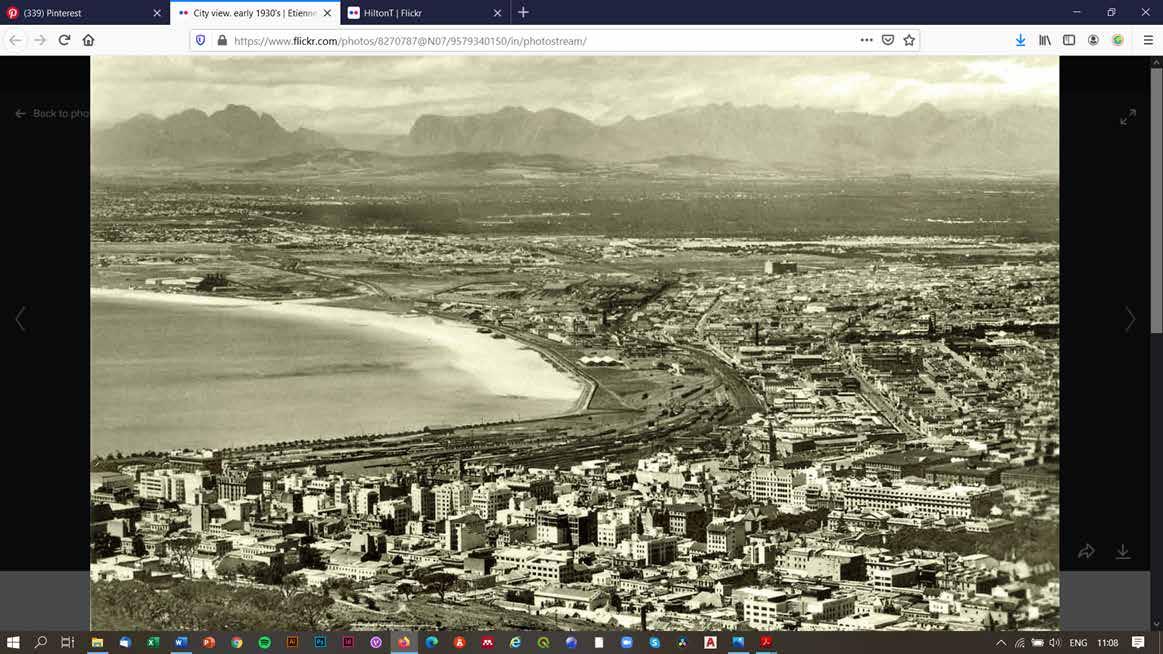
Before any human development the site was a estuary with a rich fluvial system braiding and changing shape with the seasons and the tidal influence. The estuary was a nursery, refuge and habitat for diadromous and estuarine fish species. During the winter month the estuary was alive and busy with migrant birds. "Estuaries in general are associated with wetlands, which attract migrant bird species for “stop overs “on their migration routes and overwintering. The birds need to fatten before migration and they must stop over at feeding grounds” (Branch, 2019). The vegetation was dense, bushy and low, adapted to the strong winds, the salty air and soil. A dune system buffered the coastline and the sand blew inland during the north-east winds in summer. The river dominated estuarine mouth shifted depending on the seasons and sediment depositions, it could have been a temporarily open/closed estuary. The size of the salt marsh is suggesting, that water was trapped there during the summer seasons. The salinity of the water changed with the seasons and the tidal inflow, an endemic habitat was formed to survive these conditions, plant and animal communities were distinct and different to the marine or terrestrial communities surrounding them. Vegetation changes up the length of the estuaries, with reeds and sedges lining the head and pond weeds growing submerged in areas where salinities are low, giving way to salt marshes and eelgrass in the middle reaches. Few plants are growing at the mouth because of
scouring by tidal exchanges. “Salinity declines upstream, while sediments are muddy in the middle to upper reaches but coarser and sandy at the mouth and head” (Branch, 2019). For the Table Bay the Salt River was the major inflow of freshwater as all the other streams where much shorter and had less flow. That would have attracted many diadromous species to travel into the estuary. Estuaries have two key features: the interplay of salty seawater entering the mouth with riverine freshwater, and the calm waters that contrast with the rage of the wave action on the open coast and the race of the upstream river. Now two sterile canals are draining the area, the low areas are filled in, the dunes flattened and sealed. Former river areas were filled with unidentified material and became lined canals. The former lagoon is now terrestrial land. The waves are splashing on the canal walls and race upstream. Seagulls are using the empty canal bed during low tide to rest. Diadromous fish species are coming inland to look for food and shelter. The land next to the canals is disconnected from the water with vertical concrete embankments. Alien invasive plants are hanging over the walls. Stormwater from the surrounding areas flows through pipes unfiltered into the canal. The land is dry, Trees and shrubs planted next to the canal have irrigation systems installed. Rubbish, foreign materials and invasive alien plants are floating in the water unhindered out to sea. The bottom of the canal is covered with the heavier waste and more alien invasive plants, which indicate bad water quality.
5.12 What can be saved / reintroduced?
The main source of an estuarine system the tidal in and outflow is still available. The flow still attracts diadromous species to travel upstream. Although the quantity of the freshwater flow might be in future reduced through the lesser discharge from the WWTW, the water quality should improve with that.
Introducing spaces for fluvial processes, that create different flow patterns, which could re-establish more diverse habitats. Cleaning the water with the help of riparian vegetation and slower flow in places. Giving back land for fluvial processes protects against flooding from the river. Reducing flood risk with reconnecting the interstitial and using the storage ability of the fluvisoils. Creating areas of “calm waters” with changing salinity levels as feeding and nursery habitats for diadromous species. Riparian banks and wetlands will attract with their fish population migrating birds.
Indigenous riparian vegetation doesn’t need irrigation and will provide habitat and refuge to many species. Alien vegetation floating within the water and infesting embankments needs to be controlled on a regular basis.
Pools, riffles and other forms of bed structures will form and change flow patterns within the channel. Organic debris like branches will accumulate in places and create diverse habitats with slower flow regimes. Erosion and deposition can take place as channel forming sediment
transport processes. Reintroducing the tidal system back into the urban communities, making people aware of the natural rhythm between land and sea. Reconnecting people with the river and the estuary to protect it. The estuary becomes an asset for the property values.
Stormwater filters like bioswales and rain gardens filter the rain water on site and reduce discharge into the river. The ground water gets recharged and the overland flow gets reduced, which results in less flooding during extreme rain events. People will reconnect with this part of the water cycle
The high risk of flooding within the industrial area with its high values gets reduced.
Salt marshes are carbon sinks and trap CO2. The air now polluted from container transport into the harbour becomes cleaner.
During the summer month the area will feel cooler because of the reduction of reflective hard surfaces and the cooling effect of the bigger water bodies with more vegetation.
9. List of figures
1 Old Salt River Canal 2020,
Source: author 2
2 Salt River Canal next to M5, view towards Devil's Peak, 2020, reach 2,
Source: author 4
3 Salt River Canal, view of bridge 2 during low tide, February 2020,
Source: author
4 Old Salt River Canal, view from N2 towards harbour, February 2020, Source: author
Source: Author 19
26 Cape Town, 1865;
Source: Western Cape Archives M2/202 18
27 Table Bay, 1901;
Source: CoCT Environmental and Heritage Resources 18
28 Table Bay, 1902;
Source: CoCT Environmental and Heritage Resources 19
29 Topographical Map Cape Town, 1934;
Source: CoCT Environmental and Heritage Resources 19
30 Salt River, 1937, extracted by author from Map of Cape Town, 1937;
Source: Author 20
31 Salt River, 1945, extracted by author from Table Bay aerial, 1945;
7 Salt River estuary June 2020, photo by author
8 Salt River 1660; extracted by author from Liesbeek- Neersetting, 1660;
Source:author 14
9 Salt River 1780; extracted by author from Paarden Eiland 1787;
Source Author 15
10 Salt River 1787; extracted by author from Paarden Eiland 1787;
Source Author 15
11 Liesbeek- Neersetting, 1660;
Source: Historiese Atlas, E. Stockman 14
12 Plan der Situatie van de Caap de Goede Hoop;
Source: CoCT Environmental and Heritage Resources 15
13 Paarden Eiland 1787;
Source Western Cape Archives M1 000904 15
14 Salt River 1789; extracted by author from Situatie Plan van het Casteel on Stadt aan Cabo de Goede Hoop,1789,
Source: Author 16
15 Salt River 1794; extracted by author from A Plan of Table Bay with the Road of the Cape of Good Hope, 1794;
Source: Author 16
16 Salt River 1806, extracted by author from Plan of the Salt River, 1806;
Source: Author 17
17 Salt River 1860, extracted by author from Table Bay, 1860;
Source: Author 17
18 Situatie Plan van het Casteel on Stadt aan Cabo de Goede Hoop,1789,
Source: CoCT Environmental and Heritage ressources 16
19 A Plan of Table Bay with the Road of the Cape of Good Hope, 1794;
Source: CoCT Environmental and Heritage ressources 16
20 Plan of the Salt River, 1806;
Source: Western Cape Archives 17
21 Table Bay, 1860;
Source: CoCT Environmental and Heritage Resources 17
22 Salt River 1865 extracted by author from Cape Town, 1865;
Source: Author 18
23 Salt River 1901, extracted by author from Table Bay, 1901;
Source: Author 18
24 Salt River, 1902, extracted by author from Table Bay, 1902;
Source: Author 19
25 Salt River, 1934, extracted by author from Topographical Map Cape Town, 1934;
Source: Author 20
32 Salt River, 1953, extracted by author from Table Bay aerial, 1953;
Source: Author 21
33 Salt River, 1958, extracted by author from Table Bay aerial, 1958;
Source: Author 21
34 Map of Cape Town, 1937;
Source: CoCT Environmental and Heritage Resources 20
35 Table Bay aerial, 1945;
Source: CoCT Environmental and Heritage Resources 20
36 Table Bay aerial, 1953;
Source: CoCT Environmental and Heritage Resources 21
37 Table Bay aerial, 1958;
Source: CoCT Environmental and Heritage Resources 21
38 Salt River, 1901 and current, extracted and over layed by author from Table Bay, 1901 and current aerial;
Source: Author 24
39 Salt River Mouth, near today’s Paarden Eiland 1896;
Source: Western Cape Archives 25
40 Plan showing plots A,B,C granted to the Maitland Municipality , 1908;
Source: CoCT Environmental and Heritage Resources 25
41 Aerial view, reclaimation for Table Bay docks expansion, 1973;
Source: UCT Digital collection, Special collections, Maps 26
42 Aerial photographs of Paarden Eiland , ca 1961
1 South from Diep River mouth;
2 Salt River mouth;
3 South from Salt River mouth;
4 Salt River power station from the sea;
5 Salt River Canal and Zoarvlei;
6 Otto Du Plessis after construction;
7 Salt River mouth;
Source: UCT Digital collection, Special collections, Maps 27
43 Salt River Canal view from Vortekker road bridge towards M5/N1 flyover2020,
Source: author 28
46
10. List of tables
11. Bibliography
‘Adams, J., Cowie, M. and Niekerk, L. Van (2016) Assessment of completed ecological water requirement studies for South African estuaries and responses to changes in freshwater inflow.
ARG, (2013),Milnerton South - Paarden Eiland Local Area Spatial Development Framework DEVELOPMENT AND Draft Report MAY 2013.
Armitage, N. et al. (no date) Alternative Technology for Stormwater Management The South African Guidelines for Sustainable Drainage Systems.
AURECON (2018) ‘Proposed Riverclub Redevelopment, Appendix G3 Surface water’, (March).
Batten, J. (no date) SUSTAINABLE CITIES WATER INDEX.
Beechie, T. J. et al. (2010) ‘Process-based Principles for Restoring River Ecosystems’, 60(3), pp. 209–222. doi: 10.1525/bio.2010.60.3.7.
Branch G. and M.(2018) ‚Living Shores‘Interacting with southern Africa‘s marine ecosyste, p.336.
Brundrit, G. (2009) ‘Global Climate Change and Adaptation : City of Cape Town sea- level rise risk assessment. Phase 5 : Full investigation of alongshore features of vulnerability on the City of Cape Town coastline, and their incorporation into the City of Cape Town’, System, (December), p. 35.
Brundrit, G. (2008) ‘Sea Level Rise Model for the City of Cape Town: Phase One Report’, Change, (March 2008), p. 36.
Burman, J. (1962) ‘Save to Sea’, p. 2.
Carden, K. and Winter, K. (2014) ‘Water Sensitive Urban Design FRAMEWORK AND GUIDELINES’, p. 234.
Carpenter (no date) Construction in the Landscape.
Cartwright, A. (2008) ‘A Sea-Level Rise Risk Assessment for the City of Cape Town. Phase 3 : Final Report’, Assessment, (June 2008), p. 65.
Cartwright, A.,Parnell, S., Oelofse,G., Ward,S. (2012) ‘Climate Change at the City Scale’, Climate Change at the City Scale. doi: 10.4324/9780203112656.ARG (2013)
Cate Brown and Rembu Magoba (2009) Rivers and Wetlands of Cape Town.
Charles W. Finkl and Christopher Makowski (2019) Encyclopedia of Coastal Science.
Christa Thirion and Nolusindiso Jafta (no date) State of Rivers Report 2017/2018.
Cities Alliance (2007) LIVEABLE CITIES.
City of Cape Town (2008) ‘Chapter 10 : Coastal and Sea Defence Decision Framework’.
City of Cape Town (2015) ‘Coastal Management Programme’, p. 220.
City of Cape Town (2017) ‘Environmental Strategy for the City of Cape Town’, (46612), p. 59. Available at: https://documents.ottawa.ca/sites/documents/ files/documents/enviro_strategy_en.pdf.
City of Cape Town (2017) ‘Five Year Integrated Development Plan 2017-2022’, (July), pp. 1–149.
City of Cape Town (2016) State of Cape Town Report 2016 Overview with infographics.
City of Cape Town (2019) Cape Town RESILIENCE STRATEGY.
City of Cape Town (2018) ‘WATER SERVICES AND THE CAPE TOWN Urban Water Cycle’, (August).
City Resilience Department, C. (no date) ‘Cape Town Resilience Strategy’.
CoCT (2017) ‘Maintenance Management Plan : Dunes and Beaches’, (November), pp. 1–68.
CoCT (2009) ‘Floodplain and River Corridor Management Policy’, 09(May).
CoCT (2009) ‘Management of Urban Stormwater Impacts Policy’, (May).
CoCT, W. and S. D. (2019) ‘Our shared water future; Cape Town Water Strategy’. Available at: https://resource.capetown.gov.za/documentcentre/Documents/ City strategies, plans and frameworks/Cape Town Water Strategy.pdf.Counts, Y. O. and Too, Y. A. (no date) ‘Water is indispensable!’ doi: 10.2779/62960.
Day, L. (2019) ‘Proposed redevelopment of the River Club , Observatory : Assessment of potential biodiversity impacts - Incorporating the findings of the aquatic ecosystems ( rivers and wetlands ), botanical , faunal , avifaunal and groundwater’, (July).
Department of Water Affairs and Forestry, P. (2005) State of rivers report: Greater Cape Town’s rivers.
DiMP (2005) ‘August 2004 Severe Storm Post Flood Assessment’, (May), pp. 1–98. Available at: http://www.riskreductionafrica.org/assets/files/
CoCT2004_Complete Report.pdf.Directorate-General for Environment (European Commission) (2011) ‘Water is for life’, p. 28. doi: 10.2779/83017.DM
Macfarlane, IP Bredin, JB Adams, MM Zungu, G. B. and C. D. (2015) PRELIMINARY GUIDELINE FOR THE DETERMINATION OF BUFFER ZONES FOR RIVERS , WETLANDS AND ESTUARIES.Eg, R. et al. (2001)
Eu, T. et al. (2015) ‘Framework Directive’, (1998).European Commission (2000) ‘Water Framework Directive 2000/60/EC’, Official Journal of the European Communities, L 269(September 2000), pp. 1–15. doi: 2004R0726 - v.7 of 05.06.2013.
European Commission (2013) A Water Blueprint for Europe. doi: 10.2779/12145.
eWISA (no date) ‘Estuaries of South Africa’.
Fairhurst, L. (2008) ‘Sea-Level Rise Risk Assessment for the City of Cape Town. Phase Two Report: Risk and impact identification’, Change, (May 2008), p. 82.Flood,
W., May, M. and Scores, W. (no date) ‘APPENDIX B : MITIGATION OPTION CONCEPTS To realize ’:Frost, D. D., Revised, U. and Farquhar, E. A. (2008) a Ppendix C S Oils, Civil Engineering.
Grab, S. and Knight, J. (2015) Landscapes and Landforms of South Africa—An Overview, World Geomorphological Landscapes. doi: 10.1007/978-3-31903560-4_1.
Groen(RHDHV), M. de (2016) ‘TWO RIVERS URBAN PARK SPECIALIST STUDY : WATERCOURSE MANAGEMENT AND CREATING A DOCKING / WATERFRONT
FEATURE Melanie Attwell and Associates’, (September).Haskoningdhv, R., Haskins, C. and Paterson, J. (no date) ‘Appendix C : Minutes of River Study Workgroup meetings and workshops’.
Hay, D., Kotze, D. and Breen, C. (no date) ‘Wetlands and Well - being : Getting more out of South Africa ’ s wetlands’, (August 2014).
Holzhausen, K. (2012) ‘Groupement Superpositions Georges Descombes architecte Atelier Descombes Rampini Biotec Biologique appliquée Schulthess Gartenpreis 2012 prix schulthess des jardins 2012 Table des matières Inhalt’.
Hugget, R. J. (2011) Fundamentals of Geomorphology. doi: 10.6009/ jjrt.67.1473.
Jansen, A. (2004) THE COSTS AND BENEFITS OF URBAN RIVER AND WETLAND REHABILITATION PROJECTS WITH SPECIFIC REFERENCE TO THEIR IMPLICATIONS FOR MUNICIPAL FINANCE : CASE STUDIES IN CAPE TOWN.
Johnson, M. F. et al. (2020) ‘Biomic river restoration : A new focus for river management’, (March 2019), pp. 3–12. doi: 10.1002/rra.3529.
Jordan, S. (2012) ESTUARIES CLASSIFICATION, ECOLOGY AND HUMAN IMPACTS.
Joubert, L. (2001) ‘Invaded - The biological invasion of South Africa’.
Kennish, M. J. (2016) Encyclopedia of ESTUARIES.
Kotze, P. (2019) Water resilient cities.
Matlock, M. D. and Morgan, R. A. (2011) Ecological Engineering Design: Restoring and Conserving Ecosystem Services doi: 10.1002/9780470949993.
Mathur, A. and Da Cunha, D. (2009) ‚SOAK - Mumbai in an estuary‘
McLean, C. (no date) ‘Durban’s Estuaries’.
MIT CAU, ZUS, URBANISTEN, Deltares, Volker Infradesign, 75B (2014) New Meadowlands.Niekerk, L. Van (2019)
National Biodiversity Assessment 2018 Volume 3 :
Novotny, V., Ahern, J. and Brown, P. (2010) ‘Restoring Urban Streams’, Water Centric Sustainable Communities, pp. 427–481. doi: 10.1002/9780470949962. ch9.
Paul, G. B. (2011) ‘CLIMATE CHANGE MITIGATION AND ADAPTATION STRATEGIES FOR INDIA : GIM and AR-CDM’.
Pearce, F. (2018), When the rivers run dry‘, p.312.
PEAK (2008) ‘Situation Assessment for the Diep Estuary’, (October).
Perini, K. and Sabbion, P. (2017) ‘Definition of the Issue Green and Blue Infrastructure in Cities’, Urban Sustainability and River Restoration, p. Chapter 1.
Perini, K. and Sabbion, P. (2017) ‘Chapter 8 Urban River Restoration’.Perini, K., Sabbion, P. and Perini, K. (2016) ‘Environmental and Ecological Imbalances in Dense Urban Areas’, Urban Sustainability and River Restoration, pp. 17–25. doi: 10.1002/9781119245025.ch3.
Pllc, A. (1961) ‘Living Breakwaters’, The Sciences, 1(13), pp. 11–13. doi: 10.1002/j.2326-1951.1961.tb00433.x.
Poff, N. L. et al. (1997) ‘The Natural Flow Regime’, BioScience, 47(11), pp. 769–784. doi: 10.2307/1313099.
Prof M N Nkondo, FC van Zyl, H Keuris, B. S. (2012) Proposed National Water Resource Strategy 2, Managing water for an equitable and sustainable future.
Prominski, M.,Stokman, A., Zeller, S, Stimber, D. and Voermanek, H. (2012), River. Space. Design.‘ p.295
R Berg, M Braune, J van Rensberg, G Howard, A Ggoergens, M. S. (2000) Salt-River-Hydrological-Study Phase 1.
Retief, K. (2016) ‘Diepriver estuarine managementplan 2016’.
RHDHV (2016) Modelling of Flood Mitigation Options on the Salt River. Task 1 Report: Set Up Model.RH-DHV (2017) ‘TWO RIVERS URBAN PARK SPECIALIST STUDY : MODELLING OF FLOOD MITIGATION OPTIONS ON THE Salt River TASK 2 FINAL REPORT Melanie Attwell and Associates’, (March).
RIBA (no date) Climate Change Toolkit - Designing for Flood Risk.
Robertson, G. W. (2018) Marine Ecosystem Management., Proceedings of SOUTHEASTCON Region 3 Conference.
Rowntree, K. (2013) RIVER ECOCLASSIFICATION MANUAL FOR ECOSTATUS DETERMINATION ( Version 2 ) MODULE B : Geomorphology Driver Assessment Index.
Sabbion, P. (2017) ‘Water in Urban Areas : Ecological and Environmental Issues and Strategies’.
South African National Biodiversity Institute (SANBI). 2019. National Biodiversity Assessment 2018: The status of South Africa’s ecosystems and biodiversity. Synthesis Report. South African National Biodiversity Institute, an entity of the Department of Environment, Forestry and Fisheries, Pretoria. pp. 1–214.
Scott,D. and Davies, H. (2019)‚Mainstreaming climate change in urban development‘ Lessons from Cape Town.
Stefan Schmutz, J. S. (2018) Riverine Ecosystem Management, Science for Governing towards a sustainable future.
Snaddon, K. and Day, L. (2009) ‘Prioritisation of City Wetlands Department of Environmental Resource Management The Freshwater Consulting Group’, (2007).
SRK Consulting (2012) ‘Stormwater Infrastructure Asset Management Plan ( Phase 2A ) Rainfall Analysis and High Level Masterplanning : Salt River Catchment : Final Report : High Level Masterplanning City of Cape Town Stormwater Infrastructure Asset Management Plan ( Phase 2A ) R’, (403343).
Stanford, J. A., Lorang, M. S. and Hauer, F. R. (2005) ‘The shifting habitat mosaic of river ecosystems’, SIL Proceedings, 1922-2010, 29(1), pp. 123–136. doi: 10.1 080/03680770.2005.11901979.T.G.
TCT (2015) Table Bay NATURE RESERVE, Water quality report.
The South African National Roads Agency (2006) Drainage Manual, 5th Revision, p.420.
URBEM (2004) ‘New techniques for urban river rehabilitation’, Viganò, P. (2012) ‘Extreme Cities and Bad Places’, 3(1), pp. 3–10. doi: 10.1007/ s13753-012-0002-6.
Watson,D and Adams, M (2011), Design for Flooding‘, p. 339. Wilby, R. (1997) ‚Contemporary Hydrology‘, p.354.
Wilkinson, M. et al. (2016) The Design of a National Wetland Monitoring Programme Consolidated Technical Report.
Wilkinson, M. et al. (2016) The Design of a National Wetland Monitoring Programme Implementation Manual.
12. Acronyms
BUW - Bauhaus University Weimar
CBD - Central Business District
CoCT - City of Cape Town
GBI - Green Blue Infrastructure
IDP - Integrated Development Plan
NAB - National Biodiversity Assessment
NWA - National Water Act
PRASA - Passenger Rail Agency South Africa
SANBI - South African National Biodiversity Institute
SUDS - Sustainable Urban Drainage System
WSUD - Water Sensitive Urban Design
WWTW- Waste Water Treatment Works
