City of Kawartha Lakes

Growth Management Strategy and Municipal Master Plan Project

EXECUTIVE SUMMARY
VOLUME 1: GROWTH MANAGEMENT STRATEGY
VOLUME 2: MUNICIPAL SERVICING ASSESSMENT
VOLUME 3: TRANSPORTATION MASTER PLAN
VOLUME 4: SOLID WASTE MANAGEMENT MASTER PLAN UPDATE
VOLUME 5: CONSULTATION REPORT
February 2012
Urban & Environmental Management Inc. 4701 St. Clair Avenue, Suite 301 Niagara Falls, Ontario L2E 3S9
Transportation Master Plan

4701 St. Clair Avenue, Suite 301, Niagara Falls, Ontario L2E 3S9 Ph: (905) 371-9764 Fax: (905) 371-9763 www.uemconsulting.com
Project: City of Kawartha Lakes Municipal Master Plan Project Client: City of Kawartha Lakes Subject: Transportation Master Plan Date: February 2012 UEM Project #08-409 Table of Contents 1.0 INTRODUCTION....................................... .............1 1.1 Summary of the Results of the Growth Management Strategy ..............................1 1.2 Municipal Class EA Process .................................................................................3 1.3 Purpose ................................................................................................................4 1.4 Scope....................................................................................................................4 1.5 Goals and Objectives............................................................................................6 1.5.1 Goal ................................................................................................................6 1.5.2 Objectives .6 1.6 Project Background ...........................................6 1.6.1 Places to Grow Act .........................................................................................6 1.6.2 Growth to 2031 ...............................................................................................7 1.6.3 Existing Land Use Inventory ...........................................................................7 1.7 Consultation Process ............................................................................................7 1.8 Planning Policy Compliance .................................................................................8 1.9 Approach and Work Plan ...................................................................................10 2.0 EXISTING CONDITIONS......................................................................................11 2.1 Road Network and Hierarchy ..........................11 2.1.1 City-Wide ...................................................................................................... 11 2.1.2 Urban Settlement Areas.................................................................................12 2.1.2.1 Lindsay ..............................................................................................12 2.1.2.2 Bobcaygeon ....................................16 2.1.2.3 Fenelon Falls ..................................16 2.1.2.4 Omemee............................................................................................16 2.2 Current Capital Improvement Plan.....................................................................16 2.3 Traffic Characteristics/Existing Conditions ........................................................17 2.3.1 Travel Patterns ..............................................................................................17 2.4 Volumes and Vehicle Classifications ................19 2.4.1 Volumes ........................................................................................................19

Transportation Master Plan Municipal Master Plan Project City of Kawartha Lakes February 2012 Page ii 2.4.2 Seasonal Trends.............................................................................................28 2.4.3 Annual Growth Trends .................................................................................28 2.4.4 Vehicle Classification.....................................................................................28 2.4.5 Collision Experience......................................................................................30 2.5 Existing Traffic Conditions ................................................................................31 2.5.1 Lindsay ..........................................................................................................32 2.5.2 Bobcaygeon ...................................................................................................37 2.5.3 Fenelon Falls ..............................................37 2.5.4 Omemee ..37 2.6 Rail Service .........................................................................................................37 3.0 LOCAL TRANSIT......................................................................................................39 3.1 Introduction .39 3.2 Comprehensive Strategic Transit Service Review ................................................39 3.3 Comprehensive Strategic Transit Service Review Study Recommendations ........39 3.3.1 In the Long Term ..........................................................................................40 3.4 Council Consideration of Strategic Transit Service Review Study .......................40 4.0 INTERMUNICIPAL TRANSIT..............................................................................43 4.1 Existing Conditions ............................................................................................43 4.1.1 Lindsay Transit ..............................................................................................43 4.1.2 Metrolinx.......................................................................................................43 4.1.3 GO Transit ....................................................................................................44 4.2 Private Providers ................................................................................................46 4.2.1 Can-ar Coach Service.....................................................................................46 4.2.2 Coach Canada Airport Van Service................................................................46 4.3 Current and Future Need ...................................................................................47 4.3.1 Current Need .............................................47 4.3.2 Future Need ..................................................................................................48 4.4 Opportunities for Future Services ......................................................................49 4.4.1 GO Bus Service to the City of Kawartha Lakes .............................................49 4.4.2 Peterborough Commuter Rail........................................................................49 4.4.3 Shining Waters Railway..................................................................................50 4.5 Conclusions – Intermunicipal Transit .................................................................51 5.0 ACTIVE TRANSPORTION....................................................................................52 5.1 Trails ..................................................................................................................55 5.2 Cycling .........55 6.0 PARKING............................................ .....................60 6.1 Urban Area Parking Supply ................................................................................60 6.1.1 Lindsay ....60 6.1.2 Bobcaygeon ................................................60
Transportation Master Plan Municipal Master Plan Project City of Kawartha Lakes February 2012 Page iii 6.1.3 Fenelon Falls .................................................................................................63 6.2 Existing Parking Utilization ................................................................................63 6.3 Future Parking Requirements .............................................................................65 7.0 FUTURE TRANSPORTATION SERVICES........................................................68 7.1 Committed/Approved Network Improvements.................................................68 7.1.1 Highway 35 South of Highway 7 ...................................................................68 7.1.2 Scugog River Bridge ......................................................................................68 7.1.3 Highway 7/35 Re-alignment .......................68 7.1.4 Highway 7 – Colborne Street Intersection ..68 7.1.5 Highway 35 Widening ................................68 7.2 Future Traffic Volumes ......................................................................................68 7.3 Future Traffic Conditions ................................70 7.4 Corridor Improvements .....................................................................................70 7.4.1 Lindsay ..........................................................................................................79 7.4.2 Bobcaygeon ...................................................................................................80 7.4.3 Fenelon Falls .................................................................................................80 7.4.4 Omemee........................................................................................................80 7.5 Intersection Improvements ................................................................................81 7.5.1 Lindsay ..........................................................................................................81 7.5.2 Bobcaygeon ...................................................................................................81 7.5.3 Fenelon Falls .................................................................................................81 7.5.4 Omemee........................................................................................................81 8.0 STRATEGIC TRANSPORTATION ALTERNATIVES....................................82 8.1 Identified Needs (Problem/Opportunity Statement) ..........................................82 8.2 Planning Approach .............................................................................................82 8.3 Strategic Alternatives ..........................................................................................83 8.3.1 Identification of Alternative Planning Solutions.............................................83 8.3.1.1 Do Nothing ....................................83 8.3.1.2 Structural Improvement .................83 8.3.1.3 Balanced Mobility Choices.................................................................83 8.3.2 Evaluation of Planning Solutions...................................................................83 9.0 STRATEGIC POLICY DIRECTIONS..................................................................86 9.1 Introduction .......................................................................................................86 9.2 Functional Road Network ..................................................................................86 9.3 Road Classification Descriptions .....................91 9.3.1 Rural Roads ...................................................................................................91 9.3.1.1 Arterials .............................................................................................91 9.3.1.2 Collectors ..........................................................................................91 9.3.1.3 Locals .............................................91 9.3.2 Urban Roads ..............................................91
Transportation Master Plan Municipal Master Plan Project City of Kawartha Lakes February 2012 Page iv 9.3.2.1 Arterials .............................................................................................91 9.3.2.2 Collectors ..........................................................................................91 9.3.2.3 Locals ................................................................................................92 9.4 Roadway Corridor and Intersection Improvements ............................................92 9.4.1 Provincial Highways ......................................................................................92 9.4.2 Municipal Roads ............................................................................................92 9.4.3 Lindsay ..........................................................................................................98 9.4.3.1 Angeline Street ...............................98 9.4.3.2 Lindsay Street .................................98 9.4.3.3 Colborne Street ..............................98 9.4.3.4 Highway 35 .......................................................................................99 9.4.3.5 Thunderbridge Road and Angeline Street ..........................................99 9.4.4 Bobcaygeon ...................................................................................................99 9.4.5 Fenelon Falls ...............................................................................................100 9.4.6 Omemee 100 9.4.7 Transit Services ........................................100 9.5 Active Transportation.......................................................................................100 9.5.1 Trails ...........................................................................................................101 9.5.1.1 Trails Planning and Management: ....................................................101 9.5.1.2 Victoria Rail Trail Corridor (VRTC): ...............................................102 9.5.1.3 Future Trail corridors ...................102 9.5.2 Road-Based Cycling.....................................................................................102 9.5.3 Community Initiatives .................................................................................103 9.6 Policy Initiatives ...............................................................................................106 9.7 Transportation Demand Management ..............................................................106 9.7.1 Fee-Based Strategies ....................................................................................106 9.7.2 Behaviour-Based Strategies .......................107 9.7.3 Land Use-Based Strategies ........................107 9.8 Goods Movement and Haul Routes .................................................................108 9.8.1 Transportation System Management (TSM).................................................109 9.8.2 Traffic Control Monitoring .......................109 9.8.2.1 Traffic Data ..................................109 9.8.2.2 Traffic Control Warrants .................................................................110 9.8.2.3 Regulatory Signage ..........................................................................110 9.8.2.4 Access Management ........................................................................111 9.8.2.5 Traffic Impact Studies .....................................................................111 9.8.2.6 Road Safety Audits .......................113 9.9 Transportation Master Plan Findings and Recommendations ...........................116 9.9.1 Findings ...................................................................................................... 116 9.9.1.1 Existing Travel Demand and Characteristics ...................................116 9.9.1.2 Future Travel Demands...................................................................116 9.9.2 Strategic Alternatives ................................117 9.9.2.1 Structural Improvements ..............117 9.9.2.2 Non-Structural Improvements.........................................................117
Transportation Master Plan Municipal Master Plan Project City of Kawartha Lakes February 2012 Page v 9.9.2.3 Policy Initiatives ..............................................................................117 9.10 Recommendations ............................................................................................118 9.10.1 Roadway Functional Classification...............................................................118 9.10.2 Transportation Strategy ...............................................................................118 9.10.3 Transit Recommendations ...........................................................................119 9.10.3.1 Frequency of Service .......................................................................119 9.10.3.2 Maintenance Staff ............................................................................119 9.10.3.3 Centralized Transfer Station .........119 9.10.3.4 Position of Transit Supervisor ......119 9.10.3.5 Intermunicipal Transit Recommendations .......................................120 9.11 Implementation and Monitoring.......................................................................120 9.12 Official Plan and Community Based Secondary Plans Integration ....................120 9.13 Study Integration ..............................................................................................121 10.0 IMPLEMENTATION PLAN.................................................................................123
List of Figures
Figure
Figure
Figure
Figure
Figure
Figure
(2009) Intersection Level of Service – Omemee..................................................36
Figure 2-16: Existing Rail Service - Kawartha Lakes.................................................................................38
Figure 4-1: The GTHA as defined by Metrolinx...... ...............................44
Figure 4-2: Go Transit System Map (Not to Scale).....................................................................................45
Figure 5-1 City of Kawartha Lakes Trails Plan............................................................................................53
Figure 5-2 Lindsay Area Trails Master Plan......... .....................................54
Figure 5-3: Kawartha Trans Canada Trail Map (Lindsay)..........................................................................56
Figure 6-1: Core Area Parking Inventory – Lindsay...................................................................................61
Figure 6-2: Core Area Parking Inventory – Bobcaygeon...........................................................................62
Figure 6-3: Core Are Parking Inventory - Fenelon Falls............................................................................64
Figure 7-1: Future (2031) Intersection Peak Hourly Traffic Volumes – Lindsay...................................71
Figure 7-2: Future (2031) Intersection Peak Hourly Traffic Volumes – Bobcaygeon...........................72
Figure 7-3: Future (2031) Intersection Peak Hourly Traffic Volumes - Fenelon Falls..........................73
Figure 7-4 Future (2031) Intersection Peak Hourly Traffic Volumes - Omemee..................................74
Transportation Master Plan Municipal Master Plan Project City of Kawartha Lakes February 2012 Page vi
1-1: Provincial Policies - Transportation Systems and Corridors...............................................9
2.1: City Roadway Functional Classification................................................................................14
2.2: Lindsay Roadway Functional Classification.......... ............15
2-3: Daily Traffic – Lindsay...............................................................................................................20
2-4: Daily Traffic – Bobcaygeon............ ........................................21
2-5: Daily Traffic - Fenelon Falls......... .........................................22
2-6: Daily Traffic – Omemee............................................................................................................23
2-7: Existing (2009) Intersection Peak Hourly Traffic Volumes - Lindsay................................24
Figure
Figure
Figure
Figure
Figure
Figure
Figure
Figure
2-8: Existing (2009) Intersection Peak Hourly Traffic Volumes – Bobcaygeon.......................25
2-9: Existing (2009) Intersection Peak Hourly Traffic Volumes - Fenelon Falls......................26
2-10: Existing (2009) Intersection Peak Hourly Traffic Volumes – Omemee..........................27
2-11: Level of Service Descriptions........ ......................................31
Figure
2-12: Existing (2009) Intersection Level of Service – Lindsay.....................................................33
2-13: Existing (2009) Intersection Level of Service – Bobcaygeon.............................................34
Figure
2-14: Existing (2009) Intersection Level of Service - Fenelon Falls............................................35
2-15: Existing
Transportation Master Plan Municipal Master Plan Project City of Kawartha Lakes February 2012 Page vii Figure 7-5: Future (2031) Intersection Level of Service – Lindsay...........................................................75 Figure 7-6: Future (2031) Intersection Level of Service – Bobcaygeon...................................................76 Figure 7-7: Future (2031) Intersection Level of Service – Fenelon Falls.................................................77 Figure 7-8: Future (2031) Intersection Level of Service – Omemee........................................................78 Figure 9-1: Proposed City Roadway Functional Classification..................................................................88 Figure 9-2: Proposed Lindsay Roadway Functional Classification...........................................................89 Figure 9-3: Proposed Settlement Area Roadway Functional Classification.............................................90 Figure 9-4: Proposed Improvement Plan – Lindsay...................................................................................94 Figure 9-5: Proposed Improvement Plan – Bobcaygeon. .......................95 Figure 9-6: Proposed Improvement Plan - Fenelon Falls..........................................................................96 Figure 9-7: Proposed Improvement Plan - Omemee.................................................................................97 Figure 9-8: Share the Road Wayfinding Signage...... ...............................104 Figure 9-9: Walking to School Through the Year....................................................................................105
Transportation Master Plan Municipal Master Plan Project City of Kawartha Lakes February 2012 Page viii List of Tables Table 1-1: Transportation Solutions..............................................................................................................10 Table 2-1: Places of Work and Mode of Transportation (City of Kawartha Lakes).............................17 Table 2-2: Kawartha Lakes External Trip Distribution.............................................................................18 Table 2-3: Home-to-Work Daily Trips from Lindsay to Other Areas....................................................19 Table 2.4: Historical Seasonal Traffic Variation... ....................................29 Table 4-1: Total Work Trips....................... ................................................48 Table 5-1: Potential Urban By-Pass Route On-Road ORV Use Assessment.........................................58 Table 6-1: Settlement Area Parking Inventory.............................................................................................60 Table 6-2: Parking Occupancy Survey Sample........ ................................63 Table 6-3: Parking Occupancy Summary......................................................................................................65 Table 6-4: Future Parking Requirements.....................................................................................................66 Table 7-1: Residential Development Trip Generation ...........................69 Table 8-1: Evaluation Criteria.........................................................................................................................84 Table 8-2: Strategic Alternative Evaluation..................................................................................................85 Table 9-1: Right-of-Way Requirements............... ......................................87 Table 9-2: Timing of Improvements – Lindsay...........................................................................................93
List of Appendices
Appendix A – Study Terms of Reference
Appendix B – Study Area Photographs
Appendix C – Traffic Count Locations
Appendix D – Vehicle Composition Analysis
Appendix E – Collision Analysis
Appendix F – Existing Conditions Capacity and Level of Service Analysis
Appendix G – Future Conditions Capacity and Level of Service Analysis
Appendix H – Bibliography
Plan Municipal
Plan
City
February 2012 Page ix
Transportation Master
Master
Project
of Kawartha Lakes
Transportation Master Plan
Municipal Master Plan Project
City of Kawartha Lakes
List of Acronyms
Acronym Meaning
AADT Average Annual Daily Traffic
ASRTS Active and Safe Routes to School
ATR Automatic Recorder
ATV All-Terrain Vehicle
BIA Business Improvement Area
CKL City of Kawartha Lakes
DC Development Charge
EAA Environmental Assessment Act
EA Environmental Assessment
ESR Environmental Study Report
GMS Growth Management Strategy
GTA Greater Toronto Area
GTHA Greater Toronto and Hamilton Area
ITE Institute of Transportation Engineers
LOS Level of Service
MEA Municipal Engineers Association
MEV Million Entering Vehicles
MTO Ministry of Transportation Ontario
OFATV Ontario Federation of All-Terrain Vehicle
OTM Ontario Traffic Manual
PPS Provincial Policy Statement
RTP Regional Transportation Plan
SADT Summer Average Daily Traffic
TDM Transportation Demand Management
TMP Transportation Master Plan
ToR Terms of Reference
TSM Transportation System Management
TTS Transportation Tomorrow Survey
VRTC Victoria Rail Trail Corridor
February 2012
Page x
1.0 INTRODUCTION
The City of Kawartha Lakes has completed a Growth Management Strategy and Municipal Master Plan project to address the requirements of the Province of Ontario’s Places to Grow legislation and to establish a plan for major municipal infrastructure and to accommodate growth. Urban & Environmental Management Inc. (UEM) in conjunction with MHBC Planning Consultants Ltd. was retained by the City to undertake the project. There are four major components to the Growth Management Strategy and Municipal Master Plan project.
Growth Management Strategy
Municipal Servicing Assessment
Transportation Master Plan
Solid Waste Management Master Plan Update
A comprehensive public, stakeholder and agency consultation program was undertaken during the project. The results of the consultation program are documented in a separate Consultation Report.
This Transportation Master Plan was undertaken based on the Master Plan process for municipal projects as defined by the Municipal Engineers Association (MEA) Municipal Class Environmental Assessment (Class EA) process, which states:
“Master Plans are long-range plans which integrate infrastructure requirements for existing and future land use with environmental assessment planning principles. These plans examine an infrastructure system(s) or group of related projects in order to outline a framework for planning for subsequent projects and/or developments. At a minimum, Master Plans address Phase I and II of the Municipal Class EA process”.
1.1 Summary of the Results of the Growth Management Strategy
The completion of the City of Kawartha Lakes Growth Management Strategy (GMS) (June 2010) was the first component of the City’s Municipal Master Plan project. The Final Draft of the City’s GMS (June 2010) was endorsed by Council at it’s meeting of September 14th, 2010. Council adopted a balanced growth approach where population is primarily distributed among the four urban areas (Lindsay, Fenelon Falls, Bobcaygeon and Omemee) relative to their population with some limited growth in hamlets and rural areas as outlined in Scenario One in Section 6.4 of the City’s GMS (June 2010). The primary conclusions of the GMS are:
The City’s population is projected to grow to 100,000 by the year 2031
Growth projections are consistent with the Provincial Places to Grow legislation
Of the three land capacity scenarios considered for the Growth Management Strategy, Council endorsed an alternative intensification and Greenfield targets for the City of Kawartha Lakes as identified in the GMS. This growth entitled ‘Growth Achieving an Adjusted Density Target’ assumes the following:
o Intensification would meet an adjusted target of at least 30 percent of all new residential units locating within the built-up area after 2015;
o Greenfield development of residential lands would meet an adjusted density target of
Page 1
Transportation Master Plan Municipal Master Plan Project City of Kawartha Lakes February 2012
40 people and jobs per hectare; and
o Greenfield target within Employment Areas of 30 jobs per hectare.
The “Growth Achieving an Adjusted Density Target” growth scenario, as endorsed by Council, formed the basis for the Transportation Master Plan
Page 2
Transportation Master Plan Municipal Master Plan Project City of Kawartha Lakes February 2012
1.2 Municipal Class EA Process
The Municipal Class EA process applies to municipal infrastructure projects including roads, water and wastewater projects. For the City of Kawartha Lake’s Growth Management Strategy and Municipal Master Plan project, the water and wastewater infrastructure systems as well as the City’s transportation system are being evaluated using the MEA Class EA process. An update of the Solid Waste Management Master Plan is also being undertaken as part of this Municipal Master Plan process. Solid waste management however does not fall under the Municipal Class EA process. The Solid Waste Management Master Plan Update is being undertaken based on relevant waste management legislation.
There are five phases to the MEA Class EA process. At a minimum, Master Plans must address Phases I and II. The following outlines the five phases of the Municipal Class EA process. The bolded phases are the Master Plan phases, which are covered in this report.
I. Theidentificationoftheproblemoropportunity
II. The identification and evaluation of alternative solutions to address the problem or opportunity
III. The identification and evaluation of alternative design concepts for the preferred solution
IV. The completion of an Environmental Study Report (ESR)
V. Implementation
The City of Kawartha Lakes Municipal Master Plan project is being undertaken using ‘Approach #1’ as defined in Appendix 4 – Master Plans of the MEA Class EA document (October 2000, as amended 2007):
“This approach involves the preparation of a Master Plan document at the conclusion of Phases I and II of the Municipal Class EA process. The Master Plan document would be made available for public comment prior to being approved by the municipality.
Typically, the Master Plan would be done at a broad level of assessment thereby requiring more detailed investigations at the project-specific level in order to fulfill the Municipal Class EA documentation requirements for the specific Schedule B and C projects identified within the Master Plan.
The Master Plan would therefore become the basis for, and be used in support of, future investigations for the Specific Schedule B and C projects identified within it. Schedule B projects would require the filing of the project file for public review while Schedule C projects would have to fulfill Phases III and IV prior to filing an Environmental Study Report (ESR) for public review.”
Master Plans are subject to approval at the municipal-level. A Master Plan, however, does not require approval under the Environmental Assessment Act (EAA), unless conducted as an Individual EA. The City of Kawartha Lakes Growth Management Strategy and Municipal Master Plan Project is not an individual EA. However, any specific projects within a Master Plan must subsequently fulfill all appropriate Class EA requirements (or, individual EA requirements, where appropriate). Master
Transportation Master Plan Municipal
Plan Project City
February 2012 Page 3
Master
of Kawartha Lakes
Plans simply provide the framework for future decisions. Master Plans prepared under Approach #1 as outlined above are not subject to Part II order requests. Requests for an order to comply with Part II of the EA Act would be possible only for those projects identified in the Master Plan which are subject to a Municipal Class EA process. Under this approach, the Master Plan and the Notice of Study Completion are not required to include a statement about Part II order mechanisms.
1.3 Purpose
The results of this Transportation Master Plan will provide the input necessary to amend the City’s Official Plan and to administer specific components of the transportation system, including roads, goods movement, transit service, active transportation in the City, traffic control and parking. The Transportation Master Plan also indicates guiding policies in these areas including strategies to reduce reliance on single-occupant automobile travel in the City, access management, traffic control, development planning and safety.
1.4 Scope
This Transportation Master Plan is an integral component of the Municipal Master Plan project and has been completed in accordance with requirements of a Master Plan project as described above. Master Plans are broad in scope and usually involve analysis of a system in order to outline a framework for future works and developments. Master Plans are not typically undertaken to address a site specific problem.
Specific features that describe the scope of this Transportation Master Plan include:
It is a strategic level assessment of various options to better address overall system needs; potential impacts and mitigation are to be considered
A system-wide approach to planning is taken which relates infrastructure either geographically or by a particular function
The assessment has been integrated with other planning initiatives, including land use planning, growth management and servicing studies
Transportation requirements over the long term (to 2031) have been considered
A transportation infrastructure Master Plan is provided along with direction for the implementation timing of separate projects
A description of specific projects is provided in the transportation assessment
A range of alternatives are considered, including “Do Nothing”, implementing structural improvements only, and a more balanced alternative including structural (road improvements) and non-structural (alternative modes and transportation demand management) improvements
A number of planning principles have been incorporated in carrying out the Transportation Master Plan. While some of these principles relate to achievement of sustainability and healthy environment and urban structure in urban areas, they are also relevant to planning of rural municipalities that include urban areas.
Page 4
Transportation Master Plan Municipal Master Plan Project City of Kawartha Lakes February 2012
Transportation Master Plan
Municipal Master Plan Project
City of Kawartha Lakes
February 2012
These principles are described in the City’s initiative of Moving Forward to Implement Healthy Community Design (November 12, 2008); and from the Transportation Association of Canada’s New Vision for Urban Transportation (Ottawa 1993, Updated 2003). These Principals are: Moving Forward to Implement Healthy Community Design:
Creating more mobility choices and opportunities for people to have less dependency on their cars
Identifying creative approaches for Travel Demand Management (TDM) working with employers and with smart commuting practices
Considering alternative transit service strategies, including the use of shuttles and other transit, for service to the rural areas
Striving to improve transit connections within the City and to other communities
Considering cycling as a key consideration and preparing a Cycling and Pedestrian Master Plan
A New Vision for Urban Transportation:
Planning for increased densities and more mixed lane use
Promoting walking as the preferred mode for person trips
Increasing opportunities for cycling as an optional mode of travel
Providing higher quality transit service to increase its attractiveness relative to the private auto
Creating an environment in which automobiles can play a more balanced role
Planning parking supply and price to be in balance with walking, cycling and transit priorities
Improving the efficiency of urban goods distribution systems
Promoting inter-modal and inter-line connections
Promoting new technologies which improve urban mobility and help protect the environment
Optimizing the use of existing transportation systems to move people and goods
Designing and operating transportation systems which can be used by the physically challenged
Ensuring that urban transportation decisions protect and enhance the environment
Creating better ways to pay for future urban transportation systems
Page 5
1.5 Goals and Objectives
1.5.1 Goal
The goal of this Transportation Master Plan is to prepare a comprehensive transportation plan that will assist the City of Kawartha Lakes, through the identification of policies, guidelines, improvement recommendations and an implementation plan, to accommodate growth in a healthy and sustainable way, and to support the City’s goals to maintain a high quality of life in the future and provide for economic development throughout the City’s rural and urban areas.
1.5.2 Objectives
Provide a clear and concise study
Provide appropriate information to amend the Official Plan
Provide additional information required to conduct discussions concerning the long-term Transportation Plan with affected agencies, including the Ministry of Transportation and Metrolinx/GO Transit
Satisfy the requirements of the Master Planning Process and the Municipal Class EA Planning and Design Process, Phases I and II
Identify existing and future transportation deficiencies at a strategic level
Develop a transportation strategy that is integrated with the other components of the Growth Management Strategy and Municipal Master Plan project; can accommodate the projected growth to 2031 and beyond; is supportive of the current policies in the Official Plan; and incorporates the planning principles noted in the previous section
Increase the availability and attractiveness of other viable travel modes, including active transportation and transit
Update the functional classification of roads within the City
Prepare an Implementation Plan that is achievable and realistic for the City that embodies the planning principles noted above
1.6 Project Background
1.6.1 PlacestoGrowAct
The Growth Management Strategy and Municipal Master Plan project is being undertaken in conformance with the Places to Grow Act, 2005. The purposes of the Act are: to enable decisions about growth to be made in ways that sustain a robust economy, build strong communities and promote a healthy environment and a culture of conservation; to promote a rational and balanced approach to decisions about growth that builds on community priorities, strengths and opportunities and makes efficient use of infrastructure; to enable planning for growth in a manner that reflects a broad geographical perspective and is integrated across natural and municipal boundaries; and
Transportation Master Plan Municipal
Plan Project City of
February 2012 Page 6
Master
Kawartha Lakes
City of Kawartha Lakes February 2012
to ensure that a long-term vision and long-term goals guide decision-making about growth and provide for the co-ordination of growth policies among all levels of government.
The primary guidance of Places to Grow is to govern the growth rate and densities surrounding the Greater Toronto Area (GTA) and in the surrounding Greenbelt area to realize a population increase estimated by the Province. The Act essentially requires that a number of municipalities in Ontario review and if required, amend their Official Plan’s to update their vacant land inventories, population projections, municipal servicing plans, and development charge (DC) calculations where necessary.
The Places to Grow Act identified four urban settlement areas and eighteen Hamlet settlement areas in the City of Kawartha Lakes. The four growth areas are Lindsay, Omemee, Fenelon Falls and Bobcaygeon. The Province is directing that the City’s growth be focused in these growth areas.
1.6.2 Growthto2031
Population and employment growth projections have been completed as part of this Growth Management Strategy and Municipal Master Plan project by MHBC Planning in association with UEM. In accordance with the terms and conditions of this assignment, the year 2031 was used for determining population and employment growth. Therefore, this Transportation Master Plan is completed for the planning period ending in 2031.
1.6.3 ExistingLandUseInventory
Under the Growth Management Strategy component of the Municipal Master Plan project, the Provincial population projection for the municipalities outside the Greenbelt was reviewed for the City of Kawartha Lakes by municipal staff, MHBC and UEM. A detailed vacant land inventory analysis was completed for all the urban areas as well as the Hamlet areas. Drawings were also prepared for the City's long-term inventory and analysis purposes.
Population estimates were allocated to each of the existing settlement areas from the overall provincially-directed City of Kawartha Lakes growth rate. This was done by an estimated percentage increase of the existing population in each urban area relative to the vacant land inventory. Growth in the Hamlet areas was estimated based on vacant land as well as development potential considering servicing availability.
Land area sizes were examined relative to legislated and anticipated development densities. Development population growth was estimated for each urban area, and a total was calculated for the City to match the Provincial forecast.
1.7 Consultation Process
As part of the Growth Management Strategy and Municipal Master Plan project, an extensive public consultation process was undertaken including specific consultation in regard to the Transportation Master Plan. Details of the consultation process are included in the Consultation Report, a separate volume of this project submission.
Transportation Master Plan Municipal Master Plan Project
Page 7
1.8 Planning Policy Compliance
The City of Kawartha Lakes operates within a legislative framework established by the Province of Ontario and the Government of Canada. Two recent initiatives by the Ontario Government have direct bearing on this study, namely the Provincial Policy Statement (2005) and the Places to Grow Plan for the Greater Golden Horseshoe (2006).
The Places to Grow legislation requires a more comprehensive approach to planning. Places to Grow examines transportation relative to more intensive development and a shift away from travel in single occupant automobiles toward transit and active transportation modes (walking and cycling). This Transportation Master Plan provides a vision for a balanced, multi-modal transportation system that ensures that future growth in the City is sustainable in the context of Smart Growth Policies.
The Provincial Policy Statement (PPS) came into effect on March 1, 2005. This coincides with the effective date of Section 2 of the Strong Communities (Planning Amendment) Act, 2004, which requires that planning decisions on applications that are subject to the new PPS “shall be consistent with” the new policies. Section 1.6, Infrastructure and Public Service Facilities relates directly to this transportation planning assessment and is summarized in Figure1-1.
The Transportation Master Plan represents one component of the Municipal Master Plan and is conducted in a manner consistent with the Municipal Class EA Master Planning process and the development goals, objectives and constraints set by the City and the Province of Ontario. The range of solutions recognizes the goal of promoting transit and active transportation modes to reduce reliance on the private automobile for travel in and around the City. An implementation strategy is formulated that addresses the identified problems and deficiencies.
Transportation Master Plan Municipal Master Plan Project City of Kawartha Lakes February 2012 Page 8
1.6.5 Transportation Systems
1.6.5.1 Transportation systems should be provided which are safe, energy efficient, facilitate the movement of people and goods, and are appropriate to address projected needs.
1.6.5.2 Efficient use shall be made of existing and planned infrastructure
1.6.5.3 Connectivity within and among transportation systems and modes should be maintained and, where possible, improved including connections which cross jurisdictional boundaries.
1.6.5.4 A land use pattern, density and mix of uses should be promoted that minimizes the length and number of vehicle trips and supports the development of viable choices and plans for public transit and other alternative transportation modes, including commuter rail and bus.
1.6.5.5 Transportation and land use considerations shall be integrated at all stages of the planning process.
1.6.6 Transportation and Infrastructure Corridors
1.6.6.1 Planning authorities shall plan for and protect corridors and rights-of-way for transportation, transit and infrastructure facilities to meet current and projected needs.
1.6.6.2 Planning authorities shall not permit development in planned corridors that could preclude or negatively affect the use of the corridor for the purpose(s) for which it was identified.
1.6.6.3 The preservation and reuse of abandoned corridors for purposes that maintain the corridor’s integrity and continuous linear characteristics should be encouraged, wherever feasible.
1.6.6.4 When planning for corridors and rights-of-way for significant transportation and infrastructure facilities, consideration will be given to the significant resources in Section 2: Wise Use and Management of Resources.
Source:MunicipalAffairsandHousing, Provincial Policy Statement 2005,Toronto:QueensPrinter,2005,page12. A number of transportation solutions including structural (roadway network) and non-structural (transportation demand management) solutions are considered in this Transportation Master Plan. Examples of each type of solution are provided in Table1-1.
Transportation Master Plan Municipal Master Plan Project City of Kawartha Lakes February 2012 Page 9
Figure 1-1: Provincial Policies - Transportation Systems and Corridors
Transportation Master Plan Municipal Master Plan Project City of Kawartha Lakes
Solution
Table 1-1: Transportation Solutions
Description
February 2012
New roads
Widen roads (auto and cycle lanes)
Improve road geometry
Structural
Physical diversion of traffic
Operational improvements (traffic control)
Transit service improvement
Telecommuting
Ride-sharing
NonStructural
Flexible Work Hours (shift changes)
Parking supply and pricing
Road user fees
Land use type and density
1.9 Approach and Work Plan
The preparation of the Transportation Master Plan involved the collection and review of available transportation and traffic data, supplementing this data through additional traffic data collection, analysis and identification of transportation issues, forecasting and analysis of future travel demands, identification and evaluation of a range of transportation solutions, and formulation of a comprehensive plan and strategy for implementing the recommended solutions in an overall network context.
The Transportation Master Plan was prepared in accordance with a draft Terms of Reference for Part C of the Municipal Master Plan project, Transportation Assessment, prepared November, 2008 and subsequently revised in December, 2008. A copy of the revised Terms of Reference is included in AppendixA.
Page 10
2.0 EXISTING CONDITIONS
2.1 Road Network and Hierarchy
2.1.1 City-Wide
The City of KawarthaLakes is a single-tier municipality in east-central Ontario, Canada. Although designated as a ‘city’ much of the area is rural. The Ontario Municipal Partnership Fund (OMPF) uses a number of parameters to characterize municipalities and based on the 2010 key OMPF data inputs, the City of Kawartha Lakes has a rating of 74% in the Rural and Small Community Measure. This is significant as a rating of 75% is the threshold by which municipalities are designated as “rural” for OMPF funding purposes. The City of Kawartha Lakes is comprised of four urban settlement areas (Lindsay, Fenelon Falls, Bobcaygeon and Omemee), multiple Hamlets and other rural/seasonal residential areas. Travel within each of these areas, and between them is made possible by a road network consisting of various classes of roads serving different functions in terms of mobility and land access. These classes of roadways are referred to as the road hierarchy or the functional classification of the road network. Classification of a roadway, urban or rural, depends on many factors, including composition of traffic, type of development on adjacent lands, and the anticipated role that a given roadway is expected to play in the transportation system in serving overall mobility in and through the network and for land access. Classifications currently in use by the City are described in Section 25 of the City of Kawartha Lakes Official Plan (September 2010). The Official Plan recognizes Provincial Highways, Major Roads and Minor Roads, as described below.
(i) Provincial Highways – Provincial highways serve primarily a mobility function, moving large numbers of regional or inter-regional traffic in, through or around the City. All provincial highways located within the City fall under the jurisdiction of the Ministry of Transportation (MTO). The provincial highways generally have limited access to adjacent development and intersections with other roads that are more widely spaced. Highways can be either primary or secondary, depending on the degree of access and function within the highway network. As indicated in Section 25.7.1 of the City’s Official Plan:
“Highway’s 7, 7A, 35 and 115 provide a major means of access through the City linking it to other parts of the province. An extensive planning study is nearing completion for potentially providing a four lane divided Highway from the intersection on 35/115 to Highway 7 just south of Lindsay.”
The planning study referenced above is a provincial planning study being undertaken by the Ministry of Transportation (MTO).
As indicated in Section 25.7.4 of the City’s Official Plan:
“Provincial Highways will be identified with provision to expand to meet future needs through widening, realignment and creation of multiple lane controlled access highways.”
In this regard, MTO recently completed the Transportation Environmental Study Report (TESR) Highway 7 from KL Road 18 to KL Road 36 (W.P. 69-99-00) Preliminary Design and Class Environmental Assessment Study (June 2010). The Highway 7 planning study along the eastern boundary of the City for the section from Fowlers Corners southerly has also been completed with a four-laning plan. MTO has also determined the route of the extension of Highway 407 to link with Highway 115 south of the existing Highway
Transportation Master Plan Municipal Master Plan Project City of Kawartha Lakes February 2012 Page 11
(ii) MajorRoad(Arterial) – Arterial roads serve primarily a mobility function with limited degrees of access to adjacent land use. Intersections are still relatively widely spaced (300 – 400 metres), are used by commercial traffic and are generally main transit corridors. Arterials can be either two or four-lane roadways and accommodate a variety of users depending on their setting with urban arterials accommodating a variety of users including cyclists, vehicular traffic and pedestrians. Adjacent land uses may be residential, commercial, or industrial in nature. Truck routes typically follow these roadways. Subcategories of arterial roads, including major and minor arterials, are possible depending on the right-of-way availability, on- and off-road facilities that may be provided and the degree to which access to adjacent properties is controlled.
The arterial road classification is described in Section 25.6.4 of the City’s Official Plan:
“Arterial Roads provide for medium volumes of traffic. In rural areas, on the higher volume ones, a rightof-way of 26 metres will be required.”
(iii) Minor Road (Collector/Local) – Minor roads, including collectors and local roads generally serve, in the case of collector roads, a more balanced mobility and land access function, or in the case of local roads, a more predominant land access function. Collector and local roads can serve residential, agricultural, commercial and industrial land uses and related traffic. Larger commercial trucks are typically not permitted on these roadways.
The City’s Official Plan does not specifically identify a separate classification for collector or local roads. However, as indicated in Section 25.6.3 of the Official Plan:
“Local roads provide accesses to lots and serve low volumes of traffic and are generally 20 metres in width.”
And by Section 25.6.5
“There are a number of local roads that are maintained seasonally. The City will not encourage new development on these roads unless the new development contributes to upgrades to the road to bring it up to a year round municipal standard.”
The current City-wide transportation network classified according to these criteria is illustrated on Figure2-1
2.1.2 UrbanSettlementAreas
2.1.2.1 Lindsay
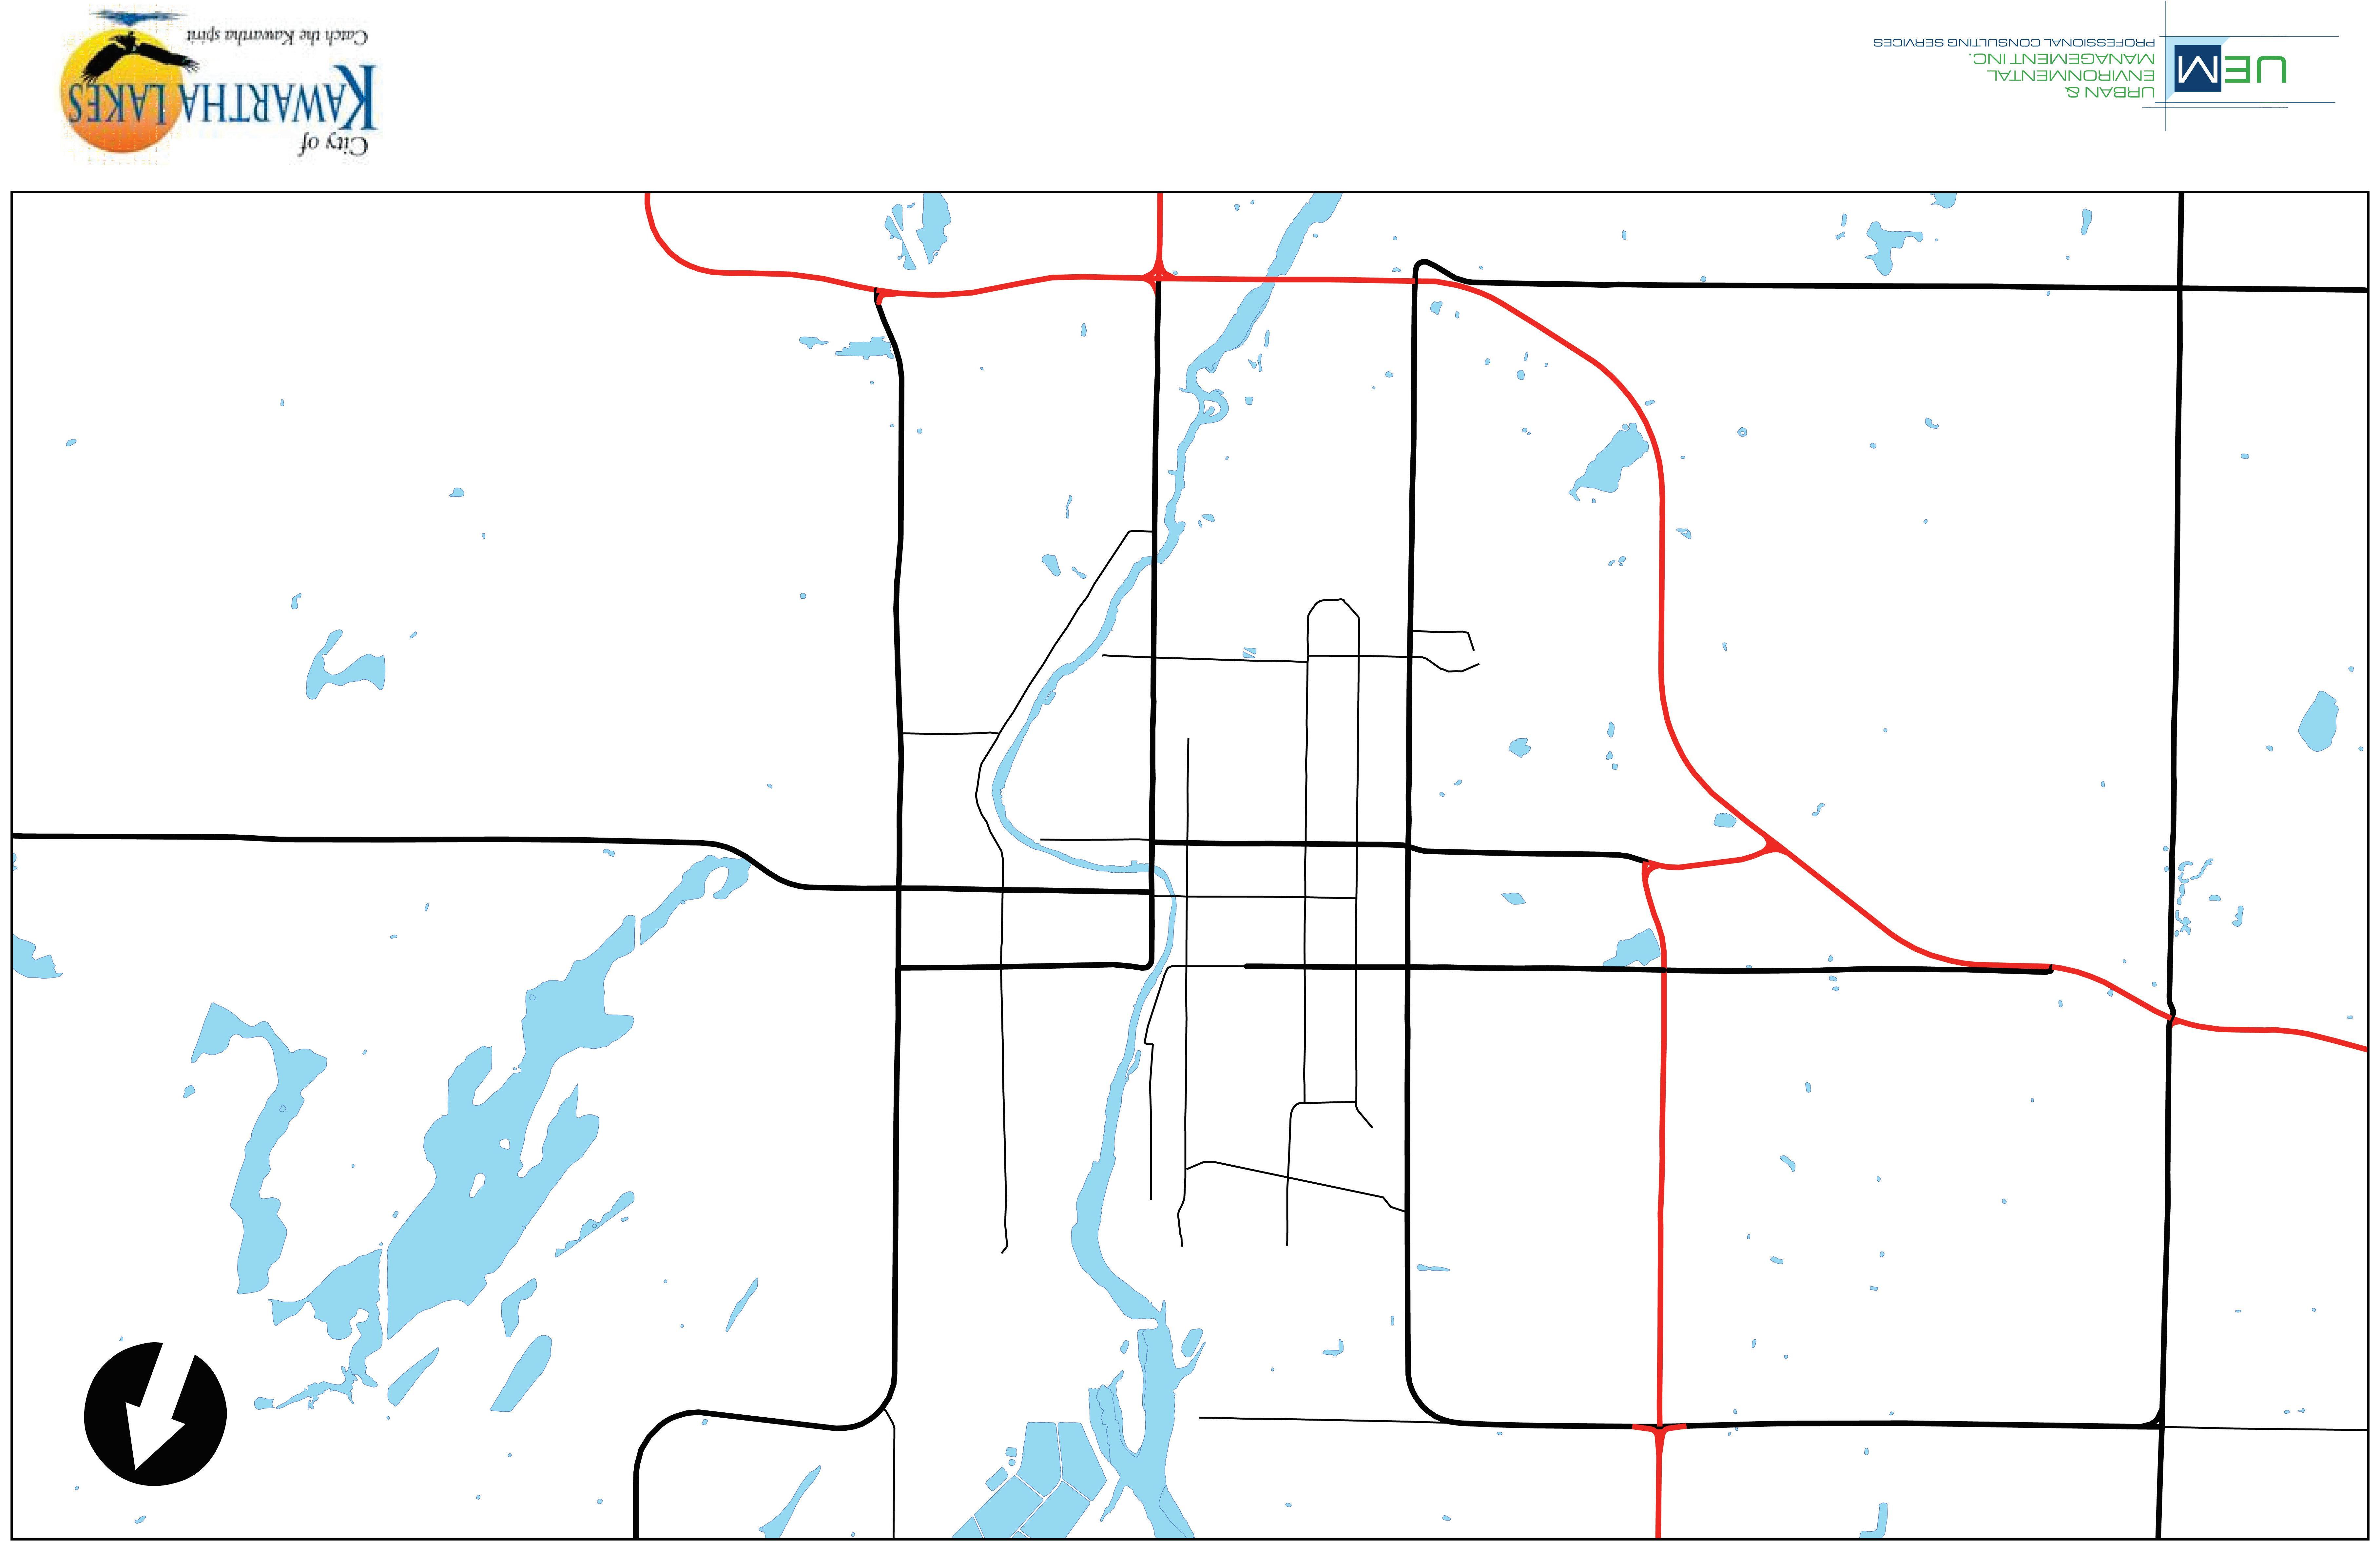
The Official Plan (OP) for the former Town of Lindsay (2000) has been maintained as a Secondary Plan to the City’s new Official Plan. The Lindsay OP (2000) provides a schedule illustrating the functional classification of roads within the Lindsay settlement area. As illustrated in Schedule ‘C’ of the Lindsay OP (2000), reproduced herein as Figure2-2, there is a hierarchy of roadways which was developed based on a relationship between land use and transportation. The roads are intended to be: “…compatible with the land use and promote and serve orderly growth. The roads also facilitate the safe and efficient movement of both people and goods to and from various land uses [land access] as well as traffic movement through Town [mobility].” The Lindsay OP goes on to describe that the public streets in Lindsay are to be classified on the basis of jurisdiction, function, traffic characteristics, speed and interconnections.
Transportation Master Plan Municipal Master Plan Project City of Kawartha Lakes February 2012 Page 12
115/35 intersection.
Provincial Highways – Highways under the jurisdiction of the Ministry of Transportation (MTO) are Highway 7 and Highway 35. The Ministry has jurisdiction over access to Highways 7 and 35 and development within the Ministry’s permit control area.
Former County Roads – The former County Road system within the urban settlement area of Lindsay, now all known as City of Kawartha Lakes (CKL) Roads, includes major roads such as CKL Road 4, 17, 19 and 36 and many other lesser former County Roads. These roadways serve the joint purpose of carrying moderate traffic volumes [mobility] as well as providing access to land. The City of Kawartha Lakes reviews and approves access to the former County Roads and determines the adequacy of sight distance and minimization of the number of individual accesses to ensure the integrity and safety of these roads. The minimum right-of-way for former County Roads is 26 metres. Due to unavoidable circumstances the right-of-way may be less than the minimum 26 metres.
Arterial Roads – Arterial roads are designed to carry high volumes of traffic between Provincial highways , the former County Roads, collector and local roads. Access to abutting properties is based on meeting sight distance criteria and avoidance of providing multiple individual access points. The minimum right-of-way width is 26 metres.
Collector Roads – Collector roads are designed to fulfill a dual function of connecting and carrying moderate volumes of traffic [mobility] to arterial roads and distributing traffic to local roads while providing access to abutting property [land access]. On-street parking may be permitted, with some restriction. The minimum right-of-way width is 26 metres (where possible).
Local Roads – the remaining roads are classified as local roads. These are two-lane roads with a minimum right-of-way width of 20 metres and are designed solely to provide access to adjacent property. Through traffic is discouraged from using these roads through application of appropriate traffic calming measures (geometric design features and traffic control) and vehicle load restrictions
Plan Municipal
Page 13
Transportation Master
Master Plan Project City of Kawartha Lakes February 2012

! ! ! ! ! ! ! ( ! ! ( H G H W A Y 3 5 MONC K RD C K L R D 1 2 1 K R K F I E L D R D CKL RD 36 E L D O N R D HIGHWAY 7 C K L R D 4 6 CKL RD 8 F E N E L R D E L M T R E E R D PIGEON LAKE R D V C T O R I A R D S T U R G E O N R D CKL RD 24 LITTLE BRITIAN RD RAMSEY RD C K L R D 4 9 GLENARM RD WOODVILLE RD CKLRD48 PORTAGE RD BASE LINE RD P O R T E R R D HIGHWAY115 CAMBRAY RD BURYS GREEN RD S K I H I L L R D K L L A R N E Y B A Y R D C K L R D 2 6 C A M E R O N R D S M C O E S T PONTYPOOL RD C K L R D 4 1 CKL RD 30 MOUNT HOREB RD E M L Y P A R K R D HIGHWAY 7A YANKEE LINE H G H W A Y 3 6 J A N E T V L L E R D BOUNDARY RD C E N T R E L I N E R D PEACE RD GOLF COURSE RD S A D O W A R D KENT ST W CONCESSION RD 6 HIGHWAY 7 & 35 C H S H O L M T R A L BRECHINRD LON G BEACH RD O G E M A H R D T H U R S T O N A R D M A R A C A R D E N B O U N D A R Y R D S T M A R Y S R D B U R N T R I V E R R D P L E A S A N T P O N T R D CONCESSION RD 7 E A S T S T S FRANCISSTE V A L E N T I A R D HIGHWAY 7A C K L R D 4 6 CKL RD 48 CKL RD 8 S M C O E S T H G H W A Y 3 5 C K L R D 4 9 H I G H W A Y 7 HIGHWAY115 C K L R D 4 9 GLENARM RD C K L R D 1 2 1 SKIHILLRD S I M C O E S T [ City Roadway Functional Classification Pro ect on UTM NAD83 Zone 17N Source: Ontar o Road Network Date: 20 May 2009 Figure 2-1 Prov inc ial Highway Arterial Roads Collector / Local Roads Legend Woodville Bobcaygeon Lindsay Omemee Bethany Pontypool Fenelon Falls Kinmount
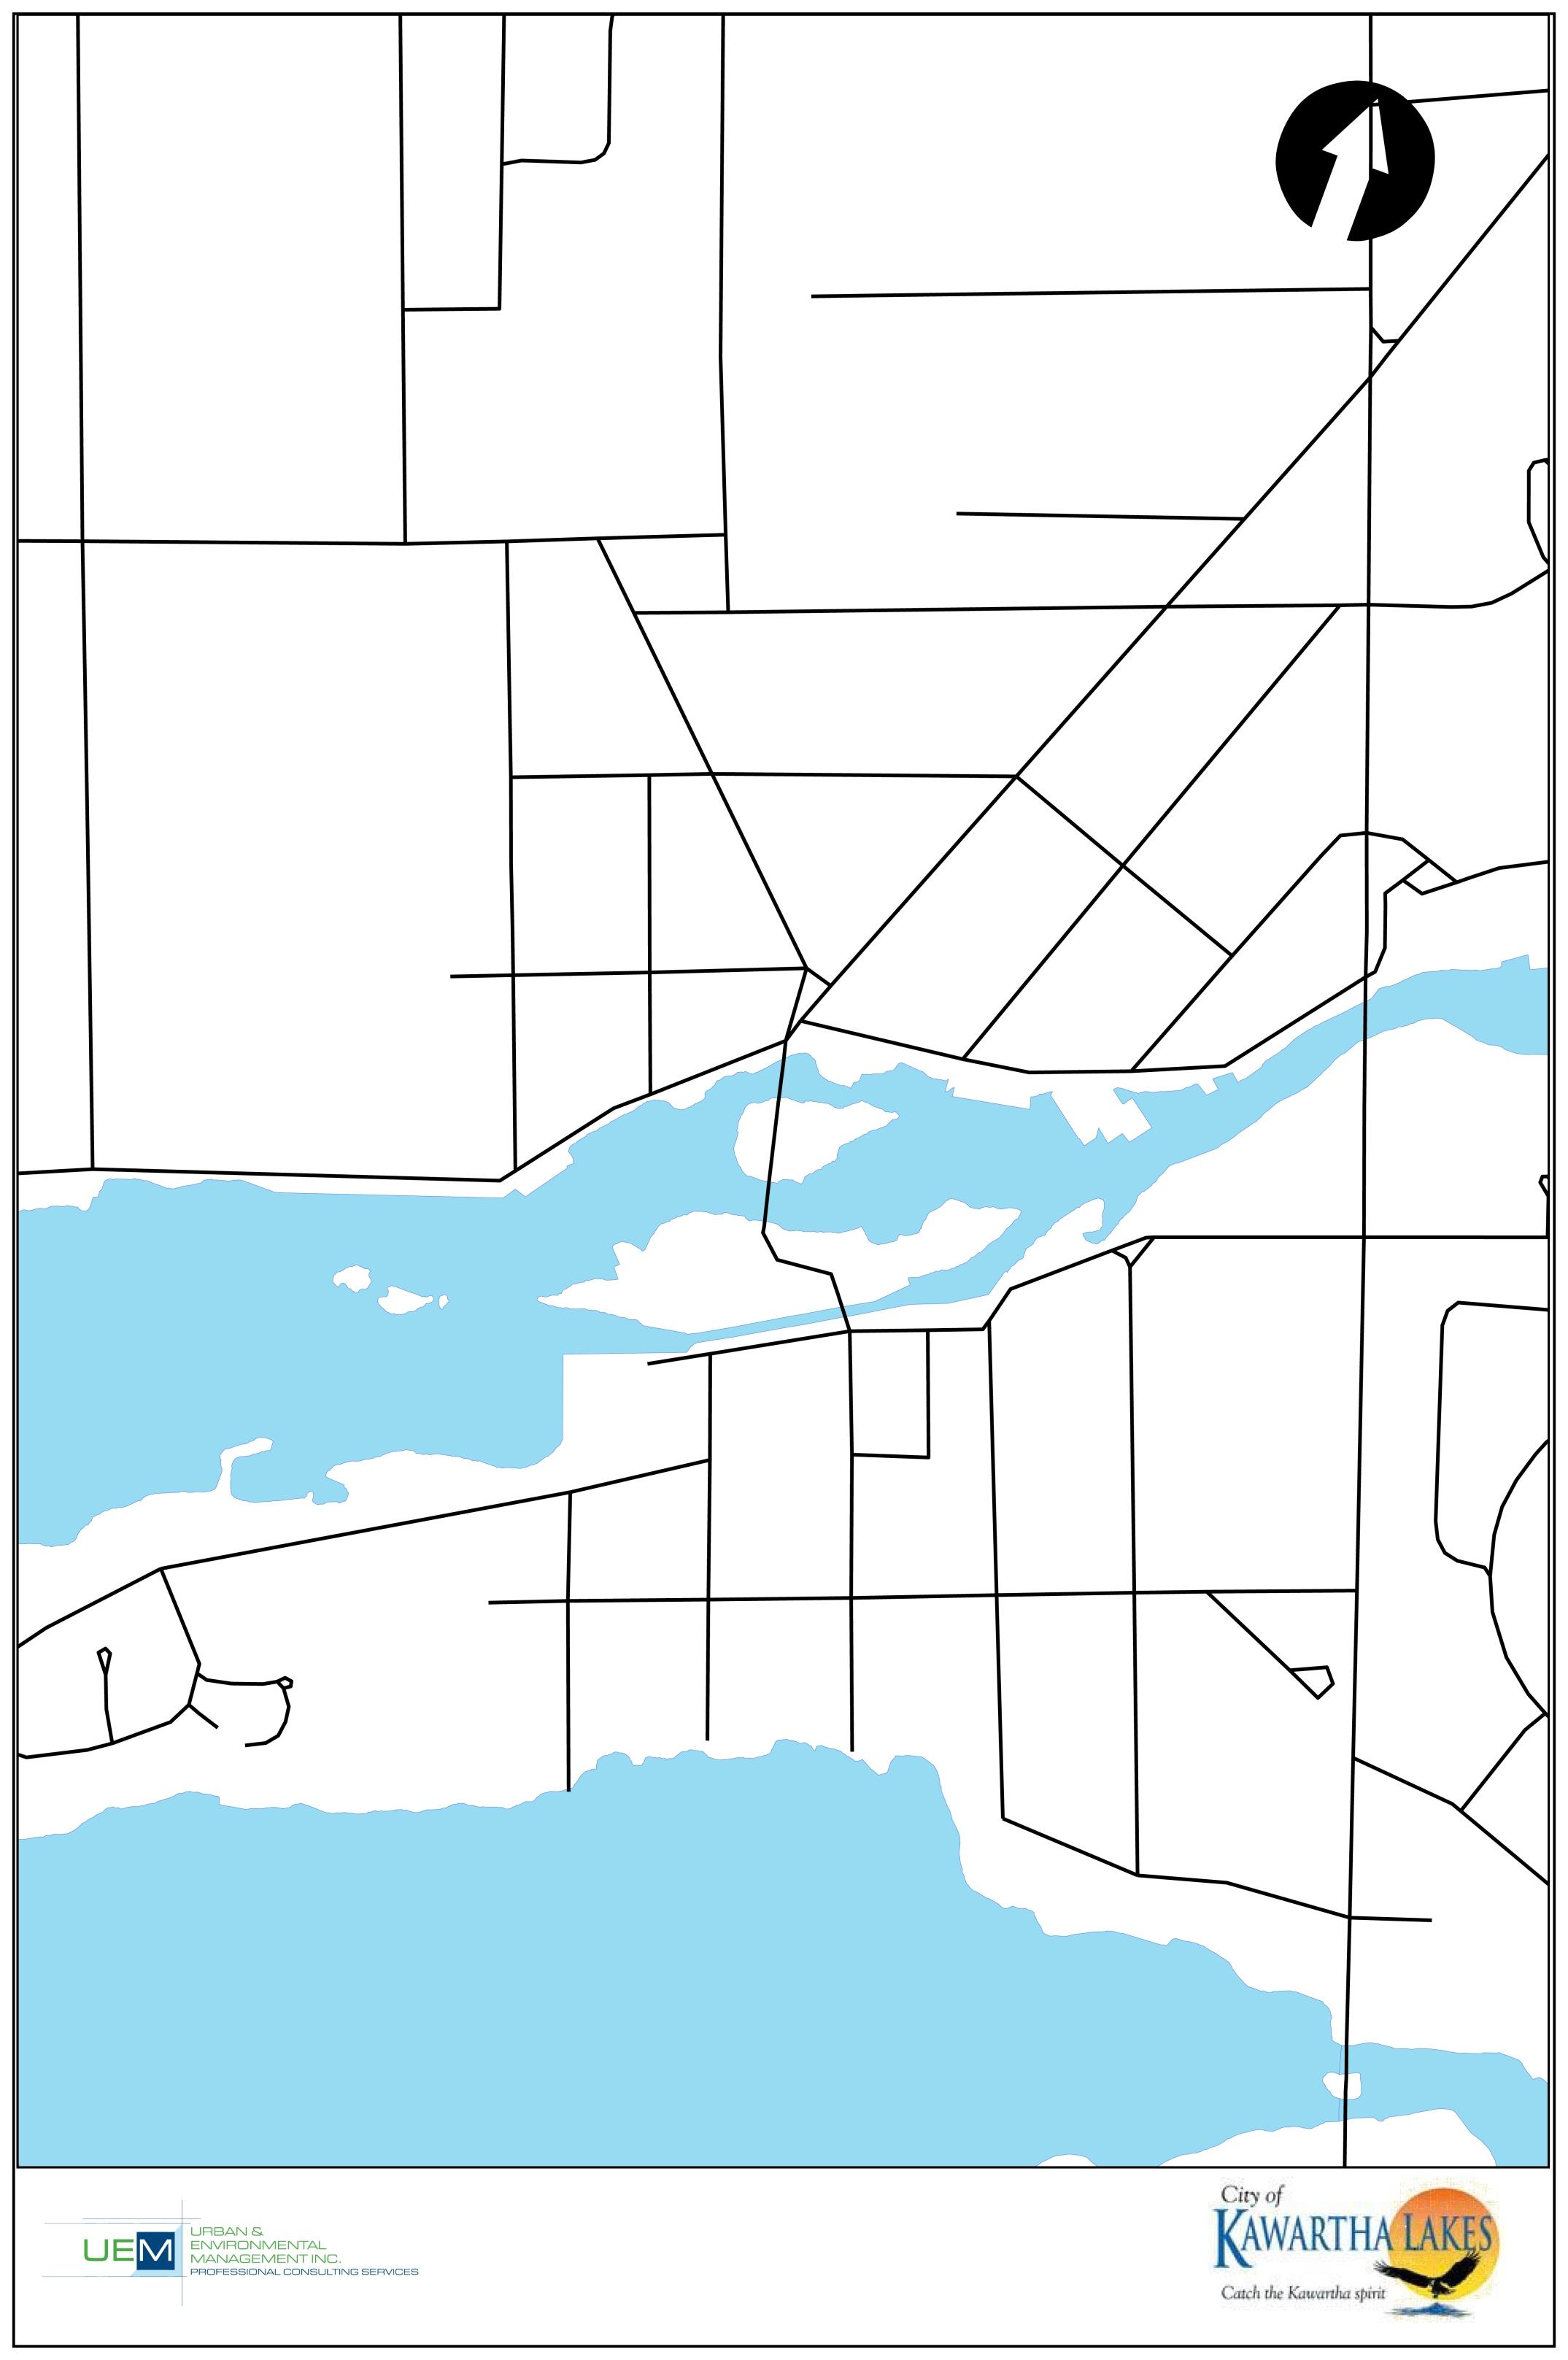
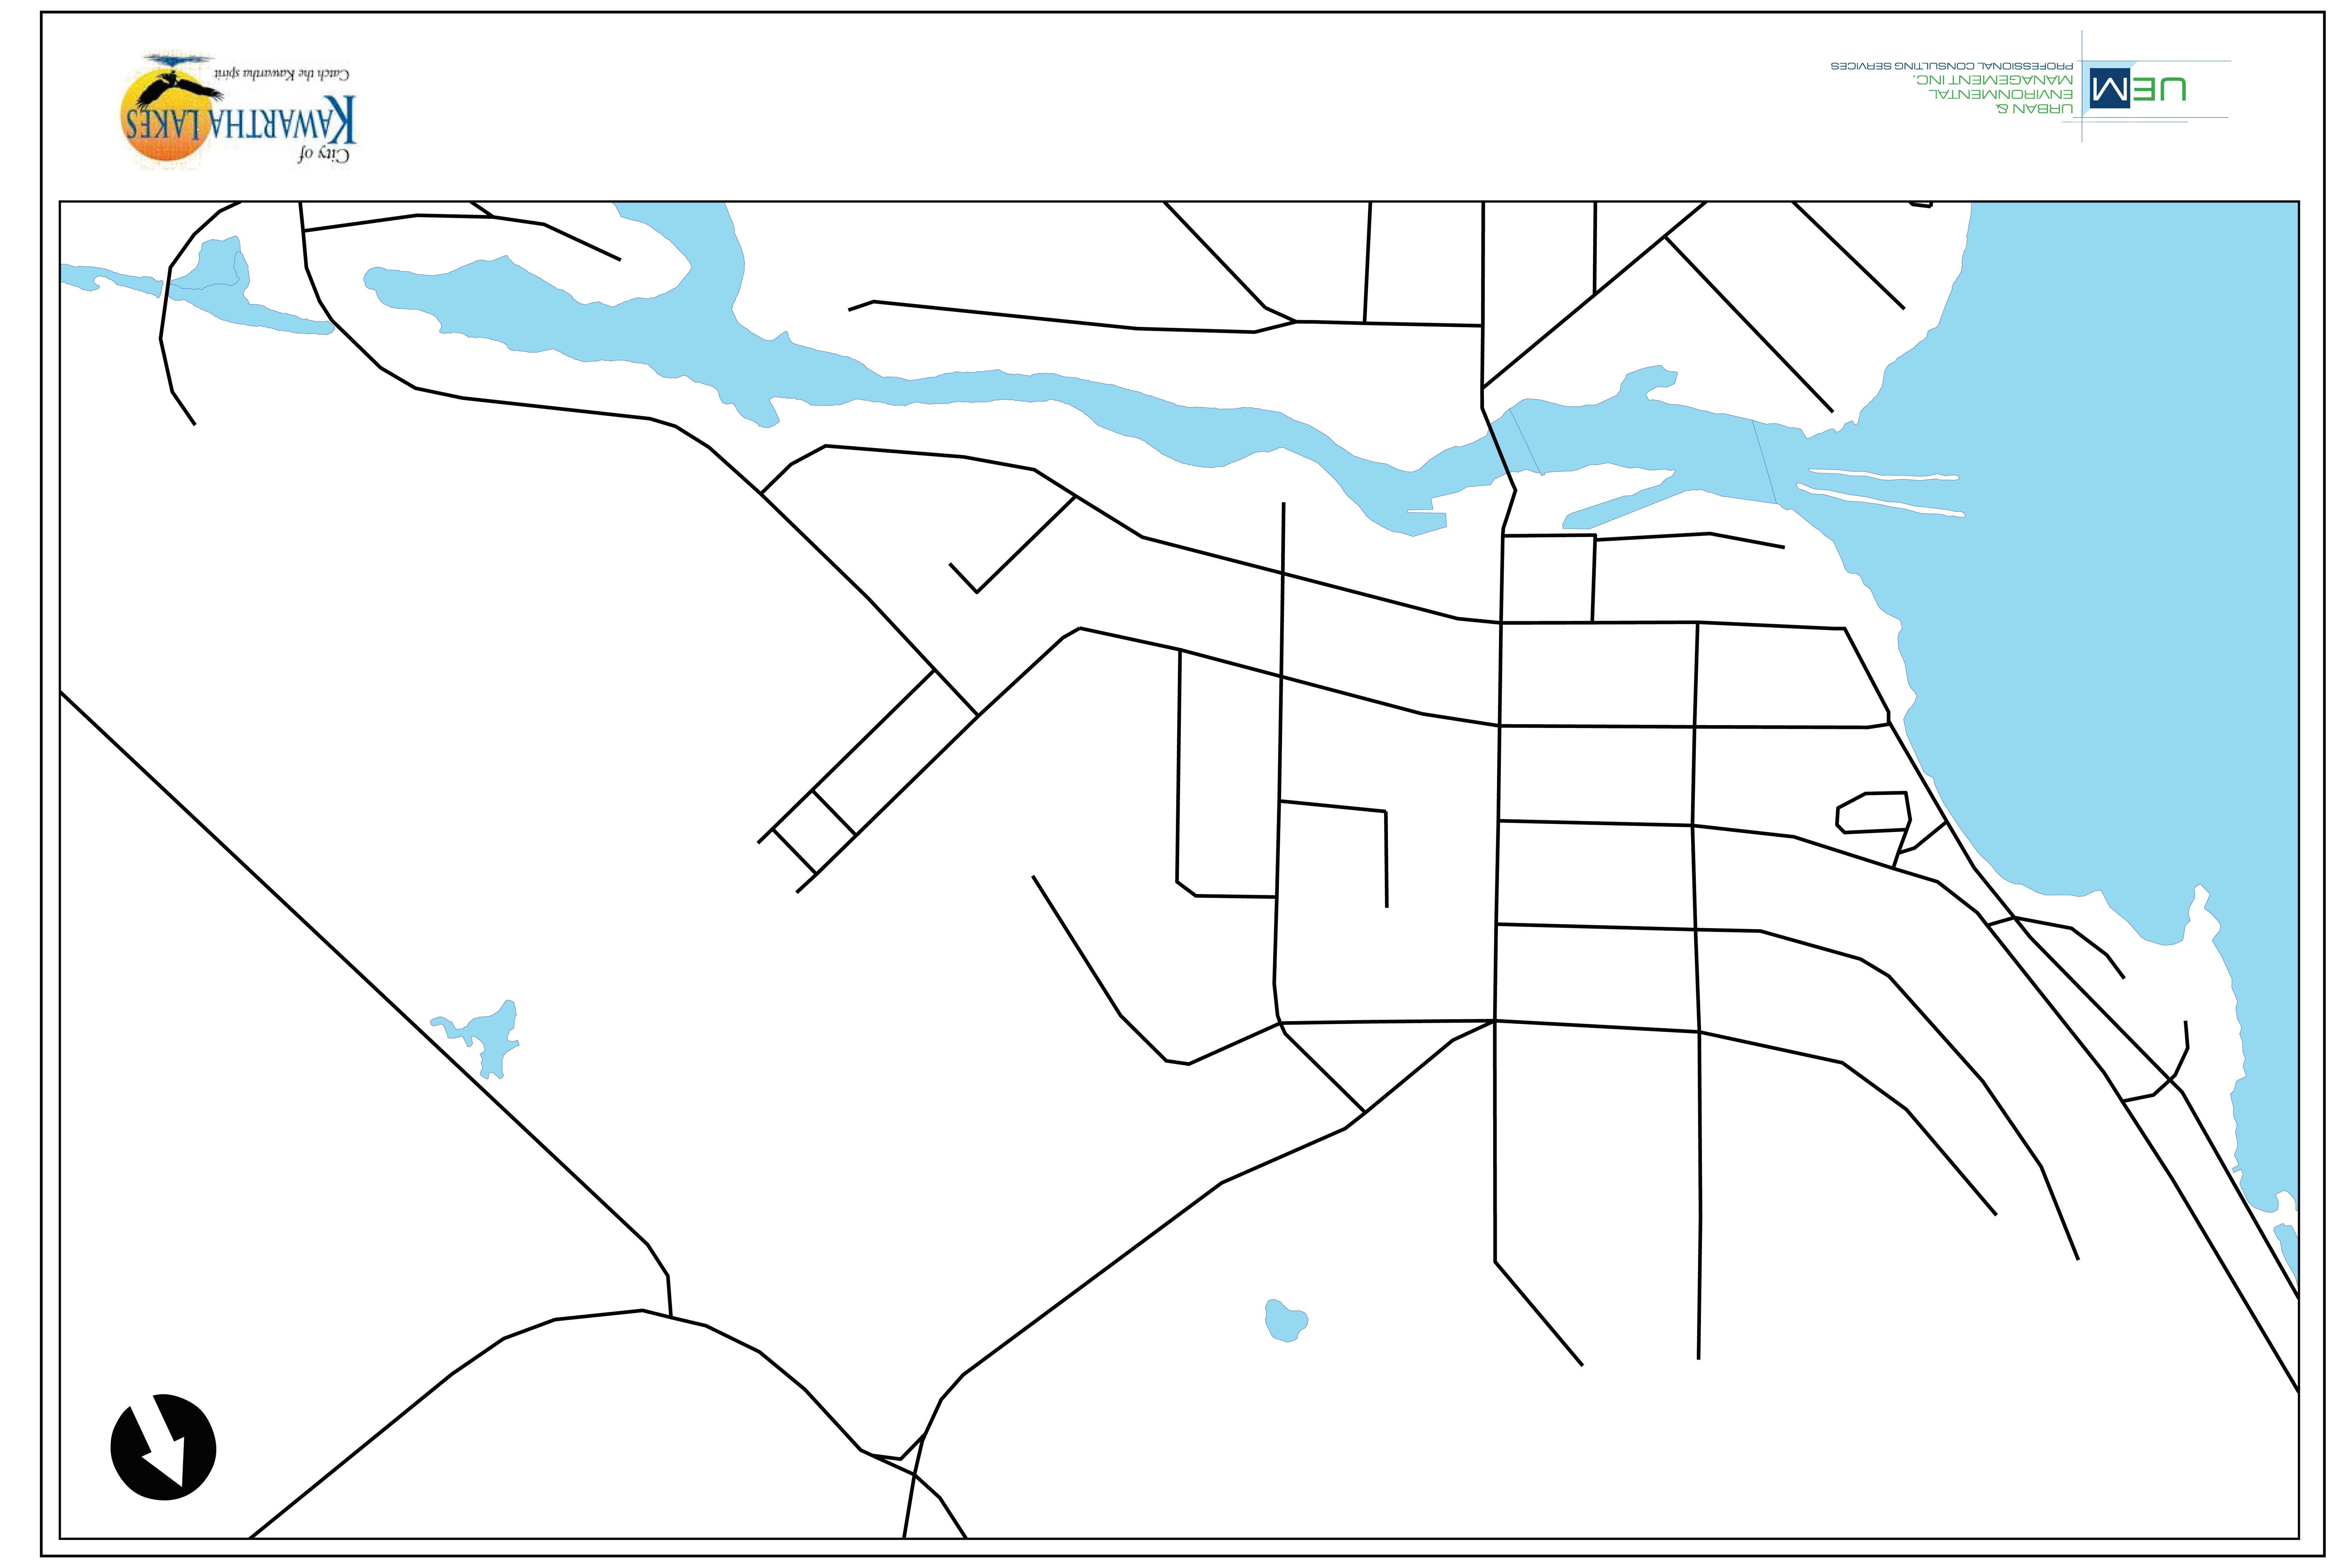
Source :Town of Lindsay Official Plan (2000)

Figure 2-2
Lindsay Roadway Functional Classification
2.1.2.2 Bobcaygeon
The City’s new Official Plan recommends that a secondary plan be prepared for the urban settlement area of Bobcaygeon. The transportation plan for this community is not identified separately in the City’s Official Plan, however, major roads within Bobcaygeon are CKL Road 36 which runs north to south along the east side of the community; and CKL Road 49 which starts in the north part of Bobcaygeon and leads north out of the community. CKL Road 8 starts in the north part of Bobcaygeon at CKL Road 36 and runs west out of the community. CKL Road 24 starts in Bobcaygeon at CKL Road 36 then runs east west across Bobcaygeon over the trent severn waterway and along the south side of Sturgeon Lake.
2.1.2.3 Fenelon Falls
The Official Plan for the former Village of Fenelon Falls (1989) has been maintained as a Secondary Plan to the City’s new Official Plan. The transportation plan for this community is not identified separately in the Official Plan, however, CKL Road 8 runs through Fenelon Falls from the south and exits to the east. CKL Road 121 enters from the west, merges with CKL Road 8 while passing through the downtown area of Fenelon Falls and then exiting northeast. CKL Road 22 Francis St. starts at Cameron Lake and runs south along the Trent Severn waterway canal.
2.1.2.4 Omemee
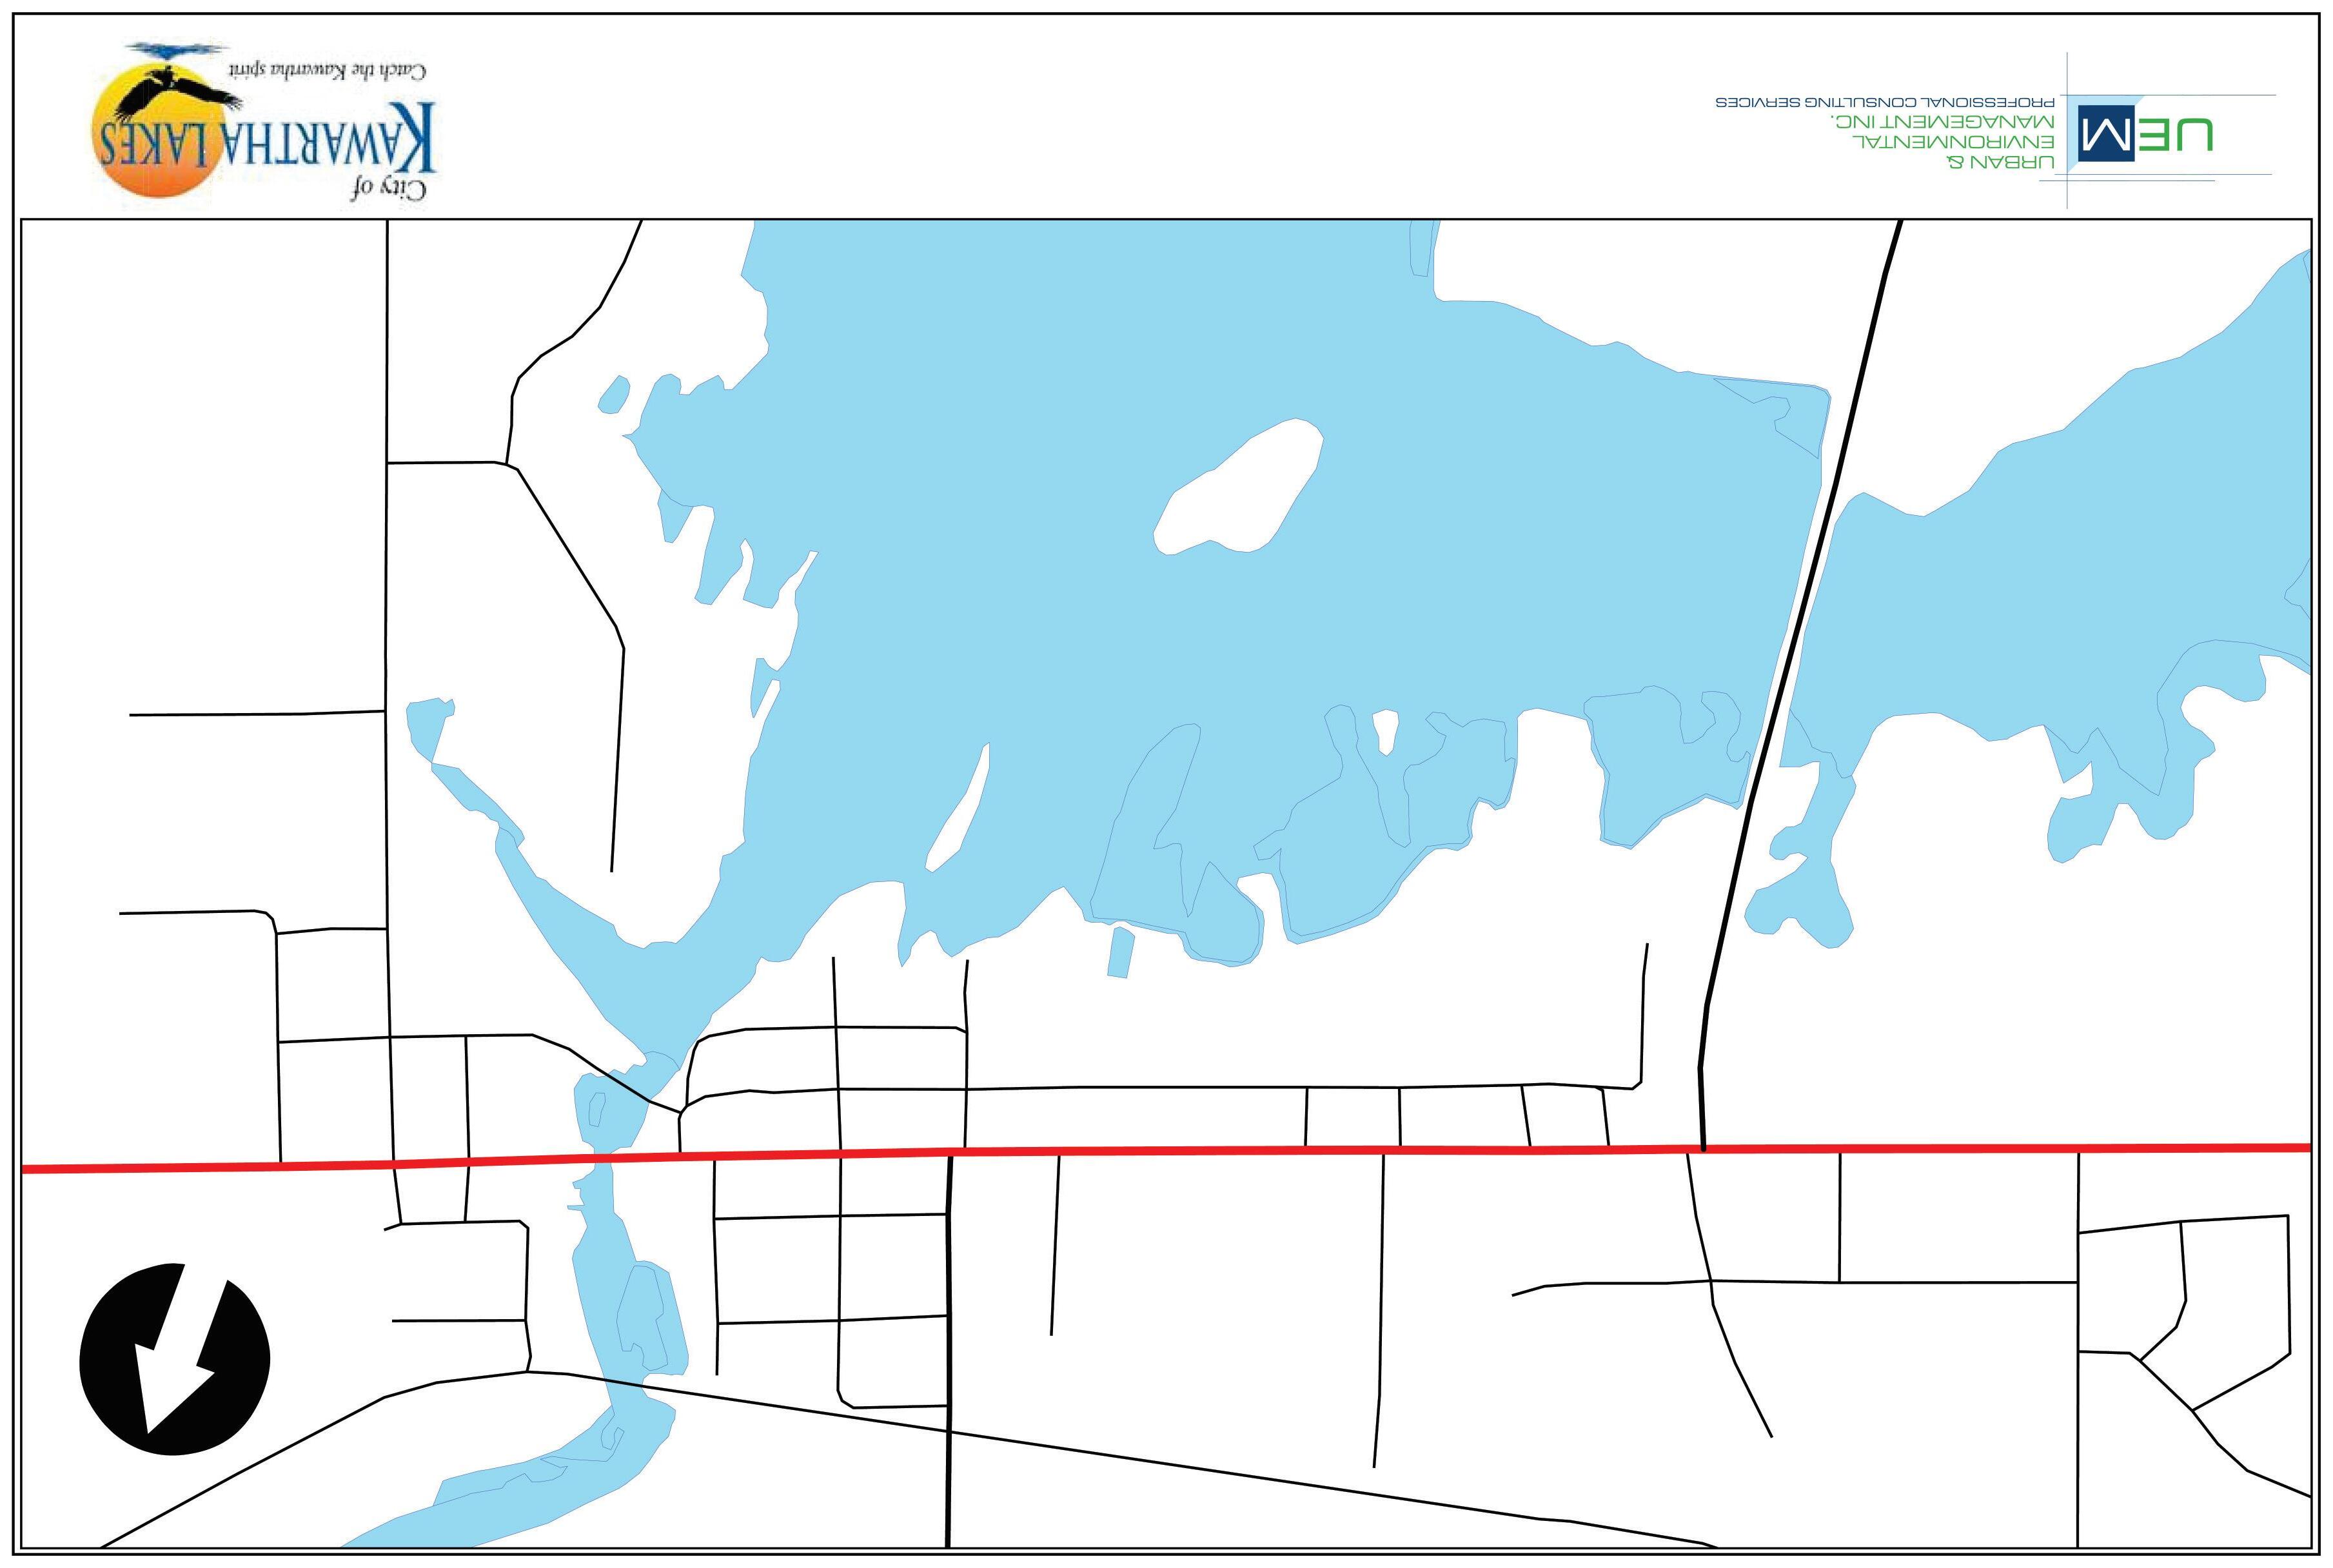
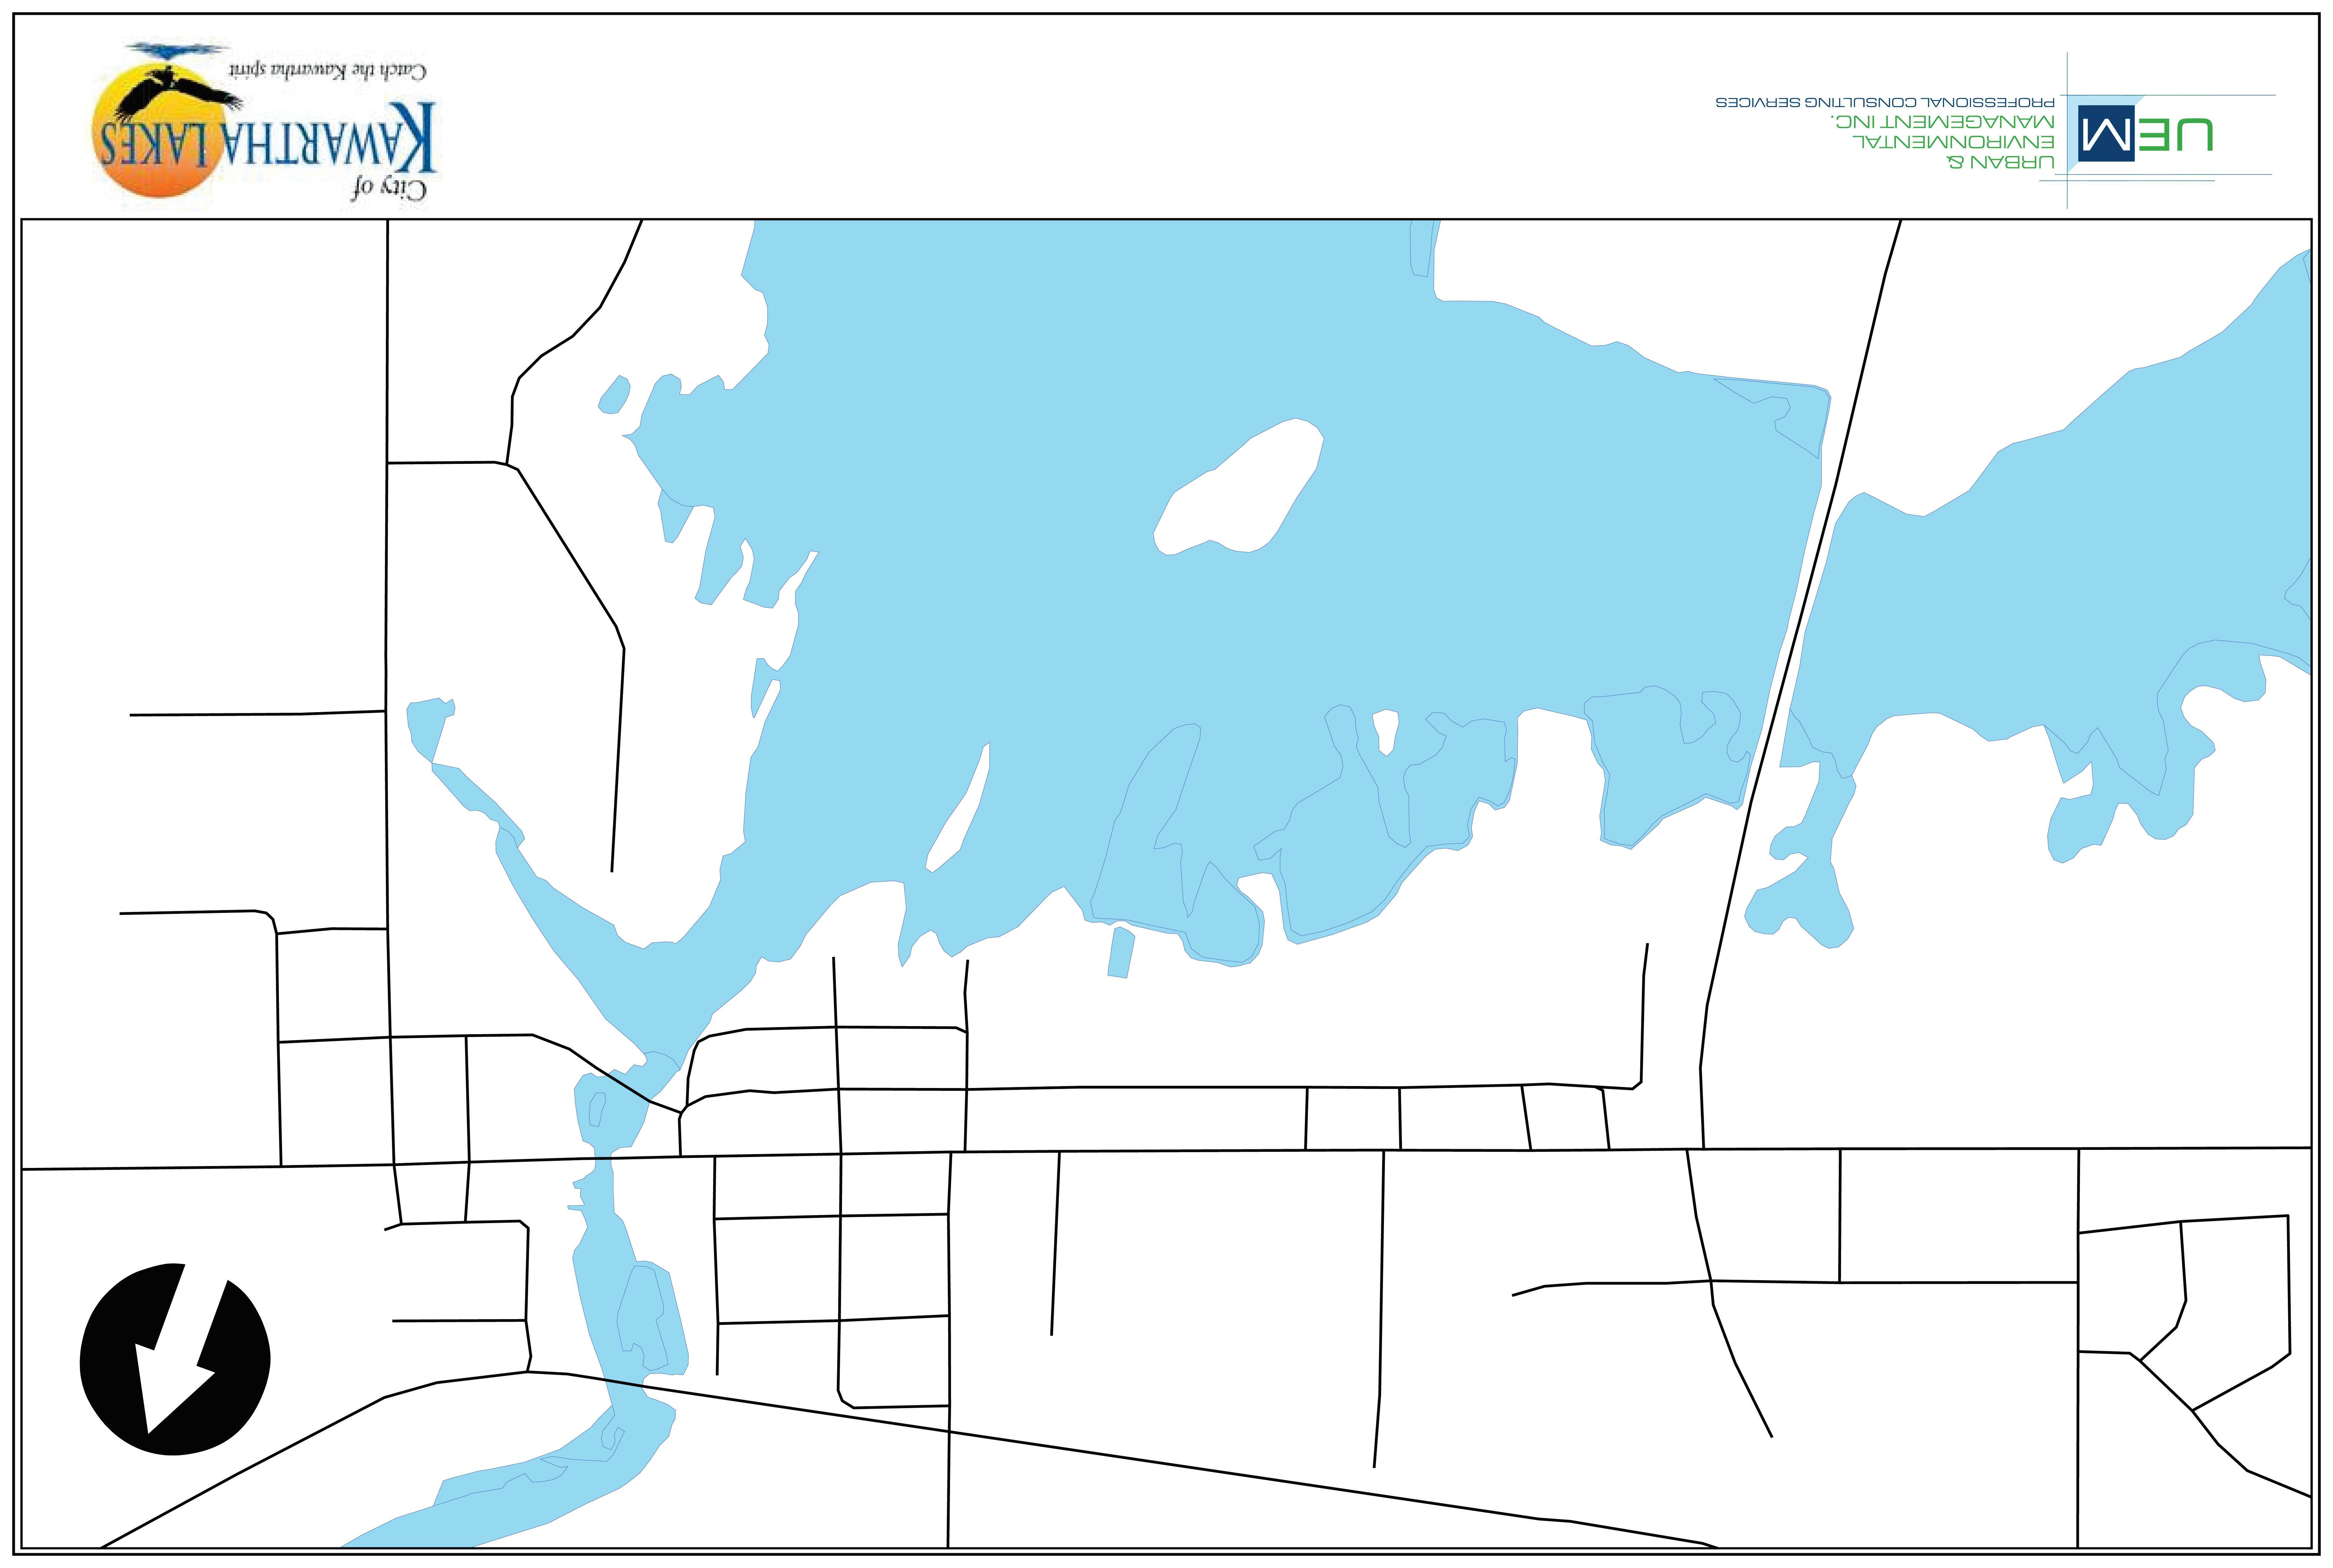
The City’s new Official Plan recommends that a secondary plan be prepared for the urban settlement area of Omemee. The transportation plan for Omemee is not identified separately in the City’s Official Plan; however, Highway 7 (King Street). traverses Omemee from east to west. Service to the north is provided along CKL Road 7 (Sturgeon Road) starting at Highway 7 and provides service to the north. CKL Road 38 Ski Hill Road starts at Highway 7 King Street and provides service to the south. The section of Highway 7 within Omemee is designated as a ‘connecting link’ and improvement to this section is subject to agreement between the City and MTO and may be cost sharable based upon approval of the City’s annual application for connecting link funding.
2.2 Current Capital Improvement Plan
The City of Kawartha Lakes has short-term and long-term transportation improvements identified in its Capital Improvement Plan. In the short term, the 2011 capital budget includes $13,213,682 dedicated to transportation infrastructure. This amount includes $1,395,548 for bridge related rehabilitation, $9,840,226 for reconstruction and road maintenance and $76,300 for traffic improvements.
The August 31, 2009 Development Charge and Background Study identifies a need within the 2009-2021 time frame for $40,580,000 to be spent on reconstruction and road maintenance including Colborne Street road reconstruction; $8,948,000 allocated to bridge related rehabilitation mainly at the Scugog River crossing; and the King Street bridge rehabilitation (Omemee). Also included is bridge reconstruction on CKL 24 Bobcaygeon, Morton Lane, and Fingerboard Road; $2,650,000 for intersection improvements at Mary Street and Lindsay Street, Durham Road and Lindsay Street, Colborne and Angeline Street; and other for general intersection improvements.
Transportation Master Plan Municipal Master Plan Project City of Kawartha Lakes February 2012 Page 16
2.3 Traffic Characteristics/Existing Conditions
A detailed analysis of existing conditions was undertaken to identify existing traffic characteristics and patterns, current levels of service, and operational and safety problems. This involved an initial review of the available traffic data provided by the City to determine relevant characteristics; identification of areas where additional traffic information would be required to either augment or update the available information; confirmation of existing conditions in the field, including a site visit to confirm intersection configuration, documenting intersection geometrics and creation of a photo log of selected locations within the study area (see AppendixB); and collection of additional traffic data to augment and update the available information. A comprehensive turning movement and automatic recorder (ATR) count program was completed in 2009 for this study at the locations illustrated in AppendixC to supplement the traffic information provided by the City.
2.3.1 TravelPatterns
Information on travel patterns in and around the City of Kawartha Lakes was extracted from the 2006 census data1. Specifically, the Place of Work and Mode of Transportation for the City were compared to similar statistics for Ontario as a whole. Table2-1 summarizes this comparison.
Approximately 66 percent of the 2006 employed labour force in Kawartha Lakes travels to work in the City. Approximately 33 percent of the employed labour force travels outside the City to work. This split is reasonably close to the Provincial average of 72/28 percent, respectively. The Growth
Municipal
City
February
Page 17
Transportation Master Plan
Master Plan Project
of Kawartha Lakes
2012
City Province Place/Mode Employment Share Employment Share PlaceofWork Total Employment 35,420 1.00 5,690,955 1.00 Work in Kawartha Lakes 23,530 0.66 4,089,050 0.72 Work outside Kawartha Lakes 11,790 0.33 1,601,905 0.28 Mode Auto as driver 25,995 0.83 4,038,035 0.71 Auto as passenger 2,880 0.09 470,410 0.08 Transit 225 0.01 736,060 0.13 Walked or Cycled 1,910 0.06 389,105 0.07 Other modes 345 0.01 57,350 0.01
Table 2-1: Places of Work and Mode of Transportation (City of Kawartha Lakes)
Source:StatisticsCanada, City of Kawartha Lakes Community Profile,2006
1 StatisticsCanada, City of Kawartha Lakes Community Profile,2006
Management Study found that from 1996 to 2006, the trend has been for an increasing amount of the total employed labour force working within the City.
In the City of Kawartha Lakes, approximately 92 percent of the employed labour force travels to work by automobile. Approximately 1 percent of the employee labour force use transit, 6 percent either walked or cycled to work, and 1 percent traveled by other modes. This compares to the Provincial average of approximately 79 percent of trips by automobile, 13 percent by transit, 7 percent by walking or cycling, and 1 percent by other modes.
Travel in the City appears to be focused more on the automobile relative to the overall Provincial pattern. Travel using transit is substantially lower than the Provincial average, while travel using active modes (walking and cycling) is roughly comparable to the Provincial pattern.
A significant proportion of travel (approximately 33 percent) is to areas external to the City. The Provincial highway and former CKL Roads form important linkages for City residents travelling to/from these external areas.
Based on the 2006 Transportation Tomorrow Survey (TTS) data, approximately 66 percent of work trips by residents of Kawartha Lakes remain in Kawartha Lakes, with 34 percent to external destinations, including 14 percent of external work trips to the south Durham Region and Toronto, 10 percent are made to north Durham and York Region, and approximately 7 percent are made to Peterborough. The distribution of external work trips is shown in Table2-2.
Source: 2006 Transportation Tomorrow Survey (TTS) Home to Work Travel Data
The City has a dispersed form of development, with rural areas and urban settlements throughout. The linkages between these areas form an integral component of the inter-City transportation network, using Provincial highways or City of Kawartha Lakes (CKL) Roads. Based on the 2006 TTS travel data, an analysis of home-to-work trips from Lindsay to other areas provides an indication of the internal distribution of trips between the settlement areas. This pattern is summarized in Table 2-3.
Based on these characteristics, and the seasonal tourism traffic to the area, the linkages between the
Plan Municipal
Page 18
Transportation Master
Master Plan Project City of Kawartha Lakes February 2012
Location PercentofTrips Kawartha Lakes 59% Toronto 3% North Durham 6% South Durham 11% York 4% City of Peterborough 6% County of Peterborough 1% Other 3% No usual Place of work 6% Total 100%
Table 2-2: Kawartha Lakes External Trip Distribution
settlement areas, either by road or transit play an important role in the economic vitality of the City. Linkages between Lindsay and the surrounding settlements and rural areas will continue to play a major role in inter-City mobility. “Through trips” are trips that do not start or end within the City’s limits. The City of Kawartha Lakes experiences a high number of through trips due to the City’s geographic location between the Greater Toronto Area and construction aggregate sources as well as “cottage country” areas located north east of the City’s limits.
Source: 2006 Transportation Tomorrow Survey (TTS) Home to Work Travel Data
2.4 Volumes and Vehicle Classifications
An understanding of the amount and pattern of traffic using a roadway as well as the types of vehicles using the roads in terms of the various classes of vehicles (trucks, buses, recreational vehicles and bicycles) is necessary to understand the traffic demand characteristics and the function being served by each facility. This information is also essential to forecasting future traffic conditions and building a properly calibrated model to analyze traffic capacity and level of service on existing and future road networks.
2.4.1 Volumes
The existing traffic volumes on City roads were summarized in terms of peak hourly traffic movements at selected intersections and daily traffic volumes for selected roadway corridors. The available historical count information was adjusted to a common base year (2009) to compare with traffic data collected in this study. These volumes are summarized on Figure 2-3 to Figure 2-6 inclusive (corridor volumes) and Figure 2-7 to Figure 2-10 inclusive (intersection volumes). Generally, the peak hour traffic volume is approximately 10 percent of the daily traffic volume and this relationship has been used to obtain estimates for the daily traffic volumes from hourly data and vice versa.
Municipal
February
Page 19
Transportation Master Plan
Master Plan Project City of Kawartha Lakes
2012
Location TTSZone(s) No.of Trips Percentage ofTrips Lindsay to Fenelon Falls 8706 415 1% Lindsay to Bobcaygeon 8707,8713 345 1% Lindsay to Omemee 8714,8715 311 1% Within Lindsay 8709,8710,8711,8712 18,581 62% To Other Areas Inside Kawartha Lakes 8708,8701,8702,8703,8704, 8705,8708,8716,8717 1210 4% To Other Areas Outside of Kawartha Lakes 8875 30% Total 29,737 100%
Table 2-3: Home-to-Work Daily Trips from Lindsay to Other Areas
Colborne Street Kent Street Wellington Street Queen Street Parkside Drive Mary Street Orchard Park Road Pigeon Lake Road Highway 7 & 35 Highway7 Highway7 Thunderbridge Road Ange;ine Street Highway 35 William Street St. David Street CKLRoad 36 Adelaide Street Albert Street LogieStreet Lindsay Street
2-3 DailyTraffic - Lindsay 7973 10049 10940 16143 16237 12632 10950 5923 3664 10799 8492 10760 11440 5437 3017 9200 8200 6000 4810 8994 Legend 1234AverageAnnual Daily Traffic Volume CKLRoad 4 Elm Tree Road 2594
Figure
CKLRoad8 CKLRoad121and8 PrincessStreet CKLRoad121 CKLRoad8 BondStreet FrancisStreet 6450 6131 3672 10972 10972 10972 370 LouisaStreet 11524 3226
DailyTraffic
Legend 1234AverageAnnual Daily Traffic Volume SturgeonPointRoad
Figure 2-5
- Fenelon Falls
King Street/Highway 7 1551 SturgeonRoad QueenStreet Terry Road 9299 Ski Hill Road 2128 9461 895
Figure 2-6
Legend 1234AverageAnnual Daily Traffic Volume
DailyTraffic - Omemee
6(5)288(440) (35)(10)1
Figure 2-7
Existing (2009) Intersection Peak HourlyTraffic Volumes - Lindsay
(311) 206 (202) 137 (53) 42 (255) 124 (1027) 391 (333) 176 147 (214) 174 (222) 66 (95) 70 (136) 412 (896) 76 (50) (2) 3 (72) 40 (178) 53 (34) 44 (252) 339 (8) 2 40 (26) 69 (56) 205 (164) 31 (180) 193 (328) 29 (91) (6) 11 (75) 82 (112) 84 (19) 45 (305) 220 (12) 30 17 (23) 50 (82) 90 (280) 259 (204) 263 (291) 91 (101) (237) 189 (223) 168 (124) 93 (37) 47 (422) 218 (177) 114 48 (77) 112 (218) 102 (273) 201 (142) 407 (439) 67 (97) (7) 6 (10) 17 (1) 2 (238) 150 (605) 323 (5) 1 133 (121) 1 (9) 86 (97) 105 (63) 470 (562) 1 (3) (83) 142 (374) 321 (8) 12 (78) 78 (6) 9 (135) 78 110 (75) 244 (425) 6 (2) 10 (3) 2 (4) 3 (3) (57) 34 (502) 250 (30) 19 (39) 17 (37) 34 (36) 89 28 (25) 511 (269) 79 (81) 64 (154) 15 (42) 15 (13) (24) 24 (287) 279 (52) 95 45 (44) 200 (295) 66 (58) 57 (88) 82 (93) 95 (100) (38) 45 (86) 85 (37) 14 (31) 12 (107) 33 (95) 37 (39) 17 (163) 78 (13) 20 1 (34) 110 (136) 198 (300) 245 (356) 120 (131) 65 (75) Colborne Street Kent Street Wellington Street Queen Street Parkside Drive Mary Street OrchardParkRoad Pigeon Lake Road Highway 7 & 35 Highway7
Thunderbridge Road Angeline Street Highway 35 William Street St. David Street CKLRoad 36 Adelaide Street Albert Street LogieStreet Lindsay Street (105) 59 (89) 83 (193) 88 (160) 133 (284) 227 (83) 42 183 (232) 138 (125) 3 (12) 1 (11) 270 (243) 155 (123) (103) 86 (331) 191 0 (10) 191 (184) 227 (241) (180) 121 (0) 0 (156) 74 Kent Street William Street Queen Street
Highway7
Legend AM(PM) Lindsay Street
2 (25) 13 (585) 102 (5) 0 (55) 14 (0) 0 (200) 149 (275) 78 (5) 3 130 (340) 12 (40) 4 (25) 8 (20) 183 (190) 3 (5) (30) 44 (248) 241 (3) 21 (112) 51 (4) 7 (34) 38 138 (132) 260 (282) 7 (1) 5 (1) 2 (0) 6 (3) (150) 55 (154) 560 (42) 820 Queen Street St.David’s Street Colborne Street Highway 36 (15) 19 (16) 11 (7) 7 (33) 22 (441) 269 (33) 15 23 (25) 7 (20) 5 (6) 3 (5) 332 (319) 6 (7) (76) 54 (194) 146 (29) 13 63 (65) 137 (142) 28 (40) 56 (46) 48 (98) 34 (45) (16) 1 (263)322 10 (16) 249 (172) (27) 6 (10) 7 WilsonRoad Pigeon Lake Road (0) 2 (126)106 (8) 33 (225)120(215)169 (0)0 103(208)65(158)45(65) 33(34) 22(22)106(146) (4) 2 (370) 156 (25) 22 (7) 18 (53) 40 (5) 6 10 (13) 373 (235) 322 (115) 107 (244) 28 (95) 43 (18) (490) 430 (6) 6 285 (567) 13 (13) 15 (11) 15 (4) (96) 24 (311) 141 (146) 74 (105) 37 (249) 218 (71) 92 79 (88) 240 (168) 133 (90) 68 (102) 193 (290) 135 (120) (234) 102 (76) 28 225 (130) 68 (46) 44 (60) 61 (69) (80) 48 (34) 11 9 (6) 27 (27) (8) 4 (20) 63 (30) 22 (45) 44 (21) 11 (35) 19 (388) 361 (35) 48 52 (43) 78 (49) 21 (27) 27 (30) 314 (403) 40 (12) (27) 17 (47) 21 (7) 6 (24) 12 (434) 334 (34) 55 19 (10) 40 (22) 6 (7) 13 (20) 329 (412) 21 (8) (4) 3 (29) 30 (9) 16 Wellington Street Adelaide Street Colborne Street Albert Street (18) 3 (105) 36 (17) 7 15 (19) 145 (56) 5 (16) 0 (12) 48 (43) 20 (22) (214) 226 (227) 128 (10) 13 (34) 12 (18) 18 (210) 172 44 (32) 171 (179) 8 (2) 2 (1) 25 (9) 13 (9) (10) 9 (10) 4 (9) 8 (24) 12 (99) 99 (7) 8 14 (13) 7 (7) 6 (6) 9 (11) 67 (108) 16 (2) Colborne Street Kent Street
MainStreet
Figure 2-8
Existing (2009) Intersection Peak
HourlyTraffic Volumes - Bobcaygeon

(135) 61 (225) 202 (156) 43 (151) 62 126 (174) 228 (249) (342) 244 (27) 12 272 (308) 48 (52) 28 (39) 15 (22) (6) 2 (26) 10 (42) 10 (23) 12 (114) 51 (8) 5 16 (18) 4 (21) 57 (105) 70 (129) 81 (83) 11 (45) (3) 2 (126) 58 (32) 5 (13) 6 (9) 7 (11) 6 7 (15) 49 (105) 11 (27) 14 (33) 5 (7) 9 (16) (25) 5 (225) 77 (35) 18 (185)99(135)62(20)10 78(205) 59(210) 2(25) 2 (30) 45(115) 8 (40) (105) 97 (227) 156 (38) 14 (19) 9 (17) 3 (91) 121 7 (21) 219 (183) 3 (8) 11 (10) 13 (19) 13 (24) (15)19(41)21(20)18 (49) 44 (85) 122 (11) 12 54(34)34(40) 6 (7) 9 (14) 79 (81) 21 (24) (2) 2 (0) 1 (3) 0 (2) 7 (155) 96 (3) 0 7 (0) 1 (0) 7 (0) 3 (0) 154 (144) 2 (3) (11) 12 (305) 202 (8) 3 (47) 11 (7) 2 (23) 6 103 (54) 240 (279) 4 (14) 10 (13) 9 (9) 8 (3) (112)37(79)47 (0)(22)17 0 17(25)50(73) Canal Street King Street Duke Street CKLRoad 8
East Street
Legend AM(PM) BoltonStreet
PrincessStreet
CountyRoad121and8
(72) 30 (533) 191 (85) 33 (50) 9 (33) 6 (115) 38 18 (38) 356 (332) 5 (12) 4 (24) 6(25) 79 (90) (12) 14 (350) 193 (5)3 (15)27 4(4)326(246) (39) 35 (379) 123 (75) 19 (165) 92 (39) 19 (70) 87 112 (128) 315 (271) 25 (87) 74 (165) 45 (69) 39 (42) (31) 8 (392) 189 (12) 6 (26) 4 (11) 1 (38) 5 14 (18) 376 (323) 3 (7) 6 (7) 1 (5) 14 (10) (46)24(126)42(157)112 (2) 2(44)(19)13 38 3(7)114(102)10(6) 11(6) 16(21) 174(150)
CountyRoad8
CountyRoad121
BondStreet FrancisStreet Legend AM(PM)
Existing (2009) Intersection Peak HourlyTraffic Volumes - Fenelon Falls
CountyRoad8
Figure 2-9
(6) 3 (652) 439 6 (3) 18 (17) 7 (26) 514 (686) (13) 16 (1) 3 (55) 18 (1) 9 (555) 347 (22) 10 4 (4) 1 (2) 18 (6) 31 (7) 437 (513) 19 (24) (21) 6 (18) 1 (12) 2 (53) 15 (542) 387 (9) 2 33 (45) 1 (2) 33 (61) 26 (30) 386 (528) 1 (3) (30) 19 (8) 10 (580) 406 (19) 9 9 (9) 0 (0) 1 (1) 375 (528) 3 (12) (2) 2 (23) 21 (17) 14 (5) 2 3 (9) 12 (31)
SibleyAvenue Ski Hill Road SturgeonRoad QueenStreet Terry Road
King Street/Highway 7
Existing (2009) Intersection Peak HourlyTraffic Volumes - Omemee Legend AM(PM)
Figure 2-10
2.4.2 SeasonalTrends
The City of Kawartha Lakes population varies depending upon the season of the year. The period from June to August is considered the peak summer period when the transient and seasonal populations are highest. Based on historical and existing data for average annual daily traffic (AADT) and summer average daily traffic (SADT) volumes provided by the MTO, traffic volumes are 25 percent higher during these peak months as shown in Table2-4. This seasonal factor is consistent with peak daily traffic volume information provided in the Environmental Study Report (ESR) for the Scugog River Crossing – Colborne Street Bridge2 .
2.4.3 AnnualGrowthTrends
A City-wide traffic growth rate was established based on current and historical traffic volumes. An average of all recorded historical traffic growth across the City was estimated to be approximately 1.6 percent per annum. This rate of traffic growth compares to a non-compound annual growth rate of 1.6 percent to 3.9 percent estimated for sections of Highway 7 near Lindsay by MTO.3 For this Transportation Master Plan, a 1.6 percent annual traffic growth rate has been incorporated into forecasting of background traffic volumes on area roads and highways.
2.4.4 VehicleClassification
Available traffic data showing the amount of commercial traffic on City roads was supplemented by traffic data collected on selected corridors using automatic traffic recorders (ATR’s). These counts categorized vehicles based on their number of axels. An analysis was then undertaken to identify those corridors that are carrying higher volumes of trucks (volumes greater than 5 percent of total traffic). From this analysis, as summarized in AppendixD, heavy vehicles were found to be oriented primarily to the Provincial Highway and former Country Road networks within Lindsay, Omemee and Pontypool.
2 Table3,followingpage9,Cole,Sherman& Associates,”Scugog River Crossing – Phase 2 Colborne Street Bridge”: Addendumtothe1994EnvironmentalStudyReport,2000.
3 GiffelsAssociatesLimited/IBIGroup,“Highway 7 Corridor Improvements (W.P. 66-99-00): Draft Environmental Study Report”,2010,Page48.
Transportation Master Plan Municipal
Plan Project City
February 2012 Page 28
Master
of Kawartha Lakes
Transportation Master Plan Municipal Master Plan Project City of Kawartha Lakes February 2012 Page 29
Road Needs Study Classification ADT (veh/d) Section NumberFunction 2009200520042003200220012000 199919981997and older 1Hwy 7300m west of Kent Street MTOHWYSADT1004910200107001100011000110001080010700 10681 AADT85508550855085508550845083008500 8500 2Hwy 35 NBtwn Colborne Street W and Thunder Bridge RoadMTOHWYSADT1094011600114001130010800110001070010 60011100 11043 AADT 1020010000990095009650945094009800 9738 4Hwy 7Btwn Kent Street and Angeline StreetMTOHWYSAD T797378008100815078507850760075507700 7859 AADT65506450630061006100595058505950 6156 6Hwy 35 S300m south of Hwy 7 MTOHWYSADT126329700101001010099509600925090508750 10048 AADT 815080007800 77007450720070006800 7513 11Hwy 7300m west of Sibley Avenue NMTOHWYSADT929976 00820082008000800078507800 8119 AADT68506750665065006500640063506400 6550 26Hwy 35300m south of John StreetMTOHWYSADT79748100 815083008100825080508150 8134 AADT65006500645063006400630063006500 6406 28Hwy 7A300m west of Ski Hill Road MTOHWYSADT60985300520053005050510050004900 5244 AADT4250415041003950395039003800 4014 30Hwy 7 A300m east of Dranoel RoadMTOHWYSADT4874530 0520053005050510050004900 5091 AADT4250415041003950395039003800 4014 82776611125% Average SADT = Average AADT = SADT/AADT = Location Road ID Historic SADT Table 2-4: Historical Seasonal Traffic Variation
Table 2.4: Historical Seasonal Traffic Variation
2.4.5 CollisionExperience
A collision analysis was undertaken to identify collision locations, types and frequency, in order to identify high hazard locations. This analysis was based on collision records supplied by the City. The analysis period ranged from January 1, 2007 to June 31, 2009, and covered only selected corridors and intersections in the settlement areas within the City of Kawartha Lakes. More details of the collision material are provided in AppendixE. The following collision characteristics were identified in this analysis:
The greatest number of collisions occurs in wintertime, with the majority of wintertime collisions occurring under clear and dry road conditions, during daylight hours during the week.
Most collisions occurred in off-peak hours. The greater number of collisions occurred on Tuesdays, during the 13 hour period from 12 a.m. (midnight) to 1 p.m.
Angle and rear end collisions make up over 50 percent of the recorded collisions and almost 80 percent of collisions were classified as Property Damage Only (PDO) collisions.
Only one fatality was recorded during the analysis period, occurring at the intersection of Highway 35 and Colborne Street in Lindsay.
Only two intersections in Kawartha Lakes had more than ten collisions during the 30 months ending June 31, 2009. Both intersections are located in Lindsay along Angeline Street (at Kent Street and at Colborne Street). In both cases, the majority of collisions occurred in 2008 and in 2009.
A review of the collision experience at both of these signalized intersections reveals the predominant collision patterns to be rear-end, turning movement, and angle collisions. Turning movement and angle collisions are identified as causes of concern at signalized intersections. The frequency of rearend collisions is likely attributed to driver inattention and acceptance of short headways (e.g., drivers following too closely as they travel in platoons) during heavy volume conditions or drivers unable to stop in time due to road surface conditions (i.e., wet, icy, slushy or snow-covered pavement). Angle collisions may be attributed to driver inattention or aggressive behaviour. The visibility of signal heads may also be compromised along corridors where heavy truck traffic habitually prevents adjacent and following drivers from viewing pedestal-mounted traffic signal heads. A number of angle collisions at these intersections involved drivers that had disobeyed traffic signal control by entering on a red signal indication. It is not known if these violations are the result of driver aggression, driver inattention or other factors. It is also worthwhile noting that some of the collisions occurring at these signalized intersections were found to be related to turning movements at driveways located in close proximity to the intersections. The number of potential conflict areas increases when driveways are frequent or closely spaced along a corridor such as Angeline Street. It is recommended that the City continue to monitor traffic and road safety conditions along Angeline Street in Lindsay.
Transportation Master Plan Municipal Master Plan Project City of Kawartha Lakes February 2012 Page 30
2.5 Existing Traffic Conditions
The quality of service of the existing transportation infrastructure was evaluated by examining the operational performance of select roadway sections and intersections. The concepts of capacity and level of service are central to assessing operational performance. However, the two concepts are not strongly related and therefore need to be evaluated separately. Capacity is normally evaluated using the volume-to-capacity ratio which is a measure of the extent of capacity used by vehicles on the entity being evaluated (e.g., roadway segment or intersection). The volume-to-capacity ratio is measured as a fractional value between zero and one. A volume-to-capacity ratio near one suggests that capacity is almost fully utilized. Level of service is a well established and well accepted qualitative concept used to define the quality of service experienced by drivers on a roadway segment or at an intersection. The level of service ratings are based on an A through F quantitative scale where level of service A describes the most favourable conditions with little or no delay being experienced by drivers. At level of service D, the influence of congestion becomes more noticeable. Level of service E describes operations considered to be at the limit of acceptable delay, or at capacity. Finally, level of service F describes operations considered unacceptable and generally occurs when vehicle demand exceeds the capacity of the road segment and/or intersection. A pictorial representation of level of service for roadway segments is provided in Figure2-11.
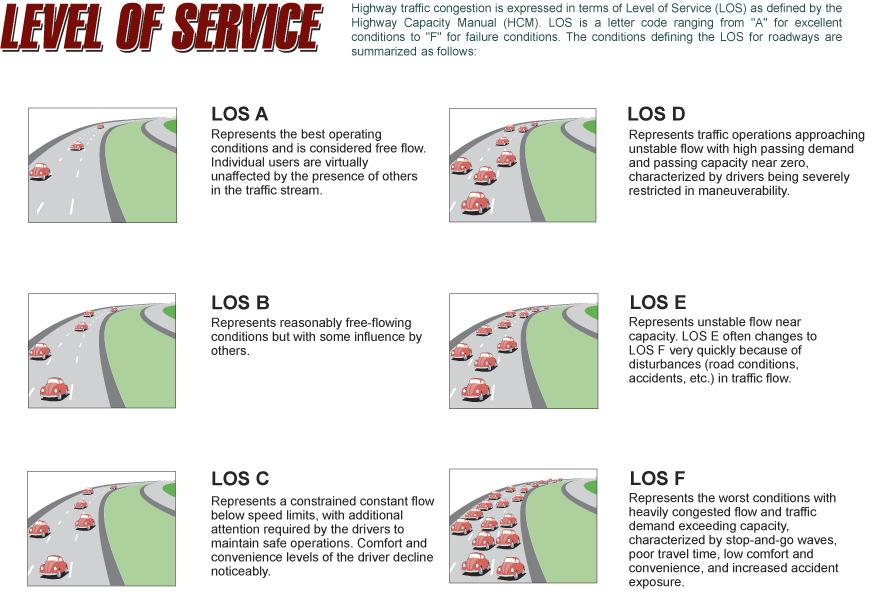
Source: http://www.route228.com/virtMtg/elements/LOS.gif
Transportation Master Plan Municipal Master Plan Project City of Kawartha Lakes February 2012 Page 31
Figure 2-11: Level of Service Descriptions
Based on the volumes and characteristics of the existing transportation network, an analysis was undertaken to identify any road sections or intersections that exhibited operational or capacity problems. A transportation network model was developed and a capacity and LOS analysis using Synchro/Simtraffic software was undertaken. The results of the analysis are summarized in Figures 2-12 to 2-15 inclusive. Tables summarizing the intersection levels of service and operations are included in AppendixF
The operational performance of the existing transportation system employed a screenline analysis and operational performance of select intersections. Screenlines are imaginary lines that extend across a number of parallel roadways and are used to summarize travel demands and transportation capacity on a corridor basis at various locations. Capacities of basic travelled lanes were based on typical values of lane capacity for the type of roadway being examined (i.e., highway, arterial or collector). The need for additional through-lane capacity was identified when the V/C ratio of the screenline exceeded a value of one.
For intersections, the operational performance made use of the Highway Capacity Manual (HCM) techniques as implemented by the Synchro/SimTraffic software package (Version 7). Operational performance at the major intersections was measured by the intersection (overall) Volume-toCapacity (V/C) ratio. A deficiency is reported when the V/C ratio exceeded the value of one (e.g., demand exceeds capacity). For specific movements at signalized and unsignalized intersections, problems were identified when the volume-to-capacity ratio exceeded a threshold value. For example, in the case of a through lane, problem movements were identified when the volume-tocapacity ratio exceeded 0.85. For a separate left or right turn lane, problem movements were identified when the volume-to-capacity ratio exceeded a value of 0.95. Intersections that exceed these criteria are shown in the figures with a red circle. Intersections approaching these levels are shown with a yellow circle and intersections operating at less than these criteria are shown with green circles. The results of the capacity analyses reveal that most roadway sections and intersections were found to be operating satisfactorily under existing (2009) traffic conditions. The analysis results for each of the settlement areas are described below and in AppendixF.
2.5.1 Lindsay
Signalized intersections were found to be operating satisfactorily under existing morning and afternoon peak hour traffic volumes. These conditions are representative of the fall or shoulder summer season, as they are based on traffic data collected in the month of September. One key intersection is noted as a gateway intersection, and is currently experiencing volumes that are approaching effective capacity of the intersection – the Kent Street and Angeline Street intersection.
This intersection is a gateway as Kent Street and Angeline Street connect to the surrounding highway system and a significant part of traffic entering or leaving Lindsay passes through this intersection. Critical movements here are the westbound through movement and the northbound left turn movement. Also, the closely spaced intersections on Lindsay Street at Kent Street and Ridout Street were noted as potential operational problems; however the current restriction on eastbound right turns from Kent Street and the split phasing of the traffic signal can accommodate the existing traffic movements.
Transportation Master Plan Municipal Master Plan Project City of Kawartha Lakes February 2012 Page 32


! ( ! ( ! ( ! ! ! ! ! ! ( ! ( ! ! ! ! ( ! ! ! ! !( ( ! ( ! ! ! ! ( ! ! ( ! ! ! ( ! ( [ ColborneStreet KentStreet QueenStreet Wellington Street OrchardParkRoad Parkside Drive PigeonLakeRoad Highway7 Highway7&35 MaryStreet ThunderBridgeRoad Highway35 AngelineStreet LindsayStreet AdelaideStreet AlbertStreet St.DavidStreet CKLRoad 36 WilsonRoad SanderlingCrescent ElmTreeRoad LogieStreet Highway7 Existing(2009)IntersectionLevelofService-Lindsay A-B:LittleToShortDelay Legend WilliamStreet C-D:AverageToLongDelay E-F:AtCapacityWithVeryLongDelay
Figure2-12


! ( ! ( ! ! ! ! ( ! ! ! ! [
2-13 E a s t S t r e e t CanalStreet Boyd Street MillStreet King Street B o l t o n S t r e e t Cedartree Lane Duke Street MainStreet CKL Road 8 W e s t S t r e e t A-B: Little To Short Delay E-F: At Capacity With Very Long Delay s Legend C-D: Average To Long Delay Existing (2009) Inters ection Lev el of Servic e - Bobcaygeon
Figure


! ! ! ! ( ! [
C K L R o a d 1 2 1 / 8
Figure
2-14 CKLRoad8
Franc is Stree t
Bond Stre et
CKLRoad8 Legend A-B: Li tle To Short Delay C-D Average To Long De ay E-F: At Capacity Wi h Very Long De ays Existing (2009) Inters ection Level Of Servic e - Fenelon Falls
Prince ss Stree t


! ! ! ! ! [
2-15 Highway 7 S i b l e y A v e n u e S k i H i l l Road D e a n e S t r e e t S t u r g e o n R o a d Q u e e n S t r e e t Terry Road A-B: L tt e To Short De ay Legend C-D: Average To Long De ay E-F: At Capac ty Wi h Very Long De ays Existing (2009) Inters ection Level Of Servic e - Omemee
Figure
All unsignalized intersections were found to be operating satisfactorily. The eastbound approach to the Lindsay Street and Mary Street intersection was found to be the most critical out of the intersections reviewed in this assessment.
2.5.2 Bobcaygeon
The two signalized and other unsignalized intersections in Bobcaygeon were found to be operating satisfactorily. The most critical unsignalized intersection is the CKL Road 49/East Street intersection with Main Street. Signalized intersections are operating well below their capacity.
2.5.3 FenelonFalls
The two signalized intersections studied were found to be operating at volume-to-capacity ratios below 60 percent. All unsignalized intersections were found to be operating satisfactorily.
2.5.4 Omemee
The one signalized intersection at Highway 7 (King Street) and Sturgeon Road East was found to be operating at approximately 70 percent of its capacity. Other unsignalized intersections were found to be operating satisfactorily.
2.6 Rail Service
Canadian Pacific Railway (CPR) owns a rail corridor running between Toronto and Peterborough (see Figure 2-16). This section of the line is the Havelock Subdivision and it runs from the CPR Agincourt Yard in Toronto to Peterborough, Havelock and Blue Mountain. The line passes through the southern part of the City, with a station at Pontypool. The distance between Toronto and Peterborough is approximately 120 kilometres. The line is used solely for limited freight operations. There has been no VIA Rail passenger service on this line since approximately 1990. Due to the deteriorated track condition, current operating speeds are limited to 10 miles per hour. Studies are being conducted into the feasibility of upgrading this line to accommodate increased freight and passenger traffic. These opportunities and their implications upon the City’s transportation system and services are discussed further in the following sections of this report.
Transportation Master Plan Municipal Master Plan Project City of Kawartha Lakes February 2012 Page 37
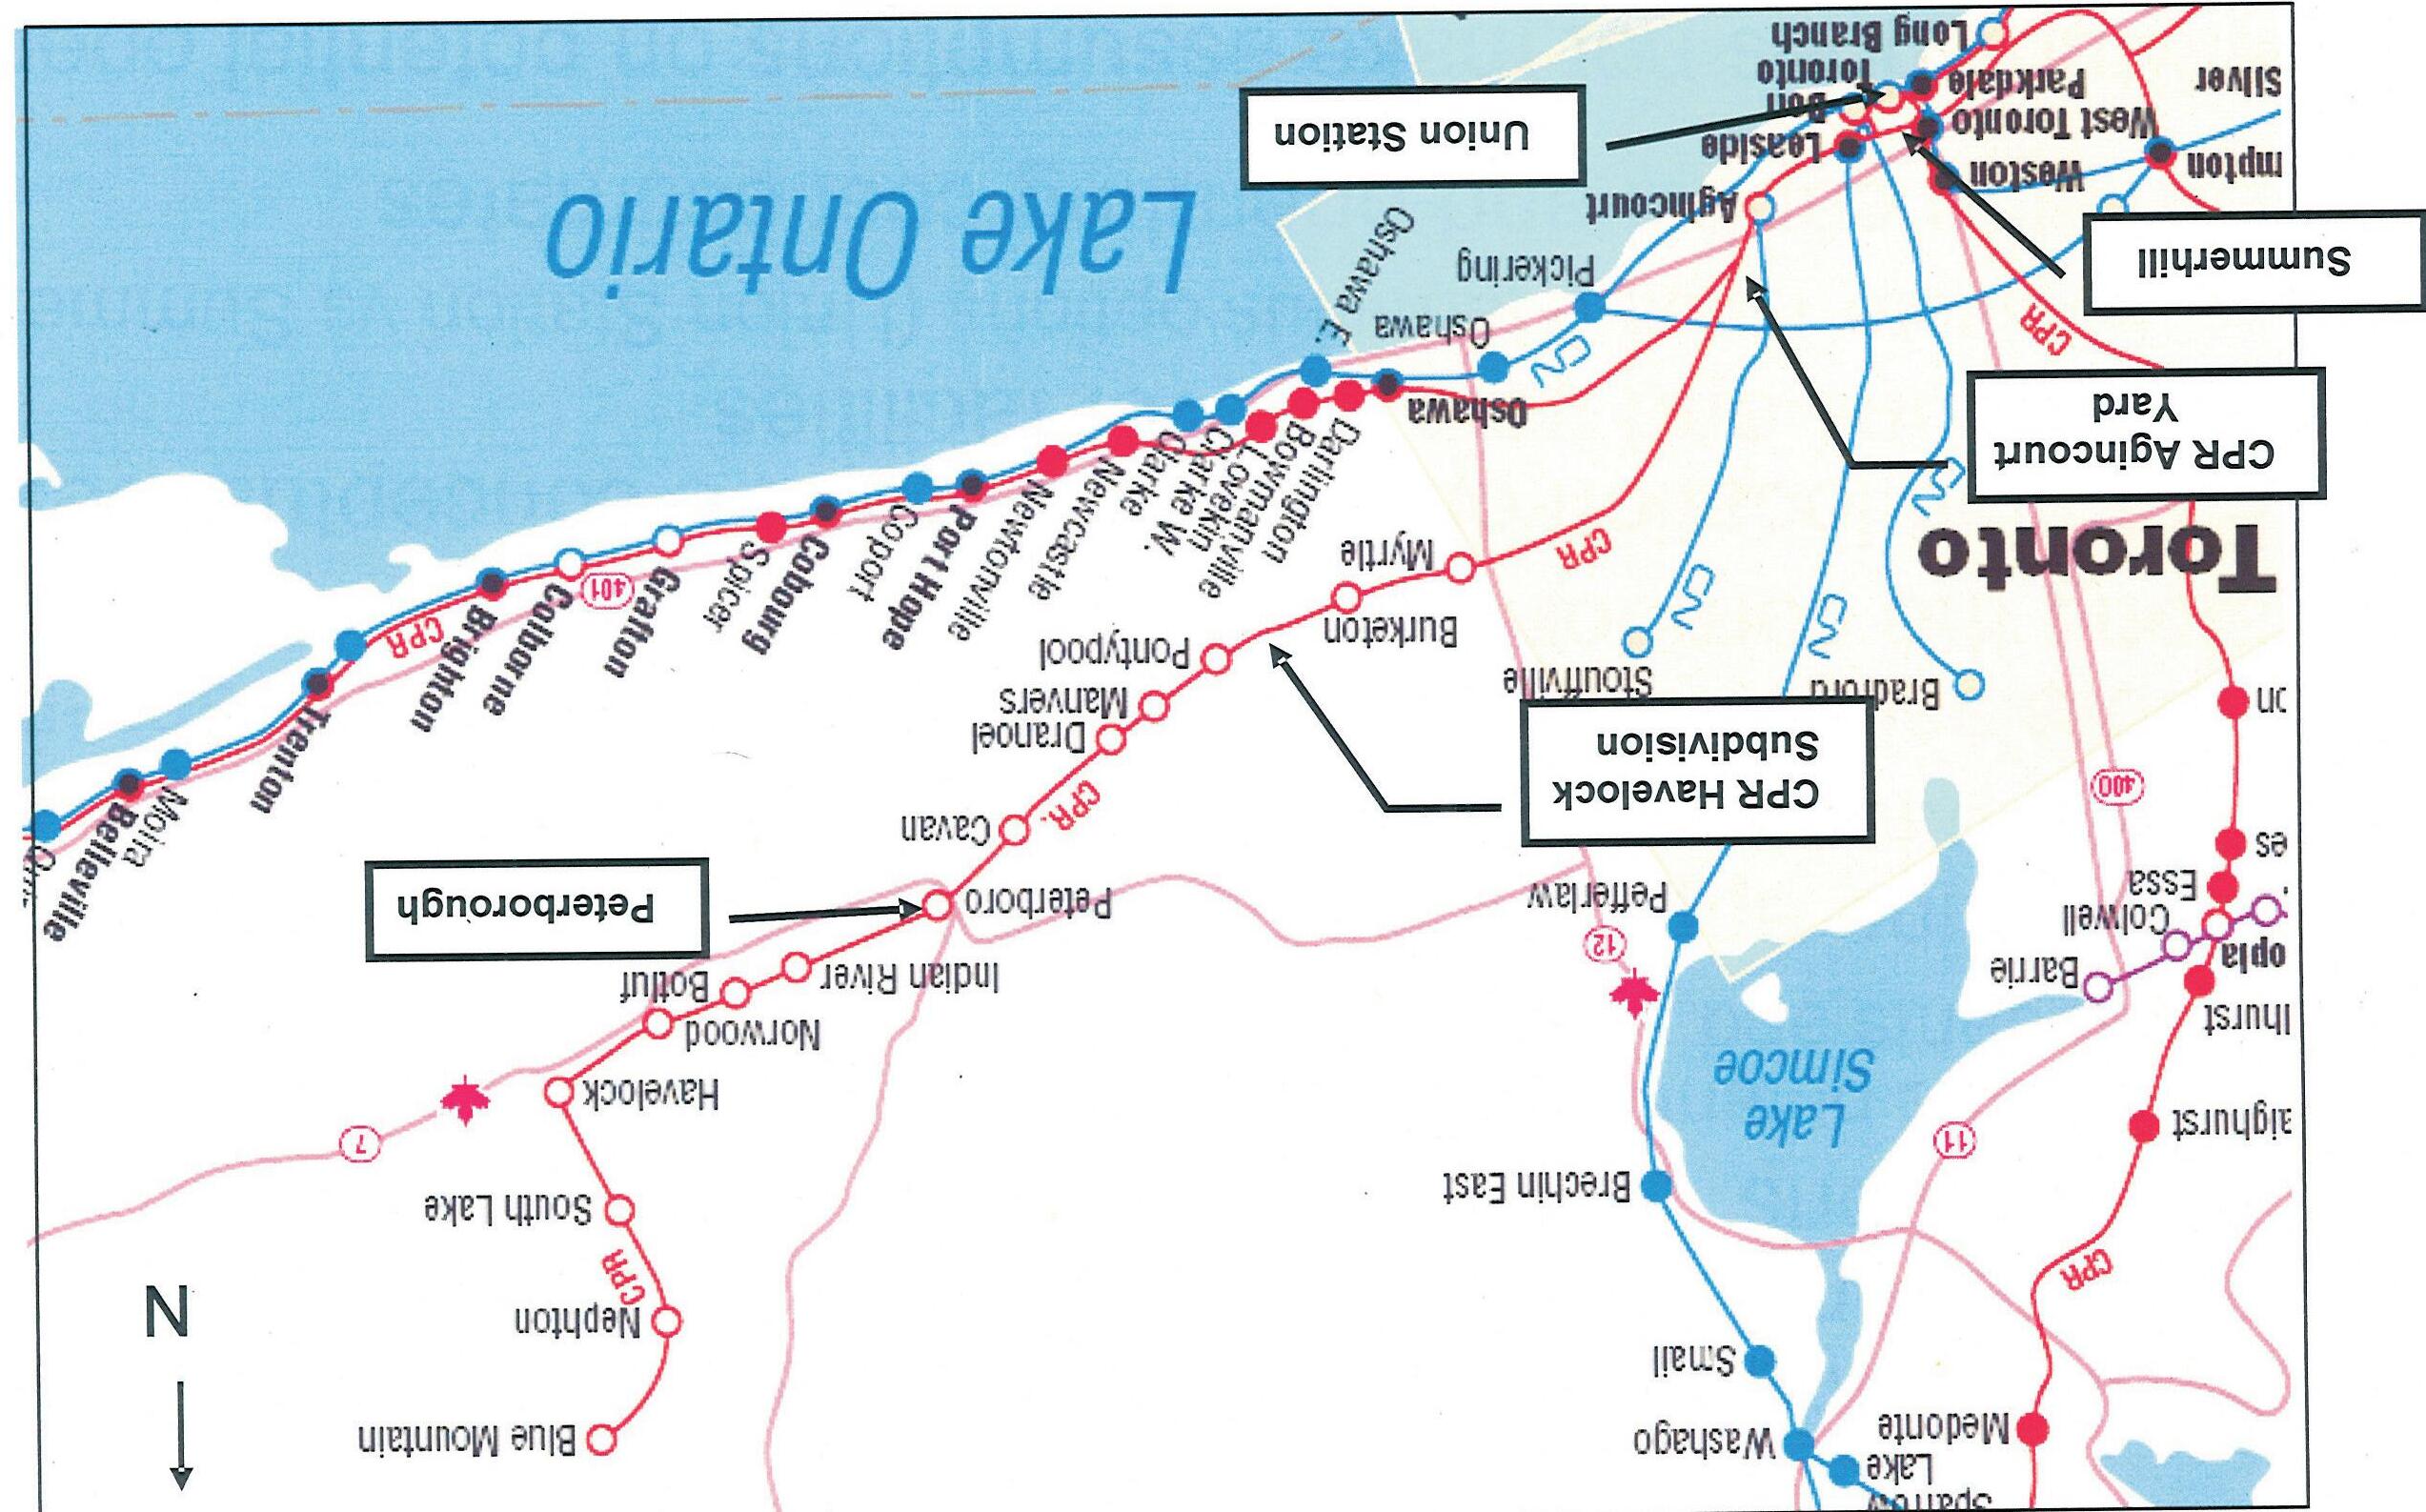

 Kawartha Lakes
Figure 2-16
Existing Rail Service - Kawartha Lakes
Kawartha Lakes
Figure 2-16
Existing Rail Service - Kawartha Lakes
3.0 LOCAL TRANSIT
3.1 Introduction
The City of Kawartha Lakes initiated a comprehensive Strategic Transit Service Review Study (Review Study) that was presented to Council in 2008. The Review Study was conducted by the MMM Group for the City.
As noted in the final report dated May 2008, the goals and objectives of the Review Study were as follows:
Assess the current and future transit needs of the major urban areas within the City of Kawartha Lakes for five, ten and twenty year time horizon
Assess and resolve any service and route network deficiencies of the existing transit services
Improve service levels and transit ridership along with improvements to service quality, customer satisfaction, productivity and cost effectiveness
Update existing plans of action in order to address transit mobility issues and integration between conventional services and specialized transit service provided by Community Care.
Establishing service standards for both conventional and specialized systems
Examine possible extension of services between larger communities (Lindsay, Bobcaygeon and Fenelon Falls) and intercity connections through GO Transit
3.2 Comprehensive Strategic Transit Service Review
The Review Study concluded that there was significant potential for increased ridership due to a number of factors, such as:
The existing two routes do not adequately serve areas of Lindsay
The hours of operation discourage transit use by students and those individuals commencing work before 8 a.m. or ending work after 5 p.m.
The sixty minute frequency results in waiting times that discourages ridership
3.3 Comprehensive Strategic Transit Service Review Study Recommendations
Major recommendations of the Review Study were as follows:
Provide an aggressive program of service improvements and marketing over the short and long term including accessibility regulations
Extend service hours from current nine hours per day to twelve hours per day (7 a.m. to 7 p.m.)
Introduce the position of Transit Operations Supervisor
Increase fares by twenty-five cents
Shorten existing routes and increase the number of routes from two to three and reduce frequency from sixty minutes to thirty minutes
Transportation Master Plan Municipal Master Plan Project City of Kawartha Lakes February 2012 Page 39
Purchase additional buses to provide a fleet of eight buses
Purchase land to provide a centrally located transfer hub in the downtown Hire additional drivers to provide the service required to operate the above recommended routing
Integrate specialized transit into one service in order to improve service resulting in increased demand and ridership
Provide a demand responsive dial-a-ride pilot project to link Fenelon Falls and Bobcaygeon to Lindsay to minimize costs and build ridership
Consolidate all transit activities into one facility
Adopt a five year target of eighteen passengers per hour with a three year target of fourteen passengers per hour
Adopt a five year target for revenue/cost ratio of 25 to 27 percent
3.3.1 IntheLongTerm
Increase the fleet size from eight to twelve buses in the ten to twenty year horizon with an associated increase in ridership providing service to new growth areas in Lindsay
3.4 Council Consideration of Strategic Transit Service Review Study
Committee of the Whole, at their meeting on March 17, 2009, considered and approved a staff report entitled ‘Transit Study Report” that directed staff to implement a series of changes to the transit system commencing in 2009. The report recommendations were as follows:
1. That the current nine hours of service from 8:00 a.m. to 5:00 p.m. Monday to Saturday be extended to twelve hours of service from 7:00 a.m. to 7:00 p.m. Monday to Saturday, commencing before the end of the second quarter of 2009.
2. That in addition to the approved purchases in the 2009 Capital Budget, two additional new buses be purchased in 2009 with funding from the Provincial Gas Tax Reserve Account.
3. That additional staff resources including additional drivers and a part time Transit Supervisor be hired to develop new services and to support the expanded service (Subject to amendment).
4. That the two existing transit routes be reviewed and considered by the Transit Advisory Committee to expand to three routes (once the new buses are acquired) consisting of one base route along Kent Street from the downtown core to the West End of Lindsay with two feeder routes (see Attachment – Figure # 5 to Report PW2009-003) to provide a thirty minute service during the morning and evening peak hours and a sixty minute service during the off peak weekend and holiday periods.
5. That a Transit Advisory Committee be established consisting of one member of Council, a representative from Sir Sandford Fleming College, a representative from one of the Chambers of Commerce, a representative from the Lindsay Business Improvement Area, a representative from Community Care, a representative from the City’s Accessibility Advisory
Transportation Master Plan Municipal Master Plan Project City of Kawartha Lakes February 2012 Page 40
Committee, a representative from one of the secondary school’s student council and two members at large.
6. That a route to Bobcaygeon, Fenelon Falls, Omemee, Riverwood Park and other alternate routes be considered and reviewed by the Transit Advisory Committee on Tuesdays and Thursdays, either as a scheduled route or as a dial-a-ride, to commence in early 2010 with a route review at the end of the first year of operation. This report addresses a scheduled bus route and is to be approved by Council.
7. That the proposed Transit Supervisor, with the assistance of a marketing consultant, prepare a detailed marketing plan to promote the transit service as an alternative to the use of personal vehicles. The marketing plan should include but not be limited to promotional literature, incentives and advertising.
8. That, as part of the introduction of new services, free transit be offered to the public for a limited time to encourage increased ridership.
9. That a reliable charter system be considered in conjunction with retirement homes and service clubs once the additional rolling stock and personnel are in place and subject to investigating the costs of such a system through various fares and subsidies, via report back to Council.
10. That staff report back to Council by the second quarter of 2010 with a detailed financial reconciliation of actual costs and revenues incurred in comparison with all assumptions in this report.
Within the five-year time horizon and subject to demand and with Council endorsement, staff will work towards additional enhancements to the system which would include:
1. Enter into discussions with Community Care with a goal to consolidate specialty transit under one umbrella for the entire City.
2. To further enhance the level of service commensurate with growth in the community and additional services.
3. Examine the potential for partnerships within the private sector and other transit systems for connections to surrounding communities such as Peterborough and Oshawa.
4. To locate and construct a centralized transfer location within the downtown core of the Lindsay community.
5. Standardized design and construction of bus stops within the urban areas and increase the number of shelters commensurate with the expanded number of stops.
6. Remain involved in the ongoing activities of the Metrolinx's group and actively to promote connections to the public transit system throughout the Greater Golden Horseshoe. Recommendation # 3 was amended to read:
That staff resources being additional drivers be hired and that a part-time Transit Supervisor be hired on a contract basis to develop new services and to support the expanded service.
Transportation Master Plan Municipal Master Plan Project City of Kawartha Lakes February 2012 Page 41
3.5 ImprovementstoTransitSystemSubsequenttoStrategicTransitServiceReview Study
Subsequent to the strategic transit review study that was presented to Council in 2008 and the recommendations approved by council on March 17, 2009 a number of improvements were implemented in order to improve service and increase ridership.
- The number of routes was increased from two (2) to three (3)
- The frequency of service on one route was reduced from 60 minutes to 30 minutes
- Accessibility standards were considered and implemented to ensure that any new buses meets the standards of the Province of Ontario
- Service hours were extended from 9 hours to 12 hours resulting in service being provided from 7:00 a.m. to 7:00 p.m.
- Fairs were increased to $2.00 per trip
- The fleet size was increased to accommodate six (6) buses in service at all times
- Additional drivers were hired to accommodate six (6) buses
- Discussions are occurring with Community Care that may result in the integration of specialized transit service into one service
Transportation Master Plan Municipal Master Plan Project City of Kawartha Lakes February 2012 Page 42
4.0 INTERMUNICIPAL TRANSIT
Intermunicipal transit is a public transportation system which connects one municipality to another. This typically refers to a service provided by the public sector, but can include private sector operators. For the City of Kawartha Lakes intermunicipal transit refers to a system which would connect the City to other major regional centres (e.g. Peterborough, Durham, Toronto, etc.). Intermunicipal transit differs from intramunicipal transit which is the provision of public transportation within the boundaries of a municipality.
The purpose of assessing Intermunicipal Transit as part of the Transportation Master Plan was to detail existing conditions, evaluate current and future need, identify opportunities for future service to the year 2031, and provide a series of recommendations on intermunicipal transit. In support of the completing of the Intermunicipal Transit Assessment, UEM held a meeting with representatives of Metrolinx and GO Transit on February 25th, 2010 at the Metrolinx office in Toronto. The representatives provided input on the long-term planning objectives of Metrolinx and GO Transit specifically in regard to, in, and in the vicinity of the City of Kawartha Lakes.
4.1 Existing Conditions
4.1.1 LindsayTransit
Lindsay Transit is the sole provider of public transit in the City of Kawartha Lakes. Lindsay Transit currently provides service on three routes (Red, Blue and Green) within the urban area of Lindsay only. Hourly service is available Monday to Saturday from 7:00 am to 7:00 pm. Lindsay Transit has no connections to other public transportation systems.
4.1.2 Metrolinx
Metrolinx is an agency legislated by the Government of Ontario with the mandate to improve the coordination and integration of all modes of transportation in the Greater Toronto and Hamilton Area (GTHA). The GTHA includes the Cities of Toronto and Hamilton as well as York, Durham, Peel and Halton Regions.
Metrolinx is the final piece in a three-part approach by the Provincial Government to prepare the GTHA for growth, building on the work of the Greenbelt and Places to Grow legislation.
The City of Kawartha Lakes is currently not included in Metrolinx’s mandate area; however, the City shares a substantial portion of its western border with Durham Region and the City of Kawartha Lakes population is projected to grow by approximately 30% by the year 2031. In addition, the southern portion of the City sits between the GTHA and the City of Peterborough which is a major urban area in mid-eastern Ontario. As shown in Figure4-1, similar to the City of Kawartha Lakes, the City of Peterborough is not within the Metrolinx’s mandate area.
In November 2008, the Metrolinx Board of Directors approved the Regional Transportation Plan (RTP), entitled ‘The Big Move’. The implementation of this plan will shape the social, environmental and economic development of the GTHA and surrounding areas. The RTP provides a decisionmaking framework on rapid transit investment and transportation planning policy in the GTHA. GO Transit (a division of Metrolinx) will play an important role in implementing the RTP’s infrastructure improvements and delivering expanded interregional bus and train service in the GTHA.
Transportation Master Plan Municipal Master Plan Project City of Kawartha Lakes February 2012 Page 43
4.1.3 GOTransit
GO Transit is the GTHA’s interregional public transportation service, carrying over 200,000 passengers each weekday. GO Transit is a division of Metrolinx, and an agency of the Province of Ontario, and reports to the Metrolinx Board of Directors, and ultimately, the Minister of Transportation. The Metrolinx Act, 2006 provided for the transfer of responsibility for GO Transit to Metrolinx, after the applicable sections of the act were proclaimed into force. Metrolinx and GO Transit were merged in May 2009.
The current long-term Strategic Plan governing the operation of GO Transit is GO 2020. The Plan provides a commitment to meet the GTHA’s longer-distance public transportation needs in the coming decades, consistent with the Province of Ontario’s Growth Plan for the Greater Golden Horseshoe, and the strategies and improvements in Metrolinx’ RTP.
GO Transit consists of a network of train and bus services that bridges the boundaries between regions and municipalities with direct service to downtown Toronto and other activity centers in southern Ontario. GO Trains and GO Buses serve a population of 7 million in an 10,000-square kilometer area. GO connects with every municipal transit system in the GTHA, with coordinated services and discounted fares for GO riders who transfer.
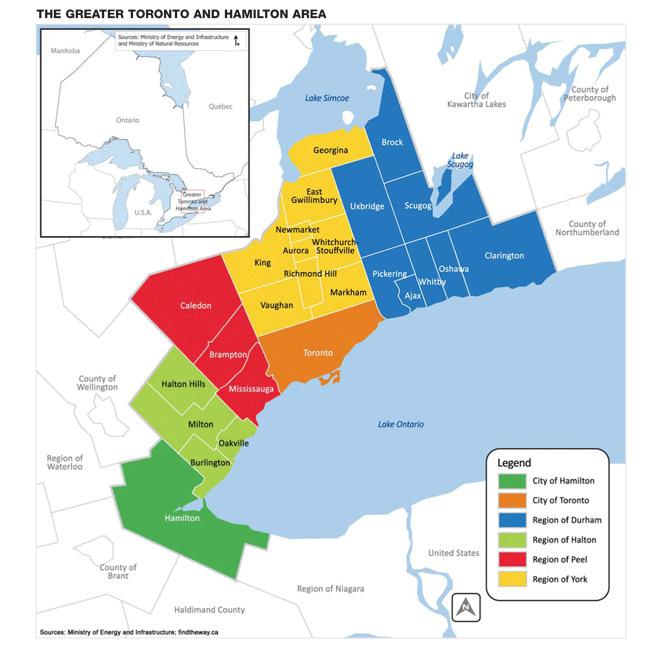
Transportation Master Plan Municipal Master Plan Project City of Kawartha Lakes February 2012 Page 44
Figure 4-1: The GTHA as defined by Metrolinx
As shown in Figure4-2, GO Transit does not currently provide bus or train service to the City of Kawartha Lakes. However, two current GO Bus routes (81 & 88) do provide service within the vicinity of the City.
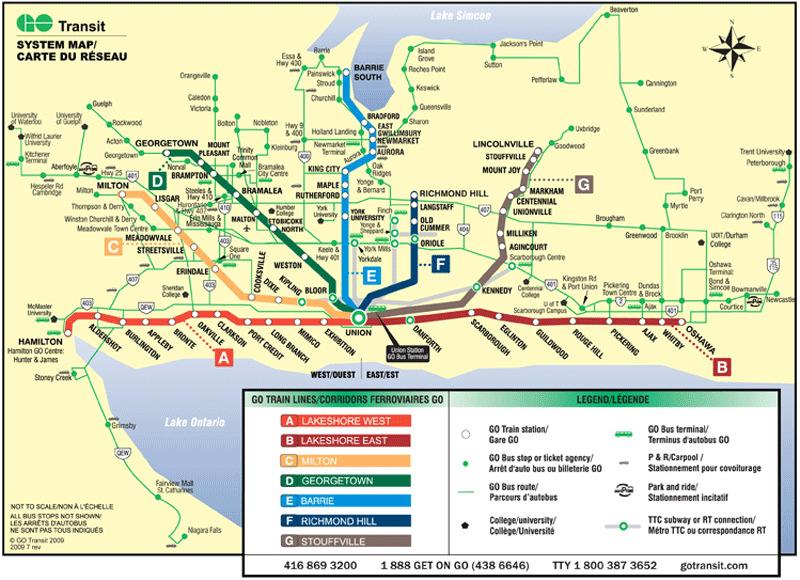
81PortPerryGOBus
Northbound and Southbound service from Beaverton to Cannington (Brock Twp.) to Port Perry to Whitby with a rail connection to Union Station (Toronto).
The Cannington stop is 2.5 kilometres west of the City of Kawartha Lakes western border, 8 kilometres from the hamlet of Manilla, and approximately 30 km from Lindsay.
There are no GO Transit parking spots provided at the Cannington Stop.
The cost of a single one-way adult ticket from Cannington to Union Station including the connection in Whitby is $11.75.
Port Perry is about 20 kilometres west of the City border along Hwy 7A and 35 km west of the hamlet of Bethany.
Transportation Master Plan Municipal Master Plan Project City of Kawartha Lakes February 2012 Page 45
Figure 4-2: Go Transit System Map (Not to Scale)
81 88 City of
Kawartha Lakes
Northbound and Southbound service from Peterborough to Cavan to Clarrington to the Oshawa GO station with a rail connection to Union Station. Currently operating ten trips per direction per weekday (est. 223 passengers daily).
The Cavan stop is at Regional Road 10 and Hwy 115, approximately 10 kilometres from Bethany and 18 kilometres from Omemee.
The Cavan stop is located at a MTO Carpool Lot.
A Park and Ride parking lot has recently been constructed at Hwy 115 and Hwy 35, which is along the route. The lot will help support residents of the City of Kawartha Lakes who wish to use this GO Transit route.
The cost of a single one-way adult trip from Cavan to Union Station including the connection in Oshawa is $13.25.
There are no extensions to this route planned, nor are there planned upgrades to the existing level of service.
4.2 Private Providers
Although not currently serviced by an intermunicipal public transit system, the City of Kawartha Lakes does receive limited intermunicipal transit service from the private sector.
4.2.1 Can-arCoachService
Can-ar Coach Service provides daily (Southbound – am, Northbound – pm) service from Haliburton to Toronto which includes nine stops in the City of Kawartha Lakes.
Stops in the City of Kawartha Lakes along the route are:
o Norland, Coboconk, Rosedale, Fenelon Falls, Cameron, Kent St. W. & William St. S (Lindsay), Lindsay (Lindsay Inn), Hwy 35 & Hwy 7A, and Yelverton
4.5 hour route from Haliburton to Toronto.
Southbound – Pick up at Lindsay Inn at 10:00 a.m., drop-off in Toronto at 12:30 p.m.
Northbound – Depart Toronto at 5:00 p.m., drop-off at Lindsay Inn at 7:30 p.m.
Adult one-way ticket from Lindsay to Toronto is $32.00
4.2.2 CoachCanadaAirportVanService
Coach Canada operates a van service between Pearson Airport and the City of Kawartha Lakes. The service is by reservation only.
Prices range from $136.00 in Bethany to $293.00 in Bobcaygeon for a one passenger one-way trip to Pearson Airport.
Transportation Master Plan Municipal Master Plan Project City of Kawartha Lakes February 2012 Page 46
88PeterboroughGOBus
4.3 Current and Future Need
4.3.1 CurrentNeed
The need for intermunicipal transit in the City of Kawartha Lakes is a function of demand. When looking at desire lines, based on information from the 2006 Transportation Tomorrow Survey (TTS)4, 27% of those who leave the City of Kawartha Lakes for work commute to South Durham (Pickering, Ajax, Whitby, Oshawa and Bowmanville), with another 15% each to North Durham (Brock, Uxbridge, and Scugog) and to the City of Peterborough.
Destinations (including those who remain within the City) and number of travelers for home-towork trips for people living in the City of Kawartha Lakes, based on the 2006 TTS and 2006 Census information are presented in Table4-1.
In 2006, it is estimated that in total 28,875 people used a private vehicle to travel to and from work in the City of Kawartha Lakes5. This includes those workers who stay within Kawartha Lakes as well as those who travel beyond the City for work.
Therefore, the greatest demand for intermunicipal transit from the City of Kawartha Lakes, to service daily commuters, would be to South Durham, North Durham, and the City of Peterborough, with less of a demand to Toronto and other employment centres.
Given that the Peterborough GO Bus line is considered viable with an estimated 223 passengers per day, GO Bus lines into the City of Kawartha Lakes would seem to have sufficient demand given the number of daily home-to-work trips taken by residents of the City to destinations beyond the City limits based on TTS data.
4 The2006TransportationTomorrowSurvey(TTS)wasatelephonesurveyconductedon5%oftheresidentsofthe GreaterTorontoAreaandsurroundingareaofCentralOntario(approximately150,000households).Thesurveywas conductedonbehalfontheMinistryofTransportation.Theresultsofthesurveyareconsideredthepreeminent sourceoftraffic-basedinformationintheGTAandsurroundingarea.
5 Basedon2006CensusdatafortheCityofKawarthaLakes
Transportation Master Plan Municipal Master Plan Project City of Kawartha Lakes February 2012 Page 47
Table 4-1: Total Work Trips
4.3.2 FutureNeed
The Growth Management Strategy (GMS) component of this Municipal Master Plan Project is a strategy to plan for and manage growth in a sustainable manner.
The Growth Management Strategy includes forecasts for population, employment and households for the year 2031, which are 100,000, 27,000, and 42,516, respectively, up from the 2006 figures of 77,543, 23,877, and 29,505 in the City. These projections are in conformance with the population and employment forecasts established in the Places to Grow Growth Plan for the City of Kawartha Lakes. Of the projected population growth of 22,457 between 2006 and 2031 in the City, 52% to 55% is expected to occur within the urban boundary of Lindsay.
The need for intermunicipal transit as a result of growth in the City of Kawartha Lakes will be a function of the demographics of growth as well as the ability of employment growth to match population growth. Employment projections in the GMS are based on projected population growth of the City as well as demographics (i.e., age of the population). If employment does not grow in the City at a rate sufficient to support population there may be a need for residents to travel beyond the limits of the City for employment opportunities. Based on the results of the GMS, the need for intermunicipal transit as a result of growth will be focused on Lindsay, and to a much lesser extent the other urban areas in the City (Bobcaygeon, Fenelon Falls and Omemee).
Transportation Master Plan Municipal Master Plan Project City of Kawartha Lakes February 2012 Page 48
Destination (forthoseworkerslivingintheCityofKawarthaLakes) Percent (Total) NumberofPeople CommutinginPrivate Vehicles City of Kawartha Lakes 59% 17,036 South Durham 11% 3,176 North Durham 6% 1,733 City of Peterborough 6% 1,733 No usual place of work 6% 1,733 York Region 4% 1,155 City of Toronto 3% 866 Other 3% 866 County of Peterborough 1% 289
4.4 Opportunities for Future Services
4.4.1 GOBusServicetotheCityofKawarthaLakes
GO Transit’s GO 2020 Strategic Plan does not identify any new Go service to the City of Kawartha Lakes. However, consultation with representatives from GO Transit suggested that future GO Bus service to the City of Kawartha Lakes, specifically Lindsay, may be considered for the longer term planning horizon.
Service within the next five years is not likely, given budget restraints, and anticipated demand for such a service. Service in the longer term planning horizon would be subject to a number of conditions including demand forecasting and budget approvals.
Additional factors that would be considered when evaluating the expansion of GO Bus service to the City are the approval of a commuter rail link to Peterborough with a station in Pontypool (see Section 4.2.2), the expansion of the Lakeshore East GO Train commuter line to Bowmanville, and the expansion of the intermunicipal transit system in the City to support the City’s overall transit objectives.
4.4.2 PeterboroughCommuterRail
On March 27th, 2008, the Governments of Canada and Ontario announced a commitment to initiate a joint study for a Peterborough commuter rail line, as part of the Government of Canada’s Budget 2008 Public Transit Capital Trust. The parties jointly developed and agreed to the terms of reference (ToR). In June 2008, the Minister of Transportation directed Metrolinx to take the lead in carrying out a Peterborough Rail Study.
In February 2010, the study6 was completed and submitted to the Provincial and Federal governments for consideration, fulfilling the responsibility of Metrolinx under the Terms of Reference (ToR). The study was released to the public on May 10th, 2010.
Study Context:
Rail corridor between Toronto and Peterborough (approximately 120 km) owned by Canadian Pacific Railway (Havelock Subdivision).
No passenger rail service along this corridor since 1990 VIA Rail cutbacks.
Significant capital investments required to bring track up to current passenger rail standards.
Key Components of the Study ToR’s included:
1. An evaluation of market potential and projected ridership, taking into consideration potential commuter and non-commuter markets (i.e. students and seniors).
2. A determination of appropriate rail vehicle technology and service level options.
3. An appraisal of track conditions and upgrade requirements.
4. An examination of location options for stations and other facilities.
Transportation Master Plan Municipal Master Plan Project City of Kawartha Lakes February 2012 Page 49
MetrolinxPeterboroughRailStudyFinalReportPO#1138–February2010
6
5. Capital and operating cost.
Note: Metrolinx made no assumption on the potential operator of the service.
The relevant study results indicate the following:
Three basic alternative routes were considered. The difference being the proposed routing around CP’s Toronto Rail Yard
Nine stops are recommended between Peterborough and Toronto. This is less than when VIA Rail operated along the same corridor. The number of stops was limited to ensure that the total trip time would be less than two hours.
Each of the alternative routes would result in a ‘Park and Ride’ station in Pontypool. This would be the only stop in the City of Kawartha Lakes.
Given the time required to complete the preliminary design/engineering, environmental assessment, detailed design and construction phases of project development, it is likely that, pending project approvals, several years of work would be required before the line would be operational.
The Federal and Provincial Governments are reviewing the findings and conclusions of the Metrolinx study. Following the review of the findings from the study, the Provincial and Federal Governments will determine the next steps for the projects. The terms of the initial commitment were that the identified project would be jointly funded by the Federal Government and the Province with each sharing equally in all eligible capital costs, net of funding from municipal or private sector contributions. Maximum contributions are set at $150 million each7, subject to the successful completion of a federal and provincial due diligence review of the project, securing any funding approvals that may be required respectively by the Federal and Provincial Treasury Boards, all applicable environmental assessments, and the signing of a contribution agreement that will detail the project elements, schedule, capital and operating costs, and funding parameters, to the mutual satisfaction of Canada and Ontario.
As noted above, Metrolinx made no assumptions on the potential operator. At this time no decisions have been made about the next steps to be taken in the study. GO Transit is currently offering a train-meet bus service between Peterborough and Whitby.
4.4.3 ShiningWatersRailway
On January 11, 2011, Progress Report No.1 of the Shining Waters Railway was released. Shining Waters Railway is a community-based organization with the goal of returning passenger and freight service to Peterborough and surrounding communities. The Shining Waters Railways proposal is based on the conclusion outlined in the Metrolinx Commuter Rail Study. The commuter service would include two morning and two afternoon trips from Peterborough to Toronto with Pontypool being the only stop in the City of Kawartha Lakes. Service would not be available until at a minimum 2014.
Transportation Master Plan Municipal Master Plan Project City of Kawartha Lakes February 2012 Page 50
7 Canada-OntarioBuildingCanadaPlanFrameworkAgreement
4.5 Conclusions – Intermunicipal Transit
The City of Kawartha Lakes is not directly serviced by any public intermunicipal transit service.
There is limited service from the private sector and GO Transit has a limited number of stops in the vicinity of the City. A private sector provider has approached the City regarding shuttle service from Lindsay to the Highway 115 stop of the Peterborough GO Bus (Route 88) the proposal is still being finalized.
The greatest demand for home-to-work trips for people living in the City of Kawartha Lakes is to South Durham, North Durham, and the City of Peterborough, with much less of an attraction to Toronto and other employment centres.
The need for transit options for students to Lindsay, and from Lindsay to Peterborough needs to be recognized in the evaluation of intermunicipal transit options.
In 2008, there was a Federal/Provincial funding commitment for a commuter rail link from Peterborough to Toronto, with the only station in the City of Kawartha Lakes being proposed in Pontypool. A study on this rail link conducted by Metrolinx is currently under consideration by the Provincial and Federal Governments.
GO Bus service to the City is likely only in the longer term planning horizon (i.e., beyond five years). Expansion of intramunicipal transit within the City may make this a more viable option.
Transportation Master Plan Municipal Master Plan Project City of Kawartha Lakes February 2012 Page 51
5.0 ACTIVE TRANSPORTION
The City’s new Official Plan contains policies to encourage and promote active transportation and connectivity for pedestrians and all modes of transportation. Active transportation including walking, cycling and use of trails has been shown to promote good health through encouragement of an active lifestyle that reduces risk of disease and ultimately saves on health care costs. Cycling for example, has been recognized as contributing to a reduction in obesity, traffic congestion and climate change, improving quality of life by enhancing social cohesion and inclusion, and enhancing economic development through tourism and leisure. Continued investment and promotion of active transportation offers the City the potential to leverage existing tourism initiatives, for example, through enhanced ‘cycling tourism’. The benefits from active transportation can accrue to a wide range of users including the physically active as well as the elderly, children and persons with disabilities. In this regard, consideration should be given to installing bike racks on municipal buses to promote cycling.
Trails support both urban and rural recreational lifestyles as well as broader environmental and ecological objectives through the preservation and protection of green space. From a social and community benefit perspective, trails offer low cost, unstructured recreation for the enjoyment of individuals and families. In the City of Kawartha Lakes, trails support the concept of a “Community of Communities” and strengthen community bonds.
Emphasizing and integrating active transportation policies and measures into the Transportation Master Plan supports the City and Provincial policies of encouraging the use of modes of travel other than the private automobile. This approach, sometimes referred to as the ‘Complete Streets’8 approach, ensures that transportation rights of way are planned, designed and operated to enable safe access for all users including drivers, transit users, pedestrians, cyclists as well as for older people, children and persons with disabilities.
In undertaking the active transportation assessment, all available data in regard to pathways, cycle facilities, walkways and trails used by pedestrians, cyclists, snowmobiles and all-terrain vehicles (ATVs) were reviewed. This comprehensive review included the Trails Master Plan for the City of Kawartha Lakes as well as Council Reports regarding the use of ATVs on pathways and roadways, including By-law 2009-116.
The existing and recommended trails system in the City is described in the Trails Master Plan and shown on Figure 1 (City-Wide) and Figure 2 (Lindsay) of that Plan (reproduced herein as Figure5-1 and Figure 5-2). It includes a number of trail corridors and nature areas which link the urban communities, rural farmland, forests and lake systems. The primary City-owned recreational trail is the Victoria Rail Trail Corridor (VRTC) which extends across the municipality from north to south, and a network of trails in the forest management areas.
8 More information is provided by the National Complete Streets Coalition on their web site (http://www.completestreets.org).
Transportation Master Plan Municipal Master Plan Project City of Kawartha Lakes February 2012 Page 52
Source: Kawartha LakesTrails Master Plan (March 2006) Figure 1
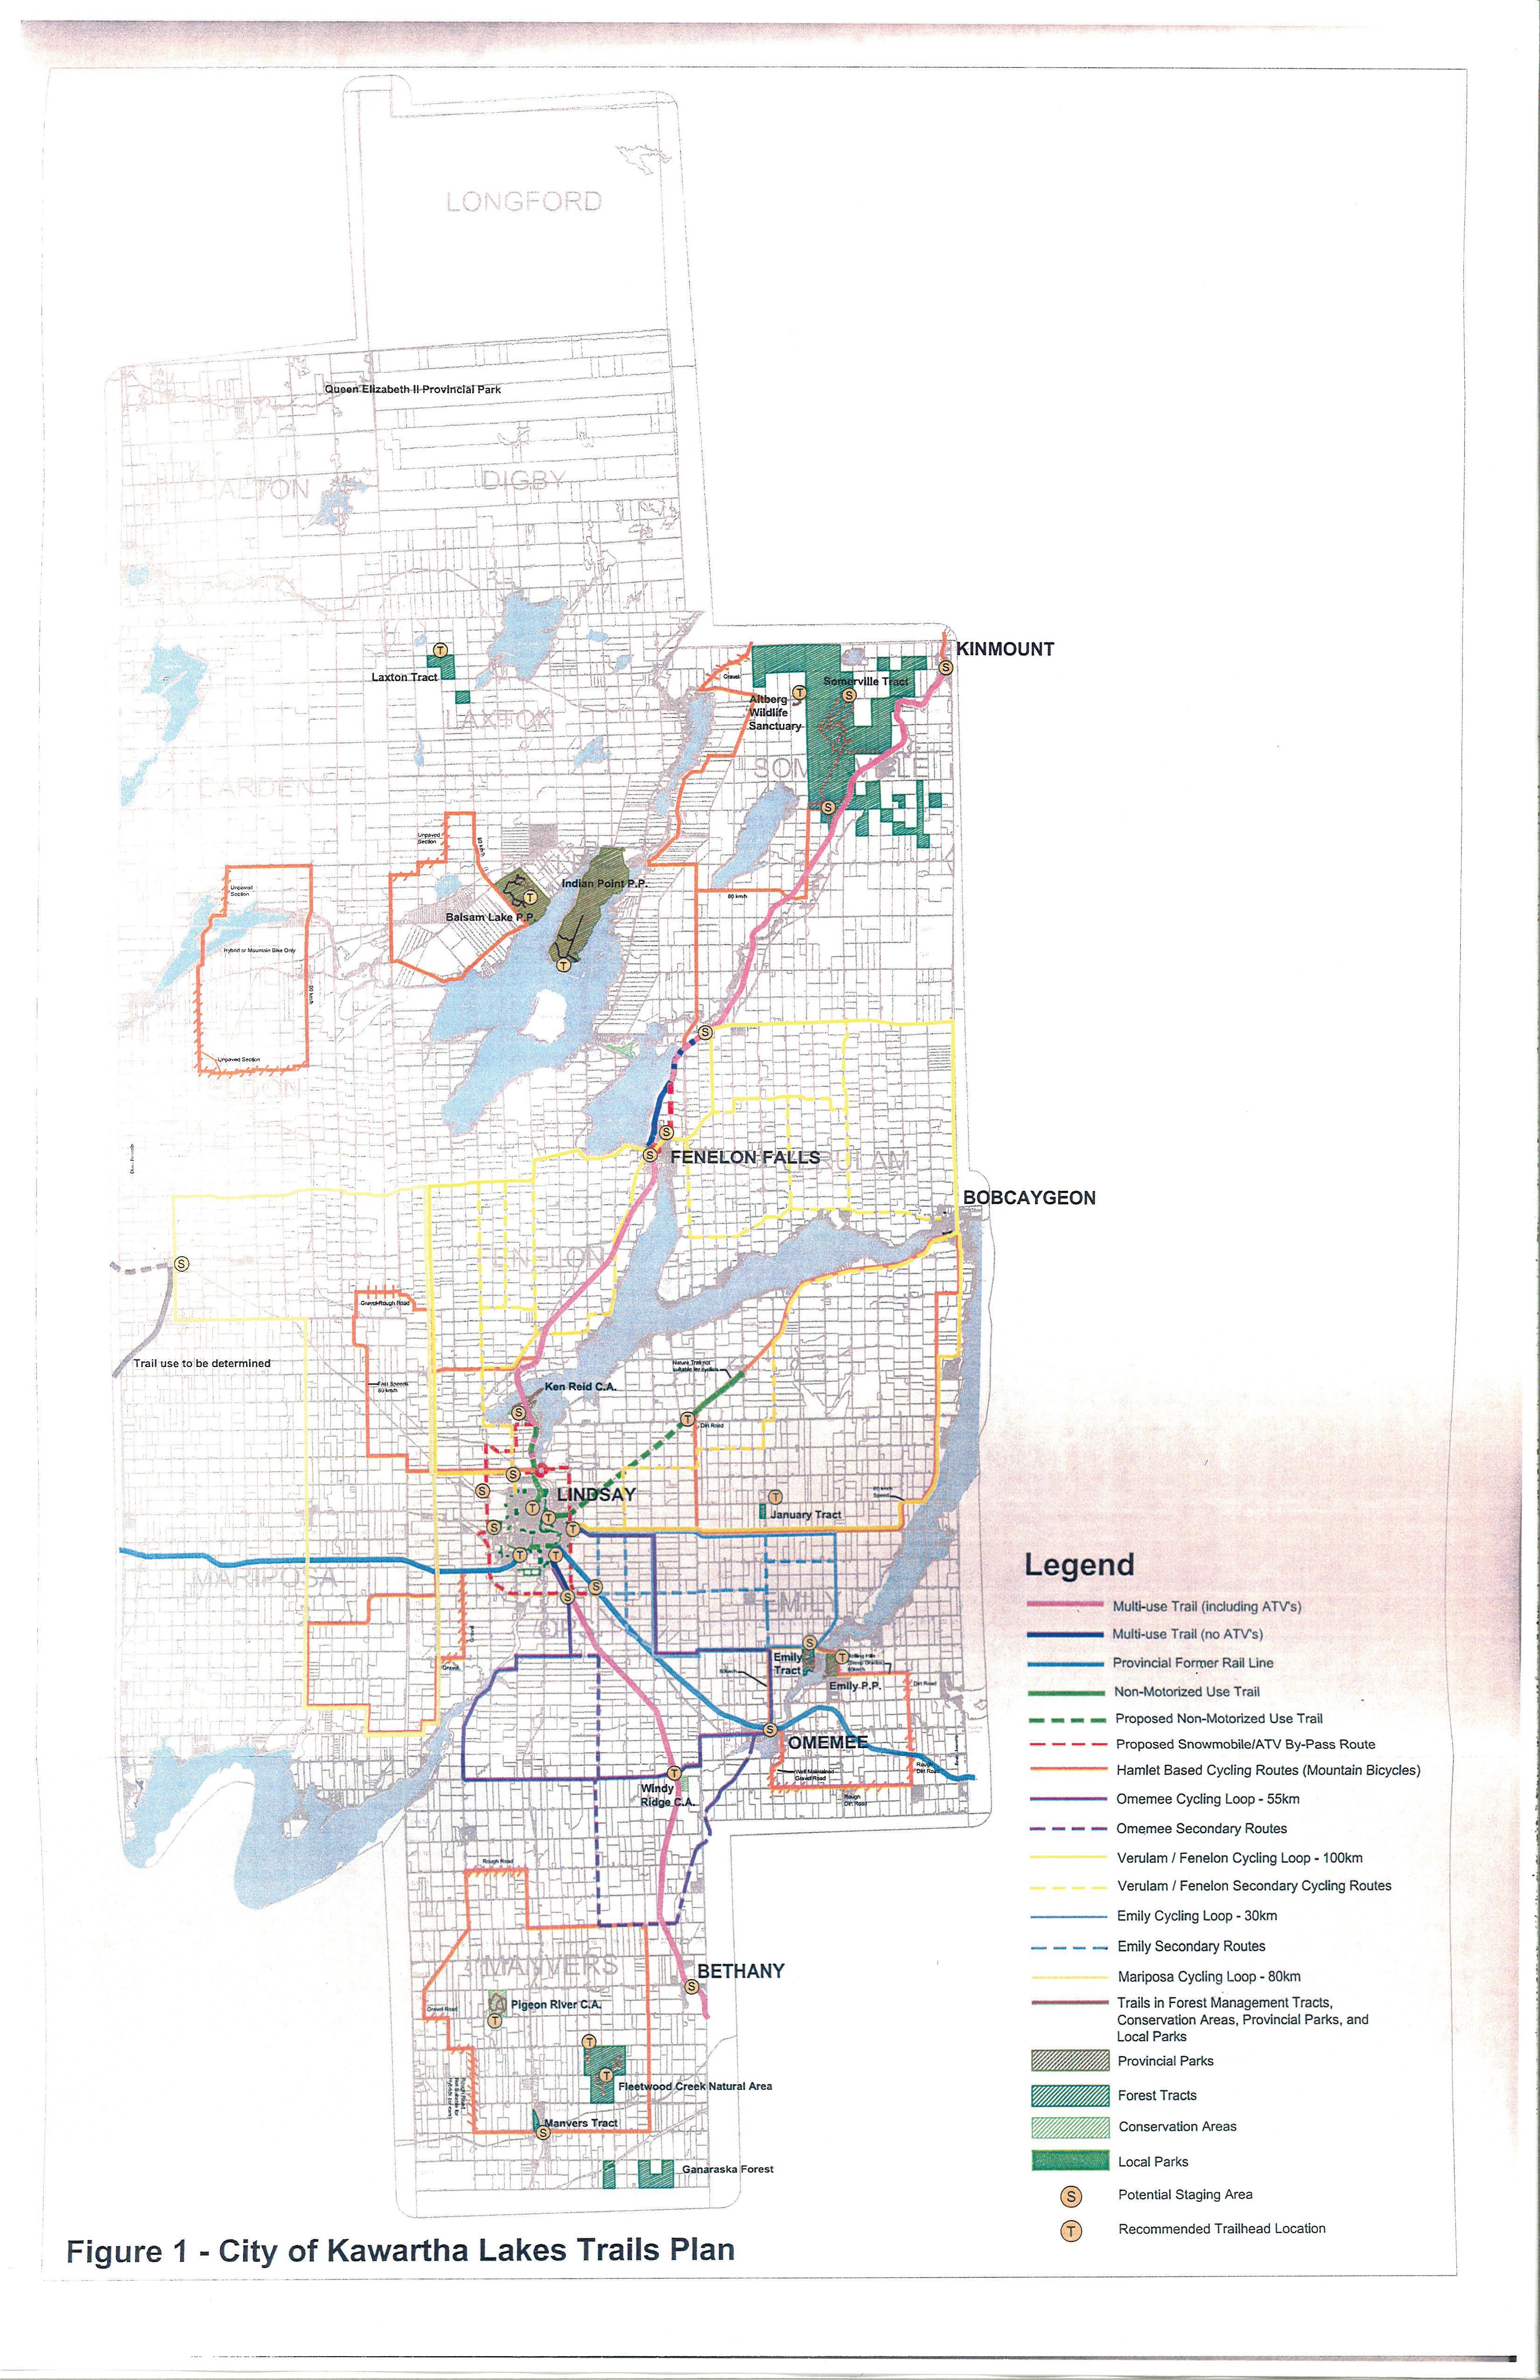

 Figure 5-1
City of Kawartha LakesTrails Plan
Figure 5-1
City of Kawartha LakesTrails Plan
Source: Kawartha LakesTrails Master Plan (March 2006) Figure 2
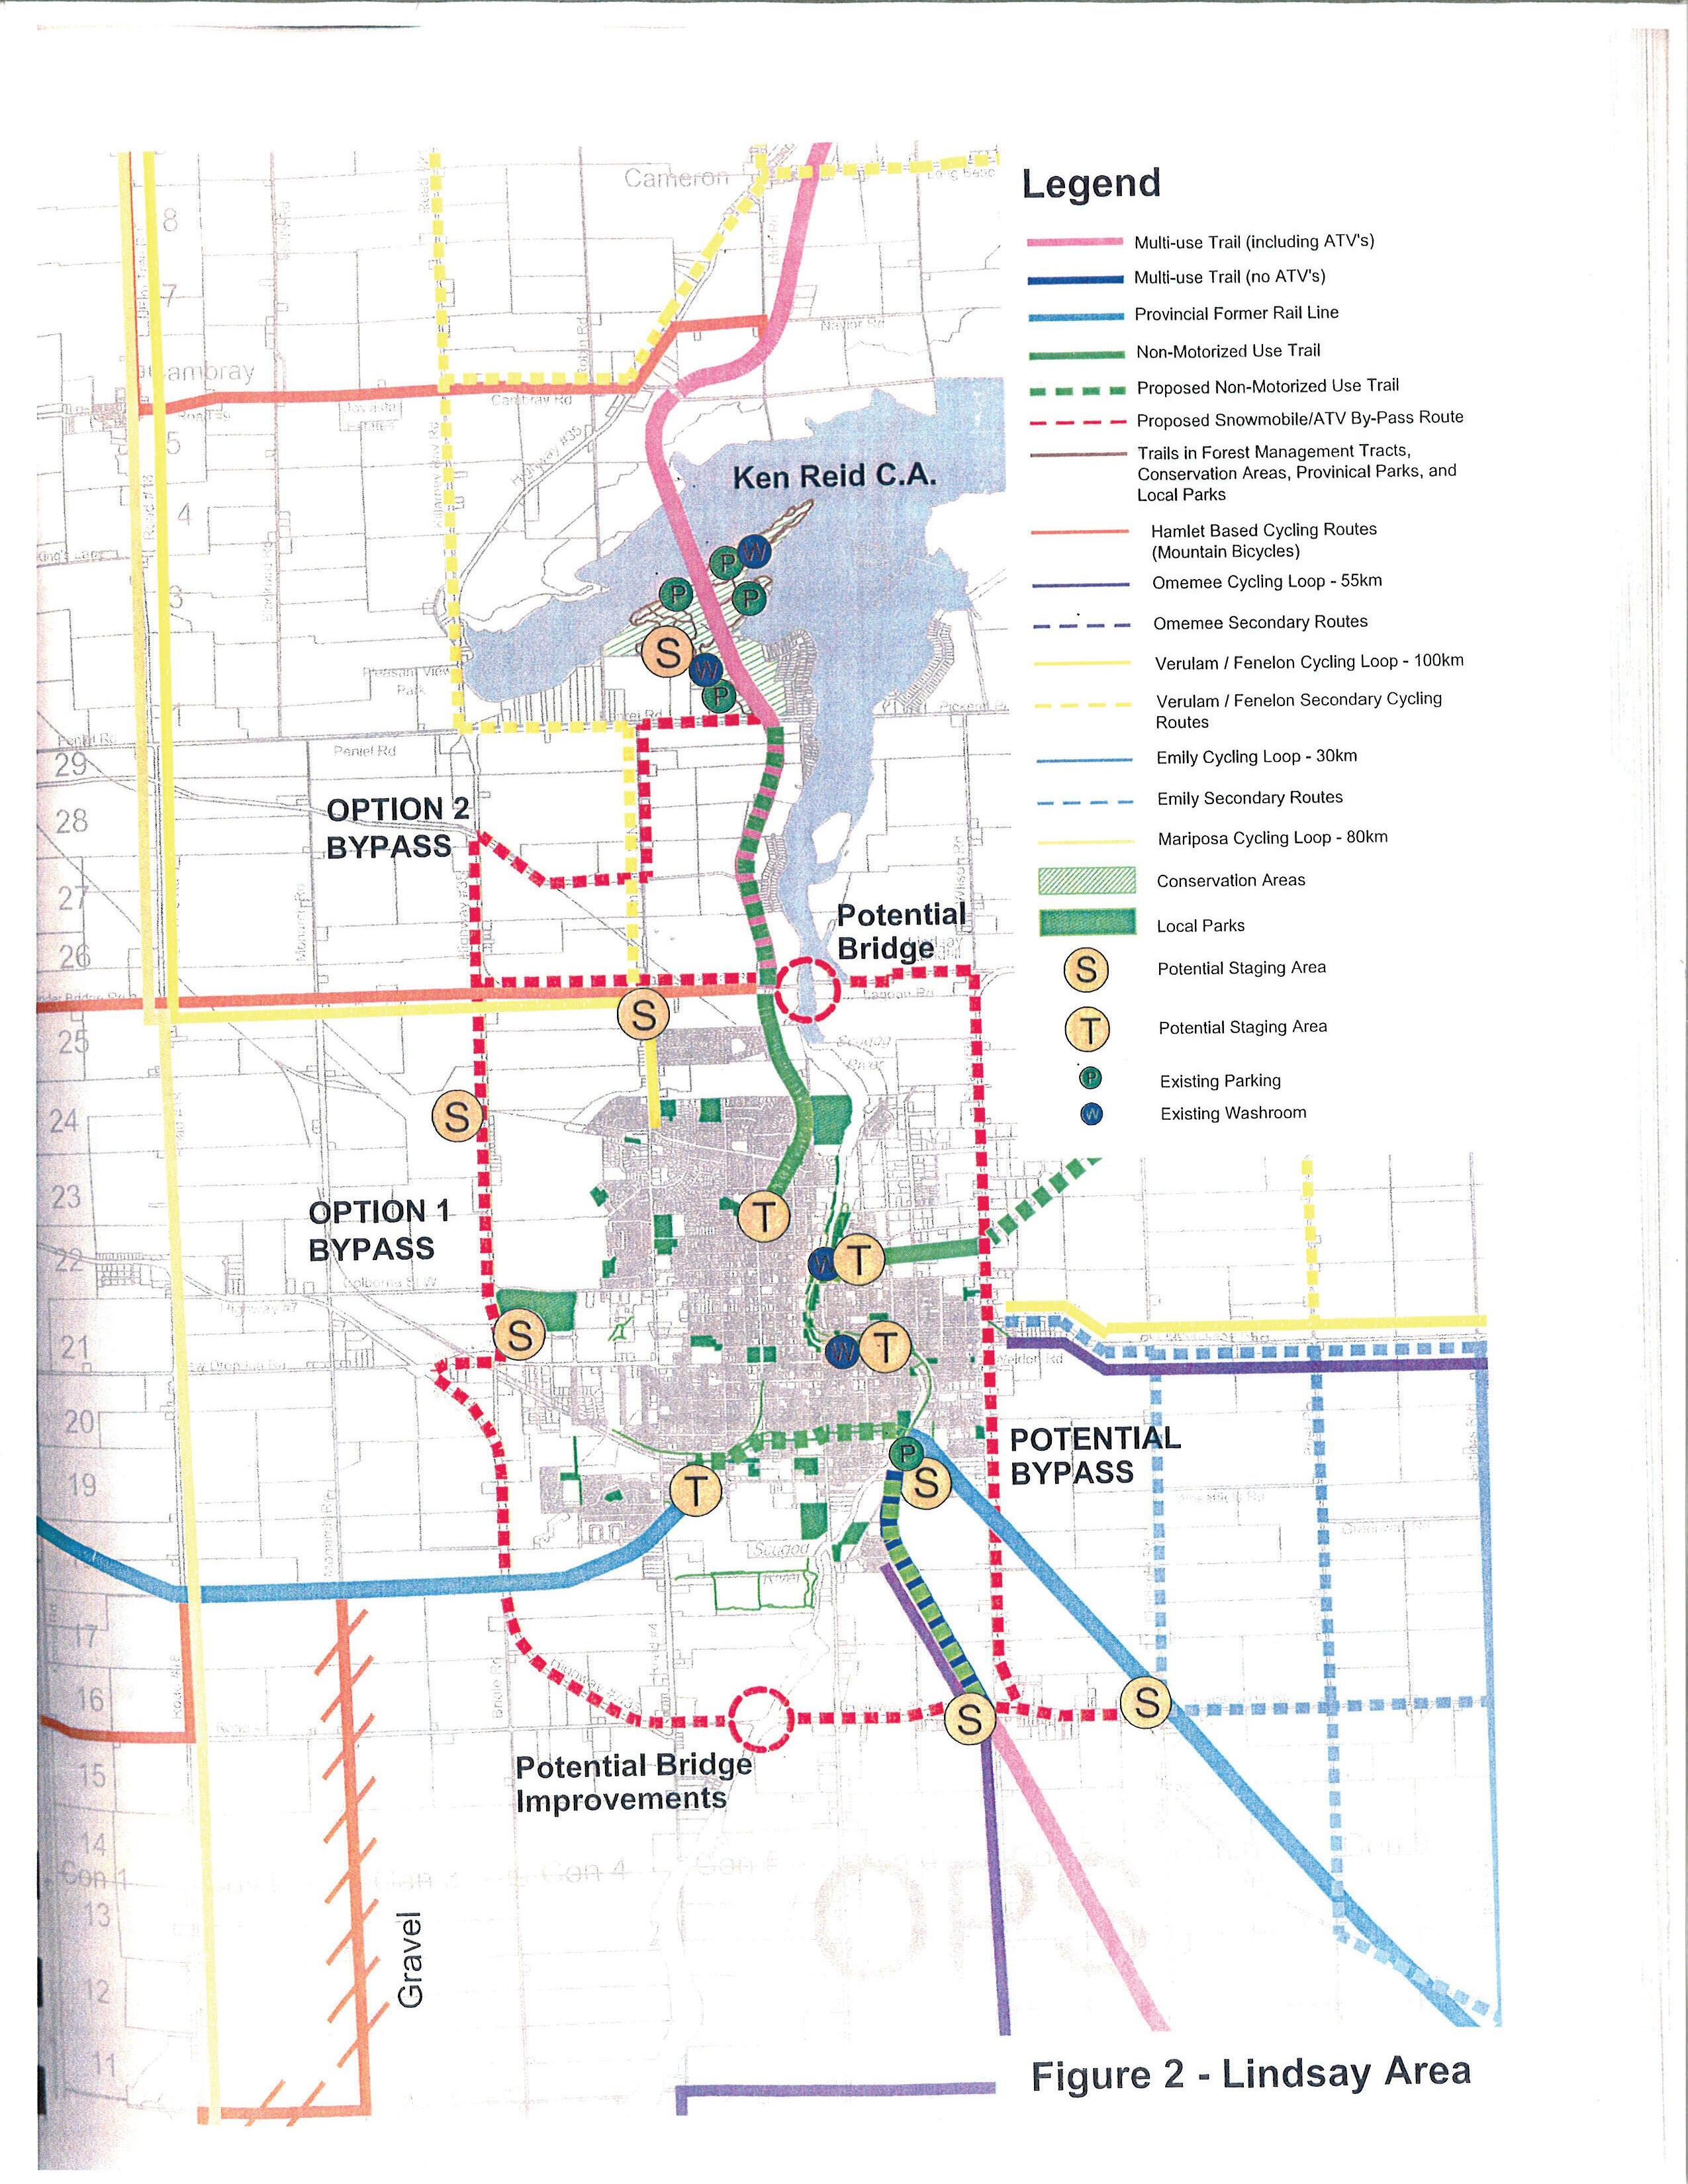
Figure 5-2
LindsayAreaTrails Master Plan

The municipal system is supported by an east-west Provincially-owned rail-trail which is operated by the Kawartha Trans Canada Trail Association, as well as a range of trail loops in conservation areas and Provincial parks. The east-west trail intersects the City’s north-south trail in Lindsay and forms an important node in the national Trans-Canada Trail network. A map of the Kawartha TransCanada Trail in Lindsay has been reproduced herein as Figure5-3.
A number of issues related to active transportation and to trails development were identified in the Trails Master Plan. These can be generally broken down between trails and cycling and are discussed below.
5.1 Trails
A need for a comprehensive and coordinated approach to trails planning, management and maintenance, to ensure a seamless connectivity between City-owned and Provincially-owned trails in the City, and those trails outside the City
A need to coordinate efforts for trails promotion and marketing, to update current trails and cycling information and materials
Conflicts with the multi-use nature of the various trails that may require further regulation for shared use, or areas of restricted use. [In this regard, the City has enacted a By-law which clearly regulates uses. This includes specific restricted uses and the By-law is properly sanctioned for any groups with By-law permissions.]
A need for urban by-pass routes, particularly for motorized trail uses.
A need for further trail surface improvements on the VRTC
Identifying opportunities for economic/tourism benefits through the development of other trail corridors, including the Trans Canada Trail, an urban trail through Lindsay, or the use of other rail line corridors
5.2 Cycling
A need for signed safe cycling routes in the urban areas
A need for cycling routes to connect the gaps in the VRTC
A need to identify safe routes for children through the urban areas, particularly in Lindsay
These issues were addressed in the Trails Master Plan and resulted in a number of recommendations in each case. Some issues identified in the Trails Master Plan were noted as being beyond the scope of that study. Specifically, in the case of ATV use on municipal roads, the report notes the following:9
Transportation Master Plan Municipal Master Plan Project City of Kawartha Lakes February 2012 Page 55
9 Envision,dmAPlanning&ManagementServices,SRMAssociates,“Trails Master Plan for the City of Kawartha Lakes”, Toronto,2006,pages35–36.
Source: http://www.kawarthatranscanadatrail.ca/map/downloads.html


KawarthaTrans Canada
Map (Lindsay)
Figure 5-3
Trail
“Issue: Urban By-pass Routes
…Although this is an area of interest to the ATV association, it was not the mandate of the Trails Master Plan to investigate the feasibility of the road network to support widespread road-based ATV use throughout the City. Such a decision would require review of traffic volumes on roads, more in-depth discussion with the ATV and snowmobile associations, and local residents, and discussion with City staff and the police forces on safety and enforcement issues. As well the policies and regulations of neighbouring municipalities should be examined to ensure the consistent application of policies on connecting roads…”
MTO has published criteria for where off-road vehicles (ORVs) can and cannot travel. These criteria indicate that ORVs can travel when the following conditions are met:10
“Provincial highways with a summer average daily traffic (SADT) level less than 5,000. Specific provincial highways where ORVs (Off Road Vehicles) can/cannot travel are defined in the regulation schedules.
Municipalities may pass by-laws to decide if, where and when off-road vehicles can be used on local roads.”
A network of municipal roads where it would be feasible from a traffic perspective for ATVs to travel along the shoulder could be determined by applying the maximum traffic volume criteria, subject to the other requirements of the Highway Traffic Act, Ontario Regulation 316/03. However, the municipality would need to enact a by-law regulating the use of ATVs (and other off-road vehicles) for this to be permitted. At this point in time, ATV (municipal) road use is approved by municipal bylaw north of CKL Road #8 and through Fenelon Falls.
Table 5-1 shows the traffic volumes for sections of the by-pass routes recommended around Lindsay and indicates that the use of sections of Provincial highways should not occur on the shoulder areas, but on a trail removed from the highway. Similarly, the section of Thunder Bridge Road between Highway 35 and Angeline Street has volumes less than the maximum criteria for most of the planning horizon, but toward the end of the planning horizon, is expected to carry volumes in excess of the level deemed acceptable for ORVs using the road shoulder area. Should the summer average daily traffic (SADT) volumes exceed 5,000 vehicles per day (or equivalently, have the average annual daily traffic (AADT) volume surpass 4,000 vehicles per day) an off-road trail in this section will be necessary. These requirements must be incorporated into the planning for future improvements to this roadway as well as any others that may be used as part of the ATV/snowmobile system.
10 MTO, “Changes to Ontario’s Off-Road Vehicles Legislation/Regulations”, On-line document at URL: http://www.mto.gov.on.ca/english/dandv/orv.shtml.
Transportation Master Plan Municipal Master Plan Project City of Kawartha Lakes February 2012 Page 57
LessThan4000 AADT(Vehicles PerDay)
The data on the modes of transportation used by City residents and employees indicates that walking and cycling are used generally to the same degree as the Ontario average. However, the City has an enviable trails system and nature areas linking its settlement areas, rural farmland, forests and lake systems. It has access to the Trent/Severn Waterway, winter sports activity areas and is proximate to the Toronto – Peterborough – Kingston markets. With these assets, increased use of active transportation modes, including walking, cycling, and snowmobile/ATVs, for either recreational or utilitarian purposes is a desirable and achievable goal. Recent surveys on transportation indicated that most Canadians would like to walk and cycle more, particularly for the shorter distance trips (less than 5 km). Some factors including health and weather may inhibit them from doing so. However, the majority of respondents have indicated that the primary reason they do not cycle or walk more is their concern about safety on the road. The challenge facing the City to encouraging greater use of active transportation modes is affecting a change in this belief and to break down entrenched attitudes while simultaneously improving the physical environment that discourages using alternative modes of travel.
The solution rests partly in the adoption of a “complete streets” approach to planning and improvement design. This includes providing on- and off-street facilities to accommodate active transportation more safely. This includes:
Understanding the gaps in the current system (as identified in the Trails Master Plan)
Identifying an appropriate improvement to fill the gap (network connectivity
provision
February 2012 Page 58
Transportation Master Plan Municipal Master Plan Project City of Kawartha Lakes
Table 5-1: Potential Urban By-Pass Route On-Road ORV Use Assessment
and
Roadway From To Existing (2009) Future (2031) Existing (2009) Future (2031) ThunderbridgeRoad Highway35 AngelineStreet 3327 4717 √ ThunderbridgeRoad AngelineStreet ScugogRiver 204 290 √ √ LagoonRoad ScugogRiver CKLRoad36 23 32 √ √ CKLRoad36 WilsonRoad PigeonLakeRoad 10799 15312 CKLRoad36 PigeonLake Road Highway7 5928 8406 Highway7 CKLRoad36 LindsayStreet 11440 16221 Highway7/35 LindsayStreet AngelineStreet 10760 15257 Highway7/35 AngelineStreet KentStreet 7973 11305 Highway35 KentStreet OffRoadTrail 10940 15512 AngelineStreet OffRoadTrail KenreiRoad 1805 2560 √ √ KenreiRoad AngelineStreet KenreiPark 959 1360 √ √
of on or off-street facility such as sidewalks, bike paths/lanes, paved shoulders, or off-road treatments
Advertising and promotion of this availability (through signage, promotional literature)
Conducting educational programs targeting adults and children regarding the use of these facilities and fostering a “Share the Road” mindset
Encouraging community initiatives such as community bike rides or an “Active and Safe Routes to School” program
Encouraging businesses through incentives to offer employees storage and shower facilities for those who choose to not take their car to work
Alternatives to address these issues and specific policy, planning and operational recommendations to encourage greater use of active modes are provided in Section 9 of this report.
Transportation Master Plan Municipal Master Plan Project City of Kawartha Lakes
Page 59
February 2012
6.0 PARKING
The ToR for the Transportation Master Plan included a requirement to assess parking needs and walkablilty in three urban areas. In discussion with City staff, it was determined that a parking assessment should be completed for the urban settlement areas of Lindsay, Fenelon Falls, and Bobcaygeon.
6.1 Urban Area Parking Supply
An inventory of the existing parking facilities in the urban settlement areas of Lindsay, Fenelon Falls and Bobcaygeon was undertaken to confirm the amount and type of parking provided (on and offstreet) and the parking regulations applicable in each case. A summary of the parking inventory is provided in Table6-1.
Table 6-1: Settlement Area Parking Inventory
The findings from this inventory for each of the three communities are discussed in the following sections.
6.1.1 Lindsay
The location of public parking in the downtown area of Lindsay is shown on Figure 6-1 and summarized in Table6-1. Within the Business Improvement Area (BIA) there are more than 500 parking spaces, split roughly equally into on- and off-street parking areas. A unique feature of the parking in the downtown area is the angled on-street parking on Kent Street between Lindsay Street and Victoria Street. On-street parking in the core area is generally metered parking at a rate of $0.50 per hour. Within this area, there are also eight municipal parking lots that have paid parking available either on a permit basis or paid basis via Pay ‘n’ Display ticket issuing machines.
6.1.2 Bobcaygeon
As noted in Table6-1, there are 174 parking spaces in the downtown area of Bobcaygeon. In this area, Bobcaygeon provides on-street parking along Bolton Street between Canal Street and King Street as well as a municipal parking lot. In addition, there are also private parking lots provided for businesses that front onto Bolton Street and are located within a short walking distance of Bolton Street. Figure6-2 illustrates the existing parking supply in Bobcaygeon.
Transportation Master Plan Municipal Master Plan Project City of Kawartha Lakes February 2012 Page 60
SettlementArea On-StreetSpaces MunicipalLotSpaces TotalSpaces Bobcaygeon 138 36 174 Fenelon Falls 181 170 351 Lindsay 276 230 506
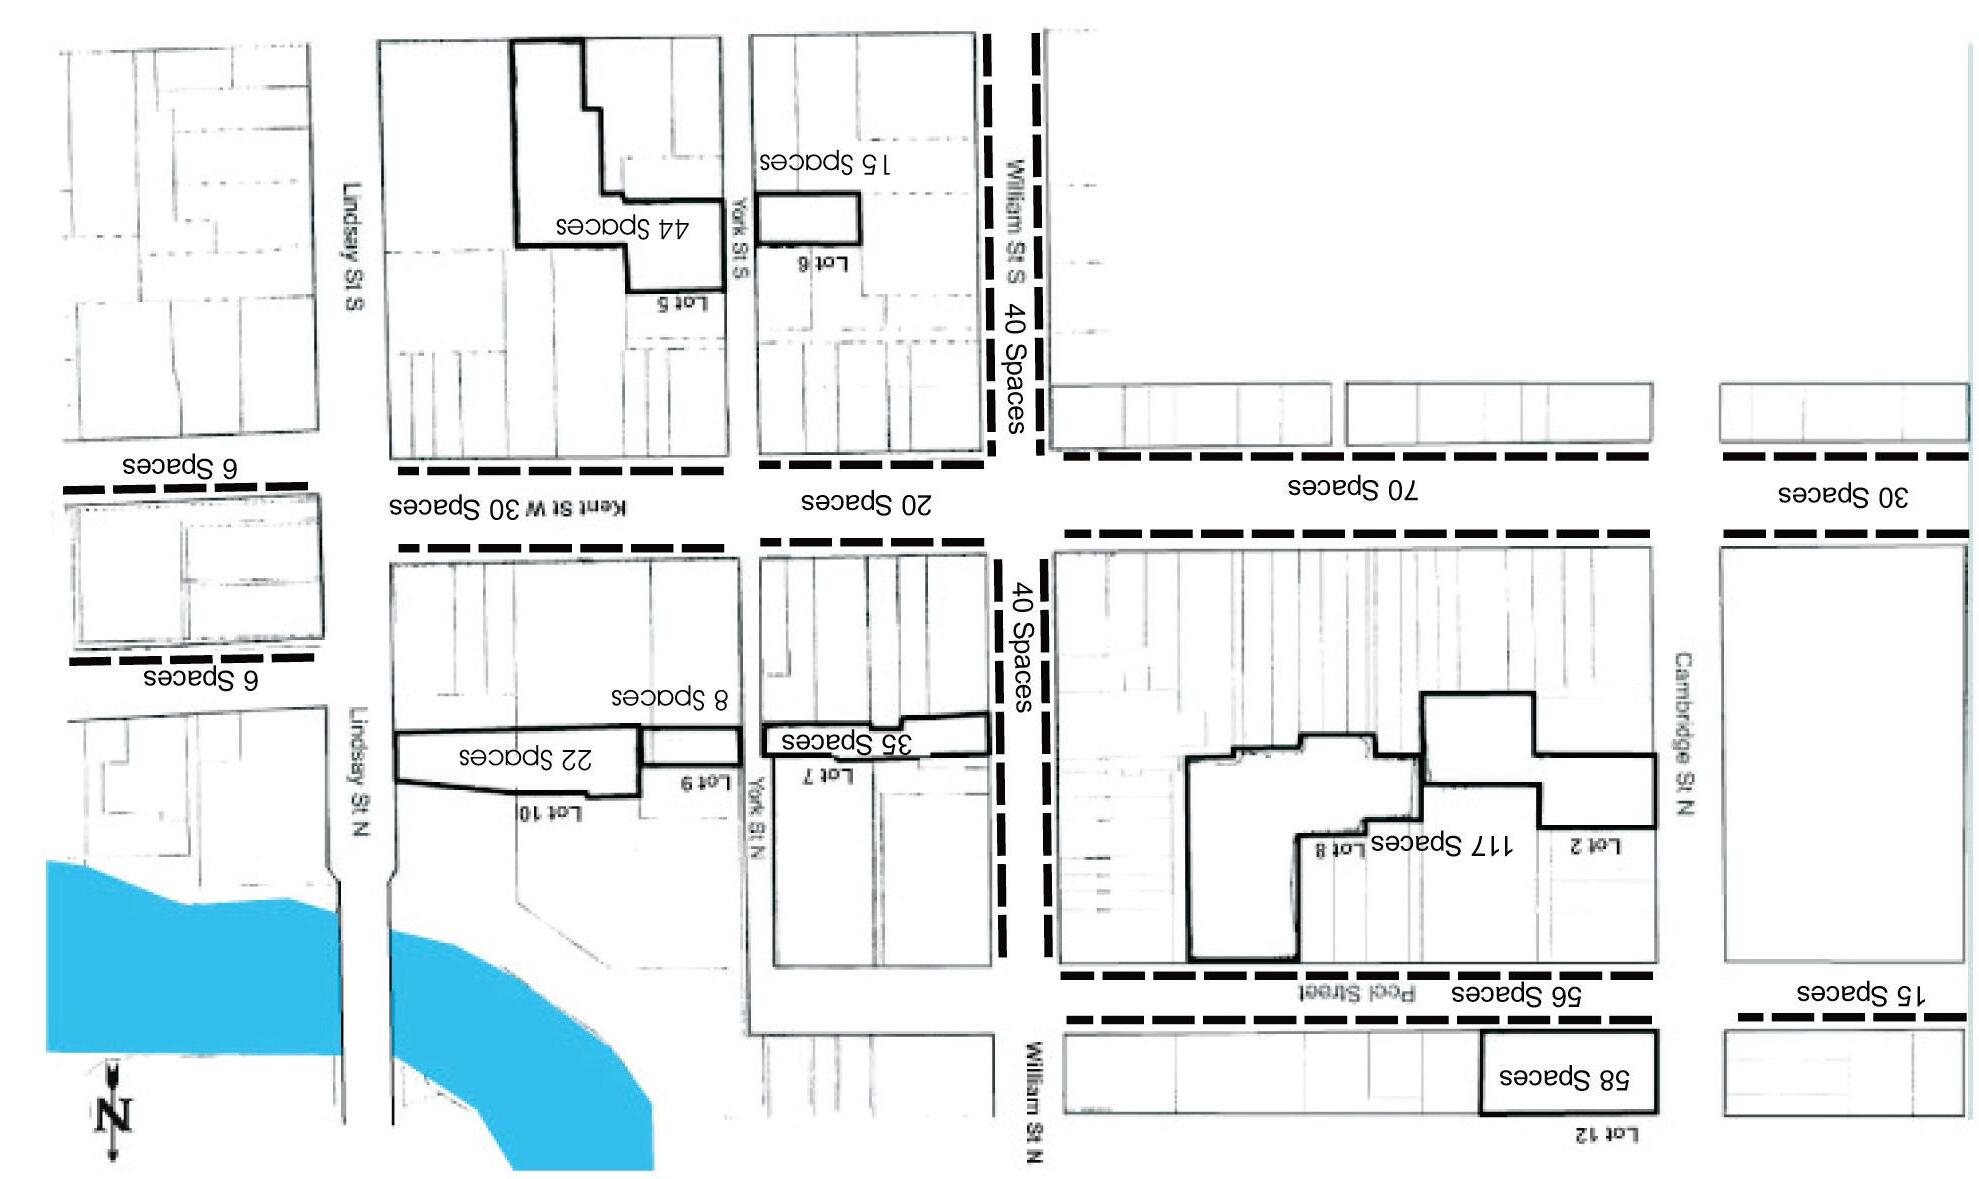
Peel Street Cambridge Street William Street Kent Street Lindsay Street York Street Lot 12 Lot 2 Lot 8 Lot 7 Lot 8 Lot 10 Lot 5 Lot 6
6-1 CoreArea Parking Inventory - Lindsay Russell Street 12 Spaces 112 Spaces 31 Spaces 6 Spaces 20 Spaces 30 Spaces 18 Spaces 20 Spaces 151 Spaces 17 Spaces VictoriaAvenue 19 Spaces 20 Spaces
Figure
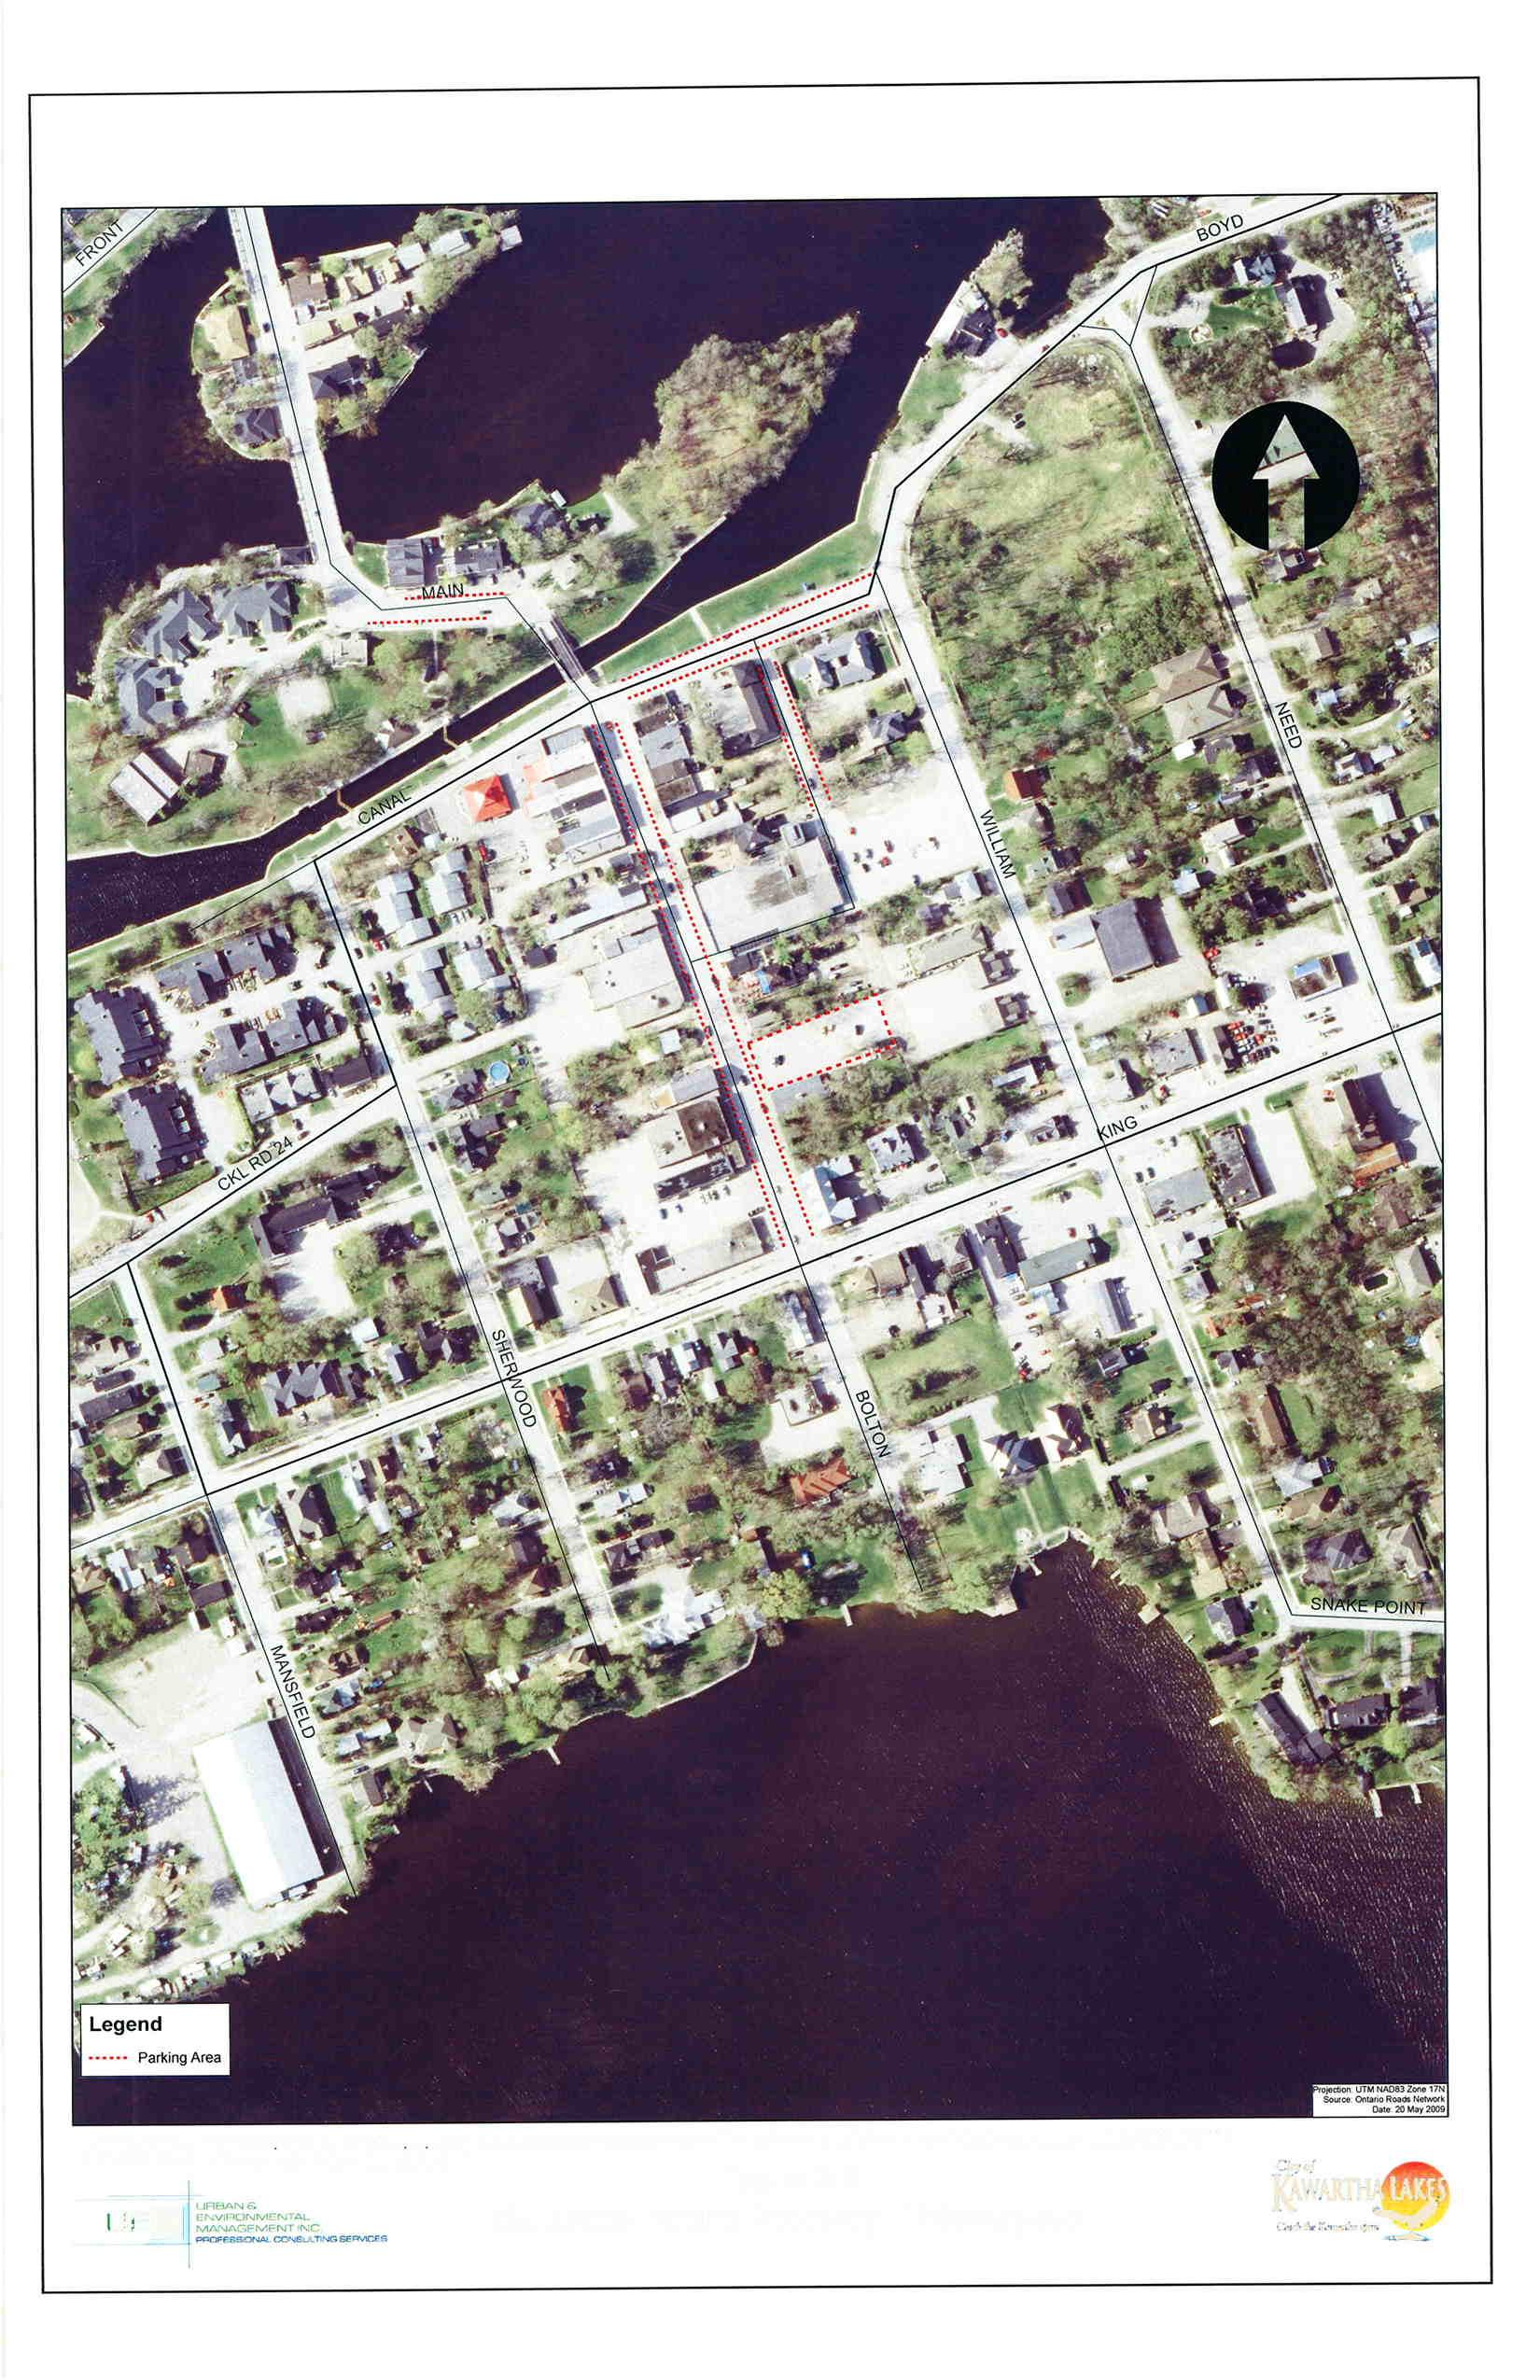
2005-283 Schedule E - Municipal Lots W¡thout Meters Figu re 6-2 i(ìrv,rnln,,r LAKt\ t\< JEM Core Area Parking Inventory - Bobcaygeon
6.1.3 FenelonFalls
Fenelon Falls provides on-street parking within the downtown area (concentrated along Colborne Street between Water Street and Francis Street). On-street parking is provided along a majority of streets within the downtown Fenelon Falls area. There are also public and private parking lots available in this area just off of Colborne Street. Figure6-3 illustrates the existing parking supply in Fenelon Falls.
6.2 Existing Parking Utilization
In early September 2009, a parking occupancy study was undertaken in Lindsay to determine the usage of existing parking facilities and on-street parking spaces in the downtown area. The study involved monitoring parking activity in approximately 390 parking spaces within the BIA area. The monitored areas included a sample of the eight off-street municipal parking lots and the on-street parking spaces, as summarized in Table6-2
Overall the survey included a sample of 94 on-street parking spaces and 299 off-street parking spaces or approximately 64 percent of the total parking spaces in the downtown area.
The study involved undertaking counts of parked vehicles at three times during the course of a weekday; 10:30 a.m., 12:10 p.m., and 2:40 p.m. The study was completed during the tourist season to capture both tourist and local parking demand on a summer weekday.
The results of the on and off-street parking occupancy survey are summarized in Table 6-3. As expected, the occupancy rates tend to fall as the walking distance to Kent Street East increases. The study shows the on-street parking along Kent Street East is well utilized during the peak summer season. The occupancy rates fall for both on-street and off-street parking in relation to the distance away from Kent Street East. On-street parking is well utilized while the off-street parking that is located within a short walking distance is mostly vacant. The study reveals that there is ample parking available within a short walking distance (approximately 100 meters) within the downtown area.
Transportation Master Plan Municipal Master Plan Project City of
February 2012 Page 63
Kawartha Lakes
ParkingLocation ExistingParking (Spaces) SampledParking (Spaces) SampleSize (Percent) Off-Street Municipal Parking Lot 299 299 100 On-Street Parking 313 94 30 Total 612 393 64
Table 6-2: Parking Occupancy Survey Sample
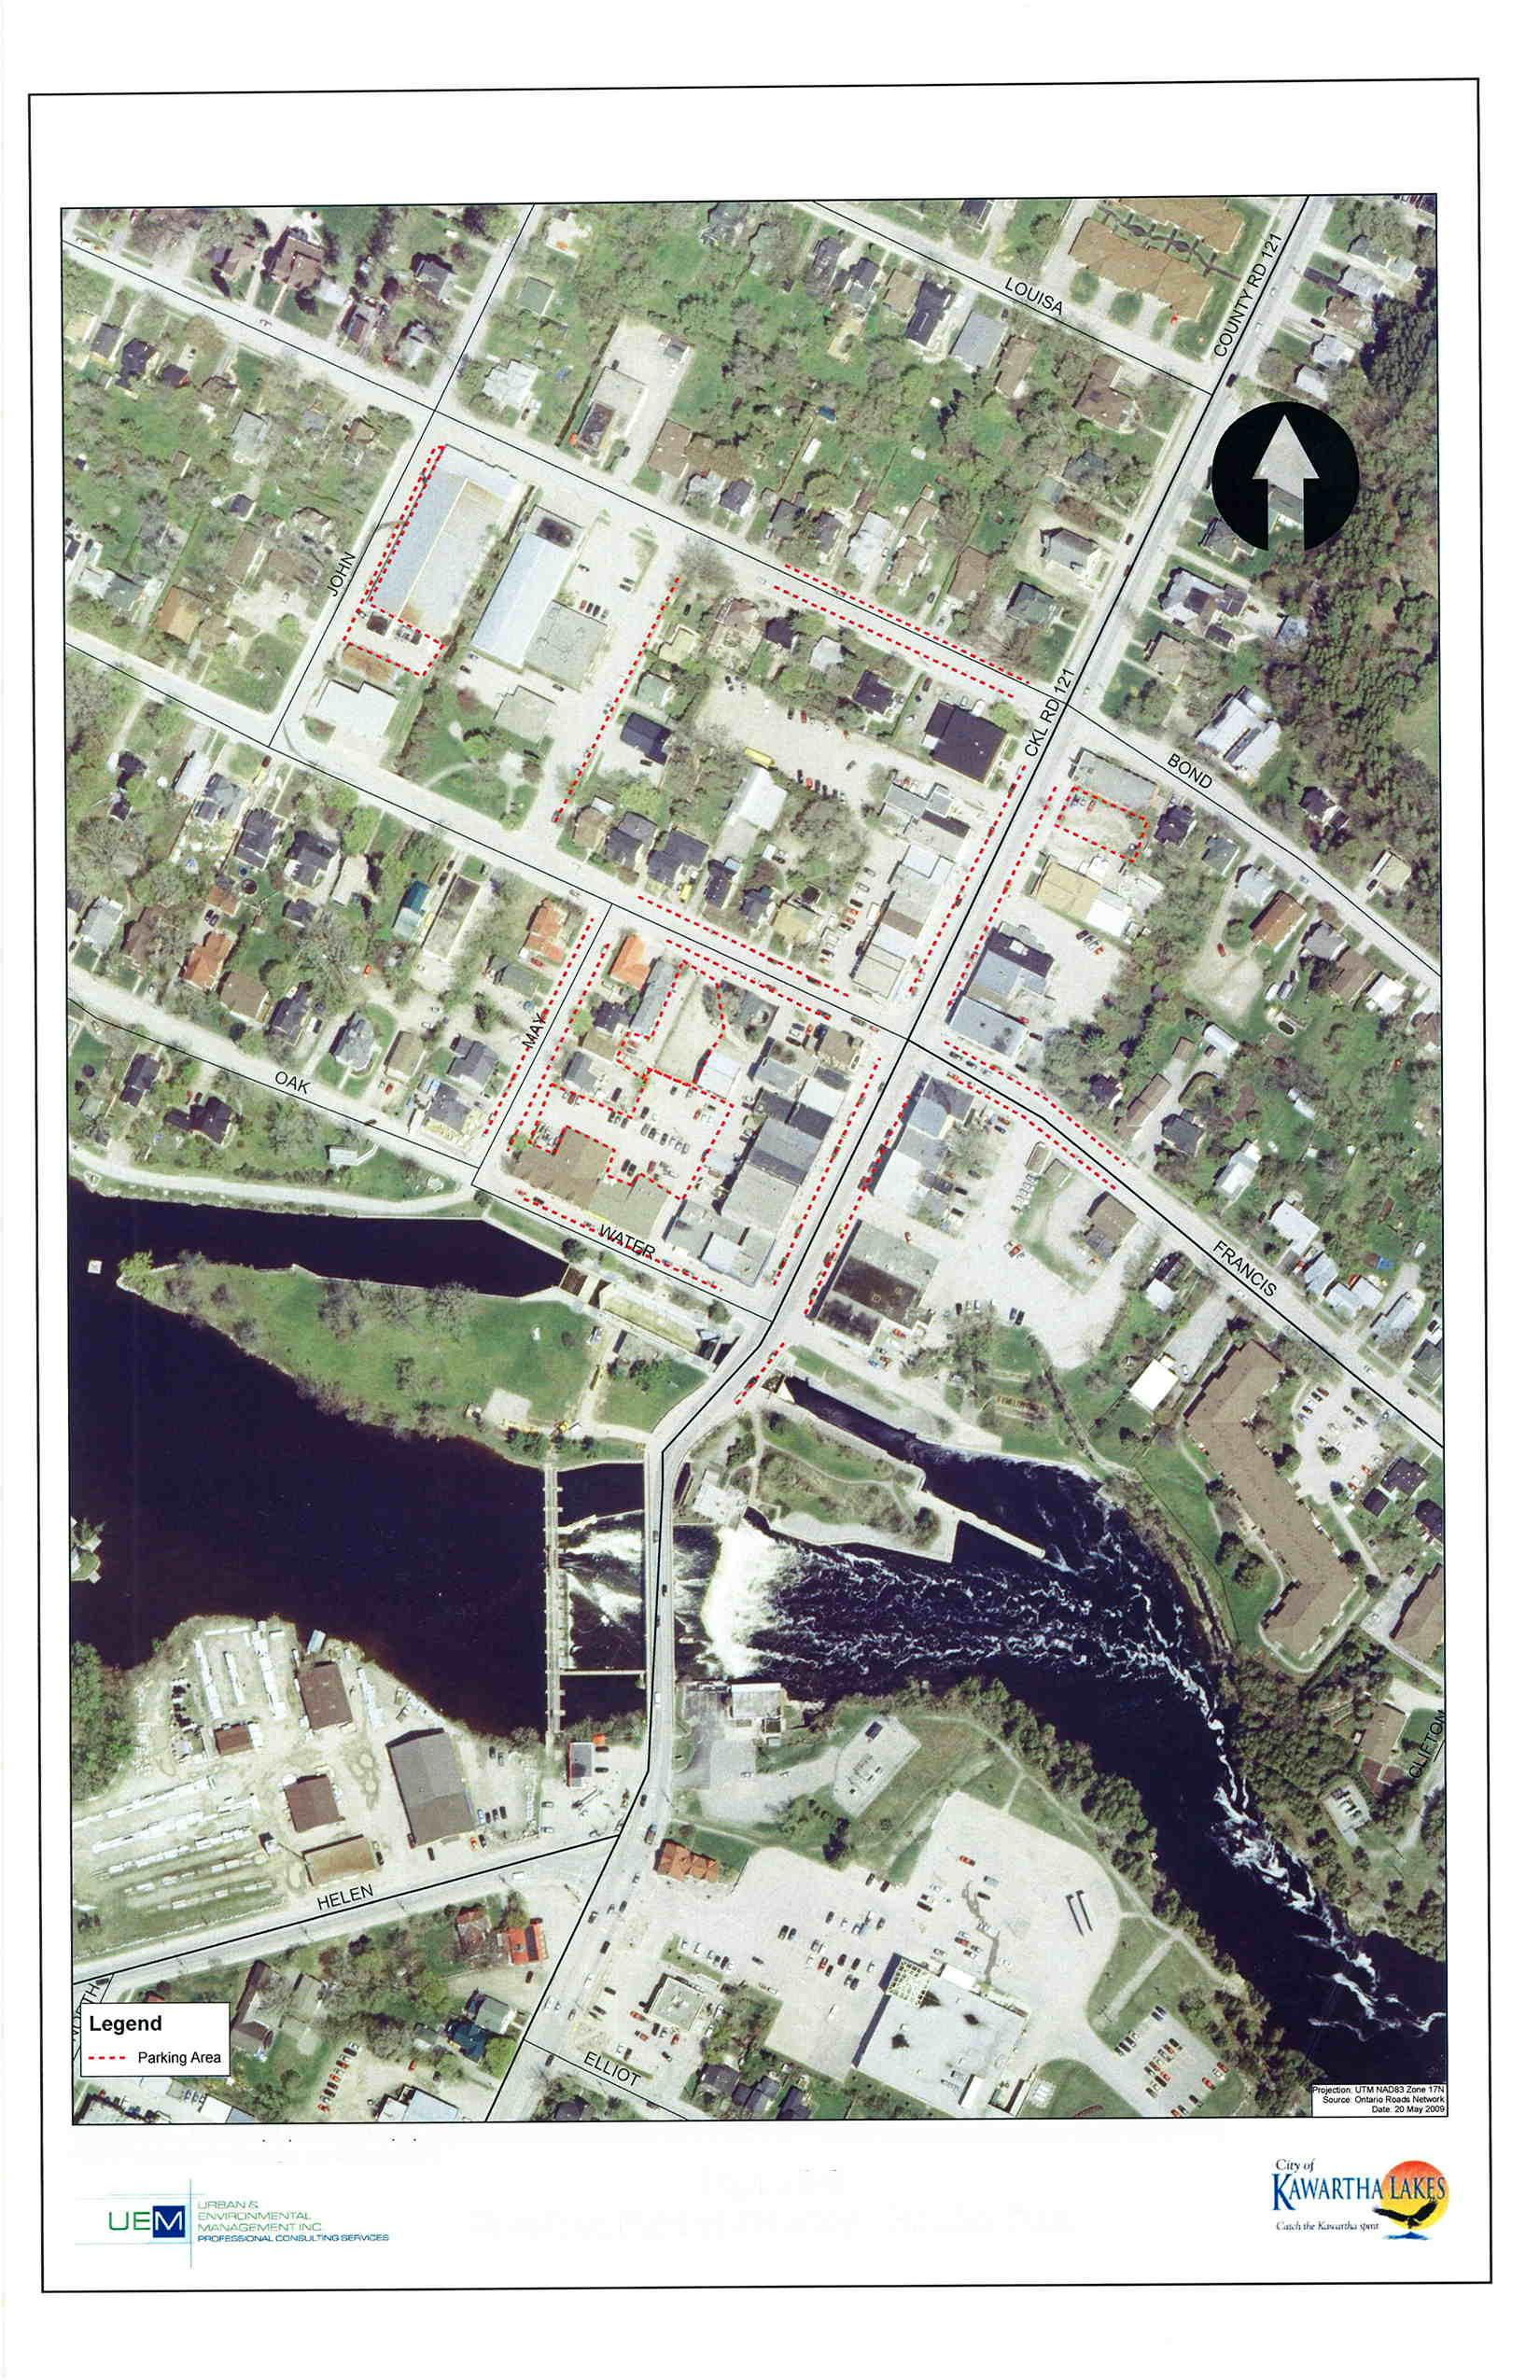
2005-283 Schedule E - Mun¡c¡pal Lots W¡thout Meters
Figure 6-3
Core Area Parking lnventory - Fenelon Falls
Table 6-3: Parking Occupancy Summary
6.3 Future Parking Requirements
Projections of future parking requirements have been based on the following parameters/assumptions:
1. Parking demand will be increased from the added residential development, from both permanent and seasonal population increases within the planning horizon
2. Parking utilization in other urban areas of the City will be similar to that observed in Lindsay
In 2006, Lindsay had a population of 19,361 persons11. By 2031, a total permanent resident population of approximately 31,00212 is forecast. In addition to the permanent resident population, the impact of a seasonal population increase in the City of Kawartha Lakes and travelling through Kawartha Lakes will result in the equivalent of an additional 11,470 persons in the summer months13 in Lindsay. This seasonal population increase will generate parking demands during the summer months that need to be considered when evaluating future parking requirements.
11 BasedoncensusinformationprovidedbyStatisticsCanada.
12 StrategypreparedbyMHBCPlanningLimited,June2010.
13 GrowthManagementStudy Background documentsprepared by Watson& Associates. Based oninformation providedintheCityofKawarthaLakesSection6.4. In 2031theseasonalpopulationwilladdanadditional37%to thepopulationestimates.
Page 65
Transportation Master Plan Municipal Master Plan Project City of Kawartha Lakes February 2012
ParkingAccumulation (No.ofParkedVehicles) Location Spaces 10:30 a.m. 12:10 p.m. 2:40 p.m. Average Maximum Occupancy(%) On-StreetParking Permit 20 4 6 4 4.7 30% Meter 74 40 56 40 45.3 76% Total 94 44 62 44 50.0 66% Off-StreetParking Permit 58 46 46 38 43.3 79% Meter 241 103 122 114 113.0 51% Total 299 149 168 152 156.3 56% TotalOn-andOff-StreetParking Permit 78 50 52 42 48.0 67% Meter 315 143 178 154 158.3 57% Total 393 193 230 196 206.3 59%
The current parking utilization in the downtown area was observed to be approximately 59 percent of the available supplied number of parking spaces during the late summer period. Approximately 41 percent of spaces are available to accommodate future growth in parking demand arising from increases in tourism activity and from local resident parking demand. With the projected increase in permanent and seasonal population to the end of the planning period (2031), parking demand can be expected to increase in proportion to the population increase. Towards the end of the planning period additional parking facilities will be required to accommodate the added local and visitor demands. The projected parking requirements in each of the urban settlement areas are summarized in Table6-4.
*NoteIn2031theseasonalpopulationwilladdanadditional37%tothepopulationestimates.
As shown in Table 6-4, the public parking infrastructure will need to be expanded to meet the projected 2031 demands during the summer months when parking demands are expected to be at their highest levels in these communities. The shortfall between what the current parking infrastructure system provided and what will be required is 264 spaces for Lindsay, 210 spaces for Fenelon Falls and 57 spaces for Bobcaygeon. These additional parking spaces can be provided through in on- or off-street parking areas. In view of the limited curb space in the downtown areas of these communities, it is anticipated that much of the future parking spaces will be provided by surface parking in off-street areas.
Parking should be as convenient as possible. On-street parking is the most convenient, but supply of this form of parking is constrained by the curb space available. Prices for on-street parking should be higher than other types of parking to encourage parking turnover (to increase its availability at any
Plan Municipal Master Plan Project City of Kawartha Lakes February 2012 Page 66
Transportation Master
Bobcaygeon FenelonFalls Lindsay Total Existing Parking Spaces 174 351 506 1031 Maximum Occupancy Rate (Summer 2009 Inventory) 59% 59% 59% 2031 Base Population 4625 3640 31002 39267 2031 Seasonal Population* 1711 1347 11471 14529 2031Population (Base + Seasonal) 6336 4987 42473 53796 Existing Maximum Parking Demand (ExistingParkingSpacesxMaximumOccupancy Rate) 103 207 299 609 Projected 2031 Base Parking Demand 169 410 562 1141 Projected 2031 Base + Seasonal Parking Demand 231 561 770 1562 Number of Spaces Required To 2031 Meet Base Parking Demand 0 59 56 115 Number of Spaces Required To Meet 2031 Base + Seasonal Parking Demand 57 210 264 531
Table 6-4: Future Parking Requirements
point in time). Off-street parking is slightly less convenient in terms of distance from destinations but can be provided in larger quantities, assuming that land is available proximate to the parking destinations. Parking rates for off-street parking are usually lower than on-street spaces and may be given on a variety of terms (short-term and long-term parking rates for visitors and employees for example). The availability of parking and the parking rates are effective transportation demand management (TDM) measures that can affect the degree to which people travel to the area by automobile or by other means (walking, cycling or by transit). The more scarce long-term parking becomes and the higher the parking rates, the more incentive there is for people to use other modes of travel.
Providing an additional 260 parking spaces in the downtown area of Lindsay, or 210 parking spaces in Fenelon Falls or 60 spaces in Bobcaygeon will involve providing primarily off-street parking areas and/or a parking structure given the limited amount of curb space for on-street parking. The parking demands for Lindsay alone translate into creating a surface lot of approximately 0.77 hectares (1.9 acres) in size to accommodate 260 parking spaces14. The new parking can be created in one location or spread across several locations closest to the parking demand generators. Possible locations and type of parking to meet these needs should be studied further by the City as part of a more detailed parking assessment, in consultation with the business community.
A unique characteristic of the on-street parking in Lindsay, in the downtown area is the angled parking on Kent Street East. This parking configuration was common in many communities, and generally required a wider roadway width to accommodate traffic lanes, parking and sidewalks. The advantage of this type of curb parking is a large number of spaces can be provided. The disadvantages are the difficulties in entering and leaving these spaces and the sightline obstructions caused by adjacent parked vehicles. Many communities have been removing these spaces to improve safety for other road users and pedestrians and to provide more sidewalk areas in front of businesses. In Lindsay, maintaining this configuration of parking may become more difficult as traffic volumes and visitation increase in future years. Reconfiguration of this parking into parallel curb parking may have to be considered in conjunction with providing additional proximate off-street parking to improve traffic movement and safety. While this study has not identified specific issues related to the operation of this type of on-street parking, this need should be assessed regularly in terms of actual safety and operational issues that may arise with the current parking configuration.
It is recommended that a parking strategy study be undertaken to assess the operation of the existing parking infrastructure in downtown Lindsay and other urban areas in the City, the costs of providing this parking, the parking requirements for new development and redevelopment sites in these areas, parking enforcement, and the potential to provide additional parking to meet future demands. This study should be undertaken with input from the business community and include more detailed utilization surveys of the existing parking. The goal of this study will be to find a long-term solution that meets parking needs, is supportive of overall City objectives of encouraging travel by modes other than the private automobile, is financially viable and sustainable for the community.
Plan
Page 67
Transportation Master
Municipal Master Plan Project City of Kawartha Lakes February 2012
14 Basedontheassumptionthattheparkingspacerequirementforatypicalvehicleisequivalenttoapproximately26 squaremetresofland.
7.1
7.0 FUTURE TRANSPORTATION SERVICES
Committed/Approved Network Improvements
MTO has indicated that it is planning to implement a number of improvements to the highways in and through Lindsay. These improvement locations are summarized below.
7.1.1 Highway35SouthofHighway7
MTO has environmental assessment (EA) approval for the widening of Highway 35 south of Highway 7, from four lanes to five lanes, to include a continuous left turn lane. This project is in a detailed design stage, with completion expected this fiscal year and construction beginning in 2011.
7.1.2
ScugogRiverBridge
MTO is currently rehabilitating and widening the Scugog River Bridge to a four lane structure. This work was initiated as a result of the deteriorated condition of the existing structure. The Ministry anticipates finalizing the EA for the widening of Highway 7 from Angeline Street to Highway 36 in 2010. The work will extend beyond Highway 36 to Slant Road and to just past Angeline Street. Widening the Highway 7 corridor to the west is a possible long-range improvement.
7.1.3 Highway7/35Re-alignment
MTO is completing an EA proposing to realign the Highway 7/35/Kent Street connection where Highway 35 from the north will be realigned to the west to connect to Highway 7 with Kent Street realigning to the north to connect into Highway 35.
7.1.4
Highway7–ColborneStreetIntersection
MTO plans to close the existing Colborne Street intersection with Highway 7, and to realign Colborne Street to the south to intersect the highway at Monarch Road. MTO indicated that Colborne Street may need to be extended across the highway to Elm Tree Road in the future.
7.1.5
Highway35Widening
MTO has EA clearance for the widening of Highway 35 from four kilometres south of Highway 7 to Highway 115. This widening will include a high standard divided arterial cross section similar to that used for Highway 115.
7.2
Future Traffic Volumes
A forecast of future traffic volumes was prepared in two steps:
1. Background morning and afternoon peak hour traffic volumes (i.e., those traffic volumes currently on the road system and unrelated to the added growth in residential and employment lands in the City) were estimated by applying an average background traffic compound growth rate of 1.6 percent per annum to project traffic volumes to 2031.
2. Morning and afternoon peak hour traffic volumes generated by the proposed residential development in the City were estimated using trip generation rates published by the Institute of Transportation Engineers (ITE). Table7-1 summarizes the traffic volumes generated by the new residential development in the afternoon peak hour. This traffic was distributed to the areas external to the City on the basis of the trip patterns derived from the
Transportation Master Plan Municipal Master Plan Project City of Kawartha Lakes February 2012 Page 68
Transportation Master Plan
Municipal Master Plan Project City of Kawartha Lakes
February 2012
Transportation Tomorrow Survey (TTS) data. Trips from planned development to other areas within the City were also distributed according to the TTS pattern. It is noted that the estimated future traffic volumes are based on existing levels of use of other modes such as transit, cycling and walking.
Source:InstituteofTransportationEngineers, Trip Generation,8thEdition,2008.
Allowance for trips generated by the employment or commercial development were not accounted for separately as these trips represent the destinations for the vehicle trips generated by the new residential development.
Trips generated within Lindsay were treated slightly differently. Lindsay was divided into four traffic zones and trips generated by development within each of these zones were distributed either externally to other areas of the City and external areas, or internally to the other internal traffic zones using a trip distribution determined from the 2006 TTS data.
Page 69
GenerationRate(#trips/unit) PMPeakHourNo.of GeneratedTrips Independent Variable (No.of Units) In Out Total In Out Total Lindsay Single-FamilyDetachedHousing 5,157 0.64 0.37 1.01 3281 1927 5209 TownHomes 2,817 0.35 0.17 0.52 981 483 1465 Apartment 2,365 0.40 0.22 0.62 953 513 1466 SeniorAdultHousing-Detached 513 0.16 0.11 0.27 84 54 139 Total 10,852 5299 2977 8278 Bobcaygeon Single-FamilyDetachedHousing 2,079 0.64 0.37 1.01 1323 777 2100 TownHomes 303 0.35 0.17 0.52 106 52 158 Apartment 517 0.40 0.22 0.62 208 112 321 Total 2,899 1637 941 2578 Fenelon Falls Single-FamilyDetachedHousing 562 0.64 0.37 1.01 358 210 568 TownHomes 273 0.35 0.17 0.52 95 47 142 Apartment 55 0.40 0.22 0.62 22 12 34 SeniorAdultHousing-Detached 55 0.16 0.11 0.27 9 6 15 Total 945 484 275 759 Omemee Single-FamilyDetachedHousing 585 0.64 0.37 1.01 372 219 591 TownHomes 103 0.35 0.17 0.52 36 18 54 Total 688 408 237 644 Bethany Single-FamilyDetachedHousing 163 0.64 0.37 1.01 104 61 165 Kinmount Single-FamilyDetachedHousing 143 0.64 0.37 1.01 91 53 144 Pontypool Single-FamilyDetachedHousing 159 0.64 0.37 1.01 101 59 161 Woodville Single-FamilyDetachedHousing 138 0.64 0.37 1.01 88 52 139
Table 7-1: Residential Development Trip Generation PMPeakHourUnitTrip
Trips generated by future development were manually assigned to the existing transportation network (no-build network). These volumes were subsequently combined with the future background traffic volumes to obtain a combined forecast of future total traffic volumes for the morning and afternoon peak hours. The 2031 forecasts are summarized on Figure7-1 to Figure74 inclusive.
7.3 Future Traffic Conditions
The capability of the planned 2031 transportation system to accommodate the 2031 travel demands was evaluated at select (major) intersections. A deficiency is reported when the volume-to-capacity ratio exceeded the value of one (e.g., demand exceeds capacity). There are a number of intersections along the Angeline Street corridor which are expected to reach or exceed capacity by 2031.
The findings of these analyses are presented graphically in Figure 7-5 for locations in Lindsay, in Figure 7-6 for locations in Bobcaygeon, in Figure 7-7 for Fenelon Falls and in Figure 7-8 for locations in Omemee.
Proposed improvements to address these anticipated deficiencies are discussed in Section 7.5 of this report.
7.4 Corridor Improvements
The need for corridor improvements was examined using a screenline corridor capacity analysis. This is the most appropriate methodology for assessing the long-term adequacy of a transportation network. Screenlines are imaginary lines that extend across a number of parallel roadways and are used to summarize travel demands and transportation capacity on a corridor basis at various locations. For this study, a grid of north-south and east-west screenlines was established for Lindsay, Bobcaygeon, Fenelon Falls and Omemee. This analysis incorporates a practical lane capacity of 800 vehicles per hour per lane (veh/h/l) for arterial roadways and a practical lane capacity of 600 veh/h/l for collector roadways. The analyses were completed for the PM peak hour as this hour corresponded to the period when the roadways were experiencing the highest hourly volumes. The initial screenline analyses were completed with traffic projections derived from base counts collected in the fall. A separate screenlines analysis with summer volumes was also undertaken. The need for additional through-lane capacity was identified when the V/C ratio of the screenline exceeded a value of one.
Transportation Master Plan Municipal Master Plan Project City of Kawartha Lakes February 2012 Page 70
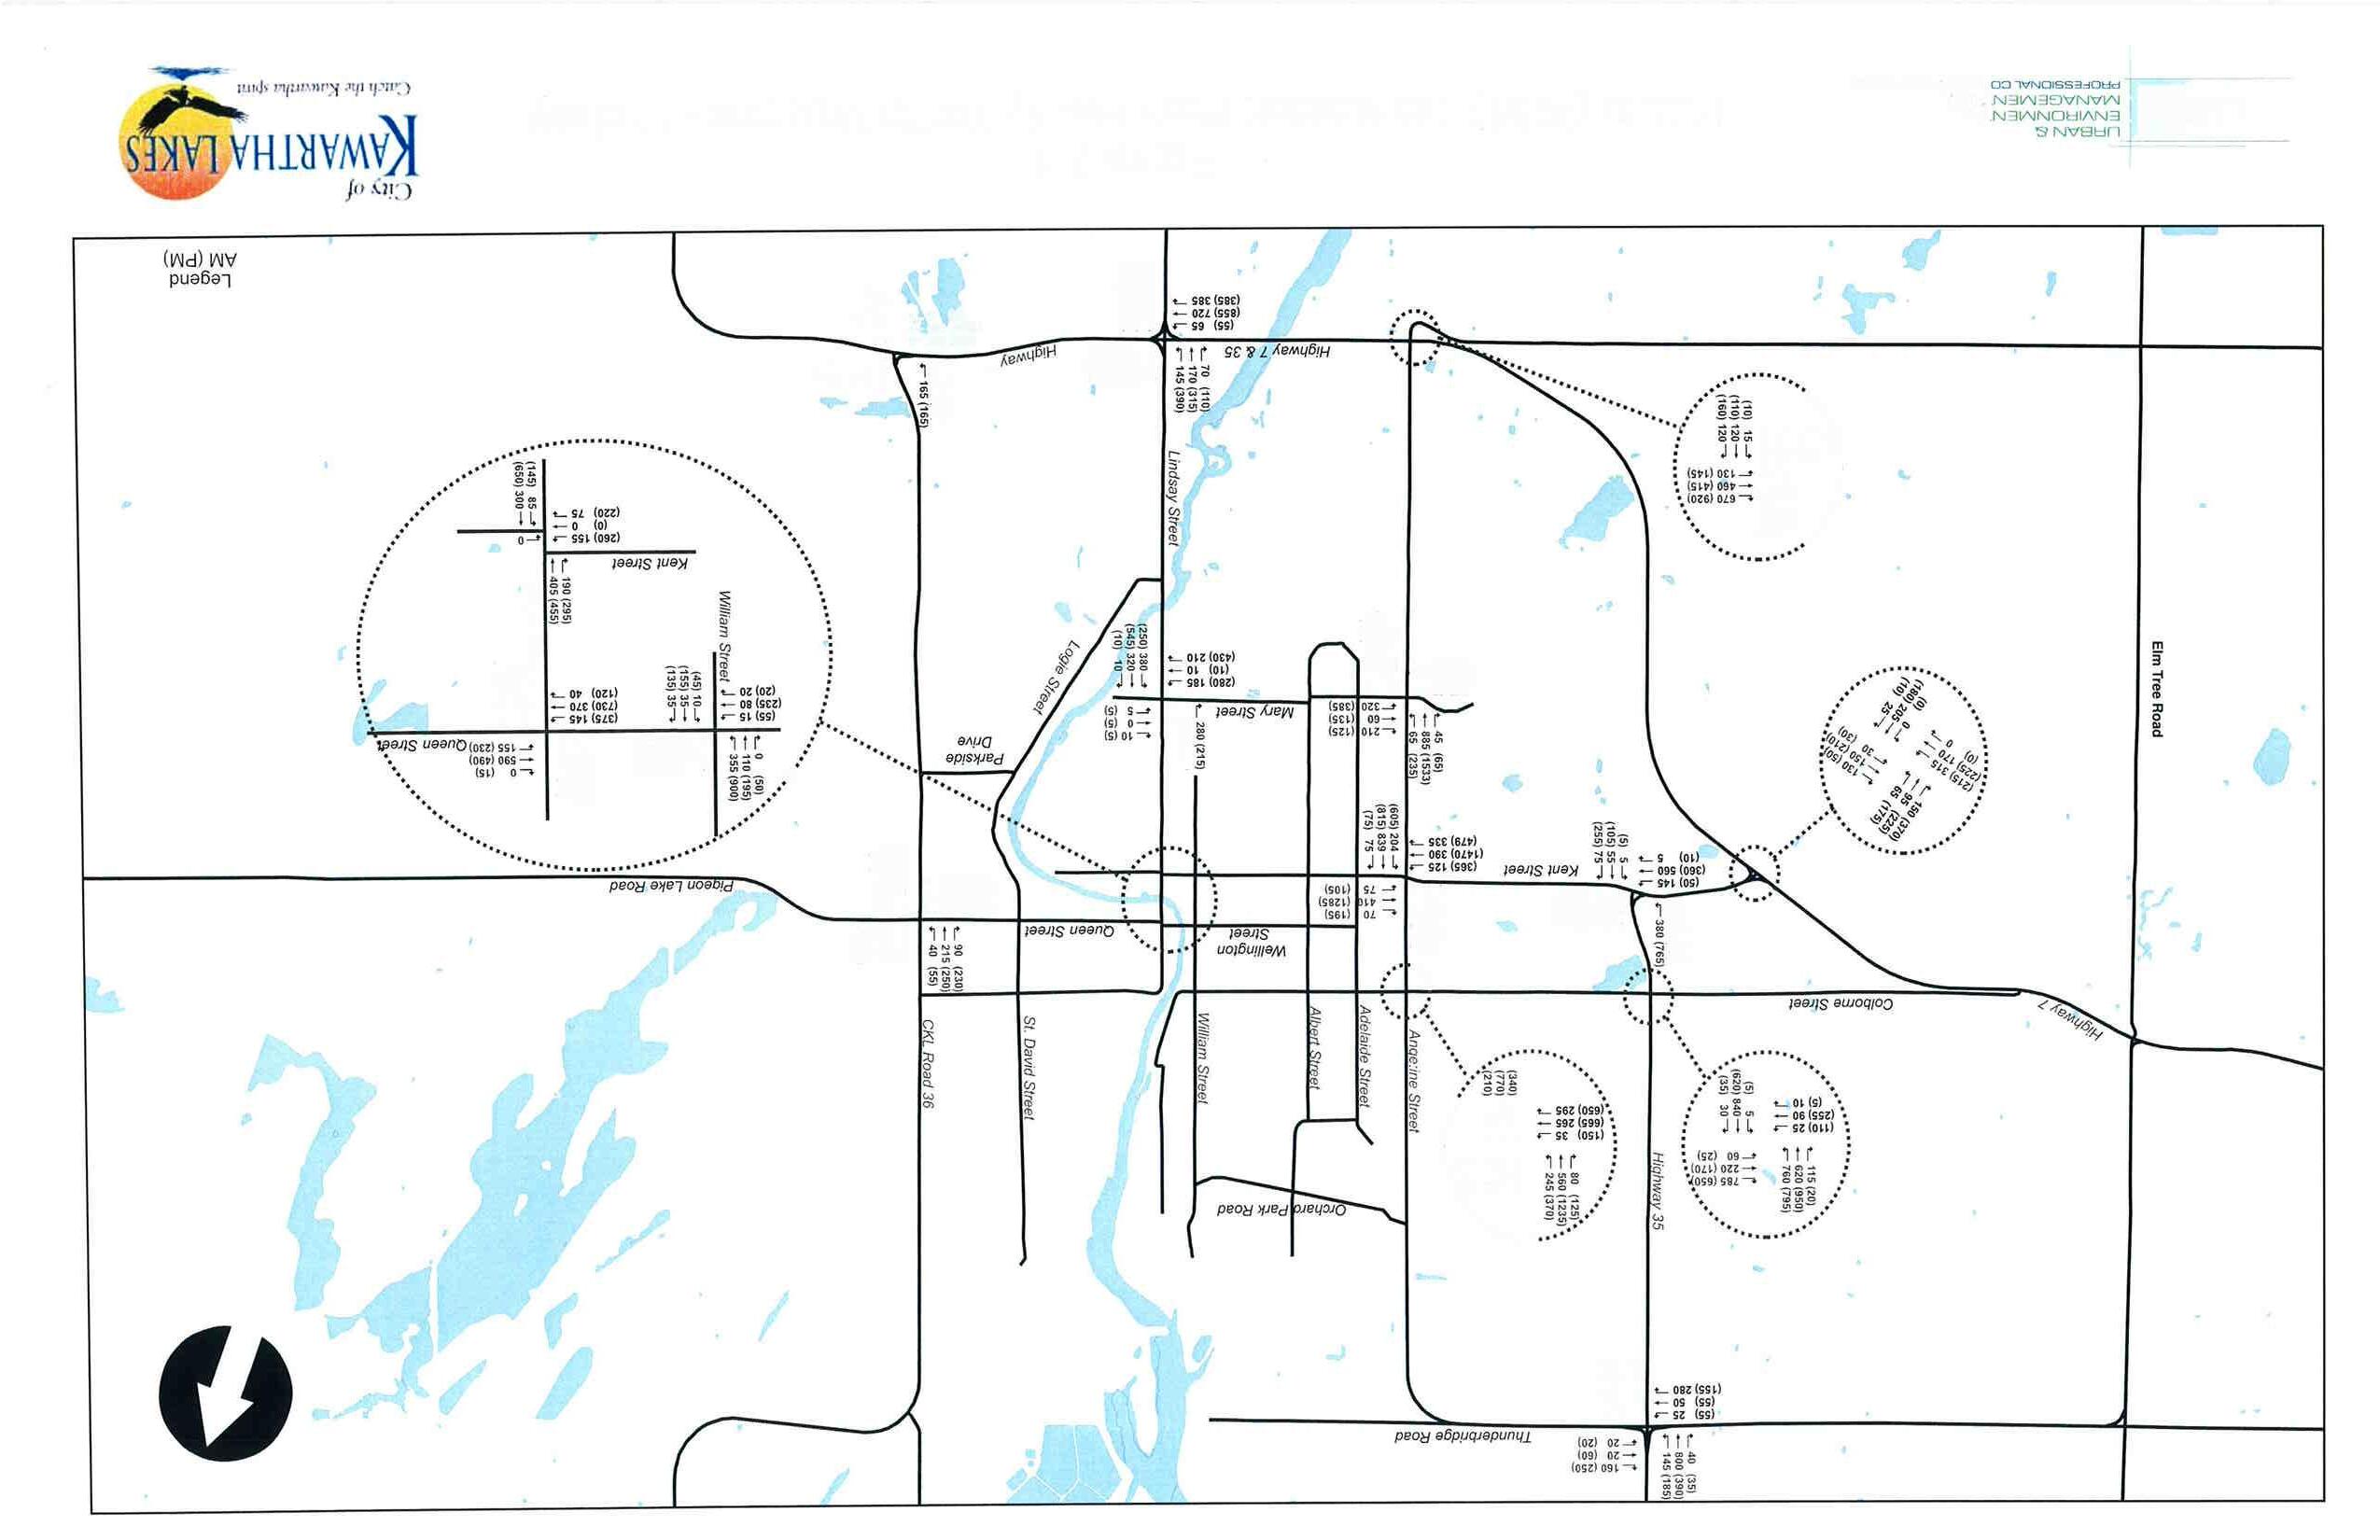
..':"""'-....'1Sñl¡gt ¿¡ $ g¡zs 1:s¡ ttt _70(120) <r r b -755(700) r55 (120) * 1 00 {80) ttl (235) r50r (785) 365(45) 2sltP L 145 (305) ._ 700 (1019) 165 (135) .' (35) 25r (1095) 1388-* (300) 335-2s0 (610) -5 (s) (10) 10 r (15) 25* (0) s- ooottt (560) 405 r 13251 24s(220) 1s0{ L300 (320) -0 (15) Itf' ttt .rtl (110) 125r (300) 255 -* (40) 20rtP L 330 (34s) * 31s (270)5 (15) Lindsay Str""t1,uo¡ uo_ (305) 170* (275'1 14011r -9m EI /-ut=yC L-\:)2 6ì a m¡Io m a 'l'l cr+c.|o N)O(¡)A fr+o-|U'oo = ofTrí'l i:$9xr--t-oo\Cl_¡ _-J -{-¡0) -Ftõ' o - =o CN ¡ffo-Ø0)
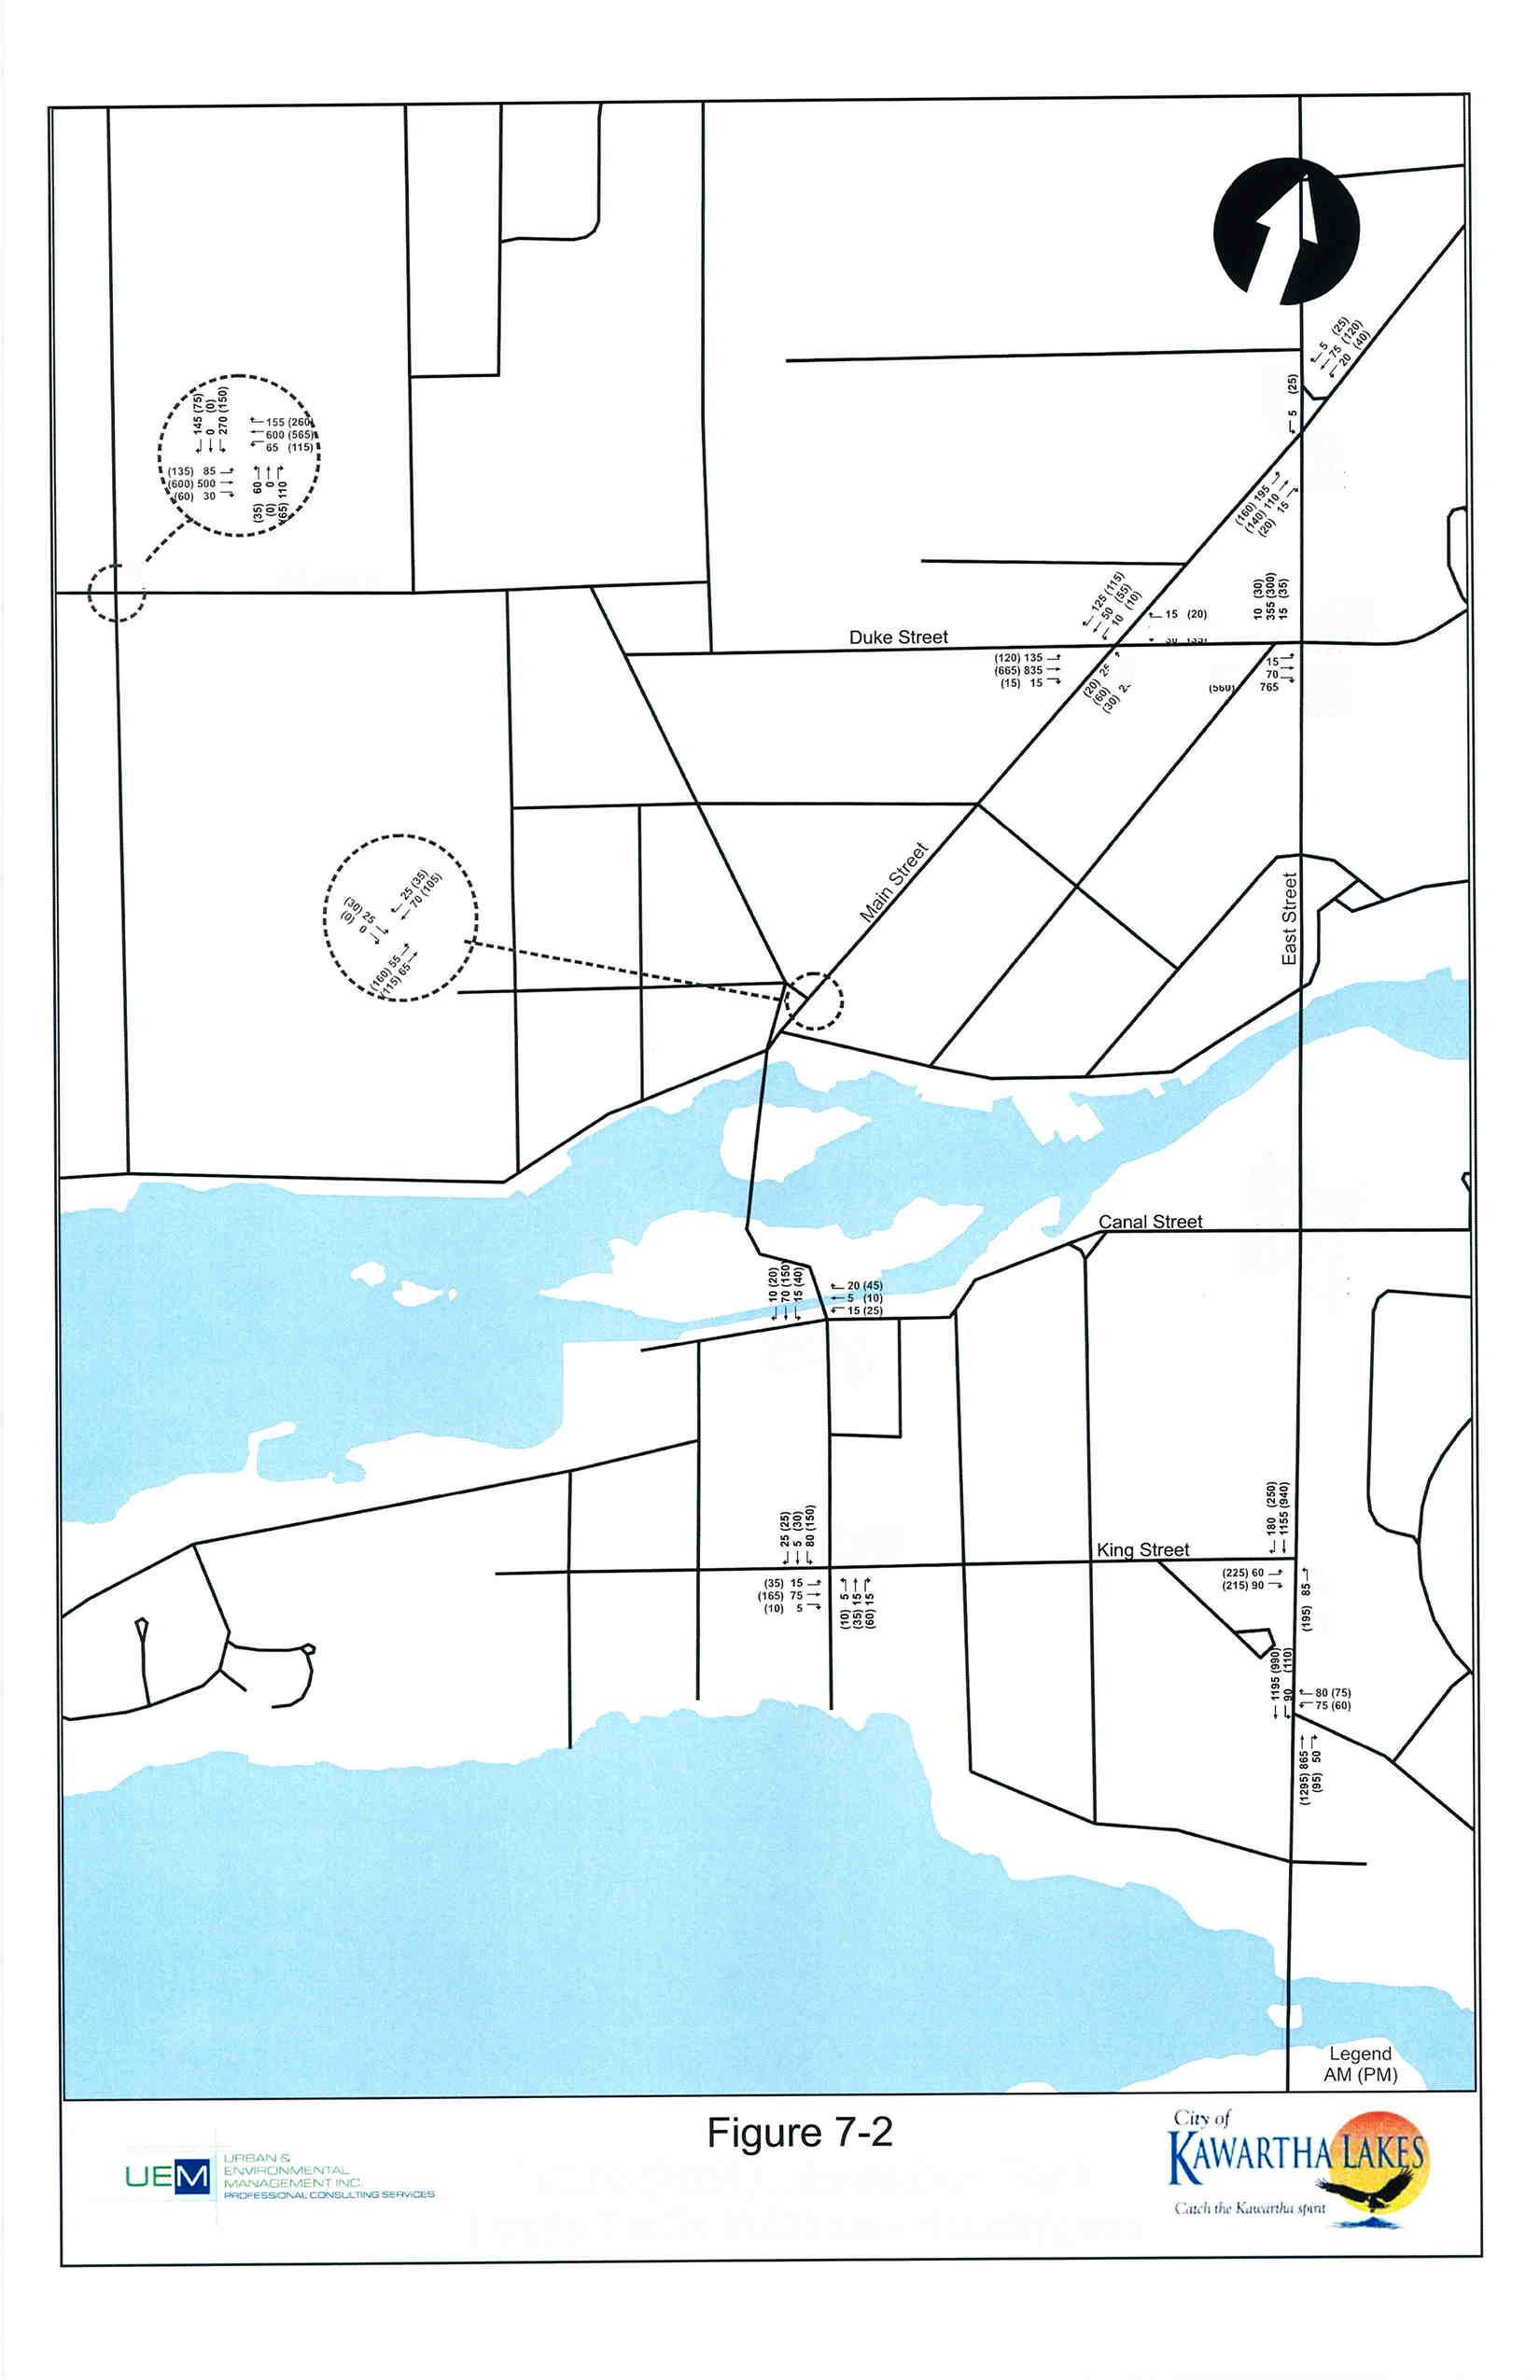
t CKL Road B frÊ L40 (2s)130 (s5) -21s (1s0) -6s5(775) ttt ì1P / 7 125) '"d,( rip L 15 (20)15 (15) -10(s) ttt (65) 1s i (10) 5 (35) l0irttttP t L 100 (185)rl5 (120) -15 (65) (20) l0 i (1s) 10 * (1s) 10'rtÈ Future (2031) lntersection Peak Hourly Traffic Volumes - Bobcaygeon
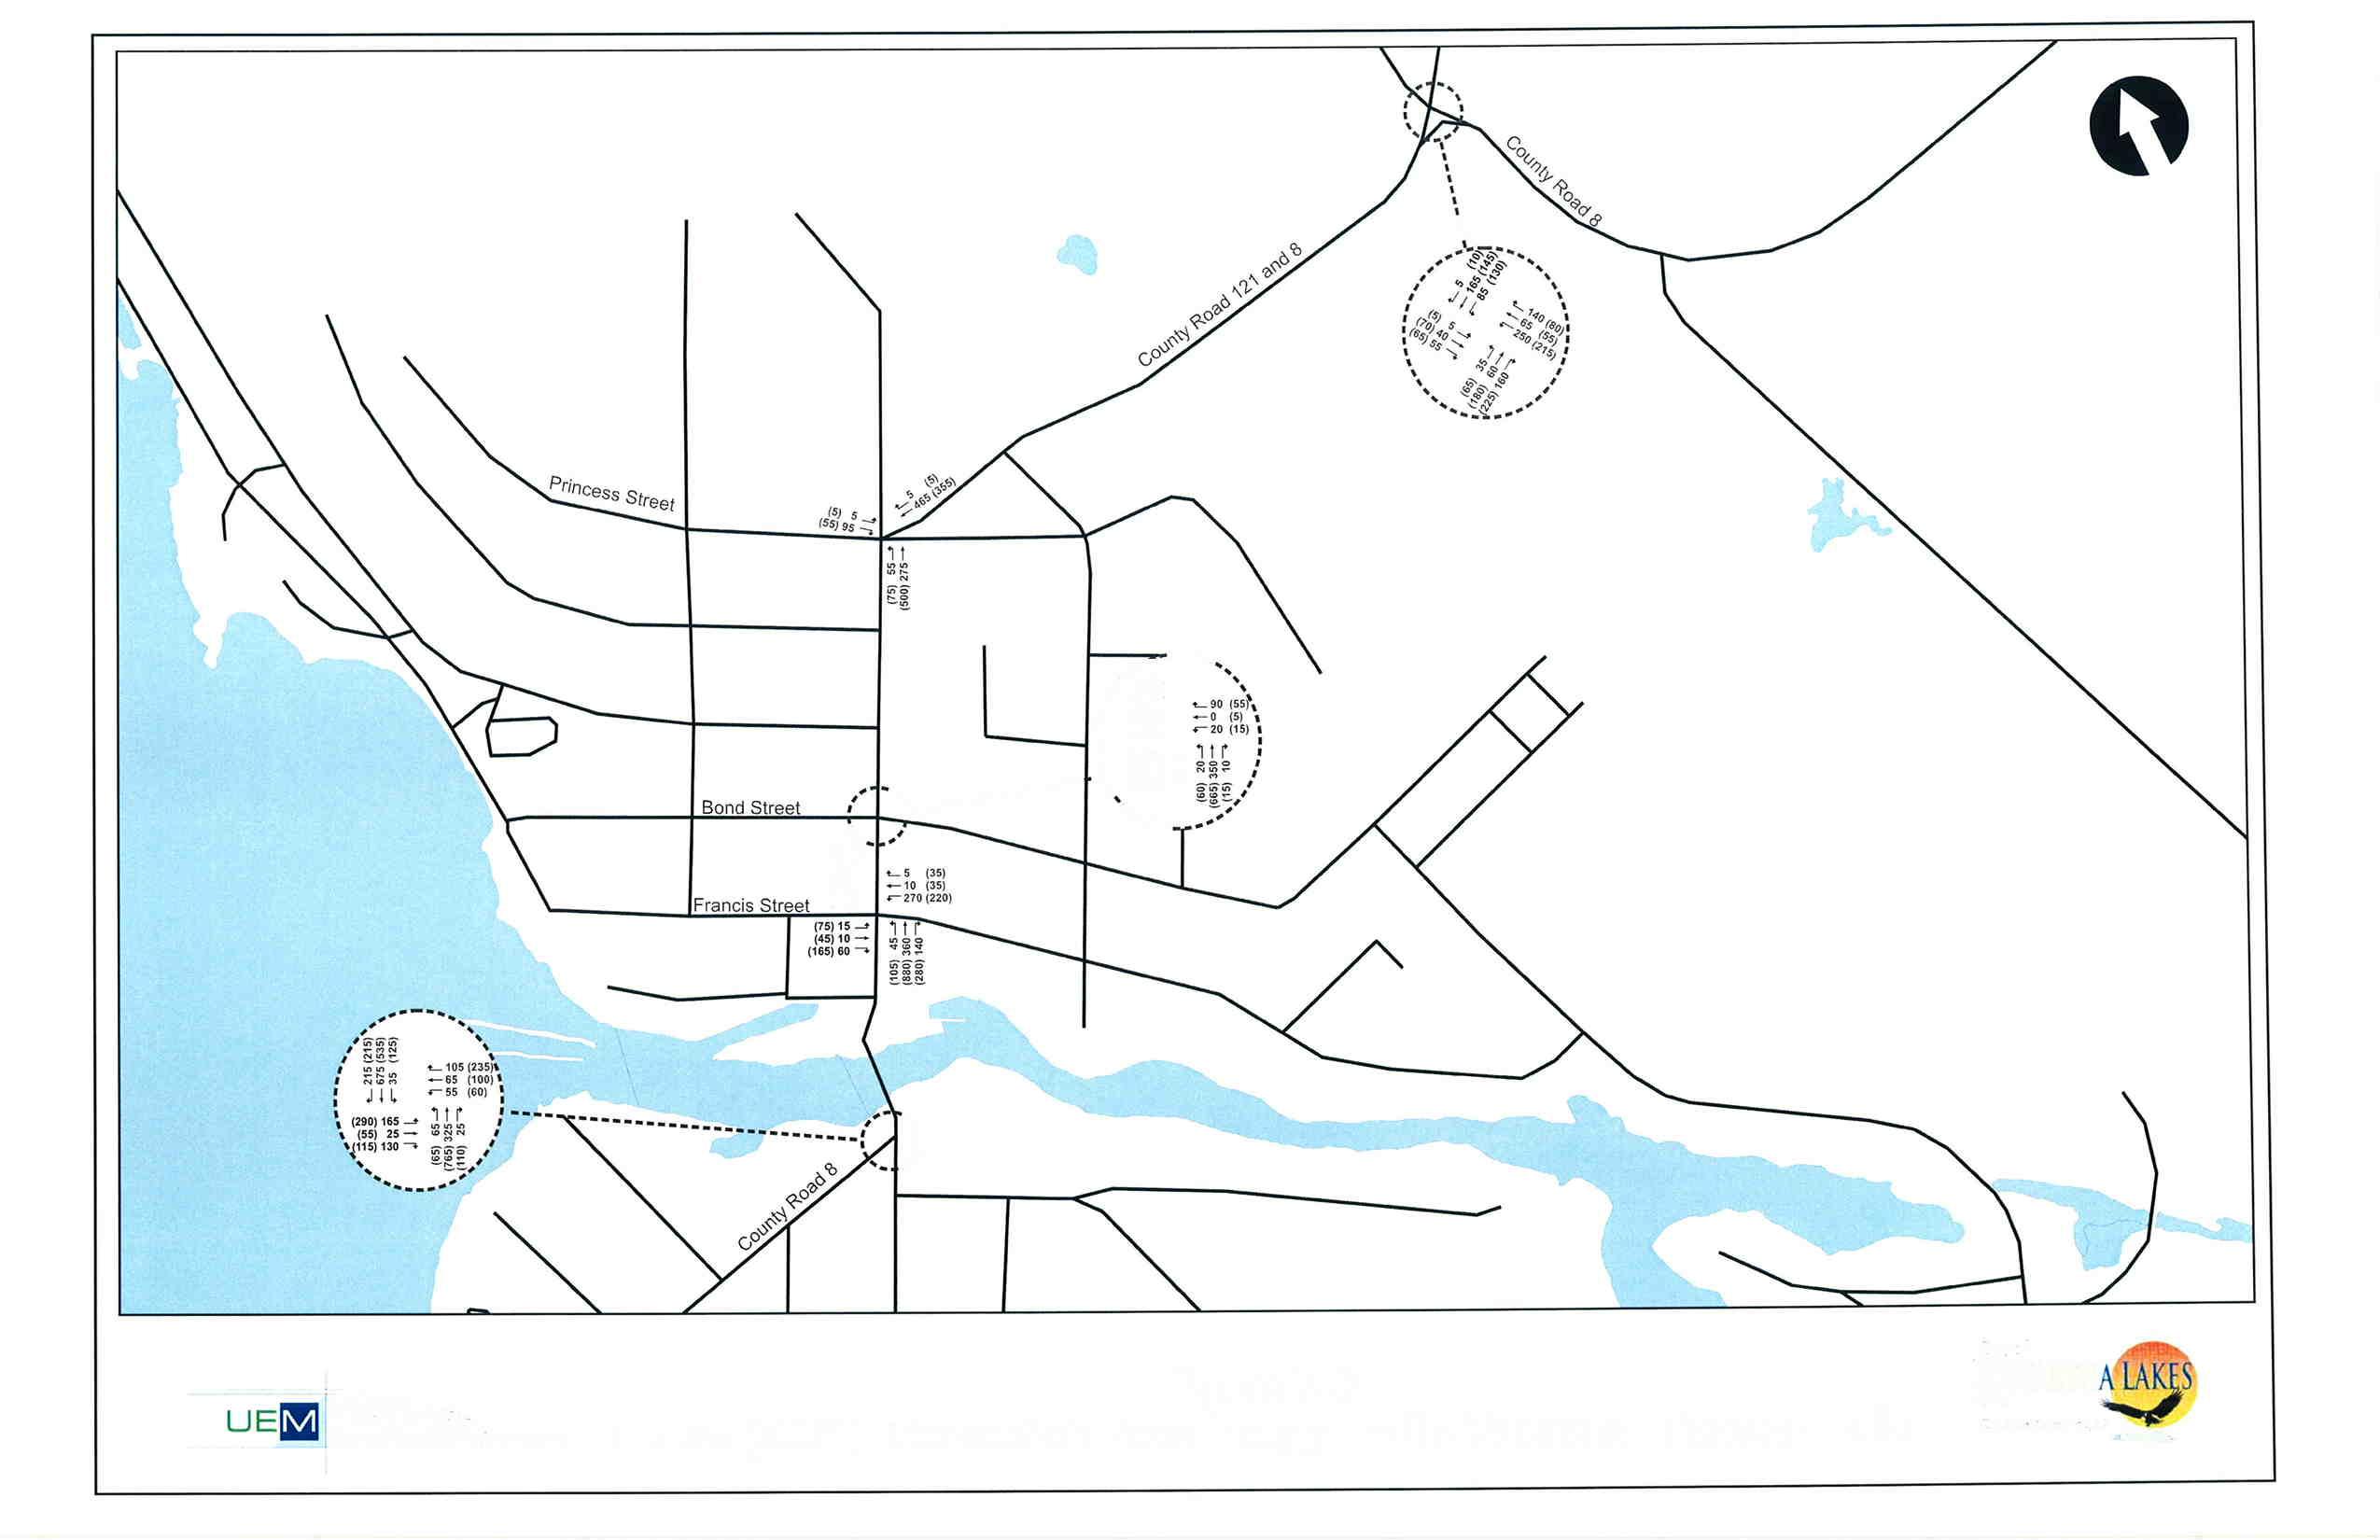
I I a^G; ^ at I ,I I I I I I ttt (40) 15 r (r5) 0 * (60) ¡10\.----" ""'r'r ^o ^ ttt I I , a LIF]B,1\N & EN\/lr 1-tlr\f\4EN r\l I^\4ANAGEMENT iI'JI] PRCFESSICNA CONSULf ING SEFVICES
7-3 lntersection Peak Hourly Traffic Volumes - Fenelon Falls (ìitr ry' I(WARTH Futu re (2031 ) ( .u;lr tlu L,rt.rr:lt, rJrtrt
Figure
King Street/Highway 7
(35) 20 (1040) 690 35 (20) 80 (55) 40 (90) 840 (1045) (20) 25 (0) 5 (80) 25 (0) 15 (930) 610 (30) 15 5 (5) 0 (5) 25 (10) 45 (10) 760 (850) 25 (35) (30) 10 (25) 0 (15) 5 (145) 70 (845) 620 (15) 5 115 (110) 0 (5) 155 (170) 120 (150) 620 (820) 0 (0) (85) 100 (50) 85 (905) 710 (100) 55 15 (15) 0 (0) 0 (0) 0 (10) 610 (885) 45 (85) (5) 5 (60) 80 (35) 35 (5) 5 15 (30) 45 (95)
SibleyAvenue Ski Hill Road SturgeonRoad QueenStreet Terry Road
Future (2031) Intersection Peak HourlyTraffic Volumes - Omemee Legend AM(PM)
Figure 7-4
Future (2031) Intersection Level of Servic e - Lindsay


! ( ! ! ! ! ( ! ! ( ! ! ! ! ( ! ! !( ( ! ! ! ( ! ! ! ! ( ! ( ! ( ! ! ! ( ! ( ! ! ( ! [ Colborne Street Kent Street Queen Street Wellington Street Orchard Park Road Parkside Drive Pigeon Lake Road Highway 7 Highway 7 & 35 Mary Street Thunder Br dge Road H i g h w a y 3 5 A n g e l i n e S t r e e t L i n d s a y S t r e e t A d e l a i d e S t r e e t A l b e r t S t r e e t S t D a v i d S t r e e t C K L R o a d 3 6 W i l s o n R o a d S a n d e r l i n g C r e s c e n t E l m T r e e R o a d Logie Street Highway7
A-B Li le To Short Delay Legend W i l l i a m S t r e e t C-D: Average To Long Delay E-F: At Capac ty Wi h Very Long Delay
Figure 7-5
! ( ! ( ! ! ! ! ( ! ! ! ! [ Figure 7-6 E a s t S t r e e t CanalStreet Boyd Street MillStreet King Street B o l t o n S t r e e t Cedartree Lane Duke Street MainStreet CKL Road 8 W e s t S t r e e t A-B: Little To Short Delay E-F: At Capacity With Very Long Delay s Legend C-D: Average To Long Delay Future (2031) Intersection Lev el of Servic e - Bobcaygeon
Future (2031) Intersection Level Of Service - Fenelon Falls
! ! ! ( ! ( ! ( [
Figure 7-7
C K L R o a d 1 2 1 / 8
CKLRoad8
Franc is Stree t
Bond Stre et
Legend A-B: Li tle To Short Delay C-D Average To Long De ay E-F: At Capacity Wi h Very Long De ays
Prince ss Stree t
CKLRoad8
! ! ! ! ! [
7-8 Highway 7 S i b l e y A v e n u e S k i H i l l Road D e a n e S t r e e t S t u r g e o n R o a d Q u e e n S t r e e t Terry Road A-B: L tt e To Short De ay Legend C-D: Average To Long De ay E-F: At Capac ty Wi h Very Long De ays Future (2031) Intersection Level Of Service - Omemee
Figure
7.4.1 Lindsay
Screenlines were drawn across the community of Lindsay to assess the 2031 travel demands and capacity on the major roadways crossing these lines. A north-south screenline was drawn that followed the path of the Scugog River and the capacity of travel lanes crossing the river via Wellington Street, Lindsay Street (twice) and Highway 7/35 was determined. In the east-west direction, a line was drawn across Highway 35, Angeline Street, Lindsay Street and Highway 36. The results of the screenline analysis in Lindsay are summarized in AppendixG.
For the north-south screenline, considering the total volume and capacity crossing the screenline, the existing V/C ratio for east-west travel across the river is estimated to be in the range of approximately 0.68 (fall) and 0.85 (summer). For the east-west screenline, the existing V/C ratio for north-south travel on the four major roadways was estimated to be in the range of 0.49 (fall) and 0.61 (summer). Of the two directions, travel demands in the east-west direction across the river are heavier than in the north-south direction.
In the future, for the north-south screenline across the river, and with the Highway 7/35 crossing of the Scugog River widened to a four-lane structure, the V/C is expected to increase to a range of approximately 1.14 (Fall) and 1.42 (summer). This indicates that even with the widening of the highway bridge, an additional lane of capacity across the river will be needed to accommodate the projected future travel demands.
In 1994, the former County of Victoria undertook a Municipal Class EA of a new crossing of the Surgog River. An Origin-Destination survey was undertaken that concluded that the main destination for cross-river traffic was the shopping areas in Lindsay located along Kent Street. From these patterns, it was concluded that a crossing north of Colborne Street would require additional access roads to the river bank and, depending upon how far north this crossing is located, may involve: impacts to a Class One Wetland; increased traffic infiltration on north-south residential streets, and; the requirement for a higher (and longer) structure to meet navigable water height requirements. This study and an Addendum Report issued in 2000 concluded that the preferred location for a new crossing of the river was Colborne Street. The screenline and traffic pattern analysis has confirmed the need for additional river crossing capacity.
At the east-west screenline, the V/C ratio is expected to increase to a range of 1.19 (fall) and 1.49 (summer). For this screenline, providing an additional through lane on Angeline Street would address the capacity deficiency along this corridor. This analysis also indicates a need to provide an additional traffic lane on Highway 35 north of Kent Street by the end of the planning horizon. It was concluded therefore that there will be a need to increase capacity across both screenlines by the end of the planning horizon. The need for additional capacity across the river may become more acute, and may present itself sooner in the east-west direction. This is based on examining the estimated growth in background traffic and a seasonal peak that can be 25 percent higher than annual average conditions. The timing of these improvements will depend on actual growth and should be closely monitored over the short-term. It is recommended, therefore, that the need for additional screenline capacity be reviewed regularly (every five years) to confirm the timing for any capacity improvements.
Transportation Master Plan Municipal Master Plan Project City of Kawartha Lakes February 2012 Page 79
7.4.2 Bobcaygeon
Bobcaygeon is served by two crossings of the Trent/Severn Waterway linking the island to the north side of canal; one on East Street and one via a swing bridge on Bolton/Main Street. The availability of the two crossing points provides a good level of emergency access.
The screenline analysis of travel demands compared to the available capacity is contained in Appendix G. The analysis indicates that overall, considering both crossings, there is sufficient capacity to accommodate current (2009) demand. It is estimated that the bridges currently operate with a V/C ratio in the range of 0.38 (fall) to 0.48 (summer). In the future, as development continues, the combined V/C ratio is expected to increase to a range of approximately 0.95 (fall) to 1.19 (summer) by the end of the planning horizon. This analysis is based on a reduced capacity at the swing bridge. These findings indicate that the two crossings will have reached their effective capacity by 2031. However, projected traffic volumes can be accommodated, with some seasonal congestion in the summer months.
7.4.3 FenelonFalls
In Fenelon Falls, there is one crossing of the Fenelon River via CKL Road 121/8. This crossing connects CKL Road 8 on the south side and Francis Street on the north side. Both of these intersections are signalized. The screenline analysis of travel demands compared to the available capacity is contained in Appendix G. On the basis of the screenline analysis, the Fenelon River crossing is currently operating with a V/C in the range of 0.61 (fall) to 0.76 (summer). As this crossing is the only route across the lock system, all traffic from the CKL road system converges across the bridge. In the future, the V/C of the crossing is projected to increase to a range of 1.10 (fall) to 1.37 (summer). These values are indicative of the need for additional through capacity at the crossing. This additional capacity can be provided by either widening the existing structure to accommodate a second traffic lane or constructing a second two-lane crossing of the Fenelon River.
7.4.4 Omemee
Improvements in Omemee are limited to improvements to existing intersections along the Highway 7 corridor traversing Omemee. These improvements involve upgrading traffic control by installing traffic control signals at three intersections. There are two bridge crossings of the Pigeon River in Omemee and crossing capacity has not been identified as an issue. The main crossing of the Pigeon River is located on Highway 7. A second “dam” crossing has been maintained as a secondary emergency access and is currently being used primarily by pedestrians and light vehicles. The screenline analysis of travel demands compared to the available capacity is contained in AppendixG Beyond the intersection improvements, no other corridor improvements along Highway 7 are required to meet the needs of the 2031 travel demands in this area.
Transportation Master Plan Municipal Master Plan Project City of Kawartha Lakes February 2012 Page 80
7.5 Intersection Improvements
7.5.1
Lindsay
Improvements to the operation of selected intersections were identified through the results of the capacity and level of service analysis at these intersections. Locations where improvements have been identified as being required are illustrated on Figure7-5.
Signalized intersection improvements are focused on the main corridors including Angeline Street, Lindsay Street, Kent Street and Colborne Street. They generally involve providing additional turning lanes and in some cases added through-lanes. These requirements are detailed in AppendixG
Unsignalized intersection improvements often include provision of traffic signals to address turning movement capacity. It is recommended that traffic conditions be monitored on a regular basis to evaluate the need for traffic signal control using the justification procedures as detailed in Ontario Traffic Manual Book 12 – Traffic Signals.
7.5.2 Bobcaygeon
A number of intersection improvements are identified along East Street and along Highway 8/Duke Street as shown on Figure 7-6. In all cases these improvements include installing traffic signal control and in the case of the Duke Street/East Street intersection, widening to provide additional auxiliary (turning) lanes. These requirements are summarized in AppendixG.
7.5.3
FenelonFalls
Traffic signal control is recommended for the CKL Road 121/Bond Street intersection to accommodate the anticipated 2031 travel demands. This improvement is shown on Figure7-7
7.5.4
Omemee
Intersection improvements in this settlement area include installation of traffic signals at three intersections along Highway 7 (Deane Street, Sibley Avenue and Queen Street). Additionally, a westbound left turn lane is identified for the Highway 7/Queen Street intersection. These improvements are shown on Figure7-8
Transportation Master Plan Municipal Master Plan Project City of
February 2012 Page 81
Kawartha Lakes
8.0 STRATEGIC TRANSPORTATION ALTERNATIVES
8.1 Identified Needs (Problem/Opportunity Statement)
The analysis of the existing transportation system and services has identified a number of areas where there is limited or insufficient capacity to accommodate anticipated 2031 travel demands. These areas include road corridors and key intersections in the urban settlement areas. Parking supply and management in the urban settlement areas has also been identified as requiring expansion in order to meet future demand conditions. Transit is used to a lesser degree than other areas in the Province and service improvement to encourage greater use is required. Expansion of existing transit services will be required to provide enhanced mobility both within the City and to external areas for existing and future development. With continued growth in permanent and seasonal population and employment, the enhancement of the existing trails and cycling systems is necessary to accommodate and encourage greater active transportation in the City for existing and future residents and visitors. These aspects are discussed further in Section 9.
MTO has identified or has initiated significant improvements to the Provincial highways serving the City including the widening to Highway 7 and 35 in response to existing and future demand. Metrolinx and GO Transit have also identified opportunities for future service expansion of the commuter rail service between Peterborough and Toronto. Given the City’s unique location and economic basis (local industry and business, recreation and tourism) and the City’s dispersed development pattern, enhanced transit service to connect settlement areas and to the external existing and possible future bus/rail services will encourage the use of alternative modes of travel. It would also leverage the strategic economic, social and environmental advantages of the community, in alignment with Provincial and City planning policy.
Within the context of the municipal master planning approach, strategic alternatives to address the existing and future municipal transportation network needs were identified. Suitable evaluation criteria to assess each alternative were developed and applied to evaluate these alternatives. A preferred strategic improvement alternative resulted from this evaluation. These alternatives are discussed below.
8.2 Planning Approach
As discussed in Section 1, this study was conducted in accordance with the Master Planning Process of the MEA Municipal Class EA process. This involves completing the first two phases of the Class EA Planning and Design process. While the transportation assessment has been conducted in accordance with the environmental planning principles and process of the Municipal Class EA, it does not constitute in itself an environmental assessment under the EA Act. Transportation undertakings recommended in this study must undergo further detailed assessment through completion of project-specific Municipal Class EA’s, according to the appropriate schedule. This Transportation Master Plan cannot be the subject of a Request for Part II Order Appeal. However, when the individual project-specific Class EA’s are undertaken, the Part II Order Appeal process is applicable.
Transportation Master Plan Municipal Master Plan Project City of Kawartha Lakes February 2012 Page 82
8.3 Strategic Alternatives
8.3.1 IdentificationofAlternativePlanningSolutions
Consideration of functionally different planning solutions, or alternatives, is a requirement of the Class EA planning and design process. For the purpose of this assessment, three strategic transportation alternatives were identified and assessed as to their potential in addressing the identified needs and responding adequately to the opportunities available to the City. These alternatives are described below.
8.3.1.1 Do Nothing
This alternative involves no major structural changes to the road network under City jurisdiction. It includes planned improvements that have been committed to by the MTO. The alternative includes normal monitoring and maintenance of the existing roads, installation of traffic control changes as they may become warranted over time and other limited intersection or operational improvements the City normally would implement to improve operations and safety on a case-by-case basis. No additional actions would be taken to augment capacity in the network or specific corridors.
8.3.1.2 Structural Improvement
This alternative includes undertaking those projects already planned by the City along with additional capacity enhancement associated with new development through strategic road widening and new facilities. It also includes transportation system management (TSM) measures to optimize the operation and capacity of the existing and planned road network. This may include signal timing plan changes, coordination of traffic signals, localized intersection improvements where warranted, access management to reduce and refine access along specific corridors and turn restrictions or other flow management strategies.
8.3.1.3 Balanced Mobility Choices
This alternative includes the improvements included in the Structural Improvement alternative but adds support for enhanced transit service both within the City and through linkages to external services. It also includes enhancement of the trail, walkway and cycling facilities, to implement the recommendations of other studies such as the Trails Master Plan and provision of on and off-street cycling facilities in selected corridors, particularly in the proposed new development areas. This alternative would include use of transportation demand management (TDM) measures to encourage the use of other modes in lieu of the private automobile.
8.3.2 EvaluationofPlanningSolutions
Criteria were selected to evaluate the strategic alternatives across technical, social, natural environmental and economic dimensions. Generalized indicators and measures were identified for each criterion to capture the effects of each alternative. Table 8-1 summarizes the criteria, factors and measures used in the evaluation. Table 8-2 summarizes the results of the assessment and evaluation of each strategic alternative.
Transportation Master Plan Municipal Master Plan Project City of Kawartha Lakes February 2012 Page 83
Table 8-1: Evaluation Criteria
Criterion Indicator
Potential to improve traffic operations
Technical
Potential ease of implementation
Potential to improve quality of life
Measure
Effect on intersection levels of service and capacity
Effect on ability to implement improvements when required
Effect on reducing congestion and property requirements
Social
Natural Environmental
Economic
Potential for improved traffic safety
Potential to encourage use of alternative modes
Potential to improve environment
Potential to make optimal use of transportation system
Potential to attract development
Potential to enhance property values
Effect on the number of collisions
Effect on transit ridership, pedestrian and cyclist travel
Effect on air quality, noise, vegetative/wildlife habitat and water
Effect on congestion and travel time/delay
Effect on ability to attract/retain development
Effect to property accessibility
Based on this evaluation, the preferred improvement strategy is a BalancedStrategy to Improve Mobility Choices in the City. The strategy addresses the future travel demand arising from population and employment in the City, and does so in a manner consistent with City and Provincial policy regarding smart growth, sustainable and healthy choices. This strategy has the potential to minimize the future needs for road expansion, but maintain and improve the vital road and transit linkages between the settlement areas and across the City. This balanced strategy is to be integrated with the external transportation services that exist or may come into being in the planning period.
Transportation Master Plan Municipal Master Plan Project City of Kawartha Lakes February 2012 Page 84
Criterion
Table 8-2: Strategic Alternative Evaluation
Do Nothing
Structural Improvement
Balanced Mobility
Description
Nomajorstructuralchanges butincludesplanned improvementsincapital program
Plannedimprovementsplus additionalroadcapacityand operationalimprovements requiredtoaccommodate development
Structuralimprovementsplus enhancedtransitservice betweensettlementsand externalareas,improvedtrails, walkwaysandcyclistfacilities
Technical
KeycorridorsinLindsay incapableofaccommodating forecastdemand.Gateway intersectionsinsettlementareas requireadditionalturninglanes andtrafficcontrol improvements.
Plannedimprovementsand addedcapacityimprovements inkeycorridorsand intersectionscanaccommodate trafficformostpart(some pressurepointintersections remain).Morecomplex alternative,butrequiresslightly lesscoordinationwithother agenciesthanbalanced alternative.
Offerspotentialtoreduce congestionfurtherthenjust withstructuralimprovements torelievepressurepointsand possiblydelaysomeofthese improvementsfurtherintothe future.Morecomplex alternativerequiringhigher levelsofcoordinationwith otheragencies.
Social
Additionalcongestion associatedwiththisalternative willinhibitsocialactivity, aggravatetrafficsafetyand increasetraveldelay.Parkingin thecoreareaswillbe increasinglydifficult.
Structuralimprovementswill addressthefuturetravel demandbutwillnotoffer modalchoicesbeyondthose availabletodayandwillnotbe inalignmentwithProvincial policy.
Structuralimprovements augmentedbytransitandactive transportationinitiativeswill addressfuturedemandina sustainableandhealthymanner, consistentwithCityand Provincialpolicy.
Natural Environmental
Congestionwillreduceair quality,increasenoise(horn blowing),butthisalternative willnotaffectnaturalvegetative orwildlifeareas.
Localizedimpactstoproperty andnaturalenvironmentfrom corridorwideningsand intersectionimprovements. Travelbyprivateautomobile mayincreaseassupportfor othermodesismissing.
Alternativecontributesto improvementinairqualityand reducednoiseandoverall reducedlevelsofcongestionon Cityroads.
Economic
Increasedtraveldelaysdueto congestion.Loweraccessibility providedtoadjacentproperties andlessattractivedevelopment potential(difficulttojustify buildingtomaximumlanduse potential)
Alternativereducestravel delaysbutrequiressignificant investmentinaddedcapacity thatmaybereducedordelayed withbalancedalternative.This alternativedoesnotaddressthe traveldemandbyothermodes andwilltendtoincreaseauto traveloverallcomparedto otheralternatives.
Traveldemandmanagement (TDM),transitservice improvementsandadditional onandoffstreetfacilitiesfor pedestriansandcyclistswill costmorethanother alternativesbutpotentialexists todelaysomeofthehighercost improvementsanddemandto beaccommodatedinother ways.
Transportation Master Plan Municipal Master Plan Project City of Kawartha Lakes
Page 85
February 2012
Overall Evaluation Not Recommended Recommended as a Necessary Requirement Preferred Strategic Alternative
9.0 STRATEGIC POLICY DIRECTIONS
9.1 Introduction
The Transportation Master Plan (TMP) is an overall network plan designed to offer residents and visitors to the City a variety of reliable transportation choices. The TMP considers the results of the consideration of existing condition, implications of potential population and employment growth and the evaluation of strategic alternatives. The following components make up the plan and are discussed in this section.
1. Functional Road Network
2. Roadway Corridor and Intersection Improvements
Provincial Highway
Municipal Road
3. Transit Services
4. Active Transportation
5. Transportation Demand Management
6. Goods Movement and Haul Routes
9.2 Functional Road Network
As indicated in the Geometric Design Guide for Canadian Roads, road classification is the orderly grouping of roads into systems according to the type of service they provide to the public. Classification assists in establishing the geometric design features for each group of roads that is consistent with the short and long-term operational needs of each group. A roadway classification system establishes a hierarchy of roads that provides for the gradation of function from mobility to land access. Roads operate most efficiently and safely if each class of road is designed to serve its intended purpose.
Road Classification:
Separates roads on the basis of differences in traffic service and land service
Separates roads on the basis of design features
Separates roads on the basis of operational needs associated primarily with adjacent land use
Can be related to jurisdictional road classes
The City of Kawartha Lakes Official Plan (September 2010) recognizes a road classification based on jurisdiction, function and operational need and utilizes the following classes:
Provincial Highway
Arterial Road
Local Road
Seasonal Road
Page 86
Transportation Master Plan Municipal Master Plan Project City of Kawartha Lakes February 2012
Private Road
With the amalgamation of the Town of Lindsay and County of Victoria into a single-tier municipality in 2001, all County Roads became municipal roads. Therefore, the Transportation Master Plan road classification is based on jurisdiction, function and operational need according to the following system:
Provincial Highway
Arterial Road (Rural and Urban sub-categories)
Collector Road (Rural and Urban Sub-categories)
Local Road (Rural and Urban Sub-categories)
Seasonal Road (Rural)
This system and the criteria used by the Transportation Association of Canada (TAC) were used to categorize the roads in the City and included both rural roads and urban roads in the settlement areas. The functional classification of roads in the TMP recommended road network for the City of Kawartha Lakes is illustrated in Figure 9-1. The functional classification of roads in the TMP recommended road network for Lindsay and for the settlement areas (of Bobcaygeon, Fenelon Falls and Omemee) is illustrated in Figure9-2 and Figure9-3, respectively.
Sub-categories for rural and urban roads in the arterial, collector and local classes are recommended to account for the different characteristics associated with these roads and the different design treatments for each case. It is important to note that if the City is presented with the opportunity to assume authority over an existing or proposed private road that these design standards are adhered to before the City assumes authority.
Right-of-way requirements and other design features for these roads depend on many factors such as whether the roadway has open ditch or storm sewer drainage, the presence of on and off-street bicycle facilities, street lighting, other utilities, noise mitigation measures and landscaping. However, it is recommended that the City employ the generalized categorization system used by the TAC. General right-of-way requirements for the various road classes are summarized in Table9-1.
Table 9-1: Right-of-Way Requirements
* Range reflects the current minimum 26 metre width required in the Official Plan, with added allowance for provision of on and off-street cyclist facilities, pedestrian facilities, urban and rural drainage and utility requirements. These are to be determined on a corridor-specific basis
** 23 reflects rural road cross section minimum ROW
Page 87
Transportation Master Plan Municipal Master Plan Project City of Kawartha Lakes February 2012
Classification TypicalRight-of-wayWidth(m) Provincial Highway Determined by Others Arterial 26 – 45* Collector 26 Local 20 -23 **

! ! ! ! ! ! ! ( ! ! ( H G H W A Y 3 5 MONC K RD C K L R D 1 2 1 K R K F I E L D R D CKL RD 36 E L D O N R D HIGHWAY 7 C K L R D 4 6 CKL RD 8 F E N E L R D E L M T R E E R D PIGEON LAKE R D V C T O R I A R D S T U R G E O N R D CKL RD 24 LITTLE BRITIAN RD RAMSEY RD C K L R D 4 9 GLENARM RD WOODVILLE RD CKLRD48 PORTAGE RD BASE LINE RD P O R T E R R D HIGHWAY115 CAMBRAY RD BURYS GREEN RD S K I H I L L R D K L L A R N E Y B A Y R D C K L R D 2 6 C A M E R O N R D S M C O E S T PONTYPOOL RD C K L R D 4 1 CKL RD 30 MOUNT HOREB RD E M L Y P A R K R D HIGHWAY 7A YANKEE LINE H G H W A Y 3 6 J A N E T V L L E R D BOUNDARY RD C E N T R E L I N E R D PEACE RD GOLF COURSE RD S A D O W A R D KENT ST W CONCESSION RD 6 HIGHWAY 7 & 35 C H S H O L M T R A L BRECHINRD LON G BEACH RD O G E M A H R D T H U R S T O N A R D M A R A C A R D E N B O U N D A R Y R D S T M A R Y S R D B U R N T R I V E R R D P L E A S A N T P O N T R D CONCESSION RD 7 E A S T S T S FRANCISSTE V A L E N T I A R D HIGHWAY 7A C K L R D 4 6 CKL RD 48 CKL RD 8 S M C O E S T H G H W A Y 3 5 C K L R D 4 9 H I G H W A Y 7 HIGHWAY115 C K L R D 4 9 GLENARM RD C K L R D 1 2 1 SKIHILLRD S I M C O E S T [ City Roadway Functional Classification Pro ect on UTM NAD83 Zone 17N Source: Ontar o Road Network Date: 20 May 2009 Figure 9-1 Prov inc ial Highway Arterial Roads Collector / Local Roads Legend Woodville Bobcaygeon Lindsay Omemee Bethany Pontypool Fenelon Falls Kinmount
Co borne S re et Kent Stree Qu een Stree We ing on Street Or char d Park Ro ad Parks de Drive P geon Lake R oad Highway 7 Highway 7 & 35 Mar y Street Thunder B ridge R oad H i g h w a y 3 5 A n g e l i n e S t r e e t L i n d s a y S t r e e t A d e l a i d e S t r e e t A l b e r t S t r e e t S t D a v i d S t r e e t C K L 3 6 W i l s o n R o a d E l m T r e e R o a d Logie Street Highway7 W i l l i a m S t r e e t [
Prov inc ial Highway Arterial Roads Collector Roads Local Roads Future Provincial Highway Future Arterial Roads
Collector Roads Future River Crossing
to be Determined) Legend Proposed Lindsay Roadway Func tional Classification
Figure 9-2
Future
(Location
Highway 7 / K ng Street C K L R o a d 7 CKL Road 38 S i b e y A v e n u e Q u e e n S t r e e t Terry Road CKL Road 31 C K L R o a d 3 6 E a s t S t r e e t MainStreet CKL Road 8 K ng St eet Canal S reet MillStreet [
9-3 CKLRoad121 CKL Road 8 CKL Road 8/121 FrancisStreetBondStreet PrincessStreet CKL R oad 8 CKLRoad121 CKLRoad22 Prov inc ial Highway Arterial Roads Collector / Local Roads Legend
Settlement Area Roadway Functional Class ific ation
Figure
Bobcaygeon Fenelon Falls Omemee Proposed
9.3 Road Classification Descriptions
9.3.1
9.3.1.1
RuralRoads
Arterials
Rural arterials serve traffic movement (mobility) as a primary function. They provide land access as a secondary consideration. The traffic carried by these roads is generally less than 12,000 vehicles per day. They have a design speed of between 80-120 km/h and an average operating speed of 60-100 km/h. These roads accommodate all types of vehicles, including trucks and connect to provincial highways, other arterials and collector roads.
9.3.1.2
Collectors
Rural Collectors serve both a traffic movement and land access function equally. Traffic volumes are usually less than 5,000 vehicles per day. Traffic movement is generally interrupted flow with design speeds in the 60-110 km/h and average operating speeds in the range of 50-90 km/h. These roads accommodate all types of vehicles, including trucks and they normally connect to local roads, other collectors and arterial roads.
9.3.1.3
Locals
Rural local roads primarily serve a land access function, with traffic movement as a secondary function. Traffic on local roads is generally less than 1,000 vehicles per day. They have interrupted traffic flow with design speeds in the range of 50-110 km/h and average operating speeds in the range of 50-90 km/h. They accommodate primarily passenger vehicles, light to medium trucks and occasional heavy trucks. They generally connect to other local roads and to collector roads.
9.3.2
9.3.2.1
UrbanRoads
Arterials
Urban arterials serve traffic movement as a primary function but also service a limited amount of land access. Traffic volumes are generally in the range of 5,000-20,000 vehicles per day, with design speeds in the range of 50-70 km/h and average running speeds in the off-peak periods of 40-60 km/h. These roads accommodate all types of vehicles, including trucks. Arterials typically connect to collectors, other arterials and Provincial highways. Transit services are provided on arterials and lane widening or separate off-street facilities are usually provided for cyclists. Sidewalks may be provided, with a separation from traffic lanes provided where possible. Parking is usually not provided on arterials, but when it is it usually has peak hour restrictions. Typical intersection spacing on arterials is 400 metres, with a right-of-way width in the 26-45 metre range.
9.3.2.2 Collectors
Urban collectors can serve residential and industrial areas and they serve land access and traffic movement functions equally. They generally carry traffic of less than 10,000 vehicles per day and have interrupted flow. Design speeds are in the range of 50-80 km/h and average operating speeds are in the range of 30-70 km/h. They generally serve the movement of passenger vehicles and some service vehicles. Collectors connect to local streets, other collectors and arterial roads. Transit services are permitted on collector streets and no restrictions or special facilities are provided for
Transportation Master Plan Municipal Master Plan Project City of Kawartha Lakes February 2012 Page 91
City of Kawartha Lakes
February 2012
cyclists. Sidewalks are provided on both sides generally with on-street parking permitted, with limited peak hour restriction. The minimum intersection spacing is approximately 60 metres and minimum right-of-way widths are 26 metres.
9.3.2.3
Locals
Urban local roads serve primarily a land access function and generally carry less than 1,000 vehicles per day. They operate under interrupted flow conditions and have design speeds in the range of 3050 km/h and average operating speeds in the range of 20-40 km/h. They accommodate passenger vehicles and service vehicles only and connect to public lanes, other local roads and collector streets. Transit services are not normally provided on local streets. There are no restrictions or separate provisions for cyclists, and sidewalks are generally provided on both sides. There are either no parking restrictions, or restrictions for parking on one side. The minimum intersection spacing is 60 metres and right of way width is 20 metres.
9.4 Roadway Corridor and Intersection Improvements
9.4.1 ProvincialHighways
There are a number of highway improvements that the MTO is planning or has approved at the present time. These improvements form part of the committed/approved transportation network and are described in Section 7.
The section of Highway 7 through Omemee is covered by a connecting link agreement and improvements to the link are subject to MTO review and approval with respect to funding.
These improvements have been incorporated into the Transportation Master Plan, as work by others, and are shown on Figure9-4
9.4.2
MunicipalRoads
This assessment has identified a number of structural improvements required to key corridors and intersections in the City. These improvements are focused in the settlement areas and in the Lindsay community in particular. Detailed information will be provided in regard to rural roads through a planned road needs study in 2011. Improvements are summarized in Table 9-2 Figure 9-4 to Figure9-7 illustrate the improvements required to accommodate growth in the City as outlined in the Growth Management Study. The improvements have been categorized in terms of current projects, short-term, medium-term and long-term improvements by considering the increase in V/C ratio over the planning horizon. AppendixG provides illustrations of this relationship for many of these improvements.
While the structural improvements are a necessary minimum component of the Transportation Master Plan, they are not sufficient to address the demands for alternative modes of travel, including transit, cycling and walking. These requirements augment the road structural improvements and offer the City a plan that balances the structural and non-structural improvements to encourage less reliance for travel in the City by the private automobile for the future.
Transportation Master Plan Municipal Master Plan Project
Page 92
Table 9-2: Timing of Improvements – Lindsay Improvement Time Period Corridor(From-To) Intersection Current
Short Term
Kent Street from Highway 35 to Victoria Avenue
Hamilton Street/Victoria Avenue from Kent Street to Mary Street
Lindsay
Lindsay Street at Kent Street
Angeline Street at Kent Street
Mary Street at Lindsay Street
Lindsay
Angeline Street at Mary Street
Medium Term
Scugog River Crossing (Location and Limits to be Determined)
Angeline Street from Highway 7/35 to North of Orchard Park Drive
Colborne Street from Highway 35 to East of Albert Street
Highway 35 from Highway 7 to Thunder
Bridge Road
Colborne Street Reconstruction from Highway 7 to Highway 35
Thunderbridge Road from Elm Tree Road to Highway 35
Reconfigure Thunderbridge Road and Angeline Street.
Angeline Street at Orchard Park Drive
Angeline Street at Highway 7/35
Angeline Street at Colborne Street
Colborne Street at Highway 35
Kent Street at Highway 35
Colborne Street at William Street
Lindsay
Colborne Street at Adelaide Street
Colborne Street at Albert Street
Colborne Street at Highway 36
Wellington Street at Lindsay Street S
Wellington Street at William Street N
Queen Street at David Street
Parkside Drive at Highway 36
Bobcaygeon
East Street at Cedartree/Duke Street
LongTerm
Fenelon River Crossing
Notes: Descriptions of these improvements are provided in Appendix G
Main Street at Duke Street
West Street at CKL Road 8
East Street at Canal Street
East Street at Mill Street
FenelonFalls
CKL Road 8 at CKL Road 121
Bond Street at CKL Road 121/8
Omemee
Highway 7 at Sturgeon Road
Highway 7 at Sibley Avenue
Highway 7 at Deane Street
Highway 7 at Queen Street
2012 Page 93
Transportation Master Plan Municipal Master Plan Project City of Kawartha Lakes February
! ( ! ( ! ! ! ! !( ( ! ! ( ! ! ! ! 4 7 15 3 19 20 12 17 16 11 13 1 14 [ Colborne Street Kent Street Queen Street Wellington Street Orchard Park Road Parkside Drive Pigeon Lake Road Highway 7 Highway 7 & 35 Thunder Br dge Road H i g h w a y 3 5 A n g e l i n e S t r e e t L i n d s a y S t r e e t A d e l a i d e S t r e e t A l b e r t S t r e e t S t D a v i d S t r e e t C K L R o a d 3 6 W i l s o n R o a d S a n d e r l i n g C r e s c e n t E l m T r e e R o a d Logie Street Highway7 Med um Term Intersect on mprovements Shor -Term Intersect on mprovements Long Term Corr dor Improvement (2 Lanes) 2 Improvemen ID Number (See Appendix G Improvement Tab e) Legend Developmen Areas New Crossing o Scugog River (Loca ion to be de erm ned) Long Term Corr dor Improvement (4/5 Lanes) mprovements by others 9 18 8 10
Improvement
- Lindsay
9-4 Long-Term In ersection Improvemen s 6 5 Med um Term Corr dor Improvement (4/5 Lanes) W i l l i a m S t r e e t M c L a u g h l i n R o a d V i c t o r i a A v e n u e H a m i l t o n S t r e e t Current Corridor Improvemen (TBD Lanes) Mary Street 2
Proposed
Plan
Figure


! ! ( ! ( ! ! ( 5 4 3 2 1 Long Term Intersection Improvements 2 Improvement ID Number (See Appendix G Improvement Table) Legend Development Areas E a s t S t r e e t CanalStreet Boyd Street MillStreet King Street B o l t o n S t r e e t Cedartree Lane Duke Street MainStreet CKL Road 8 W e s t S t r e e t Proposed Improvement Plan - Bobcaygeon Figure 9 -5
Legend
Long Term Intersection Improvements
Development Areas CKLRoad8
2 Improvement ID Number (See Appendix G Improvement Table)


! 1 [
C K L R o a d 1 2 1 / 8
Francis Street
Bond Street
Princess Street Proposed Improvement Plan -
CKLRoad8
Fenelon Falls
Figure 9 -6
New Crossing of the Fenelon River (Location to be determind)


! ! ( ! ( ! ( 2 3 4 1 Long Term Intersection Improvements 2 Improvement ID Number (See Apendix G Improvement Table) Legend Development Areas Highway 7 S i b l e y A v e n u e S k i H i l l Road D e a n e S t r e e t S t u r g e o n R o a d Q u e e n S t r e e t Terry Road Proposed Improvement Plan - Omemee Figure 9 -7
9.4.3 Lindsay
9.4.3.1 Angeline Street
Angeline Street forms an integral connection in Lindsay between the highway network consisting of (Highway 35 and Highways 7/35), the commercial areas in the Kent Street corridor and the new development areas in the northwest and southwest. The screenline analysis of travel demand indicates that this corridor will require four basic travel lanes to accommodate future travel demands. This requirement will arise in the medium term. From a staging perspective, the first sections to reach effective capacity include the sections between Mary Street and Kent Street and from Kent Street to Colborne Street, primarily as a result of the traffic likely to be generated by future development adjacent to these sections. The widening of the southerly section and the northerly section will form the second and third sections anticipated to reach their effective capacities. The actual limits of the sections to be widened and the timing will depend on a number of factors including the pace and type of development that is expected to occur along this corridor, and to a lesser extent, the continued growth in background traffic. These requirements are for basic (through) lanes. Additional turning lanes will also be necessary to safely accommodate turning traffic at intersections. It is likely that where commercial development is located adjacent to the roadway, a five-lane cross section may be required, including two through lanes and a centre two-way left turn lane. Where intersection and driveway spacing permits, the centre lane can be terminated and reintroduced when required by development. Typically this type of cross section would require a width of 36 metres, depending on the boulevard treatments and need for on or off-street bicycle lanes. A corridor study of the specific lane configuration requirements should be completed in conjunction with the detailed land use planning of the adjacent areas. This corridor study should include the existing established development areas between the highway and north of Colborne Street.
Key intersections along this corridor will also require additional turning lanes to accommodate future traffic volumes. These have been identified in Appendix G and generally include provision of separate right turn lanes and in the case of the Highway 7 & 35 intersection a dual southbound left turn lane.
9.4.3.2 Lindsay Street
The screenline analysis has identified the need for four basic lanes on Lindsay Street South, from Highway 7 to Mary Street, toward the end of the planning period. This need may be accelerated and may require the addition of a fifth centre turning lane should significant commercial development occur adjacent to the south section of the road. A long-term corridor right-of-way width of 36 metres is recommended for this roadway to protect for the future addition of on-street bicycle lanes.
9.4.3.3 Colborne Street
The screenline analysis has confirmed the need for an additional traffic lane of capacity across the Scugog River. In 2000, the former County of Victoria had completed a municipal class environmental assessment for a crossing of the Scugog River at Colborne Street. While the EA study has confirmed the need for an extra traffic lane, its location should be determined as part of an amendment to the original 2000 EA or as part of the new EA for a new crossing of the river. The timing of this improvement will depend upon the final growth in traffic levels in the future. The
Transportation Master Plan Municipal Master Plan Project City of Kawartha Lakes February 2012 Page 98
function of Colborne Street between Highway 36 and Angeline Street is recognized as an arterial road in the Lindsay OP (2000). This assessment recommends that this designation be extended to include the section west of Angeline Street to Highway 35 and subsequently to Highway 7 via a relocated connection.
Preliminary traffic studies for the development of the northwest residential area have identified the need for four basic lanes on Colborne from east of Angeline Street to at least the mid-block collector roadway to this development. Given the potential for significant commercial development at the intersection of Highway 35 and Colborne Street, it is recommended that the four basic lane section be extended to Highway 35. As Colborne Street is discontinuous across the river and serves fronting residential development in areas east of Angeline Street, opportunities to obtain a four basic lane cross section in this section may be limited. Therefore, this plan ends the four basic lane section at Albert Street, with the section east of this point being designated as an arterial road with two basic lanes. Additional turning lanes may become necessary, including the possibility of a third turning lane should a crossing ever be implemented along this corridor. However, the minimum 26-metre right of way designation for the arterial roads is sufficient for this widening. The configuration of the intersection of Highway 35 and Colborne Street, including turning lane requirements, should be examined as part of the Class EA for the new river crossing.
9.4.3.4 Highway 35
The screenline analysis identified the need to widen Highway 35 to four basic lanes by the end of the planning horizon in response to traffic increases in both background traffic levels and traffic related to new development in the northwest residential and commercial areas. Additional turning lanes to accommodate commercial traffic in the block proposed north of Colborne Street will also be required. Depending on the final intersection spacing along the highway frontage, a five lane cross section may be required for part of the section between Colborne Street and Thunder Bridge Road, most likely ending north of the proposed commercial area. The details of the roadway cross section and widening will depend on the detailed planning of these lands. The roadway is under the jurisdiction of the MTO and specific requirements for intersection spacing, and speed change (auxiliary) lanes that may be necessary, are subject to review and approval by the Ministry.
9.4.3.5 Thunderbridge Road and Angeline Street
Development in the southwest quadrant of the intersection of Thunderbridge Road and Angeline Street is expected to increase travel demands entering this intersection. The existing configuration is not standard and presents some challenges to traffic entering from the north and east. It is recommended that the City transform this intersection to a more conventional configuration in conjunction with development in the vicinity of this intersection to improve operational efficiency and safety.
9.4.4 Bobcaygeon
Improvements in Bobcaygeon include intersection improvements on East Street at Mill Street, at Boyd Street and at Cedartree Lane. Additionally, intersection improvements are identified as required on Highway 8 at West Street and at the intersection of Duke Street and Main Street. Most of the improvements include the provision of traffic signals at these intersections. The timing of these installations will depend on traffic growth. Traffic signal control is generally installed only when
Transportation Master Plan Municipal Master Plan Project City of Kawartha Lakes February 2012 Page 99
traffic volumes have reached certain levels or there is a collision experience to remedy. The justification/warrant analysis is detailed in the Ontario Traffic Manual (OTM), Book 12 – Traffic Signals. In addition to the traffic signals, widenings may be required at these intersections to accommodate auxiliary (turning) lanes.
9.4.5
FenelonFalls
Recommended improvements in Fenelon Falls include provision of a traffic signal at the intersection of CKL Road 121 and Bond Street due to the high volumes forecasted for CKL Road 121. The provision of a separate westbound right turn lane at the intersection of CKL Road 121 and CKL Road 8. The timing of these improvements will depend on the pace of development, growth in background traffic volumes and satisfaction of applicable technical warrants.
9.4.6
Omemee
Recommended improvements in Omemee are limited to intersection improvements on Highway 7. This section of roadway is designated as a connecting link and improvements are cost sharable with the MTO. The need for traffic signal control (within the planning horizon) is identified at the King Street intersections with Sibley Avenue, Deane Street and Queen Street. Additionally, widenings will be required to accommodate auxiliary (turning) lanes for the eastbound left turn at the Sturgeon Road intersection and for the westbound left turn at the Queen Street intersection.
9.4.7
TransitServices
The comprehensive Strategic Transit Review established the current and future transit needs of the major urban areas within the City of Kawartha Lakes. Based on the future assessment of intra and inter municipal transit described in Sections 3 and 4, expanded transit service within Lindsay and connections to other urban areas and services is recommended subject to development of a business plan to support expanded service.
9.5 Active Transportation
The Trails Master Plan serves as an integrated plan that accounts for community needs taking into consideration future development, existing and future trails, the railway right-of-way, waterfront lands and the balance of the City. The Trails Master Plan addresses the need for a comprehensive approach to trails planning and development throughout the City, and provides a framework for future decision-making related to pathways, cycling facilities and walkways. The Trails Master Plan serves as the long-term planning tool that guides the development of new trails and open space linkages.
The Trails Master Plan identifies issues and opportunities to realizing a vision where “Trails in the City of Kawartha Lakes will be safe and accessible, support attractive and livable communities, and be sustainable…”15 . The City considered potential economic, social and health benefits of the trails system with a focus on realizing a number of key opportunities over the ten year term of the plan. A series of recommendations are described in the Trails Master Plan along with an Implementation Plan, complete with Trail Development Standards. Subsequent to the implementation of the plan, a
Page 100
Transportation Master Plan Municipal Master Plan Project City of Kawartha Lakes February 2012
15 Opcit,ExecutiveSummary,pagei.
number of recommendations will need to be implemented through policy development and by-laws including the regulation of the use of ATVs on public access roads.
The Trails Master Plan addresses requirements for incorporating non-vehicle travel into the Municipal Master Plan. The analysis and recommendations set forth in the plan are recent and relevant and do not require duplication in the Municipal Master Plan. In considering strategic and long-term planning decisions for non-vehicular travel, the City of Kawartha Lakes is advised to consult the Trails Master Plan.
In addition to the recommendations provided in the Trails Master Plan, there are a number of principles and concepts enunciated in the “When Ontario Bikes, Ontario Benefits” Green Paper that are incorporated into the Transportation Master Plan. These principles include:
A “Complete Streets” approach to ensure the needs of all users are considered in the planning, design and operation of the transportation system
A “Share the Road” vision for driver education and awareness and incorporation of this vision into way-finding signage of cycling routes
An “Active and Safe Routes to School” approach for encouraging more walking and cycling to school by children
Considering “Safe Cycling Zones” similar to the Community Safety Zone concept for traffic calming
The following outlines measures to integrate the recommendations from the Trails Master Plan with the Transportation Master Plan and that extend these recommendations in some areas.
9.5.1 Trails
The Trails Master Plan includes a number of recommendations for the planning, management of trails and development of future trails for walking, cycling and ATV use. These recommendations include:
9.5.1.1 Trails Planning and Management: Plan for trails development in growth areas. Ensure that development areas are provided with sidewalks for walking/cycling only. Develop bicycle lanes on selected collector/rural roads as road improvements are undertaken.
The Growth Management Plan has indicated a number of future growth areas in the City, with a major part of this growth occurring in Lindsay. The opportunity exists to incorporate, during the planning of these developments, appropriate pedestrian and cycling amenities through the provision of:
Sidewalks on urban streets using the TAC criteria in conjunction with City design standards
Walking/hiking trails and multi-use recreational trails for pedestrian access to parks, commercial areas and transit services in buffer areas, woodlots, open valleys, setback zones adjacent to environmental areas and in proximity to residential areas where walking and seasonal cycling are anticipated
Page 101
Transportation Master Plan Municipal Master Plan Project City of Kawartha Lakes February 2012
Cycling and low impact facilities where possible via non-motorized, low impact trails in roadway boulevards , parks and greenways, floodplains, open valleys and buffer areas
Motorized multi-use trails in rail-to-trail corridors
Design standards for these facilities are provided in Appendix A to the Trails Master Plan.
In Lindsay, the main corridors connecting the growth areas to other attractions/destinations for pedestrians/cyclists such as commercial areas, downtown and other residential neighbourhoods should be planned to accommodate transit services and the needs of pedestrians and cyclists. This will include provision of sidewalks and/or off-street cycling paths/trails where property is available or on-street cycling lanes in more constricted areas. These corridors would include Colborne Street, Kent Street, Angeline Street and Lindsay Street.
Detailed studies of these existing corridors will be necessary to identify opportunities and constraints to providing these facilities and confirming connectivity of services and appropriate ultimate widths of rights-of-way to protect for providing these services.
These studies must be completed in conjunction with the completion of a related Cycling Network Plan and Goods Movement/Haul Route Plan, recommended as part of the Transportation Master Plan, with the recommendations integrated with those from these parallel studies. The output will be an updated roads/cycling plan identifying the road classifications, cycling routes, trails systems, urban by-pass routes and staging areas.
9.5.1.2 Victoria Rail Trail Corridor (VRTC):
Determine the feasibility of staging areas around Lindsay and of a trail by-pass route, including options along Thunder Bridge Road.
The review of the feasibility of the trail by-pass route depends on identifying those areas where motorized vehicles can or cannot use the shoulders of municipal roads. In cases where the vehicles cannot use the shoulders of roadways, suitable provision in off-road trails must be made. The analysis completed indicated that this situation occurs in all highway corridors, as well as in one section of the Thunder Bridge Road corridor, due to higher traffic volumes.
9.5.1.3 Future Trail corridors
Develop a greenway trail connection in Lindsay between the VRTC North and South Corridors for non-motorized use only (from Thunder Bridge Road to Logie Street).
9.5.2 Road-BasedCycling
The Trails Master Plan also includes a number of recommendations for road-based cycling routes. These recommendations include:
Working with local cycling groups to develop a cycling network map to identify and promote cycling routes including identification of cycling type, skill level, distance, trailheads, points of interest and amenities.
Establishing rural routes through placement of signage at key start locations (i.e. Lindsay and outlying communities).
Municipal
City
February
Page 102
Transportation Master Plan
Master Plan Project
of Kawartha Lakes
2012
Establishing two or three loops of varying length that can be showcased. These loops will include in-pavement cycling facilities and will require the incorporation of improvements and safety measures as road works are undertaken.
The underlying goal of the provision of on-road cycling facilities is to improve the safety of cyclists using these facilities. This can be achieved firstly by ensuring that there is a connectivity of cycling routes provided so that users are not faced with abrupt changes in provisions of dedicated lanes and/or facilities or where these facilities are changed into general purpose travel lanes. The first step is the development of a comprehensive cycling route map for the rural and urban areas through consultations with the cycling community. Ideally these routes would be oriented to the lower volume, more scenic routes where possible; however, this is not always the best or available routing. Secondly, main constraint areas (bottlenecks), such as bridges and areas with on-street parking should also be identified and reviewed to ensure adequate provision of on-street lanes can be made. If these provisions cannot be made, these sections should not be used as part of the cycling network.
Appropriate signage of the recommended on-street network is necessary to ensure drivers and cyclists are both aware of the joint use of the roadway. This can be done by incorporating signage provided in the Ontario Traffic Manual for on-street bicycle lanes, and by provision of the “Share the Road” wayfinding signs (see Figure9-8) to enhance driver awareness of the shared-use nature of the roadway.
Thirdly, cycling route maps illustrating the on and off-street networks must be updated to reflect these additions as they occur both initially and in the future.
The City will need to undertake additional advertising of the changes to cycling periodically through print ads and on its web site. The underlying theme of “Share the Road” can form a consistent theme of a promotional program by the City.
9.5.3 CommunityInitiatives
There are several initiatives that can be undertaken by the City, schools and cycling community to raise awareness of walking and cycling opportunities. These include:
Holding cycling events, such as large public rides that mobilize a number of community resources and involve a variety of stakeholders
Consideration of holding “car-free Sundays” or establishing “car free zones”
Implementation of an “Active and Safe Routes to School” (ASRTS) program for schools in the City that is modeled on the Green Communities Canada ASRTS program (see Figure99)16
Work with local advocacy groups such as the Green Trails Alliance to promote cycling and walking.
16 Foradescriptionofthisprogramsee:http://www.saferoutestoschool.ca/downloads/ASRTS-Globe-2009-E.pdf
Transportation Master Plan Municipal Master Plan Project City of Kawartha Lakes February 2012 Page 103

Transportation Master Plan Municipal Master Plan Project City of
February 2012 Page 104
Kawartha Lakes
Figure 9-8: Share the Road Wayfinding Signage
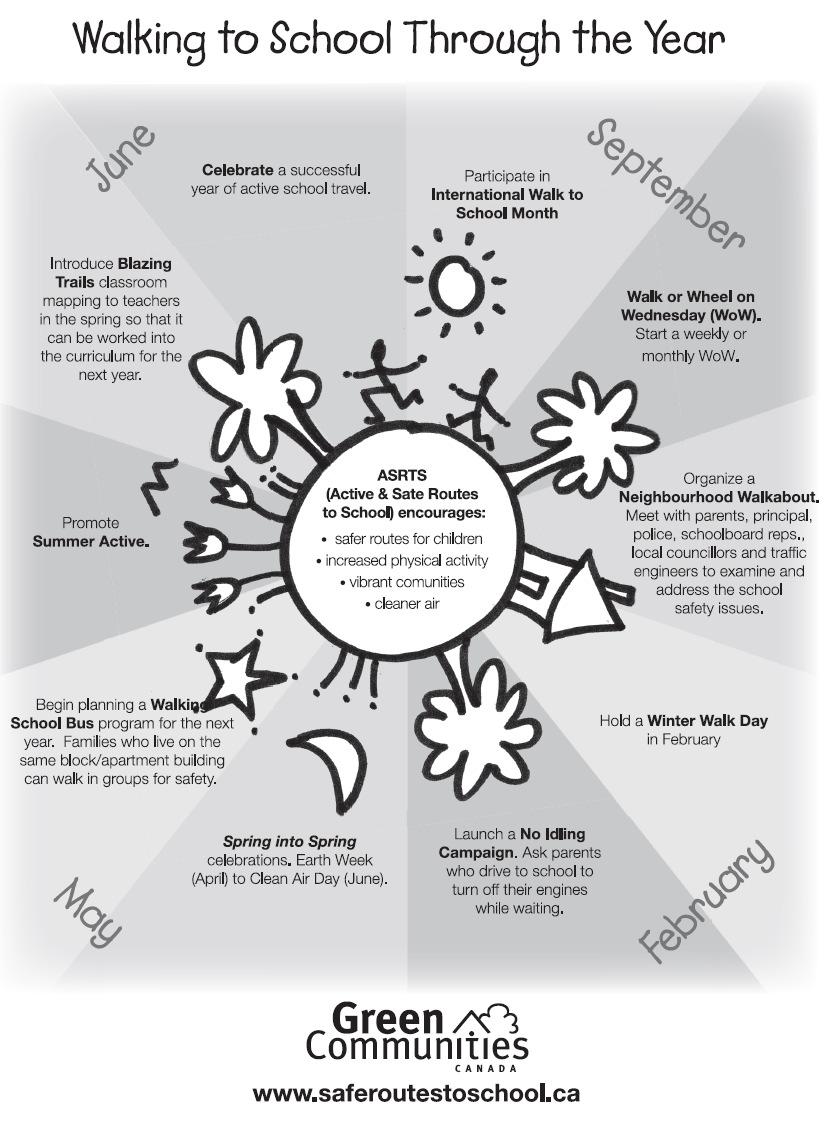
Transportation Master Plan Municipal Master Plan Project City of Kawartha Lakes February 2012 Page 105
Figure 9-9: Walking to School Through the Year
9.6 Policy Initiatives
There are a number of policies targeting active transportation and cycling in particular that should be pursued by the City. The Ontario government established a Transportation Demand Management (TDM) grant program in 2008 that provides municipalities with financial assistance for the development and implementation of TDM-related initiatives (see also discussion below). Some recently funded projects have included:
Implementation of bike locking posts
Pathways signage program
Walk-to-school pilot project (similar to the ASRTS walking school bus concept)
Share the Road promotion and signage
Preparation of a cycling Master Plan
Travelwise Community Plans to reduce auto trips
Transit outreach programs to students and persons with disabilities
Smart Commute programs
Bikeway and Trail Signage Programs
Cycle Now Education and Promotion targeting students, adults and seniors
It is recommended that the City apply for funding under this program for some of the active transportation initiatives and TDM initiatives discussed in this plan
The City may also consider bonusing provisions under the Planning Act be used where new development provides facilities that encourage use of active modes of travel, such as bike storage, showers and change rooms. These provisions may also include reductions in the amount of parking provided, particularly in areas that are well served by transit.
9.7 Transportation Demand Management
Transportation Demand Management (TDM) consists of strategies and measures designed to reduce the demand for vehicular travel by affecting a change in travel behaviour, including changing travel time and travel mode. The purpose of TDM is to make efficient use of the available transportation system and services and to reduce as much as possible the travel impacts to the natural and social environments. TDM policies and measures apply to the demand side of the transportation demand/supply relationship through three basic strategies: fee-based, behaviour-based and land usebased strategies.
Fee-based strategies affect the cost of travel through user fees for travel and for parking. Behaviourbased strategies affect the way people decide to travel and their use of specific travel modes. Land use-based strategies affect the relationship between land use and transportation, the availability and proximity of specific land uses to one another, that would affect the live – work relationship.
9.7.1 Fee-BasedStrategies
Implementing a road user fee, or toll for using the municipal roads would not be an effective
Municipal
Plan Project City of Kawartha Lakes February 2012 Page 106
Transportation Master Plan
Master
approach to reducing automobile travel during certain periods of the day in Kawartha Lakes. The rural areas have a grid road system that makes application of tolling difficult. Tolling is usually only applicable to controlled access facilities, such as 400-series highways. The Ministry does not have plans to implement these types of plans on the provincial highways serving Kawartha Lakes. This policy may be applicable to the future extension of Highway 407 to the Peterborough area; however, this extension would be a longer term improvement.
Implementing increases in the pricing or restricting the availability of long-term parking in the settlement areas may be effective particularly in changing the long-term parking behaviour. However, changing parking in the core areas can affect economic development and this strategy has been recommended for further study as part of an overall parking strategy study for the City.
9.7.2 Behaviour-BasedStrategies
Improvements to transit service and to ride sharing programs offer the City the greatest potential for TDM effectiveness. Other measures, including telecommuting, have not been shown to be able to reduce overall trips significantly.
Potential improvements to transit services between the settlement areas could include a “dial-a-ride” program or an express shuttle service. A possible commuter rail link, in addition to the existing GO Bus service to Peterborough, could integrate the City’s transportation system with external services, achieving greater interregional mobility. Improvements to the local transit services in Lindsay, particularly those to the new development areas in the northwest and southwest areas offer potential to reduce automobile travel through key corridors and intersections (such as along the Kent Street and Angeline corridors).
Ride sharing programs are designed to increase the number of persons per vehicle, or vehicle occupancy. These programs are most effective when they are supported and implemented by large employers, including government agencies, and large private organizations, and can include incentives to ride share such as preferential parking and guaranteed ride home programs. Ride sharing for interregional travel can also be promoted by utilizing the Carpool Parking Facilities and related policies of the MTO. Specific locations for such facilities can be identified and recommended to the Ministry for inclusion in this program. The existing sites can be advertised in the ride sharing packages developed with large employers and the City.
Other TDM strategies, such as changes to peak hour shifts are not appropriate as many employers currently offer flex hours for their employees and these strategies tend to be at conflict with effective ride-sharing programs.
9.7.3 LandUse-BasedStrategies
The most prominent and useful TDM approach is using increased density policies as a way of supporting development of transit services and encouraging greater use of active transportation modes. The Places to Grow legislation requires a denser form of development. The issue for the City is the ability to implement this densification in conjunction with transit supportive forms of this development to make transit service more effective and encourage its greater use by inhabitants of these developments and existing development areas. Policies that encourage mixed-use can also be an effective TDM measure, as mixed use developments tend to reduce overall trips by internalizing
Transportation Master Plan Municipal Master Plan Project City of Kawartha Lakes February 2012 Page 107
some of these trips (live-work, home-shopping, etc.), as well as encouraging the use of alternative forms of transportation.
9.8 Goods Movement and Haul Routes
The former Provincial Road system that was downloaded to the local municipality encouraged the movement of goods including aggregates through urbanized areas giving the municipality little ability to control the negative impacts.
Development of a strategic truck route network is required to identify a network that can accommodate these movements, can meet the needs of customers and suppliers and contribute to the economic well being of the City. Identification of this network will also assist the City in identifying improvements and design standards necessary to upgrade specific links in this network.
At the present time there is a need to improve data collection as it relates to goods movement and haulage in the City. The counting program undertaken as part of this study is a good starting point. However, additional data as to the origins and destinations of goods movements in the City are necessary to confirm these patterns and to determine the effectiveness of restricting these movements to specific areas or corridors.
Compatibility between the presence of a truck route and the adjacent land uses, particularly in residential developments, often arise. A strategic truck route network will assist the City in reducing these compatibility issues from arising over time as the areas develop.
A starting point in the development of the haul route network is the mapping of all existing and future goods movement corridors and facilities including pits and quarries, commercial centres and commercial corridors where goods movement and service vehicle access are paramount. A survey of private operators and businesses involved to determine their goods movement practices should be undertaken.
Designation of a haul route system will ensure efficient and safe goods transportation and handling. This would include the deliveries to businesses in the core settlement areas. Once the network is identified, the planning of compatible adjacent land uses can be completed. Zoning By-law provisions and Official Plan policies for buffer zones adjacent to truck routes may be required. Identification of appropriate fines for infractions on hauling goods on roads not designated for haulage may also need to be identified along with specific restrictions on the use of the haul routes themselves.
Truck route designations on the roads plan are more important now that the former County roads have been incorporated into the municipal road system. Previously, all County roads could be used as truck routes, with some of these roads subject to either temporary or permanent load limits as specified by By-Law. Under the recommended functional classification system, trucks are to be limited to the highway and arterial (including former County) roads. Additional restrictions may be necessary, based on an assessment of the structural adequacy of these roads to accommodate truck movements. These may include vehicle restrictions, seasonal restrictions, time restrictions or local truck restrictions. It is recommended that the City update it’s load limit By-Law to reflect current road carrying capacity determined through road needs and/or geotechnical testing studies. The design of specific corridors and intersections should consider the needs of trucks. This would include
Transportation Master Plan Municipal Master Plan Project City of Kawartha Lakes February 2012 Page 108
sightlines, speed change lanes, passing/climbing lanes and corner turning radii.
Policies and requirements for commercial loading and unloading zones in the settlement areas will need to be clarified, with exceptions permitted in certain cases of existing development. Ideally, all commercial loading should take place in off-street locations to minimize disruptions to traffic and to maintain the safety of other road users. In the case of existing development, conditions where onstreet loading is necessary need to be identified.
Transportation facilities designated as truck routes generally accommodate these movements on a 24 hour, 7 day per week basis. However, operators tend to restrict their movements to the normal working hours of the day. There may be instances where it is desirable to extend the delivery times in particular areas to avoid combining truck movements with other road traffic. In these cases, specific incentives may be required by the City to encourage this behaviour and to defray additional private sector costs associated with deliveries at these off-peak times.
In identifying an appropriate truck route network the following factors should be considered:
Impact to adjacent land uses
Transportation network continuity
Adequate structural strength of the roadway
Adequate vertical clearance
Travel lanes of at least 3.5 metres in width
Ideally, road grades of less than 4 percent
Adequate road capacity so that travel times are reasonable
The current policies in the Official Plan should be strengthened to permit truck movement on highways and arterial roads. A Trucking Advisory Group should be established to review polices as they relate to goods movement and to develop a strategic truck route network for the City, using the criteria noted above. The City should consider implementing a truck route designation in the settlement areas, in conjunction with the overall City-wide network to control truck movement in and through these communities.
9.8.1 TransportationSystemManagement(TSM)
One of the key objectives of the transportation plan is to make best use of the existing transportation system. This includes monitoring the operations periodically and making adjustments to traffic control installation and operation as appropriate to accommodate the traffic conditions as they change over time. It also includes having a series of policies in place that can regulate and maintain the integrity and operation of the transportation system. This includes implementing policies for access management and requirements for traffic impact studies.
9.8.2 TrafficControlMonitoring
9.8.2.1 Traffic Data
The Transportation Master Plan is not a static document. It must be reviewed on regular basis to ensure it meets the travel demands of the City. As described in Section 2 of this assessment, a
Transportation Master Plan Municipal Master Plan Project City of Kawartha Lakes February 2012 Page 109
comprehensive traffic data collection program, including the collection of a number of sectional and intersection traffic counts was undertaken to augment the available traffic data and establish baseline traffic conditions. It is recommended that the City periodically collect traffic data to refresh the traffic database, monitor conditions and determine if elements of the TMP need to be updated. Traffic data is useful for varying types of analyses, but its utility falls with the passage of time as changes may occur in travel patterns. Municipalities typically update their traffic database on a threeyear cycle. This involves designing a program where all signalized intersections are counted annually, while other intersections and road sections are counted once every three years. The traffic data is to monitor the state of the transportation network, the quality of traffic service and the need for improvements, through a number of traffic engineering and planning studies. It is recommended that the City design and implement and maintain this type of system going forward.
Part of the traffic monitoring and counting program involves developing an inventory of traffic control devices, including traffic signs, pavement markings and traffic signal and related equipment (signal hardware, loop detectors, wiring, controllers and pre-emption and surveillance equipment). Included in this inventory is an assembly of the traffic signal timing plans currently in service. The inventory requires regular updating to ensure the information is reflective of current conditions. Another area is the regulatory signage, including speed signage, parking restrictions, that is currently in place.
9.8.2.2 Traffic Control Warrants
The need to change traffic control at intersections or along roadways through either use of All-Way STOP control, installing traffic control signals or controlled pedestrian crossings will arise from time to time in response to changes in the traffic volumes or traffic patterns. Periodic collection of traffic information allows the City to routinely monitoring the need for changes in traffic control. These evaluations should make use of the well-established and well-accepted guidelines or warrants. Guidelines or warrants have been established for the use of all-way stop signs, the installation of flashing beacons, traffic signals, or other controlled crossings (e.g. pedestrian signals). The Ontario Traffic Manual contains applicable warrants for each of these circumstances and should be employed to assess the need to make these changes. A rigorous and quantitative approach to assessing these needs affords the City an objective assessment, and one that is consistent with established norms in traffic and safety engineering with the objective of contributing to a high degree of motorist compliance. It is recommended that the City undertake justification/warrant analyses using the OTM procedures on a regular basis, or as required, to address specific concerns raised by the public or identified through regular monitoring of the transportation system.
9.8.2.3 Regulatory Signage
Regulatory signs for speed limits, traffic control and parking also require regular review as conditions change or where specific problems become apparent. A necessary step after an inventorying of the existing signage is the assessment of compliance with applicable standards using the OTM installation guidelines and application of applicable warrants for changes, as may be necessary for changes to traffic control signage (STOP and YIELD controls). Review of parking behaviour, including adherence to time limits, parking turnover and enforcement are also suggested as necessary on a regular basis and as specific concerns arise. Speed studies and compliance with traffic control
Transportation Master Plan Municipal Master Plan Project City of Kawartha Lakes February 2012 Page 110
studies may also be appropriate in some instances. It is recommended that an overall review of traffic regulation and signage be undertaken to confirm compliance with accepted practices and procedures. A review of the goods movement and haul routes in the City as well as a parking utilization and strategy study, as described in previous sections, could be undertaken in conjunction with this type of overall traffic regulation review.
9.8.2.4
Access Management
The need for effective corridor management strategies is paramount with growing congestion and traffic demand. These strategies include access management, which has been described in the (TRB) Access Management Manual as: “…the systematic control of the location, spacing, design and operation of driveways, median openings, interchanges, street connections as well as median and auxiliary lane treatments and the spacing of traffic signals”17. Failure to manage access is associated with a number of adverse social, economic and environmental impacts, including:
Increased numbers of vehicle collisions
More collisions involving pedestrians and cyclists
Accelerated reduction in roadway efficiency
Unsightly commercial strip development
Degradation of scenic landscapes
More cut-through traffic in residential areas, as arterials are overburdened
Homes and businesses adversely affected by the widening of roads
Increased commuting time, fuel consumption and vehicle emissions, as driveways and traffic signals intensify congestion and delay along major roads.
This assessment has identified the need for improvements and widening to key corridors in Lindsay, including Angeline Street, Colborne Street and Lindsay Street. This will require a corridor review in each case that considers not only the cross sectional requirements (four or five basic traffic lanes and auxiliary lanes), but also considers intersection spacing, boulevard treatments, pedestrian and cyclist facilities (on and off-street) and right-of-way width. Access to these arterial roads between main intersections can have significant effects on operation and safety in the corridor and should be examined in this type of review. Given the vision for these corridors, noted previously in this assessment, the details of the implementation of these treatments should be undertaken in subsequent Municipal Class EAs for the widening work.
Many examples of access management guidelines are available, but those produced by the TRB or other agencies can be used by the City as a starting point to develop its own access management practices and policies.
9.8.2.5 Traffic Impact Studies
Traffic Impact Studies (TIS) are undertaken, by the developer as a requirement of Draft Plan
17 TransportationResearchBoard. Access Management Manual,Washington,DC,2003.
Transportation Master Plan Municipal Master Plan Project City of Kawartha Lakes February 2012 Page 111
approval, for new development projects to determine the need for any improvements to the surrounding road system to accommodate the added or changed traffic conditions and patterns that are a result of the development. These studies are also undertaken to determine the on-site transportation facilities necessary to accommodate site access, on-site circulation and parking.
Requirements for these studies vary from location to location, however many agencies have published guidelines for the preparation of these studies. For example, the Institute of Transportation Engineers (ITE) has published guidelines18 as have many jurisdictions in Ontario. In this regard, it is recommended that the City develop guidelines for the preparation of traffic impact studies.
The objective of the TIS study is to demonstrate that the transportation impacts of a proposed development or redevelopment will be manageable and that the transportation aspects of the proposed development are consistent with the objectives of the City. The TIS will also provide a basis for the identification and evaluation of the transportation related improvements or measures required to address the impacts arising from the proposed development. The scope of a traffic impact study is determined by the following factors19 :
When is a study needed?
Traffic impact studies are typically required when one of the following triggers is met:
When the development generates a specific number of peak-hour trips
When the development generates a specific number of daily trips
When the development size exceeds a specified limit
At the government agencies discretion
When the development is to occur in a sensitive area
When financial arrangements are required
ITE has recommended that in the absence of locally establish thresholds, a traffic impact study should be conducted wherever proposed development will generate one hundred or more added (new) peak direction trips to or from the site during the adjacent roadway’s peak hours or during the developments peak hours.
What are the study limits?
These studies include:
All site access driveways
Adjacent roadways and major intersections
The first signalized intersection in each direction from the site based on local policy
18 InstituteofTransportationEngineers,“Traffic Access and Impact Studies for Site Development – A Recommended Practice”, Washington,DC,1991.
19 Source:ITE, “Professional Traffic Operations Engineers Certification Program Refresher Course”,Washington,DC.2002.
Transportation Master Plan Municipal Master Plan Project City of
Lakes February 2012 Page 112
Kawartha
Additional areas as specified in local policy
What Background data is needed?
Typical data inputs for a TIS include:
Traffic volumes
Land uses and demographics
Existing and planned transportation system
Other transportation data, such as origin – destination, collision and other data
What should be the study horizon?
Depending on the size and intensity of the development, the following are typical study horizons:
Anticipated opening day of major phases of the development
Anticipated date of full build out
Five years after full build out of the site
What are the steps in the process?
A typical site impact analysis requires the following steps:
Site traffic generation
Site traffic distribution and assignment
Non-site (background) traffic forecast
Analysis of level of service at signalized and non-signalized intersections
Site access improvements, internal site circulation and parking analysis
9.8.2.6
Road Safety Audits
In conjunction with a successful transportation system management plan is the on-going review of safety of the transportation network, or safety management plan. Road Safety Audits (RSAs) represent an additional tool within the suite of tools available that make up a multidisciplinary safety management system aimed at improving roadway safety.
A Road Safety Audit is a formal safety performance examination of an existing or future road or intersection by an independent audit team. Road safety audits can be used in any phase of project development from planning and preliminary engineering, design and construction. RSAs can also be used on any sized project from minor intersection and roadway retrofits to mega-projects. The road safety audit generally involves a multi-disciplinary team so that they can consider the needs of all road users and qualitatively estimate and report on road safety issues and opportunities for safety improvement20
Transportation Master Plan Municipal
Plan Project City
February 2012 Page 113
Master
of Kawartha Lakes
20 FederalHighwayAdministration,“FHWA Road Safety Audit Guidelines”:PublicationNo.FHWA-SA-06-06,FHWA, Washington,DC,2005,p.v.
The City may have established a traditional safety review processes through its high hazard identification and correction programs. However, a road safety audit and a traditional safety review are different processes. It is important to understand the difference between the road safety reviews that are commonly performed and newer road safety audits. As RSAs may be a new process for the City, a “top down” strategic approach is recommended for the introduction of RSA’s. This process typically includes undertaking pilot RSA projects to demonstrate the value of these studies and to perfect the techniques for completing them. A formal RSA policy can then be developed that embodies what has been learned from the pilot projects. Subsequent RSA projects should then be monitored, refined and promoted as a process to improve safety.
The City is already undertaking safety-related tasks that, taken together, constitute an informal audit process. These tasks may include independent safety and design reviews conducted from the road user perspective that examine new alignments and/or existing road segments and intersections slated for rehabilitation or expansion. The City may be able to formulate a formal RSA policy on the basis of this experience without the need to conduct RSA pilot projects.
The following summarizes various types of projects and the degree to which each may have potential for safety improvement.
Capital Improvement Projects
These projects generally provide significant safety benefits, particularly when conducted early in the design process. There is generally more scope to conduct the audit and greater opportunity to implement RSA suggestions.
Rehabilitation Projects
Undertaking RSA’s on these projects may result in significant benefits. Incorporating safety improvements is often achievable with only minor changes to the overall design.
Surface Improvement (Operational) Projects
These projects have probably the greatest potential to benefit from RSAs. Often low cost, high value safety enhancements that are capable of being implemented in conjunction with other operational improvements result from these projects.
Bridge Reconstruction/Rehabilitation Projects
Generally, broadly scoped projects offer the greatest potential to incorporate major improvements suggested by RSAs. Narrower scoped projects (such as bridge deck rehabilitation) may also benefit from suggestions such as illumination, signs, pavement markings/delineation and accommodating the needs of pedestrians and cyclists.
Safety Projects
Incorporating RSAs on these projects offers potential to provide a proactive approach to safety. RSA’s identify potential hazards by looking at in-service roads from different perspectives and offer suggestions for improvement that do not rely on collision history validation.
Transportation Master Plan Municipal Master Plan Project City of Kawartha Lakes February 2012 Page 114
Developer-led Projects
These projects potentially offer enormous opportunities and benefits; however, they require management of developer resistance to iterative reviews and redesign requirements.
As described in the FHWA guidelines report, one approach to determining what types of projects may benefit from RSAs is through the application of nominal and substantive safety concepts. Nominal safety refers to compliance with standards and substantive safety refers to collision performance. The following examples taken from the FHWA report illustrate the application of these concepts to existing roads.
An intersection or road segment that does not meet current design standards (nominal safety issues) and also has a poor record of safety performance (substantive safety issues) should also be considered as a high priority candidate for RSA as the potential for safety improvement, and the likelihood of its achievement, is also high.
An intersection or road segment that meets all current design standards (no nominal safety issues) but has a poor record of safety performance (substantive safety issues) should also be considered as a priority candidate for RSA as the potential for safety improvement, and the likelihood of its achievement, is significant.
An intersection or road segment that does not meet current design standards (nominal safety issues) but has a satisfactory record of safety performance (no substantive safety issues), should be considered as a lower priority candidate for an RSA relative to those above, which exhibit substantive safety issues, as the potential safety improvement, and the likelihood of its achievement, is low to moderate.
To implement a selection process for projects, a screening of all road segments and intersections can be undertaken to identify the degree to which each satisfies current design practices (nominal safety) and record of safety performance (substantive safety). The safety performance can be based initially on a screening by collision frequency and by collision rate. Over time, as more safety and traffic information is collected by the City, including determination of Annual Average Daily Traffic (AADT) volumes, a more sophisticated approach to screening that examines the over or under representation of various types of collisions in comparison to overall network experience can be used to target RSA candidate projects.
While most agencies recognize that the benefits of RSAs are substantial, these benefits are largely immeasurable. However, major quantifiable benefits can be identified in the following areas:
Throwaway costs and construction costs to correct safety deficiencies identified once roads are in service are either avoided or substantially reduced.
Lifecycle costs are reduced since safer designs often carry lower maintenance costs (e.g. flattened slope versus guiderail)
Societal costs of collisions are reduced by safer roads and fewer, less severe, collisions
Liability claims, a component of both agency and societal costs, are reduced
Generally, the cost for carrying out an RSA is in the range of $2,000 - $5,000. Pilot programs at other agencies have identified that RSA teams often identify safety concerns that would not have otherwise
Transportation Master Plan Municipal Master Plan Project City of Kawartha Lakes February 2012 Page 115
been discovered as part of a standard safety review and as a result the value of projects where the RSA process was applied was significantly enhanced.
9.9 Transportation Master Plan Findings and Recommendations
9.9.1 Findings
The following summarize the findings that are made based on the results of the long-term transportation assessment undertaken for the development of the Transportation Master Plan.
9.9.1.1 Existing Travel Demand and Characteristics
The transportation assessment has determined that traffic volumes on the City’s transportation system are growing at between 1 to 2 percent per annum on a compound basis. Traffic volumes on the City’s transportation system are subject to seasonal variation. Summer traffic volumes are typically 25 percent higher than at other times of the year. The increase in the summer months is the result of an increase in seasonal population of some 30 to 40 percent of the City’s permanent population and an increase in tourist and recreational traffic.
Commercial traffic represents approximately less than 10 percent of the total traffic, but can be more than this in specific corridors providing haul routes for goods movement.
Based on the 2006 census data, travel in the City is primarily by private automobile (92 percent of trips). Approximately one percent of trips are by transit, 6 percent are by either walking or cycling and 1 percent by other modes such as horse drawn carriage.
Approximately 66 percent of total work trips by persons living in the City are to areas internal to the City. Remaining trips are to areas external to the City, with approximately 7 percent of these trips to the east (Peterborough), 14 percent of trips to Toronto and South Durham, and 10 percent to North Durham, and York Region.
9.9.1.2 Future Travel Demands
Travel to/from future residential development to employment areas both internal and external to the City, as well as a continued increase in area tourism is projected to add significant traffic volumes to roads and highways in the City.
MTO is planning major improvements to the highways including a widening to four lanes of Highway 7 & 35 from Highway 36 to Highway 35 (North Junction), widening to five lanes for a section of Highway 35 south of Highway 7/36, and realignment of the Highway 7 and 35 intersection, including a section of Kent Street at the western gateway to Lindsay.
In addition, GO Transit has expanded GO Bus service to Peterborough, and Metrolinx has completed a study to examine the potential for rail service to Peterborough as well. The current GO service to Peterborough passes through the very southern part of the City of Kawartha Lakes, however the stop is at the junction of Highway 35 and 115, just south of the City of Kawartha Lakes in the Municipality of Clarington.
This assessment has shown that a number of the existing corridors and intersections in the City will not be able to accommodate predicted increases in traffic volumes without additional roadway capacity being provided.
Transportation Master Plan Municipal Master Plan Project City of Kawartha Lakes February 2012 Page 116
9.9.2 StrategicAlternatives
Three alternative planning solutions to addressing these capacity deficiencies were identified and evaluated in this assessment. These alternatives included: “Do Nothing”; providing structural improvements (road additions and widening); and a balanced strategy of structural and non-structural improvements (improvements to transit and active modes). The structural improvement alternative was found to be the minimum necessary to accommodate the projected growth. However the Balanced Strategy is the preferred strategy, given the support and encouragement for the use of alternative modes and alignment with City and Provincial objectives.
9.9.2.1 Structural Improvements
A number of improvements to the roadways in Lindsay and in other settlement areas were identified as necessary to accommodate future traffic growth. These include in the medium term provision of an additional traffic lane across the Scugog River; widening of Angeline Street and Colborne Street, these would require land acquisition; and in the long term, widening of Lindsay Street and providing an additional crossing in Fenelon Falls. A number of intersection improvements will also be necessary in conjunction with these road widenings. Plan for the addition of sidewalks and on and off-street cyclist facilities to roads being widened or otherwise improved.
9.9.2.2 Non-Structural Improvements
Provide improved transit service based on business case analysis to the developing areas in Lindsay as well as between Lindsay and other settlement areas of Bobcaygeon, Fenelon Falls and Omemee.
9.9.2.3 Policy Initiatives
The City should encourage major employers to prepare and submit Travel Demand Management (TDM) Plans with the goal of reducing the number of trips made by the private automobile. Incentives that might include reduced parking requirements or reduced prices for transit passes could be considered by the City to encourage preparation of these plans.
New development meeting certain minimum size criteria should be required to prepare and obtain approval for a traffic impact study for the proposed development. This study should show how the net negative effect of site traffic to the surrounding road system can be reduced to an acceptable level.
Transportation Master Plan Municipal Master Plan Project City of Kawartha Lakes February 2012 Page 117
9.10 Recommendations
Based on the results of the transportation assessment, a number of recommendations are made with respect to roadway classification, transportation strategy, transit, and implementation and monitoring.
9.10.1 RoadwayFunctionalClassification
1. That the City of Kawartha Lakes adopt the recommended roadway functional classification shown in Figure9-2 to Figure9-3 inclusive, that is based on the classification for rural and urban roadways published by the Transportation Association of Canada.
2. That the City undertakes a review of the draft 2007 designation of Haul Routes in conjunction with input from the affected industries, identify an appropriate Schedule of permissible Haul Routes for inclusion into the City’s Secondary Plans.
9.10.2 TransportationStrategy
1. That the City adopt a balanced strategy of providing both structural improvement and nonstructural improvements to addressing future capacity deficiencies. This will include providing road widenings to corridors identified in Appendix G. This will include the planning for additional traffic capacity across the City.
Providing improved transit services to new development areas in Lindsay, and between Lindsay and other settlement areas (see discussion below)
Planning sidewalk and cyclist facilities to new roads and widened roads to encourage use of active transportation modes.
Provide improved signage of cycling routes.
Update promotional materials describing the walking and cycling facilities available in the City.
Consider implementation of ‘Share-the-Road’ signing of cycling routes and ‘Active and Safe Route to School’ walking programs at local schools.
Encouraging preparation of TDM plans, including programs for cyclists, by considering bonuses under the Planning Act or other incentives including reduced parking requirements.
Undertaking a comprehensive TSM program as outlined in this assessment.
2. That the City implement the recommendations of the Trails Master Plan in conjunction with the recommendations of this plan. Specifically, that a cycling network study be initiated to identify and review the cycling, pedestrian and trails connectivity and improvement priorities.
3. That the City undertake a Parking Strategy Study to assess the operation of existing downtown parking in Lindsay and other settlement areas, the costs of providing this parking (operations and maintenance), the parking requirements for new development and redevelopment sites in the downtown areas, the method of parking enforcement and the potential to provide additional parking to meet future demands. This study should be undertaken with input from
Transportation Master Plan Municipal Master Plan Project City of Kawartha Lakes February 2012 Page 118
the business community and include more detailed parking utilization surveys of the existing parking operation. A parking strategy component has been included in the Community Based Secondary Plan Capital project to be initiated in 2011. This project will focus on the City’s urban areas of Bobcaygeon, Fenelon Falls, Lindsay, Omemee, and Woodville. In addition, a Municipal Parking Lot review is being conducted by the City, in conjunction with the Lindsay BIA, that will also inform the parking strategy component of the Lindsay Community Secondary Plan.
9.10.3 TransitRecommendations
9.10.3.1
Frequency of Service
The existing frequency of service is sixty minutes on two (2) routes and thirty (30) minutes on one (1) route. It is recommended that staff should consider reducing the frequency from 60 minutes to 30 minutes in the medium term on all routes.
9.10.3.2 Maintenance Staff
The City will need to increase the number of maintenance staff to support additional buses. It is recommended that an additional bus mechanic be retained to ensure reliability of the transit fleet in the short term and an additional mechanic in the medium term.
9.10.3.3 Centralized Transfer Station
The Comprehensive Strategic Transit Service Review recommended the purchase of land to provide a centrally located transfer hub in the downtown. Although Council has identified that within the 5 year time horizon a centralized transfer location should be established in the downtown core it appears that this recommendation is not being implemented at the present time. Such a transfer hub will improve the level of service to the riders of the transit system and will provide an opportunity to centralize transit staff, especially the Transit Supervisor, in a location that best serves the needs of transit ridership. At the present time the Transit Supervisor is located in an office at the Works Yard located in the northeast portion of Lindsay thus significantly reducing the ability of the Supervisor to interact with the ridership. It is recommended that the City proceed with a study that examines potential locations for a centralized transfer hub in the core of Lindsay and that such a centralized location include facilities to house the Transit Supervisor.
9.10.3.4 Position of Transit Supervisor
The position of Transit Supervisor is presently a part time position. Since transit operates twelve hours per day and six days per week the Transit Supervisor is present and working for only a small number of the service hours. As indicated above, the Transit Supervisor is located in an office removed from the primary transit transfer hub in the downtown core. In order to improve level of service and impact ridership it is imperative that the Transit Supervisor be present as many hours as possible while the transit system is operational in order to improve level of service, deal with customer complaints and concerns and provide management oversight. Therefore it is recommended that the position of Transit Supervisor be made a full time position at the earliest opportunity and the position should be included for consideration by Council as part of the next budget submission.
Transportation Master Plan Municipal Master Plan Project City of Kawartha Lakes February 2012 Page 119
9.10.3.5 Intermunicipal Transit Recommendations
The City should formally initiate discussions with the Provincial and Federal Governments that a commuter rail link to Peterborough would benefit the City, and would have a positive impact on the overall development of transit in the geographic region in the long-term.
The City should take the necessary steps to support the introduction of GO Bus service into the City. This may include the expansion of intramunicipal transit in the City, including obtaining permission to expand the system south of the City to the junction of Hwy 115 and 35, to support a connection with the current Peterborough GO Bus line.
o Permission from the Province would be required because expansion of the system to the junction of Hwy 35 and 115 would be south of the City limits.
9.11 Implementation and Monitoring
1. That the City provide for the staged implementation of the structural and non-structural improvements described in Table 9-2 and presented in Figure 9-4 to Figure 9-7 for the short, medium and long-term time frames and update these priorities on a five-year cycle.
2. That the City undertake a continuous monitoring of the traffic operations and safety of the transportation system, including the operation of the traffic control system. This would include an annual review of warrants for traffic control changes, identification of hazardous locations based on a collision and safety review. Undertake a systematic review of the traffic signal control timing plans and updating in accordance with the prevailing traffic conditions.
3. That the City develop and maintain an access management policy that has the objective of maintaining the integrity of the road system through controls of the number, location and design of access to existing and proposed development.
9.12 Official Plan and Community Based Secondary Plans Integration
The City should give consideration to incorporating the recommendations of the Transportation Master Plan into the City of Kawartha Lakes Official Plan, where appropriate to form the basis from which the recommendations can be implemented into the Transportation Master Plan. The Transportation Master Plan also recommends a number of guidelines and policy initiatives regarding transportation demand management, active transportation and parking management that involve land use planning, urban form and the integration of transportation and land use. The City’s new Official Plan was adopted by Council in September 2010 and is before the province for review and approval. The City will also be undertaking Community Based Secondary Plans for the communities of Bobcaygeon, Fenelon Falls, Lindsay, Omemee and Woodville in 2011/2012. The recommendations of the Municipal Master Plans, including this Transportation Master Plan should be incorporated into those policy documents.
Specific policies recommended for inclusion into the Official Plan are:
1. Transportation Goal: The transportation goal of developing a comprehensive Transportation Plan that will assist the City of Kawartha Lakes through the identification of policies, guidelines, improvement recommendations and implementation plan, to accommodate growth in a healthy and sustainable manner should be included in the Official Plan.
Transportation Master Plan Municipal Master Plan Project City of Kawartha Lakes February 2012 Page 120
2. Transportation Objectives: The objectives described in Section 1.5.2 should be incorporated into the Official Plan.
3. Transportation planning principles needed to support and implement the Healthy and Sustainable strategy identified in this Transportation Master Plan and in the Moving Forward to Implement Healthy Community Design and in the New Vision for Urban Transportation should be incorporated into the Official Plan.
4. Road Classification: The Transportation Schedule of the City’s Official Plan should be amended to reflect the classification scheme recommended in this Transportation Master Plan.
5. Roadway Level of Service: Reference to level of service standards in the Official Plan and in Municipal Class EAs of specific projects should state that the City endeavours to maintain conditions consistent with at least Level of Service D in the afternoon peak hour. As summarized on Figure 2-11, Level of Service D represents traffic operations approaching unstable flow with high passing demand and passing capacity near zero, characterized by drivers being severely restricted in manoeuvrability. Once conditions on a road or intersection are forecast to exceed Level of Service D operation, this can be deemed to constitute a “Problem” as defined in Phase 1 of the Municipal Class Environmental EA process and actions may be taken to return operations to the Level of Service D planning standard.
6. Corridor Protection: The City should review provisions in the Official Plan to ensure they contain sufficient policy directions to protect the long-term integrity and operational effectiveness of the transportation network and its connections to the Provincial Highway system. Corridors must be protected from land use forms, access and encroachment that would restrict roadway operations and contribute to decreased safety to the travelling public.
7. Public Transit: The Official Plan should include supportive statements or policy directions on the role of public transit in the City as part of the sustainable transportation strategy, including the provision of service into appropriate service areas of the City in conjunction with the supporting recommendations of the Transportation Master Plan. The Official Plan can also include a policy supporting provision of alternative service delivery methods (dial-aride and taxi services).
8. Goods Movement and Haul Routes: The provisions in the Official Plan covering goods movement and haul routes will require updating to reflect a Schedule of Haul Routes showing those roadways suitable for movement of heavy vehicles and those roadways where restrictions to the movement of trucks (either temporary or permanent) occur. This schedule will be the result of a study of haul routes in the City and consultation with affected businesses and operators.
9.13 Study Integration
The Transportation Master Plan will form a basis for undertaking a number of more detailed studies (internal and/or external) of specific improvement projects, or traffic studies required in connection with future development proposals (traffic impact studies). The traffic forecasts undertaken as part
Transportation Master Plan Municipal Master Plan Project City of Kawartha Lakes February 2012 Page 121
of the Transportation Master Plan have been prepared in relation to assessing the need for a series of network improvements, and not for one specific improvement. The forecast traffic volumes produced as part of this study are based on a simplified transportation analysis using historical traffic growth trends, existing travel patterns, observed seasonal traffic peaking characteristics and estimated traffic generation from proposed residential development. These forecasts are not based on a detailed transportation model of trip interchanges. While the forecast volumes are representative of the total volume of traffic crossing selected screen lines, it is possible to have some variation in the assignment of this traffic to specific network links and intersections. Therefore, the link-specific volumes should not be used directly as the basis for detailed traffic analysis of specific roadways and intersections. However, they can be used to determine the projected growth rates in traffic volumes crossing these screen lines and these growth rates can be applied to specific corridors to obtain estimates of future traffic conditions.
A typical methodology that could be used to forecast traffic volumes for subsequent traffic studies of specific improvements or developments includes the following:
Determine the existing (base year) traffic conditions with actual traffic counts.
Identify appropriate project implementation timing and traffic forecast horizons.
Identify appropriate screen line volumes and growth rates in proximity to the project. Use these growth rates to expand base-year traffic volumes to the desired analysis horizon year. This will result in an estimate of future background traffic conditions (to a development level consistent with the growth management population and employment).
Adjust the future background traffic, if necessary to reflect specific development proposals in the vicinity of the project (if these are different than the Growth Management Plan forecasted land use intensity).
Add site-specific traffic generation to driveways and intersections in the vicinity of the site.
Transportation Master Plan Municipal Master Plan Project City
February 2012 Page 122
of Kawartha Lakes
Transportation Master Plan
Municipal Master Plan Project City of
10.0 IMPLEMENTATION PLAN
February 2012
The strategic transportation improvement projects recommended for the City of Kawartha Lakes Transportation Master Plan for the Short- (2012 to 2013), Medium- (2013-2021) and Long-terms (2021-2031) are summarized in Table 10-1, 10-2 and 10-3. These improvements are shown on Figure9-4 to Figure9-7. Descriptions of these improvements are provided in AppendixG
Table 10-1: Short Term Improvements
Table 10-2: Medium Term Improvements
Kawartha Lakes
Page 123
Improvement Areas Estimated Capital Costs Municipal Class EA Requirement* LindsayStreetatKentStreet $25,000 ScheduleA+ AngelineStreetatKentStreet $1,400,000 ScheduleA+ Short Term Lindsay MaryStreetatLindsayStreet $925,000 ScheduleA+ Short Term Total $2,350,000
Improvement Areas Estimated Capital Costs Municipal Class EA Requirement* AngelineStreetatMaryStreet $900,000 ScheduleA+ AngelineStreetatOrchardParkDrive $225,000 ScheduleA+ AngelineStreetatColborneStreet $1,400,000 ScheduleA+ ColborneStreetatWilliamStreet $675,000 ScheduleA+ ScugogRiverCrossing(LocationandLimitstobeDetermined) $5,000,000 Conductasa ScheduleCClass EA AngelineStreetfromHighway7/35toNorthofOrchardPark Road $10,000,000 Conductasa ScheduleCClass EA WorkbyOthers: AngelineStreetatHighway7/35 ColborneStreetatHighway35 Lindsay KentStreetatHighway35 Subjectto ProvincialClass EA Requirements Medium Term Medium Term Total $18,200,000
Table 10-3: Long Term Improvements
Transportation Master Plan Municipal Master Plan Project City of Kawartha Lakes February 2012 Page 124
Improvements Estimated Capital Costs Municipal Class EA Requirement* ColborneStreetatAlbertStreet $225,000 ScheduleA+ ColborneStreetatHighway/Highway36 $225,000 ScheduleA+ WellingtonStreetatLindsayStreetS $400,000 ScheduleA+ WellingtonStreetatWilliamStreetN $400,000 ScheduleA+ QueenStreetatDavidStreet $225,000 ScheduleA+ ReconstructThunderBridgeRoadatAngelineStreet $2,000,000 Conductasa ScheduleCClass EA ColborneStreetfromHighway35toAlbertStreet $3,800,000 Conductasa ScheduleCClass EA ReconstructColborneStreetfromHighway7toHighway35 $1,400,000 ScheduleA+ ReconstructThunderbridgeRoadfromElmTreeRoadto Highway35 $2,700,000 ScheduleA+ Lindsay Total $11,375,000 WorkbyOthers: Lindsay Highway35fromHighway7toThunderBridgeRoad Subjectto ProvincialClass EARequirements EastStreetSatCedartreeLane/DukeStreet $675,000 ScheduleA+ MainStreetatDukeStreet $225,000 ScheduleA+ WestStreetatNorthStreet/CKLRoad8 $225,000 ScheduleA+ EastStreetatBoydStreet/CanalStreet $225,000 ScheduleA+ EastStreetatMillStreet $225,000 ScheduleA+ Long Term Bobcaygeon Bobcaygeon Total $1,575,000
Table 10-3: Long Term Improvements
*Such expenditures may be subject to connecting link substitutes based upon approval by the MTO annual connecting link program.
** All Municipal Class EA Requirements subject to “Bump Up” if necessary
UnitCostsbasedonthefollowing:
Transportation Master Plan Municipal Master Plan Project City of Kawartha Lakes February 2012 Page 125
Improvements Estimated Capital Costs Municipal Class EA Requirement* BondStreetatCKLRoad121/8 $225,000 ScheduleA+ FenelonRiverCrossing $5,000,000 Conductasa ScheduleCClass EA Fenelon Falls Fenelon Falls Total $5,225,000 KingStreet/Highway7atSturgeonRoad $250,000 KingStreet/Highway7atSibleyAvenue $225,000 KingStreet/Highway7atDeaneStreet $225,000 KingStreet/Highway7atQueenStreet $475,000 ScheduleA+ Omemee* Omemee Total $1,175,000 Total Long Term Cost $19,350,000 2009-2031 Total City Cost $39,900,000
IntersectionSignalization $225,000 Leftturnlane $250,000 Dualleftturnlane $600,000 Rightturnlane $200,000 Twolaneroadreconstruction $1.0million/km Newthroughlaneineachdirection $1.5million/km
Appendix A
Study Terms of Reference

Transportation Master Plan Municipal Master Plan Project City of Kawartha Lakes February 2012 Appendix A
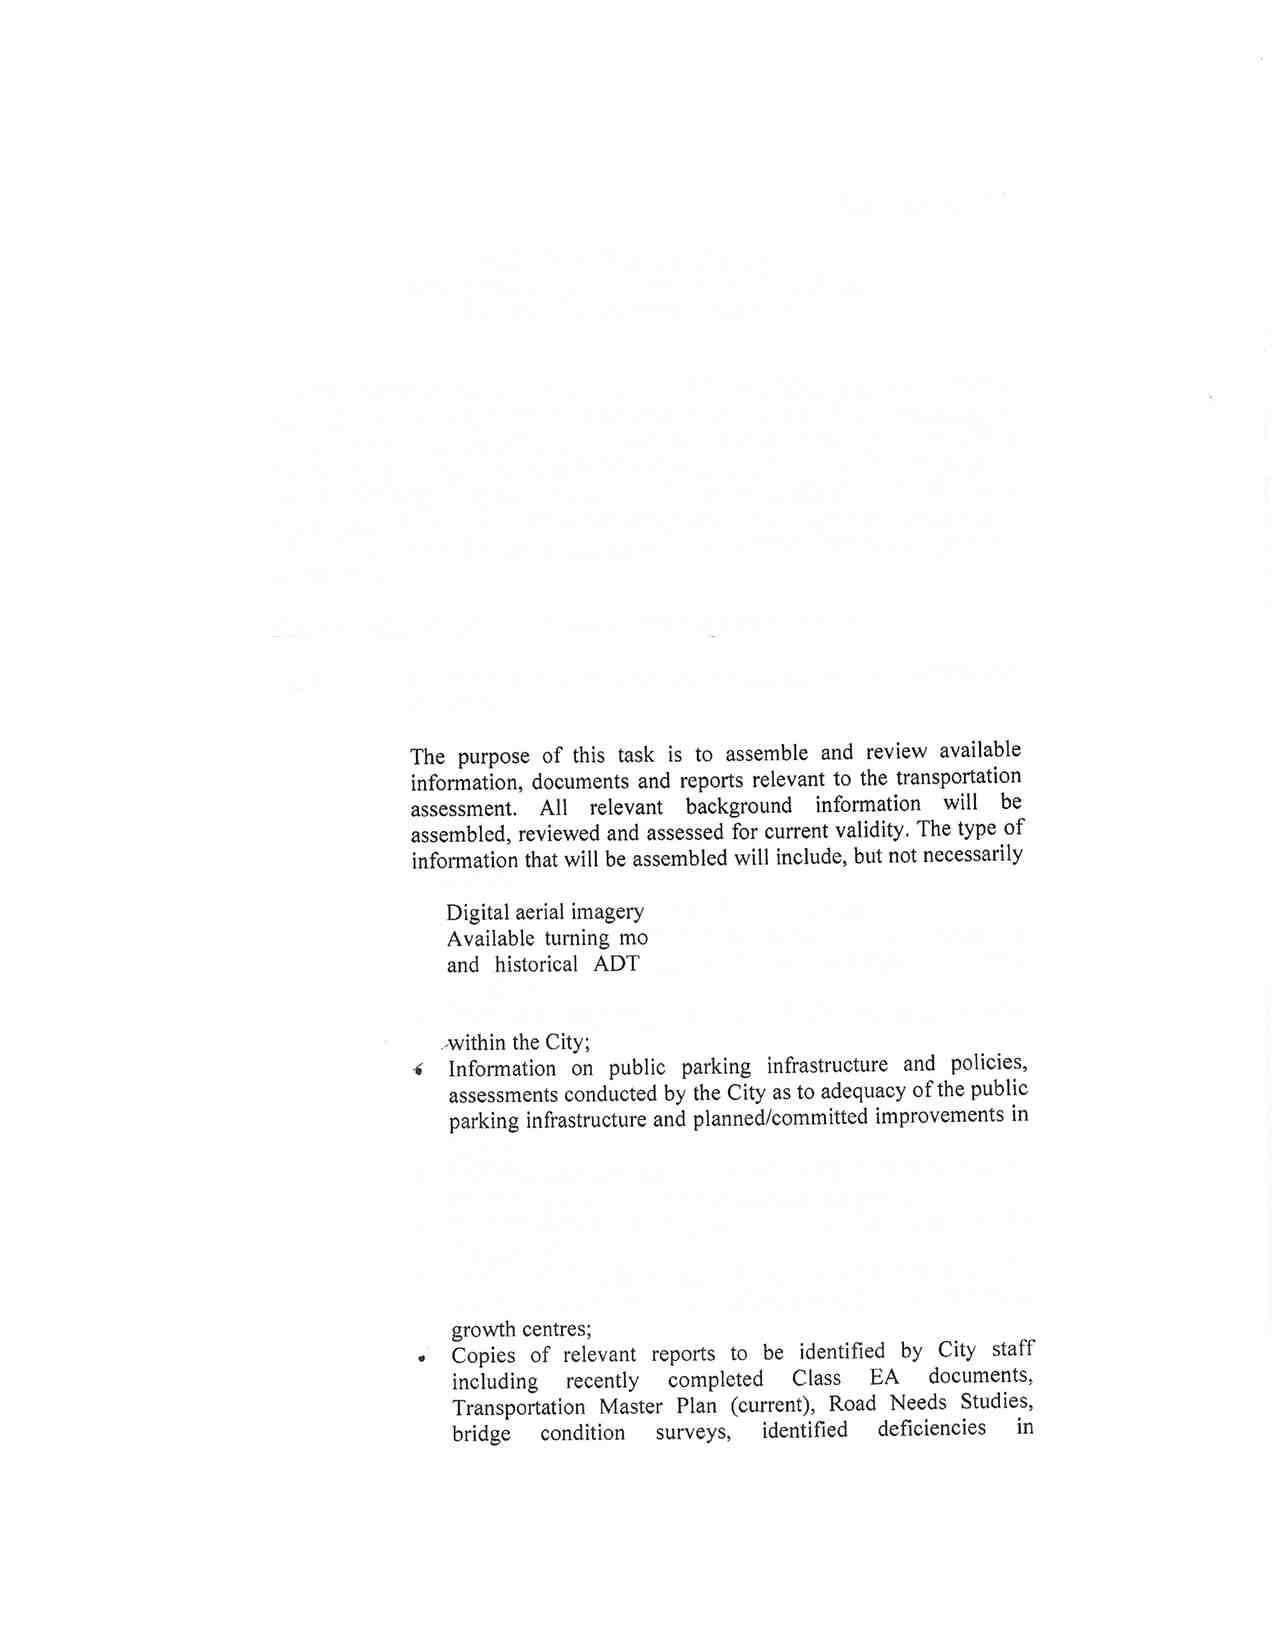


Appendix B
Study Area Photographs
Transportation Master Plan Municipal Master Plan Project City of Kawartha Lakes February 2012 Appendix B
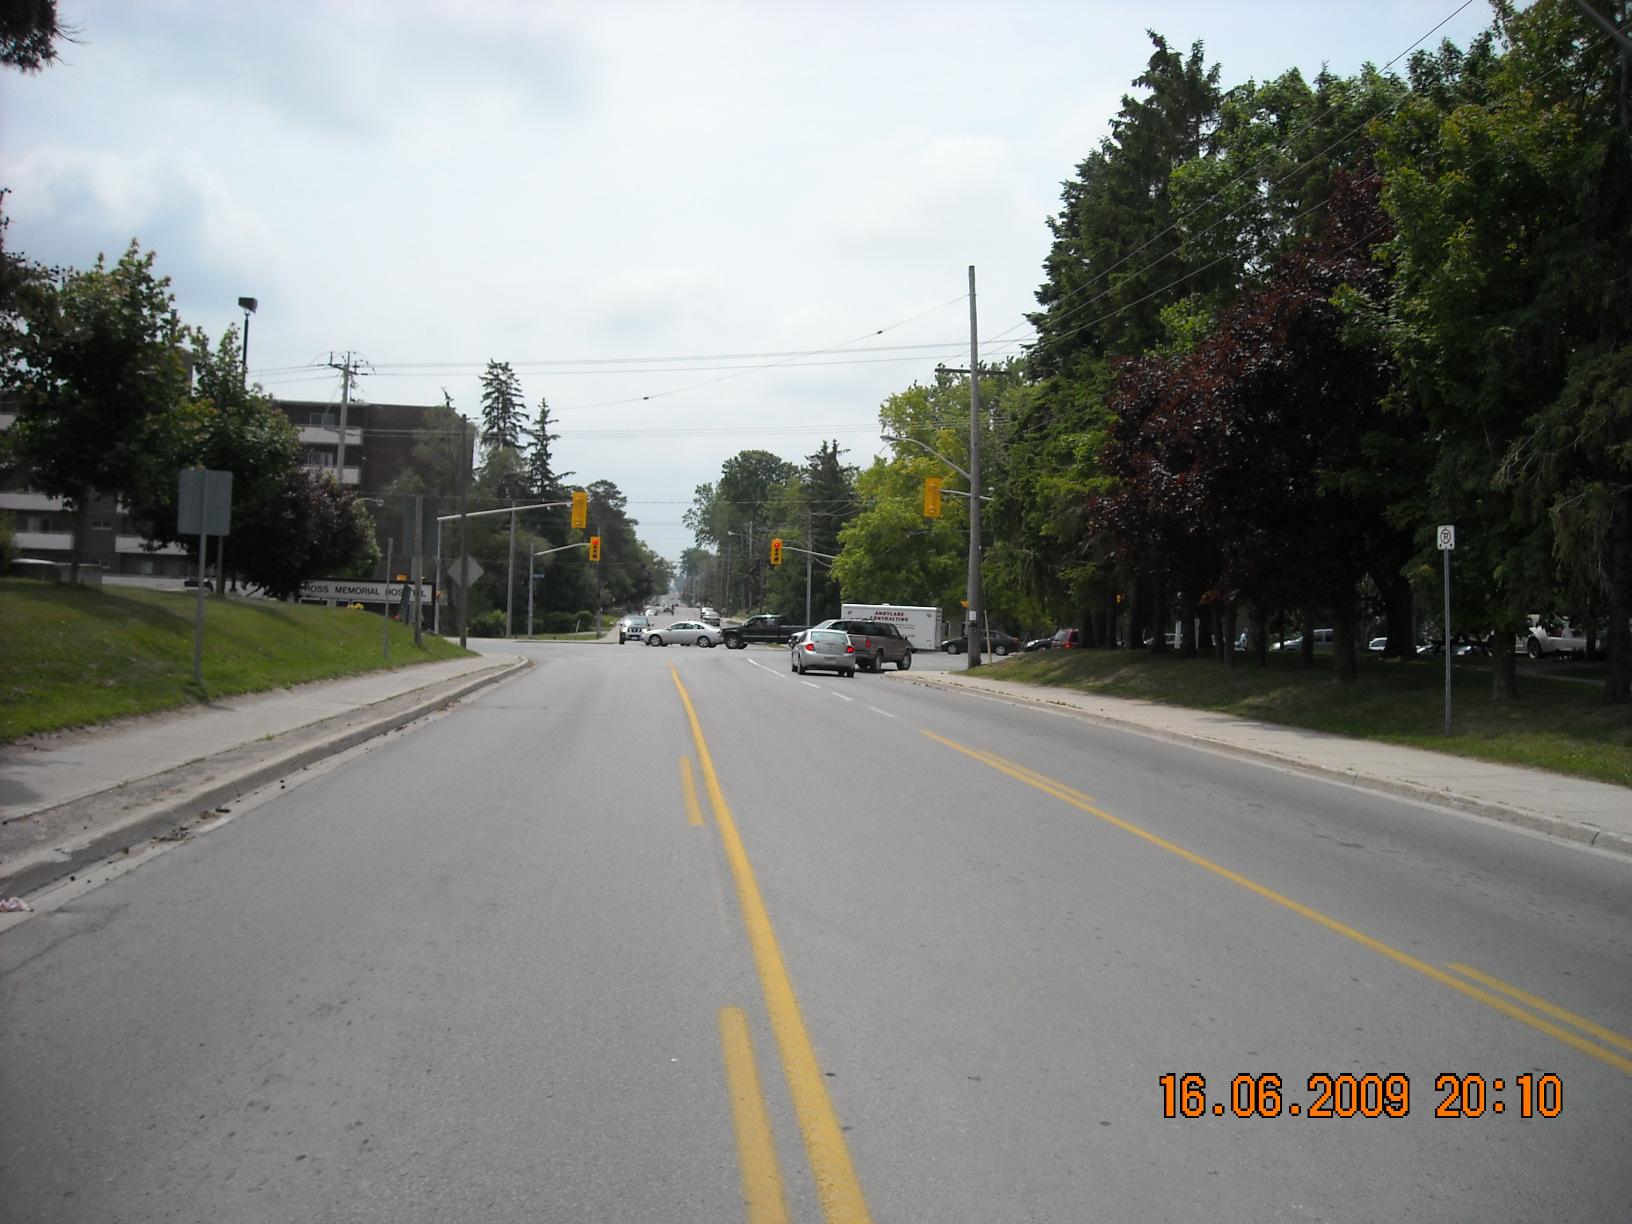
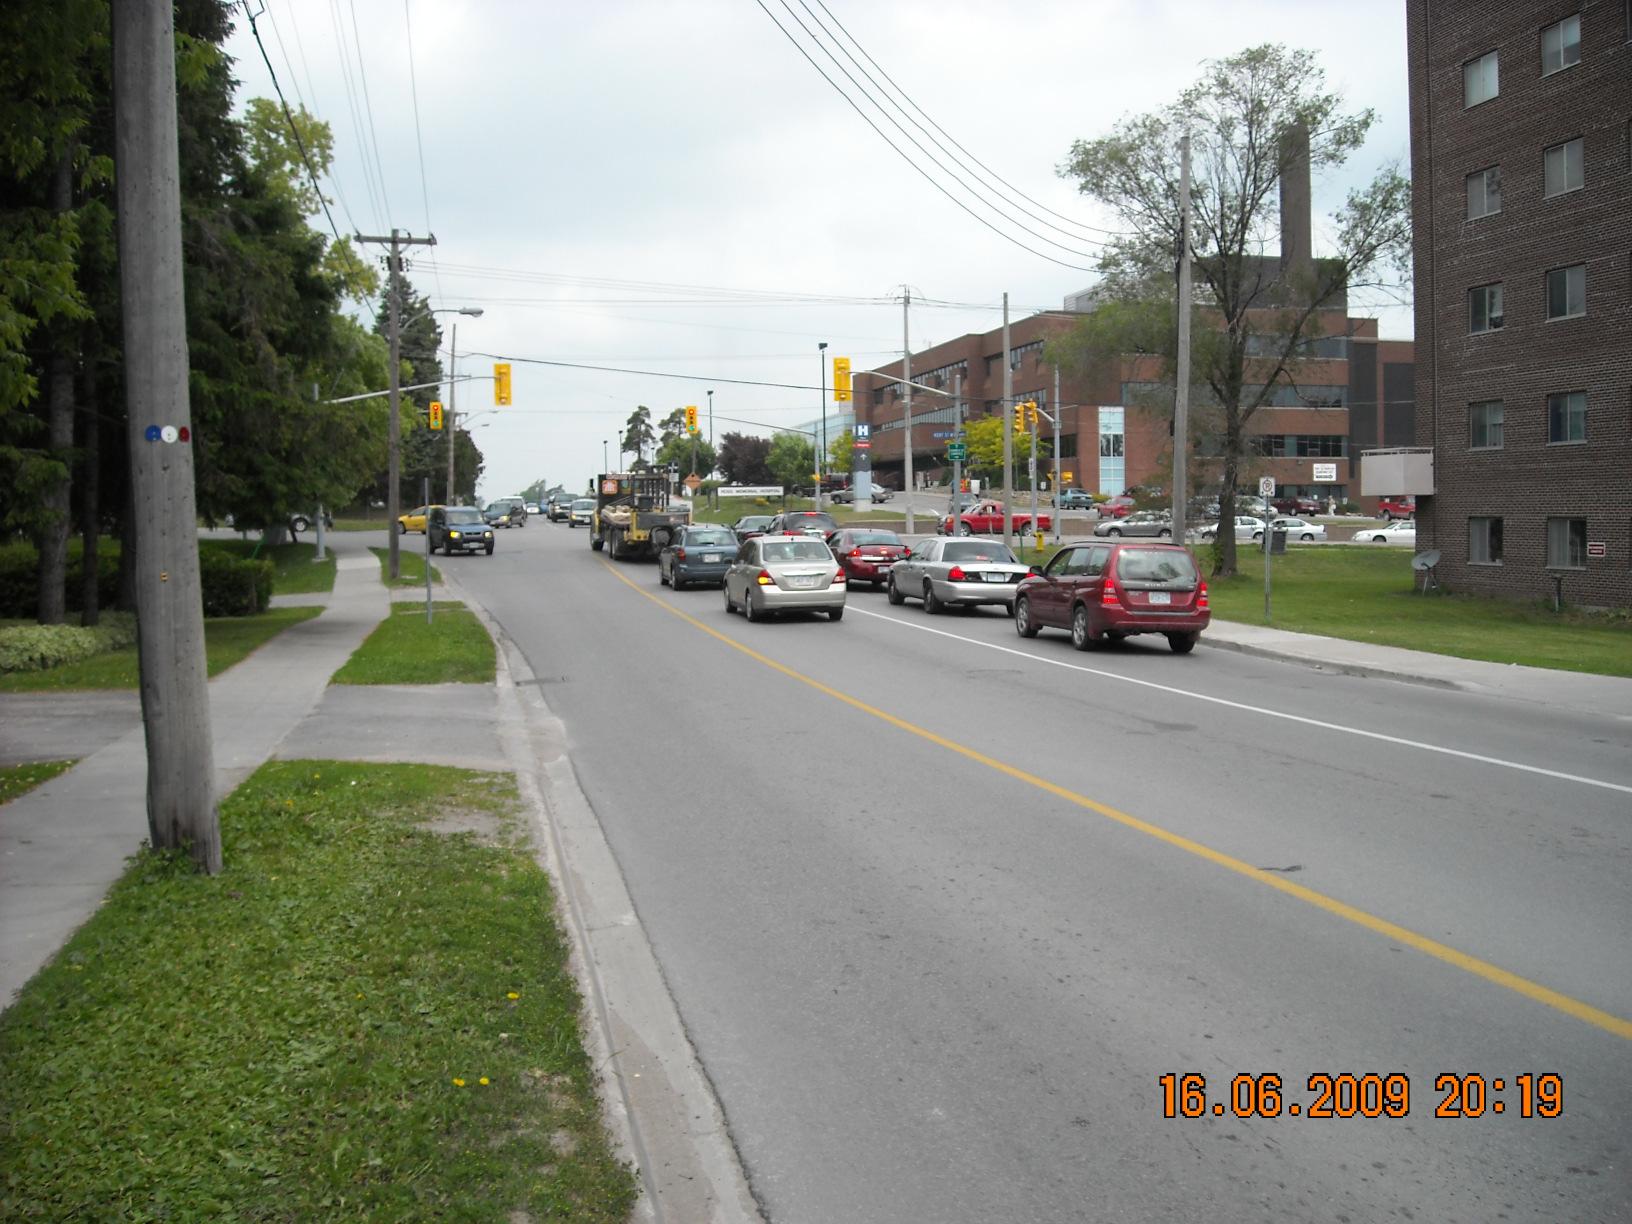 Angeline Street
Angeline st and Kent st – Facing South
Angeline st and Kent st – Facing North
Angeline Street
Angeline st and Kent st – Facing South
Angeline st and Kent st – Facing North
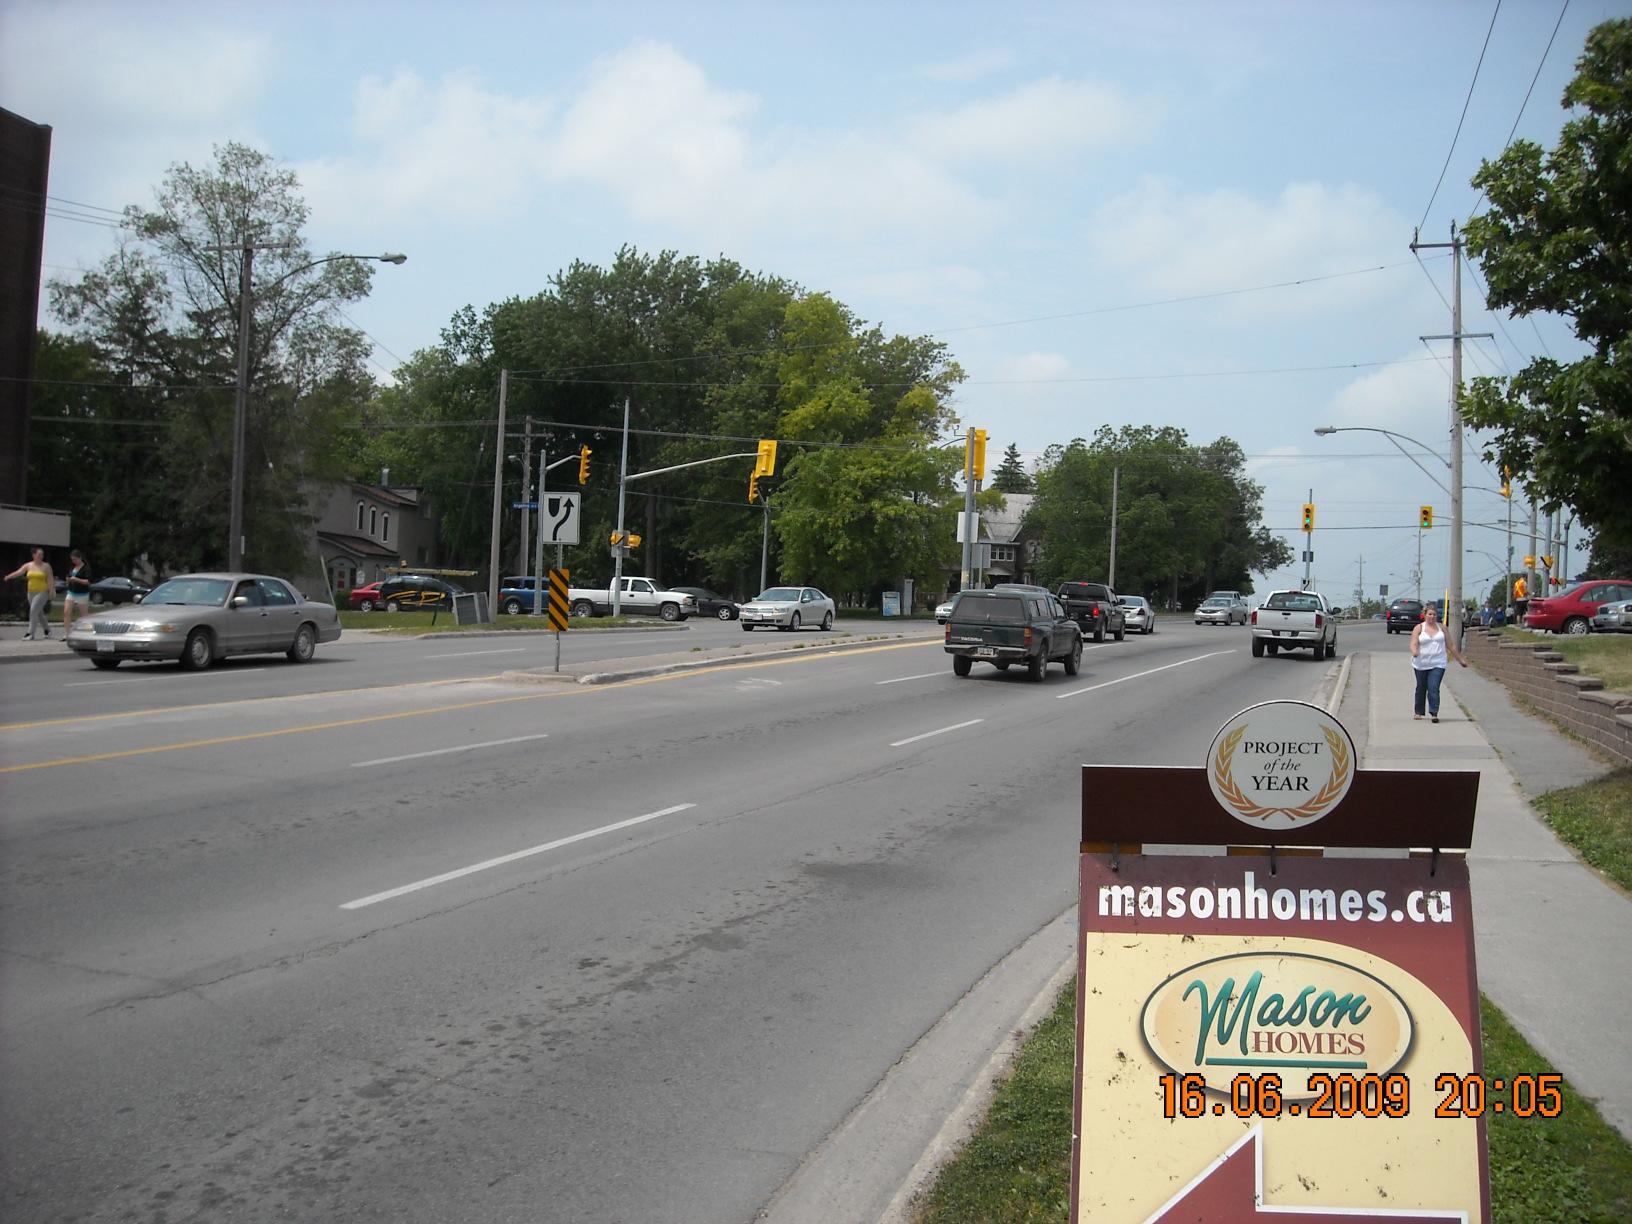
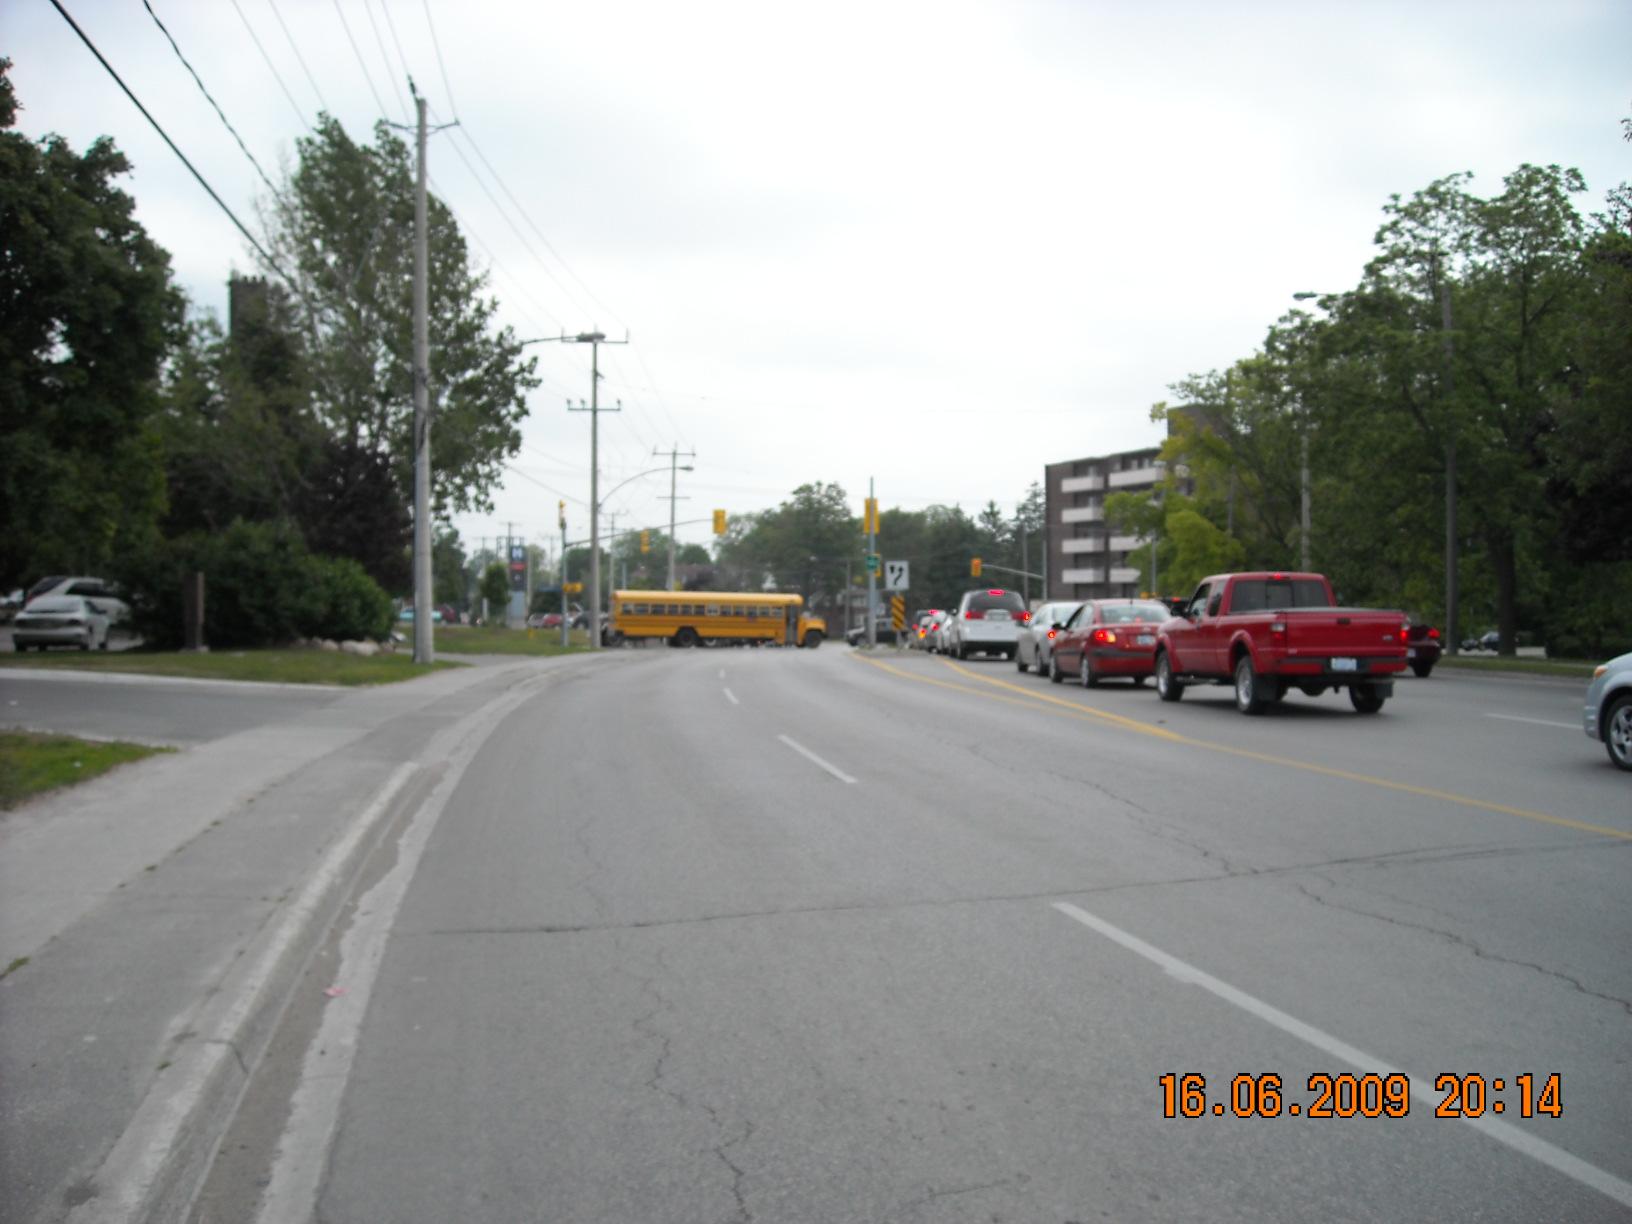 Angeline st and Kent st – Facing West
Angeline st and Kent st – Facing East
Angeline st and Kent st – Facing West
Angeline st and Kent st – Facing East
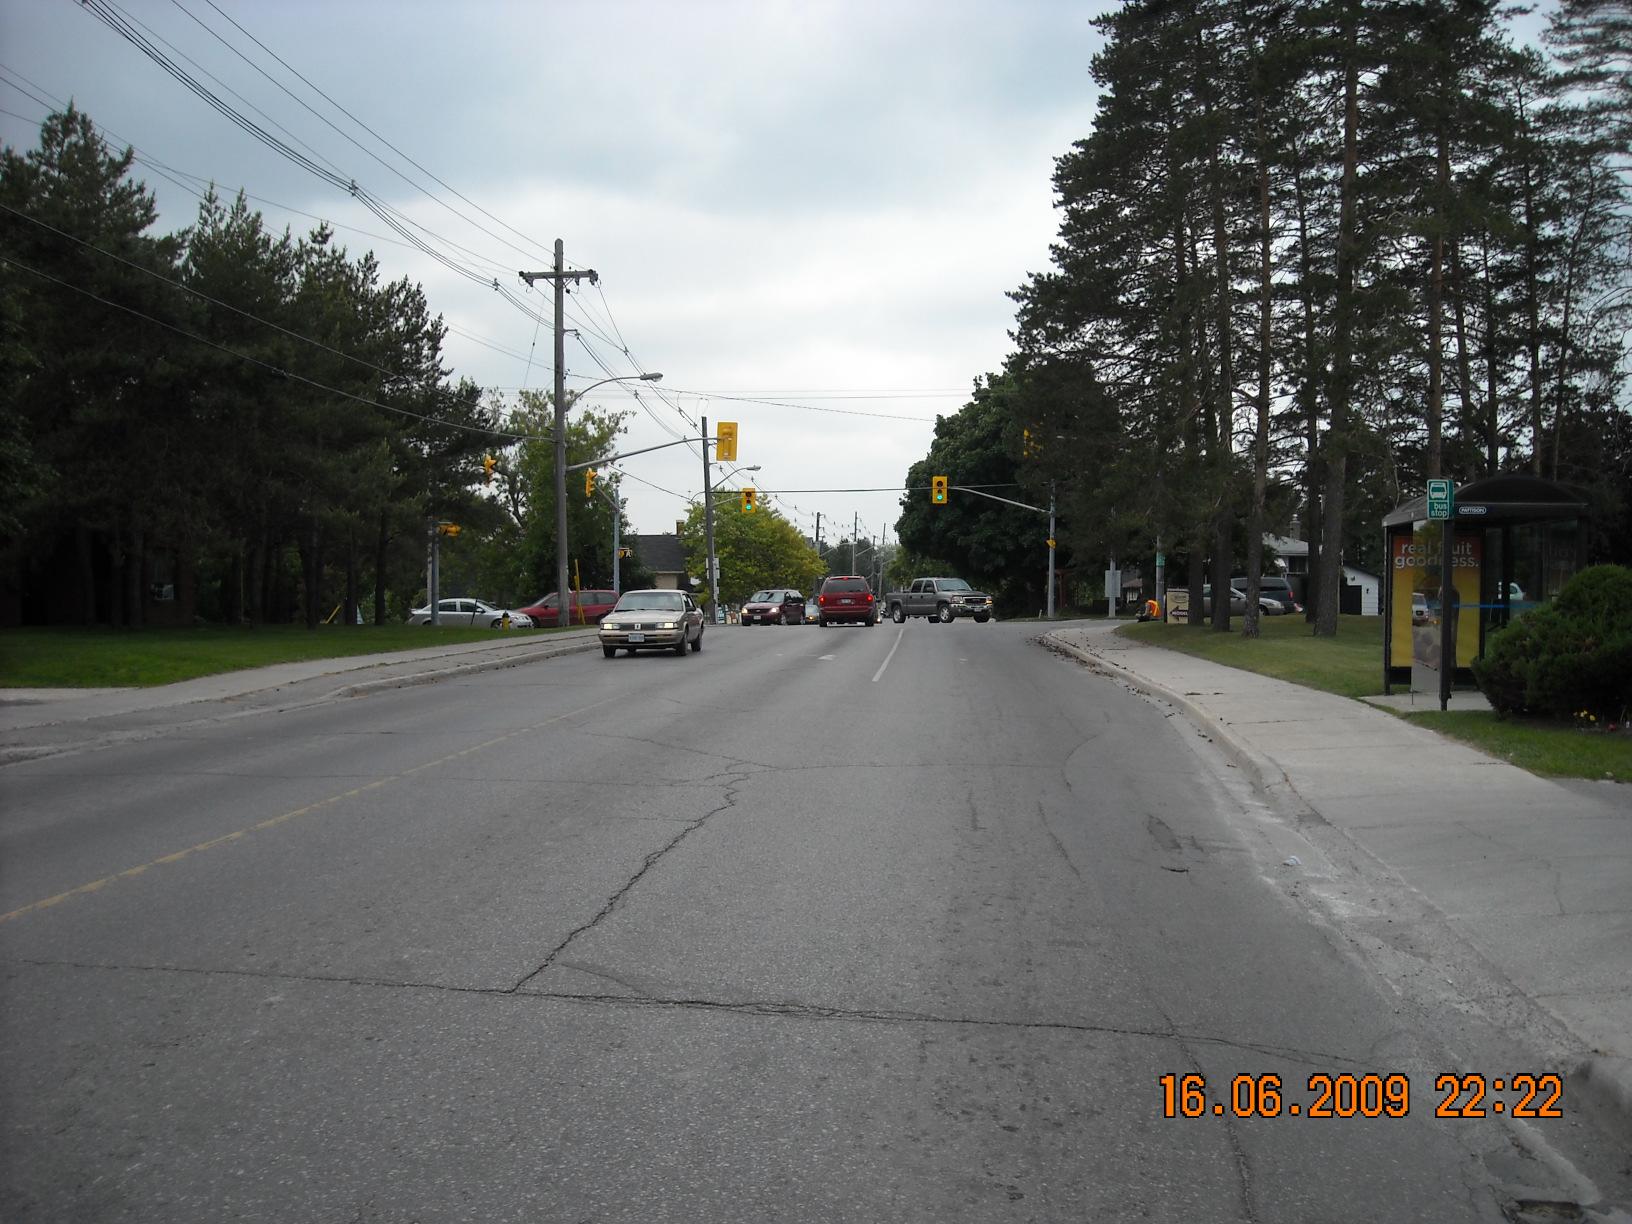
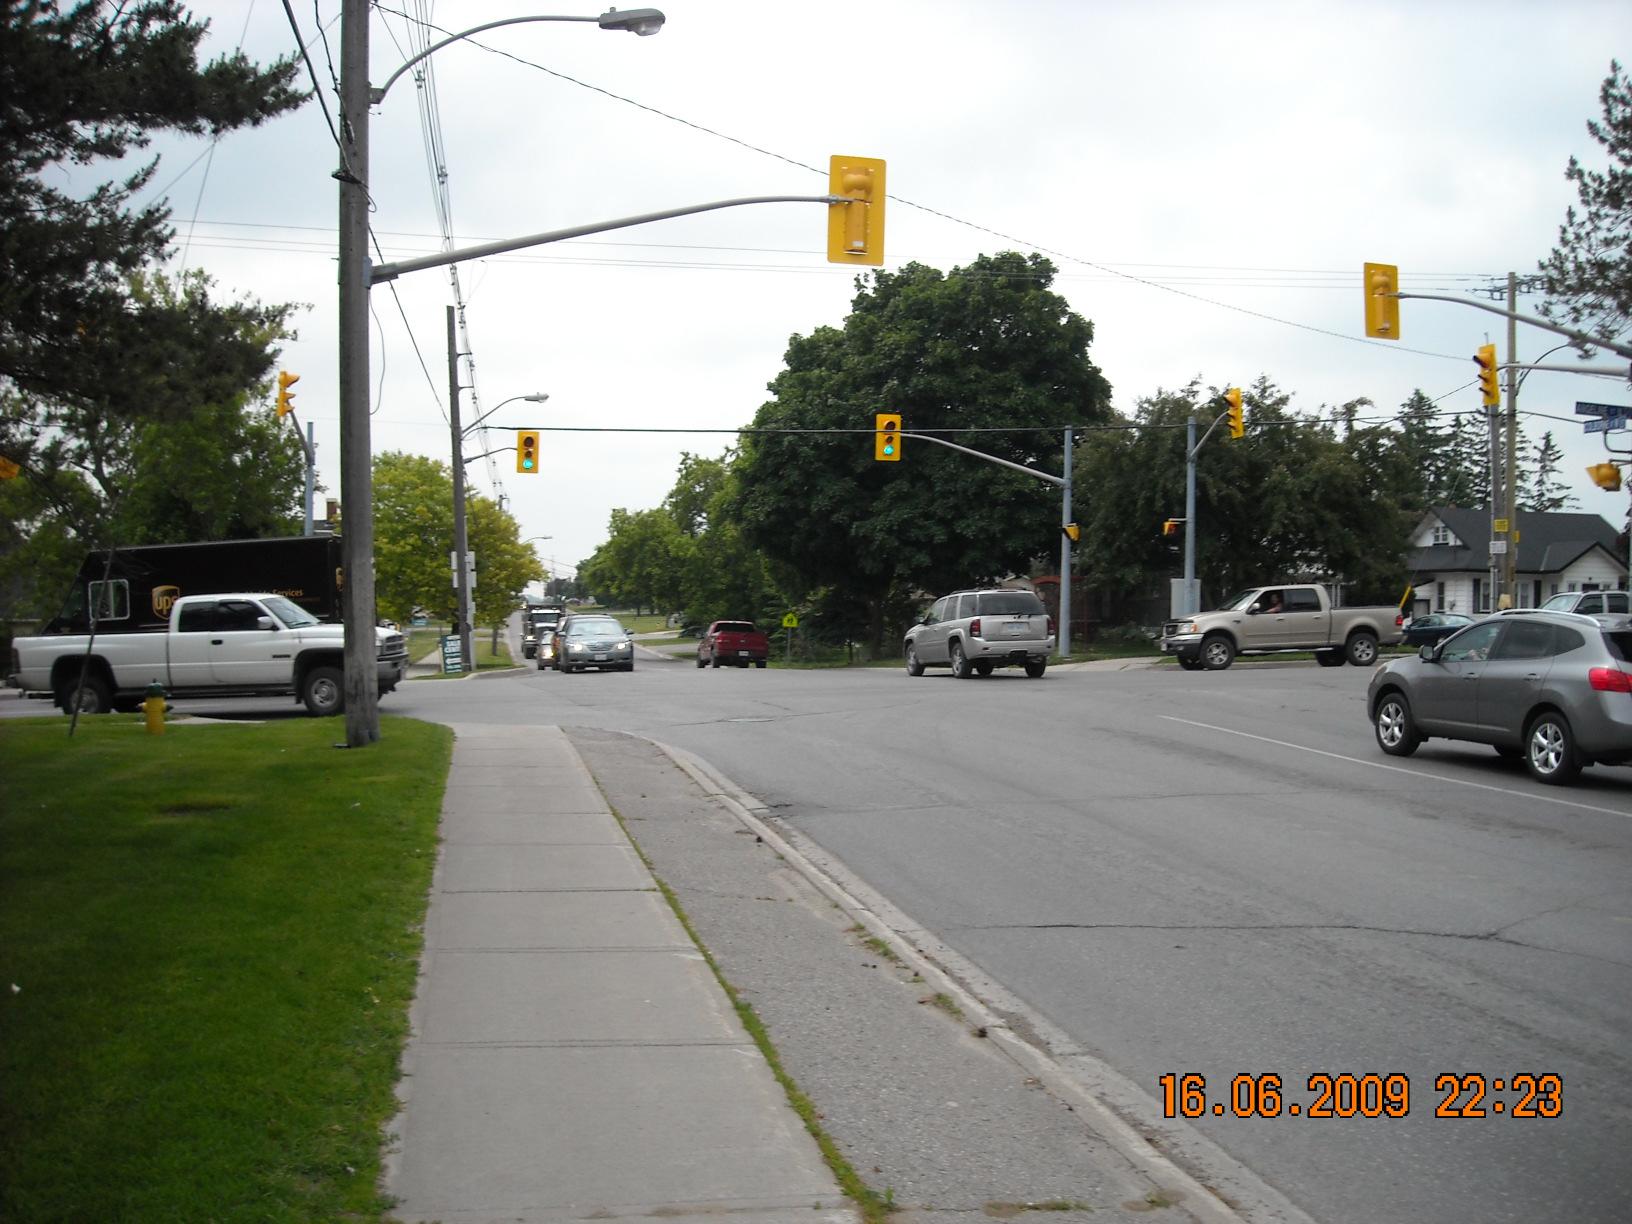 Angeline st and Colborne st – Facing West
Angeline st and Colborne st – Facing South
Angeline st and Colborne st – Facing West
Angeline st and Colborne st – Facing South
 Angeline st and Colborne st – Facing East
Angeline st and Colborne st – Facing North
Angeline st and Colborne st – Facing East
Angeline st and Colborne st – Facing North
 Angeline st and Orchard Park Rd – Facing North
Angeline st and Orchard Park Rd- Facing South
Angeline st and Orchard Park Rd – Facing North
Angeline st and Orchard Park Rd- Facing South
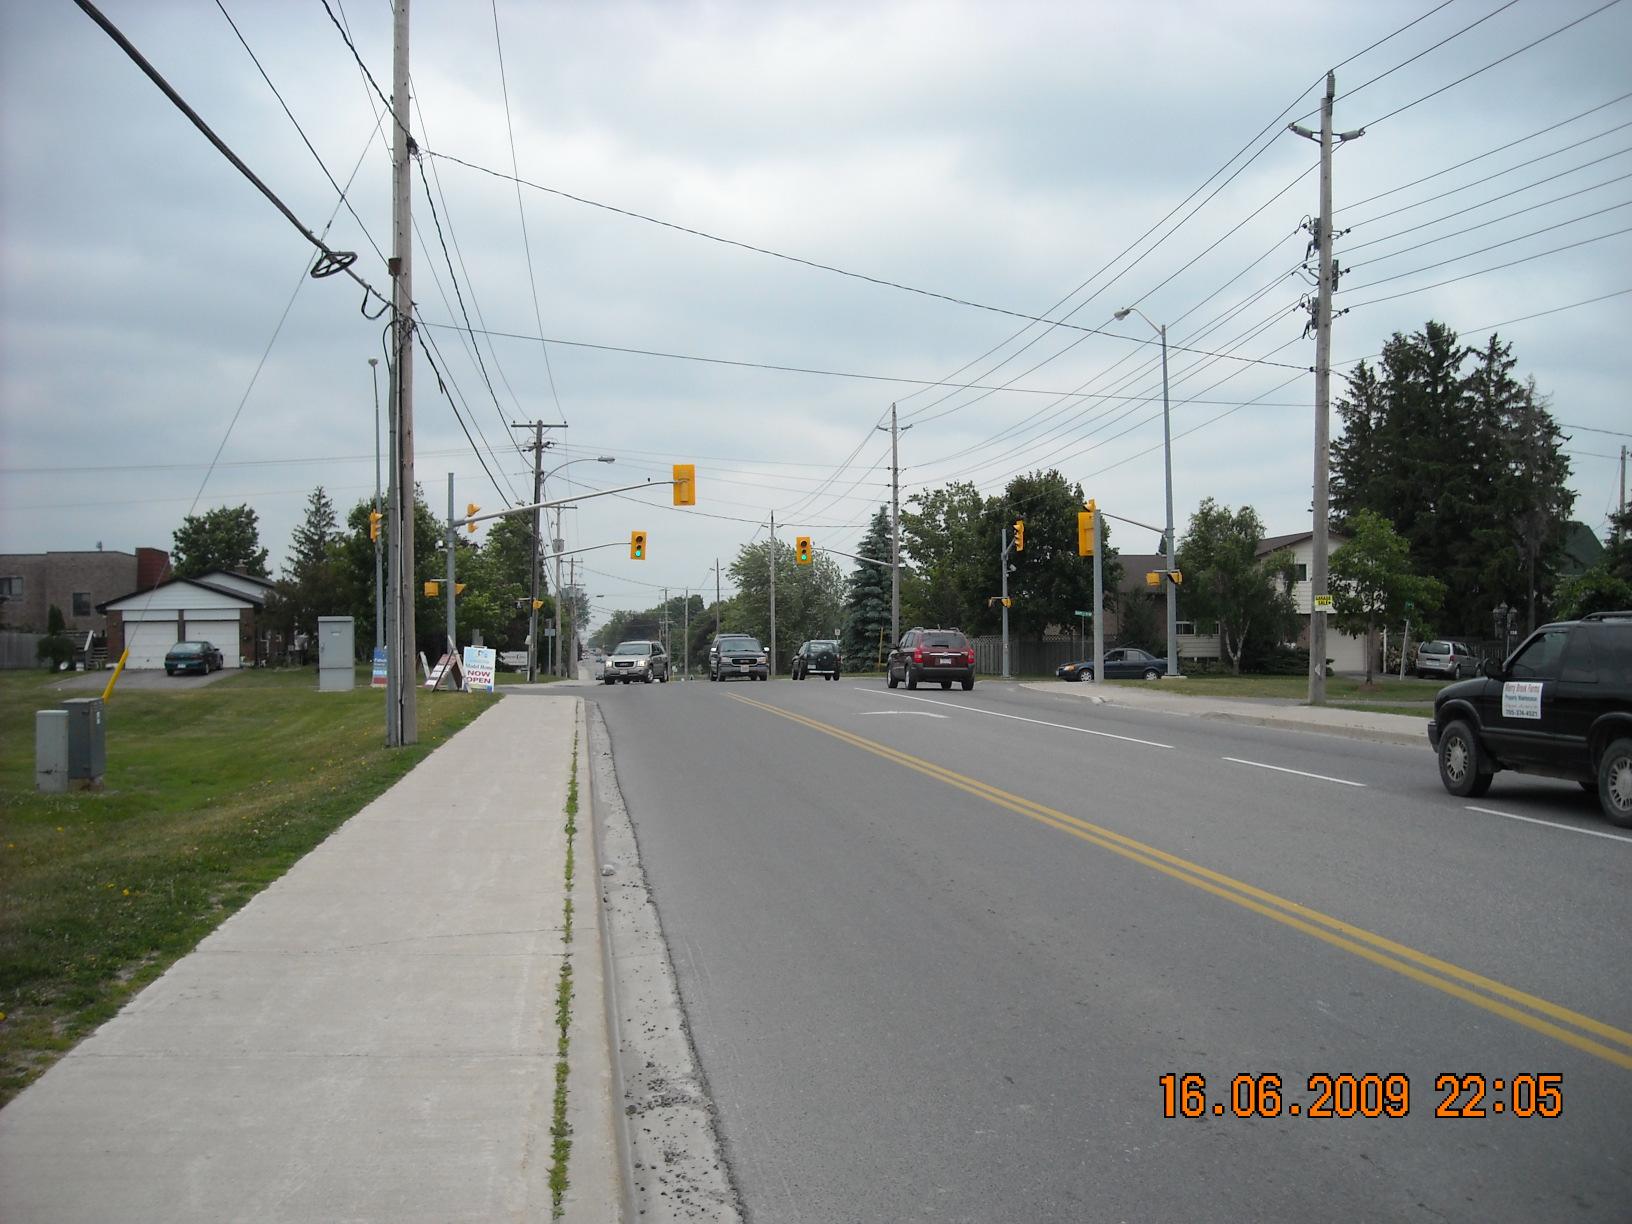
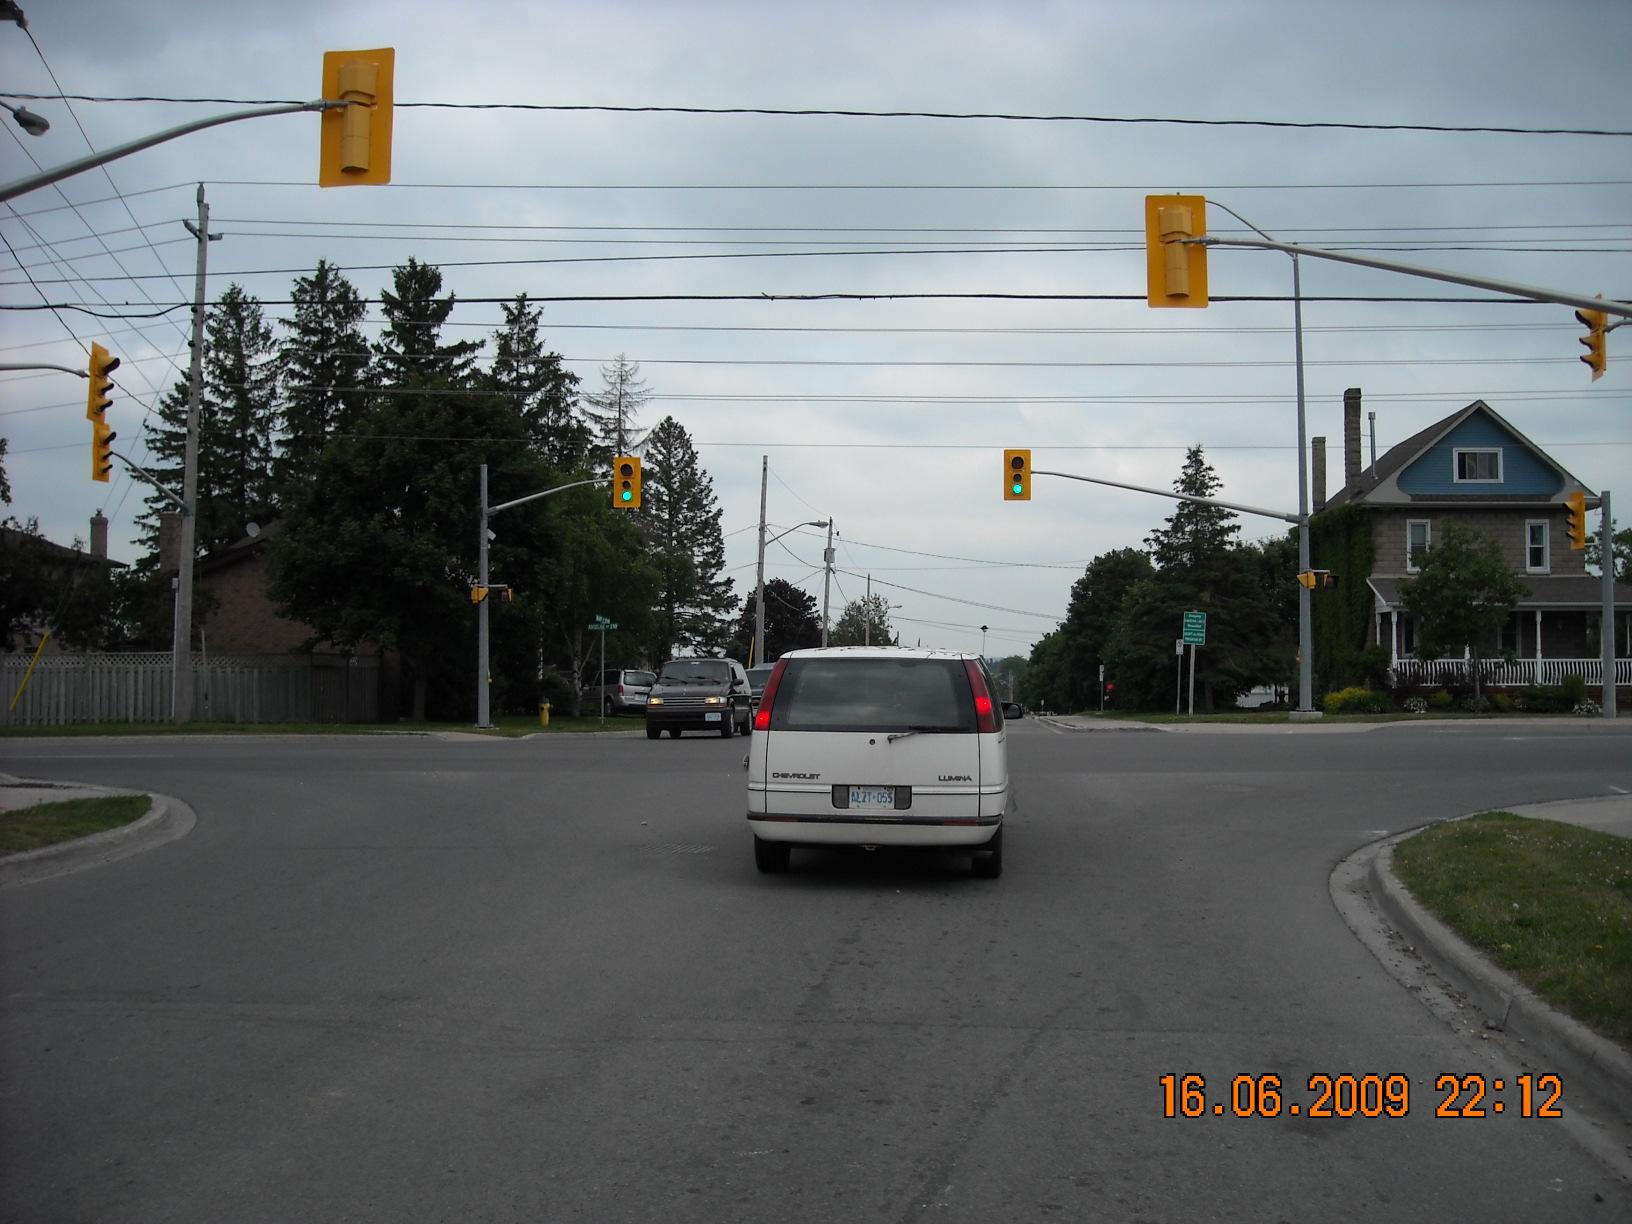 Angeline st and Mary st – Facing East
Angeline st and Mary st – Facing South
Angeline st and Mary st – Facing East
Angeline st and Mary st – Facing South
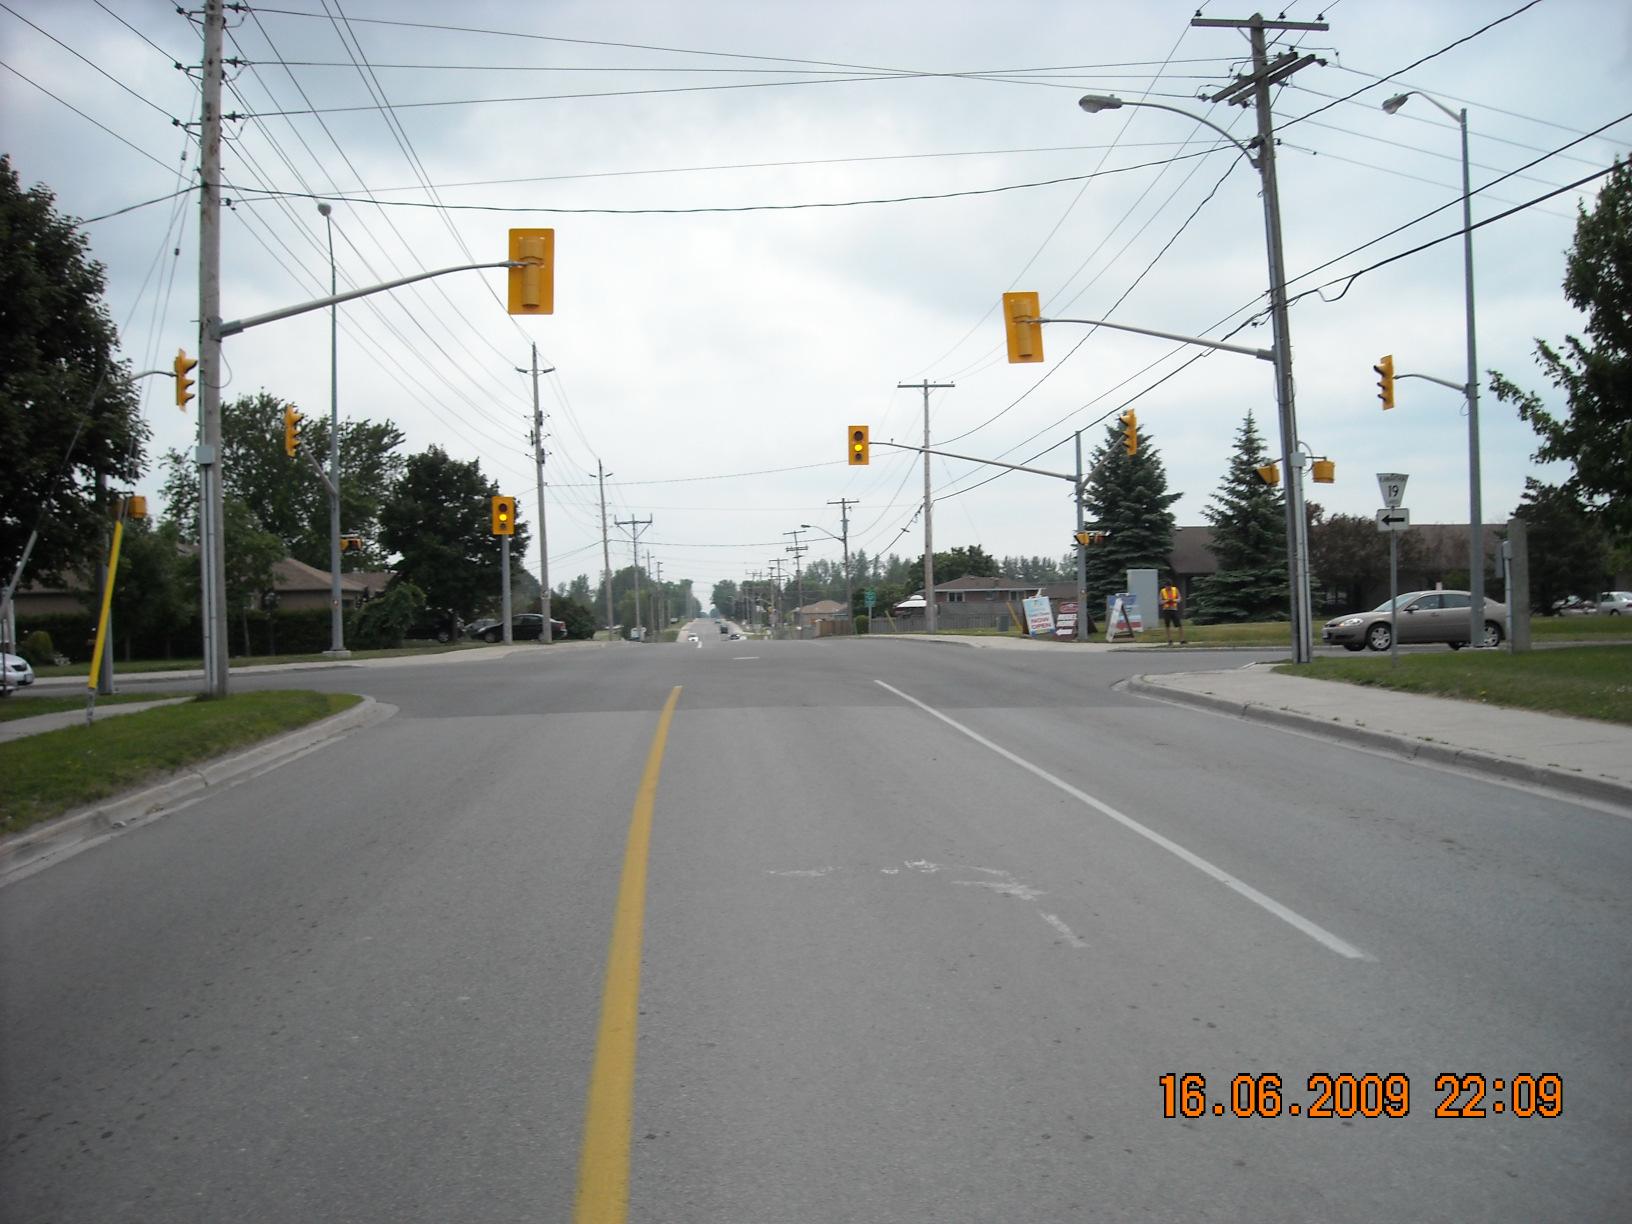
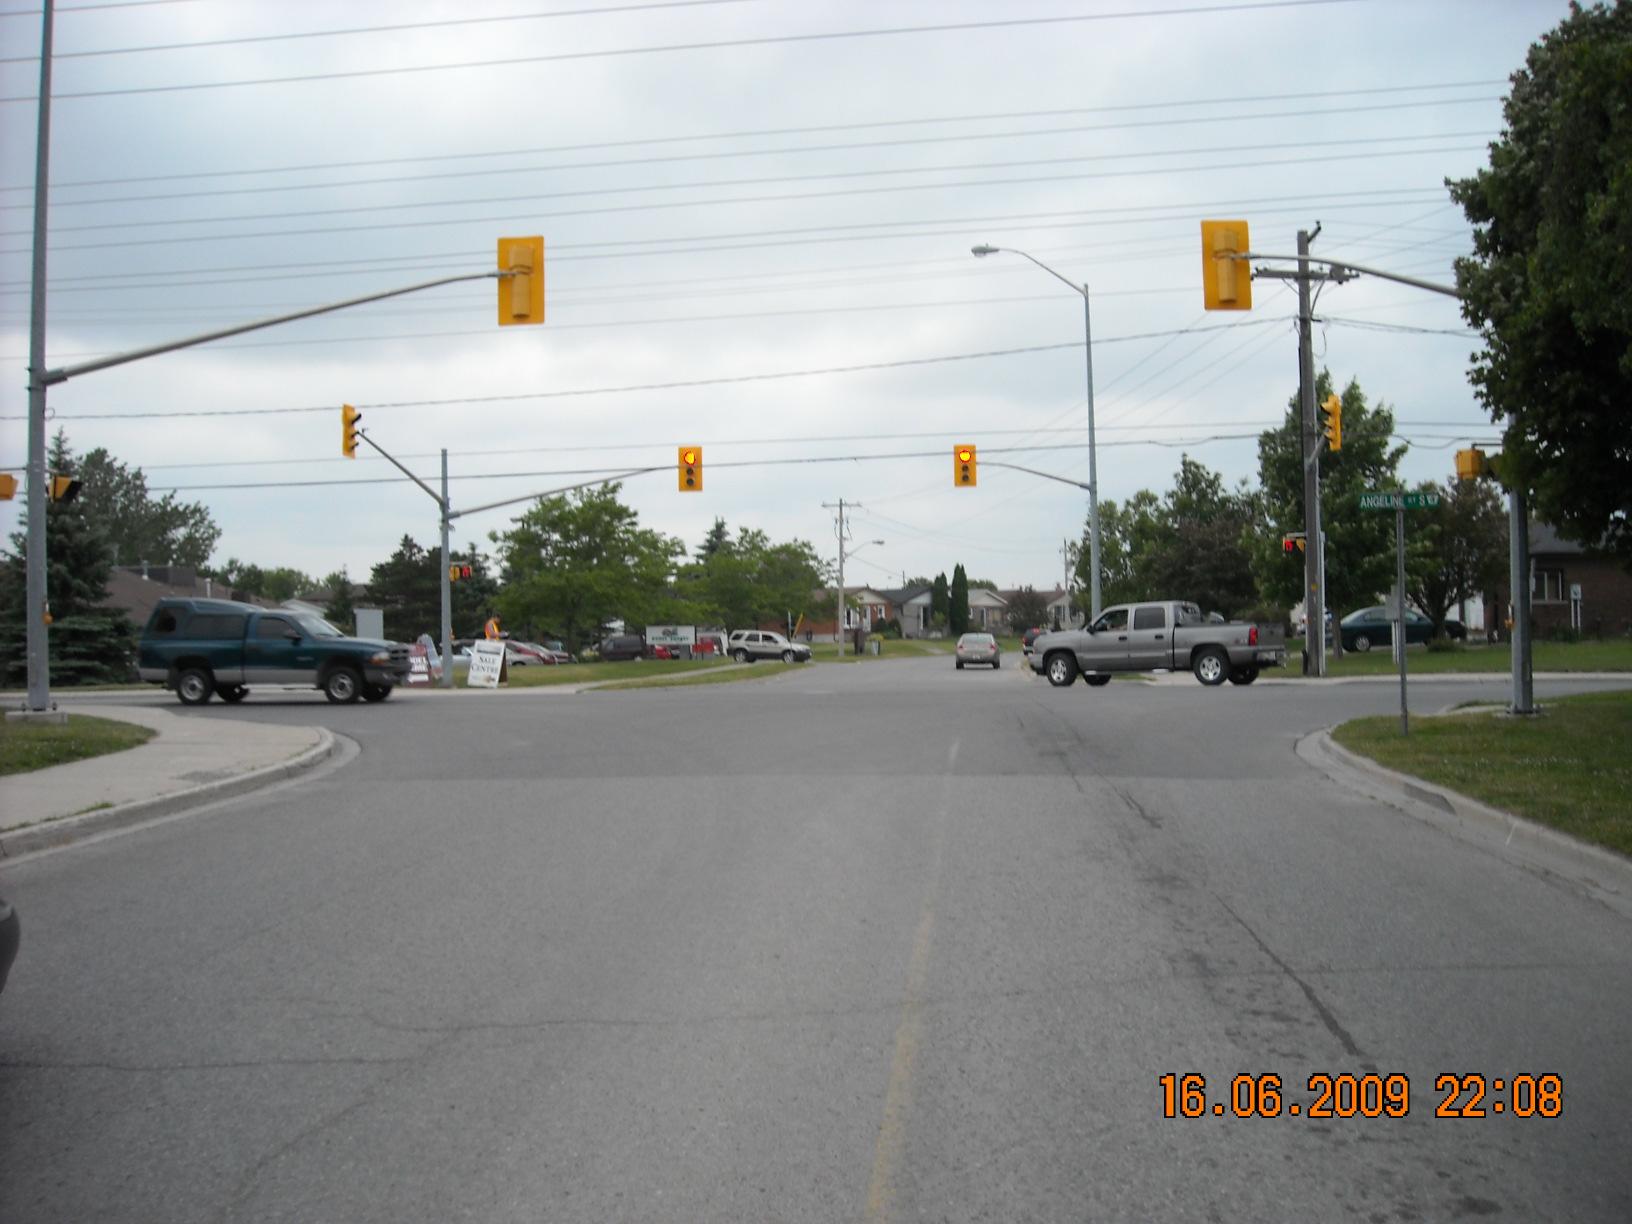 Angeline st and Mary st – Facing West
Angeline st and Mary st – Facing North
Angeline st and Mary st – Facing West
Angeline st and Mary st – Facing North
 Angeline st and Hwy 35+7 – Facing North
Angeline st and Hwy 35+7 – Facing East
Angeline st and Hwy 35+7 – Facing North
Angeline st and Hwy 35+7 – Facing East
 Angeline st and Hwy 35+7 – Facing South
Angeline st and Hwy 35+7 – Facing East
Angeline st and Hwy 35+7 – Facing South
Angeline st and Hwy 35+7 – Facing East
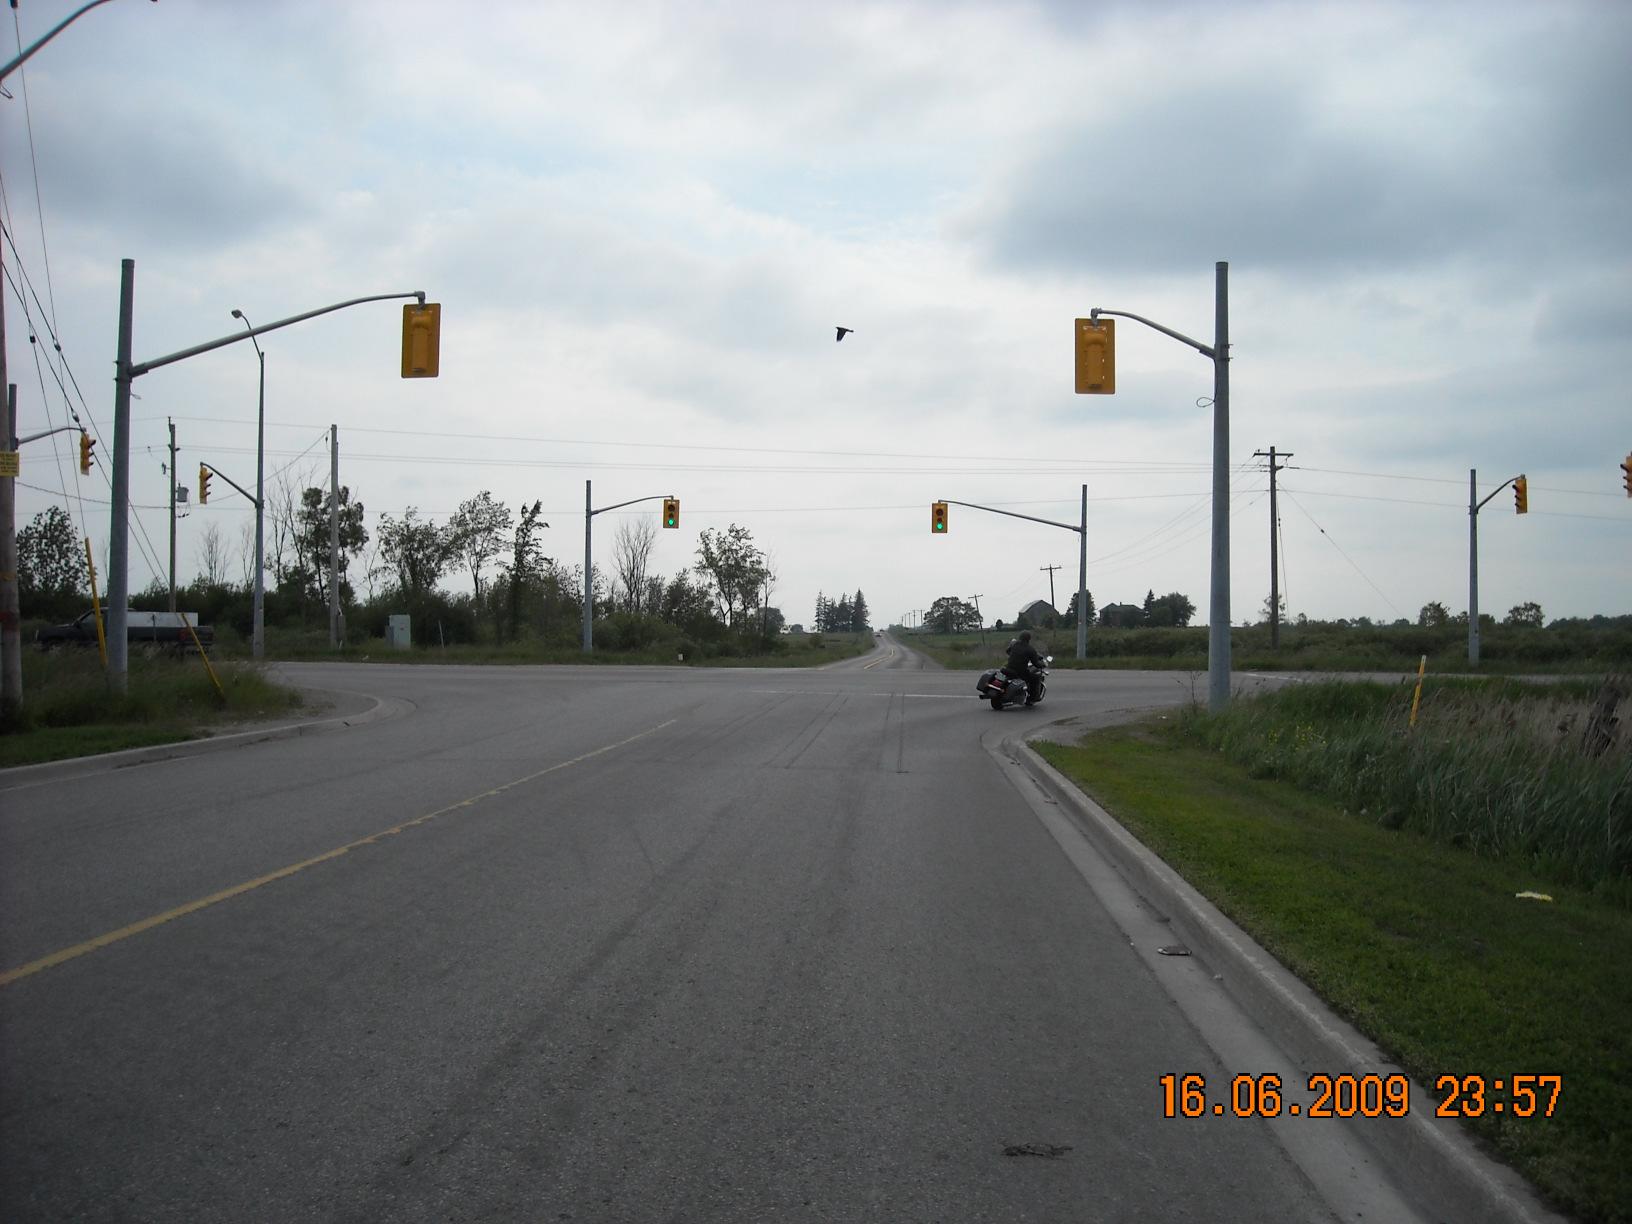
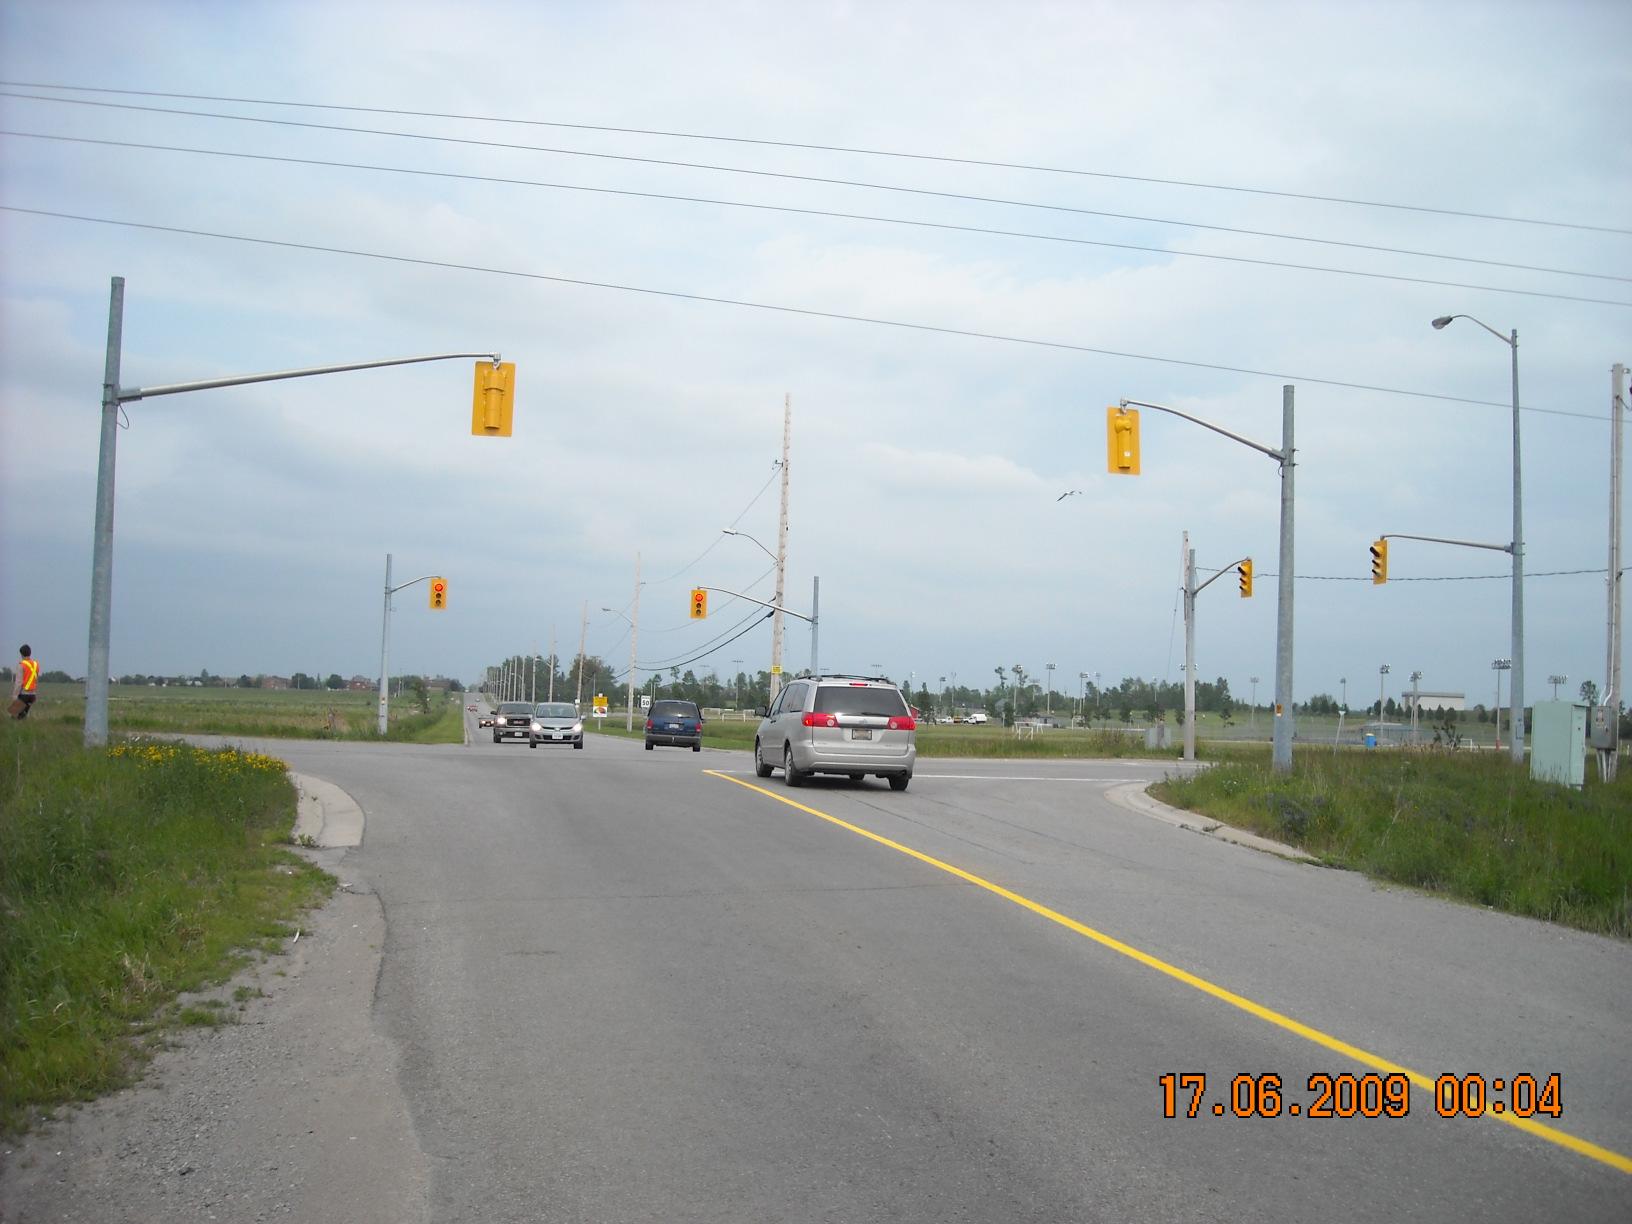 Colborne st and Hwy 35: Facing West
Colborne st and Hwy 35: Facing East
Colborne st and Hwy 35: Facing West
Colborne st and Hwy 35: Facing East
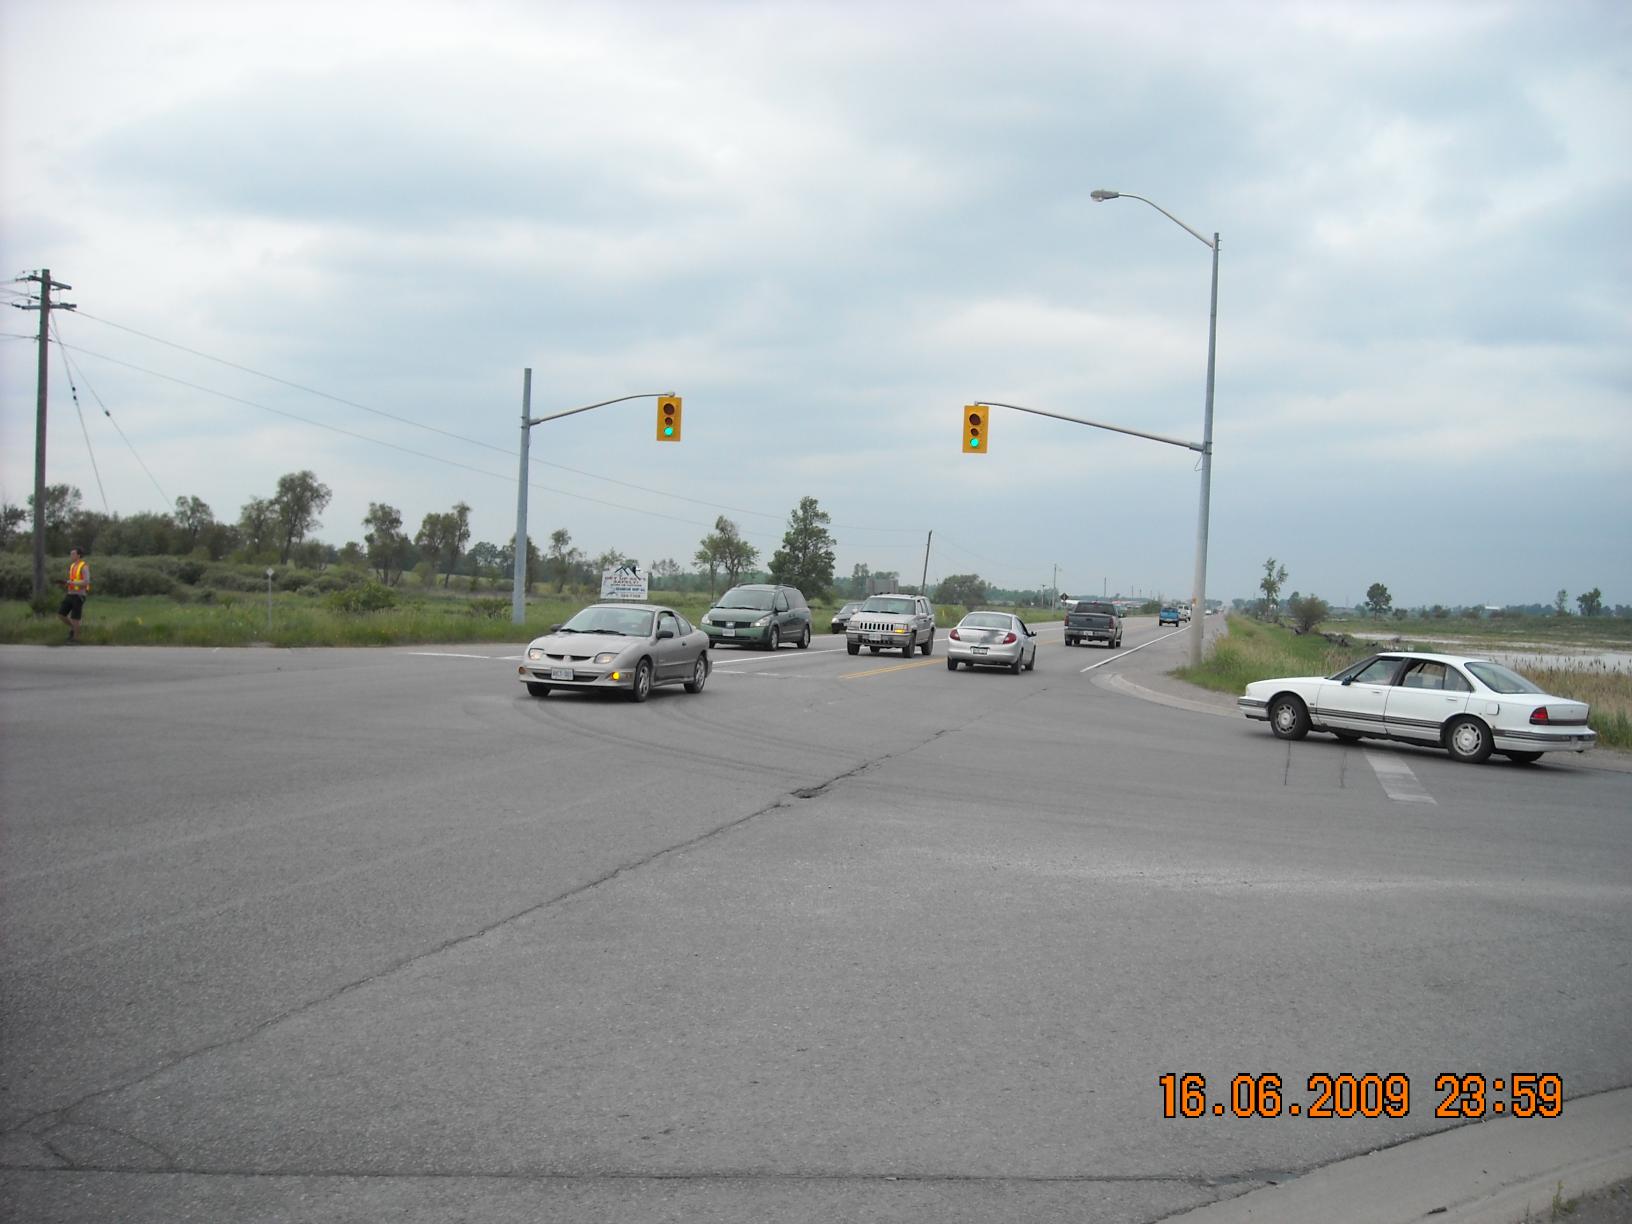
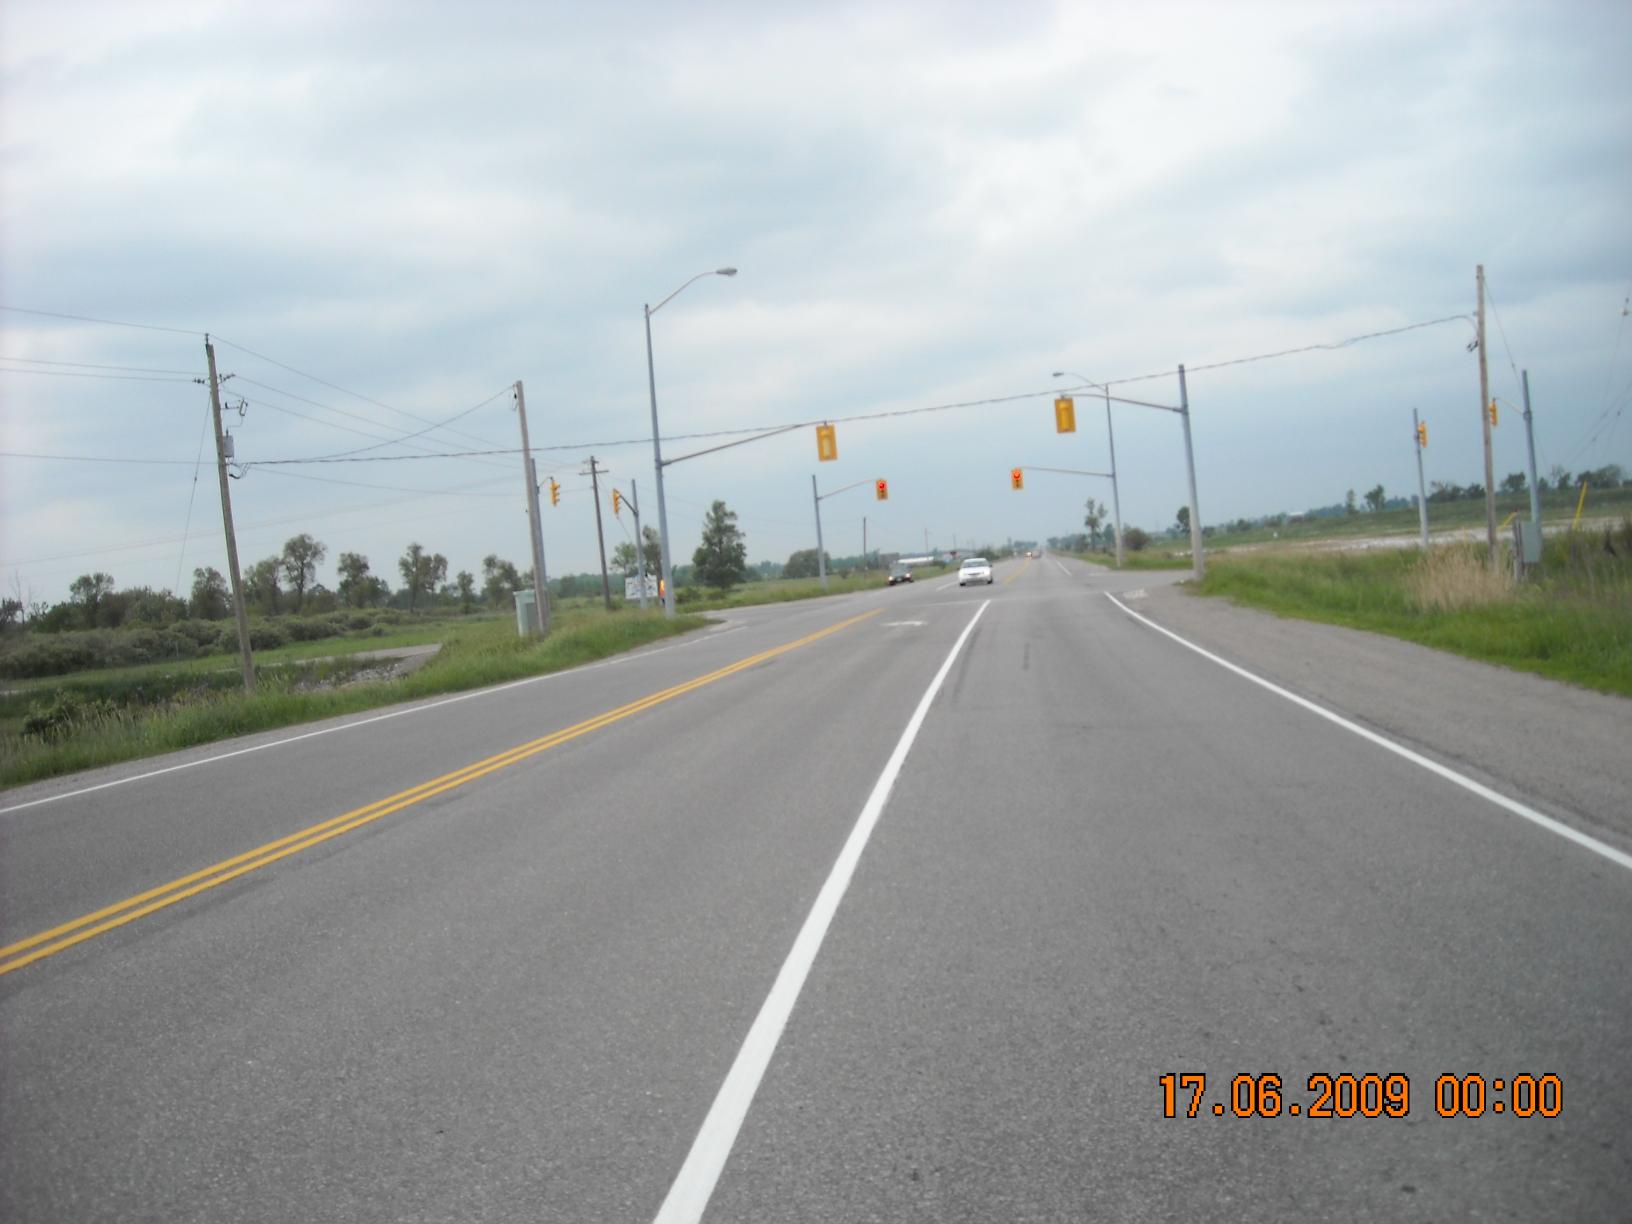 Colborne st and Hwy 35: Facing North
Colborne st and Hwy 35: Facing South
Colborne st and Hwy 35: Facing North
Colborne st and Hwy 35: Facing South
 Colborne Street at Albert Street: Facing East
Colborne Street at Albert Street: Facing West
Colborne Street at Albert Street: Facing East
Colborne Street at Albert Street: Facing West
 Colborne Street at Albert Street: Facing North
Colborne Street at Albert Street: Facing South
Colborne Street at Albert Street: Facing North
Colborne Street at Albert Street: Facing South
 Kent Street and Lindsay Street: Facing West
Kent Street and Lindsay Street: Facing North
Kent Street and Lindsay Street: Facing West
Kent Street and Lindsay Street: Facing North
 Kent Street and Lindsay Street: Facing West from Ridout Street
Kent Street and Lindsay Street: Facing South
Kent Street and Lindsay Street: Facing West from Ridout Street
Kent Street and Lindsay Street: Facing South
 Lindsay Street and Mary Street: Facing North
Lindsay Street and Mary Street: Facing East
Lindsay Street and Mary Street: Facing North
Lindsay Street and Mary Street: Facing East
 Lindsay Street and Mary Street: Facing South
Lindsay Street and Mary Street: Facing West
Lindsay Street and Mary Street: Facing South
Lindsay Street and Mary Street: Facing West
 Lindsay Street at Logie Street: Facing North
Lindsay Street at Logie Street: Facing South
Lindsay Street at Logie Street: Facing North
Lindsay Street at Logie Street: Facing South
 Lindsay Street at Logie Street: Facing East
Lindsay Street at Highway 7/35: Facing North
Lindsay Street at Logie Street: Facing East
Lindsay Street at Highway 7/35: Facing North
 Lindsay Street at Highway 7/35: Facing West
Lindsay Street at Highway 7/35: Facing East
Lindsay Street at Highway 7/35: Facing West
Lindsay Street at Highway 7/35: Facing East
 Lindsay Street at Highway 7/35: Facing South
Appendix C
Traffic Count Locations
Transportation Master Plan Municipal Master Plan Project City of Kawartha Lakes February 2012 Appendix C
! ( ! ! ! ! ( ! ! ( ! ! ! ! ( ! [ Colborne Street Kent Street Queen Street Wellington Street Orchard Park Road Parkside Drive Pigeon Lake Road Highway 7 Highway 7 & 35 Mary Street Thunder Br dge Road H i g h w a y 3 5 A n g e l i n e S t r e e t L i n d s a y S t r e e t A d e l a i d e S t r e e t A l b e r t S t r e e t S t D a v i d S t r e e t C K L R o a d 3 6 W i l s o n R o a d S a n d e r l i n g C r e s c e n t E l m T r e e R o a d Logie Street Highway7 Linds ay Intersection and ATR Count Locations 9 8 8 10 Ana yzed Intersect ons Legend ATR Coun Location W i l l i a m S t r e e t
! ( ! ! ( ! ( ! ( ! ( ! ! ! ( ! [ Bobcaygeon Intersection and ATR Count Locations E a s t S t r e e t CanalStreet Boyd Street MillStreet King Street B o l t o n S t r e e t Cedartree Lane Duke Street MainStreet CKL Road 8 W e s t S t r e e t Intersections Analyzed Legend ATR Count Locations
! ( ! ! ! ! [
Falls Inters ection and ART Count Loc ations CKLRoad8 C K L R o a d 1 2 1 / 8
Fenelon
Franc is Stree t
Bond Stre et
CKLRoad8 Legend Intersect ons Analyzed ATR Count Locat ons
Prince ss Stree t


! ! ! ! ( [ OmemeeIntersectionandATRCountLocations Highway7 SibleyAvenue SkiHillRoad DeaneStreet St u rg e o n R o a d Qu ee n St r e e t Terry Road
Legend ATRCountLocations
IntersectionsAnalyzed
Appendix D
Vehicle Composition Analysis
Transportation Master Plan Municipal Master Plan Project City of Kawartha Lakes February 2012 Appendix D
Appendix E
Collision Analysis
Transportation Master Plan Municipal Master Plan Project City of Kawartha Lakes February 2012 Appendix E
1611 27 12 38 49 510 Clear (77%) Other (9%) Rain (14%) "Other" includes snow, freezing rain, strong winds, fog, etc. Weekend (22%) Weekday (78%) 0 10 20 30 40 50 60 70 WinterSpringSummerFall Season Number of Collisions 0 5 10 15 20 25 30 JanFebMarAprMayJunJulAugSepOctNovDec Month of Year Number of Collisions 0 5 10 15 20 25 30 35 40 45 SunMonTueWedThuFriSat Day of Week Number of Collisions 0 5 10 15 20 25 12-1am 2-3am 4-5am 6-7am 8-9am10-11am12-13pm14-15pm16-17pm18-19pm20-21pm22-23pm Time of Day Number of Collisions 0.0% 10.0% 20.0% 30.0% 40.0% 50.0% 60.0% 70.0% 80.0% 90.0% 100.0% PDOnlyNFInjuryFatal Injury Collision Classification Percentage of Collisions Study Intersections City of Kawartha Lakes Province 0 10 20 30 40 50 60 70 80 90 100 AM PeakOff PeakPM PeakOvernight Time Period Number of Collisions
Approaching Pedestrian Cyclist Other SMV Angle Turning Movement Sideswipe Rear End "Other" includes animal strikes and unknown collisions. Daylight (72%) Dark (23%) Dawn/Dusk (5%) Other* (7%) Wet (30%) Dry (63%) "Other" includes snow, ice, slush, and loose gravel City of Kawartha Lakes 0 5 10 15 20 25 30 35 40 45 50 55 60 65 70 75 80 85 90 95 100 200720082009 Year Number of Collisions LindsayCollisions 0 5 10 15 20 25 30 35 40 45 50 55 60 65 70 75 80 85 90 95 100 200720082009 Year Number of Collisions Fenelon Falls Collisions 0 5 10 15 20 200720082009 Year Number of Collisions Bobcaygeon Collisions 0 5 10 15 20 200720082009 Year Number of Collisions Collision Locations 78% 12% 7% 3% Lindsay Fenelon Falls Bobcaygeon Omemee
Appendix F
Existing Conditions Capacity and Level of Service Analysis
Transportation Master Plan Municipal Master Plan Project City of Kawartha Lakes February 2012 Appendix F
Remarks V/CDelayLOSV/CDelayLOS Queen Street and CKL Road 36 0.296.9A0.558.8A Wellington Street and Lindsay Street S 0.4313.4B0.4712.7B Kent Street W and Lindsay Street N 0.3813.1B0.4918.6B Kent Street W and Angeline Street S 0.589.2A0.9237.7DWBT and NBL and critical Wellington Street and William Street N 0.3810.0B0.6315.7B Colborne Street W and Adelaide Street N 0.4213.0B0.4313.5B Colborne Street W and Angeline Street S 0.5011.8B0.6213.6B Kent Street W and Highway 35 0.508.2A0.4113.4B Colborne Street W and Highway 35 0.547.2A0.439.2A Thunder Bridge Road and Highway 35 0.496.5A0.516.9A Kent Street W /Dewdrop Inn Road and Highway 7 0.387.8A0.447.9A Mary Street W and Angeline Street S 0.558.6A0.559.0A Highway 7 / Highway 35 and Lindsay Street 0.608.6A0.7111.0B Highway 7 / Highway 35 and Angeline Street 0.447.3A0.6911.4B Highway 7 and CKL Road 36 0.548.4A0.6810.0A Remarks DelayLOS Critcal Movement DelayLOS Critcal Movement Colborne Street E and CKL Road 36 3.0B4.2A Colborne Street and St. David Street 5.5A6.5A Queen Street and St. David Street 1.9A2.5B Parkside Drive and CKL Road 36 0.3A1.2A Fair Avenue and Albert Street N 4.1A4.6A Colborne Street W and William Street N 7.7B8.6B Colborne Street W and Albert Street N 2.9A3.8A Orchard Park Road and William Street N 5.9A4.9A Thunder Bridge Road and Angeline Street N 1.3A0.8A Mary Street W and Lindsay Street S 8.0D10.4DMonitor EB Logie Street and Lindsay Street 0.7A0.4A Orchard Park Road and Angeline Street 3.7A3.5B Orchard Park Road and Sunderling Road 7.8A7.9A CKL Road 36 and Wilson Road 0.3A0.9A AMPM AMPM Signailzed Intersections Lindsay Existing Traffic Volume Analysis - Weekday Peak Hour Unsignaized Intersections
Main Street/Bolton Street and Canal Street 0.089.3A0.4117.8B East Street S and King Street 0.254.7A0.396.7A DelayLOS Critcal Movement DelayLOS Critcal Movement Main Street & CKL Road 649/East Street N 8.5A24.3C East Street S and Cedartree Lane/Duke Street 4.4A4.8A Main Street and Duke Street 8.6A8.4A West Street and North Street/CKL Road 8 0.9A0.3A Main Street and Joseph Street 2.7A3.8A East Street S and Boyd Street/Canal Street 1.2A2.5A Bolton Street and King Street 7.9A9.6A East Street S and Mill Street 1.5A1.6A AMPM AMPM Bobcaygeon Existing Traffic Volume Analysis - Weekday Peak Hour Signalized Intersections Unsignalized Intersections
V/CDelayLOSV/CDelayLOS
Remarks V/CDelayLOSV/CDelayLOS Francis Street W and CKL Road 121 0.396.9A0.559.1A CKL Road 8 and CKL Road 121 0.3910.8B0.5810.9B Remarks DelayLOS Critcal Movement DelayLOS Critcal Movement Princess Street W and CKL Road 121 0.8A0.5A CKL Road 121 and Northline Road 8.6A8.6A Bond Street W and CKL Road 121 1.1A2.3A AMPM Signalized Intersections AMPM Unsignalized Intersections Fenelon Falls Existing Traffic Volume Analysis - Weekday Peak Hour
Remarks V/CDelayLOSV/CDelayLOS King Street / Highway 7 and Sturgeon Road East 0.424.7A0.7110.8B Remarks DelayLOS Critcal Movement DelayLOS Critcal Movement King Street / Highway 7 and Sibley Avenue 0.5A2.0A King Street / Highway 7 and Deane Street 1.7A1.8B King Street / Highway 7 and Queen Street 0.8A1.3A Terry Road and Queen Street 3.0A2.4A AMPM Signalized Intersections AMPM Unsignalized Intersections Omemee Existing Traffic Volume Analysis - Weekday Peak Hour
Appendix G
Future Conditions Capacity and Level of Service Analysis
Transportation Master Plan Municipal Master Plan Project City of Kawartha Lakes February 2012 Appendix G
Lindsay Improvement Table
Future 2031 Traffic Volume Analysis - Weekday Peak
Remarks Geometric Changes Intersection IDV/CDelayLOSV/CDelayLOS V/CDelayLOSV/CDelayLOS Queen Street and CKL Road 36 0.6711.4B0.7212.7B Wellington Street and Lindsay Street S16 1.0062.2E1.0665.0ESBR+EBR0.9647.2D0.8031.6C Kent Street W and Lindsay Street N 1 0.6119.5B0.75ErrFTo much DelayClose Ridout Street0.7826.1C0.6317.8B Kent Street W and Angeline Street S 2 Far over capEBR+SBR+NBR+WBR NB+SB Twin +NBL Dual1.38171.0F0.8537.3D Wellington Street and William Street N 3 0.8536.1D1.6201.2FWBR+NBR0.8331.9C0.4316.1B Colborne Street W and Adelaide Street N 0.6417.4B0.7317.5BEB+WB Twin0.5812.8B0.4412B Colborne Street W and Angeline Street S4 Far over capEB+WB+NB+SB twin + Dual NBL+NBR+WBR+EBR+SBR1.0773.8E0.8343D Kent Street W and Highway 35 5 0.7821.3C1.36110.8FSBL0.6720.6C0.6214.8B Colborne Street W and Highway 35 6 Far over capWBR+EBL +SBL Dual0.7730.1C0.9753.5D Thunder Bridge Road and Highway 35 0.7312.7B0.8113.9B Kent Street W /Dewdrop Inn Road and Highway 78 0.619.5A0.7010.7C Mary Street W and Angeline Street S 7 Far over capNBR+WBL+EBL+WBR0.8435.5D0.9744.2D Highway 7 / Highway 35 and Lindsay Street18 0.7119.3B0.9848.9DFar over cap Highway 7 / Highway 35 and Angeline Street 9 0.7125.0C0.8426.8CFar over capDual SBL Highway 7 and CKL Road 36 10 0.7214.4B0.9029.3CFar over cap Remarks Geometric Changes DelayLOS Critcal Movement DelayLOS Critcal Movement V/CDelayLOSV/CDelayLOS Colborne Street E and CKL Road 36 11 Far over capSignal0.7814.7B0.718.9A Colborne Street and St. David Street 11.3D13.4D Queen Street and St. David Street 17 Far over capSignal0.8215.2B0.7111.7B Parkside Drive and CKL Road 36 19 40.0E6.9EFar over capSignal0.659.6A0.7914.8B Wellington Avenue and Albert Street N 4.6A5.0A Colborne Street W and William Street N12 Far over capSignal + NBL +EBR0.8827.3C0.7825.6C Colborne Street W and Albert Street N 13 Far over capSignal +EB+WB Twin0.607.8A0.457.1A Orchard Park Road and William Street N 2.0A5.5A Thunder Bridge Road and Angeline Street N20 1.3A0.8AReconfigure due to safety issues Mary Street W and Lindsay Street S 14 Far over capSignal +EBL + EBR+NBL0.7919.9B0.8530.3C Logie Street and Lindsay Street 9.2F9.8HTo much DelayNB+SB Twin4.6D5.2C Orchard Park Road and Angeline Street15 Far over capSignal NB+SB Twin0.8412.5B0.707.0A Orchard Park Road and Sunderling Road 8.1A8.4A CKL Road 36 and Wilson Road 0.3A0.8A AM PM with Improvements AM with Improvements AM with Improvements PM with Improvements
PM Signalized Intersections Unsignalized Intersections AMPM
Hour
Geometric Changes Intersection IDV/CDelayLOSV/CDelayLOSV/CDelayLOSV/C DelayLOS Main Street/Bolton Street and Canal Street 0.3016.6B0.5221.8C East Street S and King Street 0.797.9A0.8517.9B Geometric Changes DelayLOS Critcal Movement DelayLOS Critcal Movement V/CDelayLOSV/CDelayLOS Main Street & CKL Road 649/East Street N 11.2B15.4C East Street S and Cedartree Lane/Duke Street 1ErrHEB/WBErrHEB/WBSignal EBR+ NBL0.9433.1C0.9035.4D Main Street and Duke Street 2143.1FEB/WB123.5FEB/WBSignal0.7712.4B0.8416.1B West Street and North Street/CKL Road 8 3ErrFNB/SBErrFNB/SBSignal0.9229.2C0.9737.8D Main Street and Joseph Street 2.9A4.0A East Street S and Boyd Street/Canal Street 4ErrDEB/WBErrFEB/WBSignal0.8713.9B0.785.9A Bolton Street and King Street 8.5A11.7B East Street S and Mill Street 5ErrFWBErrFWBSignal0.8411.8B0.8312.2B AM with Improvements Signalized Intersections Unsignalized Intersections Bobcaygeon Improvement Table Future 2031 Traffic Volume Analysis - Weekday Peak Hour PM with Improvements AMPM PM with Improvements AM with Improvements AMPM
Remarks Geometric Changes Intersection IDV/CDelayLOSV/CDelayLOS V/CDelayLOSV/CDelayLOS Francis Street W and CKL Road 121 0.5710.0B0.8919.4C CKL Road 8 and CKL Road 121 0.6520.3C0.9449.4D Remarks Geometric Changes DelayLOS Critcal Movement DelayLOS Critcal Movement Princess Street W and CKL Road 121 1.2A0.7A CKL Road 121 and Northline Road 13.1B12.6B Bond Street W and CKL Road 121 122.9C350.5FEB/WB Signal0.525.5A0.495.3A Unsignalized Intersections Fenelon Falls Improvement Table Future 2031 Traffic Volume Analysis - Weekday Peak Hour PM with Improvements AM with Improvements AMPM AM with Improvements Signalized Intersections PM with Improvements AMPM
Geometric Changes Intersection IDV/CDelayLOSV/CDelayLOSV/CDelayLOSV/C DelayLOS King Street / Highway 7 and Sturgeon Road 10.7317.31.1257.4EEBL0.9636.0D0.6018.4B Geometric Changes DelayLOSCritcal MovementDelayLOS Critcal Movement V/CDelayLOSV/CDelayLOS King Street / Highway 7 and Sibley Avenue 27.0B11.8FSB 1.28Signal0.8212.4D0.7211.7B King Street / Highway 7 and Deane Street 360.8F126.5FSignal0.7413.2B0.689.9A King Street / Highway 7 and Queen Street 4Far over capFar over CapSignal + WBL0.8616.8B0.8012.7B Terry Road and Queen Street 2.3A1.9A Signalized Intersections PM with Improvements AMPM Unsignalized Intersections Omemee Improvement Table Future 2031 Traffic Volume Analysis - Weekday Peak Hour PM with Improvements AM with Improvements AMPM AM with Improvements
CapacityEB/NBWB/SBEB/NBWB/SBTotalEB/NBWB/SBEB/NBWB/SBTotal Angline StreetHighway 7/35Mary Street8003304090.410.510.4612759551.591.191.39 Mary StreetKent Street8005255010.660.630.64150019481.882.442.16 Kent StreetColborne Street8005734450.720.560.64152520391.912.552.23 Colborne StreetOrchard Park Drive8004142610.520.330.42149019051.862.382.12 Total 3200184216160.580.510.54579068471.812.141.97 Lindsay StreetHighway 7/35Logie Street8004495690.560.710.646608250.831.030.93 Logie StreetMary Street8004835720.600.720.6684011081.051.391.22 Total 160093211410.580.710.65150019330.941.211.07 Colborne StreetHighway 35Angline Street8003084160.390.520.4512206401.530.801.16 Angline StreetAdelaide Street8004714940.590.620.6012409301.551.161.36 Adelaide StreetAlbert Street8004644470.580.560.5711708351.461.041.25 Albert StreetWilliam Street8003553480.440.440.4411858301.481.041.26 Total 3200159817050.500.530.52481532351.501.011.26 North-South Screenline Wellington Street8005605540.700.690.70132310201.651.281.46 Lindsay Street N8004493780.560.470.528307601.040.950.99 Lindsay Street S8004835720.600.710.6684011081.051.391.22 Highway 7/358006676750.830.840.84144317751.802.222.01 Total 3200215921780.670.680.68443646631.391.461.42 TotalwithHwy 7/35Widening 4000 1.111.171.14 East-West Screenline Highway 358003312460.410.310.364458250.561.030.79 Angline Street8005666050.710.760.73172022482.152.812.48 Lindsay Street8004344250.540.530.547457350.930.920.93 CKL Road 368002992290.370.290.334554600.570.580.57 Total 3200163015050.510.47 0.49 336542681.051.331.19 Lindsay Screenline Capacity Analysis - Weekday Peak Hour Conditions Note* 800 vehicles per/hour per lane (Typical arterial road capacity 800-1000 veh/h/lane) ExistingPkHr Volume(veh/h) FuturePkHr Volume(veh/h) Note** Summer volumes estimated to be 25% higher than Fall volumes Volume-to-Capacity Ratio(v/c) Volume-to-Capacity Ratio(v/c) StreetFrom To
StreetFrom ToCapacityEB/NBWB/SBEB/NBWB/SBTotalEB/NB WB/SBEB/NBWB/SBTotal Angline StreetHighway 7/35Mary Street8004135110.520.640.58159411941.991.491.74 Mary StreetKent Street8006566260.820.780.80187524352.343.042.69 Kent StreetColborne Street8007165560.900.700.80190625492.383.192.78 Colborne StreetOrchard Park Drive8005183260.650.410.53186323812.332.982.65 Total 3200230320200.720.630.687237.58558.752.262.672.47 Lindsay StreetHighway 7/35Logie Street8005617110.700.890.8082510311.031.291.16 Logie StreetMary Street8006047150.750.890.82105013851.311.731.52 Total 1600116514260.730.890.81187524161.171.511.34 Colborne StreetHighway 35Angline Street8003855200.480.650.5715258001.911.001.45 Angline StreetAdelaide Street8005896180.740.770.75155011631.941.451.70 Adelaide StreetAlbert Street8005805590.730.700.71146310441.831.301.57 Albert StreetWilliam Street8004444350.550.540.55148110381.851.301.57 Total 3200199821310.620.670.65601940441.881.261.57 North-South Screenline Wellington Street8007006920.880.860.87165412752.071.591.83 Lindsay Street8005614730.700.590.6510389501.301.191.24 Lindsay Street8006047140.750.890.82105013851.311.731.52 Highway 7/358008338431.041.051.05180422192.252.772.51 Total 3200269827220.840.850.85554558291.731.821.78 TotalwithHwy 7/35Widening 4000 1.391.461.42 East-West Screenline Highway 358004143080.520.380.4555610310.701.290.99 Angline Street8007087560.880.950.91215028102.693.513.10 Lindsay Street8005435310.680.660.679319191.161.151.16 CKL Road 368003742860.470.360.415695750.710.720.71 Total 3200203818810.640.590.61420653351.311.671.49 Note* 800 vehicles per/hour per lane (Typical arterial road capacity 800-1000 veh/h/lane) Screenline Capacity Analysis - Summer Conditions Lindsay Note** Summer volumes estimated to be 25% higher than Fall volumes FuturePkHr Volume(veh/h) Volume-to-Capacity Ratio(v/c) FuturePkHr Volume(veh/h) Volume-to-Capacity Ratio(v/c)
(Weekday
0.00 0.10 0.20 0.30 0.40 0.50 0.60 0.70 0.80 0.90 1.00 1.10 1.20 1.30 1.40 1.50 2009 2010 2011 2012 2013 2014 2015 2016 2017 2018 2019 2020 2021 2022 2023 2024 2025 2026 2027 2028 2029 2030 2031 Time Volume/Capacity Ratio North-South Screenline East-West Screenline
Screenline Capacity Utilization - Lindsay
Peak Hour Traffic Conditions)
CapacityEB/NBWB/SBEB/NBWB/SBTotalEB/NBWB/SBEB/NBWB/SBTotal East-West Screenline CKL Road 8/121CKL Road 8Francis Street10007005110.700.510.6112809101.280.911.10 Total 10007005110.700.510.6112809101.280.911.10 1.280.911.10 North-South Screenline Highway 7Sturgeon RoadQueen Street10006165640.620.560.5910189851.020.991.00 Mary StreetMill StreetDivision Street60023230.040.040.0433330.060.060.06 Total 16006395870.400.370.38105110180.660.640.65 0.660.640.65 East-West Screenline Main StreetCanal StreetJoseph Street5001911470.380.290.342452100.490.420.46 CKL Road 36Canal StreetDuke Street10000.000.000.00135510481.361.051.20 Total 15001911470.130.10 0.11 160012581.070.84 0.95 CapacityEB/NBWB/SBEB/NBWB/SBTotalEB/NBWB/SBEB/NBWB/SBTotal East-West Screenline CKL Road 8/121CKL Road 8Francis Street10008756390.880.640.7616001137.51.601.141.37 Total 10008756390.880.640.7616001137.51.601.141.37 1.601.141.37 North-South Screenline Highway 7Sturgeon RoadQueen Street10007707050.770.710.74127312311.271.231.25 Mary StreetMill StreetDivision Street60023230.040.040.0433330.060.060.06 Total 16007937280.500.460.48130612640.820.790.80 0.820.790.80 East-West Screenline Main StreetCanal StreetJoseph Street5002391840.480.370.423062630.610.530.57 CKL Road 36Canal StreetDuke Street10000.000.000.00169413101.691.311.50 Total 15002391840.160.12 0.14 200015731.331.05 1.19 Bobcaygeon Screenline Capacity Analysis - Off Peak Conditions ExistingPkHr Volume(veh/h) FuturePkHr Volume(veh/h) Bobcaygeon Omemee Omemee Note** Summer volumes estimated to be 25% higher than Fall volumes Note* 800 vehicles per/hour per lane (Typical arterial road capacity 800-1000 veh/h/lane) FenelonFalls FenelonFalls Volume-to-Capacity Ratio(v/c) Volume-to-Capacity Ratio(v/c) StreetFrom To Screenline Capacity Analysis - Peak Conditions StreetFrom To Other Urban Settlement Areas ExistingPkHr Volume(veh/h) Volume-to-Capacity Ratio(v/c) FuturePkHr Volume(veh/h) Volume-to-Capacity Ratio(v/c)
0.00 0.10 0.20 0.30 0.40 0.50 0.60 0.70 0.80 0.90 1.00 1.10 1.20 2009 2010 2011 2012 2013 2014 2015 2016 2017 2018 2019 2020 2021 2022 2023 2024 2025 2026 2027 2028 2029 2030 2031 Time Volume/Capacity Ratio CKL Road 8/121
Capacity Utilization Fenelon River Crossing - Fenelon Falls (Weekday Peak Hour Traffic Conditions)
Appendix H Bibliography
Transportation Master Plan Municipal Master Plan Project City of Kawartha Lakes February 2012 Appendix I
Bibliography
City of Kawartha Lakes Development Services – Planning Division. “City of Kawartha Lakes Draft Official Plan”. Lindsay: June 22, 2006.
City of Kawartha Lakes Development Services – Planning Division. “Town of Lindsay Official Plan”: Office Consolidation – February 28, 2008, Reprinted – August, 2009. Lindsay: 2000.
Cole Sherman & Associates. “Scugog River Crossing – Phase 2 Colborne Street Bridge”: Addendum to the 1994 Environmental Study Report, Prepared for the County of Victoria. Thornhill: 2000.
Cuming + Company. “City of Kawartha Lakes Staff workshop on Moving Forward to Implement Healthy Community Design”: Summary Report. Toronto: November 12, 2008.
Duncan, B., Hartman, J. “Sustainable Urban Transportation Initiatives in Canada”. Ottawa: Transportation Association of Canada, Urban Transportation Council: November, 1996.
Envision the Hugh Group, dmA Planning & Management Services, SRM Associates. “Trails Master Plan for the City of Kawartha Lakes”. Toronto: March, 2006.
Giffels Associates Ltd., IBI Group, LGL Ltd. “Highway 7 Corridor Improvements (W.P. 69-99-00) Draft Transportation Environmental Study Report”. Toronto.
iTrans Consulting Inc. “Kent Street – Lindsay Traffic Study”: Lindsay Ontario, Prepared for First Professional Management Inc. Richmond Hill: July, 2000.
Mark Engineering. “Traffic Impact Study for the Proposed Relocation of the Kawartha Dairy Facility”: Bobcaygeon, City of Kawartha Lakes. Newmarket: December, 2008.
MHBC Planning, Urban Design & Landscape Architecture. “City of Kawartha Lakes Growth Management Study”: Phase 1 Background and Growth Issues Scoping Report. Kitchener: April, 2009.
MMM Group. “City of Kawartha Lakes Comprehensive Strategic Transit Service Review Study”: Final Report. Toronto:May, 2008.
Richardson Foster Consulting Engineers. “Traffic Impact Analysis Community of Fenelon East, City of Kawartha Lakes”: Prepared for 2165744 Ontario Limited. Barrie: July, 2009.
Share the Road Cycling Coalition. “When Ontario Bikes, Ontario Benefits”: A Green Paper for an Ontario Bicycling Policy. Burlington: March, 2010.
DraftNo.2TransportationMasterPlan MunicipalMasterPlanProject CityofKawarthaLakes AppendixI October2010 I-1
Tranplan Associates. “Rokeby Subdivision Residential Development Traffic Impact Study Bobcaygeon, Ontario”: Prepared for 2212749 Ontario Limited. Toronto: November, 2009.
Transportation Association of Canada. “A New Vision for Urban Transportation”. Ottawa: 1993, Updated 2003.
Totten Sims Hubicki Associates Limited. “City of Kawartha Lakes Aggregate Haul Route Study”: Final Report. Whitby: June, 2006.
Urban & Environmental Management Inc. “Intermunicipal Transit Assessment”: Technical Memorandum To File. Niagara Falls: March, 11, 2010.
Watson & Associates. “Addendum To City of Kawartha Lakes 2009 Development Charge Background Study.” Mississauga: August 31, 2009.
DraftNo.2TransportationMasterPlan MunicipalMasterPlanProject CityofKawarthaLakes AppendixI October2010 I-2
