Solid Waste Management Master Plan Update
4701 St. Clair Avenue, Suite 301, Niagara Falls, Ontario L2E 3S9 Ph: (905) 371-9764 Fax: (905) 371-9763 www.uemconsulting.com
Project: City of Kawartha Lakes Municipal Master Plan Project Client: City of Kawartha Lakes Subject: Solid Waste Management Master Plan Update Date: February 2012 UEM Project #08-409 Table of Contents 1.0 INTRODUCTION....................................... ....................................1 1.1 Summary of the Results of the Growth Management Strategy ...................................1 1.2 The Municipal Class EA Process ...............................................................................2 1.3 Purpose .....................................................................................................................2 1.4 Planning Period .........................................................................................................2 1.5 Existing Solid Waste Management Master Plan ......3 1.6 Consultation Process ..............................................4 2.0 EXISTING CONDITIONS..............................................................................................................5 2.1 Current Waste Management System in the City of Kawartha Lakes ...........................5 2.1.1 Current Level of Service ...........................................................................................5 2.1.1.1 Reduction & Reuse Programs .................................................................................5 2.1.1.2 Promotion and Education ......................................................................................5 2.1.1.3 Collection System ...................................................................................................6 2.1.1.4 Processing Facilities ................................................................................................7 2.1.1.5 Disposal Facilities ...................................................................................................7 2.1.1.6 Waste Disposal Quantities ...................................9 2.1.2 Current Waste Generation and Diversion Rates ..12 2.1.2.1 2010 Residential Waste Generation and Diversion Rates ......................................12 2.1.2.2 Total Waste Generation and Diversion Rates .......................................................12 2.1.3 Waste Composition ................................................................................................14 2.1.4 Representative Waste Composition – Audits ..........................................................14 2.1.5 Industrial, Commercial & Institutional (IC&I) and Construction & Demolition (C&D) Waste..........................................................................................................16 2.1.6 Waste Generation Projections .............................17 2.1.7 Revenue and Expenditures ..................................19 3.0 DATA COLLECTION & ANALYSIS.........................................................................................20 3.1 Preliminary Municipality Review ...........................20 3.1.1 Results the Preliminary Municipality Review...........................................................20 3.2 Detailed Municipality Review ..................................................................................22
SolidWasteManagementMasterPlanUpdate MunicipalMasterPlanProject CityofKawarthaLakes February2012 Page ii 3.2.1 Results of the Detailed Municipality Review ...........................................................22 3.2.1.1 General Observations ...........................................................................................22 3.2.1.2 Specific Observations ...........................................................................................24 3.2.1.3 Tipping Fees.........................................................................................................25 3.3 Provincial Data Review .........................................25 3.3.1 Waste Diversion Ontario (WDO) ........................25 3.3.1.1 Category Comparison ...........................................................................................25 3.3.2 Municipal Performance Measures Program (MPMP) ..............................................28 3.3.3 Ontario Municipal Benchmark Initiative (OMBI) ................................................... 29 3.3.3.1 Overview of the OMBI Solid Waste Management Services ..................................30 3.3.3.2 OMBI Results and Comparison............................................................................30 3.3.3.3 Issues Facing the Delivery of Solid Waste Management Services ..........................31 3.3.4 Summary of Provincial Data Review ...................32 3.4 Review of Provincial Direction .............................32 3.4.1 Provincial Plans ...................................................................................................... 32 3.4.1.1 Growth Plan for the Greater Golden Horseshoe ..................................................32 3.4.1.2 Provincial Policy Statement, 2005 .........................................................................34 3.4.2 Provincial Legislation .............................................................................................34 3.4.2.1 Environmental Assessment Act, 1990, R.S.O. 1990, c. E. 18 ................................34 3.4.2.2 Environmental Protection Act R.S.O. 1990, c. E.19 .............................................34 3.4.2.3 Waste Diversion Act, 2002, S.O. 2002, c. 6 ........35 3.4.2.4 Planning Act, 1990, R.S.O. 1990, CHAPTER P.13 ...............................................36 3.4.2.5 Municipal Act, 2001, S.O 2001, c. 25 ....................................................................36 3.4.3 Provincial Initiatives ...............................................................................................36 3.4.3.1 Ontario’s 60% Waste Diversion Goal ...................................................................37 3.4.3.2 From Waste to Worth: The Role of Waste Diversion in the Green Economy ......38 3.4.3.3 Guidelines for Composting Facilities and Compost Use in Ontario ......................40 3.4.3.4 Continuous Improvement Fund ........................41 3.4.3.5 CIF Project 240 – Guideline for Preparing a Municipal Waste Recycling Strategy (WRS)...................................................................................................................42 3.4.4 Designated Materials ..............................................................................................43 3.4.4.1 The Municipal Hazardous or Special Waste (MHSW) Program Plan.....................43 3.4.4.2 The Waste Electrical & Electronic Equipment (WEEE) Program Plan ................44 3.4.4.3 Used Tires Program Plan ......................................................................................45 3.4.5 Policy Statement on Waste Management Planning: Best Practices for Waste Managers ..........46 3.4.6 Summary of Provincial Direction Review ............47 4.0 IDENTIFICATION AND EVALUATION OF DIVERSION ALTERNATIVES...........48 4.1 Evaluation Methodology ......................................48 4.2 Evaluation Criteria ................................................48 4.3 Identification of Diversion Alternatives ...................................................................49 4.4 Comparative Evaluation of Alternatives ..................................................................51
SolidWasteManagementMasterPlanUpdate MunicipalMasterPlanProject CityofKawarthaLakes February2012 Page iii 5.0 DISPOSAL ALTERNATIVES......................................................................................................52 5.1 Landfill and Other Facilities Management ...............................................................52 5.1.1 Landfill Expansions to Increase Site Life .............52 5.1.2 Landfill Mining .53 5.1.3 Alternative Daily Cover .......................................54 5.1.4 Landfill Operational Efficiencies ............................................................................55 5.1.5 Landfill Monitoring Program ..................................................................................55 5.1.6 Landfill Sites – Potential Afterlife Uses...................................................................56 5.2.1.1 Existing Thermal Treatment Technologies ...........................................................59 5.2.1.2 Emerging Thermal Treatment Technologies ......60 5.2.1.3 Examples of Thermal Treatment Facilities ........60 5.2.2.1 Mechanical Treatment Technologies .................61 5.2.2.2 Biological Treatment Technologies.......................................................................61 5.2.2.3 Examples of Mechanical Biological Treatment Facilities .......................................62 6.0 PROPOSED UPDATE TO THE CITY OF KAWARTHA LAKES SOLID WASTE MANAGEMENT SYSTEM.................................. ......................66 6.1 Waste Diversion 66 6.1.1 Transfer Station ...................................................................................................... 71 6.2 Review of Waste Management Programs .................................................................72 6.2.1 Review of Tipping Fees & Bag Tag Rates ...............................................................72 7.0 IMPLEMENTATION CONSIDERATIONS FOR THE UPDATED SOLID WASTE MANAGEMENT MASTER PLAN FOR THE CITY OF KAWARTHA LAKES............74 7.1 Updated Waste Diversion Targets ...........................................................................77 7.2 Disposal Requirements ............................................................................................77 7.3 Implementation of a City-Wide Source Separated Organics (SSO) Collection and Composting Program ..............................................................................................78 7.4 Compost Facility Technology/Location ..................................................................80 7.4.1 Compost Technology ..........................................80 7.4.2 Compost Facility Siting ........................................82 7.4.3 Compost Facility Ownership and Operation .......82 7.5 Amendment of Solid Waste Management By-law to Support an SSO Collection and Composting Program ..............................................................................................84 7.6 Results of the SSO Compost Feasibility Study .........................................................84 7.7 Extended Producer Responsibility (EPR) ................................................................84 7.7.1 Introduction ...........................................................................................................84 7.7.2 Current EPR Programs in Ontario ......................85 7.7.3 Detailed Elements ...............................................85 7.7.4 Examples of EPR Programs ................................87 7.7.5 Implications of EPR to the SWMMP Update .........................................................87
SolidWasteManagementMasterPlanUpdate MunicipalMasterPlanProject CityofKawarthaLakes February2012 Page iv 8.0 CONCLUSIONS AND RECOMMENDATIONS...................................................................89 8.1 Conclusions .............................................................................................................89 8.2 Recommendations ................................................91
List of Figures
Figure 2-1: Breakdown of Waste Received by Landfill (2011) in Tonnes per Year...............................10
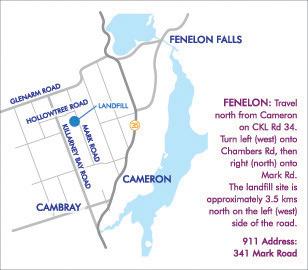
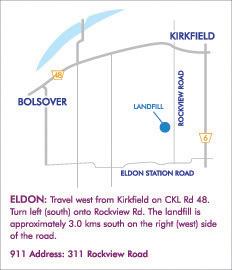
Figure 2-2: Location of Existing Operating Landfills in the City of Kawartha Lakes...........................11
Figure 2-3: Average Waste Composition.............. .....................................16
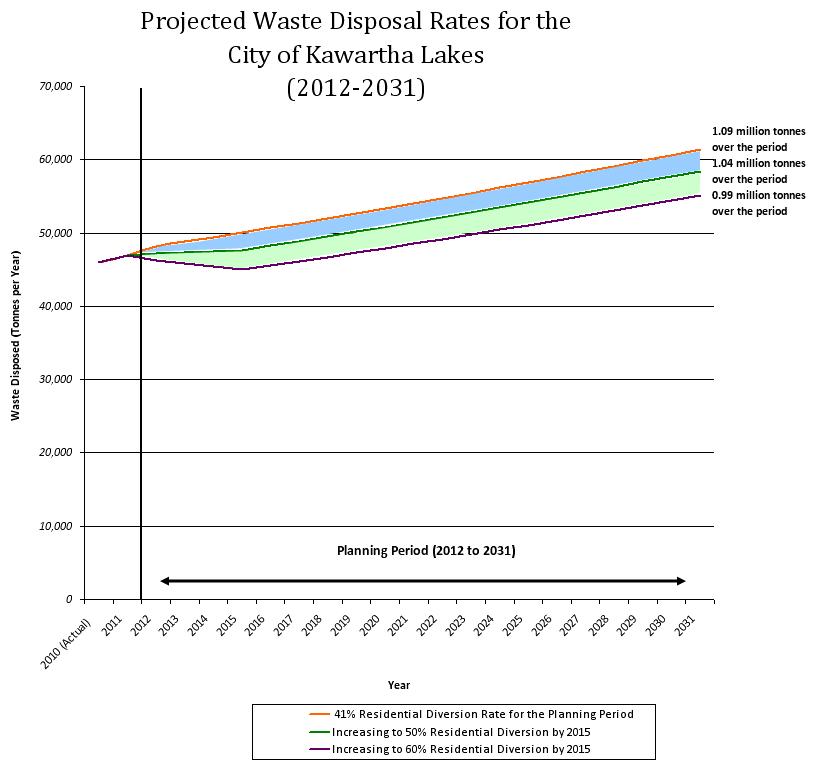
Figure 2-4: Projected Waste Disposal Rates for the City of Kawartha Lakes.........................................19
Figure 3-1: The Greater Golden Horseshoe (GGH)..... ..........................33
Figure 7-1: Proposed Waste Management System....... ............................76
Figure 7-2: Considerations in the Ownership and Management of an SSO Compost Facility............83
List of Tables
Table 2-1: Waste Quantities Disposed at City of Kawartha Lakes Landfills (2006 to 2011)..................9
Table 2-2: Total Waste Management in the City of Kawartha Lakes in 2010 (Based on WDO Submission and CKL Financial Information Return).................................................................................13
Table 2-3: Estimate of the Composition and Quantity of the IC&I Waste Stream Disposed in the City of Kawartha Lakes (2010).......................................................................................................................17
Table 2-4: Estimate of the Composition and Quantity of the C&D Waste Stream Disposed in the City of Kawartha Lakes (2010).......................................................................................................................17
Table 2-5: Current and Projected Total Waste Generation, Disposal, and Diversion Tonnages Based on Maintaining the Current Average (2008 to 2010) Residential Diversion Rate of 41% for the Planning Period (2012-2031)..........................................................................................................................18
Table 3-1: Demographics, Tonnage and Diversion Rates for ‘Rural Regional' Municipalities (2010)26
Table 3-2: Financial and Performance Rates for 'Rural Regional' Municipal Blue Box Programs (WDO 2010).....................................................................................................................................................27
Table 3-3: Municipal Performance Measure Program (MPMP) - City of Kawartha Lakes (2009 & 2010)...................................................................................................................................................................28
Table 3-4: Comparison of OMBI and MPMP Data for the City of Kawartha Lakes (2008 & 2009).31
Table 3-5: Materials Included in Phase-1 and Phase-2 of the WEEE Program.....................................45
Table 4-1: Identification of Diversion Alternatives ....................................................................................49
Table 7-1: Updated Waste Diversion Targets for the City of Kawartha Lakes......................................77
Table 7-2: Landfill Capacity Remaining........................................................................................................77
Table 7-3: Effects on City-Wide SSO Collection on Disposal Rates and the Residential Diversion Rate in the City of Kawartha Lakes...............................................................................................................80
Table 7-4: Considerations for Extended Producer Responsibility............................................................86
SolidWasteManagementMasterPlanUpdate MunicipalMasterPlanProject CityofKawarthaLakes February2012 Page v
List of Appendices
Appendix A – Method of Managing Waste Materials
Appendix B – Stewardship Ontario Waste Audit Results
Appendix C – Waste Generation Projections
Appendix D – 2010 Waste Management Revenue and Expenditures
Appendix E – Preliminary Municipality Review
Appendix F – Detailed Municipality Review
Appendix G – Results of the ‘Net-Effects’ Evaluation
Appendix H – Summary of Residential Blue Box Materials Collected
Appendix I – Information on Gore Compost Systems
Appendix J – Process to Identify and Evaluate Alternative Technologies
SolidWasteManagementMasterPlanUpdate MunicipalMasterPlanProject CityofKawarthaLakes February2012 Page vi
SolidWasteManagementMasterPlanUpdate
MunicipalMasterPlanProject
CityofKawarthaLakes
List of Acronyms/Abbreviations
Acronym Meaning
C&D ConstructionandDemolition
C.ofA. CertificateofApproval
CAP Canada-wideActionPlan
CIF ContinuousImprovementFund
CKL CityofKawarthaLakes
CWA CleanWaterAct
E&E EffectivenessandEfficiency
EAA EnvironmentalAssessmentAct
EBR EnvironmentalBillofRights
EFW Energy-from-Waste
EPA EnvironmentalProtectionAct
EPR ExtendedProducerResponsibility
FIR FinancialInformationReturn
GAP GenerallyAcceptedPrinciples
GGH GreaterGoldenHorseshoe
GMS GrowthManagementStrategy
GTA GreaterTorontoArea
HHW HouseholdHazardousWaste
IC&I Industrial,CommercialandInstitutional
IFO IndustryFundingOrganization
MHBC MHBCPlanningConsultantsLtd.
MHSW MunicipalHazardousorSpecialWaste
MMA MinistryofMunicipalAffairs
MOE MinistryoftheEnvironment
MPMP MunicipalPerformanceMeasuresProgram
MRF MaterialsRecoveringFacility
NGO Non-GovernmentOrganization
NMA NutrientManagementAct
OES OntarioElectronicStewardship
OMBI OntarioMunicipalBenchmarkInitiative
OTS OntarioTireStewardship
OWMA OntarioWasteManagementAssociation
OWRA OntarioWaterResourcesAct
PET PolyethyleneTerephthalate
PPS ProvincialPolicyStatement
SSO SourceSeparatedOrganics
UEM Urban&EnvironmentalManagementInc.
SWMMP SolidWasteManagementMasterPlan
WDA WasteDiversionAct
WDO WasteDiversionOntario
WDR WasteDisposalRate
WEEE WasteElectricalandElectronicEquipment
WRS WasteRecyclingStrategy
February2012
Page vii
1.0 INTRODUCTION
The City of Kawartha Lakes (CKL) has completed a Growth Management Strategy and Municipal Master Plan project to address the requirements of the Province of Ontario’s Places to Grow legislation and to establish a plan for major municipal infrastructure and to accommodate growth. Urban & Environmental Management Inc. (UEM) in conjunction with MHBC Planning Consultants Ltd. (MHBC) was retained by the City to undertake the project. There are four major components to the Growth Management Strategy and Municipal Master Plan project.
• Growth Management Strategy
• Municipal Servicing Assessment
• Transportation Master Plan
• Solid Waste Management Master Plan Update
A comprehensive public, stakeholder and agency consultation program was undertaken during the project. The results of the consultation program are documented in a separate Consultation Report.
1.1 Summary of the Results of the Growth Management Strategy
On June 13th, 2005, the Places to Grow Act (2005) received Royal Assent. The Act established a legal framework for provincial growth planning in Ontario. In support of this, the ‘Growth Plan for the Greater Golden Horseshoe’ (June 2006) was developed and approved by the Province. The City of Kawartha Lakes is located within the Greater Golden Horseshoe (GGH). The Growth Plan for the Greater Golden Horseshoe identified four urban settlement areas in the City, namely Lindsay, Omemee, Bobcaygeon and Fenelon Falls. Built boundaries were established for each of these four urban settlement areas. In addition, 30 smaller, unserviced or partially serviced communities and hamlets were also identified in the Growth Plan for the Greater Golden Horseshoe as “undelineated” built up areas.
The first step in the Growth Management Strategy and Municipal Master Plan Project was to develop a Growth Management Strategy (GMS) specifically for CKL that addressed the Provincial requirements of the Places to Grow Act. The Final GMS (June 2010) was endorsed by Council on September 14th, 2010. The primary conclusions of the GMS are as follows:
• That the City’s population is projected to grow to 100,000 by the year 2031
• That growth projections are consistent with the Places to Grow legislation
• Of the three (3) land capacity scenarios considered for the Growth Management Strategy the preferred scenario was ‘Growth Achieving an Adjusted Density Target.’ This scenario assumes:
o Intensification would meet an adjusted target of at least 30% of all new residential units locating within the built-up area after 2015
o Greenfield development would meet an adjusted density target of 40 people and 40 jobs per hectare
SolidWasteManagementMasterPlanUpdate MunicipalMasterPlanProject CityofKawarthaLakes February2012 Page1
• That there is enough land within the current urban boundaries of the four settlement areas and the 30 hamlets to meet the needs to 2031 and beyond.
The conclusions of the GMS provided the basis for the completion of the Solid Waste Management Master Plan Update.
1.2 The Municipal Class EA Process
The Municipal Class EA process applies to municipal infrastructure projects. For the Growth Management Strategy and Municipal Master Plan project both water and wastewater systems as well as the City’s transportation system are being evaluated using the MEA Class EA process. Solid waste management does not fall under the Municipal Class EA process. The Solid Waste Management Master Plan (SWMMP) Update is therefore being undertaken based on relevant waste management legislation.
1.3 Purpose
The purpose of the SWMMP Update is to update the City’s long-term strategy for the management of solid waste, which was first developed in 1993 (Proctor & Redfern). The SWMMP will be consistent with the GMS. The primary objectives of the SWMMP Update are as follows:
• Divert as much waste as possible from the existing waste stream
• Work in partnership with Sir Sanford Fleming College and local stakeholders to develop new and innovative programs to achieve further diversion from landfills
• Examine alternative disposal options to landfilling for residual component after diversion (i.e. thermal destruction, energy from waste, etc.)
• Approach other municipalities in consultation with regulatory agencies to determine feasibility of City participation in existing alternative to landfill approved disposal processes/facilities (i.e. Durham-York energy from waste)
• Work with neighboring municipalities and the private sector to realize cost savings and efficiencies through regionalization of waste management programs and services.
• Examine the centralization of waste management services, where possible
• Develop and maximize revenue sources from waste materials and recyclables for the City
• Review and implement landfill mining programs if supported through a business case
• Develop Source Separated Organics (SSO) Program for the City
1.4 Planning Period
Population and employment growth projections were developed as part of this Growth Management Strategy and Municipal Master Plan project. In accordance with the terms and conditions of this assignment, the year 2031 was used for determining population and employment growth. Therefore, this SWMMP Update was completed for the planning period ending in 2031.
SolidWasteManagementMasterPlanUpdate MunicipalMasterPlanProject CityofKawarthaLakes February2012 Page 2
1.5 Existing Solid Waste Management Master Plan
The last comprehensive waste management study undertaken for the municipality was in the early 1990’s (Proctor & Redfern, County of Victoria Solid Waste Management System Plan, March 1993). That study was led by the former County of Victoria and was undertaken by the County in conjunction with the former Town of Lindsay and lower-tier municipalities. When the study was initiated the County assumed responsibility for disposal, while the lower-tier municipalities retained responsibility for collection and recycling. The County and municipalities (and subsequently CKL) proceeded to implement the components of that plan, which was designed for a 25-year period to the year 2020.
When the System Plan (1993) was developed, the primary method of managing solid waste was disposal. Disposal accounted for approximately 88% of total waste managed. Residential recycling was at 7% and had only been implemented in the Town of Lindsay and a limited number of the lower-tier municipalities. Other programs (i.e. industrial, commercial and institutional (IC&I) and construction and demolition (C&D) material recycling) and diversion activities (e.g. leaf and yard waste, composting, promotion of backyard composting, etc.) accounted for approximately 5% of the waste management total.
Through the development of the System Plan (1993), a diversion target was established and a preferred long-term system identified. The Provincial target of that time of 25% diversion of waste by 1992 and 50% by 2000 was adopted as a diversion target by the County. The preferred long-term waste management system was established in the following order of preference for implementation:
• Public Education
• Waste Reduction
• Materials Reuse
• Materials Recycling
• Leaf & Yard Material Composting
• Collection & Proper Management of Household Hazardous Waste (HHW)
• Landfill
Based on population projections and historic waste generation information, the System Plan (1993) estimated that the population (described as the Town of Lindsay, County of Victoria and including a factor for seasonal population) would be approximately 99,000 by 2020 and approximately 2.0 million tonnes of waste would be generated over a 25 year period from 1996 to 2020. A target of establishing an additional 1.0 million tonnes of waste disposal capacity was derived from a diversion rate of 50%. It was estimated that the per capita waste generation rate over the 25-year planning period would average 0.95 tonnes/person/year. The distribution of waste generation when the System Plan was developed was 75% residential and 25% IC&I/C&D in the County of Victoria and 20% residential and 80% IC&I/C&D in the Town of Lindsay. The high ratio of IC&I/C&D waste to residential waste in the Town of Lindsay
SolidWasteManagementMasterPlanUpdate MunicipalMasterPlanProject CityofKawarthaLakes February2012 Page 3
reflected the large industrial/manufacturing employment base that existed in the Town at the time.
The System Plan was adopted and the former Town of Lindsay and former County of Victoria implemented many programs and developed facilities in support of the preferred system. With the formation of the City of Kawartha Lakes a coordinated disposal and diversion process was made even further possible. Generally, this has included:
• Increasing the promotion and education of diversion programs
• Continuing to promote the sale and use by residents of backyard composters
• Establishing a Reuse Centre at the Fenelon Landfill
• Expanding the Blue Box recycling program City-wide
• Adding additional materials to the Blue Box recycling program
• Implementing a leaf and yard material collection and composting program
• Undertaking a pilot source separated organics (SSO) collection and composting program
• Implementing and/or expanding programs for the diversion of other materials such as tires, waste electronics, scrap metal, HHW, etc
• Establishing long-term disposal capacity through the approval of the Continued Use and Expansion of the Lindsay-Ops Landfill
Through the implementation of these programs, the residential diversion rate has increased significantly and the amount of waste disposed has decreased proportionally. As reported to Waste Diversion Ontario (WDO) in the 2010 Financial & Tonnage Datacall submission, the City’s residential diversion rate for 2010 was 43.75%, which is a substantial increase from the approximately 12% diversion in the early-1990’s when the System Plan was initially prepared and adopted.
However, over the most recent 3 year reporting period (2008 to 2010) the City’s residential waste diversion rate has stabilized at an average of approximately 41%, suggesting that the diversion programs as currently in place have reached their full potential. SSO is the remaining major component to be diverted from the waste stream. If the City was able to achieve an additional 15% diversion based on diverting SSO materials, which is very realistic based on experience in the Province, this would increase the City’s residential diversion rate to approximately 56%. This would rank the City within the top municipalities in terms of total residential waste diversion rates in the province.
1.6 Consultation Process
As part of the Growth Management Strategy and Municipal Master Plan project an extensive public consultation process was undertaken including specific consultation in regard to the SWMMP Update. Details of the consultation process are included in the Consultation Report, a separate volume of this project submission.
SolidWasteManagementMasterPlanUpdate MunicipalMasterPlanProject
February2012 Page 4
CityofKawarthaLakes
2.0 EXISTING CONDITIONS
2.1 Current Waste Management System in the City of Kawartha Lakes
The following provides a background review of the City’s existing waste management system. This information was used for the understanding and evaluation of the current system, comparison with other municipalities, generating recommendations for changes/improvements and assessing future needs which resulted in the development of the SWMMP Update.
2.1.1 Current Level of Service
2.1.1.1
Reduction & Reuse Programs
• Operation of a Reuse Centre at the Fenelon Landfill. Household and other items (electrical items excluded) in good, resale condition are accepted free of charge and resold for a nominal fee.
• Promotion of home composting through the publication of information regarding backyard composting, vermi-composting and the sale of backyard composters.
• Acceptance of electronic items at all City landfills for recycling.
• Acceptance of tires, scrap metal, propane tanks, car batteries and bale and boat wraps at all City landfills for recycling.
• Household hazardous waste (HHW) depots which operate during the regular landfill hours of operation of the Fenelon and Lindsay-Ops landfills.
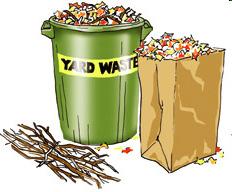
• Acceptance of leaf & yard material, including brush and Christmas trees at all City landfills for composting.
• Drop-off boxes located at CKL Municipal Service Centre’s for laser printer cartridges, household batteries and old/damaged recycling containers. All of these items are recycled.
2.1.1.2 Promotion and Education
• ‘Be Waste Wise’ branding for educational tools and guides
• Publication of an annual recycling and waste collection calendar which provides residents and businesses with valuable information on waste management programs.
• Information on waste management services on the City website, including fact sheets on backyard composting, household hazardous waste, grasscycling and recycling.
• Public school education program
• Agreement with Sir Sanford Fleming College to work together on projects, activities and initiatives, specifically including “innovative technology, landfill mining, environmental protection, ecological restoration and natural resource conservation.”
SolidWasteManagementMasterPlanUpdate MunicipalMasterPlanProject CityofKawarthaLakes February2012 Page 5
2.1.1.3 Collection System
• Weekly curbside waste collection is provided City-wide to all permanent single-family residences, and to some seasonal residences and some multi-residential and IC&I properties. The City has a waste container limit of 2 bags per residential property. The 2-bag limit is applicable to both permanent and seasonal residences. The IC&I sector that receives collection has a 4-bag limit. Residents and the IC&I sector can purchase bag tags to allow the set out of additional waste. The cost of bag tags is $3.00 each. Large IC&I establishments are encouraged to make arrangements with private contractors for collection.
• Weekly curbside Blue Box (containers) and Green Box (fibres) recyclables collection is provided City-wide to all permanent single-family residences, and to some seasonal residences and some multi-residential and IC&I properties. The program alternates weekly between containers collection (i.e. Blue Box) and fibres collection (i.e. Green Box). IC&I properties are limited to the equivalent of 4 cubic yards (i.e. equivalent of four roll-out carts) per week.
• Miller Waste Systems is contracted by the City to provide residual waste collection, Blue Box and Green Box material collection, textiles collection, large items/white goods collection and seasonal (fall) leaf and yard material collection.
• A ‘Silver Box’ public spaces recycling program, partnering with EcoMedia Direct Inc. Starting in May 2010, the City installed recycling bins in public spaces, in areas with high pedestrian and vehicular traffic. Recyclable material is sorted in the same manner as it is for the curbside program. Mobile units are also available for special events.
• Since 2005, curbside leaf & yard material collection has been provided to single-family residences for collection in the autumn throughout the entire City.
Paper bags or reusable containers must be used, no plastic bags are permitted.
Bundles of brush weighing less than 40lbs are also collected during the leaf collection event.
• Textiles are collected four times per year (March, May, August and November) on regularly scheduled recycling days.
• Large items and large appliances (white goods) are collected. Residents are required to contact the collection contractor directly to arrange the service. A $5.00 sticker must be purchased and placed on the item for collection.
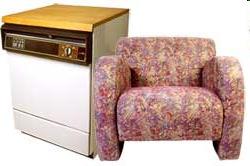
SolidWasteManagementMasterPlanUpdate MunicipalMasterPlanProject CityofKawarthaLakes February2012 Page 6
• Freon containing appliances are collected. Residents are required to contact the collection contractor directly to arrange the service. A $20 “Freon appliance” sticker must be purchased and placed on the item, along with the $5.00 large-item sticker.
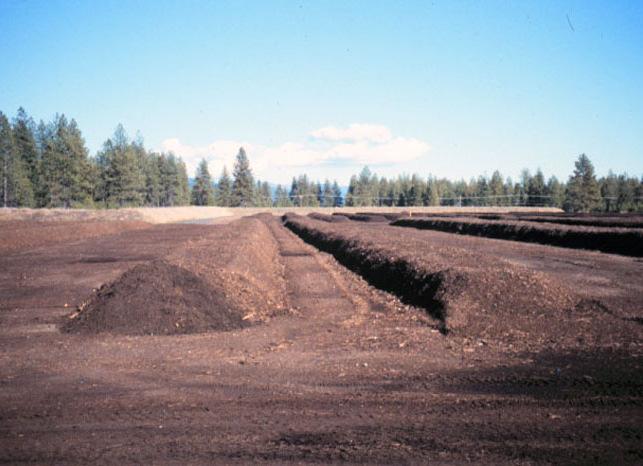
• The City is currently undertaking a pilot source separated organics (SSO) collection and composting program. Organic materials collected are composted in open windrows at the Fenelon Landfill.
• The City has also initiated a study to determine the feasibility of implementation of citywide SSO program
• The City is looking into tendering out future material recovery services to obtain the most economically viable option for blue-box recyclables
2.1.1.4 Processing Facilities
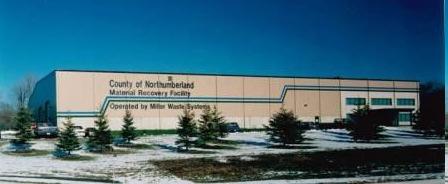
• Recyclable materials (containers and fibres) collected in the curbside Blue Box or Green Box collection program or self-hauled by residents to recycling bins located at the landfills are transferred to the County of Northumberland Materials Recovery Facility (MRF) for processing. The City pays a processing fee to the County and then shares in the profit from the sale of materials. As stated in the preceding section, the City is looking into tendering out future material recovery services to obtain the most economically viable option for blue-box recyclables
• The City has approval and operates leaf & yard material composting facilities at all five of the existing landfills. The City also has approval to operate a leaf and yard material compost facility as the closed Lindsay Street North Landfill, however, they are not currently utilizing this facility. Leaves collected in the fall collection program and leaf & yard material self-hauled by residents are composted at one of these facilities.
• The City will also be expanding its transfer station capacity at Lindsay-Ops in 2012/2013 to ensure recyclables bulking and transference operations are as efficient as possible
2.1.1.5 Disposal Facilities
The City has five operating landfills: Lindsay-Ops, Fenelon, Eldon, Somerville and Laxton. Residual waste is transported to one of these landfills for disposal. The following provides an overview of the five operating landfills.
SolidWasteManagementMasterPlanUpdate MunicipalMasterPlanProject CityofKawarthaLakes February2012 Page 7
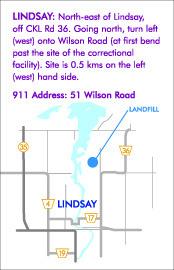
Lindsay-Ops Landfill – The Lindsay-Ops Landfill is located in the central part of the City in the former Township of Ops and has been in operation since 1980. The City received Environmental Assessment Act (EAA) and Environmental Protection Act (EPA) approval for the northerly expansion of the Lindsay-Ops Landfill in 2001 and began accepting waste in the new disposal area in late 2002/early 2003. On average, approximately 31,100 tonnes of waste has been disposed at the site per year over the last three years (2009 to 2011). In 2011, approximately 29,342 tonnes of waste was disposed. As other City landfills close, it is anticipated that the annual disposal rate at this site will increase. The site is being developed in 6 cells. It is estimated that disposal capacity at the Lindsay-Ops Landfill will last until approximately 2032.
The Lindsay-Ops Landfill operates under C. of A. No. A321504. The most recent amendment to the C. of A. was issued April 8th, 2010 (Notice of Amendment No. 4). The C. of A. permits acceptance of a maximum of 240 tonnes of solid non-hazardous municipal waste per day to an annual maximum of 58,200 tonnes per year. With the northerly expansion in 2001 of 1.49 million cubic metres, the total waste disposal capacity of the site including daily cover is 2.34 million cubic metres. The stormwater management system at the Lindsay-Ops Landfill operates under C. of A. 5134-7JURG6 issued October 10, 2008 and an Air & Noise C. of A. No. 52118ASRRU issued November 10, 2010.
Fenelon Landfill – The Fenelon Landfill is located in the east-central part of the City, in the former Fenelon Township. The landfill operates under C. of A. No. A321206. The most recent amendment to the C. of A. was issued December 8th, 2009 (Notice of Amendment No. 4). On average, approximately 8,000 tonnes of waste has been disposed per year at the site over the last three years (2009 to 2011). In 2011, approximately 8,414 tonnes of waste was disposed. The site is being developed in two phases. The Fenelon Landfill is expected to reach capacity by approximately 2020.
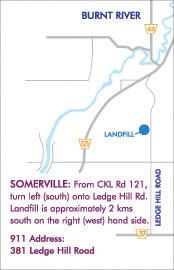
Somerville Landfill – The Somerville Landfill is located in the northeast part of the City, in the former Somerville Township. The landfill operates under C. of A. No. A321604 originally issued February 7th, 1980. The most recent amendment to the C. of A. was issued June 27th, 2008 (Notice of Amendment No. 3). On average, approximately 3,400 tonnes of waste has been disposed at the site per year over the last three years (2009 to 2011). In 2011, approximately 3,854 tonnes of waste was disposed. The site is being developed in two phases, with Phase 1 complete. Phase 2 has 12 cells and it is anticipated that disposal capacity will last to approximately 2040.
Eldon Landfill – The Eldon Landfill is located in the west-central part of the City, in the former Eldon Township. The landfill operates under Certificate of Approval (C. of A.) No. A321004 originally issued on February 21st, 1980. The most recent amendment to the C. of A. was issued January 6th, 2009 (Notice of Amendment No. 7). On average, approximately 2,700 tonnes of waste was disposed per year at the site over the last three years (2009 to 2011). In 2011, approximately 2,450 tonnes of waste was disposed. The Eldon Landfill is being developed
SolidWasteManagementMasterPlanUpdate MunicipalMasterPlanProject
February2012 Page 8
CityofKawarthaLakes
in three phases. The Phase 1 and 2 areas are anticipated to last to approximately 2015. The Phase 3 area was originally proposed to be developed for non-putrescible waste only (i.e. construction and demolition waste). However, the City submitted an application to the MOE in December 2010 for approval to use the Phase 3 area for municipal solid waste. The MOE has not approved the Phase 3 area to be used and will not until further technical support is presented and/or additional buffer lands around the site are acquired by the City.
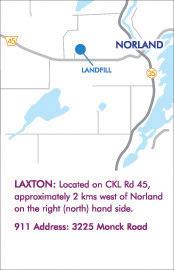
Laxton Landfill – The Laxton Landfill (also referred to as the LDL Landfill) is located in the north part of the City in the former United Townships of Laxton, Digby and Longford. The landfill operates under C. of A. No. A321304 originally issued July 9th, 1973. The most recent amendment to the C. of A. was issued June 11th, 2009 (Notice of Amendment No. 3). On average, approximately 1,150 tonnes per year of waste has been disposed at the site over the last three years (2009 to 2011). In 2011, approximately 1,390 tonnes of waste was disposed. It is estimated that the Laxton Landfill will reach capacity in approximately 2028. The Laxton Landfill Site has been approved to receive HHW; however, no HHW depot or collection events currently occur at the site.
2.1.1.6 Waste Disposal Quantities
Over the past six years (2006 to 2011), on average approximately 45,150 tonnes of waste has been disposed at City landfills.1 In 2011, 45,449 tonnes of waste was disposed. Table 2-1 summarizes the quantity of waste disposed at each of the City landfills from 2006 to 2011.
1Thesixyearaverageexcludes2008. Wastequantitiesdisposedin2008weresignificantlylowerduetothe7-week municipalworkstoppage. Duringthattime,curbsidewastewascollectedanddisposed. However,selfhauledand privatecommercialwastehaulerswerenotpermittedaccesstothelandfillsites.
SolidWasteManagementMasterPlanUpdate MunicipalMasterPlanProject
February2012 Page 9
CityofKawarthaLakes
Figure 2-1 provides a breakdown of waste received at each landfill in 2011. Figure 2-2 identifies the location of existing landfills in the City.
QuantityofWasteDisposed(tonnes) Landfill 2006 2007 2008 2009 2010 2011 Lindsay-Ops 30,155t 28,197t 24,591t 32,849t 31,099t 29,342t Fenelon 4,907t 9,404t 8,131t 7,055t 8,505t 8,414t Somerville 3,219t 2,959t 2,055t 3,594t 2,679t 2,450t Eldon 3,202t 3,370t 3,069t 2,884t 2,818t 3,854t Laxton 1,097t 1,034t 1,085t 1,161t 866t 1,390t TOTAL 42,580t 44,197t 38,931t 47,540t 45,966t 45,449t
Table 2-1: Waste Quantities Disposed at City of Kawartha Lakes Landfills (2006 to 2011)
Breakdown of Waste Received by Landfill (2011) in Tonnes per Year
SolidWasteManagementMasterPlanUpdate MunicipalMasterPlanProject CityofKawarthaLakes February2012 Page 10
Lindsay-Ops 29,342 65% Eldon 2,450 5% Sommerville 3,854, 8% Fenelon 8,414, 19% Laxton 1,390, 3%
Figure 2-1: Breakdown of Waste Received by Landfill (2011) in Tonnes per Year
SolidWasteManagementMasterPlanUpdate MunicipalMasterPlanProject CityofKawarthaLakes February2012 Page 11
Figure 2-2: Location of Existing Operating Landfills in the City of Kawartha Lakes
2.1.2 Current Waste Generation and Diversion Rates
The waste diversion rate is a common measure of the performance of a municipality’s waste management system. In CKL, the City manages residential disposal and diversion activities and to a more limited extent some IC&I and C&D disposal and diversion activities.
2.1.2.1 2010 Residential
Waste Generation
and Diversion Rates
The City is responsible for providing waste management services to the residential sector. Waste collection, diversion and disposal programs are primarily delivered to the residential sector. The Provincial government, through WDO, has developed a funding mechanism to support residential diversion programs. In support of this funding program all municipalities are required annually to submit detailed tonnage and financial information regarding their residential waste management programs. WDO compiles and releases the residential waste generation and diversion rates for municipalities across the Province. The residential diversion rate is a common measure and comparator to other municipalities across Ontario. The most recent information provided by the City to WDO is for 2010. The 2010 GAP (generally accepted principles) residential rates for the City are as follows:
The residential waste diversion rate for the City is further broken down by individual diversion activities, as follows:
2.1.2.2 Total Waste Generation and Diversion Rates
In addition to managing residential waste, the City also provides some waste management services to the IC&I and C&D sectors. However, the City is not mandated to manage waste generated from these sectors. As such, IC&I and C&D waste management services are market driven and the IC&I and C&D sectors can obtain waste management services from the private
SolidWasteManagementMasterPlanUpdate MunicipalMasterPlanProject CityofKawarthaLakes February2012 Page 12
Residential Waste Generated 25,102 tonnes Residential Waste Disposed 14,120 tonnes Residential Waste Diverted 10,982 tonnes Residential Waste Diversion Rate 43.75%
Residential Deposit Return Program 1.85% Residential Reuse 0.00% Residential On Property (e.g. backyard composting, grasscycling, etc.) 5.76% Residential Recyclables 32.22% Residential Organics 3.04% Residential Special and Hazardous Waste 0.88% Total 43.75%
sector should they choose not to utilize municipal programs. With respect to measuring waste generation and diversion rates for the IC&I and C&D sectors, the majority of waste management services provided by the City are for disposal. There is minimal use of municipal waste diversion programs by the IC&I and C&D sectors. This is not to say that these sectors are not diverting waste, it is simply not managed by the City, and therefore not measured by the City. Future public education and various diversion programs should focus on this sector, and partnership with this sector, in order to maximize revenue sources for the City and justify various City-wide waste reduction initiative programs
The result is that an estimate of total waste managed by the City can be determined. The estimate is of waste collected, received, diverted and disposed by the City. However, it is not considered to be representative of total waste generated, diverted and disposed by all sectors in the City of Kawartha Lakes since waste diverted by the IC&I and C&D sectors may by-pass municipal programs and be sent to private processing facilities (either within or outside the City). Similarly, waste disposed could be collected by private haulers and taken to disposal facilities outside the City if supported by economic or other market factors. Without comprehensive waste audit information for IC&I and C&D facilities, there is no actual way of knowing the total waste generated, collected, diverted and disposed in the City.
The 2010 Financial Information Return (FIR) which is submitted to the Ministry of Municipal Affairs (MMA), provides information on total waste managed by the City. Based on the 2010 WDO submission related to residential waste, review of 2010 landfill disposal records and the 2010 FIR information related to total waste generated and disposal, Table 2-2 summarizes the total waste managed by CKL.
As indicated in Table 2-2, the IC&I and C&D diversion tonnage is 13 tonnes compared with 21,606 tonnes of IC&I and C&D waste disposed at City landfills. If the data from Table 2-2 was used to generate a total or City-wide waste diversion rate, the diversion rate would be only 19.3%, since non-City managed IC&I and C&D diversion activities are not captured.
SolidWasteManagementMasterPlanUpdate MunicipalMasterPlanProject
February2012 Page 13
CityofKawarthaLakes
Generated Disposed Diverted Management ResidentialCurbsideWasteDisposal 14,120t 14,120t 0 Landfill ResidentialSelf-haulWasteDisposal 5045t 5045t 0 Landfill ResidentialWasteDiverted 10,982t 0 10,982t Recycling&Composting I,CIWasteDisposal 8,267t 8,267t 0 Landfill C&DWasteDisposal 13,339t 13,339t 0 Landfill C&D/I,CIWaste Diverted 13t 0 13t Recycling OtherWaste(soilmunicipalworks disposal) 5195 5195 0 Landfill Total 56,961 45,966 10,995t
Table 2-2: Total Waste Management in the City of Kawartha Lakes in 2010 (Based on WDO Submission and CKL
Financial Information Return)
2.1.3 Waste Composition
In August 2005, the residual waste or ‘garbage’ of 120 households in the City was audited over a 3 day period. The households chosen for the audit were evenly divided between seasonal (Somerville), rural (Mariposa) and urban (Lindsay) (i.e. 40 of each). The results of the audit concluded that on average the residual waste stream consisted of only 18% non-divertible material with 51% being compostable, 29% recyclable and 2% being other divertible material.
In July 2006, in advance of the implementation of the SSO pilot project, waste and recycling audits were completed for 40 homes in the SSO pilot area (Fenelon Falls) – 20 from the rural area and 20 from the urban area. The audit was conducted on two consecutive weeks in order to include the waste/recycling from the container stream one week and the paper fibre stream the next week. Waste and recyclable materials were collected from the same households on both collection weeks. In total, 884.7 kg of waste was collected, with approximately 34% of that being from the recycling stream (i.e. 583.9 kg of residual waste and 300.8 kg of Blue/Green Box Material was audited). The results of the audit indicated that compostable material comprised nearly 51% of the residual waste stream and 33.5% of all materials collected (waste and recycling streams).
In November 2007, the City completed a waste audit as part of the SSO pilot project. Waste from 40 households (20 urban and 20 rural) in the Fenelon Falls community was collected and audited. In total 709.9 kg of waste was examined, 48% from the rural households and the remaining 52% from the urban households. The results of the waste audit indicated that 62% of the waste could be diverted. Furthermore, 39% of the total waste was comprised of material that could be composted. In general, the results of the audit indicated that waste diversion programs operate with varying degrees of success; with capture rates as follows: co-mingled container recycling program - 60%, paper fibre recycling program - 93%, and SSO pilot project - 55%.
2.1.4 Representative Waste Composition – Audits
Between 2005 and 2007 WDO’s Blue Box Program Plan directed Stewardship Ontario, through the Effectiveness and Efficiency (E&E) Fund, to complete a series of residential waste audits on single and multi-unit residential properties across the province. The goal of the audits was to develop estimates of waste generation rates for various waste and blue box material categories. A detailed categorization of these waste materials by Stewardship Ontario is included in Appendix A, along with the method by which the City manages those components of the material stream. The City was not audited during this period, however a number of other similar municipalities were. The results of Stewardship Ontario’s audits provide useful information on waste composition for use in the SWMMP Update. Audited municipalities that are similar in size and urban/rural characteristics to the City, and at the time of their audit did not offer a SSO collection and composting program, were identified and reviewed as they could provide an indication of waste composition similar to the City. Five municipalities were identified:
• North Glengarry – audited in 2005
• Simcoe County – audited in 2006
SolidWasteManagementMasterPlanUpdate MunicipalMasterPlanProject CityofKawarthaLakes February2012 Page 14
• City of Peterborough – audited in 2006
• Centre and South Hastings – audited in 2007
• District of Muskoka – audited in 2007
Each of the programs were audited by Stewardship Ontario four times over the year (winter, spring, summer and fall). Leaf & yard material was not included in the waste audits because it is seasonal in nature. In general, there was no significant difference between waste generation rates from season to season, with winter waste generation rates being only slightly less than the yearly averages. However, in the District of Muskoka winter waste generation rates were only 58% of the summer generation rates. Given that the sample size was only 100 households, and Muskoka has a high proportion of seasonal residents, it is reasonable to assume that seasonal households were included in the audit (i.e. living in Muskoka during the summer and living elsewhere during winter months). The results of these audits, presented in detail in Appendix B, represent a summation of the 4 audits completed on each program. Each individual audit was completed over a 2-week period and as discussed above included a sample of 100 households.
The Provincial waste audit results presented in Appendix B are consistent with the waste audits completed by the City of Kawartha Lakes in Fenelon Falls in 2006, prior to the implementation of the SSO pilot program as presented in Section 2.1.3 and summarized in Appendix B. Most importantly are the generation and disposal figures for household organics. The City’s audit found 51.1% organics in the residual waste stream and 33.8% of the overall curbside material stream. The results of the Stewardship Ontario waste audits for the five municipalities prior to SSO program implementation have organics ranging from 47.2% to 54.6% of the residual waste stream and 30.3% to 33.4% of ‘all streams’, which is consistent with the City’s results.
Since City-wide waste audits have not been undertaken, but the results from other programs are similar and consistent with the City’s audit for the Fenelon area, audit results presented in Appendix B are considered reasonable for use in the SWMMP Update.
All waste stream averages for the five Provincial waste audits and the Fenelon Falls localized waste audit are shown in Figure 2-3.
SolidWasteManagementMasterPlanUpdate MunicipalMasterPlanProject
February2012 Page 15
CityofKawarthaLakes
Average Waste Composition Based on the 5 Provincial Waste Audits for Single-Family Homes and the Fenelon Falls
2006 Waste Audit
Other Materials, 11.72%
Organics, 32.43%
HHW, 0.66%
Glass, 6.75%
Paper, 19.58%
Paper Packaging, 13.43%
Plastics, 11.37%
Metal, 4.08%
2.1.5 Industrial, Commercial & Institutional (IC&I) and Construction & Demolition (C&D) Waste
As noted on Table 2-2, 21,606 tonnes of IC&I and C&D waste managed by the City in 2010 was disposed. This does not represent the total IC&I and C&D waste generated in the City, as there are private sector companies that provide collection to the IC&I and C&D sectors that may utilize diversion or disposal facilities outside the City.
Similar to the residential waste stream, there is no specific waste audit data for the composition of the IC&I and C&D waste stream in the City. A report prepared for the Ontario Waste Management Association (OWMA), entitled ‘The Private Sector IC&I Waste Management System in Ontario’ (January 2005) indicates that approximately 85% of the IC&I and C&D waste stream in Ontario is IC&I waste and 15% is C&D waste. The OWMA report provides a breakdown of the composition of the typical IC&I and C&D waste stream. However, for CKL, the amount of C&D waste is higher than IC&I waste. In 2010, C&D waste accounted for 62% of the total
SolidWasteManagementMasterPlanUpdate MunicipalMasterPlanProject CityofKawarthaLakes February2012 Page 16
Figure 2-3: Average Waste Composition
IC&I and C&D waste disposal, while IC&I waste accounted for only 38%. Using the breakdowns, for each of the IC&I and C&D waste categories in the OWMA report and the quantity of IC&I and C&D waste disposed in 2010 in the City, Tables 2-3 and 2-4 provide an estimate of the quantity and composition of the IC&I and C&D waste streams in the City.
The estimated composition of the IC&I and C&D waste streams disposed in 2010 at City landfills indicate that paper, plastics, food waste, metals, glass and wood represent the major components of the waste stream.
2.1.6 Waste Generation Projections
To project future waste generation, disposal and diversion rates for the City, an assumed population of 100,000 in the year 2031 was utilized. This population projection is in accordance
SolidWasteManagementMasterPlanUpdate MunicipalMasterPlanProject CityofKawarthaLakes February2012 Page 17
MaterialType PercentofAvailableIC&I WasteStream AvailableIC&IWasteQuantity (tonnes) Paper 44.9 3,712 Glass 4.2 347 FerrousMetals 7.2 595 Non-FerrousMetals 4.6 380 Plastic 10.3 852 FoodWaste 11.4 942 Leaf&YardMaterials 1.6 132 Wood 7.8 645 Other 8.0 661 Total 100% 8,267
Table 2-3: Estimate of the Composition and Quantity of the IC&I Waste Stream Disposed in the City of Kawartha Lakes (2010)
MaterialType PercentofAvailableC&D WasteStream AvailableC&DWasteQuantity (tonnes) Wood 41.2 5496 Fill&Aggregate 13.3 1774 Steel 6.3 840 PortlandCementConcrete 5.2 694 Drywall 5.9 787 Asphalt 3.8 507 Brick 1.9 253 OldCorrugatedCardboard(OCC) 2.4 320 Plastic 1.8 240 Plaster 1.7 227 Shingles 2.3 307 ElectricalWire 0.6 80 ConstructionPaper 0.9 120 CeilingTiles 1.5 200 Non-FerrousMetals 0.4 53 Glass 1.7 227 Ceramics 0.2 27 Other 8.9 1187 Total 100% 13,339
Table 2-4: Estimate of the Composition and Quantity of the C&D Waste Stream Disposed in the City of Kawartha Lakes (2010)
with the results of the Growth Management Study. For the purpose of projecting waste generation and disposal rates under the current waste management system, an average residential diversion rate (2008 to 2010) of 41% and an annual population growth rate of 1.01% were utilized for the planning period. Table 2-5 projects total waste generation, disposal and diversion rates for the planning period using 2010 data as a baseline. Cumulative totals for the planning period are also included in the table. A more detailed projection, with annual data, based on 2010 baseline waste management rates is included in Appendix C. In addition, Appendix C includes projections for a scenario in which the City reaches and then maintains a residential waste diversion rate of 50% by 2015 and a scenario in which the City reaches and then maintains a residential waste diversion rate of 60% by 2015. Figure 2-4 graphically compares these three scenarios and shows the decrease in disposal requirements as diversion increases.
As noted in Appendix C, if the City continues at its current waste generation, disposal and diversion rates, approximately 1.09 million tonnes of waste will require disposal over the planning period (2012 to 2031). If the City can increase the residential diversion to 50%, then the amount of waste requiring disposal is estimated to decrease by approximately 50,000 tonnes over the planning period to approximately 1.04 million. If the City reaches 60% residential waste diversion, then the amount of waste requiring disposal is estimated to decrease by approximately 105,000 tonnes to approximately 986,000 tonnes.
The implications of achieving the 50% and 60% residential waste diversion targets are provided in this part of the SWMMP Update for comparison and information purposes. Based on the review of alternatives and the preferred alternatives to be implemented, the estimated diversion potential and implications for waste disposal requirements will be presented.
SolidWasteManagementMasterPlanUpdate MunicipalMasterPlanProject
February2012 Page 18
CityofKawarthaLakes
Year 2011 2016 2021 2026 2031 Total ForPlanning Period Population 77,472 82,577 88,018 93,818 100,000 N/A TotalWaste Generated 58,104t 61,932t 66,014t 70,364t 75,000t 1,332,325t TotalWaste Disposed 46,882t 50,721t 54,063t 57,626t 61,423t 1,091,141t Waste Measures TotalWaste Diverted 11,221t 11,211t 11,950t 12,738t 13,577 t 241,184t
Table 2-5: Current and Projected Total Waste Generation, Disposal, and Diversion Tonnages Based on Maintaining the Current Average (2008 to 2010) Residential Diversion Rate of 41% for the Planning Period (2012-2031)
2.1.7 Revenue and Expenditures
2010 revenue and revenue fund expenditures for the City are reported in the 2010 FIR. Waste management financial information is categorized by waste collection, waste disposal and recycling. In 2010, total revenue from grants, revenue from other municipalities and user fees/service charges was $4,187,719, which represented 47.9% of total revenue. The remaining revenue of $4,603,904 was generated through tax revenue, for total 2010 waste management revenue of $8, 818,623. Total expenditures equated the total revenue of $8,818,623. A complete breakdown of 2010 waste management revenue and expenditures is included in Appendix D. The cost of waste management services is compared with other similar municipalities in Section 3.0.
SolidWasteManagementMasterPlanUpdate MunicipalMasterPlanProject CityofKawarthaLakes February2012 Page 19
Figure 2-4: Projected Waste Disposal Rates for the City of Kawartha Lakes
3.0 DATA COLLECTION & ANALYSIS
3.1 Preliminary Municipality Review
Examining the waste management practices of other Ontario municipalities can provide useful information on program and facility alternatives, what has been successful and what has not, diversion programs, costs, etc. As part of the SWMMP Update a preliminary review of ten municipalities was completed. The ten municipalities were identified from the WDO Best Practices Report. The purpose of the preliminary review of the ten municipalities was to determine the municipality’s suitability for a more detailed evaluation. The intent of the preliminary review was to reduce the number of municipalities down to five for a more detailed review.
The results of this preliminary review are presented in two tables. Appendix E, Table E-1 compares CKL to the other selected municipalities by Region, Number of Households, Population, Area, and Residential Waste Diversion Rate. Appendix E, Table E-2 describes the current waste management system for each of the selected municipalities by Waste Stream, Recycling Stream, Organic Stream and General Practices in order to identify the most appropriate municipalities for further comparison and review.
3.1.1 Results the Preliminary Municipality Review
Based on the results of this preliminary municipality review the following five (5) municipalities were recommended for a more detailed evaluation. Municipalities recommended for detailed review were those for which it was determined that CKL had the greatest potential to obtain program information from based on factors such as higher diversion rates, unique approaches to waste management, similar demographics, etc. Comparable municipalities are analyzed in Section 3.3.
1. District Municipality of Muskoka
The District Municipality of Muskoka is similar in terms of land area, and like CKL, Muskoka has a large number of seasonal residents. Muskoka achieved a residential waste diversion rate of 49.90% in 2010 through a waste management system which includes every-other-week (EOW) waste collection during the off-season and a source separated organics (SSO) collection system in three (3) of its urban centres. Total waste management costs in 2010 were $13,891,620 of which 66.7% of revenues to account for these costs was from tax revenue.
2. Regional Municipality of Durham
The Regional Municipality of Durham borders to the west of CKL, and has a similar land area. Durham Region reached a residential waste diversion rate of 51.59% in 2010. Durham Region has implemented EOW waste collection and is undertaking a pilot program for the use of clear plastic bags for waste collection. Durham Region has weekly collection of SSO’s and prohibits the use of plastic bags in this stream. Durham Region is also partnering with York Region for disposal of the residual waste fraction after diversion and has obtained approval from MOE to
SolidWasteManagementMasterPlanUpdate MunicipalMasterPlanProject CityofKawarthaLakes February2012 Page 20
construct an energy from waste facility to dispose/process the waste. Total waste management costs in 2010 were $45,930,553 of which 56.9% of revenues to account for these costs was from tax revenue.
3. Restructured County of Oxford
The Restructured County of Oxford is located in southwest Ontario and includes the cities of Woodstock, Ingersoll and Tillsonburg. Oxford County has a similar demographic distribution in terms of urban centres and rural areas compared to CKL. Oxford County achieved a residential diversion rate of 54.09% in 2010 without a SSO collection program. This was in main part due to the user pay system for waste collection, whereby, all garbage bags are required to be tagged at $1.25 per tag. Total waste management costs in 2010 were $8,982,520 of which only 11.6% of revenues to account for these costs was from tax revenues. This is also, as noted above, due to the user pay system of bag tag requirement.
4. City of Sault Ste. Marie
The City of Sault Ste. Marie was able to increase its residential diversion rate from 9% in 2000 to 33.5% in 2006 through the use of a variety of diversion activities including education, a 2-stream recycling collection program and the bi-weekly collection of leaf and yard material. In 2010, the City’s residential waste diversion rate was 33.50%. Total waste management costs in 2010 were $5,793,565 of which only 28.2% of revenues to account for these costs was from tax revenues. Sault Ste. Marie has a similar population as CKL and has recently evaluated fully-automated waste collection. Although it was ultimately decided to continue with manual collection, Sault Ste. Marie’s evaluation process could provide useful information for the SWMMP Update. The City of Sault Ste. Marie has also undertaken an EFW pilot-program since 2007. However, MOE approvals for the facility lapsed in August 2011. The private firm who provides the proprietary EFW process plan to move forward with a full-size, working plant. The firm must negotiate a rate with Ontario Power Authority before moving forward.
5. The City of Ottawa
Although the residential waste diversion rate for the City of Ottawa was only 38.80% in 2010, the City has taken an aggressive approach towards waste management and waste diversion. This has included support for the recent completion of a ‘Waste-to-Energy’ demonstration project by a private firm, and the implementation of a City-wide SSO collection program that began in January 2010. The Ottawa City Council has approved a 20-year deal with a private firm who supply the proprietary EFW process. The waste-processing plant would take on 300 tonnes of municipal solid waste per day, however the deal is contingent on securing financing by 2013 and completing construction by 2016. The City has also implemented a “yellow-bag” waste collection system for the small IC&I sector.
SolidWasteManagementMasterPlanUpdate MunicipalMasterPlanProject CityofKawarthaLakes February2012 Page 21
Total waste management costs in 2010 were $72,576,335 of which only 9.3% of revenues to account for these costs was from tax revenues. The low amount attributable to taxes as a set “user fee” is applied equally to all residential units within the City. The City considers this a user fee, not a tax.
3.2 Detailed Municipality Review
Based on the results of the preliminary municipality review, a detailed evaluation of the five municipalities was undertaken. The methodology for the detailed evaluation involved reviewing information available about the municipality on their website, WDO 2010 Blue Box program results, 2010 FIRs and contacting the municipalities directly2 .
Results of the detailed evaluation for the five comparator municipalities are included in Appendix F-1 as well as the current comparable information for CKL. Detailed financial data for CKL and comparator municipalities in support of the detailed municipality review is included in Appendix F-2. Contact information for the comparator municipalities is included in Appendix F-3.
3.2.1 Results of the Detailed Municipality Review
3.2.1.1 General Observations
The results of the detailed municipality review indicated that municipalities across the Province have developed systems for the delivery of waste management services that reflect the unique characteristics of the municipality. General observations from the detailed municipality review made by UEM are as follows:
District Municipality of Muskoka
• Every-other-week waste collection can be successfully maintained year-round even if SSO collection is not provided during winter months (i.e. SSO collection May –November only)
• 2-stream recycling with weekly collection of both streams is feasible even in areas with a low population density
• Leaf & yard material collection may only be necessary in urban cores where on-site management is more difficult or not feasible
• Curbside collection on seasonal/private/unassumed roads can be limited to summer months only, especially if accessibility during winter months is an issue
SolidWasteManagementMasterPlanUpdate MunicipalMasterPlanProject CityofKawarthaLakes February2012 Page 22
2 UEM contacted by phone the individual listed as the contact person for the WDO Financial and Tonnage Datacall.ContactinformationisincludedasAppendixF-3.
Restructured County of Oxford
• User-pay for all bags/containers of waste set out is effective at increasing diversion even without implementing a SSO or leaf & yard material collection program
• The user pay system results in a significantly lower percentage of waste management costs being paid for through taxes (11.6%) compared to CKL (52.5%)
• The multi-unit residential, C&D and IC&I (at a reasonable scale) sectors can be included in municipal collection programs with no special provisions with a user-pay program because all waste must be tagged regardless of the source of generation
Regional Municipality of Durham
• EOW waste collection year round is feasible in conjunction with weekly SSO collection
• A study in Durham Region suggests that the use of clear bags for residual waste collection has the potential to increase total waste diversion by 3%
• Issues with every-other-week waste collection such as families with children in disposable diapers or families where a medical condition exists, can be overcome by providing additional tags for waste disposal
• MOE approvals for the EFW facility were received in June 2011 and construction began in August 2011. It is anticipated that the facility should be fully operational by the end of 2014. CKL should continue to monitor the Durham-York EFW facility and approach the municipality in coordination with MOE to assess the feasibility of the EFW facility accepting waste from CKL in the future.
City of Ottawa
• Bi-weekly collection of SSO materials is feasible during winter months to reduce costs associated with collection
• Bulky item collection can be combined with regular collection. Each bulky item may be considered as 1 bag/container. If the item can be loaded onto the regular collection vehicle it will be, otherwise the regular collection vehicle will radio for an additional crew to collect the item
• SSO collection may be feasible in high-rise and multi-unit residential properties. The City of Ottawa is addressing high-rise residential properties on a case-by-case basis. Waste Management staff visit each location to determine container requirements and obtain agreements from residents/landlords on what system/solution will work best.
• The ‘Yellow-Bag’ program is effective for servicing small stand alone businesses
• In Ottawa, a set fee for the management of residual waste is applied equally to all households across the City as opposed to a rate that varies by property assessment value. Recycling management is paid based on a percentage of the property tax assessment.
• Ottawa City Council have approved a 20-year agreement with a private firm who will
SolidWasteManagementMasterPlanUpdate MunicipalMasterPlanProject CityofKawarthaLakes February2012 Page 23
supply a proprietary thermal treatment process. The waste-processing plant would accept 300 tonnes of municipal solid waste per day, however the deal is contingent on securing financing by 2013 and completing construction by 2016. CKL should continue to monitor the City of Ottawa and the private company’s progress in establishing a successful commercially sized and economically viable facility, especially if CKL considers alternative disposal technologies in the future.
City of Sault Ste Marie
• Fully-automated waste collection of all materials is a technically feasible option even in cold-climate areas. Fully automated waste collection systems have been found to reduce collection staff injury, thus reducing costs. These systems also operate with a single driver/operator which can further reduce costs from two-person vehicle/operation systems.
• The City has had a pilot-EFW plant in operation since 2007. The private firm that operates the plant let their MOE approvals lapse in August of 2011 but have extended their lease with the City and still have a 5-year agreement to process the City’s waste. The firm has initiated negotiations for a rate to sell electricity to Ontario Power Authority in hopes of building a full-size working plant.
3.2.1.2 Specific Observations
Of specific interest is that CKL, in comparison to the five comparator municipalities, has the second highest rate of residential recyclables diverted3 (32.22%), but the lowest rate of residential organics diverted (3.04%) (see Appendix F-1). This indicates that the City’s current Blue Box program is performing effectively, and that City residents are responding to Blue Box program education and promotion initiatives. This assertion is supported through further comparison with the County of Northumberland, one of the City’s most demographically comparable neighbours. Northumberland has a residential recyclables diverted rate of 26.36%, utilizing the same MRF.
Durham Region, which has a weekly SSO collection program, has the highest residential organics diversion rate (21.68%).
Therefore, if CKL was able to achieve even a 15% residential organics diversion from the total waste stream, this increase alone would bring the City’s residential diversion rate to 56%, which would rank the City in the top five of total residential waste diversion in the Province.
3 TheDistrictMunicipalityofMuskokahasthehighestrateofrecyclablesdivertedat36.44%
SolidWasteManagementMasterPlanUpdate MunicipalMasterPlanProject CityofKawarthaLakes February2012 Page 24
3.2.1.3 Tipping Fees
A tipping fee is the charge levied on a given quantity of waste delivered to a waste management facility, usually calculated on a per-tonne basis. As part of the detailed municipality review landfill 2012 tipping fees for the comparator municipalities were determined. Overall tipping fees are as follows, with more a more detailed breakdown of the specific fees included in Appendix F-4
• Regional Municipality of Durham - $120.00/tonne
• District Municipality of Muskoka - $121.00/tonne
• City of Kawartha Lakes - $95.00/tonne
• City of Ottawa - $98.00/tonne
• City of Sault Ste. Marie $70.00/tonne
• Restructured County of Oxford - $64.12/tonne
The review of tipping fees indicates that tipping fees range from a low of $64.12/tonne in Oxford lows to a high of $121.00/tonne in Muskoka. The City of Kawartha Lakes, at $95/tonne is within the average of the five comparator municipalities.
3.3 Provincial Data Review
The purpose of the Provincial Data Review is to provide CKL with an overview of Provincial waste management data from sources such as WDO, the Ontario Municipal Benchmark Initiative (OMBI) and the Municipal Performance Measures Program (MPMP). CKL data obtained from these sources was compared to municipalities in CKL’s category and as well as other municipalities Province-wide. The Provincial Data Review also examined and evaluated the Effectiveness and Efficiency (E&E) rating.
3.3.1 Waste Diversion Ontario (WDO)
WDO is a non-crown corporation created under the Waste Diversion Act (WDA), 2002. The Act was passed with the stated purpose of promoting the reduction, reuse and recycling of waste and to provide for the development, implementation and operation of waste diversion programs (WDA, 2002, c.6, s.1). Specifically, WDO was created by Section 3 of the WDA to develop waste diversion programs for selected materials across the Province.
The WDA empowers the Minister of the Environment to designate a material for which a waste diversion program must be established. Once the material has been designated the Minister will request that WDO, in cooperation with an Industry Funding Organization (IFO), develop and submit a waste diversion program for approval.
3.3.1.1 Category Comparison
For the purpose of collecting data, categorizing and comparing statistics, CKL is classified as ‘Rural Regional’ by WDO. The 14 municipal Blue Box programs in this category include the: Bluewater Recycling Association, Bruce Area Solid Waste Recycling, Municipality of ChathamKent, City of Greater Sudbury, City of Kawartha Lakes, City of Kingston, District Municipality of Muskoka, County of Norfolk, City of North Bay, County of Northumberland, Restructured
SolidWasteManagementMasterPlanUpdate MunicipalMasterPlanProject CityofKawarthaLakes February2012 Page 25
County of Oxford, County of Peterborough, Quinte Waste Solutions and the County of Wellington. Relevant 2010 WDO derived statistics for the ‘Rural Regional’ Blue Box programs are presented in two summary tables below. Table 3-1 describes the demographics, tonnage, and diversion rates for the programs in 2010. It is important to note that this table identifies the Blue Box material marketed. The difference between waste generated and disposed is greater than the amount of Blue Box materials marketed as it accounts for SSO composting, leaf and yard material composting, an estimate for backyard composting and grasscycling, deposit return program estimate and other diversion activities reported by municipalities to WDO. Table 3-2 describes the financial and performance rates for the programs in 2010.
Note: for the purpose of this study, ‘Blue Box’ is intended to mean all recyclable materials collected in the program. ‘Blue Box’ includes blue boxes, grey boxes, containers, fibers etc.
Table 3-1: Demographics, Tonnage and Diversion Rates for ‘Rural Regional' Municipalities (2010)
When compared to the other programs in the ‘Rural Regional’ category, CKL’s 2010 residential diversion rate of 43.75% is above the category average (40.98%). This ranks CKL fourth out of the 14 municipalities in the Rural Regional category. Kawartha Lakes was also second among the 14 Rural Regional Municipalities with respect to recyclable materials diverted. The City had a diversion rate in 2010 for recyclable materials of 32.22% which was well above the average of 26.19% for these materials.
SolidWasteManagementMasterPlanUpdate MunicipalMasterPlanProject
Page 26
CityofKawarthaLakes February2012
Program Name Population including Seasonal Single Family Households Including Seasonal MutiResidential Households Residential Waste Generated (tonnes) Residential Waste Diverted (tonnes) Residential Diversion Rate4 Residential Blue Box Tonnes Marketed Kawartha Lakes 87,097 35,746 2,860 25,102 10,982 43.75% 6,078 Bluewater 151,811 68,449 0 35,043 13,892 39.64% 11,113 Bruce Area 63,304 32,914 0 13,376 4,262 31.86% 3,863 Chatham-Kent 108,192 47,197 0 47,701 15,072 31.60% 4,475 Sudbury 158,357 57,946 13,908 78,593 36,215 46.08% 13,797 Kingston 119,711 38,649 12,138 46,056 23,752 55.16% 8,887 Muskoka 72,239 44,827 2,570 23,862 11,907 49.90% 6,208 Norfolk 63,380 23,966 4,171 24,029 7,072 29.43% 4,202 North Bay 51,124 16,829 6,136 18,543 5,648 30.46% 3,528 Northumberland 84,843 37,740 0 27,300 16,401 39.92% 5,173 Oxford 102,756 43,687 5,908 39,131 21,165 54.09% 6,927 Peterborough County 63,215 34,269 10 23,684 9347 39.47% 4,749 Quinte Waste 142,908 60,922 2,471 46,552 19,391 41.66% 11,027 Wellington 93,636 31,862 0 22,165 9,019 40.69% 4,751 Average 40.98%
4 2010WDOGAPResidentialDiversionRate
When examining CKL’s data in comparison to other programs in the category, one of the most noteworthy observations is the cost to revenue ratio for Blue Box materials. Besides the Municipality of Chatham-Kent, CKL has the second highest cost to revenue ratio. This translates to only 6 cents revenue for every dollar spent on the Blue Box program. In contrast to this, the Quinte Waste Solutions program, which is privately operated, has the best cost to revenue ratio for the Rural Regional category. Quinte generates 33 cents revenue for every dollar spent according to 2010 WDO data.
The reason for this discrepancy in revenue versus cost was previously discussed in Section 2. The City does not directly process and market its own Blue Box materials. The recyclable materials are sent to the County of Northumberland MRF where a processing fee is paid and CKL receives a portion of the revenue. That portion is based on the commodity market and fluctuates based on changes in the market. This low/no revenue is in turn raising the net cost per tonne because gross revenue is not offsetting gross cost. An alternative is to consider other blue box material processing options. This should be done through an request for proposals (RFP) after the next collection contract is tendered.
Another important factor is the net cost/household/tonne marketed rate which was calculated to demonstrate the municipal costs associated with the Blue Box program in comparison to the population of the program-area. Again, because of low revenue, CKL has the highest cost/tonne/person rate. At $77.90 per household per tonne of recyclable material marketed, CKL is well above the category average of $43.40. Thus, when considering economies-of-scale, CKL has one of the highest net cost/household/tonne for all of the municipal Blue Box programs in the ‘Rural Regional’ category.
SolidWasteManagementMasterPlanUpdate MunicipalMasterPlanProject
February2012 Page 27
CityofKawarthaLakes
Program Name Total Gross Cost Total Gross Revenue Gross Cost to Revenu e Ratio Net Cost Net Cost per Tonne Total Number of Households Net Cost per Household per Tonne Kawartha Lakes $3,194,799 $187,512 17.04:1 $3,007,287 $494.77 38,606 $77.90 Bluewater $5,421,539 $1,528,291 3.55:1 $3,893,248 $350.34 68,449 $56.88 Bruce Area $1,394,404 $626,225 2.23:1 $768,179 $198.87 32,914 $23.34 Chatham-Kent $1,018,611 $5,714 178.27:1 $1,012,897 $226.35 47,197 $21.46 Sudbury $4,991,397 $813,338 6.14:1 $4,178,059 $302.83 71,854 $58.15 Kingston $3,081,530 $1,317,151 2.34:1 $1,764,379 $198.54 50,787 $34.74 Muskoka $3,258,749 $497,309 6.55:1 $2,761,440 $444.86 47,397 $58.26 Norfolk $1,995,989 $569,828 3.50:1 $1,426,161 $339.44 28,167 $50.63 North Bay $1,016,830 $451,243 2.25:1 $610,587 $160.32 22,965 $26.59 Northumberland $2,994,904 $759,562 3.94:1 $2,235,342 $391.27 37,740 $59.23 Oxford $2,168,828 $861,395 2.52:1 $1,307,433 $188.74 49,595 $26.36 Peterborough County $1,808,305 $604,480 2.99:1 $1,203,825 $253.49 34,279 $35.12 Quinte Waste $3,309,791 $1,569,145 2.11:1 $1,740,646 $157.85 63,393 $27.46 Wellington $1,983,765 $711,997 2.79:1 $1,271,768 $267.71 31,862 $39.91 Total/ Average $37,639,442 $10,503,190 3.58:1 $27,136,252 $283.96 625,205 $43.40
Table 3-2: Financial and Performance Rates for 'Rural Regional' Municipal Blue Box Programs (WDO 2010)
3.3.2 Municipal Performance Measures Program (MPMP)
The Municipal Performance Measures Program (MPMP) requires Ontario Municipalities to measure and report to taxpayers on service delivery. The program, which first began in 2000, currently includes 54 measures in 12 service areas. For the purpose of this study, the Solid Waste Management measures are considered. For CKL, the data collected by the program is useful for understanding current waste management services provided by the City as well as to predict future needs and costs. The most up to date MPMP data available is for 2010. Table 3-3 presents the 2009 and 2010 data for comparison.
SolidWasteManagementMasterPlanUpdate MunicipalMasterPlanProject CityofKawarthaLakes February2012 Page 28
ServiceArea Objective Performance Measure Variables 2009Result 2010Result CollectionCost $2,849,234 $2,850,312 TotalTonne Received 14,734 14,364 Garbage Collection Efficient Municipal Garbage Collection Service Operating Cost for Garbage Collection per Tonne CollectionCost perTonne $193.38 $198.43 DisposalCost $4,635,978 $3,142,626 Tonnes Disposed 45,778 49,692 Garbage Disposal Efficient Municipal Garbage Disposal Services Operating Cost for Solid Waste Disposal per Tonne DisposalCost perTonne $101.27 $63.24 DiversionCost $2,951,159 $2,825,685 Tonnes Diverted 9,989 9,512 SolidWaste Diversion Efficient MunicipalSolid WasteDiversion Service Operating Costs for Solid Waste (recycling) per Tonne DiversionCost perTonne $295.44 $297.07 OperatingCost $10,436,371 $8,818,623 TotalTonnes 55,767 59,204 SolidWaste Management EfficientSolid Waste Management Average Operating Costs for Solid Waste Management (collection, disposal, diversion) per Tonne OperatingCost perTonne $187.14 $148.95 Compliance MunicipalSolid WasteFacilities donothavean AdverseImpact onthe Environment NumberofDays perYearaMOE Compliance Order was in Effect Numberof Days 0 0
Table 3-3: Municipal Performance Measure Program (MPMP) - City of Kawartha Lakes (2009 & 2010)
3.3.3 Ontario Municipal Benchmark Initiative (OMBI)
The Ontario Municipal Benchmark Initiative (OMBI) is a data collection and analysis collaboration between the Chief Administrative Officer’s or City Managers of 15 Ontario Municipalities, which represent a total of 73% of the population of Ontario. By collecting, analyzing, and sharing data, OMBI allows for the improvement of municipal services and the establishment of operational best practices. OMBI represents a credible source of self-reported municipal data for comparison. The City is not a member of OMBI and does not use OMBI data to measure performance but can still benefit from the information generated by the uppertier and single-tier municipalities which are part of the initiative. Three of the 15 OMBI member municipalities (City of Ottawa, Durham Region and the District of Muskoka) were evaluated in detail as part of this SWMMP Update (See Section 3.2 – Detailed Municipality Review). The City of Greater Sudbury and District of Muskoka are also part of WDO’s “Rural Regional” category as discussed earlier in Section 3.3.1. The 15 member municipalities of OMBI include:
SolidWasteManagementMasterPlanUpdate MunicipalMasterPlanProject CityofKawarthaLakes February2012 Page 29 ServiceArea Objective Performance Measure Variables 2009Result 2010Result Numberof Waste Management Facilities Contextfor Compliance TotalNumberof Facilities TotalNumber ofFacilities 42 41 Numberof Complaints 322 410 Numberof Households 37,419 37,419 Complaints ImprovedLevel ofService Numberof complaints receivedinayear concerningthe collectionof solidwasteand recycled materials Complaintsper 1000households 8.605 10.957 Tonnesof ResidentialSolid WasteDiverted 9972 9,499 Tonnesof ResidentialSolid WasteDiverted andDisposed 30,567 33,144 Diversionof ResidentialSolid Waste MunicipalSolid WasteReduction ProgramsDivert Wastefrom Landfills Percentageof ResidentialSolid WasteDiverted forRecycling Residential DiversionRate 32.6% 28.7% TonnesofSolid WasteDiverted fromall propertyclasses 9,989 9512 TonnesofSolid WasteDiverted andDisposed fromall propertyclasses 55,767 59,204 Diversionof Residentialand IC&ISolid Waste Municipaland IC&ISolid WasteReduction ProgramsDivert Wastefrom Landfills Percentageof ResidentialSolid WasteDiverted forRecycling (basedon combined residentialand IC&Itonnages) TotalDiversion Rate 17.9% 16.1%
CityofKawarthaLakes
- City of Greater Sudbury
- City of Ottawa
- City of Windsor
- Regional Municipality of Durham
- Regional Municipality of Peel
- City of Hamilton - City of London
- City of Thunder Bay - City of Toronto
- Country of Brant
- Regional Municipality of Halton
- Regional Municipality of Waterloo
- District of Muskoka
- Regional Municipality of Niagara
- Regional Municipality of York
In general the concept of benchmarking is to establish a point of reference against which information may be measured or compared. In the case of OMBI, this involves the standardizing and comparing of municipal data with the intent of understanding driving factors and improving municipal services. The 2010 OMBI report discusses 22 service areas from child care to wastewater. For the purpose of this study, only the results pertaining to solid waste management were analyzed.
3.3.3.1 Overview of the OMBI Solid Waste Management Services
The services which OMBI classifies as solid waste management are the collection and disposal of garbage; collection, processing and sale of recyclable materials; collection and processing of leaf & yard material and SSO and the sale of compost generated from these materials; collection, reuse, and sale of municipal hazardous and special waste; community recycling and reuse centres; public awareness; and ‘user-pay’ programs for residential and commercial waste collection programs.
As discussed in Section 2.1, CKL is responsible for all of these services except for the processing and sale of recyclable materials.
3.3.3.2 OMBI Results and Comparison
The results presented in Table 3-4 compare the 2010 OBMI data to the 2010 MPMP data for CKL. The WDO residential diversion rate is also included for comparison. It can be noted that the MPMP and WDO residential diversion rates for the City differ significantly. OMBI and MPMP collect information on the same parameters and use the same methodology. Therefore, it is assumed that information generated is directly comparable. However, for the purposes of future waste management planning, the WDO figures which come from the very detailed annual Financial and Tonnage Datacall will be used.
SolidWasteManagementMasterPlanUpdate MunicipalMasterPlanProject
February2012 Page 30
(2010MPMPdata)
OperatingCostforAllStreamsofSolidWasteDisposalperTonne (InternalLandfill)
CityofKawarthaLake (2010MPMPdata) OMBI2010Median $63.24pertonne
OperatingCostforResidentialSolidWasteDiversionperTonne
CityofKawarthaLake (2010MPMPdata) OMBI2010Median $297.07pertonne
The results indicate that when compared to OMBI reporting municipalities, CKL has higher operating costs. A primary factor for this is that OMBI municipalities are by population some of the largest in the Province. In turn, they have high population densities and can take advantage of economies-of-scale. This is supported by the fact that the District of Muskoka, which is one of the most similar OMBI municipalities to CKL in terms of size and population density, is the only municipality to report comparably higher operating costs.
3.3.3.3 Issues Facing the Delivery of Solid Waste Management Services
Based on the review of municipally provided data, OMBI has identified a number of issues which are now, and will continue to be, prevalent in the delivery of solid waste management services. Although these issues were related to the 15 OMBI municipalities, these issues are also applicable to CKL and were be considered in the SWMMP Update. These issues are:
• The need to expand diversion programs to include multi-residential buildings and new material types
• The need to increase market demand and find purchasers for the increasing volume of recyclables
• The need for increased public awareness including the education and promotion of waste
SolidWasteManagementMasterPlanUpdate MunicipalMasterPlanProject CityofKawarthaLakes February2012 Page 31
CityofKawartha Lakes(2010MPMP) CityofKawartha Lakes(WDO)(2010) OMBI2010Median ProvincialWaste DiversionTarget 28.7% 43.75% 47% 60%
Table 3-4: Comparison of OMBI and MPMP Data for the City of Kawartha Lakes (2010) ResidentialWasteDiversionRate
$103pertonne
OperatingCostforResidentialGarbageCollectionperTonne
CityofKawarthaLake
OMBI2010Median $198.43pertonne
$64pertonne
$147pertonne
diversion programs and to clarify any confusion over the recyclability of ever changing consumer packaging
• The lack of regulation, especially concerning recycling programs for small commercial business
• Rising fuel costs which cannot be absorbed by limited budgets
3.3.4 Summary of Provincial Data Review
The summary and analysis of data at a Provincial scale compare the performance of CKL’s current waste management system with other municipalities within its category and Provincewide. The results of these evaluations indicate that the City has achieved a higher-than-average recycling diversion rate, yet receives lower-than-average revenue from marketed Blue Box program materials. However, the overall residential diversion rate is lower than average because the City does not divert SSO materials through a full scale program.
3.4 Review of Provincial Direction
The purpose of the review of Provincial direction is to provide the City an overview of Provincial direction in regard to waste management planning and waste diversion and consider the implications of this direction on the future solid waste management system in the City. This review includes an overview of Provincial guidelines and legislation which currently directs waste management planning and the development of waste management programs by municipalities; a discussion on Provincial initiatives in respect to waste management and diversion; an outline of Provincial initiatives developed through WDO, related to municipal hazardous or special waste, waste electrical and electronics equipment and used tires; and an overview and discussion of the draft Policy Statement on Waste Management Planning: Best Practices for Waste Managers with consideration to the implications for CKL.
3.4.1 Provincial Plans
There are two primary Provincial plans which affect the development of the SWMMP Update. The first, the Growth Plan for the Greater Golden Horseshoe, is regional, whereas the second, the Provincial Policy Statement, is Province-wide. In both cases these plans are intended to provide direction and guidance for planning initiatives in the Province. To comply with Provincial direction, CKL must abide by the recommendations made in these plans when planning for waste management.
3.4.1.1 Growth Plan for the Greater Golden Horseshoe
As described in Section 1.1, the Growth Plan for the Greater Golden Horseshoe (GGH), prepared by the Ministry of Public Infrastructure Renewal under the Places to Grow Act, 2005 is the framework for implementing the Province of Ontario’s plan for building better, more prosperous communities by better managing the growth in the GGH through the year 2031. The City of Kawartha Lakes is part of the GGH area as shown on Figure 3-1.
SolidWasteManagementMasterPlanUpdate MunicipalMasterPlanProject CityofKawarthaLakes February2012 Page 32
The Growth Plan is intended to be a guide for a range of planning issues including transportation, infrastructure and waste management.
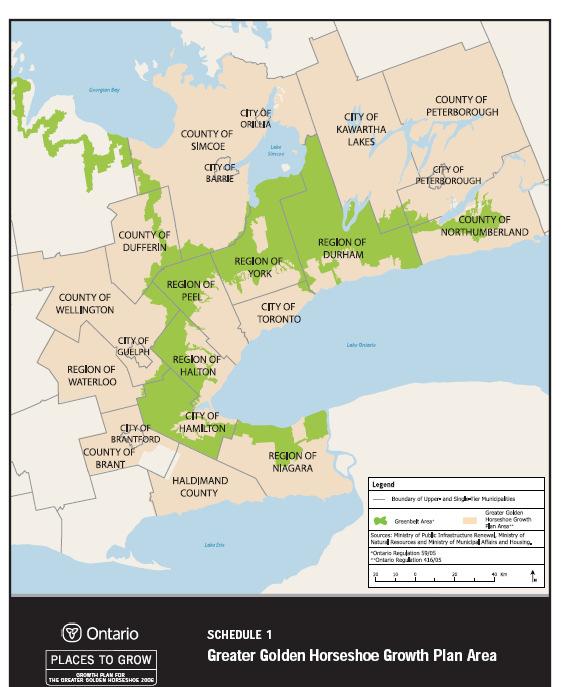
The recommendations for waste management are included in Section 4 of the Plan ‘Protecting What is Valuable’. Specifically in regards to waste management, the Growth Plan states that “Municipalities will develop and implement official plans and other strategies in support of….Integrated Waste Management including:
I. Enhanced waste reduction, composting, and recycling initiatives and the identification of new opportunities for source reduction, reuse and diversion where appropriate.
II. A comprehensive plan with integrated approaches to waste management, including reduction, reuse, recycling, composting, diversion and the disposal of residual waste.
III. Promotion of reuse and recycling of construction materials.
IV. Consideration of waste management initiatives within the context of long-term regional planning, and in collaboration with neighboring communities.”
SolidWasteManagementMasterPlanUpdate MunicipalMasterPlanProject CityofKawarthaLakes February2012 Page 33
Figure 3-1: The Greater Golden Horseshoe (GGH)
3.4.1.2 Provincial Policy Statement, 2005
The Provincial Policy Statement (PPS), 2005 provides policy direction on matters of provincial interest related to land use planning and development. The intent of the PPS is to guide development while protecting resources, public health and safety and the quality of the natural environment. The PPS was issued under the authority of Section 3 of the Planning Act, which requires that decisions affecting planning matters ‘shall be consistent’ with Policy’s made under the Act.
With respect to waste management planning, Section 1.2 of the PPS requires that a coordinated, integrated, and comprehensive approach should be used when dealing with planning matters within municipalities or that cross boundaries, this includes waste management systems. Furthermore, Section 1.6.8 of the PPS, (Infrastructure and Public Services Section) states that:
• Waste management systems need to be provided that are of an appropriate size and type to accommodate present and future requirements, and the systems need to facilitate, encourage, and promote reduction, reuse, and recycling objectives; and that
• Waste management systems shall be located and designed in accordance with Provincial legislation and standards.
3.4.2 Provincial Legislation
Waste management and waste diversion to varying extents are regulated and mandated by all levels of government. However, the primary source of waste management legislation is from the Provincial-level. In general, in Ontario, residential waste management is mandated by the Province and carried out by local municipalities, while the IC&I sector is individually responsible for complying with waste management regulations - dependent on their size and the type of their operation. Listed below is a summary of Provincial legislation which mandates various aspects of waste management and diversion for both the residential and IC&I sectors.
3.4.2.1
a. O. Reg. 101/07 - Waste Management Projects - requires that public and private sector waste management projects are equally subject to the requirements of the Environmental Assessment Act (EAA). The regulation designates certain waste management projects, exempts others, and exempts certain projects if they successfully complete the Environmental Screening Process. The level of assessment for each category is dependent on the anticipated environmental effects. O. Reg. 101/07 provides municipalities the ability to follow an Environmental Screening Process to establish or expand landfills with a certain disposal capacity. The capacity limitations include: expanding an existing landfill such that total capacity is not greater than 100,000 m3 or establishing a new landfill between 40,000m3 and 100,000m3
3.4.2.2 Environmental Protection Act R.S.O. 1990, c. E.19
SolidWasteManagementMasterPlanUpdate MunicipalMasterPlanProject CityofKawarthaLakes February2012 Page 34
Environmental Assessment Act, 1990, R.S.O. 1990, c. E. 18
a. O. Reg. 101/94 – Recycling and Composting of Municipal Waste - requires that all municipalities with a population of more than 5,000 provide a residential recycling program. Basic Blue Box Materials are defined as newsprint and food and beverage containers made from aluminum, steel, polyethylene terephthalate (PET), or glass. Supplemental Blue Box materials include aluminum foil, fine paper, textiles and magazines. The regulation prescribes that municipal Blue Box systems are required to collect the basic materials, plus at least two supplemental materials.
b. O. Reg. 102/94 - Waste Audits and Waste Reduction Work Plans – requires that designated waste generators from the IC&I sector conduct waste audits and prepare and implement waste reduction work plans.
c. O. Reg. 103/94 - Industrial, Commercial and Institutional (IC&I) Source Separation Programs - requires large establishments in the IC&I sector to set up facilities for the separate collection and removal of commonly recycled materials such as fine paper, newspaper, cardboard, wood, glass, plastic, aluminum, and steel.
d. O. Reg. 104/94 – Packaging Audits and Packaging Reduction Work Plans – requires manufacturers and importers in the food and beverage sector, the paper and allied products sector, and the chemical and chemical products sectors to conduct audits of packaging practices and prepare and implement waste reduction work plans.
e. O. Reg. 105/94 General Waste Management Amendment Regulations
f. O. Reg. 232/98 Landfilling Sites – applies to all municipal landfills which come into existence, are altered, are expanded, or are enlarged on or after August 1st, 1998. The regulation applies if the landfill or the landfill expansion is to have a total waste disposal volume of more than 40,000 cubic metres.
g. O. Reg. 347, R.R.O 1990. – General-Waste Management – prescribes direction on general waste management issues, waste disposal and hazardous waste management.
3.4.2.3 Waste Diversion Act, 2002, S.O. 2002, c. 6
a. O. Reg. 273/02 – Blue Box Waste - defines Blue Box waste as glass, metal, paper, plastic and textiles. Stewards are expected to comply with this regulation by paying a fee based on how much waste the steward generates for each of these materials. Municipalities will continue to collect Blue Box materials as defined under O. Reg. 101/94.
b. O. Reg. 393/04 – Waste Electrical and Electronic Equipment – designates waste electrical and electronic equipment (WEEE) providing the Minister the authority to require a diversion program.
c. O. Reg. 542/06 – Municipal Hazardous or Special Waste – designates municipal hazardous or special waste (MHSW) providing the Minister with the authority to
SolidWasteManagementMasterPlanUpdate MunicipalMasterPlanProject CityofKawarthaLakes February2012 Page 35
require a diversion program.
d. O.Reg. 84/03 – Used Tires – designates used tires providing the Minister with the authority to require a diversion program.
3.4.2.4 Planning Act, 1990, R.S.O. 1990, CHAPTER P.13
States that municipalities, when carrying out their responsibilities under the Act, shall have regard to matters of Provincial interest including the provision of waste management systems and the minimization of waste.
3.4.2.5 Municipal Act, 2001, S.O 2001, c. 25
Section 11(1) and Section 391 (1) authorizes a municipality to pass waste management by-laws and to impose fees and charges related to the provision of waste management services.
a. Corporation of the City of Kawartha Lakes Consolidated By-law No. 2007-024
– A by-Law Dealing with the Collection, Removal and Disposal of Solid Waste within the City of Kawartha Lakes – Consolidated as of June 19th, 2009. Originally passed in 2007 this by-law regulates the collection, removal and disposal of solid waste as per the authority granted to the City by the Municipal Act, 2001. The by-law outlines what collection and removal responsibilities the City has (Section 2.05), customer responsibilities for the preparation and setting out of waste (Section 3 & 4), the tipping at waste disposal sites (Section 7), and fees (Section 8). The schedules attached to the by-law are approved containers (‘A’), bulky items (‘B’), streets to be collected as downtown business sectors (‘C’), recyclable materials (‘D’), prohibited waste (‘E’), leaf and yard material (‘F’), solid waste tipping fees (‘G’), landfill hours of operation (‘H’), collection requirements (‘I’), guidelines for collection on private, seasonal and unassumed roads (‘J’), exemptions from tipping (‘K’) and procedures for receipt of contaminated soil (‘L’).
3.4.3 Provincial Initiatives
It is estimated that Ontarians generate more than 12 million tonnes of waste per year, of which almost 80% is disposed. Of the 10 million tonnes which are disposed, 6 million tonnes are disposed within the Province, with landfilling representing 5.88 million tonnes. Province-wide only 22% of total waste is diverted from disposal, with the residential diversion rate at 39% and the IC&I diversion rate at 12%.5
In response to this, the Province has developed and implemented a number of initiatives in support of waste diversion. The primary Provincial-lead initiative is the 60% waste diversion goal, although this goal was simply intended to be a target and was never formally adopted into legislation. The origins and details of this goal are discussed in further detail below. Although the 5
SolidWasteManagementMasterPlanUpdate MunicipalMasterPlanProject CityofKawarthaLakes February2012 Page 36
FromWastetoWorth:TheRoleofWasteDiversionintheGreenEconomy(October2009)
goal was set in 2004 with a 2008 timeline to reach 60%, Province-wide the target was not met. However, it remains the Province-wide goal/target for waste diversion. More recently the Ministry of the Environment (MOE) completed a review of the Waste Diversion Act (2002). As a result, a number changes to Ontario’s waste management framework have been proposed. The Continuous Improvement Fund (CIF) was established and is a direct mechanism which the Province uses to support waste management initiatives. The CIF, which operates through WDO, is the successor to the E&E Fund and provides funding for the improvement of municipal Blue Box programs.
3.4.3.1 Ontario’s 60% Waste Diversion Goal
In 2004, MOE set a goal of diverting 60% of Ontario’s waste from disposal by the end 2008. Although Province-wide this goal was not met, significant progress was made and 60% remains the current Provincial waste diversion target/goal for municipalities in Ontario. As noted, the 60% target was not formally adopted by legislation but is intended for guidance purposes only.
On June 12th, 2004, MOE released a Discussion Paper with the intent of obtaining input towards reaching the 60% target. As part of this discussion paper a number of ‘Potential Action Items’ were put forth for consideration by the consultation panels. These items were examples of actions that could be part of a Province-wide diversion strategy. Although slightly dated (2004), and intended for a Provincial-wide strategy, many of the ‘Potential Action Items’ are applicable for consideration in the SWMMP Update. The items relevant to the current systems in place in CKL include:
A. Set Waste Diversion Objectives and Targets
a. Set mandatory waste diversion targets for all sectors.
b. Require public reporting of waste diversion rates by certain business.
c. Review and enforce more consistently diversion regulations for IC&I sectors.
B. Residential Waste Diversion: Accelerating Centralized Composting
a. Continue to support and encourage backyard composting.
b. Implement increased residential organic waste collection and centralized composting.
C. Examine a Number of Financing Strategies for Waste Diversion
a. User pay.
b. Provincial funding.
c. Municipal financing through borrowing.
d. Private sector investment.
e. Revenues from new markets for recycled materials.
SolidWasteManagementMasterPlanUpdate MunicipalMasterPlanProject CityofKawarthaLakes February2012 Page 37
D. Industrial, Commercial, and Institutional (IC&I) Waste Diversion
a. Require the largest waste generators to publicly report their waste diversion rates.
b. Phase in public reporting of waste diversion by waste generators on a sector-bysector basis.
c. Provide training to small businesses to help them increase their waste diversion rates.
E. Ban Organics and Recyclables from Disposal
F. Reducing Packaging and Increase the Recycled Content in Products and Packaging.
a. Work with other levels of government to improve programs designed to reduce packing and increase recycled content.
b. Disseminate information on best practices in packaging reduction, reuse, and recycling.
G. Provincial-wide Monitoring Systems for Waste
a. Require all sectors to collect and report waste statistics to Provincial-wide data collection systems such WDO, MPMP, and OMBI.
3.4.3.2 From Waste to Worth: The Role of Waste Diversion in the Green Economy
In October 2008 MOE began the review of Ontario’s Waste Diversion Act (WDA) (2002) and launched a public consultation process to obtain input on increasing the Province’s waste diversion rate and to explore the use of extended producer responsibility (EPR) as a driver for the Province to reach its waste diversion goals.
In October 2009 the results of the WDA review were released in a report entitled From Waste to Worth: The Role of Waste Diversion in the Green Economy – Ministers Report of the Waste Diversion Act (2002) Review. As a result of the review and consultation process a number of proposed changes to Ontario’s waste diversion framework have been set forth that impact the SWMMP Update, including:
• Outcomes-Based Individual Producer Responsibility
o This involves making individual producers fully responsible for meeting waste diversion requirements for waste discarded in both the residential and IC&I sectors.
o Allowing individual producers to meet waste diversion requirements either by joining a materials management scheme or by developing their own individual waste diversion plan.
SolidWasteManagementMasterPlanUpdate MunicipalMasterPlanProject CityofKawarthaLakes February2012 Page 38
• Clarifying the Concept of Diversion
o To allow a wider range of processes and technologies to be used to meet diversion requirements, while encouraging innovation. For example, this would include expanding the definition of diversion to include the material value recovered and preserved from all processes and technologies. However it is important to note that incineration or burning of waste with no material recovery would remain excluded from the definition of diversion.
• A Long-Term Schedule for Diversion
o Material-specific collection and diversion targets for both residential and IC&I sectors.
• Effective Oversight
o Clearly articulating the roles of the MOE, WDO and IFOs in diversion activities and programs.
• Supporting Producer Responsibility
o Although the shift towards producer responsibility is a significant waste management milestone, it alone is insufficient to meet Ontario’s diversion targets. Producer responsibility needs to be supported by other financial initiatives. There is a significant gap in disposal costs versus diversion costs in Ontario (i.e. waste disposal costs average $58-$75 per tonne while the average net cost to divert Blue Box materials is in the order of $150-$180 per tonne). To address this, there has been discussion at the Provincial policy level that a disposal levy (i.e. surcharge) be placed on each tonne of waste disposed. Disposal levies are already in place in Quebec, in some jurisdictions in the United States and throughout the United Kingdom and the European Union. Quebec continues to evaluate the advantages of using disposal levies to support waste diversion initiatives. It is considered that a disposal levy will narrow the gap between the cost of disposal and the cost of diversion, shift the behaviour of waste generators, and further help the Province to meet its diversion targets. Disposal levy revenue can further support and finance waste diversion programs and activities. On a local level, some municipalities increase tipping fees beyond that required strictly for disposal with the additional revenue directed to diversion programs. In the UK and EU, disposal levies are placed on “unprocessed” waste going into landfills. The disposal levies have decreased the gap between landfill disposal costs and alternative technologies. As such, disposal levies have resulted in a greater number of alternative disposal technologies being developed and implemented in the UK and EU.
SolidWasteManagementMasterPlanUpdate MunicipalMasterPlanProject CityofKawarthaLakes February2012 Page 39
• Transitioning Existing Programs
o Setting phased end dates for each existing program with corresponding milestones to move existing programs to the proposed new framework.
3.4.3.3 Guidelines for Composting Facilities and Compost Use in Ontario
In November 2009, MOE released the DRAFT: For Consultation Purposes Only, Guideline for Composting Facilities and Compost Use in Ontario. The revised Guideline for anaerobic composting of waste materials also includes proposed regulation changes. The guideline which includes best management practices and guidance for compost facilities and municipal waste managers is proposed to replace the Interim Guidelines for the Production and Use of Aerobic Compost in Ontario (November 1991, updated 2004). The revised guideline reflects current legislation, industry standards, good management practices and advances in technology and science. A major component of the revised guideline is the introduction of three categories of compost quality (AA, A, and B).
The intention of the document is to assist with the siting, design and approval of composting facilities as well as to aid in the production of high-quality compost material. The guideline applies to the aerobic composting of non-hazardous organic materials for the purpose of producing a product with the intended use as a soil enhancer or conditioner. The guideline is important as the SWMMP Update is considering the implementation of full-scale SSO collection and composting.
The Guideline is divided into three parts, plus supporting appendices:
Part I
• Introductory information and an overview of the current legislative framework:
o Includes an overview of environmental legislation and regulations as they relate to composting activities: Environmental Protection Act (EPA), R.S.O. 1990, c. E.19; Regulation 347 – General Waste Management; Ontario Water Resources Act (OWRA), R.S.O 1990, c. O.40; Nutrient Management Act (NMA), 2002, S.O. 2002, c. 4; Clean Water Act (CWA), 2006, S.O. 2006, c. 22; Environmental Assessment Act (EAA), R.S.O 1990, c. E.18; Environmental Bill of Rights (EBR) 1993, S.O. 1993, c. 28.
Part II
• Sets out standards for composting facilities, including:
o Criteria for finished compost quality
o Restrictions for the use of each category of compost:
• AA – can be used directly in gardens or with plants, does not require a C. of A. for use or transport, exempt from the Part V approval requirements of the EPA and Regulation 347
SolidWasteManagementMasterPlanUpdate MunicipalMasterPlanProject CityofKawarthaLakes February2012 Page 40
• A – must be mixed with soil, does not require a C. of A. for use or transport, exempt from the Part V approval requirements of the EPA and Regulation 347, must be applied by the end user in accordance with the application rate restrictions
• B – suitable only for organic soil conditioning, agricultural applications, blending, and landfill daily cover, not suitable for residential or recreational applications, its use and transportation would continue to require government approval
o Requirements for composting facilities
o Requirements for feedstock and compost sampling
o Laboratory analysis requirements
Part III
• Provides guidance to Facility Operators including best management practices in the following areas:
o Site selection considerations
o Site design considerations
o Composting unit operations
o Health and safety
o Sewage/wastewater management
o Odour prevention and control
o Prevention and control of potential adverse effects
3.4.3.4 Continuous Improvement Fund
The Continuous Improvement Fund (CIF) was created to provide funding in support of projects and programs that increase cost effectiveness, increase diversion, and/or increase the performance of Ontario’s residential Blue Box programs. The CIF aims to maximize the efficiency of both individual municipal recycling programs and Blue Box recycling systems as a whole by identifying and applying ‘best practices’ and preferred approaches.
Municipalities can apply for and receive between 25% to 100% of the cost for capital and noncapital projects in the areas of best practices, innovation, emerging technology and communication. Of the 2009 budget of over $25M, 70% of the funding will go towards increasing efficiency (lowering cost) and 30% will go towards increasing effectiveness (increasing Blue Box capture).
Examples of projects described in the Continuous Improvement Fund 3-year Strategic Plan which could potentially apply to the City include:
• Training on tendering and contracting
• Compaction of materials during collection
• Projects designed to pool resources at a regional level (e.g. regional processing arrangements for eastern Ontario, etc.)
SolidWasteManagementMasterPlanUpdate MunicipalMasterPlanProject CityofKawarthaLakes February2012 Page 41
• Increasing the performance of multi-family recycling programs through financial incentives, outreach and technology
• Enhancing plastics market capacity (e.g. shared plastics recycling facility for the Greater Toronto Area (GTA) and surrounding area, etc.)
• Applying new technologies to address specific systemic challenges
• Training, education and knowledge sharing initiatives that aim to better educate and engage municipalities, stewards and/or consumers
In accordance with the principles of the fund, the CIF states that applications are more likely to receive approval and funding if they present a good business case that will lead to outcomes that include:
• Increased effectiveness and efficiency of the municipal blue box program
• Increased diversion of recyclable materials
• A transferability to other municipalities
• The ability to handle a changing mix of materials
• A definition and adoption of best practices
The application process for the fund is available through the CIF website at http://www.wdo.ca/cif/applications.html
In 2011, the City was successful with four applications to the CIF. Projects included:
• Multi-Residential Best Practices- Increase Existing Materials, $19,850
• Blue Box Material Transfer Facility, $432,732
• Polystyrene Densifier, $75,050
• Development of a Waste Recycling Strategy, $15,000
CKL is proceeding forward with all of the CIF approved projects except the polystyrene densifier.
Based on the results of the SWMMP Update, the City may be able to apply for further funding from CIF to implement improvements proposed to the municipal Blue Box program which would satisfy any of the criteria listed above.
3.4.3.5 CIF Project 240 – Guideline for Preparing a Municipal Waste Recycling Strategy (WRS)
The guideline for preparing a Waste Recycling Strategy (WRS) is one of several tools that the CIF has developed to enable Municipal Waste Managers to create locally-appropriate and sustainable solutions to manage recyclables.
The CIF’s WRS guideline aligns with WDO’s best practice requirements. The WRS guideline and template document are designed specifically to meet Provincial expectations for waste recycling planning as identified in the best practice section of the WDO Municipal Datacall.
SolidWasteManagementMasterPlanUpdate MunicipalMasterPlanProject CityofKawarthaLakes February2012 Page 42
Communities that put in place a WRS or plan can increase (or maintain) the portion of their annual WDO funding, which is linked with this measure. Those who don’t will have their funding reduced.
In addition to developing a guideline for preparing a WRS, the CIF has developed a series of worksheets for Municipal Waste Managers to utilize to simplify the process and ensure conformance with WDO’s best practice requirements.
In recognition of the importance of a Municipal WRS the City of Kawartha Lakes applied to CIF and received funding to complete the project. A public consultation program was undertaken and a draft WRS is complete.
3.4.4 Designated Materials
3.4.4.1 The Municipal Hazardous or Special Waste (MHSW) Program Plan
On December 11th, 2006 the Minister of the Environment filed Ontario Regulation 542/06 under the Waste Diversion Act. The purpose of O.Reg. 542/06 was to designate Municipal Hazardous or Special Waste (MHSW)6. Upon the designation of a material, the Minister is empowered by the WDA to have WDO develop a program for the diversion of the designated material. The MHSW Program Plan is such a plan.
The Final Consolidated Municipal Hazardous or Special Waste Program Plan (July 30th, 2009), is designed to improve diversion by reducing, reusing, and recycling MHSW in Ontario. The five-year Plan outlines opportunities to improve access to MHSW collection services across the Province. The categories of materials included under the MHSW Program Plan are as follows:
• Aerosols
• Antifreeze
• Batteries – Industrial Stationary and Non-Lead Acid Motive
• Corrosives
• Fertilizers
• Fire Extinguishers (Portable)
• Flammables – User-Removed
• Fluorescents – Embedded in Designated EEE
• Leachates
• Oil Containers
• Oil Filters
6 Municipal Hazardous or Special Waste (MHSW) is used interchangeably with Household Hazardous Waste (HHW)inthisSWMMPUpdate.
SolidWasteManagementMasterPlanUpdate MunicipalMasterPlanProject CityofKawarthaLakes February2012 Page 43
• Paint & Coatings
• Pesticides, Fungicides and/or Herbicides
• Pharmaceuticals
• Pressurized Containers – Non-Refillables
• Pressurized Containers – Refillable
• Reactives
• Sharps and Syringes
• Toxics
Unlike Blue Box materials, municipalities are not legally required to collect MHSW and are not required to do so under this Plan. If the expansion of existing services or the addition of new services is required to meet accessibility targets outlined in the Plan, including new collection services, this will also be funded by industry stewards upon approval by Stewardship Ontario. The Plan also includes funding for MOE to enforce the Plan as well as provisions for the promotion and education of the Plan.
One of the objectives of the MHSW Plan is to double accessibility to the MHSW programs. This has implications to the SWMMP Update.
The MHSW program benefits the City by providing financial compensation for a program which is already being offered. Further, the MHSW program supports residential and to some extent, IC&I diversion, which corresponds with one of the primary goals of this SWMMP Update.
3.4.4.2 The Waste Electrical & Electronic Equipment (WEEE) Program Plan
On December 14th, 2004 the Minister of the Environment filed Ontario Regulation 393/04 under the Waste Diversion Act. The purpose of O.Reg. 393/04 was to designate Waste Electrical & Electronic Equipment (WEEE). As previously discussed, upon the designation of a material, the Minister is empowered under the WDA to have WDO develop a program for the diversion of the designated material. The WEEE Program Plan is such a plan.
The purpose of the Program is to provide convenient opportunities for individual consumers and businesses to reuse and recycle used electronic equipment. To achieve this objective, financial incentives will be provided for organizations that collect, transport and process WEEE in a manner that will capture as much WEEE as possible for reuse and recycling. The Program is to be supported by an extensive promotion and education program.
On July 10th, 2009 a Final Revised (Phases 1 and Phase 2) Waste Electrical and Electronic Equipment (WEEE) Program Plan was released by the Ontario Electronic Stewardship (OES) which includes Phase-1 and Phase-2 materials which are eligible for inclusion in the WEEE program. These materials are presented in Table 3-5 below:
SolidWasteManagementMasterPlanUpdate MunicipalMasterPlanProject CityofKawarthaLakes February2012 Page 44
Table 3-5: Materials Included in Phase-1 and Phase-2 of the WEEE Program
Category Equipment
DisplayDevices
DesktopComputers
PortableComputers
ComputerPeripherals
Printers&Copiers
Telephone&AnsweringMachines
CellularDevices
Image,Audio&VideoDevices
TV (CRT, Plasma, LCD, Rear Projection), Monitors (CRT, Plasma, LCD)
Computer Terminals, Microcomputer, Minicomputers, Personal Computers
Laptops,Notebooks,Notepads
CDRomDrive,DiskDrive,Keyboards,Mouse,Modems
Copiers,Printers,Scanners,Typewriters,FaxMachines
Wired Telephone, Cordless Telephones, Telephone Answering Machines
CellPhones,Pagers,PersonalDigitalAssistants(PDA’s)
Handheld Computers, non-cellular PDA’s, Amplifiers, AudioPlayers, AudioRecorders,Cameras,Equalizers,Pre-amplifiers,Radios,Speakers, Receivers,Tuners,Turntables,VideoProjectors,VideoRecorders.
The WEEE program operates by providing a financial incentive of $165 per tonne to all registered collection locations for materials listed above which have been collected and prepared for transport. Both residential and IC&I materials are eligible for the program. OES is responsible for, and funds the collection of the designated materials.
The City is able to benefit from this program by continuing to collect the designated materials at all landfill locations and have them collected by OES. However, CKL uses a different collection and transportation model, the Processor Incentive Program and receives $150 per tonne plus transportation from OES.
3.4.4.3 Used Tires Program Plan
In March 2003 the Minister of the Environment filed Ontario Regulation 84/03 under the Waste Diversion Act. The purpose of O.Reg. 84/03 was to designate used tires. As previously discussed, upon the designation of a material, the Minister is empowered by the WDA to have WDO develop a program for the diversion of the designated material. The Used Tires Program Plan is such a plan.
The purpose of the Used Tires Program Plan (approved by the Minister of the Environment, April 8th, 2009) is to present a plan for the diversion of used tires generated within Ontario as well as a plan for the management of existing scrap tire stockpiles.
The Program Plan has been broken down into 6 primary elements:
• Used Tire Reduction Activities:
o Promotion and education activities centered around proper maintenance of tires to maximize their lifespan
• Used Tire Collection:
o Continued collection of on-road tires and further collection into the collection of off-road ties
o Under the Program the existing consolidation and storage capacity will be leveraged to support efforts to even out the seasonality of the flow of scrap tires.
SolidWasteManagementMasterPlanUpdate MunicipalMasterPlanProject
February2012 Page 45
CityofKawarthaLakes
• Used Tire Transportation:
o The existing relationship between haulers and collectors will continue
o Ontario Tire Stewardship (OTS) will pay incentives to haulers where collection is not economically feasible
• Scrap Tire Processing:
o Reuse and retreading when possible (used tires must meet strict minimum standards to ensure safety)
o OTS plans to encourage new recycling programs so that registered processors can convert scrap tires into marketable materials
• Stockpile Abatement:
o The plan to manage each stockpile will be determined based on individual characteristics (e.g. age, quantity, quality, location, etc.)
• Stakeholder Engagement/Consultation:
o Collectors, Haulers, Processors, Consumers, Non-Government Organizations (NGO’s) and Non-collector Municipalities
The City should continue to promote of used tire recycling and the drop-off of used tires at City landfills to support proper management and disposal
3.4.5 Policy Statement on Waste Management Planning: Best Practices for Waste Managers
On June 12th, 2007, MOE released the draft Policy Statement on Waste Management Planning: Best Practices for Waste Managers. The Policy statement has yet to be approved by the Province, however the information presented in the report is useful for consideration in the SWMMP Update. If passed, municipalities will be required to develop 20-25 year waste management plans. The purpose of the draft Policy Statement is to articulate the Province’s expectations for waste management in Ontario, to outline a framework and principles for decision-making by all waste managers, and to provide specific direction to guide the development of long-term municipal waste management plans.
Specifically, the draft Policy Statement sets out best management practices for the management of waste and the creation of waste management plans.
The draft Policy Statement was developed to address waste management deficiencies previously identified by both the Provincial Policy Statement (2005) and the Growth Plan for the Greater Golden Horseshoe (2006). Particularly, the draft Policy Statement was developed in response to these waste management issues facing the province:
• Ontario cannot sufficiently manage all waste generated
• Progress on waste diversion is slow
SolidWasteManagementMasterPlanUpdate MunicipalMasterPlanProject CityofKawarthaLakes February2012 Page 46
• Existing public and private waste management infrastructure are under great pressure to handle increasing quantities of waste
• Waste is being exported out of Ontario for management
3.4.6 Summary of Provincial Direction Review
The Province of Ontario has various acts, guidelines, policies, plans, regulations, and initiatives which are intended to facilitate the planning of waste management programs by municipalities. These various provincial directives are important to consider in the SWMMP Update. In general, the Provincial approach to waste management is planning an integrated, long-term, environmentally and economically efficient approach with a goal of achieving a minimum 60% diversion rate through the reduction, reuse, and recycling of waste.
SolidWasteManagementMasterPlanUpdate MunicipalMasterPlanProject CityofKawarthaLakes February2012 Page 47
4.0 IDENTIFICATION AND EVALUATION OF DIVERSION ALTERNATIVES
The identification and evaluation of diversion alternatives considered the following four main steps:
• Development of evaluation methodology
• Development of evaluation criteria
• Identification of diversion alternatives
• Comparative evaluation of diversion alternatives
4.1 Evaluation Methodology
The evaluation of the alternative programs and/or opportunities for increasing diversion was undertaken in consideration of the potential effects (both positive and negative) of the alternative programs or opportunities relative to a set of evaluation criteria.
The specific steps undertaken in the evaluation of the alternative diversion programs and opportunities are as follows:
• Step #1 – Undertake any additional data collection for each alternative.
• Step #2 – Apply each of the evaluation criteria against each alternative to identify potential effects (positive or negative).
• Step #3 – Where a potential effect (positive or negative) has been identified, identify reasonable measures to mitigate or eliminate potential negative effects or to enhance positive effects.
• Step #4 – Identify the resulting net effects from the application of mitigative and enhancement measures against the potential effects.
• Step #5 – Based on the results of the ‘net-effects’ evaluation, identify which of the proposed programs and opportunities are able to increase the diversion in the City taking into account the advantages and disadvantages related to the evaluation criteria. Based on the evaluation process, alternative programs and opportunities were evaluated.
4.2 Evaluation Criteria
Although increasing diversion is the primary goal of the evaluation process, there are a number of additional factors that are important when evaluating and selecting the program and/or opportunities for increasing diversion. These additional criteria ensure that factors such as cost, technical feasibility, time, and environmental and social impacts are considered in the decisionmaking process. The criteria considered in the evaluation of diversion alternatives considered:
1. Effect on waste diversion and potential implications
2. Potential effect on the natural environment
3. Potential effect on the social-cultural environment
SolidWasteManagementMasterPlanUpdate MunicipalMasterPlanProject CityofKawarthaLakes February2012 Page 48
4. Cost/benefit versus impact on the economic environment
5. Technical feasibility
6. Facility Requirements in support of the proposed program or opportunity and their potential geographic location
7. Degree of change/transition issues from the current system and the potential effect on program participation
8. Public and community education requirements
9. Potential conflict with current or higher priority diversion programs
10. Approval requirements and associated impacts
11. Enforcement requirements
Programs and opportunities for increasing waste diversion were selected from a number of sources. These sources included the preliminary municipality review, the detailed municipality review as well as a general review of waste management systems across the Province. A review of waste management best practices as presented by WDO and Provincial guidelines and legislation related to waste management were also utilized to develop the list of programs and opportunities for review. Both enhancements to existing programs as well as new programs and opportunities were included for consideration. Programs and/or opportunities for increasing diversion including a brief description are outlined in Table 4-1
It is important to note that not all of the programs and opportunities listed have been implemented either currently or previously in Ontario or elsewhere. Many programs and opportunities are included in the list to demonstrate the full range of alternatives available for consideration. Where a program or opportunity has not be proven in another jurisdiction this will be reflected in Criteria No.2 of the net-effects evaluation ‘Proven Performance Results’.
Every-Other-Week(EOW)WasteCollection
Residual waste would be collected EOW. The purpose of consideringEOWwastecollectionistoincreaseparticipation inotherdiversionprograms(existingorproposed).Variations ofthisapproachincludeEOWwastecollectionyearroundor onlyoff-season(i.e.Nov-May)whenactivityislowerandthere arelessconcernswithverminandodours.
ReduceContainerLimits
Households would only be permitted to set out 1bag/container per week (2-bags/containers for EOW) for collection.Variationsofthisapproachincludeastrictcontainer limitortheoptiontoallowresidentstopurchasepre-paidtags foroverages.
IncreaseCostofAdditionalTags
FullUserPay–throughtagsorpre-purchased
Increasetheexistingcostoftagsforcollectionlimitoverages asameanstoencourageparticipationindiversionprograms
Allresidualwastemustbepaidfor,throughtheuseofpre-
SolidWasteManagementMasterPlanUpdate MunicipalMasterPlanProject CityofKawarthaLakes February2012 Page 49
4.3 Identification of Diversion Alternatives
ProgramorOpportunity
ResidualWasteStream
Table 4-1: Identification of Diversion Alternatives
Description
bags
UseClearBagsforWasteCollection
purchased bags, or by requiring all bags/containers to be tagged.
Clearplasticsbagsallowforcollectorsorinspectorstoview thecontents,andrefusecollectionifnecessary(alsoasocial tool,don’twantneighborstoseethatyouarenotparticipating inwastediversionprograms).
Provide/CompeteforMulti-ResidentialandIC&I WasteCollectionServices
Usea‘Yellow-Bag’TypeCollectionSystemfor IC&ICollectionServices
RecyclingStream
AddNewMaterialstoExistingProgram
AllowforBins+ClearandBlueBagstobeused forCollection
To gain access to IC&I market and assist with the implementationofdiversionprograms.
‘Yellow-Bags’arepurchasedbytheIC&Isector forresidual waste. Unlimited access is then granted to all diversion programs(i.e.ifamemberofIC&Isectorpaysforresidual waste collection by the municipality, recycling and SSO collectionisfree-of-charge).
Addtothetypeofmaterialscollectedinboththecontainer andfibrestreams.
Allow for recyclable materials to continue to be placed at curbsideintheBlue/GreenBoxes,butalsoallowuseofclear (whiteorblue)bags.
SingleStreamCollection Collectallrecyclablematerialsinasinglestream.
2-StreamCollectiononaWeeklyBasis
Provide/CompeteforIC&IRecyclingService
Continuetohaveboththefibrestreamandcontainerstream collectedseparately,buthavebothonaweeklybasis.
To gain access, assist with the implementation of diversion programs,andbenefitfromthesaleofrecyclablematerials.
EliminatetheLimitonIC&ICollection (Municipally-hauled)–Therewouldbenolimitonthequantity ofmaterialthatmembersoftheIC&Isectorcouldplaceatthe curbside for collection, promoting diversion, and benefiting fromthesaleofrecyclablematerials.
ProvideRecyclingServiceatSpecialEvents
Provide receptacles and collection service for recyclable materialsatpublicevents.
SourceSeparatedOrganics(SSO)
ExpandSSOProgramtoallHouseholdsCityWide
ExtendSSOtoMulti-UnitResidential
Based on the results of the SSO Pilot Project, expand collectionofSSOtoallhouseholdsCity-wide.
ExtendtheSSOprogramtomulti-unitresidential.
ExtendSSOtotheIC&ISector ExtendtheSSOprogramtotheIC&Isector.
LeafandYardMaterials
IncreasetheFrequencyofLeafandYardMaterial Collection
LeafandYardMaterialCollection–Multi-Unit Residential
LeafandYardMaterialCollection–IC&ISector
Reuse
EstablishAdditional‘ReuseCenters’
Increase the frequency of the collection of leaf and yard materialsintheexistingcollectionprogram.Thiscouldinclude addingaSpringcollectionprogramand/orfurthercollection daysinthecurrentFallprogram.
Extendtheleafandyardmaterialcollectionprogramtomultiunitresidential.
Extendtheleafandyardmaterialcollectionprogramtothe IC&Isector.
TheCityhasanexistingreusecentreattheFenelonLandfill andhasconsideredopeningareusecenterattheLindsay-Ops Landfill. One or more additional centers could facilitate additionalreuseorexchangeoflightlyuseditems
PaintReuseCentersorPaintExchangeDays Programswhichfacilitatetheexchangeorreuseofpaintsand otherlikeproducts(e.g.stains,chemicals,specializedcleaners, etc.).ThiscouldbedoneinconjunctionwithHHWdepots.
SpecialWastes(HHWandE-Waste)
EstablishAdditionalHHWDepots
To improve access to the program and encourage greater participation
SolidWasteManagementMasterPlanUpdate MunicipalMasterPlanProject
Page 50
CityofKawarthaLakes February2012
HoldAdditionalHHWEventDays
Toimproveaccesstotheprogramandencourageparticipation bythosewhoarenotabletoaccesstheexistingHHWdepots Education
Promotethe5R’s(Rethink,Resist,Reduce, Reuse,Recycle)
UseElectronicAlerts(e-mailalerts)toNotify PublicaboutUpcomingWasteDiversion Programs/Events/Days
ContinuetoworkinpartnershipwithSirSanford FlemingCollegeandlocalstakeholdersto improveexistinganddevelopnewandinnovative programstoachievefurtherdiversionfrom landfill
MunicipalPolicyMeasures
PlaceaBanonallDivertibleMaterialsfromthe ResidualWasteStream
Education needs to move beyond the 3R’s and target the mindset of the consumer rather than just consumption and disposalpatterns.
Inacknowledgementoftheshiftinsocietalpatternsandthe needforinformationondemand.
Sir Sanford Fleming College is a local post-secondary institution, with which the City has an agreement to work together on project activities and initiatives specifically as related to waste management and including innovative technologies, landfill mining, environmental protection, ecologicalrestorationandnaturalresourceconservation.
A legislative tool to force participation with municipally provided waste diversion programs. Can be enforced at curbsideoratthetipping-face.
4.4 Comparative Evaluation of Alternatives
The evaluation of the alternatives is presented in detail in Appendix G (Tables G-1 to G-13). Based on the results of the evaluation the following was observed:
• The greatest potential to increase diversion is to target the SSO component of the residential waste stream.
• The City has a very successful curbside “Blue/Green” Box recycling program. There is only limited potential to increase diversion in this program as the City already accepts all of the main/marketable materials. Further, the residential diversion rate for the Blue/Green Box component is one of the highest in Ontario.
• The IC&I and C&D sectors dispose of a considerable amount of waste at City landfills. Provincial waste estimates for these sectors suggest a significant component of this waste stream can be diverted. However, the City does not have “flow control” over these sectors, as they do with the residential waste stream. Therefore, programs for the IC&I and C&D sector are significantly impacted by market influence and cost to that sector to participate in programs.
• There are a number of municipal policy measures and enforcement measures that support waste diversion programs and help increase diversion. Not all programs work in conjunction with one another and success is generally dependent on the level of enforcement that a municipality is willing to implement.
• The agreement with Sir Sanford Fleming College allows the City to be on the forefront of assessing in a scientific, educational and business case manner various opportunities in waste diversion, alternative technologies and landfill disposal systems. The City is in a unique position and should continue and grow this relationship and its opportunities, on a case-by-case and program basis.
SolidWasteManagementMasterPlanUpdate MunicipalMasterPlanProject
February2012 Page 51
CityofKawarthaLakes
5.0 DISPOSAL ALTERNATIVES
Notwithstanding current efforts at diverting waste from disposal and the potential to increase diversion in the future, the City will still have a need to manage the residual waste stream that cannot be diverted to a beneficial use. The City currently has sufficient landfill capacity to meet the City’s disposal needs for at least the next 25 years. However, landfill capacity is a finite resource and the City will eventually need to have in place capacity to manage the residual waste stream. Across Ontario and Canada, waste is increasingly being viewed as a resource to recover costs and provide value to municipalities. Alternatives to landfill disposal of residual waste are continuing to develop in Ontario. With alternative disposal facilities being established in YorkDurham Region, Sault Ste. Marie and Ottawa, a shift in the manner in which residual waste is managed is occurring. City Staff recognize the importance of keeping up with new and improved methods of disposing and managing waste. The City receives unsolicited submissions from waste management technology vendors from time to time and considers the merits of these technologies.
To determine what can be done to further enhance the City’s disposal and management practices, the following sections will consider landfill management practices at the City’s existing landfills in order to maximize their capacity and long-term value as well as alternative disposal technologies such as incineration/energy from waste and mechanical biological treatment of waste.
5.1 Landfill and Other Facilities Management
5.1.1 Landfill Expansions to Increase Site Life
An important consideration in the planning for expansion of landfill sites is the ability to justify need. In the context of EAA approvals for additional landfill capacity it may be difficult at this time for the City to justify need, given that at current diversion rates there is approximately 27 years disposal capacity remaining. With the implementation of diversion activities outlined in this SWMMP Update, disposal capacity could be extended by at least 5 to 9 years. Therefore the planning for landfill expansions at this time may not be appropriate.
The City should however consider, that in the future, land
will be required for the
management of solid waste (e.g. for disposal, EFW) and that appropriate action should be taken in the shortterm to ensure that appropriate sites/locations will be available in the long-term.
The City currently owns a significant amount of land around and in the vicinity of the LindsayOps Landfill. The City should ensure that those lands and surrounding facilities (i.e. wastewater treatment plant) are appropriately zoned and recognize possible expansion onto surrounding lands in the future.
The City should put a holding designation on the lands surrounding the Lindsay-Ops Landfill Site to protect these lands as municipal property until future decisions are made on waste management facilities or decisions are made on alternative technologies. This is particularly important for an alternative technology facility as it would serve the entire City and the LindsayOps Landfill Site is centrally located for such a facility. Putting a holding designation on the
SolidWasteManagementMasterPlanUpdate MunicipalMasterPlanProject CityofKawarthaLakes February2012 Page 52
CityofKawarthaLakes
lands surrounding the Lindsay-Ops Landfill Site would protect the City’s investment in the area.
It should be noted that this does not infer that the Lindsay-Ops Landfill Site or surrounding lands would be the preferred location for any future waste management facilities, only that it exhibits a number of positive attributes which would make it a strong candidate for consideration. A site selection and approvals process under the EAA would be required to determine the appropriate site for any proposed future waste management facility.
5.1.2 Landfill Mining
Landfill mining or landfill reclamation is a process of solid waste management which is a combination of landfilling, recycling and composting with potential tie-ins to EFW or other thermal technologies. As such, the in-place waste can be viewed as a resource for potential future beneficial use. The general concept is that an existing landfill site is dug up or mined, materials are sorted and diverted where possible, and then the cell is refilled using higher technology solutions for compacting waste and for collecting leachate and landfill gas. A positive benefit of the remediation process has been to reclaim disposal capacity. Where proponents have undertaken landfill mining, it has usually been done to remediate a problem at the landfill site.
MOE have indicated that reclaiming disposal capacity through landfill mining to address an operational issue does not require EAA approval. However, if landfill mining is done specifically to reclaim disposal capacity, then MOE considers this “new” capacity and EAA approval is required.
Previously landfilled waste is excavated using heavy machinery and sorted using a mechanized screener such as a rotary trommel screen. The resultant large diameter overages are discharged from the screen and will be re-landfilled. Recyclable materials such as metal or rubber tires would be separated prior to screening and sent to a licensed recycling facility. However, one issue is that the materials mined from the landfill will be dirty and therefore not easily marketed. Bulky items from the excavated waste, as well as those from incoming fresh waste can be processed by a lowspeed grinder. Processing items such as furniture, mattresses, tree stumps and construction and demolition waste into smaller pieces reduces voids and improves compaction.
In general, the fines that pass through the screen will consist mostly of dirt/sand or other similar material that has previously been used as landfill cover, broken glass and fine decayed organic material. These fines would be reused as daily cover for the overs and for incoming waste. However, historically at the City’s landfills some clay-type materials have been used for daily cover and this can be difficult to screen out. The separated fines may continue to contain clay materials which may not be suitable for daily cover material. Clay material in daily cover can cause perched conditions leading to leachate outbreaks if leachate cannot precipitate down through the waste layers.
The primary benefits of landfill mining are increasing the compaction or fill material thereby increasing the site life at the site; increasing the ability to manage leachate which will protect the surrounding environment and allow for better control of moisture levels; and allow for better capture of landfill gas which will reduce GHG emissions from the site and possibly allow for cost recovery through the sale of methane or the sale of electricity generated by captured
SolidWasteManagementMasterPlanUpdate
MunicipalMasterPlanProject
February2012 Page 53
methane gas.
Secondary benefits of landfill mining include cost-recovery associated with recycling of reclaimed materials such as metal and tires, the cleaning and recycling of some plastic material may also be possible; a reduction in the need for daily cover, since recovered material can be used even for incoming waste; and the possibility to utilize reclaimed waste in an EFW facility.
Landfill mining has been successfully undertaken in a number of municipalities in Ontario. The County of Simcoe has an ongoing program that has seen many of their existing landfills mined. A successful mining project was also undertaken at the McDougall Landfill near Parry Sound. The County of Northumberland also undertook a detailed examination of the feasibility of mining its Brighton Landfill, however upon more detailed economic and technical consideration, decided to seek approval for expansion of the site rather than mining existing areas of the landfill.
The City has a number of closed and operating landfills that could be considered feasible for landfill mining. However, many of the sites are small and have been closed for a number of years. The smaller closed sites would not likely be primary candidates for landfill mining. However, there is potential that some of the larger sites such as Lindsay-Ops, Somerville, Eldon and other sites may provide potential for landfill mining. A pilot project, potentially in conjunction with Sir Sanford Fleming College, could be developed to examine the feasibility of a full-scale landfill mining project.
5.1.3 Alternative Daily Cover
Alternative daily cover (ADC) refers to cover material other than earth material placed on the tipping-face of an active landfill at the end of each operating day to control vectors, odours, blowing litter and scavenging. ADC is applied in the same manner as a daily cover material-over the entirety of the exposed landfill face. The use of ADC is not recorded as disposal.
It is recognized that the purchase of daily cover for the City’s landfill sites represents a significant expenditure. There are a number of ADC options available including spray-on biofilms, tarping systems and the use of alternative materials. The Aberfoyle Landfill site near Guelph and the Halton Landfill in Milton have both recently begun using tarps as an ADC system. Information on the Aberfoyle Landfill is discussed below:
Aberfoyle Landfill Site- County of Wellington
In 2010 the County of Wellington completed a 2-year trial program to investigate the use of a reusable tarping system as an alternative to soil at the active Aberfoyle Landfill Site. During the trial period the reusable tarp and deployment equipment was found to perform very well, and no issues or complaints regarding off-site odour, litter, vermin, or the appearance of the tipping area were received during the period.
Following the trial program the County was successful in amending the Certificate of Approval (C. of A.) for the Aberfoyle Site to allow for the permanent use of reusable tarps.
The tarp system reduces the need for cover soil and prolongs the remaining life of the
SolidWasteManagementMasterPlanUpdate MunicipalMasterPlanProject
February2012 Page 54
CityofKawarthaLakes
landfill site. It is recognized that mechanical issues could arise which would prevent the tarp from being deployed; also, it may not be possible to lay out the tarp during certain weather conditions, especially on very windy days. The C. of A. for the landfill requires that a 3-day supply of traditional daily cover be kept on site in the event that the tarp system is not operable.
Given the current and projected future difficulty that the City faces in securing reliable, low cost sources for daily cover, a study should be undertaken to examine alternative daily cover materials. The study could be undertaken in conjunction with Sir Sanford Fleming College as a research and development project.
5.1.4 Landfill Operational Efficiencies
In addition to considering the use of alternative daily cover, another opportunity to increase the efficiency of the use of the City’s five landfill sites is to consider operating levels-of-service. In general, the five City landfills are geographically well distributed and provide an acceptable levelof-service to residents and business relative to travel distance and operating hours. However, two of the landfills, Laxton and Somerville, are located relatively close together and the Laxton Landfill is in a relatively low populated area. The estimated haul distance between the two landfills is approximately 20 minutes. Given that these sites support seasonal residents in the summer, consideration should be given to closing one of the sites during the winter months to reduce costs. Residents would continue to receive curbside collection of waste and recyclable materials. Therefore, the basic level of service and ability to access a landfill site would continue. During the winter on occasion that a resident or business owner needs to travel to a landfill site, they may have a slightly longer travel time. However, residents especially should not have a need to travel to a landfill site very often, given the high level of curbside collection service provided by the City.
5.1.5 Landfill Monitoring Program
In accordance with individual C. of A.’s and Provincial legislation the City is required to complete monitoring of City-owned open and closed landfill sites. Over time, due to changing MOE requirements and amendments to individual C. of As, monitoring programs have evolved to the point where the current City-wide program may not be an optimal use of City resources.
The City has initiated a study to review environmental monitoring requirements at City landfill sites. This undertaking is consistent with the efficient management of the City’s waste management facilities and overall SWMMP Update.
This review of the City’s environmental monitoring requirements will provide the City with overall guidance on the consolidation and optimization of its programs including providing insight on how the monitoring programs may need to change over time as a result of the future closing of other City landfills and changes to the City’s waste management system.
An important component of the management of both open and closed landfill sites is the monitoring and management of leachate. The Environmental Monitoring Review Study should provide direction on the most appropriate methods for leachate management. The traditional
SolidWasteManagementMasterPlanUpdate MunicipalMasterPlanProject CityofKawarthaLakes February2012 Page 55
CityofKawarthaLakes
pump, treat and haul method of leachate management is expensive and is not necessarily the most efficient or effective method. While considering environmental monitoring programs, the City has the opportunity to consider alternative methods of leachate management. Spray irrigation with wetland pretreatment are examples of alternative methods of management. Compared to pump and treat, spray irrigation can be a lower cost alternative while being as effective. Wetland treatment, for example, may not be appropriate to treat full-strength leachate during the operating life of a landfill. However, after closure, as leachate strength weakens, wetland treatment may be a reasonable alternative that meets treatment needs. This could significantly reduce operating costs, as wetlands are relatively low cost and low maintenance. The City should take advantage of it’s strategic relationship with Sir Sandford Fleming College Centre for Alternative Wastewater Treatment to partner with them to further investigate the feasibility of spray irrigation with wetland pre-treatment as a management option.
5.1.6 Landfill Sites – Potential Afterlife Uses
Section 46 of the EPA requires the Minister’s approval for use of lands previously used for the disposal of waste in order to protect the health and welfare of the general public from potential hazards relating to those lands. Section 46 states that “No use shall be made of land or land covered by water which has been used for the disposal of waste within a period of 25 years from the year in which such land ceased to be so used unless the approval of the Minister for the proposed use has been given” R.S.O. 1990, c. E.19, Section 46.
MOE’s objective is the safe use of land, and avoidance or elimination of situations which may result in adverse effects for potential on-site users and nearby lands and their uses.
In support of this objective, MOE has published a series of guidance documents to facilitate the safe use of lands previously used for waste disposal. These documents include MOE Guideline D-4 (formerly 07-07) ‘Land use on or Near Landfills and Dumps’ and ‘Operational Guidance for Obtaining Environmental Protection Act Section 46 Approval for the Use of Lands Previously Used for Disposal of Waste’.
Often, post-closure uses for landfill sites can be predetermined, and defined as a condition of the C. of A. Where this is not the case, a preliminary consideration that would have to be made when determining post-closure use is, does the site have a public value? In other words, is the site in a desirable location and is there the potential for the development of some publically beneficial use.
MOE generally discourages residential and other sensitive development on lands previously used for waste disposal, and recommends that land uses be limited to open-space activities associated with parks, recreation and open space, crop farming and similar uses for which the landfill and use is specifically designed.
Livestock grazing is discouraged and there should generally be no paved or impermeable surfaces or underground services or structures.
In addition, in determining if there is a suitable land use for a former landfill site, there are environmental and public health and safety considerations which must be evaluated. Factors to
SolidWasteManagementMasterPlanUpdate MunicipalMasterPlanProject
February2012 Page 56
be considered include, ground and surface water contamination by leachate, surface runoff, ground settlement, visual impact, soil contamination and hazardous waste, attraction of animals and insects, poor growing conditions, high costs associated with remediation measures and landfill-generated gases, particularly the production and migration of methane gas.
If significant limitations/concerns exist in regard to the suitability of the site for a future use or because of environmental or public health and safety factors, the most appropriate afterlife use for a closed landfill site may be passive/open-space/recreational. A number of landfills have been converted to recreation trails, parks and golf courses after closure. Some examples of recent, successful projects on land previously used for waste disposal in Ontario include:
Glenridge Quarry Landfill Naturalization Site
Located on the brow of the Niagara Escarpment in St. Catharines, the Glenridge Quarry Site was a municipal landfill from 1976 to 2001. After the landfill closed, a number of land use alternatives were evaluated and it was concluded that the most suitable end use for the site was a natural re-vegetation and the establishment of a trail system.
Along the trails, seating areas were integrated to enhance the experience. A children’s science nature area, with an outdoor classroom, provides an area for educators and school groups to visit and learn about natural sciences and the environment. Other site features include an existing large naturalized pond, a heritage arboretum, and a wildflower meadow with bird and butterfly houses as well as a series of interpretive panels explains how the site has evolved and been used over time.
Elm Street Landfill Naturalization Site
The Elm Street Landfill in Port Colborne operated for approximately 45 years and closed on December 31st, 2008. Niagara Region developed a Closure Plan and End Use Plan that was approved by MOE. The end use involved the establishment of a naturalization site and dog park. The Elm Street Naturalization Site officially opened August 18th, 2010.
St. Catharines Municipal Golf Course
There are many examples of closed landfills being developed into golf courses. Golf courses generally require large, hilly areas, without the need for hard surfaced infrastructure. In St. Catharines, the former Lincoln Avenue Landfill closed in 1980 and was converted into an 18hole, par-60 executive golf course. Being located in a central area of the City, it has been an ideal location, especially for seniors and those just learning the game of golf.
Brae Ben Golf Course
The City of Mississauga owned and operated the Brittania Landfill for many years. Upon closure, the City retained a golf course architect to design a golf facility for the lands. The Brae Ben golf course includes a championship 18-hole course and a 9-hole executive course. A clubhouse and other amenities were established to service the golf facility, on-site, but off of the actual former disposal areas.
SolidWasteManagementMasterPlanUpdate MunicipalMasterPlanProject
February2012 Page 57
CityofKawarthaLakes
Niagara Waste Systems Landfill
The Niagara Waste Systems (NWS) landfill is a subsidiary of Walker Industries of Niagara Falls. NWS has partnered with the University of Guelph to study the possibility of reclaiming part of the closed East Landfill for agriculture. Integrated Municipal Systems (IMS), another subsidiary of Walker Industries operates a leaf & yard material and SSO compost facility on part of the closed East Landfill. The goal of the study is to determine the most economically viable option for farming. In 2010 NWS planted 17 ha on the former East Landfill with forage crops. They are studying the use of those crops for use in biofuel production or as a needed carbon source for the IMS compost facility.
Belle Island Landfill
Located in a marshland that extends into the Kingston Inner Harbour the 44 hectare site was used as a municipal landfill from 1952 to 1974. After the landfill was closed in accordance with MOE requirements, the City of Kingston developed the site into Cataraqui Park. Cataraqui Park is a multiple use recreational facility that includes a nine-hole golf course, tennis courts and walking paths.
Nepean Landfill
In late spring 2010, the City of Ottawa approved the construction of a 12 megawatt solar energy farm to be built in part on the closed Nepean Landfill. In total, the solar farm, to be developed on two separate parcels of land totaling 120 acres of landfill, produces enough electricity to power 1,500 homes. The City is leasing the lands to a private firm who will build and operate the solar energy farm. At the end of the lease the City will then option to buy the solar farm, extend the lease or ask for the solar panels to be decommissioned.
5.2 Alternative Disposal Technologies
Landfilling is the primary method of disposal for the City’s residual waste stream. However, landfill capacity is a finite resource that will run out some time in the future. Landfills have a legacy that requires continued monitoring and maintenance for many years after closure. For example, it is estimated that monitoring of the Lindsay-Ops Landfill will have to occur for over 100 years after closure. As such, landfills become a financial liability after their disposal capacity value is reached upon closure. This liability must be funded for many years. Landfills do not manage waste as a resource, it is simply a repository over which time waste slowly breaks down. Alternative technologies for managing waste have existed for many years. Incineration for example is not a new technology, however improved methods of “combustion technologies” have been developing world-wide due to a need to manage waste by means other than disposal. Technologies being developed outside of North Avenue are starting to become more prevalent in Ontario, and throughout Canada and North America. Recognizing that the City’s landfills are a finite resource, the City should begin to consider what role alternative technologies may play in the City’s future waste management system. The following sections present an overview of alternative technologies while section 5.3 provides an outline of a process for considering alternative technologies.
SolidWasteManagementMasterPlanUpdate MunicipalMasterPlanProject CityofKawarthaLakes February2012 Page 58
5.2.1 Thermal Treatment
In jurisdictions that employ thermal treatment of municipal solid waste, treatment occurs to the remaining waste stream that is not recovered from source-separated diversion of recyclables and organics. Thermal treatment of waste can reduce the overall volume of waste, allow for the recovery of energy from waste (EFW), allow for the recovery of mineral and chemicals which can be reused or recycled and destroy contaminants in the waste stream. There are many established thermal treatment technologies already being utilized throughout North America, Europe and Asia. Existing and emerging thermal technologies are described as follows.
5.2.1.1 Existing Thermal Treatment Technologies
Conventional combustion of waste is a mature and well-established technology. In recent years, technologies such as gasification and pyrolysis, which are not new concepts, have also been applied to the treatment of municipal solid waste.
Conventional Combustion
Conventional combustion (otherwise known as mass burn or incineration) normally involves the combustion of unprepared, raw waste. Combustion at an incineration facility can reach temperatures upwards of 850°C. This method results in the production of carbon dioxide and water, as well as bottom ash made up of any non-combustible materials and some carbon. Heat from the process can be captured and converted into energy as steam and/or electricity.
In addition to the single-stage mass burn technology, a modular, two-stage combustion technology exists, which involves two separate stages of combustion in different chambers. Fluidized bed combustion is also a commonly employed technology involving increased preparation of waste materials prior to combustion. [7] [8]
Pyrolysis
Unlike combustion, pyrolysis is the thermal degradation of a substance in the absence of oxygen. It requires an external heat source to maintain the temperature required, typically relatively low between 300ºC and 800ºC for municipal solid waste. Similarly to conventional combustion, bottom ash is a result of the process, as well as a synthetic gas (syngas) The syngas is a mixture of gases (combustible constituents include carbon monoxide, hydrogen, methane and a broad range of other volatile organic compounds). A proportion of these can be condensed to produce oils, waxes and tars. The condensable fraction of the syngas can be collected through cooling, potentially for use as a liquid fuel. [9]
Gasification
Gasification involves the partial oxidation of a substance. Oxygen is added but the amounts are not sufficient to allow the fuel to be completely oxidized and full combustion to occur. The temperatures employed are typically above 750ºC. Similarly to pyrolysis, the main product is a
7 StantecConsultingLtd.,CountyofBrantSolidWasteDisposalFutureNeedsStudy(May2011).
8 GartnerLeeLimited,2007.Studyofstabilizedlandfill.
9 DepartmentofEnvironment,FoodandRuralAffairs,2007.Advancedthermaltreatmentofmunicipalsolidwaste.
SolidWasteManagementMasterPlanUpdate MunicipalMasterPlanProject CityofKawarthaLakes February2012 Page 59
syngas which contains carbon monoxide, hydrogen and methane. Gasification also produces a bottom ash. Like pyrolysis, the syngas can be burned in a boiler to generate steam, which can be used to generate electricity or to heat the facility. The syngas can also be used as a liquid fuel in a gas engine. [9]
5.2.1.2 Emerging Thermal Treatment Technologies
There are a number of emerging alternative thermal treatment technologies that have yet to be proven in practice. The emerging thermal treatment technologies include:
• Plasma Arc Gasification – electric current that passes through a gas to create plasma which gasifies waste into simple molecules.
• Gasplasma – produces clean hydrogen-rich syngas and an aggregate, designed for postdiversion materials (cannot be recycled or composted).
• Thermal Cracking technology – waste material is heated in an oxygen-free chamber and is thermally cracked in a matter of seconds, producing a syngas and a small amount of mineral solids. A portion of the syngas can be used to heat the chamber.
• Thermal Oxidation – a closed system that uses pure oxygen as opposed to ambient air for the oxidation process and claims to dispose of all classifications of waste while producing zero emissions.
• Waste-to-Fuels – based on the concept of using syngas as a feedstock to create various liquid fuels for use off-site.
• Disintegration Systems – uses thermal disintegration to combust waste materials for the production of energy (i.e. Kearns Disintegration System).
• Steam Reformation – uses steam in an oxygen-deprived environment to re-arrange the carbon and hydrogen atoms in waste materials to produce fuels such as ethanol, methanol and other hydrocarbons. A pilot plant in Sault Ste. Marie operated by the Elementa group, has been in operation for over three years and is ready to begin full commercial operation. [7]
5.2.1.3 Examples of Thermal Treatment Facilities
There are currently seven operational conventional combustion incinerators in Canada that treat municipal solid waste; three in Quebec and one each in British Columbia, Alberta, Ontario and Prince Edward Island. Four of the seven facilities use mass burn incineration technology while three of the facilities use multiple stage modular technology. Experience shows that mass burn facilities tend to have a longer lifespan. [10]
The one incinerator currently in operation in Ontario (Algonquin Power) processes municipal solid waste for the Region of Peel and has been open since 1992. It processes approximately
SolidWasteManagementMasterPlanUpdate MunicipalMasterPlanProject CityofKawarthaLakes February2012 Page 60
10 EnvironmentCanada,2007.MSWthermaltreatmentinCanada.
50% of Peel’s solid waste (140,000 tonnes per year) and produces steam used to drive a turbine to create electricity.
The joint EFW facility for York and Durham Region received an MOE Certificate of Approval on June 28, 2011. This thermal treatment facility will sort solid non-hazardous post diversion municipal waste and generate electricity and steam. The facility is currently in ‘Project Phase’ which involves design, construction and operation.
The events currently taking place in Ontario as mentioned above, as well as other pilot projects to test emerging incineration technologies, suggest that incineration technologies are more and more being considered as disposal alternatives.
5.2.2 Mechanical Biological Treatment
Mechanical Biological Treatment (MBT) is a term to describe a variety of waste treatment processes that involve both mechanical and biological treatment processes to sort municipal solid waste and dry the organic portion of the waste. MBT encompasses a wide variety of mechanical and biological process elements that can be combined in many ways to achieve a range of objectives, including the stabilization of waste prior to landfill disposal, production of compost-like products, diversion of non-organic recyclables and other materials and production of refuse derived fuel (RDF).[7] Studies have shown that the total mass reduction resulting from a MBT process can amount to between 20 and 40% due to the degradation of materials. [8] One of the major disadvantages of the MBT process is the additional cost. Cost estimates from other MBT stabilization facilities are in the order of $50 to $75 per tonne. This would approximately double the City’s current cost for landfill disposal.
5.2.2.1 Mechanical Treatment Technologies
All MBT processes include mechanical treatment technologies involving the separation of waste materials into individual streams which can allow for several end uses such as recycling and landfilling of non-organic materials, biological treatment of organic and non-organic materials and energy recovery. The implementation of a mechanical treatment technology or a combination of many technologies depends on the preferred end use of the recovered materials. The input materials can include municipal solid waste from curbside collection, organic materials from a biological treatment process and ash or char from a thermal treatment process. These materials are received and inspected for unacceptable materials that may cause damage to the sorting equipment. Prior to separation, numerous preparation techniques can be used be used to reduce the size of material. Most MBT facilities employ a variety of sorting techniques to achieve specific end uses of the material.
5.2.2.2 Biological Treatment Technologies
Biological treatment of waste involves using microorganisms to decompose organic material in the waste stream, which can result in heat production, carbon gases and steam, used to create fuels. In addition to the creation of fuel, end uses of decomposed organic materials can include compost and landfill applications. Biological treatment can be applied to source separated organics (SSOs) as well as mixed waste (i.e. garbage). When applied to a mixed waste stream
SolidWasteManagementMasterPlanUpdate MunicipalMasterPlanProject CityofKawarthaLakes February2012 Page 61
without being separated, output can be sent to a stabilized landfill. Some solid residue materials are common by-products from the biological treatment process and must be landfilled, including heavy weight grit and glass materials and light weight plastic film materials. [11] [12]
There are two types of biological treatment technologies which can be used to process mixed waste, either before or after separation techniques have been utilized; aerobic and anaerobic digestion.
Aerobic Treatment
During aerobic decomposition, otherwise known as composting, biodegradable material interacts with oxygen in a natural process called microbial respiration. Carbon dioxide is produced through the oxidation of carbon materials present in the waste, and water is produced through the oxidation of hydrogen. Heat is also produced as a by-product of this process. After treatment, non-biodegradable materials, humus and microorganisms remain, as well as dry compost.
Decomposition can occur fully through a type of aerobic treatment called in-vessel composting or occur partially through bio-drying/bio-stabilization. In-vessel composting occurs in a container or building in which the material is either mechanically turned to be agitated, or air is pushed or pulled through the material. The main differences between different in-vessel technologies such as vertical silos or agitated piles is how oxygen is supplied to the material. [15]
Anaerobic Treatment
Anaerobic digestion (AD) is the biological breakdown of organic materials in the absence of oxygen. The material remaining after digestion is a partially stabilized organic material, which can then be aerobically cured and used as compost. All AD is in-vessel to establish an environment without oxygen. Biogas is generally a by-product of the process, which can be burned to produce heat and/or electricity.
Vendors of AD systems offer various throughput capacities, with abilities to directly inject liquids (e.g., manures, sludges). There are different AD technologies available that provide a range of environments which favour different populations of microorganisms.
5.2.2.3 Examples of Mechanical Biological Treatment Facilities
MBT facilities and stabilized landfill sites have mainly been developed in the European Union (EU), Australia and the United Kingdom (UK). This development in the EU was driven by the need to comply with the EU directive 1999/31/CE which required a progressive ban on the disposal of biologically degradable organics in landfills. Spain has the highest capacity of operational facilities in the world, followed by Italy and Germany, who have introduced different national regulations to comply with the EU directive with a key difference being the extent of
11 Juniper Consultancy Services, 2007. Mechanical-biological treatment: a guide for decision makers processes, policiesandmarkets.
12 DepartmentofEnvironment,FoodandRuralAffairs,2007.Advancedbiologicaltreatmentofmunicipalsolid waste.
SolidWasteManagementMasterPlanUpdate MunicipalMasterPlanProject
February2012 Page 62
CityofKawarthaLakes
stabilization required prior to landfill. In the UK several facilities are in the early years of operation. Significant efforts are in place in the EU and UK to implement recycling programs to reduce the volumes of material needing to be processed. [9]
The Edmonton Composting Facility began operation in 2000 is and similar to an MBT facility. Waste undergoes hand-sorting followed by composting and screening to remove non-organic components to produce compost. The Halifax Regional Municipality (HRM) operates a facility that is also bio-stabilized prior to landfilling. Waste entering the facility is removed from bags and screened. Large items are sent to landfill and the remaining waste goes through an aerobic biological treatment process and then sent to landfill. [13]
5.3 Evaluation and Consideration of Alternative Technologies
The approach to managing waste in the City and throughout Ontario and North America has changed significantly over the last 20 to 30 years. Technology has allowed for, and resulted in the implementation of recycling collection and processing programs, composting collection and processing programs, engineered landfill facilities, incineration/EFW facilities, etc. These technologies have greatly changed the way municipalities now manage waste compared to when garbage was collected and disposed in mainly small, un-engineered dumps.
As such, the systematic and ongoing consideration of new and emerging waste management technologies is important so that municipalities can continue to improve the methods by which waste is managed, including increasing the amount of waste that is diverted from disposal. Therefore, it is recommended that the City undertake a formal review of waste management technologies on a regular basis (i.e. every 3 to 5 years) as part of its solid waste management planning program. The City should continue its strategic partnership with Sir Sandford Flemming College on researching and investigating new and emerging waste management technologies. The formal review process of alternative technologies could coincide with the expiry and renewal of the City’s waste collection contract so that if any major changes are implemented that affect the collection program, they can be implemented without reopening or significantly impacting the collection contract. As noted on Figure 7-1, it is proposed that the City undertake a review of alternative technologies in Phase 2, which is within the next 3 to 5 years.
As part of this review, the City will also be able to consider the progress of a major initiative of one of the adjacent municipalities – that is, the York-Durham Waste Incinerator Project. YorkDurham has received EAA and EPA approval and is proceeding with the construction of the facility. Based on the results of the York-Durham project, their may be opportunities for the City to utilize this facility. The City should reopen the dialogue it began in 2007 with York-Durham to determine whether their facility would be available to Kawartha Lakes. Other municipal initiatives include the City of Sault Ste. Marie and the County of Norfolk which are considering
13 AECOMCanadaLtd.,2009.ManagementofmunicipalsolidwasteinMetroVancouver–acomparativeanalysis ofoptionsformanagementofwasteafterrecycling.
SolidWasteManagementMasterPlanUpdate MunicipalMasterPlanProject
February2012 Page 63
CityofKawarthaLakes
alternative disposal technologies and the County of Dufferin which has been investigating various alternative disposal technologies for a number of years. The knowledge these municipalities gain through their processes of identifying, evaluating and implementing alternative technologies can be useful in any evaluation of alternative technologies undertaken by the City.
The evaluation of major alternative technologies should involve a systematic and traceable methodology and defined evaluation criteria. The process must also potentially evolve from one that is a ‘feasibility’ type study to one that eventually would potentially have to meet the requirements of the EAA and other relevant legislation if the City decided to proceed with implementation of a specific technology. Details of a process to consider alternative technologies and each of the steps are summarized in Figure 5-1 and described in detail in Appendix J.
SolidWasteManagementMasterPlanUpdate MunicipalMasterPlanProject CityofKawarthaLakes February2012 Page 64
Public,Agency& Stakeholder Consultation
Public,Agency& Stakeholder Consultation
Step#1 –ConfirmProcessforIdentifyingandEvaluating AlternativeTechnologiesthatConsidera“Feasibility”Levelof EvaluationtoAddressingtheEvaluationandConsultation RequirementsoftheEAA,EPAandotherLegislature.
Step#2 –EstablishEvaluationCriteria&Methodology
Step#3 –Identify“Long-List”ofAlternativeTechnology ProponentsBasedonUnsolicitedSubmissionsReceivedand FormalRequestforSubmissions
Step#4–Evaluate“Long-List”SubmissionstoIdentify“ShortList”ofAlternativeTechnologiesforFurtherEvaluation
Step#5 –Prepare&DistributeRequestforProposals(RFP)to “ShortList”Proponents
Step#6 –ReviewofRFPSubmissionsforCompleteness
Step#7 –ProponentInterviewsandFacilityVisits
Step#8 –Economic/FinancialandLegalDueDiligenceReview
DecisionPoint ConcludeProcessat Step#4orIdentify “Short-List”of Alternativesfor furtherEAALevel Evaluations
Step#9 –ComparativeEvaluationof“Short-List”Submissions andIdentificationofPreferredProponent
Step#10 –FurtherDueDiligence,RiskAssessment, DevelopmentofApprovalsStrategyandPossibleSiteSelection Process
DecisionPoint ConcludeProcessat Step#9orIdentify thePreferred Proponentfor FurtherDetailed Review
Step#11 –ContractDevelopmentandNegotiationsand AcceptancebyCouncil
Step#12 –FacilityCommissioning,Approvalsand Implementation
DecisionPoint ConcludeProcessat Step#10,select anotherproponent forfurtherdue diligencereviewor proceedwith preferredproponent tonextsteps
SolidWasteManagementMasterPlanUpdate MunicipalMasterPlanProject CityofKawarthaLakes February2012 Page 65
Figure 5-1 Overview of a Process to Consider Alternative Technologies for the City of Kawartha Lakes
6.0 PROPOSED UPDATE TO THE CITY OF KAWARTHA LAKES SOLID WASTE MANAGEMENT SYSTEM
6.1 Waste Diversion
As noted, there are two main sources of waste generation in the City, the residential component and the IC&I/C&D component. The following identifies alternatives that can be considered to increase diversion:
Residential Waste Stream – Section 2.1.2.1 indicates that 14,120 tonnes of the City’s residential waste stream (which includes curbside collection and residential self-haul) was disposed in 2011. Potential areas to increase diversion include:
• Blue/Green Box Recycling Program – The City collects the five basic materials as required under O. Reg. 101/94. These are also the materials that are most common to all other residential Blue Box programs in Ontario, as they are required to be collected by all municipalities. The City also collects all 14 supplemental “Blue Box” materials tracked by WDO. This is additional validation that the City’s recycling program is operating positively. Appendix H compares the performance of the City’s recycling program to other similar programs across the Province. Although the diversion of paper is quite high, the City’s audits undertaken prior to implementing the Fenelon Falls SSO program indicated that only about 60% of containers are diverted. Promotion and education of the Blue/Green Box recycling program is recommended to increase diversions of container materials.
In addition to promotion and education, other means to increase diversion of Blue/Green Box recyclable materials that have been effective in other municipalities include:
• Providing an additional bin for the container stream, especially if that stream is only picked up every two weeks.
• Alternatively, some municipalities have two-stream recyclables collection systems but they pick up both streams weekly to discourage residents from disposing of recyclable materials if the container becomes full. This option has also been shown to increase diversion even if extra containers are provided for every two week recyclables collection, mainly due to the convenience of residents not having to store two weeks worth of materials.
It is recommended that in the next collection contract the City include a request for a cost to provide weekly 2-stream recyclable collection and a cost to continue the current alternating week 2-stream recyclable collection program. For cost comparison, the City should also include the cost of providing an additional bin to residents for the container stream to determine a total cost of the existing system.
It should also be noted, that the experience of some municipalities (i.e. City of Toronto, Peel Region), indicates that the amount of contamination is higher for single-stream Blue Box recyclables collection. The higher contamination offsets any minimal gain in diversion of going
SolidWasteManagementMasterPlanUpdate MunicipalMasterPlanProject CityofKawarthaLakes February2012 Page 66
from 2-stream to single-stream collection. Therefore, it is not recommended that the City implement single-stream recyclables collection.
• Banning grass collection - One of the most significant components of the leaf & yard material disposal stream is grass (estimated to be at least 25% of the leaf & yard material disposal stream). The intent of the leaf & yard materials collection program is for leaves, yard trimmings and small branches. The program is not intended as a grass collection and composting program. Many Ontario municipalities have banned the setting out, collection and acceptance for disposal of grass clippings. The intent of a ban on grass collection is to encourage residents to manage grass on their properties through “grasscycling” and backyard composting. Leaving grass clippings on the lawn is beneficial to the soil, providing moisture and nutrients. Further, the City would not have to manage this material at all, thus resulting in collection, composting and disposal cost savings. The experience of other Ontario municipalities with composting facilities is that grass clippings are one of the major contributions to odour problems. Therefore, banning grass clippings will improve the operation of any future City SSO facility, with respect to odour control. The banning of grass collection would need to be supported by strong education and promotional programs supporting grasscycling and backyard composting, which should be run concurrent with such a ban. Currently, the City only collects leaf & yard material in the Fall. If the City moves to a full City-wide SSO collection program, then this would be the most opportune time to ban grass clippings, so they are not set out with weekly organics.
• Introducing a residential City-wide Source Separated Organics (SSO) collection and composting program - One of the major components of the residential waste stream is food waste. The Province and many Ontario municipalities have recognized that capturing and composting the food waste component of the residential waste stream is the next major step in diverting waste from disposal. The development and implementation of food waste collection and composting programs is relatively new in Ontario. Most programs in Ontario have been developed and fully implemented only in the last 8 years and are experiencing relatively low participation and capture rates (30% to 50%). Comparatively, Blue Box recycling programs have been in place in most Ontario municipalities for over 20 years and are therefore mature programs with high community acceptance and participation rates exceeding 80 to 90%. The introduction of a City-wide SSO collection program has the potential for the single greatest impact on increasing waste diversion. As noted in Figure 2-3, approximately 33% of the residual waste stream is comprised of organics. Even with the experience of other municipalities of 30% to 50% diversion at the initial start up of an SSO program, this would result in an increase of 7% to 15% which alone would increase residential waste diversion to approximately 50% to 59%. The introduction of a City-wide residential SSO program will also need to consider the location and type of technology for processing SSO materials and potential economies of scale that could be gained by developing facilities in conjunction with adjacent municipalities. For example, Peterborough was considering implementing an SSO program. However, the MOE did not approve their application for an open-
SolidWasteManagementMasterPlanUpdate MunicipalMasterPlanProject
February2012 Page 67
CityofKawarthaLakes
windrow SSO compost facility, so Peterborough has placed their program on hold. Northumberland County is currently initiating an update of their Solid Waste Master Plan. One component is to examine the feasibility of establishing an SSO composting program.
In addition to specific programs, there are a number of municipal policy changes that can be considered to support programs to increase diversion. These include:
• Increasing public awareness of diversion programs through additional types of, and more frequent educational materials (i.e. promoting grasscycling and backyard composting)Ongoing public education and promotion of diversion programs is important. As program changes are made and new programs are introduced, it is important to properly promote the programs in order to ensure residents know that the programs are being changed/implemented and how to participate. This may require additional resources, particularly at program implementation. Public education and awareness programs could also target specific Blue/Green Box or other materials for which diversion rates are lower.
• Introducing and enforcing bans on the collection and/or disposal of certain types of materials, such as Blue/Green Box recyclables or organics - Disposal bans are policy measures used to keep specifically designated materials out of the landfill. Bans are legislated to support diversion of materials from disposal. Enforcement of disposal bans is an important consideration and can be done both at curbside or at the disposal facility. The implementation and enforcement of collection and disposal bans requires a significant amount of promotion so that residents and businesses understand that containers that include banned materials will not be picked-up at the curb or that loads containing banned materials will either not be accepted for disposal or will be charged a premium above the set tipping fee as a penalty for non-compliance. In addition, it is very important that when bans are put in place, that there are viable options/alternatives for the disposal of the banned material (e.g. grasscycling, backyard composting, Blue/Green Box recycling, SSO collection and composting, leaf & yard material collection and composting, etc.). If leaf & yard material and food waste organic programs are fully implemented by the City, curbside collection and landfill disposal bans could assist in further increasing diversion by these programs.
• Every-Other-Week Waste Collection – If a City-wide SSO program is introduced, then residents will have the opportunity to eliminate most organic materials from their waste stream and include them in their organic stream. By taking advantage of the SSO program, residents can generally eliminate the types of materials that cause odour in regular waste. As such, this option recognizes that residents should have less material in their residual waste stream and that this residual waste should be less odourous. This will allow residents to keep the residual waste at their property for a longer period. The additional benefit of this option is that if residents only have collection of the residual waste stream every two weeks, and they perceive that they could have odour issues, then they will be even more likely to ensure putrecible materials are diverted to the organics
SolidWasteManagementMasterPlanUpdate MunicipalMasterPlanProject CityofKawarthaLakes February2012 Page 68
stream. This should further increase participation in the diversion of organic materials. Most municipalities in Ontario that have implemented SSO programs have or are considering including EOW waste collection to support participation in the program.
As noted above, it is estimated that initial participation in an SSO program may be in the order of 30% to 50% diversion of organics. Municipalities that have included EOW waste collection with the SSO program have found that the diversion rate starts at the higher-end and grows faster than programs that continued with weekly waste collection.
It is also very important to note that it is only the residual waste stream that would be picked up EOW. The SSO container and Blue/Green Boxes would continue to be picked up weekly. Another corresponding benefit is a reduced cost for collection of the residual waste stream, which helps to defer any cost increase related to adding a new collection stream (SSOs) or more frequent Blue/Green Box collection.
IC&I and C&D Waste Streams – Unlike the residential sector, the City is not responsible for providing programs to, nor does it have control over how waste is managed by the IC&I and C&D sectors. The City accepts IC&I and C&D waste for disposal, but does not formally provide IC&I and C&D diversion programs. However, the IC&I and C&D sectors are mandated by O. Reg.’s 102/94, 103/94 and 104/94 to undertake waste audits and develop and implement plans to divert waste from disposal. Although this legislation was passed in 1994 and still exists, the Province to date has not been very diligent in enforcing this legislation on the IC&I and C&D sectors. It is understood that in the past few years, the Province has been pushing to enforce this legislation and focus on increasing waste diversion from these sectors. To that end, the City may see the IC&I and C&D sectors turning to them to request participation in municipal diversion programs and to seek guidance on how they can increase diversion to be in compliance with applicable diversion legislation. This provides an opportunity for the City to consider expanding some of the existing services or introducing new services to the IC&I and C&D sectors to promote diversion. Based on the review of alternatives in this evaluation, the following is recommended for consideration by the City:
• Extend Recycling Programs to Multi-Residential Properties – The City’s curbside recycling program is provided to some multi-residential properties. The City should work with multi-residential building owners not participating in the City’s program to determine if they are working with the private sector or have no recycling programs. If the multi-residential building has no program or a limited private program, then the City should take a pro-active approach to encourage the building owners to implement or expand their recycling program.
• CKL has been approved for funding from CIF to implement a multi-residential best practices program. At the approximately 200 small multi-residential buildings in the City, staff will complete site visits, update databases, increase recycling cart capacity and develop and deliver new P&E materials.
SolidWasteManagementMasterPlanUpdate MunicipalMasterPlanProject
February2012 Page 69
CityofKawarthaLakes
• An important consideration is that any added cost to provide such a program should be borne by the multi-residential building owner, but it needs to be balanced against lowercost disposal options.
• Extend Recycling Programs to the IC&I and C&D Sectors – Similar to multi-residential units, the IC&I and C&D sectors can participate in the curbside recycling program, but are limited to 4 cubic yards per week. For larger establishments, the quantity limit is insufficient. The intent of implementing this option is to capture recyclables from IC&I & C&D establishments. However, this may involve competing with the private sector to provide services to those in the IC&I and C&D sector already receiving service, or to provide service to those IC&I and C&D establishments not participating in any type of recycling program, but are simply sending recyclable materials to disposal. The material diverted would not be considered by WDO in calculating the residential diversion rate and WDO does not provide funding of this material. Tables 2-2 and 2-3 provided an estimate of the composition of the IC&I and C&D waste stream currently disposed, based on Ontario averages. Of the 21,606 tonnes of waste disposed by the IC&I and C&D sectors at City landfills in 2010, it is estimated that approximately 13,400 tonnes (62%) was recyclable material. As this would be a new program introduced to the IC&I & C&D sector by the City, it is assumed that there would be a significant period of time required to achieve the types of participation rates seen in the residential curbside Blue/Green Box collection program (i.e. over 90%). Therefore, for the purpose of the evaluation, it is assumed that IC&I recycling can reach 50% at initial start-up, but that eventually even higher diversion levels would be achieved. Using a conservative estimate that 50% of this material could be diverted through implementation of recycling programs, approximately 6,700 tonnes of material being diverted from disposal. The recyclable material diverted would not be included by WDO in the calculation of the diversion rate or towards funding.
• With the City’s ongoing efforts to secure sources of daily cover material, C&D material may provide an opportunity for daily cover. Wood waste and other C&D material can be ground up to generate a daily cover material. The City should consider a pilot program with Sir Sanford Fleming College to identify types of C&D waste that may be suitable for daily cover and to test these materials as daily cover.
• Extend SSO Program to multi-unit residential properties – One of the major recommendations of the SWMMP Update is to implement a City-wide SSO collection and composting program for the residential sector. The City does not currently provide SSO collection/composting to the multi-residential sector. Unlike leaf & yard materials, which are generally managed by lawn care providers, there are few, if any, private sector food waste collection programs in place for this sector. Therefore, it is assumed that the food waste component of SSOs generated from this sector end up in the disposal stream. This alternative would extend the SSO collection program, if implemented for the residential sector, to the multi-residential sector to increase the total amount of SSOs captured in the City.
SolidWasteManagementMasterPlanUpdate MunicipalMasterPlanProject CityofKawarthaLakes February2012 Page 70
• Provide SSO service to the IC&I sector – Similar to the multi-residential sector, a significant portion of the IC&I sector is not provided with SSO collection by the City, as a City-wide program does not exist. Therefore, the intent of providing SSO collection to the IC&I sector is to provide an opportunity to divert SSOs captured from the total waste stream in the City.
• Based on the information in Tables 2-2 and 2-3, it is estimated that approximately 950 tonnes of SSOs are available from the IC&I sector. In particular, a significant component would come from restaurants, the food service industry and institutions (e.g. schools, government offices, etc).
• Based on an initial capture rate of 30% of food waste, it is estimated that approximately 300 tonnes of SSOs could be captured. The material diverted through the IC&I sector is not considered by WDO in calculating its residential waste diversion rate and funding is not provided by WDO for this diverted material. As the program matures, the diversion of food waste would increase.
• Another important consideration is that providing SSO service to the IC&I sector could generate revenue for the City. The revenue generated by this sector could help off set the costs to provide this service to the IC&I sector. SSO collection to the IC&I sector should be a lower cost option than disposal to encourage participation in the program.
6.1.1 Transfer Station
The City of Kawartha Lakes is currently transferring recyclable materials collected in the curbside recycling program to the Northumberland MRF. Recyclable materials are picked up curbside by the collection vehicle, taken to a temporary transfer station at the Lindsay-Ops Landfill Site, packed onto large trucks and transported to the MRF in Northumberland County.
The majority of the population of the City of Kawartha Lakes is concentrated in the urban area of, and the area surrounding Lindsay. Therefore, utilizing Lornville as a transfer point for recyclable material is adding significantly to the cost of transportation incurred by the City. Representatives from WDO’s Continuous Improvement Fund (CIF) indicated to City staff (February 3rd, 2010 meeting) that they would not support a new MRF to serve the City, given the shift towards larger, regional facilities which are able to take advantage of economies-of-scale. The CIF representatives did indicate however, that WDO would support (i.e. provide funding for) a transfer station in the City.
Given the proximity of the Lindsay-Ops Landfill site to the City’s largest generator of recyclable material (i.e. the Lindsay urban area), the sites central location in the City, the minimization of transportation costs it could provide, the City should continue with the establishment of a transfer station for recyclable materials at the Lindsay-Ops Landfill site.
The CIF has approved funds for the construction of transfer stations in CKL in the amount of $432,732. This represents 42% of the estimated overall project costs. In addition, the CIF also approved CKL to purchase and install a polystyrene densifier at the Lindsay-Ops Landfill Site. CKL received $75,050 towards the purchase of the polystyrene densifier. Although the City was
SolidWasteManagementMasterPlanUpdate MunicipalMasterPlanProject CityofKawarthaLakes February2012 Page 71
approved for the densifier the project is on hold until the business case is more favourable. However with respect to the transfer station, the City is moving ahead with the intiative and plans to build the station at the existing Lindsay Ops site, beside the existing transfer building. Opportunities may also be available to the City to provide a service to other municipalities or the IC&I sector that could generate additional revenue. For example, the Regional Municipality of Niagara purchased and installed a glass crusher that produces material for sandblasting. The glass crusher system utilizes glass that cannot be marketed. Niagara Region markets this service to other municipalities and the IC&I sector and it is a net revenue generator. Such a process may be supported by the CIF and funding could be available. Such innovative solutions should be discussed with Sir Sanford Fleming College to determine if their are joint opportunities for evaluation and implementation.
6.2 Review of Waste Management Programs
6.2.1 Review of Tipping Fees & Bag Tag Rates
Tipping Fees and ‘Bag Tags’ for residual waste overages, in addition to the rate charged to municipal taxpayers, are a means by which the City finances the delivery of solid waste services.
‘A Report on the Establishment of a Waste Disposal Rate for the City of Kawartha Lakes’ (UEM, September 2002) was the first comprehensive review by the City to determine and establish the most appropriate rate to charge private haulers and other self-hauled vehicles arriving ‘at the gate’ of the City’s waste disposal facilities and to determine and establish the rate to be charged to taxpayers for municipally managed waste disposed at City landfills.
The intent of determining a waste disposal rate is to ensure that the City is able to generate sufficient funds for all capital, operating, closure and post-closure costs for the waste disposal system in both the short and long-term. It is understood that no formal review of the City’s waste diversion rate has taken place since 2002, and only in 2010 was a $90 per tonne rate implemented14 .
It is recommended that in conjunction with the implementation of the other recommendations of the Solid Waste Management Master Plan Update that the City implement a formal program for an annual review of the City’s waste disposal rate as was recommended in the 2002 UEM Report.
A current and up-to-date waste disposal rate (WDR) which is reflective of the true costs for the management of solid waste is an important component of the waste management system. In addition to being sufficient to cover the short and long term costs of waste disposal, the WDR should be set at a high enough rate to make waste disposal financially less attractive, relative to the cost of diversion. However, the City must realize that solid waste is mobile and will, over time, gravitate to the lowest cost disposal option. Having private haulers or municipal waste transported out of the City for disposal would not be consistent with one of the fundamentals of
14 Theresultsofthe2002reportsuggestedthattheCityshouldchargeatleast$80to$90pertonneatthattimeand increaseonanannualbasis. However,in2002theCityofKawarthaLakestippingfeewassetat$70pertonne.
SolidWasteManagementMasterPlanUpdate MunicipalMasterPlanProject
February2012 Page 72
CityofKawarthaLakes
waste management which is to have waste managed as close to the source as possible. When developing and implementing the program for the review of the WDR, the City will have to ensure a rate is being developed which not only provides a reasonably priced disposal system but is also high enough to provide an incentive to participate fully in diversion programs.
SolidWasteManagementMasterPlanUpdate MunicipalMasterPlanProject CityofKawarthaLakes February2012 Page 73
7.0 IMPLEMENTATION CONSIDERATIONS FOR THE UPDATED SOLID WASTE MANAGEMENT MASTER PLAN FOR THE CITY OF KAWARTHA LAKES
Figure 7-1 outlines the major components of the proposed updated SWMMP for the City.
Figure 7-1 shows the existing system and identifies a phased approach to implementing the major components. The following describes the implementation phases:
Phase 1 (Short-term, 1-2 years)
Phase 1 of the implementation program is mainly directed to the residential sector and includes the following:
• Change the existing residential curbside Blue/Green Box recycling program to have both streams (fibres and containers) picked up weekly, but still in a 2-stream process.
• Develop and implement a program for annual review of the City’s waste disposal tipping fee rate.
• Implement a City-wide weekly SSO collection program.
• Establish a centralized facility in the City for the composting of SSO materials.
• Increase public education of waste diversion programs, especially in support of the new SSO program.
• Establish a centralized transfer station for recyclable materials. The transfer station should be of an adequate size and capacity to accommodate weekly collection of both recycling, streams, in consideration of the first recommendation of the Phase I implementation program.
• Ban collection of grass clippings.
• Change the frequency of collection of the residual waste stream to every-other-week. Reduce the current weekly 2-bag/container limit by allowing 3-bags/containers EOW.
It is estimated that when Phase 1 activities are implemented, the residential diversion rate will increase to approximately 50%, with a corresponding decrease in the residential disposal rate to approximately 50%. It is further estimated that total waste diverted will increase to approximately 30% and total waste disposed will decrease to 70%.
Phase 2 (Medium-term, 3-5 years)
Phase 2 of the implementation program is mainly directed to the multi-residential, IC&I and C&D sectors and includes the following:
• Expand recycling program to the multi-residential, IC&I and C&D sector.
• Expand SSO collection program to the multi-residential, IC&I and C&D sector.
• As diversion programs are implemented in Phases 1 and 2, the City will be in a better position to estimate the amount of residual waste remaining for disposal and more
SolidWasteManagementMasterPlanUpdate MunicipalMasterPlanProject CityofKawarthaLakes February2012 Page 74
importantly the composition of that waste. Near the end of Phase 2, the City should undertake a comprehensive review of alternative waste management technologies to manage the residual waste stream. The results of the review will provide input to the next 5-year update of the solid waste master plan.
• Continue to increase public education efforts, especially focusing on the IC&I and C&D sector.
• Reduce the residential residual waste bag/container limit to 2-bags/containers EOW.
It is estimated that as Phase 1 activities mature and when Phase 2 activities are implemented the residential diversion rate will increase to approximately 65% and the residential disposal rate will decrease to approximately 35%. It is further estimated that total waste diverted will increase to approximately 45% and total waste disposed will decrease to 55%
Phase 3 (Longer-term, beyond 5 years)
• The optimization of waste diversion programs should be completed prior to considering any longer-term disposal options. Maximizing waste diversion will ensure the success and support for options required for residential disposal/management.
• At the 10-year review period for the updated SWMMP, the City should also determine whether there is a need for additional landfill disposal capacity. At that time, the potential to expand existing landfill sites or to undertake landfill mining can be considered. Input from any pilot programs undertaken in the interim in conjunction with Sir Sanford Fleming College can be considered in this review.
• Implementation of alternative disposal technology, if determined feasible
It is estimated that as Phase 1 and 2 programs and activities are implemented and mature and the City reaches Phase 3 in approximately 5 years, the residential diversion rate will reach approximately 70% and the residential disposal rate will decrease to approximately 30%. It is further estimated that upon reaching Phase 3, total waste diverted will increase to 50% and total waste requiring disposal will decrease to 50%.
SolidWasteManagementMasterPlanUpdate MunicipalMasterPlanProject CityofKawarthaLakes February2012 Page 75
Other Diversion Activities
Figure 7-1: City of Kawartha Lakes –Solid Waste Management Master Plan Update
Proposed Solid Waste Management System
•HHW
•WEEE
•Tire Recycling
•Bale and Boat Wrap Recycling
•Textile Collection
•Mulch Blade Subsidy Program
•Seasonal Leaf and Yard Material Collection & Composting
•Public Spaces Recycling Program
•Provincially Mandated Programs
Weekly Waste Collection (2 bag/week limit)
Weekly Residential SSO Collection Establish Composting Facility
•Expand Recycling to IC&I / C&D and Multiresidential
•Expand SSO to IC&I / C&D and Multi-residential

•IC&I / C&D and Multi-residential Recycling
•IC&I / C&D and Multi-residential SSO
Other Diversion Activities
•HHW
•WEEE
•Tire Recycling

•Bale and Boat Wrap Recycling

•Textile Collection

•Mulch Blade Subsidy Program
•Seasonal Leaf and Yard Material Collection & Composting
•Ban Grass Collection
•Public Spaces Recycling Program

•Provincially Mandated Programs
EOW Waste Collection (3 bags EOW)
Other Diversion Activities
Other Diversion Activities
Yellow Bag Waste Collection
Yellow Bag Waste Collection for Small IC&I / C&D

EOW Waste Collection (2 bags EOW)
Consider Alternative Technologies
EOW Waste Collection (2 Bags EOW)
Implement Alternative Technologies
Determine Role of Landfill Disposal and Need to Establish Additional Capacity
Weekly Blue/Green Box Residential Collection 2-Stream Weekly Residential SSO Collection and Composting Weekly Blue/Green Box Residential Collection 2-Stream Weekly Residential SSO Collection and Composting Weekly Blue/Green Box Residential Collection 2-Stream 2-Stream EOW Blue/Green Box Residential Collection Phase 3 (Long-Term Beyond 5 years) Phase 2 (Medium-Term 3-5 years) Phase 1 (Short-Term 1-2 years) Existing System •30% Total Diversion •70% Total Disposal •50% Residential Diversion •50% Residential Disposal •45% Total Diversion •55% Total Disposal •65% Residential Diversion •35% Residential Disposal •50% Total Diversion •50% Total Disposal •70% Residential Diversion •30% Residential Disposal •19.8% Total Diversion •80.2% Total Disposal •39.4% Residential Diversion •60.6% Residential Disposal
7.1 Updated Waste Diversion Targets
As noted in Section 1.5, the former County established diversion targets of 25% by 1992 and 50% by 2000. These diversion targets were consistent with Provincial diversion targets at that time. The former County did not achieve these diversion targets. In 2010, the City diverted 19.3% of total waste generated and 43.75% of residential waste. The June 2004 Provincial report “Ontario 60% Waste Diversion Goal – A Discussion Paper” proposed that 60% of waste generation in Ontario be diverted from disposal by the end of 2008. However, since this report was prepared in 2004, the Province has not provided any further direction or legislation specifically related to achieving this goal.
To implement proposed residential diversion alternatives outlined in this SWMMP Update, lead time will be required to adjust collection contracts, wait until a new collection contract is tendered or to fulfill obligations related to the use of the existing MRF. As such, diversion increases could take a number of years to achieve specific targets. Based on the above, Table 7-1 outlines new residential and total waste diversion targets proposed for the City:
7.2 Disposal Requirements
Implementation of activities to increase diversion will have a positive effect by decreasing the amount of waste requiring disposal and extending the life of existing landfills. The City has five, existing operating landfills. The estimated remaining capacity to December 31st, 2011 is as follows:
Based on the approximately 45,449 tonnes of waste disposed in 2011 at the five City landfills, there is approximately 22 years disposal capacity in total remaining if current waste diversion and disposal rates continue.
SolidWasteManagementMasterPlanUpdate MunicipalMasterPlanProject CityofKawarthaLakes February2012 Page 77
Year Residential DiversionTarget TotalWaste DiversionTarget 2010(current) 43.75%(current) 19.3%(current) 2012 50% 30% 2015 65% 45%
Table 7-1: Updated Waste Diversion Targets for the City of Kawartha Lakes
LandfillSite Estimated RemainingDisposal Capacity (December31st , 2010) EstimatedClosure Date EstimatedClosure DateBasedon Implementing PhaseIActivities EstimatedClosure DateBasedon Implementing Phase1and2 Activities Lindsay-Ops 750,400t • 2032 2035 2040 Fenelon 69,800t • 2020 2023 2028 Eldon 13,000t(Municipal SolidWaste-MSW) 109,000t(C&D) • October2015 (MWS) • 2047(C&D) 2050 2055 Somerville 144,000t • 2040 2043 2048 Laxton 18,700t • 2028 2031 2036 TOTAL 995,900t(MSW) 109,000t(C&D)
Table 7-2: Landfill Capacity Remaining
Implementation of Phase 1 activities, which are directed mainly to the residential sector, is estimated to decrease disposal requirements, such that the existing landfill site life will be extended by a minimum of 2 to 4 years.
Implementation of Phase 2 activities, which are directed mainly at the multi-residential and IC&I/C&D sectors will result in a further decrease in disposal requirements, extending landfill life a further to 3 to 5 years. As such implementing the diversion activities outlined in Phase 1 and 2 of this SWMMP Update could extend existing disposal life by a minimum of 5 to 9 years. Table 7-2 also identifies the estimated remaining site life of the five existing landfills based on implementing Phase 1 and 2 activities.
7.3 Implementation of a City-Wide Source Separated Organics (SSO) Collection and Composting Program
The implementation of a City-wide SSO collection and composting program is an important component of the SWMMP Update and is proposed for implementation in Phase 1. Based on recommendation of previous drafts of this SMMP update, the City initiated a feasibility study to examine the implementation of an SSO compost program15. The results of the study were presented to Council in November 2011.
The results of waste audits undertaken by Stewardship Ontario in various municipalities across the Province indicate that on average the organic stream (which comprises approximately 33% on average of the overall waste stream) is comprised of 79% food waste and 21% pet waste (seasonal leaf & yard material excluded). This breakdown is supported by the waste audit completed by the City in Fenelon Falls prior to implementation of the pilot SSO program. Therefore, if the City were to implement the SSO program as it currently exists in the Fenelon Falls pilot program, approximately 75% of organic material from the total waste stream (food waste and kitchen paper) would be included while approximately 25% of organic material from the total waste stream (yard waste and pet waste) would be excluded. Under the SSO program as proposed in SWMMP Update, pet waste could be included in the SSO collection program. This would increase the amount of organic materials eligible to be included in the SSO program to approximately 95%. Further the remaining 5% that is identified as yard material could be captured in the Fall leaf & yard materials collection program or by introducing an additional Spring collection program.
Capture rate is a term used to quantify the effectiveness of diversion programs. Capture rate considers the effectiveness of the program at diverting materials, as well as the overall participation in the program. For City-wide SSO collection a 30% capture rate after 1 year, 40% after 3 years and 50% after 5 years is reasonable to assume, based on the experience of other municipalities that have introduced SSO programs. At program maturity, a capture rate of 80% is projected for 20 years after implementation.
15 Urban&EnvironmentalManagementInc.,CityofKawarthaLakesSourceSeparatedOrganics(SSO)Compost FeasibilitySummaryReportandBusinessCase(November,2011)
SolidWasteManagementMasterPlanUpdate MunicipalMasterPlanProject CityofKawarthaLakes February2012 Page 78
Table 7-3 presents the results of the analysis of the effects of implementing a City-wide SSO collection and composting program on overall waste diversion. Table 7-3 analyzes the two scenarios as presented above. The first scenario assumes the SSO program is expanded City-wide using the same parameters as the SSO pilot program in Fenelon Falls (75% organic eligibility), the second scenario assumes that the City-wide SSO program will allow pet waste (95% organic eligibility). Under Scenario 1, a City-wide SSO program will initially increase the residential diversion rate by 7.3% which will increase to 19.0% as the program matures. Under Scenario 2, a City-wide SSO program will initially increase the residential diversion rate by 9.2% which will increase to 24.6% as the program matures.
There is still discussion in Ontario about the merits of including pet waste in an SSO program. Some municipalities claim that pet waste has a negative impact on compost quality. There is, as yet no clear determination on this. The inclusion of pet waste does not directly affect the ability to achieve AA (the highest grade of compost quality); however, the inclusion of animal waste as a feed stock material does appear to contribute to odour problems in many compost operations.16 It is recommended that the City exclude pet waste at the initial implementation of a City-wide program in order to ensure highest quality compost and to reduce the potential for odours. Consideration could be provided in the future to including pet waste in the composting program, based on the experience of other municipalities in the ensuing years. There are however, a number of feedstock materials, that if included in the SSO Composting program, would directly affect the ability to produce category AA compost. These feedstock materials are:
• Sewage biosolids - residue from a sewage treatment works following treatment of sewage and removal of effluent
• Pulp and paper biosolids - residue from the treatment of wastewater from the pulp and paper manufacturing process
• Septage - human body waste, toilet and/or other bathroom waste
The City should consider the marketability of the compost material and other approval requirements before determining whether or not to include these feedstock materials as part of the SSO Composting Program.
SolidWasteManagementMasterPlanUpdate MunicipalMasterPlanProject CityofKawarthaLakes February2012 Page 79
DraftforConsultation, MinistryoftheEnvironment
16 GuidelinesforCompostingFacilitiesandCompostUseinOntario,November2009
Table 7-3: Effects on City-Wide SSO Collection on Disposal Rates and the Residential Diversion Rate in the City of Kawartha Lakes
based on
7.4 Compost Facility Technology/Location
For the pilot SSO collection program currently being undertaken in Fenelon Falls, organic materials collected are taken to the Fenelon Landfill Site for composting. An open-windrow compost facility was established for the pilot program. An important consideration in implementing the SSO program City-wide is to consider the type of compost technology that should be considered to determine where a compost facility should be located.
7.4.1 Compost Technology
There are four basic types of compost technologies available; open-windrow, low technology covered windrows, low-technology in-vessel compost facilities and high-technology in-vessel compost facility. If the City proceeds with implementation of the SSO program City-wide and
SolidWasteManagementMasterPlanUpdate MunicipalMasterPlanProject
February2012 Page 80
CityofKawarthaLakes
Year Years After Implementation Projected Waste Generation Rate (tonnes per year) Organic Composition Rate
WDO Data Projected Capture Rate Projected Increase in Diversion Rate Current System: (75% of Organics eligible) Projected Tonnes Diverted (75% eligibility) Projected Increase in Diversion Rate Proposed System: (95% of Organics eligible) Projected Tonnes Diverted (95% eligibility) 2012 0 58,850 32.43% 30% 7.3% 4,294 9.2% 5,439 2013 1 59,606 32.43% 30% 7.3% 4,349 9.2% 5,509 2014 2 60,372 32.43% 35% 8.5% 5,139 10.8% 6,510 2015 3 61,147 32.43% 40% 9.7% 5,949 12.3% 7,535 2016 4 61,932 32.43% 45% 10.9% 6,779 13.9% 8,586 2017 5 62,728 32.43% 50% 12.2% 7,629 15.4% 9,663 2018 6 63,534 32.43% 52% 12.6% 8,036 16.0% 10,178 2019 7 64,350 32.43% 54% 13.1% 8,452 16.6% 10,706 2020 8 65,176 32.43% 56% 13.6% 8,877 17.3% 11,245 2021 9 66,014 32.43% 58% 14.1% 9,313 17.9% 11,796 2022 10 66,861 32.43% 60% 14.6% 9,757 18.5% 12,359 2023 11 67,720 32.43% 62% 15.1% 10,212 19.1% 12,935 2024 12 68,590 32.43% 64% 15.6% 10,677 19.7% 13,524 2025 13 69,471 32.43% 66% 16.1% 11,152 20.3% 14,126 2026 14 70,364 32.43% 68% 16.5% 11,638 20.9% 14,741 2027 15 71,267 32.43% 70% 17.0% 12,134 21.6% 15,369 2028 16 72,183 32.43% 72% 17.5% 12,641 22.2% 16,012 2029 17 73,110 32.43% 74% 18.0% 13,159 22.8% 16,668 2030 18 74,049 32.43% 76% 18.5% 13,688 23.4% 17,338 2031 19 75000 32.43% 78% 19.0% 14,229 24.0% 18,023 TotalOrganicsDivertedinTonnes(2012-2031) 188,104 238,262
decides to establish a facility in the City, then an evaluation of compost technologies will be required. On a preliminary basis, the following provides an overview of the various options for SSO composting:
• Open Windrow
This is the simplest form of composting. The materials are piled on outdoor pads to allow the compost process to be undertaken. Experience of other municipalities indicates that although open windrows are suitable for leaf & yard materials, significant odours can and do occur for SSOs. It is unlikely that this type of facility would be approved by the MOE for the composting of SSO materials, given recent experience in Peterborough and other locations.
• Low-Technology Covered Windrows
Low technology covered windrows are available for SSO composting. These processes are based on an aerobic, oxygen-based controlled aeration process, which results in a uniform, reliable and stable compost product. Gore Compost System facilities are representative of low technology covered windrow systems. In Ontario, facilities have been constructed in Niagara Region, Kingston and London. The ability to control odours begins with the receiving building, which is based on a negative air-pressure system and includes an air-filtration/biofilter system, and continues through the covering of the windrows using a Goretex cover. Within the piles, oxygen and moisture are controlled for optimum aerobic composting conditions. Moisture from the compost process is captured through a collection system under the compost pads and reused in the system.
•
Low-Technology In-Vessel Facilities
Low-technology in-vessel compost facilities are typically batch-type systems where material is added into a vessel and allowed to compost usually without mechanical processing. Such systems are usually modular and fully expandable.
•
High-Technology In-Vessel Facilities
High-technology indoor, in-vessel facilities have the greatest ability to manage odours. An example is the centralized compost facility recently constructed by the City of Hamilton. These types of facilities are usually significantly more expensive to construct and operate, and as such increase the cost/tonne to manage SSO materials. In-vessel facilities have also experienced operational issues including damage to building structure from ammonia and other gases released in the composting process being trapped within the facility.
If the City implements an SSO program it will have to consider the type of technology most appropriate for the City’s needs. Based on UEM’s experience and the preliminary review of
SolidWasteManagementMasterPlanUpdate MunicipalMasterPlanProject CityofKawarthaLakes February2012 Page 81
technologies, it is recommended that the City consider the low-technology covered windrows such as the Gore Cover System. A detailed discussion on the Gore Cover System is included in Appendix I.
7.4.2 Compost Facility Siting
The current SSO pilot program is utilizing the Fenelon Landfill as the location for the compost facility. The City will need to consider the most appropriate location for a facility should a Citywide SSO program be implemented. As an SSO compost facility of the size required for the City’s needs will not require EAA approval, a formal siting process is not required. However, the City should consider a location that is most appropriate for this facility. The Lindsay-Ops Landfill site property may be a reasonable location for the following reasons:
• SSO facility would be within a facility already established for waste management.
• A leaf & yard material compost facility is already an approved and established use on the site.
• The Lindsay-Ops Landfill Site is located central to the major sources of waste generation in the City.
• Existing landfill infrastructure (such as weigh scales, administration facilities, etc.) is in place to support the compost facility.
• The compost facility could utilize the landfills existing leachate and stormwater management facilities. The Lindsay-Ops Landfill site has the most comprehensive and highly engineered leachate collection and stormwater management systems of the five operating landfills in the City.
• Collection vehicles will already be travelling to the site for waste disposal. Therefore, if split-body collection trucks are used (waste and SSOs), then having the SSO compost facility at the Lindsay-Ops Landfill site would reduce transportation costs to another, separate facility.
It is recommended that the City review its overall land holdings at and surrounding the LindsayOps Landfill site to determine if the site is appropriate for the establishment of an SSO compost facility.
7.4.3 Compost Facility Ownership and Operation
The current SSO pilot program is utilizing the Fenelon Landfill Site for the composting of organic material collected. If, in conjunction with the implementation of a City-wide SSO collection and composting program, the City decides to establish a new facility, the manner in which the facility will be owned and operated will need to be determined. Options range from municipally owned and operated, to public-private partnerships, to privately owned and operated. Figure 7-2 outlines some of the factors in considering ownership and operating options for an SSO compost facility.
SolidWasteManagementMasterPlanUpdate MunicipalMasterPlanProject CityofKawarthaLakes February2012 Page 82
Some consideration that will need to be made when selecting the preferred approach for the ownership and operation of an SSO composting facility are as follows:
• The type of facility selected by the City will have a significant effect on the ownership/operation format selected. Each type of facility/technology has different requirements. For example, staff, resources, level of expertise, initial costs, etc. Once the City has selected a preferred option for the facility/technology an evaluation of the City’s capability to own and operate that type of facility will need to be made. The more complex a facility, the more likely that specialized operations/experienced operators will be required.
• A site will be required within the City for the SSO facility, regardless of the ownership/operation format selected. This will allow SSO material and other organic feedstock to be composted at the facility to be managed as close to the source of generation as possible. As previously discussed, the Lindsay-Ops Landfill site is a reasonable location, along with numerous other advantages, it is centrally located in the City.
• The involvement of the private sector will provide a number of opportunities and challenges. Compost technology vendors will be soliciting different products, technologies, or levels of service to the City and in return will be seeking varying levels of risk, involvement and forms of compensation. The City should have an understanding of the business model of a variety of vendors in order to best maximize the benefits to the City and to minimize the costs and issues. For example, under the privately owned and operated format, vendors may be seeking land for the facility, guaranteed feedstock over the long-term and a tipping fee for organics received. Whereas other private sector vendors may be seeking to sell or lease technology to the City.
• Regardless of the ownership/operation format selected, the facility will have to be appropriately licensed and the operator will have to be qualified.
SolidWasteManagementMasterPlanUpdate MunicipalMasterPlanProject CityofKawarthaLakes February2012 Page 83
Facility Ownership/ Management Considerations MunicipallyOwned andOperated MunicipallyOwnedand PrivatelyOperated PrivatelyOwned andOperated Control Decreases Risk Increases Cost Increases Resource Requirements Decreases
Figure 7-2: Considerations in the Ownership and Management of an SSO Compost Facility
7.5 Amendment of Solid Waste Management By-law to Support an SSO Collection and Composting Program
The City has in place By-Law No. 2007-024 dealing with the collection, removal and disposal of solid waste within the City of Kawartha Lakes. In support of the implementation of a City-wide SSO collection and composting program the Solid Waste Management By-Law should be amended. The amendment should include definitions for the SSO program and ancillary services, include a description of the sectors eligible for inclusion in the program, a discussion on the materials which would be eligible for collection, and a description on the method of collection including approved containers. The amendments to the by-law in support of the Citywide SSO collection and composting program should be completed in conjunction with amendments which may be required in support of other recommendations of the SWMMP Update.
7.6 Results of the SSO Compost Feasibility Study
Phase 1 of the SSO Compost Feasibility Study (November 2011) examined:
• Various SSO composting technologies
• Potential location for an SSO facility in the City
• Approvals requirements
• Implementation considerations
• A business case analysis for implementing an SSO collection and composting program
The major conclusion and recommendations of the Phase 1 Study were that a low-technology covered windrow facility such as the Gore composting process should be implemented at the Lindsay-Ops Landfill site, which is the most centrally located and most appropriate location. A detailed discussion of the Gore system is included in Appendix I. The City should initially implement the program in urban areas only and should discuss opportunities to provide compost processing capacity to other municipalities, including Peterborough and Northumberland. The feasibility study also estimated that there would be an approximately 6% to 8% increase in total net waste management system costs to implement the program.
7.7 Extended Producer Responsibility (EPR)
7.7.1 Introduction
Extended producer responsibility (EPR) is an environmental policy approach in which a producer’s responsibility for a product, physical and/or financial, is extended to the postconsumer stage of the product’s life cycle. There are two primary characteristics of EPR programs. First, responsibility for end-of-life management is shifted to the producer (i.e. the manufacturer, brand owner or first importer), away from municipalities and municipal tax payers. Secondly, producers are provided with incentives to consider environmental concerns in the design of their products and packaging. EPR shifts the responsibility for waste diversion to those that are best able to influence and control decisions throughout the life cycle of a product or package.
SolidWasteManagementMasterPlanUpdate MunicipalMasterPlanProject CityofKawarthaLakes February2012 Page 84
7.7.2 Current EPR Programs in Ontario
In Ontario, EPR programs are legislated through the Waste Diversion Act (WDA), 2002. There are currently four such programs:
The Blue Box Program – Industry Stewards currently pay 50 percent of the cost of collection and processing Province-wide. The program only applies to the residential sector.
The Municipal Hazardous or Special Waste Program (MHSW) – Industry Stewards are responsible for the full cost of Phase 1 of the program from collection to final diversion or disposal. The MHSW program applies to the residential sector and a small portion of the IC&I sector. Phases 2 & 3 of the program were launched in July, 2010, but because of issues related to the program, as of October 2010, Industry Stewards are not responsible for costs related to Phase 2 & 3 of the program. As of October 2010 the Provincial government and municipalities are bearing the cost while the program plan is being updated.
The Waste Electrical and Electronic Equipment Program (WEEE) – A financial incentive of $165 per tonne is available to all registered collection locations for approved WEEE materials which have been collected and prepared for transport. The WEEE program applies to both the residential and IC&I sector. The City of Kawartha Lakes uses a different collection and transportation model and receives $150 per tonne plus transportation costs from the Ontario Electronic Stewardship (OES).
The Used Tire Program – Industry stewards fully fund and operate the program, and the program applies to all passenger vehicle, truck and off-road tires.
7.7.3 Detailed Elements
Producers are responsible for preparing an individual stewardship plan for their designated products or must be part of an Industry Funding Organization (IFO) with other designated producers. Stewardship plans are required to address the full life cycle of the designated product and must assume full financial and operational responsibility for the collection of the end-of-life management of the designated product. Producers and IFOs are also required to report on the ultimate disposition of materials recovered by the EPR program.
In a complex and competitive national and global business market, signals to producers from a relatively small market like Canada, let alone the City of Kawartha Lakes, may not be strong enough to influence new environmentally conscious product design and supply chain management. The environmental objectives of EPR may therefore be supported by a range of voluntary, negotiated or regulatory programs and activities, as outlined in the Table 7-4 below.
SolidWasteManagementMasterPlanUpdate MunicipalMasterPlanProject CityofKawarthaLakes February2012 Page 85
Table 7-4: Considerations for Extended Producer Responsibility
TypeofEPRor StewardshipApproach
Producttake-backprograms
Procurement/consumer programs
Regulatoryapproaches
• Mandatorytake-back
Examples
• Voluntaryornegotiatedtake-backprograms
• Procurementguidelinesandpolicies
• Informationdisclosureprograms
• Prohibitionsofcertainhazardousmaterialsorproducts
• Disposalbans
• Mandatedrecycling
Voluntaryindustrypractices
• Voluntarycodesofpractice
• Public/privatepartnerships
• Leasingand"servicizing"(inwhichcompaniesasdiverseasphotocopy manufacturerstocarpetmanufacturersleasetheirproductsorprovideservices, therebyretainingownershipoftheproduct,includingresponsibilityforitsendof-lifedisposal)
Economicinstruments
• Specialtaxes
• Productcharges
• Advancedisposalfees
• Deposit/refundschemes
• Subsidiesandtaxcreditsfortheproductionanduseofenvironmentally preferableproducts
Sharing responsibilities across the product chain is an inherent part of EPR. While the policy mechanism is called Extended Producer Responsibility it should be noted that all participants in the product chain must participate in order to optimize its effects.
As a part of the Canada-wide Action Plan (CAP) for EPR, jurisdictions must commit to implementing the following priority materials within the first six years of the adoption of the plan:
• Packaging
• Printed materials
• Mercury containing lamps
• Other mercury-containing products
• Electronics and electrical products
• Household hazardous and special wastes
• Automotive products
SolidWasteManagementMasterPlanUpdate MunicipalMasterPlanProject CityofKawarthaLakes February2012 Page 86
7.7.4 Examples of EPR Programs
British Columbia
In 1997, British Columbia enacted the Beverage Container Stewardship Program Regulation. This regulation required all beverage brand-owners of ready-to-drink beverages (with the exception of milk, milk substitutes, liquid meal replacements and infant formula) to establish a Province-wide collection system for returned beverage containers, under a deposit-refund system. The regulation set a minimum 85% recovery rate target and required that redeemed containers be either refilled or recycled. Encorp Pacific, an IFO, manages the recovery system for non-alcoholic beverage containers and ensures that they are recycled at designated service locations. In 2000 the ‘Return It’ program managed almost 600 million beverage containers. The overall recovery rate was 81%.
Ontario
A primary example of an EPR system is the Brewers Retail in Ontario. The Beer Store is unique in that it takes back all of the packaging materials that it sells. With a recovery rate of 95% on the industry standard bottle, The Beer Store is one of the most successful waste diversion programs in Ontario, and North America. The costs associated with the system are recovered from fees applied to brewers.
Germany
In 2003, the German government implemented a deposit system for single-use containers. Producers and retailers are obliged to take back beverage containers at every point-of-sale, either manually or by machine.
An IFO also exists in Germany that collects used packaging from households, and sorts and recycles these materials. In 2006, more than half of municipal and production waste in Germany was recycled. In some areas, including packaging, more than 80% was recycled.
7.7.5 Implications of EPR to the SWMMP Update
As EPR programs continue to expand, there are potential implications to municipal solid waste management programs. EPR shifts the responsibility for end of life management of products/goods from the consumer/municipalities to the manufacturers and first importers (i.e. the stewards). The intent is for the product stewards to limit the environmental impact of their products and the packaging associated with it, by either reducing the amount of product/package that eventually has to be disposed or to provide service or funding to manage the material.
As seen from the initial examples in Ontario, the stewards in the Blue Box, MHSW, WEEE and Used Tire programs have directed funds to the programs; however, the municipality still has an important role in curbside collection or allowing for the centralized collection of these materials. It is unlikely that this approach will change in the short term.
If EPR moves in a direction that reduces or removes management of materials by municipalities (i.e. the Brewers Retail deposit model), then there are significant implications to municipalities.
SolidWasteManagementMasterPlanUpdate MunicipalMasterPlanProject CityofKawarthaLakes February2012 Page 87
Such a model reduces the amount of materials that a municipality has access to and could seriously impact the economies of municipal waste management. As discussed, “need” is an important consideration in obtaining EAA approval for waste management facilities, particularly landfills and thermal treatment facilities. If the type and quantity of waste material are significantly impacted by EPR programs, then the ability to show “need” may be impacted or at a minimum, delayed. For facilities that reply on a minimum daily feedstock (i.e. EFW, thermal treatment), this is even more important than other types of facilities (i.e. compost, landfill). However, even those facilities would see higher per tonne operating costs as feedstock is reduced. Another important implication is the impact to the economics of certain programs. If, for example, EPR programs result in a deposit system for aluminum cans, then one of the major sources of revenue for municipal Blue Box recycling programs would be removed. This would significantly impact the cost to provide curbside collection of remaining Blue Box materials.
Given the recent negative publicity in 2011 of the Province of Ontario’s plan to introduce Eco Fees and the subsequent elimination of that program, it is unlikely that EPR programs will have a significant negative impact on municipal waste management programs in the short term. As seen from current programs, product stewards would prefer a continued role of the municipality in collection/management with stewards providing funding. However, EPR program development should continue to be monitored. As the City moves towards the five and ten year reviews of the SWMMP Update, the implications of EPR programs should be reviewed especially with respect to need and where decisions on major future capital facilities are to be made.
SolidWasteManagementMasterPlanUpdate MunicipalMasterPlanProject
February2012 Page 88
CityofKawarthaLakes
8.0 CONCLUSIONS AND RECOMMENDATIONS
8.1 Conclusions
The following are the conclusions resulting from the update of the Solid Waste Management Master Plan for the City of Kawartha Lakes:
• The current SWMMP was prepared in 1993. Significant progress has been made in the City since that time to implement programs to increase diversion.
• The City has a relatively high residential Blue Box recycling and overall diversion rate relative to similar size municipalities in Ontario. The 2010 residential diversion rate for the City was 43.75% and the average residential diversion rate over the 3 year period (2008 to 2010) is approximately 41%.
• The residential diversion rate over the 2008 to 2010 period has stabilized, suggesting that current diversion programs have almost fully matured.
• Waste composition studies indicate that organics represent the largest single source of material in the waste stream not currently being diverted.
• The City is operating a successful pilot SSO collection and composting program in Fenelon Falls.
• SSOs represent the greatest remaining ‘major’ opportunity to substantially increase diversion.
• Low-technology composting technologies exist, such as the Gore Cover system, that reduce odour associated with open windrow SSO compost facilities, but do not have the high capital and operating costs of fully enclosed high-technology in-vessel composting facilities.
• The establishment of a MRF in the City is not supported by current Provincial direction or funding initiatives. The Province supports fewer, larger/more regionally located MRF’s that operate more economically and efficiently based on economies of scale.
• Given the central location of the Lindsay-Ops Landfill site to the major population centre in the City, it is an appropriate location for the establishment of a recyclable materials transfer station and an SSO compost facility.
• The City does not have control over the management of multi-residential, IC&I and C&D waste. The City receives waste at its facilities for disposal from these sectors but manages little to none of the diversion stream.
• Landfill capacity in the City is a finite resource. Based on current disposal rates, there is approximately 22 years of disposal capacity remaining at existing City landfills. This could increase by 5 to 9 years based on implementation of diversion activities proposed in the SWMMP Update.
SolidWasteManagementMasterPlanUpdate MunicipalMasterPlanProject CityofKawarthaLakes February2012 Page 89
• The City has a unique and advantageous relationship with Sir Sanford Fleming College that will allow it to be on the forefront of waste management programs and technologies. The agreement with Sir Sanford Fleming College will provide opportunities to examine various recommendations from the SWMMP Update leading to the creation of a “Centre of Excellence” for waste management in the City.
• There have been many advances in alternative disposal technologies in the past few years in Ontario, Canada and North America. A number of Ontario municipalities are in final stages of approvals for alternative technology facilities and/or in preliminary stages of implementation. Alternative disposal technologies consider waste as a resource as opposed to an end repository such as a landfill. The City has received information from technology vendors that provide opportunities for incineration. More specifically, the York-Durham EFW facility could provide an opportunity for the management of the City’s residential waste stream.
SolidWasteManagementMasterPlanUpdate MunicipalMasterPlanProject CityofKawarthaLakes February2012 Page 90
8.2 Recommendations
The following are the recommendations from the update of the Solid Waste Management Master Plan for the City of Kawartha Lakes that:
1. The City accepts the results of the SWMMP Update and adopts the recommended Implementation Plan.
2. The City proceed in the short-term (Phase 1) with programs that are directed at the residential sector and include:
• Change the existing residential curbside Blue/Green Box recycling program to have both streams (fibres and containers) picked up weekly.
• Develop and implement a program for annual review of the City’s waste disposal tipping fee rate.
• Implement a City-wide weekly SSO collection program.
• Establish a centralized facility in the City for the composting of SSO materials.
• Increase public education of waste diversion programs, especially in support of the new SSO program.
• Establish a centralized transfer station for recyclable materials. The transfer station should be of an adequate size and capacity to accommodate weekly collection of both recycling streams, in consideration of the first recommendation of the Phase I implementation program.
• Ban collection of grass clippings.
• In support of implementing an SSO composting program, change the frequency of collection of the residual waste stream to every-other-week (EOW). Reduce the current weekly 2-bag/container limit by allowing 3-bags/containers EOW.
• Consider closing the Laxton Landfill in the winter months as a cost savings measure. Residents’ level of service would still be maintained through the curbside collection program and the availability of the Somerville Landfill, which is in close proximity.
3. Based on the results of the implementation of Phase 1 activities, the City proceed with Phase 2, medium-term implementation activities in the next 3 to 5 years. Phase 2 activities are mainly directed at the multi-residential, IC&I and C&D sectors. Prior to implementation, these activities should be reviewed to ensure they are still feasible and relevant and meet the goals and objectives of the SWMMP.
4. The review of alternative technologies occurs in Phase 2 (next 3 to 5 years) as other diversion alternatives are implemented and their impact on diversion and disposal rates and residual waste composition is realized. The need for additional landfill disposal capacity including the evaluation of expanding existing landfills or to undertake landfill mining to gain disposal capacity should be reviewed at the 10-year SWMMP review period.
SolidWasteManagementMasterPlanUpdate MunicipalMasterPlanProject CityofKawarthaLakes February2012 Page 91
5. Landfill should continue to be the primary method of disposing of residual waste in the short to medium-term (i.e. next 3 to 5 years). The City should focus on alternatives to landfilling and thinking of waste as a resource for the future.
6. The City should further its opportunities with Sir Sanford Fleming College, with a goal of establishing a “Centre of Excellence” in waste management. Specific activities resulting from the SMMP Update that should be undertaken by the City, that could be developed/evaluated with Sir Sanford Fleming College include:
• Landfill mining pilot program
• Evaluation of alternative daily cover, including consideration of ground construction and demolition material for daily cover use
• Examine wetland treatment as a low-cost leachate treatment option, especially for closed landfills
7. The following waste diversion targets be adopted:
8. The SWMMP should continue to be reviewed every five years.
9. The Solid Waste Management Division of Public Works should prepare an Annual Report to Council that outlines progress to implementing the SWMMP Update recommendations, major initiatives undertaken in the year, the diversion rate relative to the proposed new diversion targets and remaining disposal capacity. The Annual Report should also be posted on the City’s web-site for review.
SolidWasteManagementMasterPlanUpdate MunicipalMasterPlanProject CityofKawarthaLakes February2012 Page 92
TargetYear ResidentialWaste Diversion TotalWaste Diversion 2012 50% 30% 2015 65% 45%