Local
Finances and the Green Transition Managing Emergencies and Boosting Local Investments for a Sustainable Recovery in CEMR member countries

the support of the European Union
With
Local Finances and the Green Transition 2 Table of Contents Executive Summary ............................................................................................................................................................ 7 Objectives and methodology ......................................................................................................................................... 12 Scope and structure of the report 12 A Decade of Local Finances: Two Crises and the Intervening Period ........................................................................ 14 1. Macroeconomic environment and public finances ............................................................................................. 15 2. Decentralisation trends in Europe ........................................................................................................................ 19 Regional disparities 23 3. Budget expenditure and investment patterns .................................................................................................... 25 Diverse options for countries with fragmented or amalgamated municipal models 26 Local functions ........................................................................................................................................................................................................ 28 Spending efficiency................................................................................................................................................................................................ 31 Capital expenditure 33 Local green investments 36 4. Revenue assignment and taxation ...................................................................................................................... 40 Revenue decentralisation and grant dependency ......................................................................................................................................... 40 Differences in local revenue policies 44 Changes in local taxation 44 Local tax autonomy 47 5. Budget balance and debt ..................................................................................................................................... 50 Local borrowing ...................................................................................................................................................................................................... 50 Local indebtedness 51 6. Public financial management ................................................................................................................................ 53 Fiscal rules .............................................................................................................................................................................................................. 53 Budget openness ................................................................................................................................................................................................... 54 Transparency and accountability 55 7. The Recovery and Resilience Facility and subnational governments ................................................................ 57 RRF objectives and management 57 RRF grants and decentralisation ................................................................................................................................................................... 58 RRF pillars ................................................................................................................................................................................................................ 58 RRF pillars of high local significance 60 Preferred policy areas by pillar priority 62 Green transition 62 Social and territorial cohesion ........................................................................................................................................................................... 63 Health and resilience ............................................................................................................................................................................................ 66 Policies for the next generation ....................................................................................................................................................................... 67
Local Finances and the Green Transition 3 Grants by thematic area 68 National plans from LRGs’ perspective 69 Evaluation and monitoring ............................................................................................................................................................................ 70 The role of local and regional governments ............................................................................................................................................ 70 Future of local monitoring 71 8. Conclusions and recommendations ...................................................................................................................... 73 Responding to the two crises: from cooperation and partnership to coordinated actions...................................................... 73 Local impact of economic regulations ........................................................................................................................................................ 74 Managing administrative-territorial reforms 74 Diverse expenditure assignment influences economic recovery 75 Local capital investments matter 76 Local revenue autonomy for crisis management and pollution control 76 Public Financial Management......................................................................................................................................................................... 77 The Recovery and Resilience Facility: an opportunity for local governments ............................................................................... 77 References ........................................................................................................................................................................ 79 Annex................................................................................................................................................................................ 80 Annex 1. Data sources and statistical terms 80 Annex 2. Troika intervention in Portugal ............................................................................................................................................................... 81 Annex 3. Financing the ecological transition ...................................................................................................................................................... 83
LIST OF FIGURES
Local Finances and the Green Transition 4 TABLE OF CONTENTS
Figure 1 Economic development stages, CEMR countries, euro area 15 Figure 2 High general government expenditure in the European welfare states ........................................................................................... 16 Figure 3 General government debt and net borrowing, 2020 .............................................................................................................................. 18 Figure 4 Country population and municipality (first tier government) population size, 2020 19 Figure 5 Regional differences: ratio of GDP per capita in richest and poorest NUTS2 region, 2019, change between 2010-2019 24 Figure 6 Stable level of decentralisation in CEMR countries, 2010-2020 25 Figure 7 Increased local spending in more decentralised countries ................................................................................................................... 26 Figure 8 Composition of local and regional*/ government expenditure by function ...................................................................................... 29 Figure 9 Human services dominate local expenditure, 2019 30 Figure 10 Scope of decentralisation and standardised local current expenditure, 2018 31 Figure 11 High subnational government capital investment responsibilities 34 Figure 12 Impact of the crises: diverse subnational capital expenditure policies over the decade (2010-2020/most recent year) 35 Figure 13 Subnational tax decentralisation, 2010-2020 ....................................................................................................................................... 40 Figure 14 Grant dependency, 2020 and changes between 2010-2020 42 Figure 15 Income and property tax-based local tax systems, 2020 44 Figure 16 Restructuring local taxation 2010-2020: 45 Figure 17 Experimenting with tax on income ........................................................................................................................................................... 46 Figure 18 Move towards tax on land, buildings........................................................................................................................................................ 46 Figure 19 Autonomy in setting the majority of local government taxes, 2018 48 Figure 20 Managing government deficit, selected CEMR countries, 2010-2020 50 Figure 21 Lower impact of pandemic on subnational government borrowing 51 Figure 22 Fiscal Rules Index, EU countries, 2019 53 Figure 23 Open Budget Index, 2019 ............................................................................................................................................................................ 54 Figure 24 Lower corruption coincides with higher decentralisation ................................................................................................................ 55 Figure 25 Statistical Performance Indicator, 2019 56 Figure 26 Subnational expenditure and RRF grants per capita 58 Figure 27 RRF grant spending by pillar (primary and secondary) 59 Figure 28 Share of green transition expenditure and decentralisation ............................................................................................................. 60 Figure 29 Share of RRF grants by country and decentralisation (selected primary pillars) ......................................................................... 61 Figure 30 Share of RRF grants by country and decentralisation (selected secondary pillar) 62 Figure 31 Expenditure supporting green transition by policy area 63 Figure 32 Social and territorial cohesion pillar: expenditure by policy area 64 Figure 33 Territorial infrastructure, rural development and decentralisation .................................................................................................. 65 Figure 34 Health and resilience pillar: expenditure by policy area .................................................................................................................... 66 Figure 35 Ratio of next generation grants and share of education expenditure in local budgets 67 Figure 36 Clean power, digital public services and decentralisation 69
Local Finances and the Green Transition 5 TABLE OF CONTENTS LIST OF TABLES Table 1 Subnational government finances: areas of analysis and indicators 13 Table 2 Municipal mergers and territorial consolidation 20 Table 3 Main types of local governments in CEMR member countries .............................................................................................................. 27 Table 4 Composition of subnational government current expenditure, 2018 .................................................................................................. 32 Table 5 Subnational government capital formation as % of general government in selected services, EU countries, 2019 36 Table 6 Number of local governments that adopted and implemented local disaster risk reduction strategies, 2018 37 Table 7 Consolidated subnational government gross debt 51 Table 8 RRPs on territorial cohesion ............................................................................................................................................................................ 65 Table 9 RRP responsiveness ............................................................................................................................................................................................ 69 Table 10 Assessment of the Recovery and Resilience Plans 70 Table 11 Local government involvement in preparing the national RRPs 71 Table 12 Implementation of the Recovery and Resilience Plan 71 LIST OF BOXES Box 1 – Fiscal policy changes hit local budgets in Serbia 16 Box 2 – The Austrian Stability Pact .............................................................................................................................................................................. 17 Box 3 – Territorial reforms of first tier local governments .................................................................................................................................... 21 Box 4 – Territorial-institutional reforms in France 22 Box 5 – Decentralisation of State competences in Portugal 23 Box 6 – Decentralisation reforms in Estonia: Devolution to amalgamated municipalities 27 Box 7 – Austria: Increase in unfunded mandates during the two crises ........................................................................................................... 31 Box 8 – Solar Energy Agreements in Turkey............................................................................................................................................................... 32 Box 9 – Facilities for Syrian Refugees in Turkey 36 Box 10 – Local investments in urban public transport in Austria 37 Box 11 – Car-Free Avenue project in Tartu, Estonia 38 Box 13 – Nation Garden Model in Turkey ................................................................................................................................................................... 39 Box 14 – Local tax reforms in Austria and France ................................................................................................................................................... 41 Box 15 – Municipal financial support programmes and subsidies 43 Box 16 – Development charges in Austria 44 Box 17 – Local tax reforms in Serbia 45 Box 18 – Tax incentives for municipal waste reduction in France 47 Box 19 – Shift from a local tax towards revenue sharing in France................................................................................................................... 49 Box 20 – Local government debt regulation in Estonia 52 Box 21 – Spain: Implementing the Spanish Urban Agenda – rehabilitation and regeneration plan 63 Box 22 – Romania: Component 10 – Local Fund 64 Box 23 – Latvia: Reducing inequalities through administrative territorial reform 65 Box 24 – Austria: Interventions for increased subnational government resilience ........................................................................................ 67 Box 25 – Croatia: Reform of the educational system .............................................................................................................................................. 68
Acknowledgements
This report was produced by CEMR under the direction of Nathalie Noupadja (former Head of Research and Studies) by Gábor Péteri (Consultant). The author would like to thank the CEMR member associations and their partners from Austria (KDZ), Estonia (ELVL), Finland (AFLRA), France (Banque Postale), Portugal (ANMP), Serbia (SKGO) and Turkey (UMT) who reported on financial mechanisms and city cases, as well as Marlon Hilden (CEMR) who contributed to the chapters on capital investments. Their valuable input has been greatly appreciated.
Special thanks go to Alexandra Schantl and Karoline Mitterer from KDZ, Austrian Centre for Public Administration Research, and Elton Stafa from NALAS, the Network of Associations of Local Authorities, for the precious help, input and comments they provided throughout the report’s elaboration. CEMR and the author would also like to give sincere thanks to UCLG, Serge Allou and Paloma Labbé in particular, and the OECD and Isabelle Chatry for their invaluable advice and work on the World Observatory on Subnational Government Finance and Investment, which was a key resource in developing this report.
Finally, we would like to acknowledge and convey our gratitude to Marine Gaudron, Axelle Griffon, Aleksandra Garo, Marlon Hilden and Marlène Siméon from the CEMR Secretariat for their important and constructive comments in producing this report.
Acronyms
COFOG Classification of the Functions of Government
CPI Corruption Perception Index
EMU European Monetary Union
GHG Greenhouse Gases
GGE General Government Expenditure
LRG Local and Regional Governments
NALAS Network of Associations of Local Authorities of South-East Europe
NUTS Nomenclature of Territorial Units for Statistics
PFM Public Financial Management
PIT Personal Income Tax
RRF Recovery and Resilience Facility
RRP Recovery and Resilience Plans
SNG Subnational Governments
SPI Statistical Performance Indicator
UMT Union of Municipalities of Turkey
WOFI World Observatory on Subnational Government Finance and Investment
Local Finances and the Green Transition 6
Executive Summary
This report provides an analysis and an explanatory synthesis of the evolution of subnational finances in CEMR member countries during the decade of 2010-2020. It also evaluates climate change-related aspects of local finances, primarily local capital spending on green investments.
The study is based on the comparative fiscal data available for this rather diverse group of countries. Information collected from selected CEMR countries and evaluations of national plans produced for the European Union’s Recovery and Resilience Facility supplement the fiscal analysis.
Periods of economic growth and public sector development
Even though the economic crisis was already a reality at the start of the decade, local governments only began to contend with its long-term consequences in 2010-2012. A confluence of contracting economies, high general government debt and increased unemployment all severely affected local budgets.
By the middle of the decade, a gradual recovery was underway amidst a stagnating, deflationary economic environment. During this period, even while private sector involvement in public service provision started to decline, economic consolidation took place through new forms of partnership between government tiers. Moving beyond economic concerns, local policies also began to respond to climate change and to expand local actions for sustainable development.
The year 2020 marked the onset of a third period with the global eruption of the COVID-19 pandemic, which produced a “scissors effect” of higher expenditure and revenue losses for both national and local governments. Unlike their response to the economic crisis a decade earlier, national governments and the international financial institutions promptly initiated coordinated countercyclical policies and launched intensive stimulus programmes.
The macro-economic environment and public finances
This economic environment was a determinant in the local scope for manoeuvre. In the first part of the past decade, public spending was confined by the hard budget constraints. High general government debt limited local spending and subnational borrowing. Slow economic growth reduced municipal revenue-raising options. Gradually, towards the middle of the decade, budget conditions did begin to normalise even if there were striking variances among CEMR countries. During the first year of the pandemic, all economies contracted. These losses were partially offset by countercyclical fiscal policy measures: wage subsidies, special spending programmes, reduced taxes. In contrast to the earlier economic crisis, these active fiscal instruments created a more favourable economic environment for the government sector. Nonetheless, the economic decline triggered by the eruption of the pandemic proved to be more severe from the start and in the years that followed.
European welfare states provide a broad range of public services and manage numerous government functions. In 2010, the general government expenditure (GGE) ratio had been close to 45% of GDP but fell under the restrictions and economic growth to 41% by 2017-2019. Owing to high government spending programmes and a shrinking economic base, government expenditure again increased, reaching 50% of GDP in the first year of the pandemic.
Significant differences in the GGE ratio can be seen among CEMR’s member countries. In the Scandinavian countries, France, Belgium, Austria, Greece and Portugal, general government expenditure exceeded 50% of GDP, whereas in North Macedonia, Turkey, Albania, Kosovo and Georgia, it did not even reach 35% of GDP.
Government indebtedness increased throughout the decade until 2017, when it declined for a short time, before rising again to 80% of GDP by 2020. Currently, 15 CEMR countries are well above the Maastricht limits.
Local Finances and the Green Transition 7
Decentralisation trends in Europe
After the 2008-2009 economic crisis, subnational governments were in the centre of economic and fiscal policies. They aimed to eliminate public spending inefficiencies, to utilise revenue-raising options and to limit overall government debt. Using an economies-of-scale approach, administrative reforms promoted larger municipalities (or inter-municipal cooperation) in order to lower service unit costs and to create networks of sizable local governments, more manageable from the centre.
As local government structures in CEMR countries are very diverse, the possible ways to carry out these amalgamation reforms ran the gamut as well. Still, several CEMR countries were able to successfully implement administrative territorial reforms (Albania, Austria/Styria, Estonia, Latvia, Ukraine). Economic growth in the past decade occurred alongside regional differentiation. The distance between the basic (NUTS2) regions with the highest and lowest GDP value per capita increased (from 2.37 (2010) to 2.46 (2020), averages based on 36 countries). In terms of population size, the average weight of capital cities increased slightly (by 1%) in CEMR countries over the past decade. The share of national capitals in countries with more concentrated urban networks further increased (Estonia, North Macedonia, Portugal, Finland).
Budget expenditure and investment patterns
The scope of decentralisation did not change significantly in CEMR countries from 2010 to 2020. Overall, subnational government expenditure amounted to a share of 25% in total general government expenditure. In terms of finance, however, rather diverse fiscal decentralisation policies were followed in CEMR countries during this period. Subnational governments’ share of overall government spending increased in two federal countries (Belgium, Germany), in countries with already extended local services (e.g. Denmark, Sweden), and in those with a relatively low baseline (e.g. Albania, Ukraine). Radical centralisation policies (those lowering subnational governments’ share of general government spending by 5% or more) were implemented in Hungary, Georgia, Spain and the UK.
The more decentralised countries experienced an increase or lower cuts in subnational spending than the centralised ones, which lost more of their spending powers. Past public sector characteristics seem to determine future paths.
Local functions and responsibilities
Subnational governments provide a wide range of services with huge variations among CEMR countries. Moreover, the options for rationalising municipal expenditure and crisis management very much depend on the extent and form of decentralisation, i.e. the type of local public services provided.
Education represents the largest expenditure item in the budget of subnational governments; it comprises more than one-fifth of local and regional governments’ budgets. In federal countries, social services and health care each represent 19% of regional governments’ total expenditure. As they also manage infrastructure network services (e.g. transport), spending on economic affairs is significant (13%).
Locally provided services greatly differ among the CEMR countries. Health care and social service budgets are correlated with the scope of decentralisation. The share of public education, health care and recreational services marginally increased between 2010 and 2019.
After the 2008-2009 economic crisis, subnational governments everywhere operated under a constant pressure to improve the efficiency of their administration and other locally provided services. According to the indicator on standardised costs (current expenditure per capita as percentage of GDP per capita), options for future efficiency savings do exist for the transition countries of Central and Eastern Europe, Italy and the Western Balkan countries and Turkey. However, local service efficiency improvement is generally determined by the prevailing labour costs, which represent an average of 46% of current expenses in the CEMR countries.
Local Finances and the Green Transition 8 EXECUTIVE SUMMARY
Capital expenditure
Subnational governments are responsible for a significant part of all government capital expenditure even though capital investments may only represent 15-18% of total subnational expenditure. In the past decade, this ratio decreased even further in the less decentralised countries (e.g. Montenegro, Serbia, Bosnia and Herzegovina, Slovakia) or where recentralisation reforms were implemented (e.g. in Hungary).
Subnational governments’ powers extend to managing capital expenditure on green investments. Most subnational capital investments are currently implemented in infrastructure and communal and utilities sectors. The investment gap to meet the EU’s climate mitigation goals, estimated at EUR 350 billion a year plus an additional EUR 130 billion for other environmental objectives, can be bridged by mobilising private and public financial resources, an area where subnational governments can play an important role. Indeed, getting the local and regional levels fully involved in decarbonisation strategies and their financial architecture is the key to achieving national as well as European climate and sustainability objectives.
Revenue assignment and taxation
Subnational governments control a significant part of taxes in the decentralised Scandinavian countries and in federal Germany and Spain (with more than 25% of all government taxes collected). In response to the fiscal challenges of the economic crisis, countries with a higher local tax revenue share increased local taxes further, while the less decentralised countries decreased their local tax share.
Grant dependency, measured by the ratio of intergovernmental transfers and grants in subnational budgets, was calculated at more than 60% of subnational budget revenue on average. No general pattern of change in the grant dependency ratio has been identified over the past decade. The factors behind any specific perceptible changes are country-specific: the overall budget restrictions (e.g. Greece), the radical recentralisation of local functions (e.g. Hungary) or the transformation of tax policies (e.g. France).
Local taxation systems in the CEMR countries are predominantly based on income (personal, profit) or land and building taxes. Local property taxation is used in the less decentralised and smaller countries, where taxes on land and buildings usually constitute the primary source of local tax revenue. Local tax systems only underwent marginal changes during the post-crisis period.
Several trends have been identified. In some countries, the local tax burden on businesses and production decreased and there was a shift towards property taxation; whereas in others, there was a slight move away from property taxation and experimentation with either income-based taxes (income, profits, capital gains) or taxes on products (sales, excise, motor vehicles, etc.). Countries with local income taxation pursued diverse policies. In light of the foregoing, some convergence of local taxation systems can be observed. The level of tax autonomy itself remained stable over the past decade.
Budget balance and debt
In the beginning of the past decade, local governments had to borrow amidst a restrictive fiscal environment. By the end, in the first year of the pandemic, the financial burden had fallen primarily on the national budget and in the federal countries on state governments.
Local governments operate under a balanced budget requirement and borrowing represents a minor source of budget revenue. In the 36 countries where comparative data was available, subnational government debt remained at a manageable level. Due to strict fiscal rules and regulated borrowing procedures, accumulated debt was kept stable and below 4% of GDP at the first tier local level. However, in the federal countries, state government debt reached 15% of GDP and increased even further during the first year of the pandemic (17.5%).
Public financial management
Selected aspects of public financial management (PFM) round out the data analysis on the overall quality of fiscal rules, budget openness and accountability.
Local Finances and the Green Transition 9 EXECUTIVE SUMMARY
Following the 2008-2009 economic crisis, the primary aim of national fiscal policies was the balancing of public budgets and curbing local debt. The country ranking listed in the Fiscal Rules Index does not correlate to level of decentralisation or economic development.
Efficiency in municipal service provision is greatly dependent on the degree to which governments manage to align public demand for services with a suitable form and level of taxation. The process of maintaining budget openness is primarily shaped by the general governance practices in place, although it is also linked in part to the scope of decentralisation. It is therefore not surprising that the more economically developed countries score high on the Open Budget Index
Openness in local finances and financial management also helps to curb corruption. Countries with greater decentralisation have better Corruption Perception Index scores. CEMR countries usually score high on the Statistical Performance Indicator
The Recovery and Resilience Facility and subnational governments
In the coming years, climate change and digital transition will be central to the European Union’s plans and funding policies. The Recovery and Resilience Facility (RRF) is a major EU financing mechanism, made possible through the first large-scale issuance of mutualised European debts, which provides funds for the EU Member States. The total budget of the Recovery and Resilience Facility is EUR 672.5 billion, which is available as a grant (EUR 312.5 billion) and as a loan (EUR 360 billion) over the 2021-2026 period.
Due to the RRF allocation criteria, the grant per capita is higher in the newer less economically developed EU member countries, Italy and Spain being the exceptions (these large countries were hit hard by the crisis and have huge internal regional differences).
The six priorities (pillars) of the RRF represent critical areas for crisis recovery, incorporating responses to climate change as well as promoting solid foundations for future economic development through digitalisation, sustainable growth and increased resilience. Local governments with functions and competences aligned with the RRF’s main pillars may be eligible to benefit from these grants.
The primary green transition pillar represents the highest share of RRF grants (42%). It accounts for more than 30% of RRF related expenditures in the countries with approved plans. The share of green transition spending is higher in the more decentralised countries, apart from the smaller countries (Luxembourg, Malta). The four countries with strong regional structures have all appropriated more than 40% of their RRF budgets to climaterelated actions and policy areas.
Sustainable mobility is the preferred policy area (32% of total planned expenditure) under pillar 1 (green transition). Energy efficiency is a similarly high priority, representing 29% of total expenditure planned on green transition. In comparison, typical local government tasks such as solid waste management and other environmental pollution prevention programmes only represent 2% to 4% of total expenditure under the first pillar.
Territorial infrastructure and services make up the bulk of RRF spending under the social and territorial cohesion pillar (66% of total). It is worth noting in this respect that, according to a survey of local government associations in 19 countries, local and regional governments are generally not satisfied with the existing national plans on territorial cohesion.
In the less decentralised countries, national plans spend more on programmes under the resilience pillar, where health care and public administration expenditures have been budgeted. Health care services (48%) and effective public administration (30%) in fact represent the main expenditure areas of this pillar encompassing health and economic, social, institutional resilience.
The policy areas predominantly being targeted by the next generation grants, namely three different levels of education (74% of total grants), early childhood education and care (14%) and youth employment (12%), ensure that there will necessarily be a local dimension to this pillar.
Including local and regional governments in the national planning process of the Recovery and Resilient Facility programmes is critical. According to our survey, local governments believe that the main goals of the
Local Finances and the Green Transition 10 EXECUTIVE SUMMARY
Recovery and Resilience Facility are reflected in the national plans. However, an overwhelming majority of local government associations (75% of respondents) claim that the national RRF plans respond effectively “only to a limited extent” to the key challenges faced by local and regional authorities.
A majority of respondents (40%) characterised their involvement as only being informed about the overall process, while approximately one-third stated that they had been consulted (mostly with limited impact on the outcome). Specific aspects of national programmes were developed without any local government involvement.
It is essential that local and regional governments also have a say in the RRF’s implementation. The financial statistics available in the country reports provide information on the attainment of the original objectives. For monitoring and evaluation purposes, the core data used by the Commission, and not only aggregate ratios, should be made publicly accessible.
Conclusions and recommendations
1. The main lesson to be drawn from the first economic downturn is that all responses to the crisis require new forms of cooperation among various government actors as well as between the public sector and private entities. The interconnected tasks of both crisis management and environmental risk mitigation call for and would highly benefit from new forms of coordination among government tiers, improved service management methods, additional and restructured investments, adjustments to local revenue to meet changing requirements, better administrative capacities, modified planning and improved budgeting practices.
2. Austerity measures should be proportional to the fiscal weight of subnational governments, legislated for all government entities in general and introduced in a straightforward, transparent way. Active fiscal policies that are financed through increased borrowing and higher general government debt impinge on the future of subnational government budgets and local capacities to invest in the green and digital transitions. These overall fiscal conditions should not augment the risk of fiscal recentralisation.
3. Administrative-territorial reforms strengthen the effectiveness of responses to climate change. These highly political administrative-territorial changes are typically initiated under favourable economic conditions, but structural reforms can only be implemented after the abatement of any financial shocks.
4. Countries with more devolved government structures continued with further decentralisation while others with lower subnational spending favoured centralisation policies. Any transfer of decentralisation methods and best practice exchanges should take this path dependency into account.
5. Subnational government capital expenditure is mainly driven by national investment programmes and grant schemes. However, there is a great deal that can be done by local governments to better the environment beyond investments in municipal services and planning.
6. Responses to the economic crisis’ fiscal challenges conform to existing patterns of revenue decentralisation in the CEMR countries. A broad revenue base and a convergence of local tax systems make local budgets more stable and financially resilient to withstand economic fluctuations. Autonomy in raising local revenue is vital in being able to regulate polluting activities. Local taxes, charges, levies and other revenue-raising options all have an indirect impact on the climate. They influence the extent to which water management, forms of transport, land use and urban planning can contribute to minimising disaster risks and reducing pollution.
7. Subnational government loans are essential for financing capital investments. Local debt issue should be regulated by a general control mechanism, which would reflect dynamic local creditworthiness and allow the higher government tier to exercise limited discretion.
8. The share of the principal RRF spending going towards green transition is higher in the decentralised countries. Stronger local and regional governments translate into more support for recovery and resilience programmes and actions. According to CEMR’s member associations, national RRF plans need to respond to key local and regional challenges more effectively. Local and regional governments should also have a say in the monitoring of RRF implementation.
Local Finances and the Green Transition 11 EXECUTIVE SUMMARY
Objectives and methodology
This report on local finances aims to provide an analysis and an explanatory synthesis of the developments in subnational finances in the CEMR member countries over the past decade (2010-2020). In this respect, it can be seen as a follow-up to the Dexia-CEMR publication on “Subnational public finance in the European Union”, which covers the early years of the decade (Dexia-CEMR, 2012). The present report takes stock of the trends in subnational finances dating from 2010, the first year following the peak of the economic crisis. It also evaluates the recovery period, along with various financial and service management challenges, and culminates with the outbreak of the COVID-19 pandemic in 2020.
In addition to these core focal points, the analysis also sets out to evaluate the climate change-related aspects of local finances. Cities and regions play a decisive role in managing climate change-related public tasks. They are responsible for a wide range of services that influence adaptation and have regulatory powers that can promote the green transition. Sustainable development and adaptation to climate change have very much been the focus of current local and regional government policymaking. It has primarily been local capital spending targeting green investments, but municipal service management methods have also focused on contributing to decarbonisation and climate crisis mitigation. Only limited information was available regarding these aspects of local finances. However, cases compiled from selected CEMR member countries and a review of the national Recovery and Resilience Facility plans supplement the fiscal analysis.
The CEMR member countries1 taking part in this analysis represent a rather diverse group. It should be noted that it is not only the scope and forms of decentralisation of these 41 entities that are diverse, but that there are differences in the types of comparable statistical information and financial data available for the period under study. The quantitative analysis is based on the data reported to various international organisations. The sources used for the fiscal and statistical data are specified in Annex 1.
Some limited qualitative information on the factors driving the changes in local finances was also collected from additional sources. It comprises country reports and comprehensive studies by international organisations on key topics relating to fiscal decentralisation and crisis management. Finally, local and regional government associations from seven CEMR countries were invited to respond to a questionnaire. They kindly provided information and some case studies on municipal finances and local climate change actions.
Scope and structure of the report
To facilitate any comparisons, this analysis follows the structure of the earlier Dexia-CEMR report on local government finances. It focuses on five key areas that are determinative of the direction of municipal finances and intergovernmental fiscal relations. For added perspective, a brief assessment of selected public financial management issues is also presented. Along with the fiscal analysis, the European Union’s Recovery and Resilience Facility itself is evaluated, primarily from the point of view of local government.
The fiscal analysis starts off with two critical input factors that influence local finances: 1) the overall economic environment and 2) the forms and trends of territorial decentralisation. These in turn shape four key areas of local government finances, namely 3) budget expenditure (assessed by economic spending category and function), 4) the composition of budget revenue and the crucial area of 5) subnational borrowing and debt. As the past decade has highlighted the importance of financial management methods, a few measurable aspects of 6) Public Financial Management are presented as well (See summary Table 1).
The overarching line of enquiry of this study is to analyse the impact of detectable changes, particularly on a) environmental expenditure influencing climate and green development; b) the efficiency of local finances and c) equity in financing local governments. The last two analytical questions assessing efficiency and fairness issues will be necessarily limited owing to the national aggregate-type data.
1 In this report, all references to Kosovo, whether the territory, institutions or population, shall be understood without prejudice to positions on status, and is in line with UNSCR 1244/1999 and the ICJ Opinion on the Kosovo Declaration of Independence.
Local Finances and the Green Transition 12
TABLE 1 SUBNATIONAL GOVERNMENT FINANCES: AREAS OF ANALYSIS AND INDICATORS
Input Systems (method)
3) Expenditure
• - functions
1) Economic environment
2) Decentralisation: status and trends:
- local government size
- administrative structure
• - spending by economic category
4) Revenue, funding
5) External sources:
- borrowing
- debt
6) Public Financial Management
Impact (output, outcome)
a) Environment
b) Efficiency
c) Equity
Local Finances and the Green Transition 13 OBJECTIVES AND METHODOLOGY
A Decade of Local Finances: Two Crises and the Intervening Period
The past decade can be characterised by three major periods of economic growth and public sector development.
(i) 2010-2012 were the years when local governments started to contend with the long-term consequences of the economic crisis. The contracting economy, high general government debt and increased unemployment all severely affected local budgets. The main economic and fiscal policy goals at that time centred on balancing budgets, promoting economic growth while keeping the tax burden low and developing fiscal rules, applicable to subnational budgets as well.
• In the European Union, all these actions led to the Stability and Growth Pact and the introduction of new budget surveillance regulations. The introduction of external mechanisms over domestic fiscal policies, such as stronger controls through the European Semester, renewed emphasis on having recourse to excessive deficit procedures and medium-term budgetary frameworks, fiscal council-type independent fiscal institutions, all intended to support balanced development.
The role of subnational governments in balancing general government finances was widely debated during these years; for example, fiscal decentralisation was targeted by the 2012 annual report on public finances in the EMU countries (European Commission, 2012). The report concluded that expenditure-related decentralisation led to a higher primary budget balance; however, the actual impact of fiscal decentralisation was largely dependent on the way in which financing mechanisms were designed. In fact, it was concluded that a greater share of taxes and fees rather than intergovernmental transfers improved budget balances. The local borrowing regulations in place have greater bearing on the balancing of budgets than comprehensive legal requirements.
(ii) Towards the middle of the decade, a gradual recovery was underway despite a stagnating, deflationary economic environment. During this period, new trends in public finances, urban development and public service provision emerged. Economic consolidation was built on new forms of partnership between government tiers. Private sector involvement in public service provision began to decline. Local governments were faced with several new challenges, including the need to search for new approaches to local economic development and growing inequalities that called for an increase in public works programmes, all while working to promote social-territorial cohesion. Urban development goals shifted towards the expansion of public spaces and caruse restrictions, the digitalisation of local administrations and service delivery.
• The most important systemic changes occurred in local policies aiming to respond to climate change and to expand local actions for sustainable development. Subnational government policy objectives and priorities have been driven by the Paris Agreement on climate change and the UN Sustainable Development Goals framework, both launched in 2015.
(iii) 2020 marked the beginning of the third period that started with the global outbreak of the COVID-19 pandemic. Following a period of years of fluctuating economic growth, the ensuing lockdown resulted in abrupt changes in all public sector areas. Amidst declining municipal revenue, pressure was high to implement new local actions while taking on broader responsibilities. This “scissors effect” of higher expenditure and loss in revenue forced both national and local governments to introduce new measures. In contrast to how the economic crisis was managed a decade earlier, the national governments and the international financial institutions responded with effective coordinated countercyclical policies, launching intensive stimulus programmes and allocating grants and new loan packages.
• The role of local governments in managing the pandemic has differed by country. Policy debates have been more focused on the forms of government interventions and the nature of the State in the future and less on its size and scope of influence. However, the long-term trend of expanding government actions in favour of economic protectionism, social equalisation and environmental safety has visibly begun.
The local fiscal analysis follows this rough classification of the past decade’s three development stages.
Local Finances and the Green Transition 14
1. Macroeconomic environment and public finances
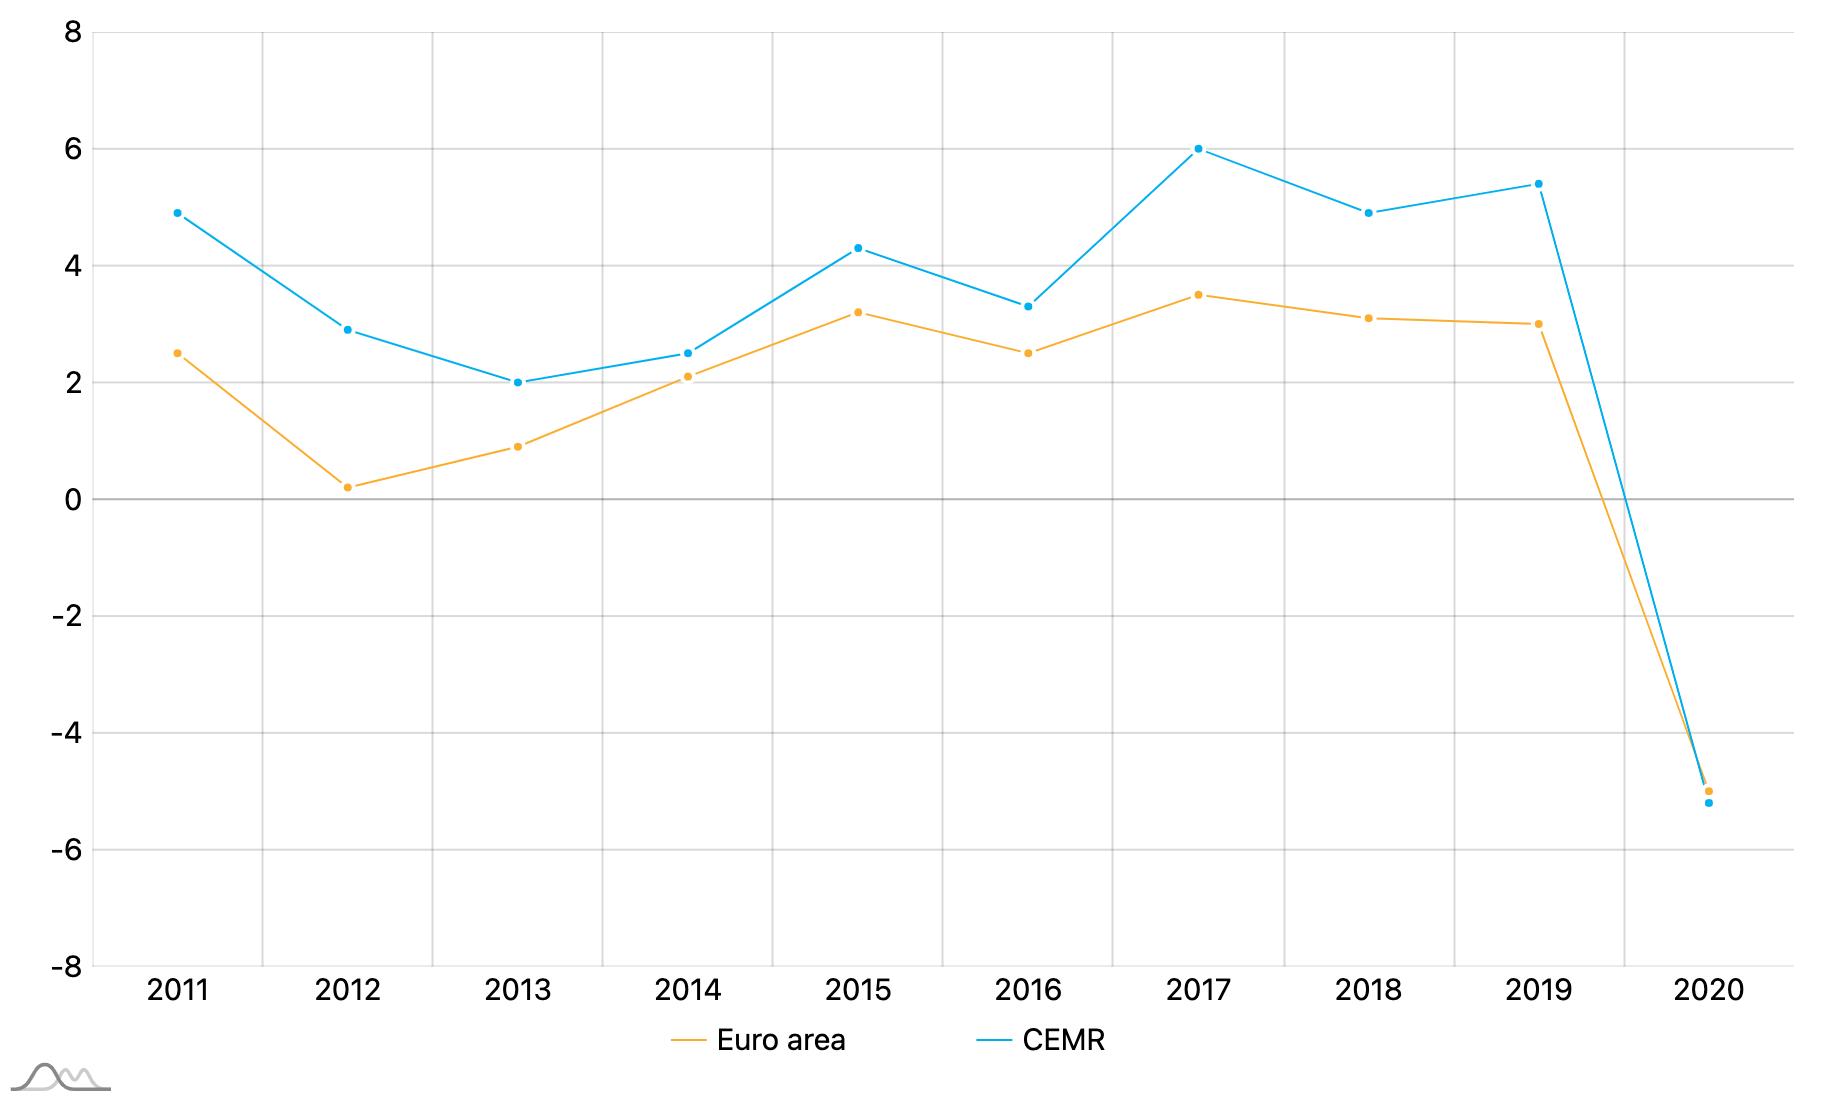
Economic growth – measured by annual changes in GDP per capita – fluctuated in the past decade (Figure 1). In both the CEMR countries and the euro area, the first stage of economic development and recovery started after 2013. At the end of the period under study, there was a severe economic downturn in 2020 with a 5% fall in GDP per capita. During the intervening years, growth was stable and averaged around 3 to 4%, although there was a relative slowdown in 2016. Annual economic growth was highest in 2017, with an average of 6% in the CEMR countries.2
The level of economic growth showed diverse regional patterns. Some of the smaller CEMR countries were the leaders in high annual growth during the recovery period, including several of the transition and Balkan countries, plus Israel and Ukraine. Interestingly, it was the same group of countries that were the worst affected by the first year of the pandemic in 2020, although large economies like Spain (-10.3%) and Turkey (-8.6%) were also among those the most severely affected.
Unemployment increased until 2014 in the 33 CEMR member countries with comparable data. The annual average unemployment rate then was above 11%. Countries in southern Europe, such as Greece, Spain, Portugal, and some of the Western Balkan countries, were hit the hardest by high unemployment. By the last half of the decade, increased economic growth had led to more jobs and the unemployment rate in the CEMR countries fell to an average of 7% by 2019.
Economic growth was constrained by the deflationary environment. Even the typically low inflation (EU country average of 2-3%) gradually vanished by the middle of the decade. From 2014 to 2016, the average inflation rate dropped close to zero in the EU countries.
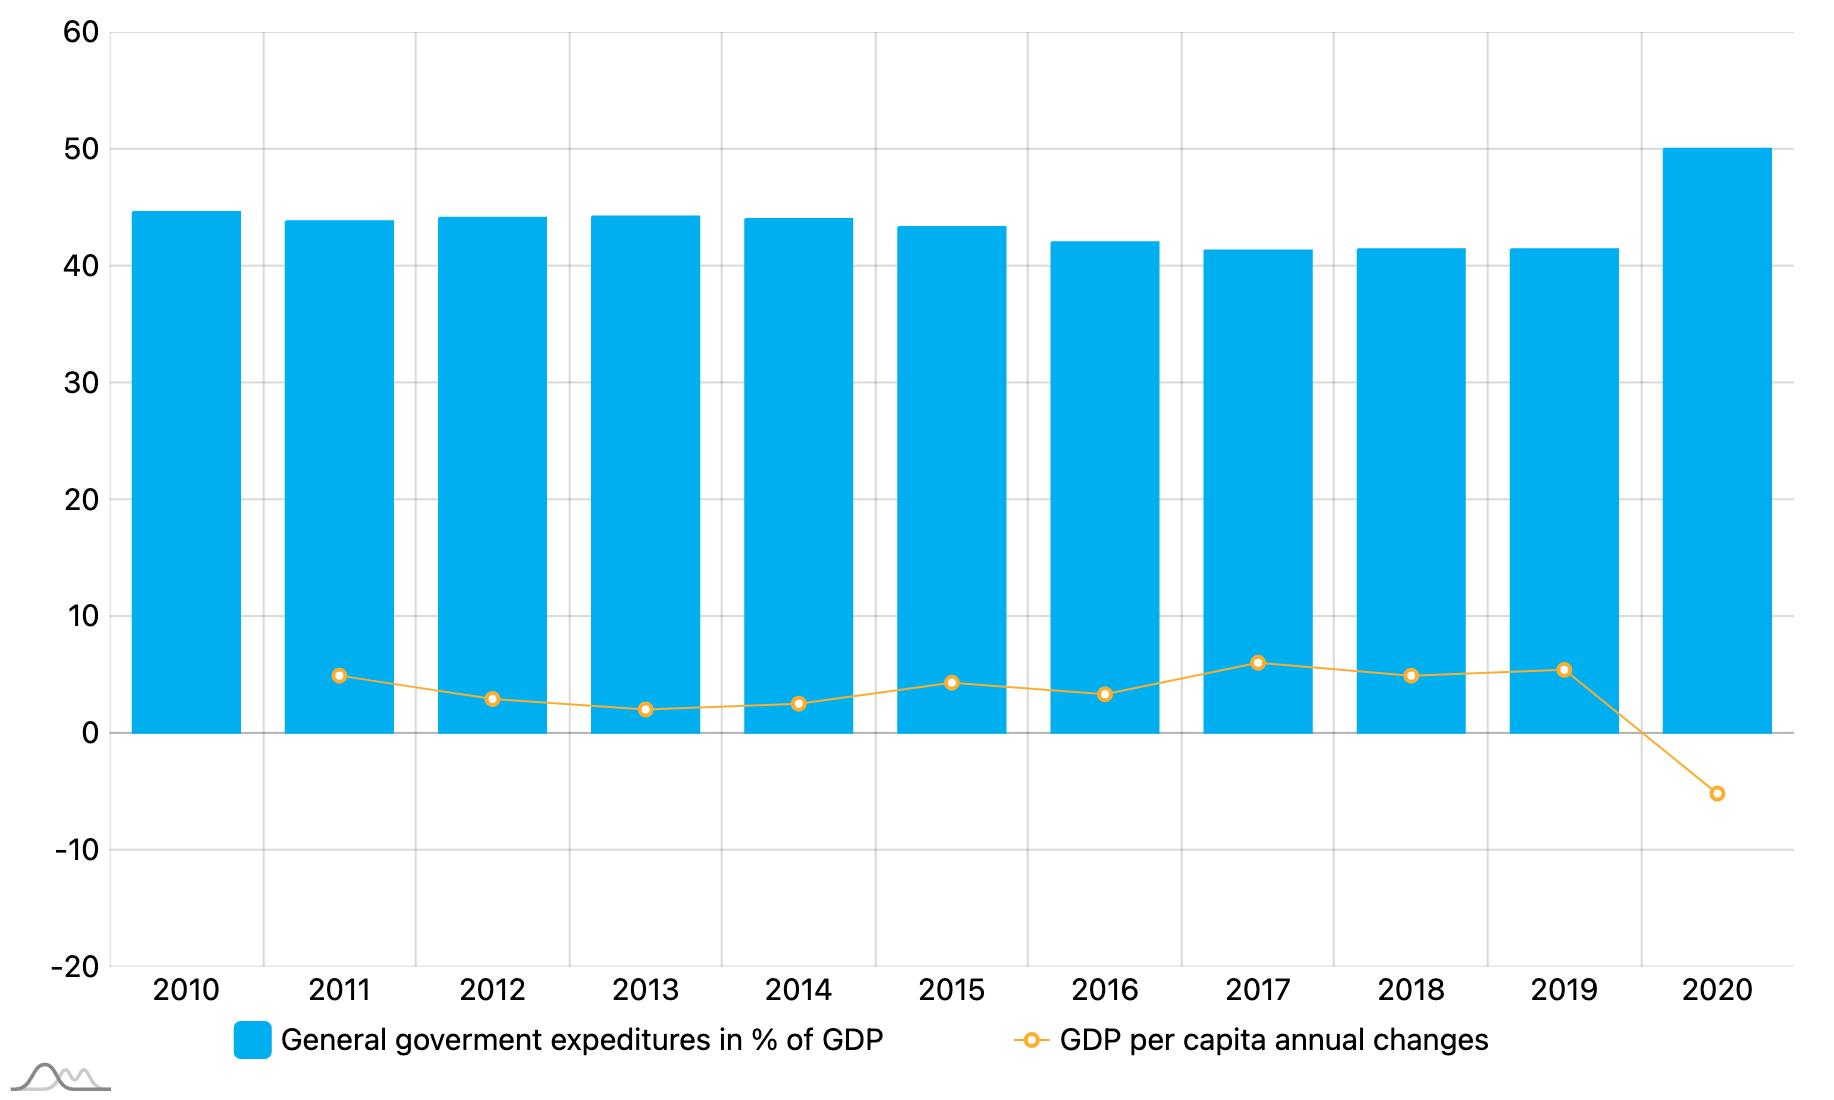
The European welfare states provide a broad range of public services and manage numerous governmental functions (Figure 2). The GGE ratio came close to 45% of GDP in 2010. Owing to restrictions and the economic growth rate, this indicator steadily dropped to 41% by 2017-2019. In the first year of the pandemic, government expenditure again increased to 50% of GDP due to high government spending programmes and a shrinking economic base.
Local Finances and the Green Transition 15 A DECADE OF LOCAL FINANCES: TWO CRISES AND THE INTERVENING PERIOD
FIGURE 1 ECONOMIC DEVELOPMENT STAGES, CEMR COUNTRIES, EURO AREA GDP PER CAPITA CURRENT PRICES, ANNUAL CHANGE
2 These are simple arithmetic averages and do not measure the size (weight) of the national economies.
With respect to government expenditure, there are significant differences among the CEMR countries. In 2010, public spending in the Scandinavian countries, France, Belgium, Austria, Greece and Portugal exceeded 50% of GDP, whereas in North Macedonia, Turkey, Albania, Kosovo and Georgia, it did not even reach 35% of GDP. This huge gap, which reflects a high diversification of overall government functions in the first group, can be telling of a country’s potential scope of decentralisation since countries with a larger public sector can more easily devolve services to subnational governments.
Government expenditure (in GDP ratio) was lower in 2020 than in 2010 only in countries with extended public budgets (e.g. Denmark, Latvia, Portugal).3 Yet, all governments found it necessary to increase their expenditure from the previous year by an average rate of 7%. The biggest increases in the ratio of government spending to GDP, all above 10%, were found in Greece, the UK and Spain. In many countries, local governments suddenly had to cope with random and unjustified budget cuts (see the case of Serbia in Box 1).
Box 1 – Fiscal policy changes hit local budgets in Serbia
Implementing financial consolidation in Serbia entailed frequent changes to its Law on Local Selfgovernment Finance. In 2009, an ad hoc governmental decision resulted in local self-governments being stripped of RSD 15 billion (EUR 158 million). Although this measure could be justified, its implementation was very hasty, reducing transfers in the middle of the budget year. There was an absence of any objective or measurable criteria for determining the reduction of municipal funds. This led to financial problems and political turbulence between the central and local levels of government. Political pressure brought about a new law in 2011 and the allocation of RSD 40 billion (EUR 420 million) to the local level, but again without any proper rationale given. This amendment set off an implosion of the national public finances and was subsequently revised twice (in 2013 and in 2016).
Portugal, as one of the countries hit the hardest by the economic crisis, was subject to a coordinated stabilisation programme set up by the major international organisations, which had an impact on local governments as well (see Annex 2).
The economic crisis of 2008-2009 was managed in part through active government borrowing. By 2010, high government indebtedness was a by-product of the efforts to subsidise failing businesses and help domestic
Local Finances and the Green Transition 16 A DECADE OF LOCAL FINANCES: TWO CRISES AND THE INTERVENING PERIOD
FIGURE 2 HIGH GENERAL GOVERNMENT EXPENDITURE IN THE EUROPEAN WELFARE STATES
3 The impact of the pandemic on government expenditure could only be studied in thirty CEMR member countries on account of the absence of data on general government spending for some Balkan countries, Turkey and Ukraine.
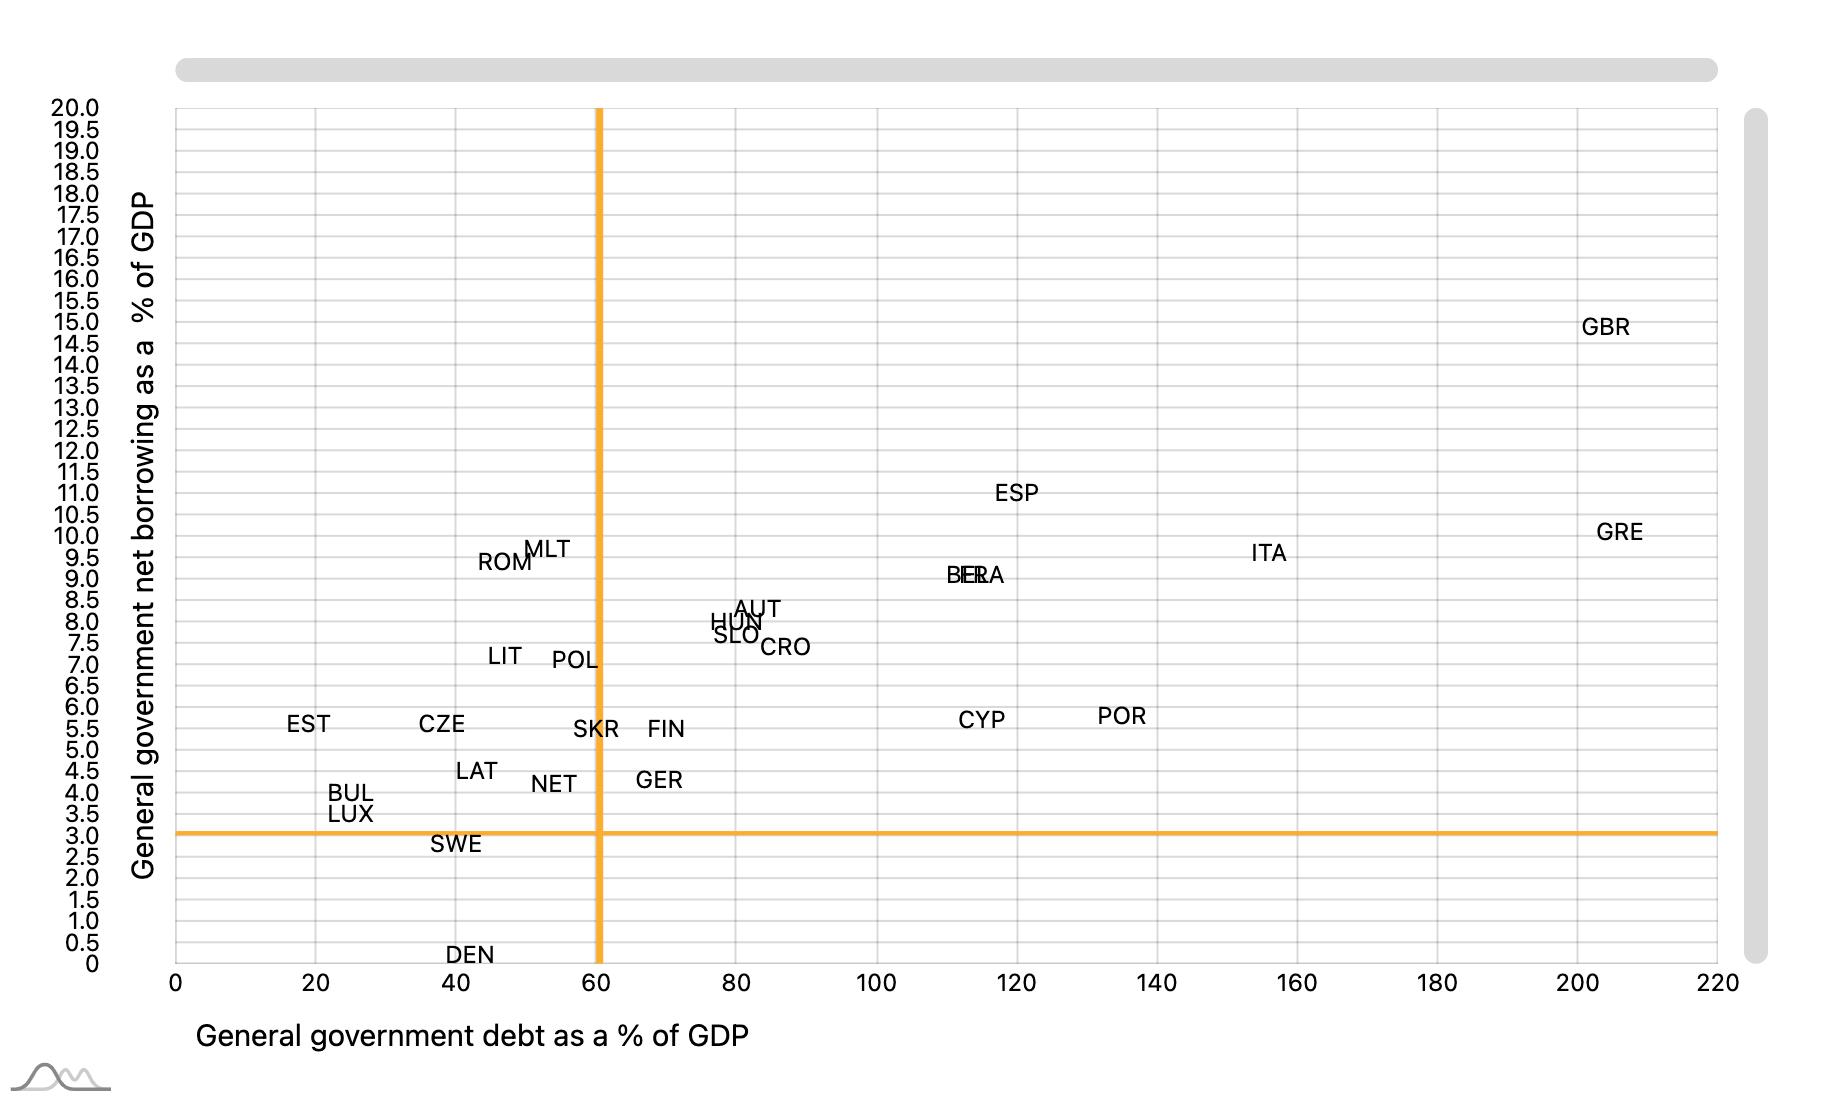
banks. Among the EU Member States, where comparative data is available, 11 economies were burdened with both general government debt above 60% of GDP and net borrowing amounting to more than 3% of GDP. There were several countries, mostly from the group of new EU Member States, whose annual net borrowing exceeded the Maastricht threshold of 3%.
Box 2 – The Austrian Stability Pact
In 2012, the “Austrian Stability Pact” was set up in agreement with the territorial authorities, whereby the European fiscal rules (mainly the Stability and Growth Pact) were transposed into national law. Its aim is to maintain sustainable, orderly budgets and in particular to avoid over-indebtedness. The most important fiscal rules concern the government deficit (borrowing) and the debt ratios.
1) Maastricht Balance: this was the main focus of the regulations until it was replaced by the structural balance in 2017. For the states (Länder) and local governments, the balance was -0.54% in 2012 and increased to +0.01% of GDP by 2016.
2) Debt brake: structural balance differs from the Maastricht balance in that cyclical effects and one-off measures are neutralised. Since 2017, the overall benchmark has been -0.45% of GDP. The distribution among the central federal government and the Länder plus municipalities falls within the ratio of -0.35% to -0.1%. Also since 2017, municipalities have committed to keeping a structurally balanced budget. Any differences between the actual structural budget balance and the permissible balance limit are to be entered in the control account, as a debit or credit, and netted over the years. Public-Private Partnership agreements declined to limit public debt towards the private sector. The “general escape clause” –analogous to the EU’s – has been activated for the years from 2020 to 2022.
3) Spending brake: under the permissible growth in spending, the annual primary expenditure growth may not exceed the medium-term potential GDP growth rate. Exceptions are possible in cases where the medium-term budgetary objective has been easily surpassed or when any excess spending has been compensated by discretionary revenue-side measures.
4) Debt ratio adjustment: reduction in government debt is to remain below the reference value of 60% of nominal GDP and kept at that level. It is also deemed sufficient if the difference between 60% and the actual debt ratio has been reduced by 1/20 per year on average for the past three years. The share of the federal government, the Länder and the municipalities in the reduction will be in line with the ratio of their debt levels (as of 2011).
5) Medium-term budget planning must be submitted by all territorial authorities to the Austrian Coordination Committee.
6) Liability caps: the upper liability limit is calculated as a percentage of the assessment base (taking into account revenues and public levies), which amounts to 175% for the federal government, 175% for the Länder (including Vienna), and 75 % for local governments. The consequences of excess borrowing are regulated, although no sanctions have been imposed to date.
Local Finances and the Green Transition 17 A DECADE OF LOCAL FINANCES: TWO CRISES AND THE INTERVENING PERIOD
Government indebtedness continued to increase over the last decade until 2017. Then, following three years of decline, general government debt rose once again, reaching 80% of GDP in 2020. This amounts to a steep 18% increase from the year before the pandemic (CEMR country average). This means that 15 countries, from both the group of large, developed economies and the smaller ones, are currently well above the Maastricht limits. Only Denmark and Sweden have been able to maintain their status through low debt and limited annual borrowing (Figure 3).
In short, this economic environment was a clear determinant of the local scope of manoeuvre. Public spending was confined by hard budget constraints in the first few years of the past decade. High general government debt limited local spending and subnational borrowing. Slow economic growth reduced municipal revenueraising options. Then, beginning in the middle of the decade, budget conditions gradually normalised, although there were striking differences among the CEMR member countries. Nevertheless, in the first year of the pandemic, all economies contracted. These losses were partially compensated by fiscal policy measures: wage subsidies, special spending programmes, reduced taxes. In contrast to the earlier economic crisis, these active fiscal instruments created a more favourable economic environment for the government sector. However, the economic decline was more severe at the beginning of the pandemic – and in the subsequent years.
Local Finances and the Green Transition 18 A DECADE OF LOCAL FINANCES:
AND THE INTERVENING PERIOD
TWO CRISES
FIGURE 3 GENERAL GOVERNMENT DEBT AND NET BORROWING, 2020
2. Decentralisation trends in Europe
After the 2008-2009 economic crisis, subnational governments increasingly became a focal point of economic and fiscal policies. They were often regarded as sources of inefficiencies in public spending while also being viewed as opportunities for public revenue-raising. Although subnational government borrowing was less significant, it was targeted as a potential area for limiting overall government debt. The primary reason behind these attitudes and fiscal policies was the complex nature of multi-tier government structures faced with fragmented local entities of various sizes. Using an economies-of-scale approach, these reform policies tended to reflexively promote larger municipalities (or inter-municipal cooperation), partly to lower service unit costs as well as to create a network of sizable local governments, more manageable from the centre. Given the very diverse nature of local government structures in the CEMR member countries, options for amalgamation reforms come in many forms as well. Decentralisation trends and subnational government patterns can be categorised using the following critical attributes: (i) constitutional form of the region (federal or unitary); (ii) number of elected government tiers and (iii) population size of subnational governments. All these factors influence national policies and reform options.
(i) There are three federal countries among CEMR’s members (Austria, Belgium, Germany), where the regions/ states are constituent entities of the national State. From a fiscal point of view, Spain should also be considered part of this group of countries since the Autonomous Communities, as regional entities, have extended powers.
(ii) Number of elected subnational government tiers further modifies these basic constitutional structures. In most countries with a smaller population size, there is only one government tier below the national one, as is the case with Estonia, Iceland, Lithuania, Luxembourg, Malta and Slovenia. In two of the federal countries, Austria and Spain, only one first-tier government exists within the Länder/regions. The vast majority of the other countries have a municipal and an intermediate level of subnational government. In certain countries, a special status has been conferred upon some local governments (e.g. capital cities, cities with county rights). The middle tiers are more fragmented, for example: France (departments and regions), Italy (provinces and regions), Poland (counties and regions), Ukraine (districts and regions) (see also CEMR, 2022).
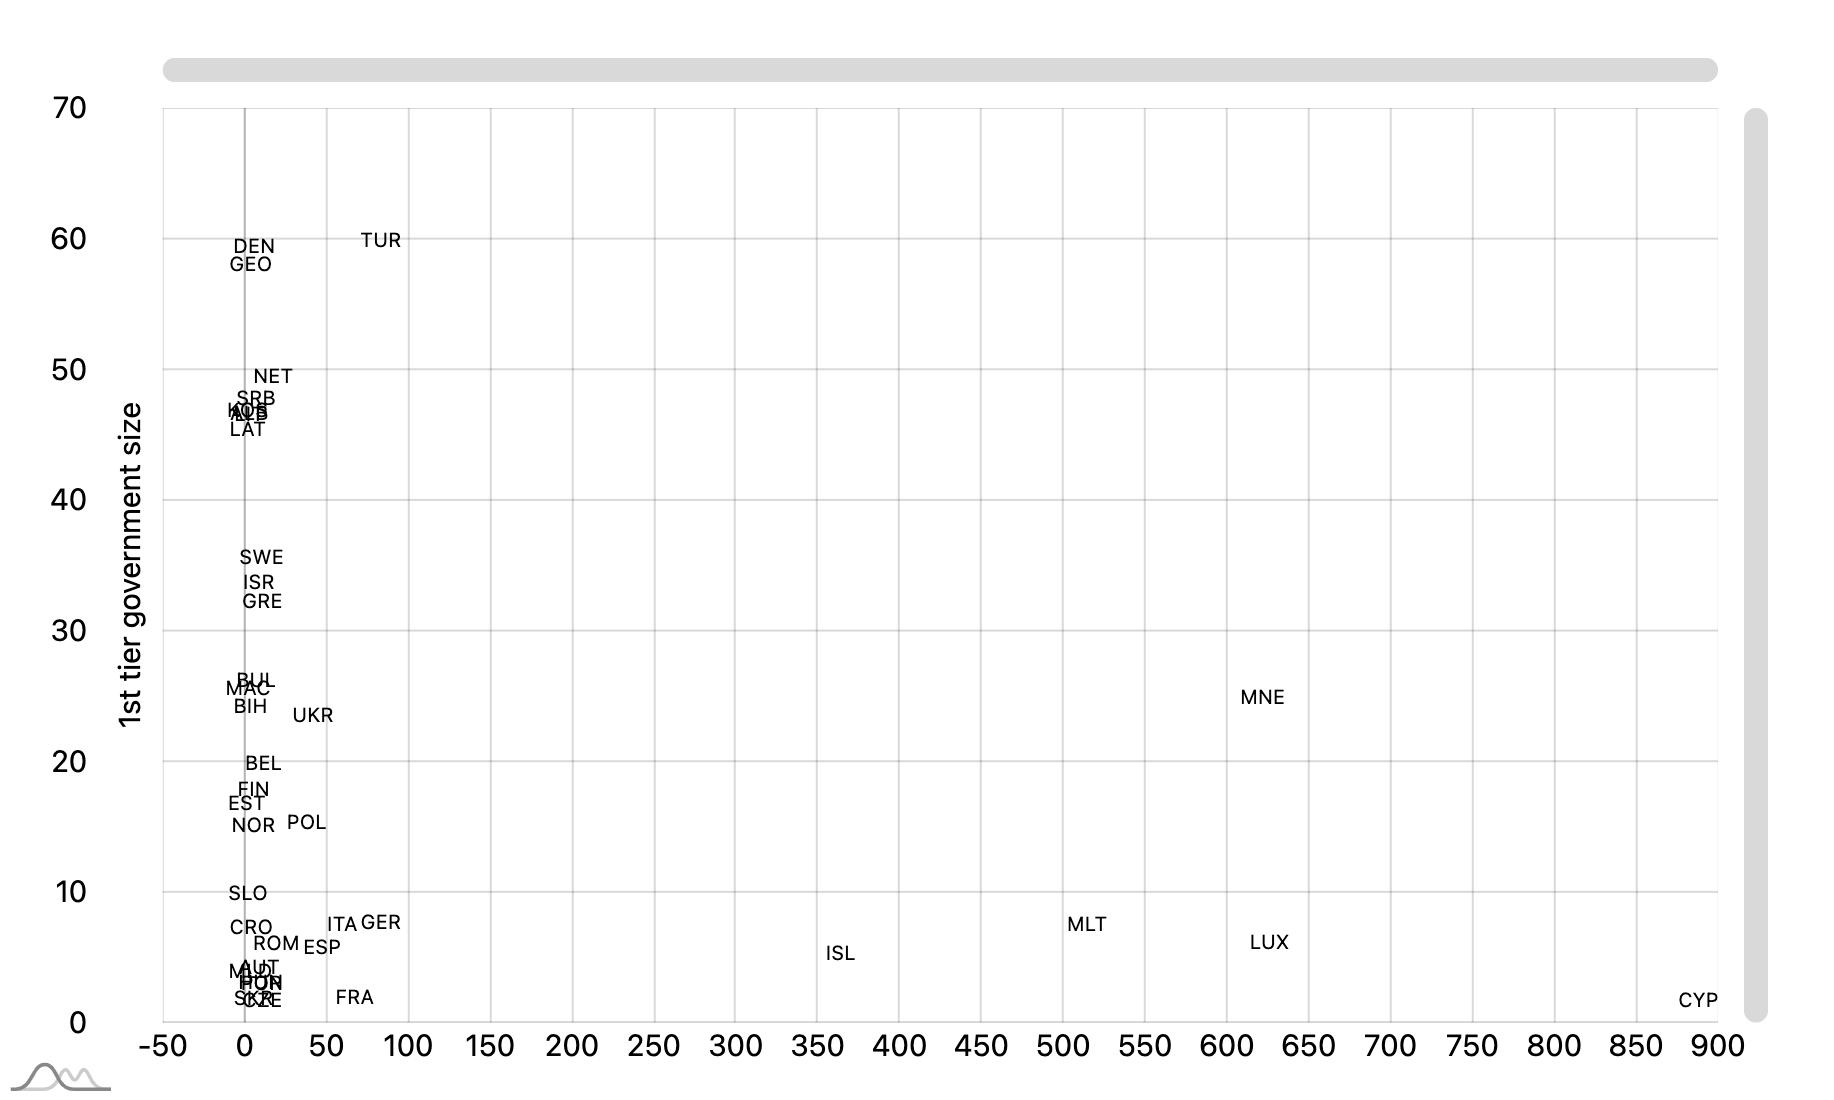
(iii) Population size of the very first tier of subnational governments also varies widely in the CEMR member countries. Four major types of municipal government structures can be identified (Figure 4). In countries with a population below the CEMR average of 16.8 million, municipalities too tend to be relatively small in number and below the average of 25 600. The countries found in the lower left cells of Figure 4 are almost all from
Local Finances and the Green Transition 19 A DECADE OF LOCAL FINANCES: TWO CRISES AND THE INTERVENING PERIOD
FIGURE 4 COUNTRY POPULATION AND MUNICIPALITY ( FIRST TIER GOVERNMENT ) POPULATION SIZE, 2020
Central and Eastern Europe, with a few from the Balkans. Two of the federal countries also belong to this group (Austria, Belgium).
Among these smaller countries, there is a subgroup with larger size municipalities (upper left cells of Figure 4). This rather heterogeneous group is made up of countries with amalgamated municipalities comprising several settlements and includes: two Scandinavian countries (Denmark, Sweden), transition countries from different regions (Georgia, Latvia, Serbia) and countries from the South (Greece, Israel).
TABLE 2 MUNICIPAL MERGERS AND TERRITORIAL CONSOLIDATION
Change in number of municipalities, 2012-2020
Ukraine -84.6% Albania -83.6% Estonia -65.0% Latvia -64.7% Portugal -25.6% Norway -17.2% Netherlands -15.8% Austria -11.1%
Several large countries have fragmented municipal systems (lower right cells). They include Mediterranean countries (France, Italy), two countries with federal structures (Germany, Spain) and transition countries (Poland, Romania, Ukraine). Among these larger countries, only three have amalgamated first tier subnational governments (upper right cells): Turkey, the UK and the Netherlands.
Over the past decade, several CEMR countries have implemented administrative territorial reforms. They were able to decrease the number of first tier governments to improve service efficiency through greater economiesof-scale. They either promoted mergers of municipalities or implemented comprehensive local territorial reforms (Table 2). Three of the transition countries reversed the extreme territorial decentralisation of the early 1990s by creating large-size municipalities (Albania, Estonia, Latvia). In Ukraine, a comprehensive local government reform was carried out to create larger territorial units. In Austria, the Styrian territorial reform was carried out as both a mandatory and voluntary process from 2010 to 2015. Other countries promoted voluntary administrative mergers (Portugal, Norway, Serbia, the Netherlands). In these cases, the number of government units at the lowest level declined by at least one-tenth over the past decade. Box 3 summarises territorial reforms in seven countries; Box 4 presents the recent territorial-institutional reforms in France; Box 5 outlines the decentralisation process in Portugal following its amalgamation of parishes.
Local Finances and the Green Transition 20 A DECADE OF LOCAL FINANCES: TWO CRISES AND THE INTERVENING PERIOD
Box 3 – Territorial reforms of first tier local governments
In Ukraine, a comprehensive reform of the territorial arrangement of government institutions and local governments was implemented after 2014. The territorial reform component instituted a radical decrease, reducing around 11 000 cities, towns and village municipalities to only 982 by 2020, initially on a voluntary basis, but later under a mandatory amalgamation stage. It resulted in a network of 1 460 first tier local self-government units. Legal-administrative and financial decentralisation reforms accompanied these territorial changes, extending local public service functions, transforming inter-budgetary relations and decentralising new own revenue sources.
In Albania, the decentralisation reform of 2015 created larger functional entities. The number of municipalities/communes was reduced from 373 to 61 municipalities under a far-reaching territorial–administrative reform.
In Estonia, following a long period of voluntary municipal amalgamation and the territorial reform of 2016-2017, the number of municipalities was reduced from 213 to 79. These mergers began voluntarily but were followed by government-mandated consolidations. In 2018, county governments were abolished and their tasks were redistributed between the central and local governments. Local governments’ financial base was strengthened through an increased share of personal income tax as well as a higher equalisation fund and other grants.
In Latvia, 119 local governments were amalgamated into 42 new units by early 2021. The initial voluntary period of the reform began in 2016 and was followed by a compulsory phase, with 65 local mergers put forward by the national government.
In Portugal, the parishes, as sub-municipal entities, were amalgamated. The 2013 reform reduced the number of parishes from 4 260 to 3 092.
In Austria, the state (Land) of Styria had a very fragmented municipal structure. During the 2015 reform, the number of municipalities was reduced from 539 to 287. The process was driven by the Land. Participation and financial incentives intended to ensure voluntary amalgamations were offered; but in the end, due to strong municipal resistance, the structural reform required both voluntary and coercive mergers.
In Turkey, economic and political goals propelled the 2012 reform to establish new metropolitan governance structures. The number of metropolitan cities increased from 16 to 30 under Law No. 6360. To achieve increased economic efficiency, the smallest municipalities were amalgamated and their number decreased from 2 950 to 1 390. The Special Provincial Administrations (chaired by appointed governors) were abolished in these metropolitan municipalities.
Local Finances and the Green Transition 21 A DECADE OF LOCAL FINANCES: TWO CRISES AND THE INTERVENING PERIOD
Box 4 – Territorial-institutional reforms in France
The first efforts to modernise France’s territorial organisation took place from 2007 to 2012. The objectives were to determine a critical size and coherent territories for local communities and their intermunicipal cooperation entities,4 along with a new distribution of competences. The territorial reforms were implemented under 2014 and 2015 legislation.
The new grouping of regions aimed to make them more homogeneous, to elevate their ranking to that of their European counterparts and to strengthen the effectiveness of regional economic action. The regions acquired authority over economic development strategy planning. All sub-regional documents now have to comply with the objectives defined by the Regional Council. This is noteworthy since, with the abolition of the general competence clause for the regions and the departments, the latter now have more competence over economic development, an area previously under the sole purview of the regions. In 2016, the number of metropolitan regions fell from 22 to 13.
Intermunicipal cooperation establishments (EPCIs) have a minimum demographic threshold of 15 000 inhabitants; however, in 2016, nearly 70% of them were below this threshold. Once they are resized, they implement the regional economic development strategies; it is compulsory to transfer municipal powers, such as waste management and water and sanitation. In 2017, their number was reduced by more than 40%, mainly through mergers, to 1 249 (compared to 2 049 in 2016).
The status of metropolitan areas was overhauled following the voluntary and mandatory transformation of all intermunicipal cooperation establishments of more than 400 000 inhabitants into these relatively new entities; three of the metropolitan areas added have special status. Fifteen metropolises were thus created, compared to one in 2016.
Municipal mergers were also encouraged through the use of financial incentives. Nearly 1 700 municipalities merged as a result and they now number less than 35 000.
Local Finances and the Green Transition 22 A DECADE OF LOCAL FINANCES: TWO CRISES AND THE INTERVENING PERIOD
4 Intermunicipal organisations (communautés, syndicats) are single or multi-purpose independent voluntary associations of local governments established under administrative law. They have a long legal tradition in France under various forms. See West, 2007.
Box 5 – Decentralisation of State competences in Portugal
In Portugal, the weight of local administration expenditure amounts to approximately 9% of the total public administration’s, thus demonstrating a high level of centralisation. After a year of negotiations, Law No. 50/2018 (16 August) instituted a new framework for the transfer of powers to local authorities and intermunicipal entities. This Law, as well as the sectoral decrees and ordinances (“diplomas”) that followed, reassigned broad competences to municipalities in the areas of education, social care services, health, civil protection, culture, heritage, housing, maritime port areas, forest management, transport and communication routes, various administrative services, fire safety, public parking, etc. With the exception of social care services and health, all competences were eventually transferred by April 2022.
A decentralisation commission made up of representatives from all the parliamentary groups, the government, the National Association of Portuguese Municipalities and the National Association of Parishes was set up to monitor these processes. It has also been tasked with assessing the adequacy of financial resources for each area of competence.
A general consensus exists among the 278 mainland municipalities that competences are best performed at the local level, and they have expressed their openness and willingness to take on new ones. However, the lack of funds, difficulties in communicating with the Central Administration and administrative constraints have caused problems for some municipalities in this regard.
The decentralisation efforts have not been immune to the resistance stemming from the different powers of the State’s deconcentrated services that delay and hinder the entire process. The main problems encountered in all areas were limited capacities, a lack of response from the central administration, insufficient access to data and the paucity of detailed information regarding the transferring of services and responsibilities, no easy access to computer platforms and, in some cases, late and insufficient financial transfers.
Regional disparities
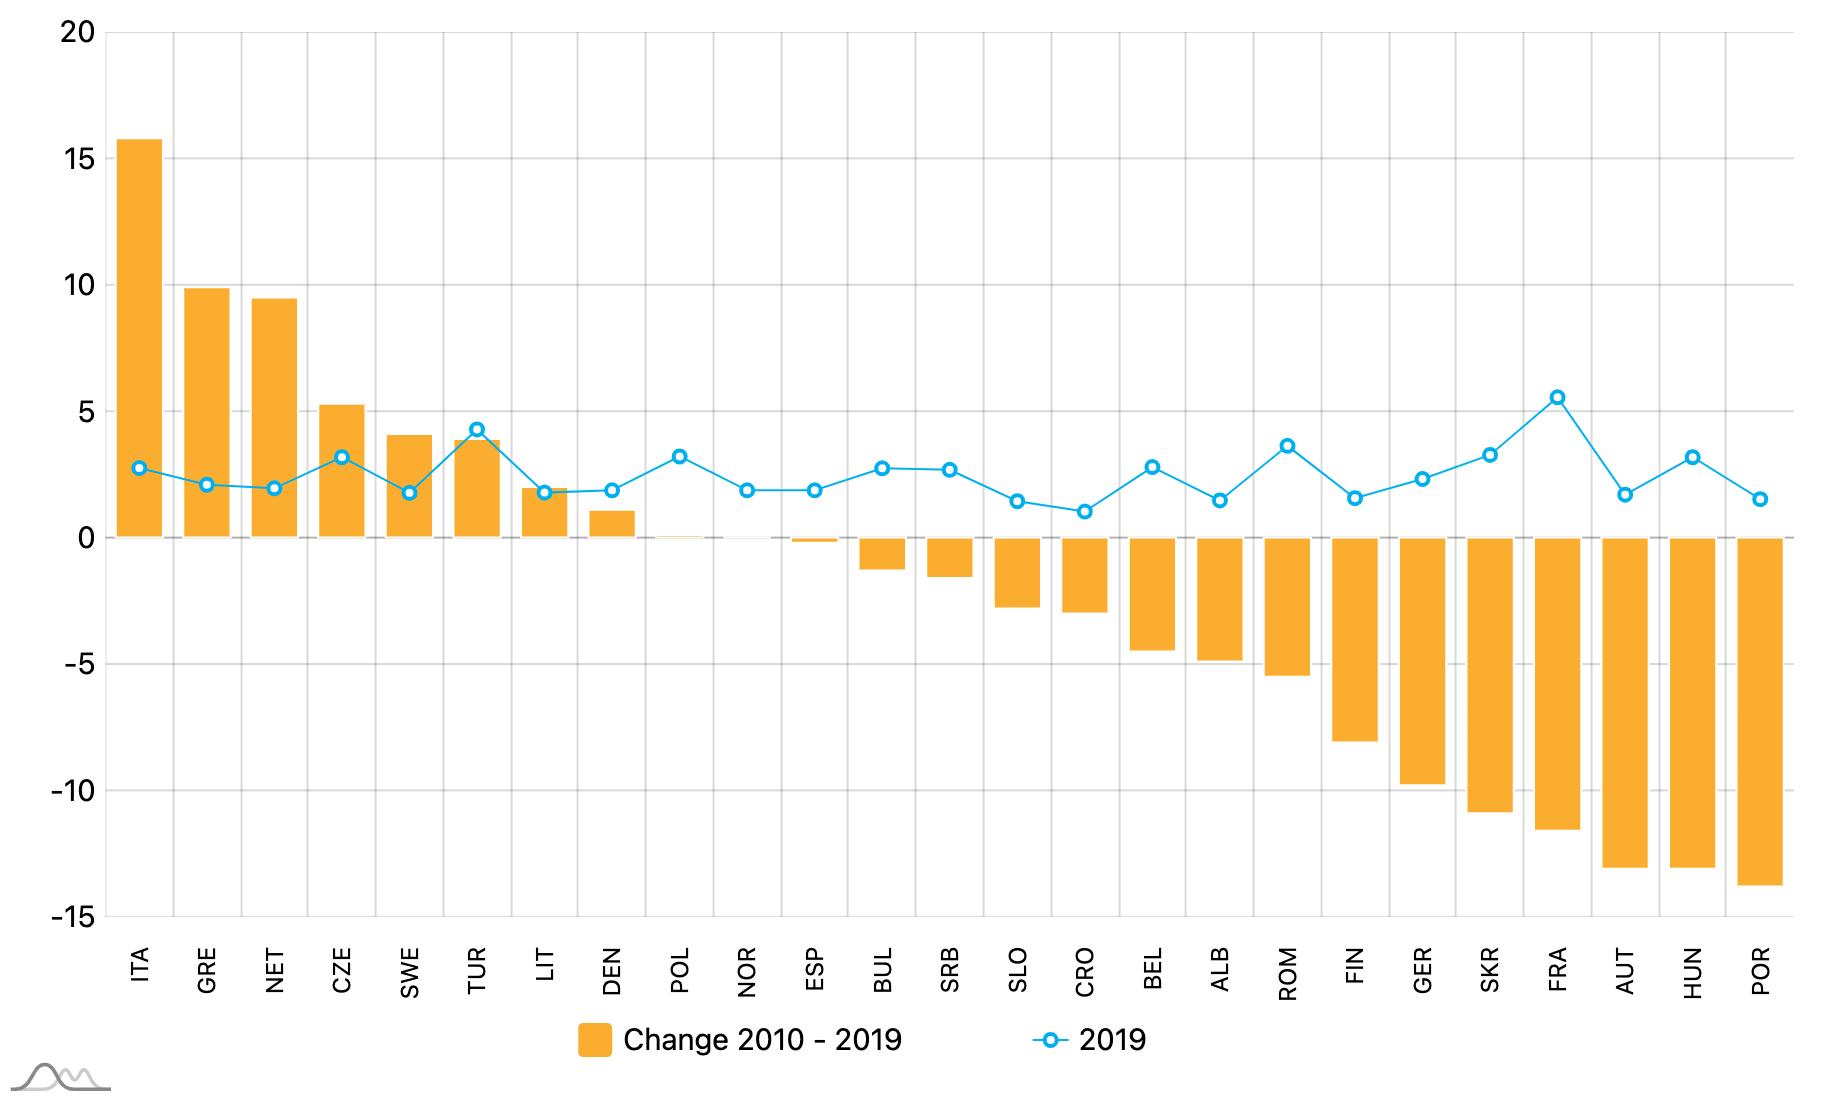
Economic growth over the past decade has occurred alongside a growing regional differentiation. The distance between the basic (NUTS2) regions with the highest and the lowest value of GDP per capita increased. In the 36 countries where disaggregated regional data is available, this ratio went up, from 2.37 (2010) to 2.46 (2020) on average.
However, the number of countries with declining regional differentiation outnumbered those where this ratio of richest-poorest regions increased (see Figure 5). There is a total of eight rather diverse countries with increased differentiation. Setting aside Montenegro as an outlier (its ratio of GDP per capita in the richest and poorest regions doubled), this group includes the countries from southern Europe that inherited large regional disparities, e.g. Italy, Greece and Turkey. The other countries showing greater economic differentiation are usually ones with more equal regional structures: two Scandinavian countries (Denmark, Sweden), the Netherlands, Czech Republic and Lithuania.
Local Finances and the Green Transition 23 A DECADE OF LOCAL FINANCES: TWO CRISES AND THE INTERVENING PERIOD
In the past decade, the population weight of capital cities has slightly increased (by 1%) on average in the CEMR countries. In the smaller countries, the network of cities is often dominated by the capital. For onequarter of CEMR member countries, where data was available, the capital city’s share of the total population accounted for more than 20%. Predictably, the national capitals in countries with more concentrated urban networks – the ones dominated by capital cities – increased their share further: Estonia, North Macedonia, Portugal, Finland. Declining urban concentration characterised the countries with a more diverse share of capital-city population: Cyprus, Moldova, Slovenia.
Local Finances and the Green Transition 24 A DECADE OF LOCAL FINANCES: TWO CRISES AND THE INTERVENING PERIOD
FIGURE 5 REGIONAL DIFFERENCES: RATIO OF GDP PER CAPITA IN RICHEST AND POOREST NUTS2 REGION, 2019, CHANGE BETWEEN 2010-2019
3. Budget expenditure and investment patterns
The scope of decentralisation has not significantly changed in the CEMR countries over the past decade. The share of subnational government expenditure in total general government expenditure was 25% the year after the economic crisis and, after a short period of some decline, had once again reached the same level by 2019. However, general government spending was somewhat delayed in keeping up with economic growth, as seen in Figure 2 above. The slow gradual economic recovery throughout the entire period led to the continuous decline in subnational expenditure as a percentage of GDP (Figure 6).
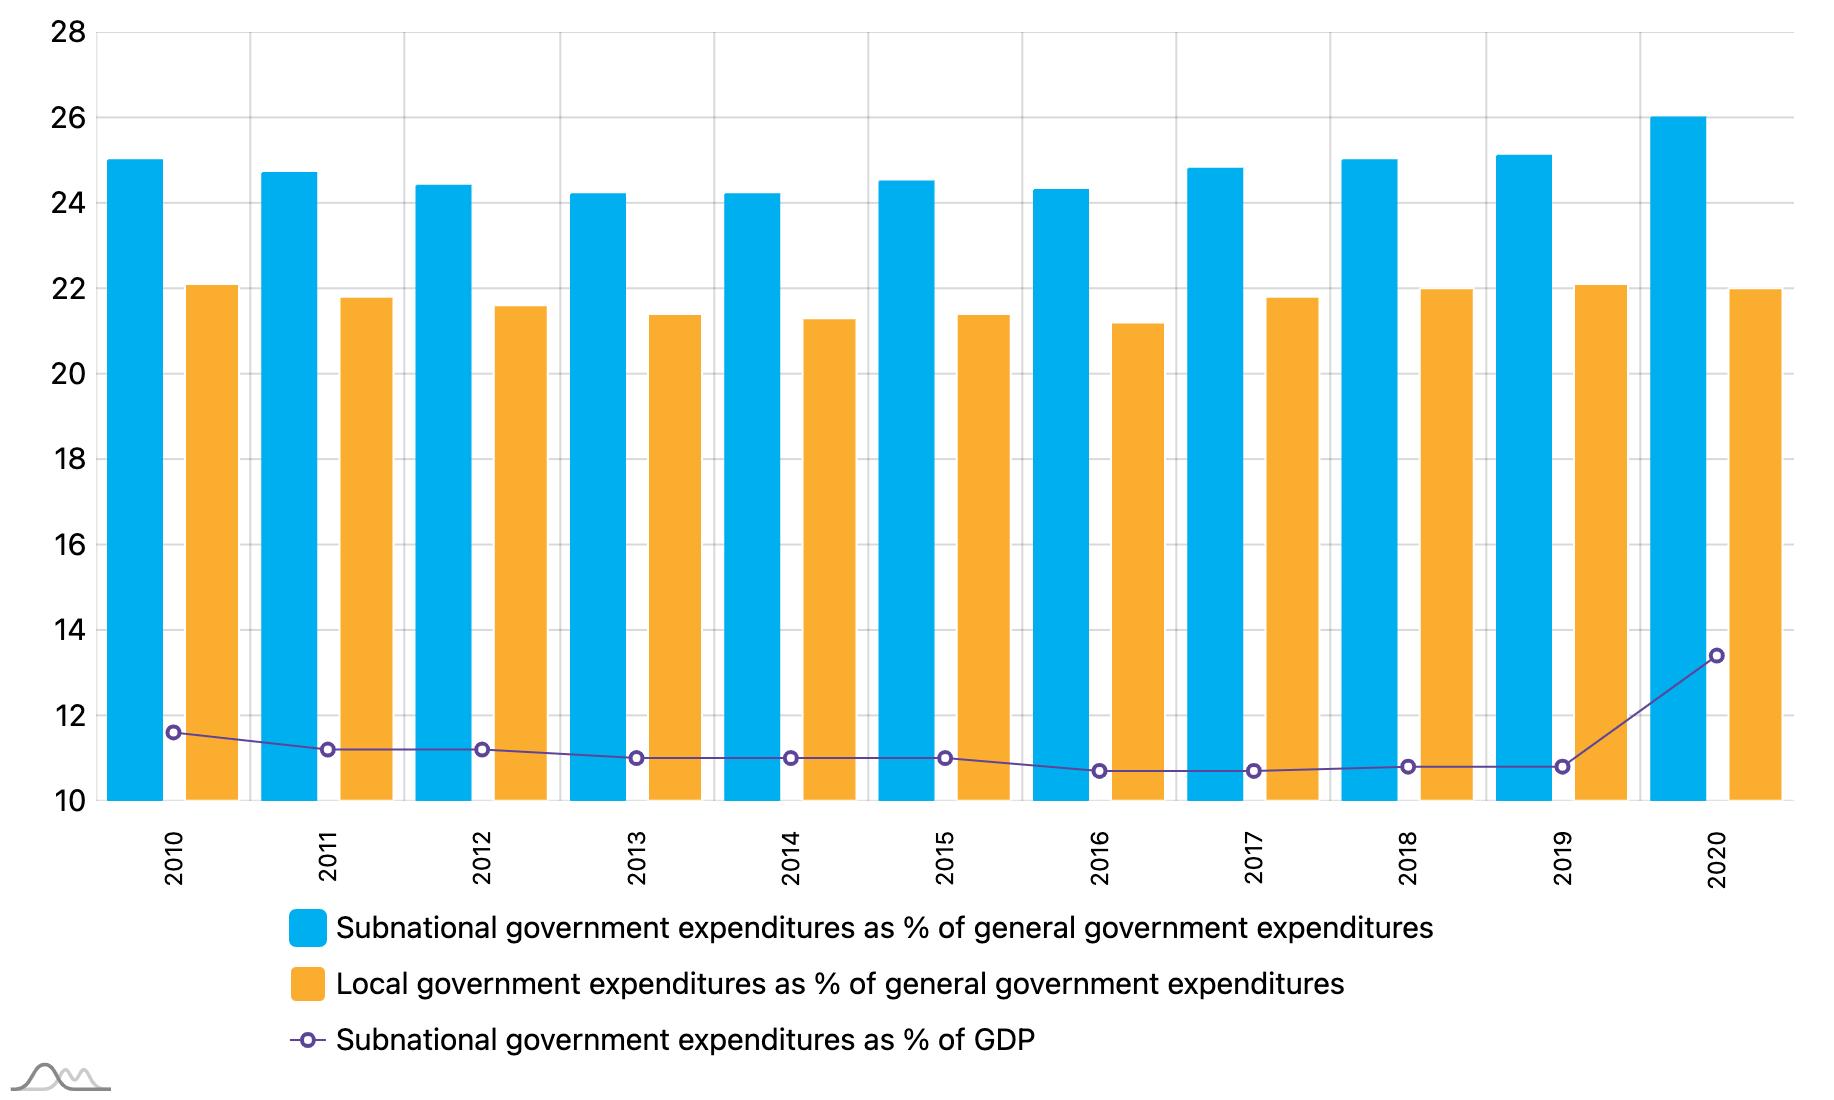
In the first two years of the decade, budget restrictions at the subnational levels were indicative of the economic recovery’s slow start. Between 2010 and 2013, subnational governments’ share in total government expenditure decreased by 0.8%. However, in the three years prior to the pandemic (2017-2019), the relative position of subnational governments had improved. Then in 2020, the economic slowdown and the higher demand for subnational spending due to the COVID-19 pandemic led to an abrupt increase in subnational budgets’ shares again; they reached a record high ratio of GDP (13.4% in 2020) and 26% in general government expenditure.
CEMR countries pursued rather different fiscal decentralisation policies during this period (see Figure 7). One group of countries supported subnational governments, which led to their having a higher share in overall government spending (see left-hand side of the chart). This group is made up of two federal countries (Belgium, Germany), where regional expenditure drove the decentralisation, and two countries with already extended local services (Denmark, Sweden). The other decentralising countries either had a relatively low starting point (e.g. Albania) or were able to undertake major reforms during this period (e.g. Ukraine).
Local Finances and the Green Transition 25 A DECADE OF LOCAL FINANCES: TWO CRISES AND THE INTERVENING PERIOD
FIGURE 6 STABLE LEVEL OF DECENTRALISATION IN CEMR COUNTRIES, 2010-2020 Subnational and local government expenditure as % of general government expenditure and GDP
FIGURE 7 INCREASED LOCAL SPENDING IN MORE DECENTRALISED COUNTRIES SUBNATIONAL GOVERNMENT EXPENDITURE AS % OF GENERAL GOVERNMENT EXPENDITURE, 2020, CHANGES 2010-2020
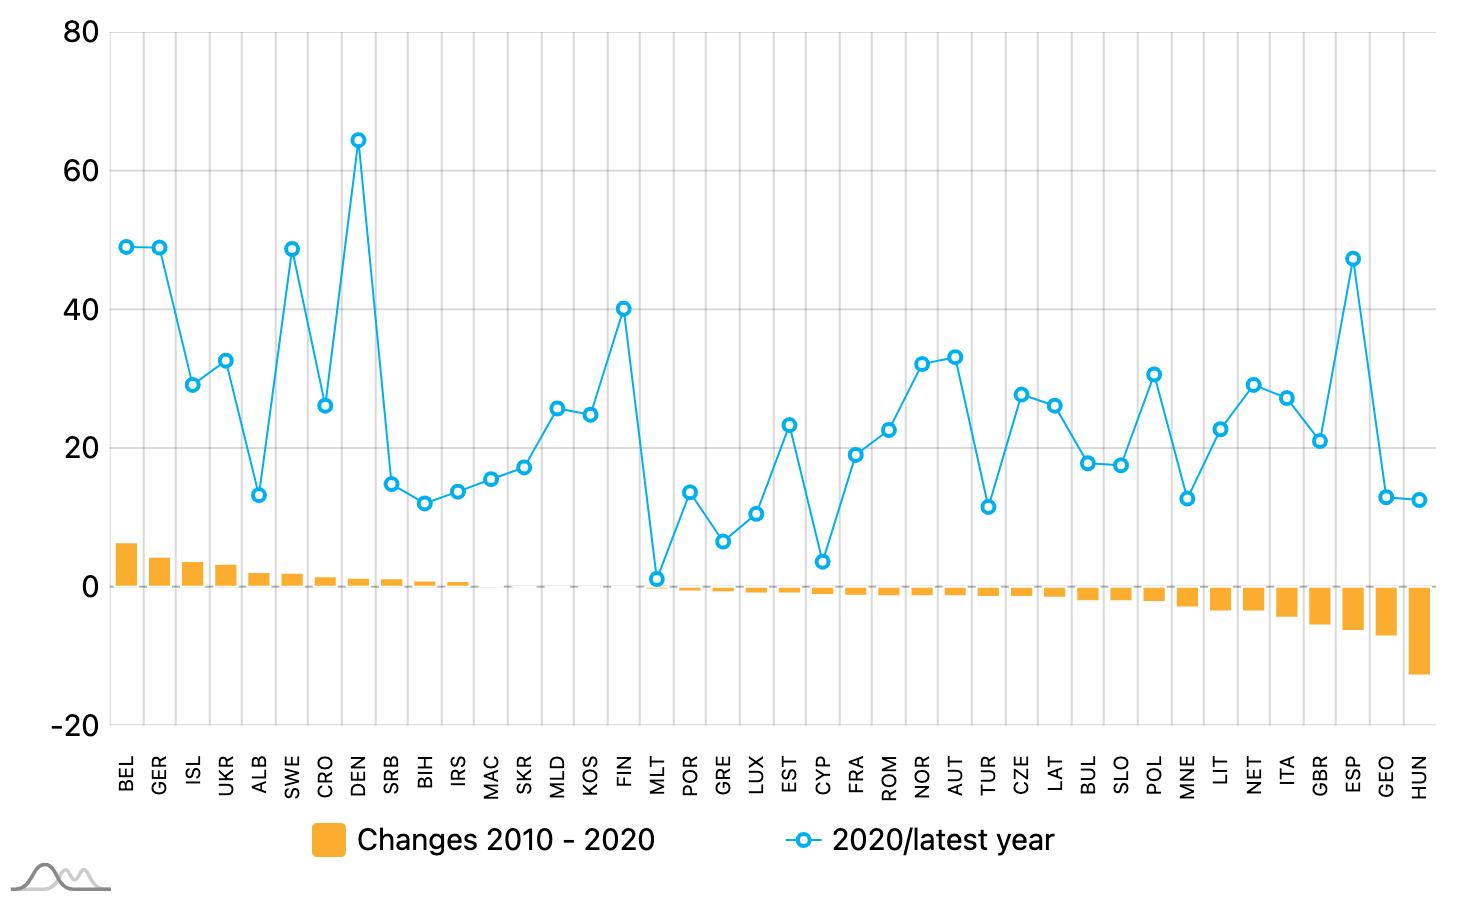
The other group of countries followed radical centralisation policies (countries on the right-hand side of the chart). In their cases, the subnational governments’ share in general government spending decreased by 5% or more. Local governments lost the most in Hungary, Georgia, and among the larger countries, in Spain and the UK. In the quasi-federal Spain, the budgets of the state-like autonomous communities and the lower government tiers were both cut.
Centralisation was prevalent among the CEMR countries. As can be seen in Figure 7, the financial weight of subnational governments in general government expenditure decreased in the majority of countries. Another overall observation was that countries with lower subnational spending preferred centralisation policies, while the more devolved countries supported further decentralisation. There is thus a positive linear correlation between the share of subnational government expenditure and the changes in relative position of local budgets. The more decentralised countries experienced increases or lower cuts in subnational spending than the more centralised ones, which lost more of their spending powers. The public sector’s past characteristics seem to determine its future paths.
Diverse options for countries with fragmented or amalgamated municipal models
Countries with bigger municipalities could opt to devolve more services to local governments with larger populations. However, this economic rationale positing that the scope of expenditure decentralisation is related to local government size could only be observed at work in a small group of countries. There were six countries in total with higher local spending levels and above average municipality population size: Denmark, Latvia, Lithuania, Sweden and the Netherlands – all from the North where amalgamated models with extended municipal functions are common – and Kosovo (see the upper right cell in Table 3).
Local Finances and the Green Transition 26 A DECADE OF LOCAL FINANCES: TWO CRISES AND THE INTERVENING PERIOD
TABLE 3 MAIN TYPES OF LOCAL GOVERNMENTS IN CEMR MEMBER COUNTRIES
Centralised (low)
Large
Small
Scope of decentralisation
(local expenditure in general government expenditure)
Decentralised (high)
Centralised, amalgamated
Turkey, Georgia, Greece, Serbia, Albania, Bulgaria, North Macedonia, Bosnia and Herzegovina, Montenegro, Israel
Centralised, fragmented
Slovenia, Slovakia, Hungary, Portugal, Austria, Belgium, Germany, Spain, France, Luxembourg, Cyprus, Malta
Decentralised, amalgamated
Denmark, Sweden, the Netherlands, Latvia, Lithuania, Kosovo
Decentralised, fragmented
Finland, Norway, Estonia, Poland, Ukraine, Moldova, , Czech Republic, Romania, Croatia, Italy, Iceland
However, many more CEMR countries follow a distinctly different model, with small municipalities and limited local functions (bottom left cell in Table 3). Fragmented municipal structures with a low local share in general government expenditure also characterise the federal countries (Austria, Belgium, Germany, Spain) since the regional governments actually take up the lion’s share of the subnational budgets. France, with its particular hierarchical and cooperation-based municipal model, also belongs to this group. The other members are relatively small countries, with several from Central and Eastern Europe (Hungary, Slovakia, Slovenia), Luxembourg, Portugal and small island States (Cyprus, Malta).
The smaller municipalities in the decentralised countries (bottom right cell) usually coexist alongside a rather powerful intermediate government tier. This group includes Italy, Poland, Ukraine, Finland, Norway a few transition countries primarily from the Balkans (Croatia, Moldova, Romania), the Czech Republic and Estonia. The latter, with its single tier subnational government structure, is the outlier in this group.
The fourth model, characterised by large amalgamated municipalities and limited local functions, are most typical of the Western Balkans; however, Georgia, Israel and Turkey also belong to this group of countries (top left cell).
This rough classification of first tier local governments is important for benchmarking various decentralisation models. Any transfers of best practices and policy solutions need to take these basic differences in local government systems into account. The responses to the past decade’s two crises and the options for supporting municipal reforms all depend on these critical factors of municipality size and scope of local functions. The territorial administration reforms mentioned in Box 3 laid out the basis for further decentralisation, namely by allocating more public functions to amalgamated municipalities (see the example from Estonia in Box 6).
Box 6 – Decentralisation reforms in Estonia: Devolution to amalgamated municipalities
A local government amalgamation reform was implemented in 2017-2018 and merged 213 municipalities into 79. The county governments were abolished and their tasks redistributed between the central and local governments in 2018. County centre municipalities were mainly attributed small-scale tasks such as registering marriages and divorces. More significantly, responsibility for foster childcare services was assigned to local governments. Another significant change is in secondary education, where the central government is opening more and more State “gymnasiums” or secondary schools all over the country while local governments are closing theirs. However, special education schools for children with disabilities are being transferred by the Ministry of Education to municipalities on a case-by-case basis pending agreement. The central government’s strong financial position has made it possible to increase the local government’s financial base (share from personal income tax, equalisation fund, other grants).
Local Finances and the Green Transition 27 A DECADE OF LOCAL FINANCES: TWO CRISES AND THE INTERVENING PERIOD
Average municipality population size
Local functions
Subnational governments in the CEMR countries provide a wide range of services, although there are considerable disparities across the continent. The options for rationalising municipal expenditure and crisis management very much depend on the scope and form of decentralisation, i.e. the types of local public services provided. The services discussed in the section below constitute the ten main functions of government (“Classification of the Functions of the Government” (COFOG) categories).
Education represents the largest expenditure item in the budgets of both types of subnational government tiers (Figure 8). It accounts for more than one-fifth of the budgets of local governments (municipal, intermediate tier) and, in the federal countries, of the regional governments. As municipalities are responsible for a large number of devolved or deconcentrated administrative services, the spending on general public services (mainly public administration) is also significant (17%).
Social services, covering both institutional care and social assistance as well as pre-school services, is also a major item in local budgets (14%). Economic affairs, primarily transport services, energy, agriculture and tourism, is a similarly important spending item (14%). Health care services are divided up among the various government tiers, but it represents a significant local responsibility in many countries (10%). Recreation and culture, including sports, accounts for 5% of local budgets.
Housing and community services, mainly water supply, public lighting and social housing expenditure, uses 7% of local budgets. Environmental services, essentially solid waste and wastewater management, takes up only 6% of local budgets since this usually involves privatised or outsourced services with only a limited connection to the public budget.
Social services and health care also represent major items in the regional governments’ budgets; together, they account for 19% of total expenditure. As the regions also manage infrastructure network services (e.g. transport), spending on economic affairs (13%) is also significant.
Local Finances and the Green Transition 28 A DECADE OF LOCAL FINANCES: TWO CRISES AND THE INTERVENING PERIOD
Local governments, average, 2019
Regional governments, average, 2019
*/ State governments in federal countries
Between 2010 and 2019, the structure of local government expenditure changed only slightly. There was a marginal increase in the share of public education, health care and recreational services. As these human services are usually subject to strict national regulations, their higher share in local budgets may be tied to a national programme or a further devolution of these services.
The budget share of administration, housing and community services and environmental protection decreased. These are usually areas where municipalities have more discretion and capacity to control local spending. This minimal restructuring of local budget expenditure demonstrates that local governments were able to improve
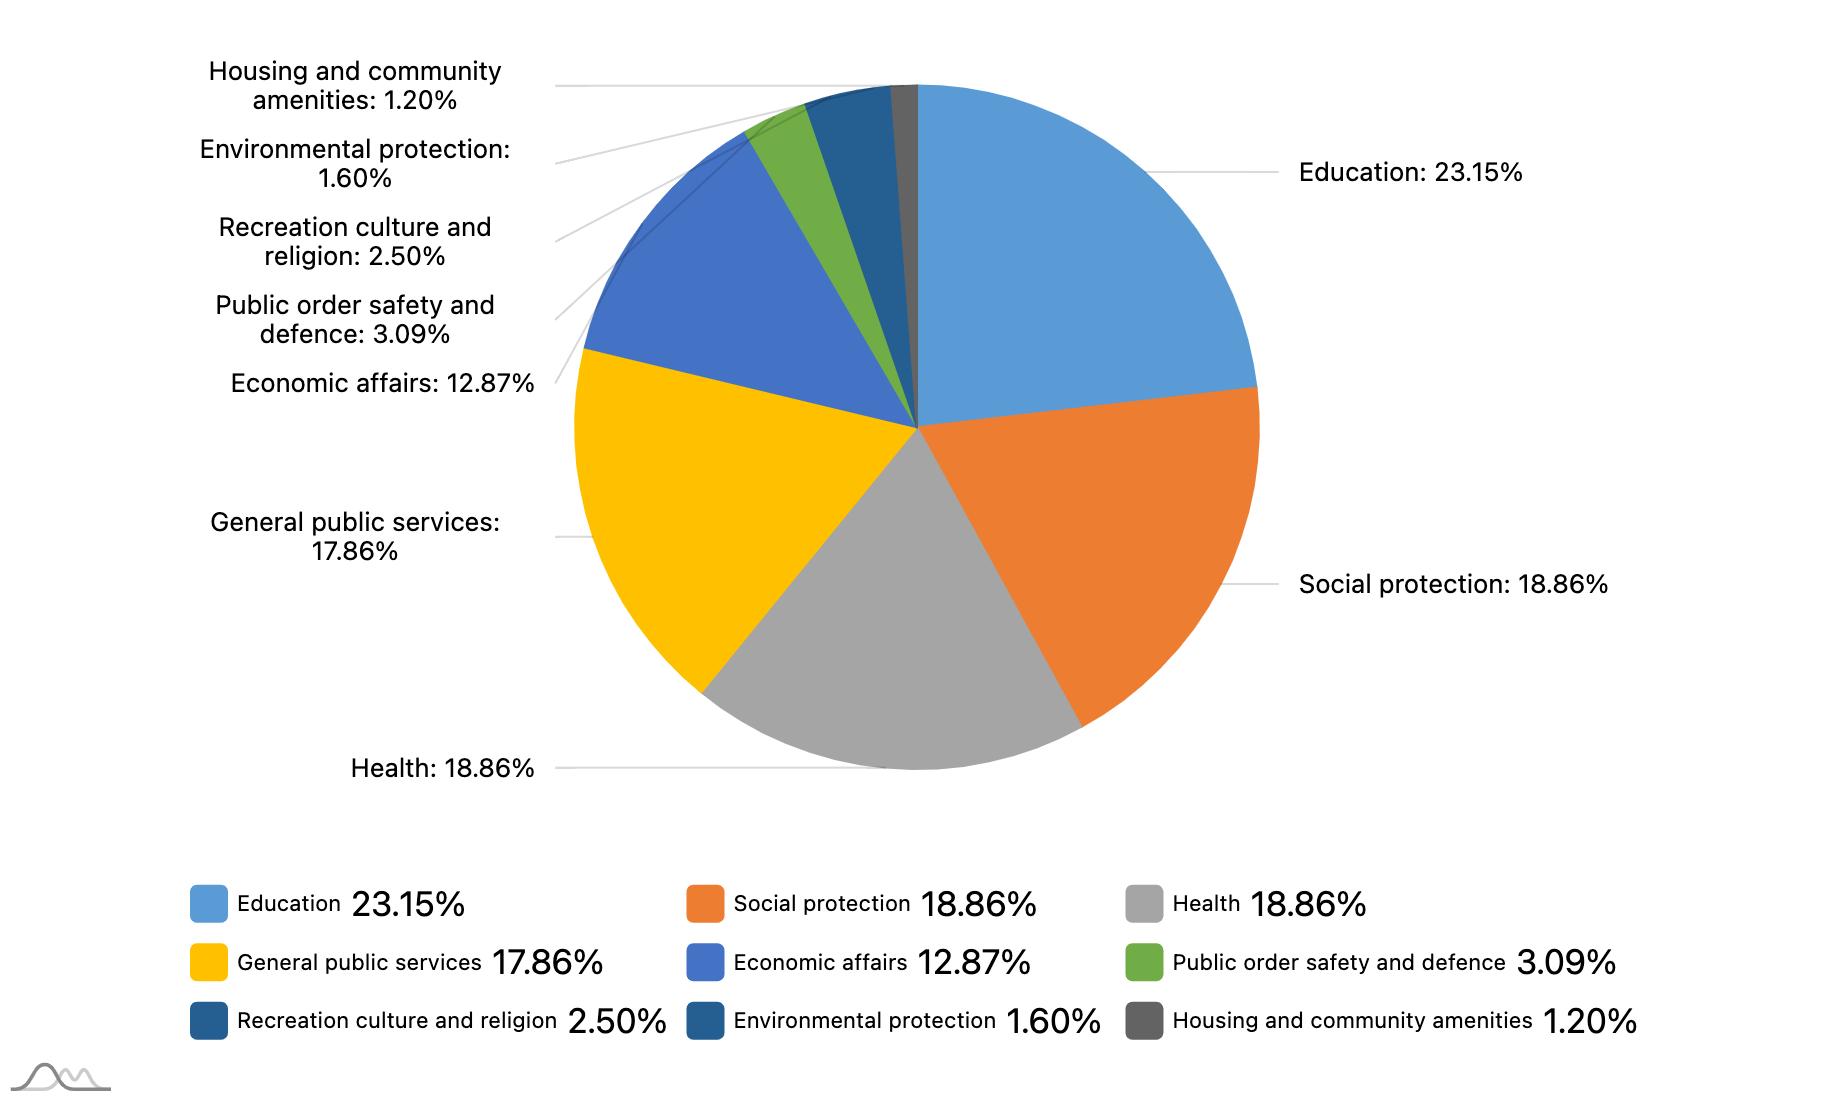
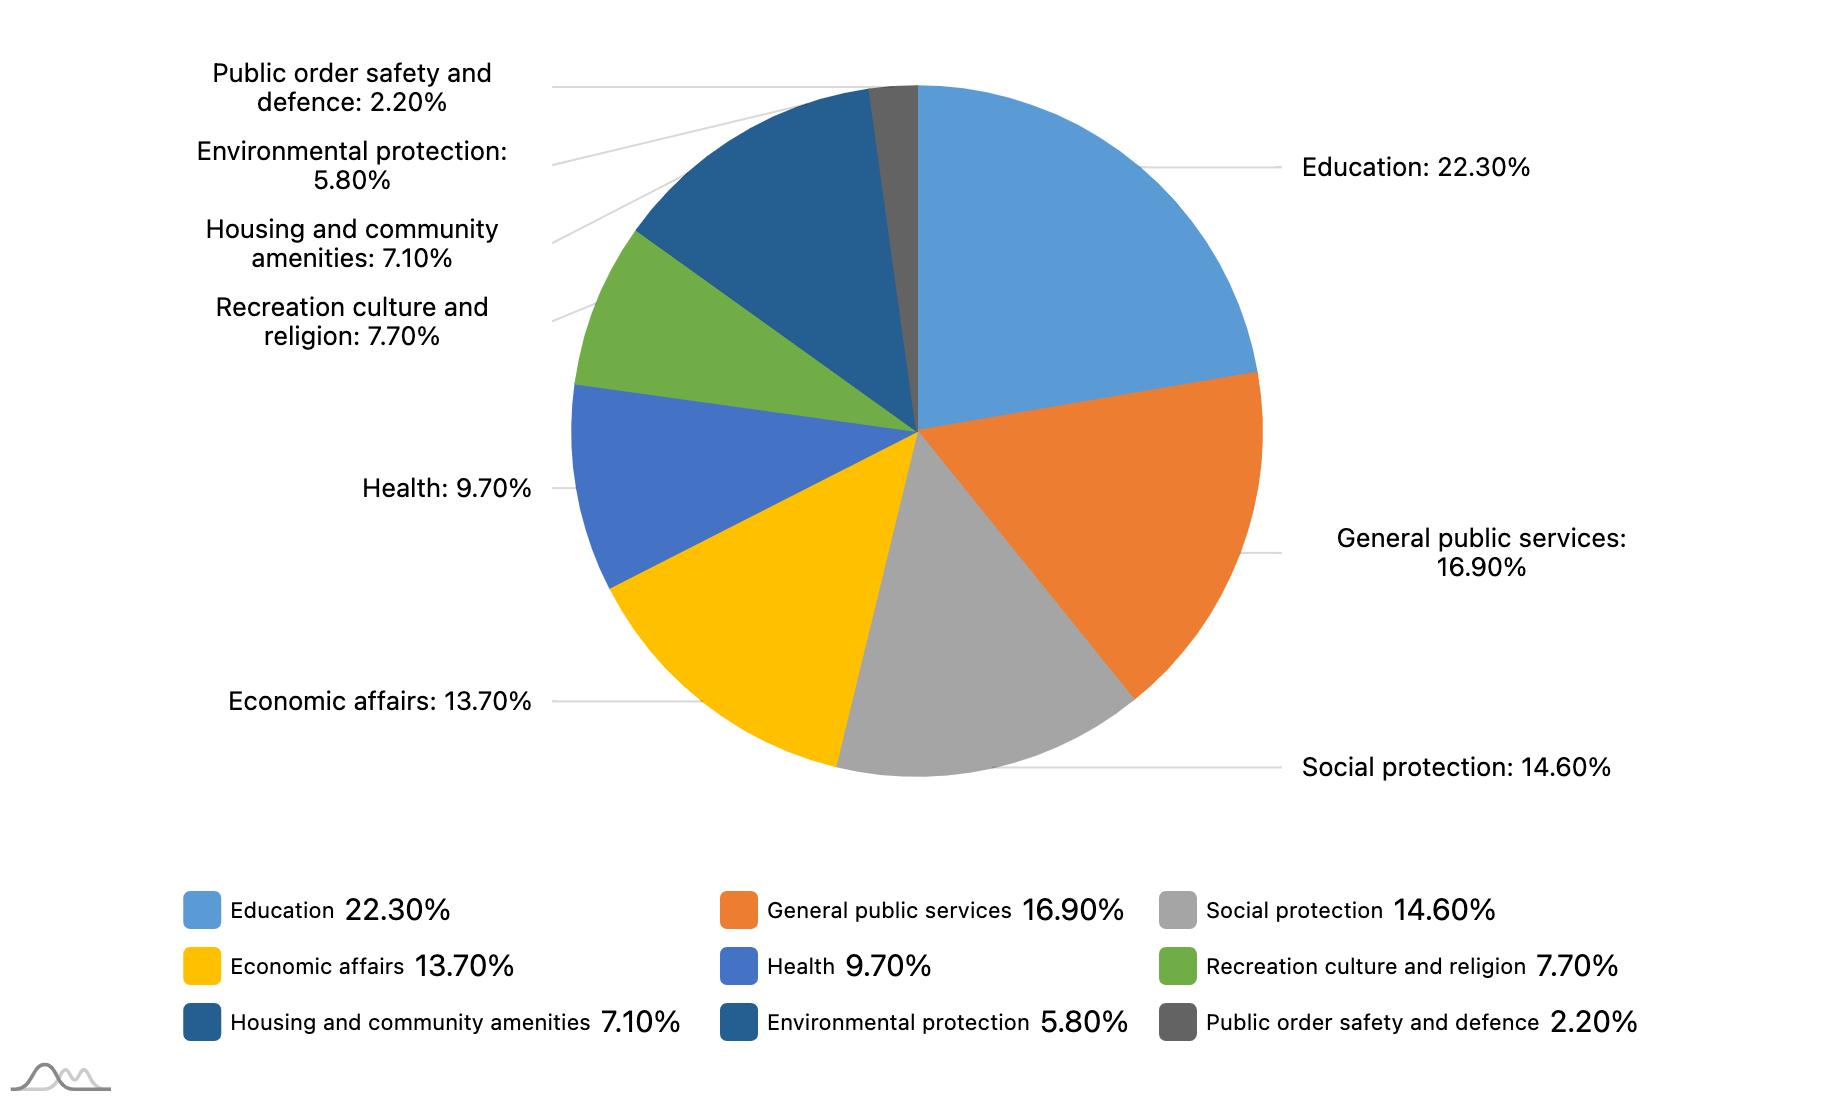
Local Finances and the Green Transition 29 A DECADE OF LOCAL FINANCES: TWO CRISES AND THE INTERVENING PERIOD
FIGURE 8 COMPOSITION OF LOCAL AND REGIONAL*/ GOVERNMENT EXPENDITURE BY FUNCTION
service efficiency in these sectors. Since demand for these typical local services remained stable, it follows that the usual service standards had to be provided even with a lower local budget share.
The restructuring of local budget expenditure could be seen to continue in 2020 and afterwards, even if no comparable data is available for the first year of the pandemic (CEMR, 2021, OECD, 2021). There was a greater need for public health services and social service activities, even as social distancing and work from home decreased the demand for other communal public services.
Locally provided services cover a wide array of areas in the CEMR countries. In the cases where local expenditure is reported by function, the budget shares for health care and social services correlate to the scope of decentralisation (Figure 9). In the most decentralised countries (measured using local expenditure as a % of GDP), these two costly services represented more than 30% of local government budgets.
In countries with an average degree of decentralisation (around 10% of GDP), education and culture were the dominant items in local expenditure. In the less decentralised systems, basic infrastructure services represented the core local mandates. In this group, higher local budgets could be found only in the countries where education was devolved (e.g. Bulgaria, Slovakia, Moldova, Slovenia).
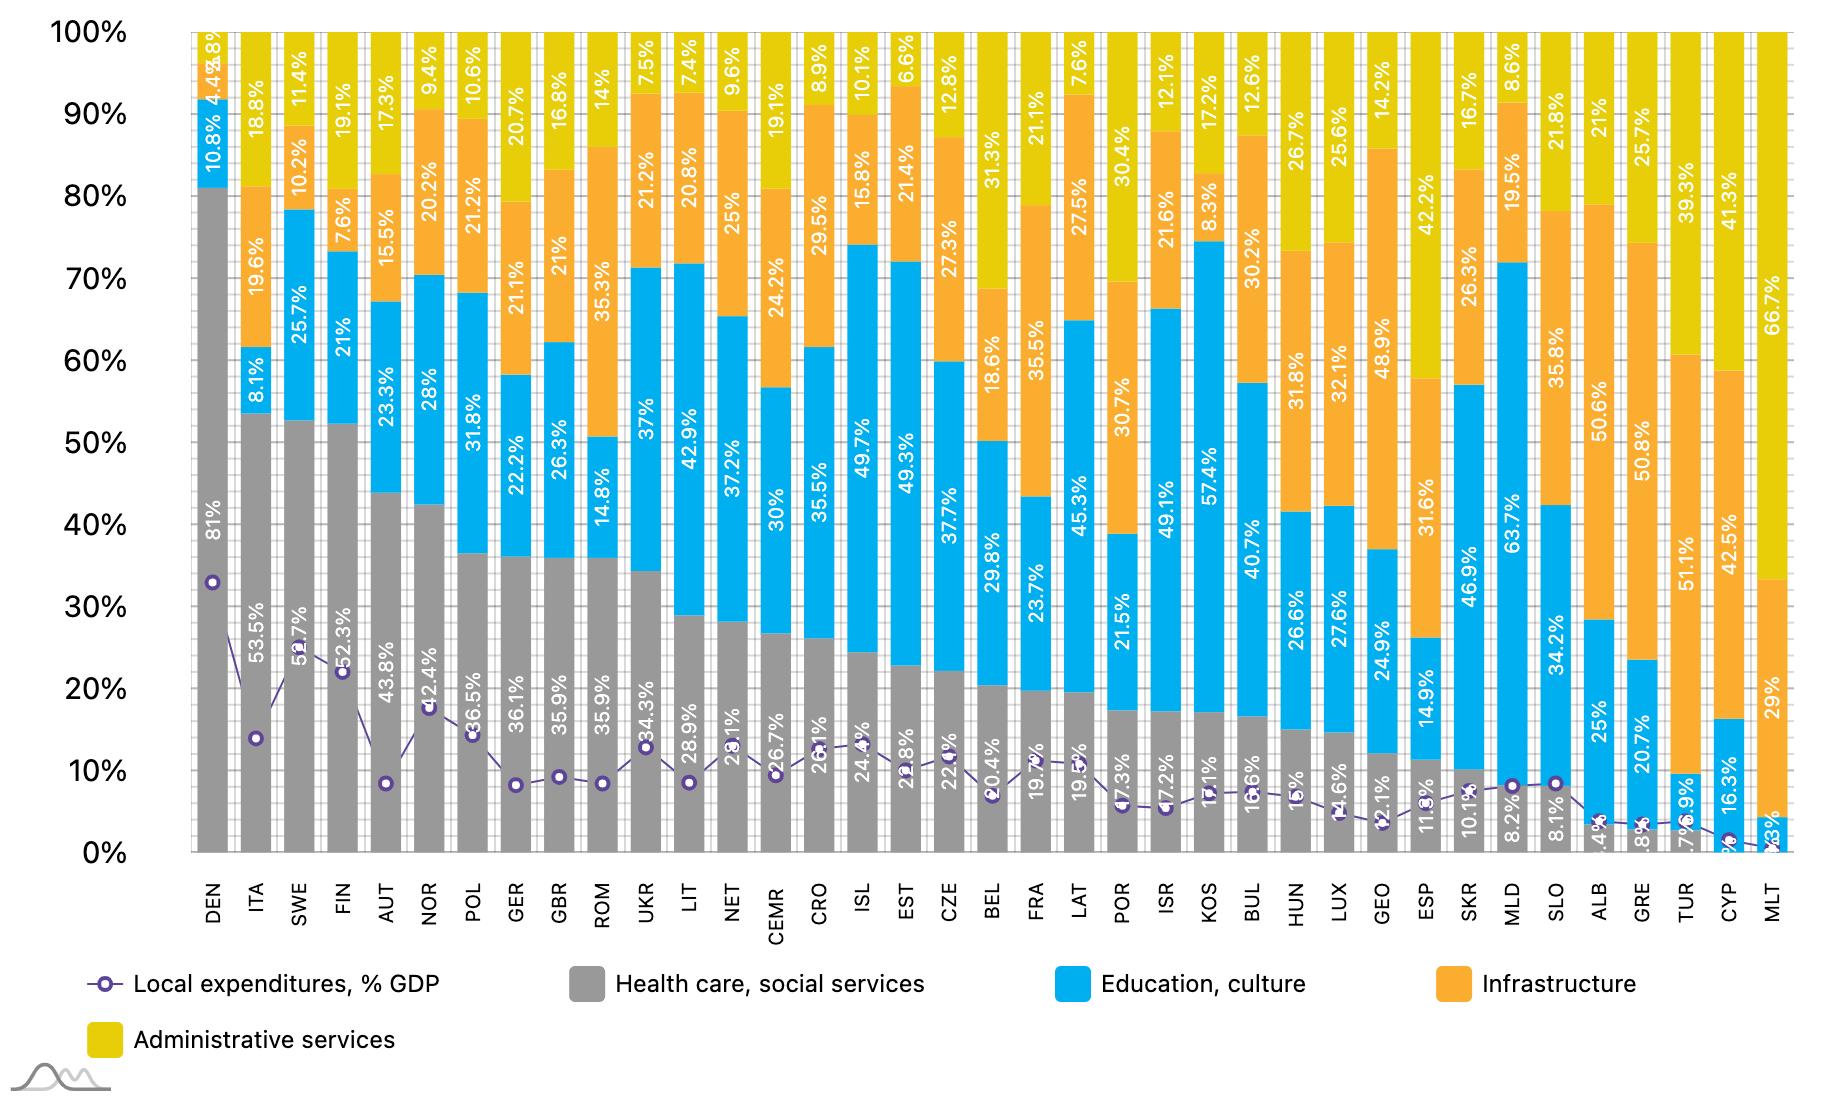
Local Finances and the Green Transition 30 A DECADE OF LOCAL FINANCES:
AND THE INTERVENING PERIOD
TWO CRISES
FIGURE 9 HUMAN SERVICES DOMINATE LOCAL EXPENDITURE, 2019
Box 7 – Austria: Increase in unfunded mandates during the two crises
Among the functions managed by local government, compulsory schools (infrastructure) and childcare (infrastructure and staff) have been especially dynamic areas, particularly since federal policies have greatly expanded these mandates. However, in the past decade, federal legislation has created an additional burden for local governments with the introduction of a compulsory year of kindergarten free of charge before entering primary school. In the field of care for the elderly, eliminating the obligatory payment for individuals in nursing homes (abolition of the nursing care recourse) also gave rise to additional financial burdens for the local level.
During the pandemic era, financial costs increased for some services provided through local companies. However, the public sector was excluded from the COVID-19 aid programmes, generally available to all companies and entrepreneurs in Austria. Nevertheless, the 100% locally-owned companies did not have access to these subsidy programmes.
Spending efficiency
After the 2008-2009 economic crisis, subnational governments everywhere were operating under constant pressure to improve the efficiency of their administration and other locally provided services. Given the difficulty of measuring service efficiency in the public sector, it is not easy to quantify changes in these areas. Fiscal indicators of higher spending can either be a reflection of the inefficient use of resources or it may simply be indicative of better service quality resulting from more spending on a local service.
Conducting an objective assessment is further complicated by the limited comparative data available on expenditure by economic category. The indicator used here to compare data therefore looks at standardised costs, i.e. the current expenditure per capita as a percentage of GDP per capita (for purposes of comparison, both in USD). As this indicator excludes differences in prices, salaries, taxation and level of economic development, it is an effective benchmarking method (Figure 10).
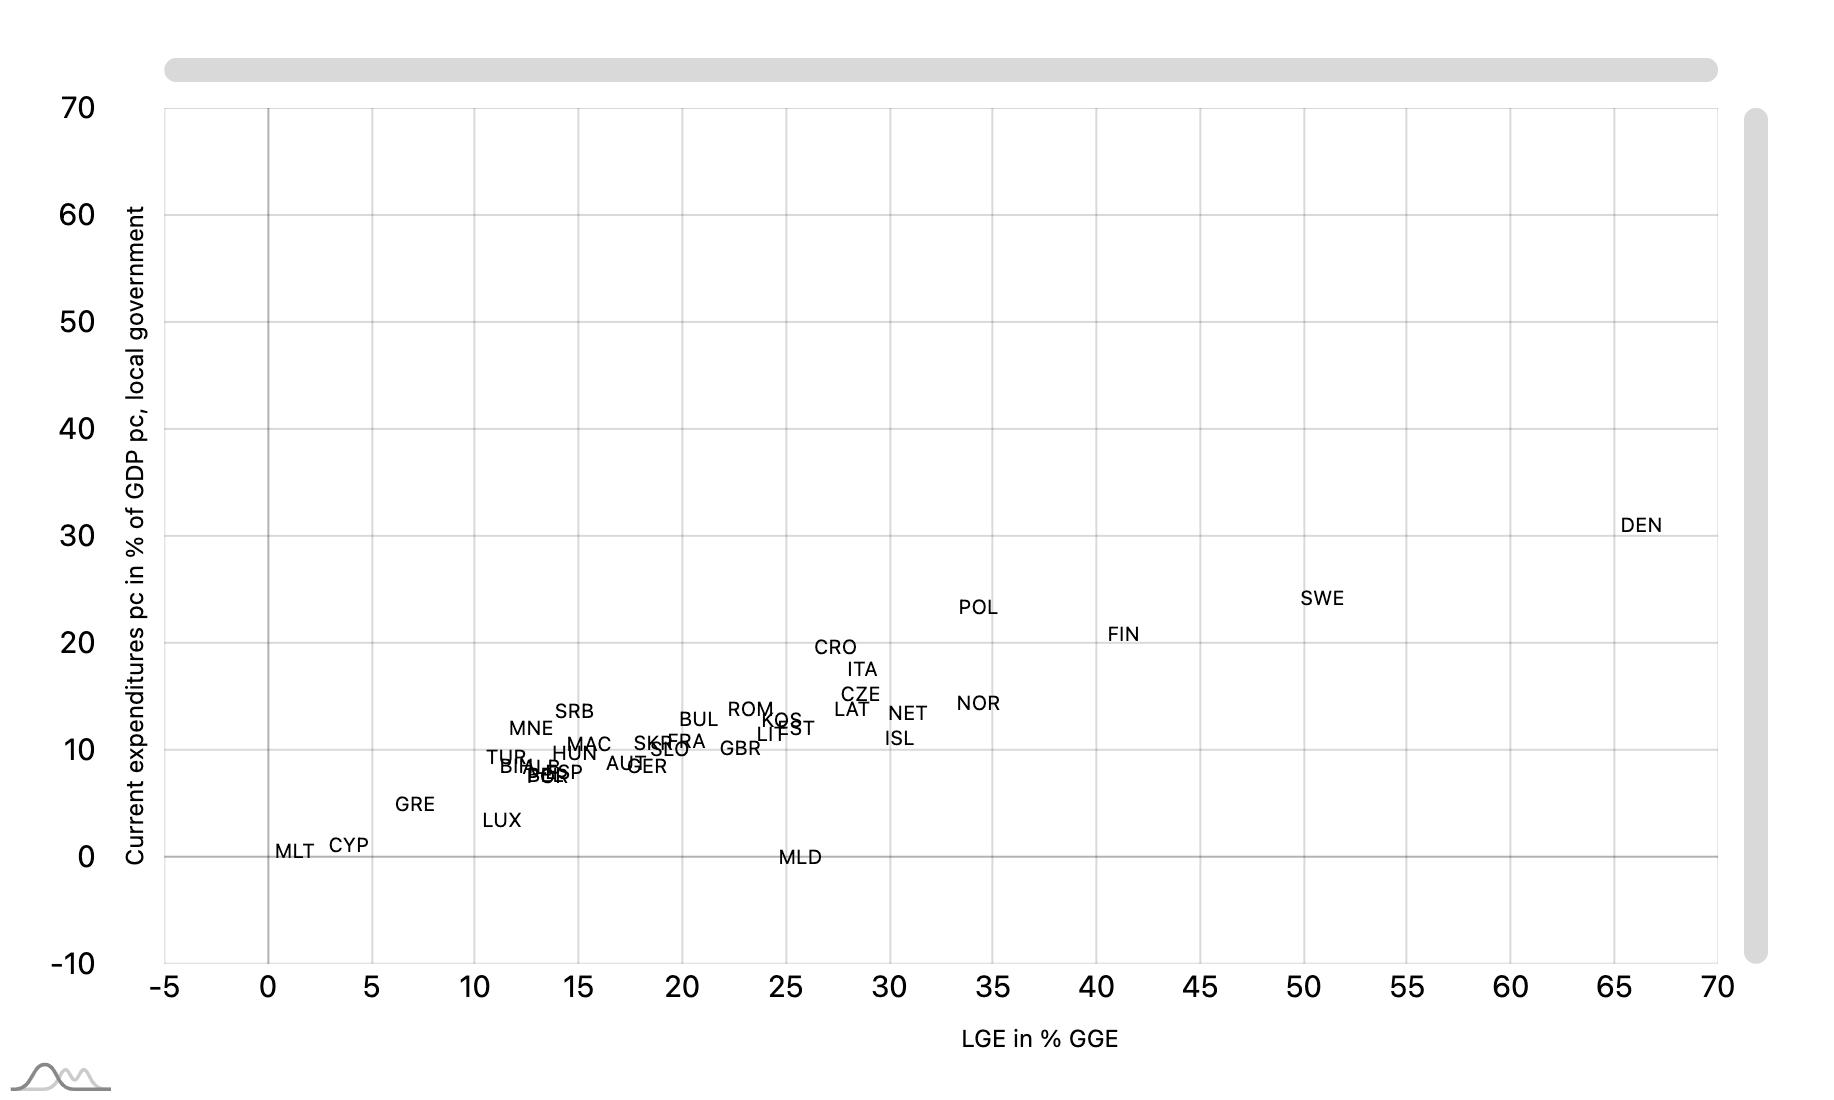
Local Finances and the Green Transition 31 A DECADE OF LOCAL FINANCES: TWO CRISES AND THE INTERVENING PERIOD
FIGURE 10 SCOPE OF DECENTRALISATION AND STANDARDISED LOCAL CURRENT EXPENDITURE, 2018
According to this indicator, local service management is less efficient in the countries above the trendline Their spending exceeds what is considered the average (standardised) level of costs. The countries below the line are regarded as more efficient in their management of local current budgets, in comparison to others with municipalities overseeing similar responsibilities.
In the decentralised countries (local expenditure exceeding 20% of general government expenditure), there is potential for efficiency savings among the transition countries of Central-Eastern Europe and Italy (red circle).
In the less decentralised group, the Western Balkan countries, Hungary and Turkey are the ones with above average current expenditure (blue circle). The countries below the trendline are regarded as more efficient in their total current budget usage.
Subnational government current expenditure is saddled by inescapable labour costs, i.e. gross salaries and wages. Options for improving local service efficiency are determined by the cost structure of municipal actions. Expenditure on employment represented 46% of current expenses on average in the CEMR countries, according to the OECD-UCLG World Observatory (Table 4).
TABLE 4 COMPOSITION OF SUBNATIONAL GOVERNMENT CURRENT EXPENDITURE, 2018
Other spending went towards intermediate consumption (30%), the operational costs of goods and services, and various local subsidies, social expenditure and transfers (23%). Actions to improve government financial efficiency could therefore focus on labour costs, which constitute the largest current expenditure category. However, climate change mitigation may also bring about significant improvements in service efficiency. This is why local governments have often invested in energy efficiency programmes, which produce savings on public lighting and facility management budgets. They can also consider investing in solar energy production (see Box 8).
Box 8 – Solar Energy Agreements in Turkey
Municipalities are amongst the major consumers of electricity and increasing costs in this area represent a huge financial burden. In Turkey, solar energy use has been regulated since 2010 and the first legal framework for unlicensed energy production was introduced in 2011. Municipalities produce energy and deliver it back to the national grid. Their contribution is metered and deducted from their electricity bill. In 2011, the system was introduced with 500 KW of energy production; by 2019, this amount had increased to a staggering 6 000 MW. The national government’s target for 2023 is 15 000 MW. Municipalities have many opportunities and sites to materially install photovoltaic (PV) systems, e.g. on public markets, municipal buildings, service buildings. They also have undeveloped lands to establish solar energy farms.
A municipality first receives a technical plan from the energy company and then obtains permission from the Ministry of Energy and Natural Resources. The completed installation produces energy that feeds back into the national grid and the total calculated savings is deducted from the municipal electricity bill. The investment is made by the municipality, which can apply to ILBANK (Bank of Provinces) for subsidised financial instruments with highly competitive interest rates on loans with a maturity of up to 25 years and a 5-year grace period.
Local Finances and the Green Transition 32 A DECADE OF LOCAL FINANCES: TWO CRISES AND THE INTERVENING PERIOD
Compensation of employees 46.0% Intermediate consumption 29.9% Social expenditure, subsidies, transfers 23.2% Other 0.9% Total 100.0%
Capital expenditure
This sub-chapter looks at the nature of subnational capital spending and in particular expenditure on local government investments. Generally, public budgets comprise current expenditure, which covers daily operational and maintenance costs such as salaries, materials, energy, etc., and capital expenditure. The latter generally consists of investments in physical infrastructure (buildings, utility networks, other assets) with a useful lifespan of more than one year as well as financial investments. After a brief description of the main expenditures by competence, this report will study the proportion and composition of subnational capital expenditure.
Capital investments represented only 15-18% of total subnational expenditure from 2010 to 2020. More capital investments are managed by first tier local governments (e.g. municipalities, counties) than by regional (state) governments, where capital expenditure only accounts for 5-7% of total budgets. Since 2010, the share of capital investments in subnational budgets has remained relatively stable. The 2016 and 2017 fiscal years were the exceptions when capital expenditure ratios fell slightly (15-16%) amidst a decline in overall government expenditure. In the first year of the pandemic, current spending (operational, maintenance) took up a large proportion of subnational government expenditure and the capital investment ratio fell again to 15% (2020).
However, subnational governments are responsible for a significant part of all government capital expenditure. Over the past decade, the trends in subnational government capital expenditure have followed the overall pattern of decentralisation.
Capital budgets were constrained after the 2008-2009 economic crisis. Subnational governments were the target of national fiscal policies and central government actions aimed at balancing public budgets. Following a gradual decline in the ratio of local investments that lasted until 2016, this trend reversed course and the share of subnational investments increased until 2019. In the first year of the pandemic, subnational government capital investments again dropped, especially at the local government tier (down to a ratio of 37.9% in the countries that reported data for 2020).
Setting aside these CEMR averages, there are major differences in subnational governments’ responsibilities over capital investments depending on the country (Figure 11). In the less decentralised countries, local governments manage one-fifth or more of total government investment (Cyprus and Malta are exceptions). In the decentralised countries, subnational governments manage more investments than the national governments (see the federal countries and those with a high local expenditure-GDP ratio). Among the federal countries, however, it is the regional government tier that is more active in this area in Belgium and Spain.
Local Finances and the Green Transition 33 A DECADE OF LOCAL FINANCES: TWO CRISES AND THE INTERVENING PERIOD
Throughout 2010, almost an equal number of CEMR member countries reported a declining share as they did an increasing share in total capital spending of subnational governments (Figure 12). Subnational governments lost the most in the less decentralised countries (e.g. Montenegro, Serbia, Bosnia and Herzegovina, Slovakia) and where major centralisation reforms were implemented (e.g. Hungary).
However, at the other end of the spectrum, subnational governments in some less decentralised countries did increase their role in public investments (e.g. Moldova, Portugal, Albania, North Macedonia, Greece). Others from the more decentralised countries in the middle were mostly able to maintain their share in general government capital investments; while some even managed to carve out a larger portion of total government investment (e.g. Croatia, Sweden, Finland, UK, Denmark).
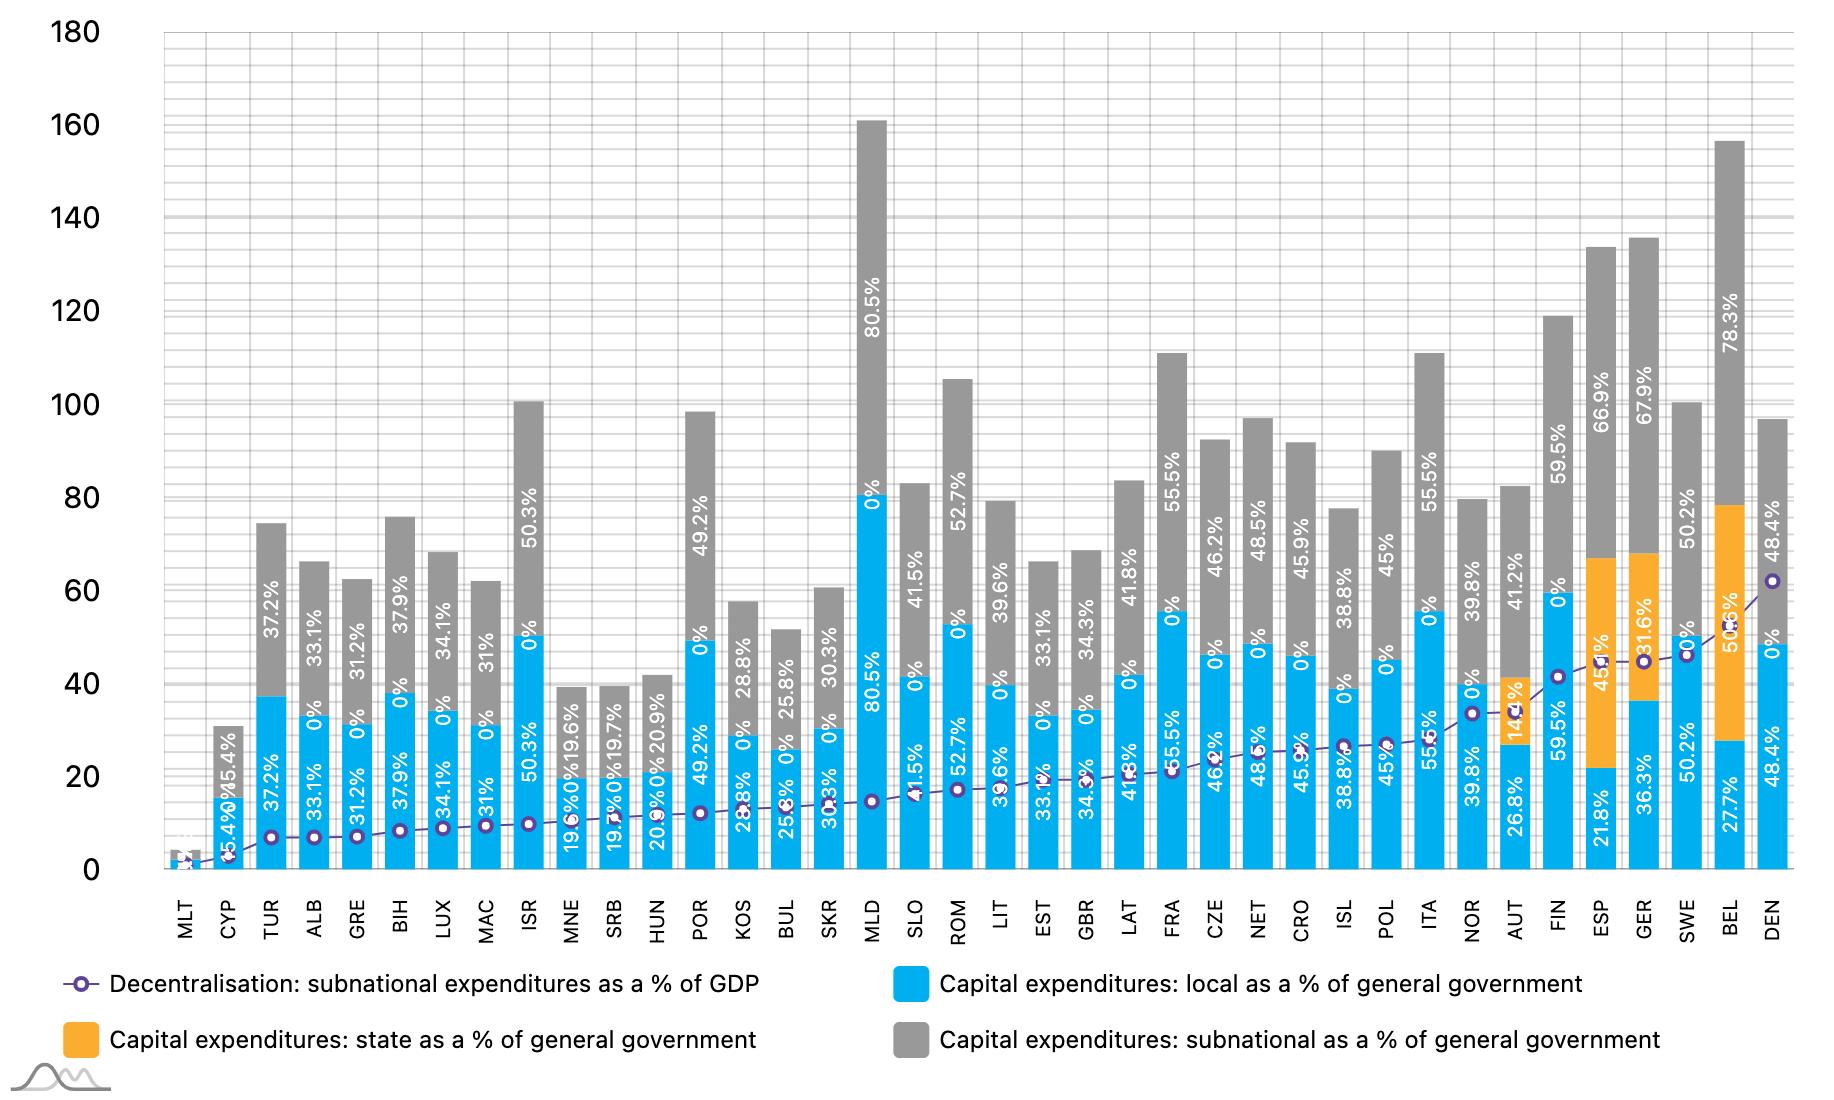
Local Finances and the Green Transition 34 A DECADE OF LOCAL FINANCES: TWO CRISES AND THE INTERVENING PERIOD
FIGURE 11 HIGH SUBNATIONAL GOVERNMENT CAPITAL INVESTMENT RESPONSIBILITIES CAPITAL EXPENDITURE AND DECENTRALISATION, 2020 ( MOST RECENT YEAR 5)
5 The most recent year of reporting was 2020, although in some Western Balkan countries only 2019 data was available. The data for 2019 does not reflect the impact of the pandemic.
FIGURE 12 IMPACT OF THE CRISES: DIVERSE SUBNATIONAL CAPITAL EXPENDITURE POLICIES OVER THE DECADE (2010-2020/MOST RECENT YEAR )
CHANGES IN CAPITAL EXPENDITURE BETWEEN 2010-2020 ( SUBNATIONAL SHARE AS A % IN GENERAL GOVERNMENT CAPITAL EXPENDITURE )
This fluctuation in capital expenditure can be explained in part by political electoral cycles. In some countries, local government elections coincided with higher local capital spending: Moldova (2019), France, Romania and several regions in Italy (2020).
Local government capital expenditure is mainly driven by national investment programmes and grant schemes. For example, the “Facilities for Syrian Refugees in Turkey” programme has a municipal component, which allocated EUR 400 million to local infrastructure projects (see Box 9). It also has grant and loan components from three donors under a joint coordination mechanism.
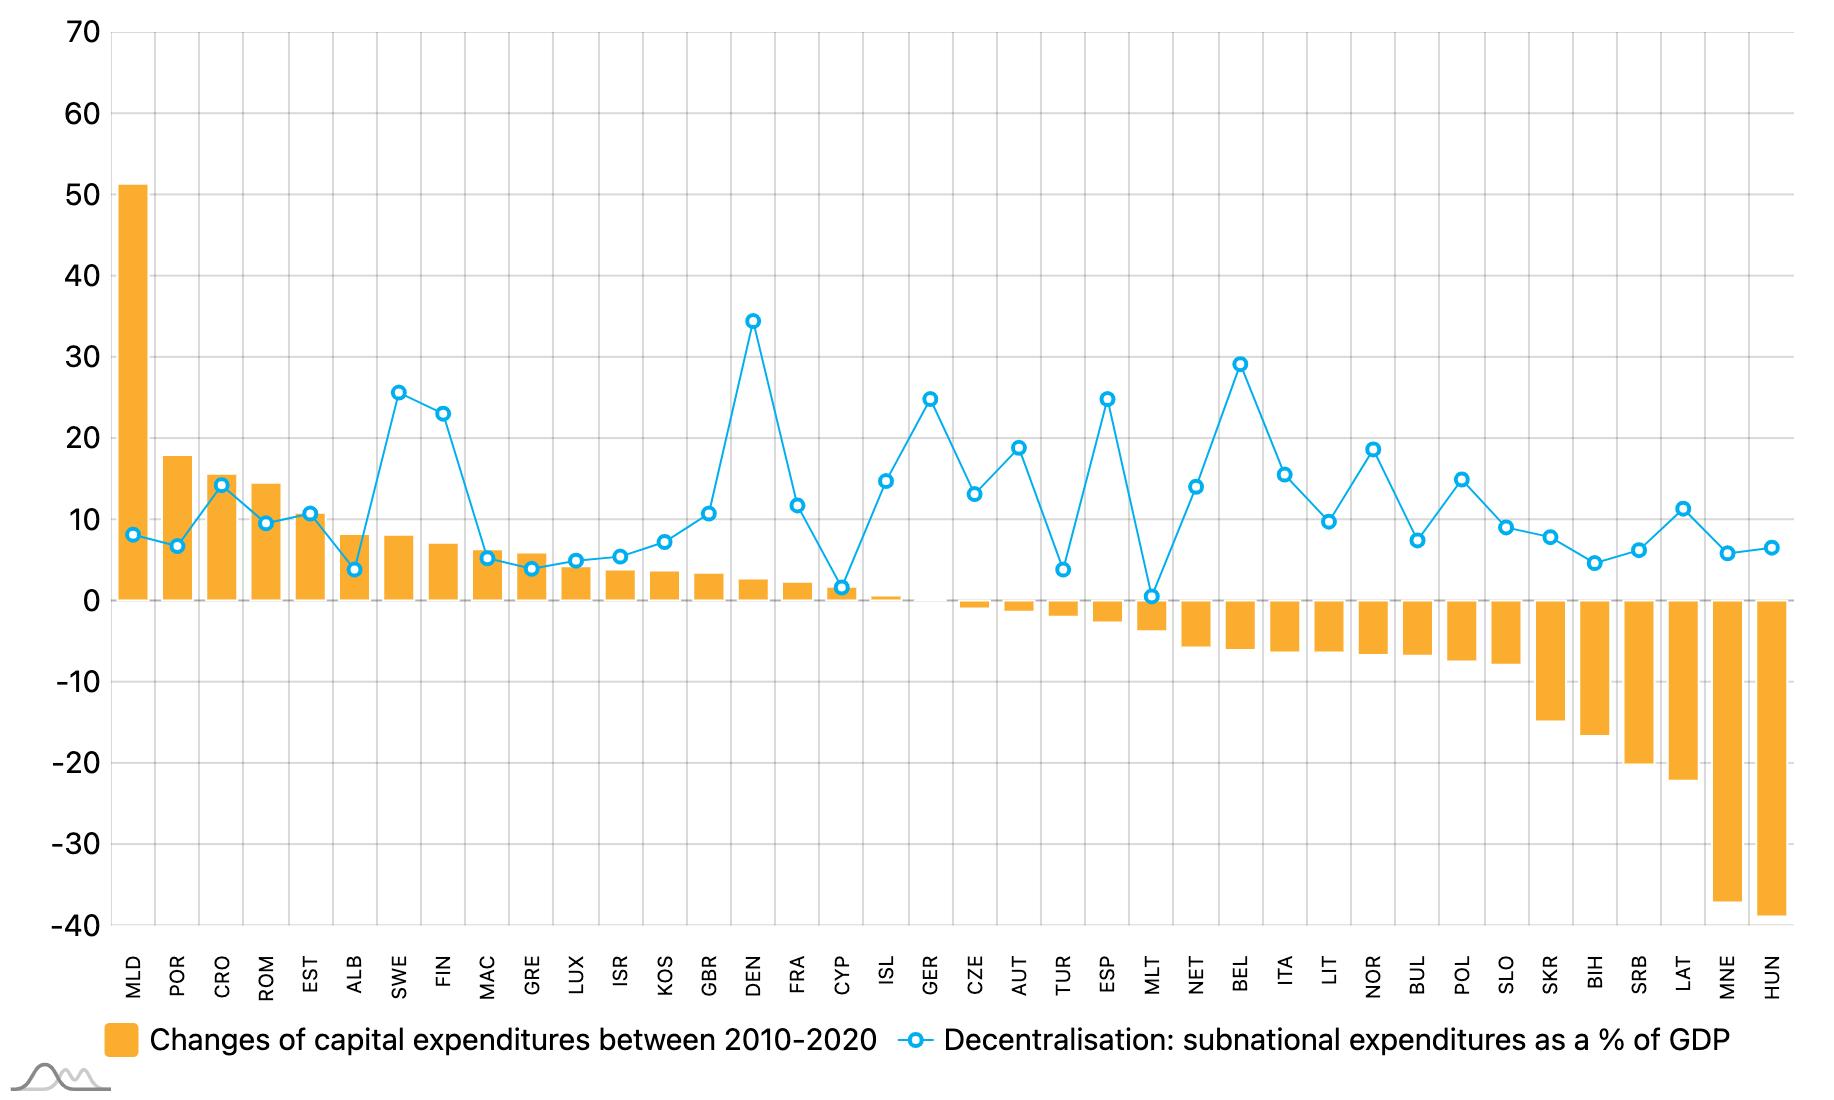
Local Finances and the Green Transition 35 A DECADE
LOCAL
PERIOD
OF
FINANCES: TWO CRISES AND THE INTERVENING
Box 9 – Facilities for Syrian Refugees in Turkey
Turkey currently hosts over four million refugees and the European Union has pledged to assist Turkey in dealing with this massive task. Of the Syrians under temporary protection (SuTPs), 98.5% now live out of shelters in many cities and towns. These host municipalities were already facing significant development challenges, such as providing adequate services and support for infrastructure, education, housing and employment.
The EU Facility for Refugees in Turkey manages a total of EUR 6 billion in two tranches. It also provides a joint coordination mechanism to ensure that the needs of refugees and host communities are addressed in a comprehensive and coordinated manner. The Facility has prioritised humanitarian assistance, education, migration management, health, municipal infrastructure, and socio-economic support. In order to overcome any public tensions that might arise, all projects under the FRIT programmes target a parity of 50% Syrians and 50% most vulnerable members of the host community.
Under the framework of the second tranche (FRIT 2), the French Development Agency (AFD) signed an agreement with the European Union Delegation to Turkey. On top of the already earmarked amount of EUR 214.8 million, AFD supplemented the loan with an additional EUR 63 million (bringing the total amount to EUR 277.8 million). Facilitated by the operational and financial intermediation of ILBANK (Bank of Provinces), these funds will go towards projects focusing on drinking water supply and sanitation and solid waste management. The 19 existing projects have targeted the 8 provinces close to the Syrian border that host the highest numbers of refugees. In addition, the World Bank has also signed an agreement with the EU for a total of EUR 135 million destined for the municipal services improvement programme. Almost all the projects are currently in development.
Local green investments
This sub-chapter sheds some light on the state of play of local and regional green finances where the financial data is available. Subnational governments have been conferred powers to manage capital expenditure in several areas pertaining to the six climate and environmental objectives of the EU Taxonomy regulation6, primarily the following: climate change mitigation, climate change adaptation, the sustainable use and protection of water resources, the transition to a circular economy, pollution prevention and control. Municipalities and regions play a crucial rule in global efforts to achieve the Greenhouse Gas (GHG) reduction in line with the Paris Agreement of 2015 and to reduce global warming to 1.5 degrees Celsius above preindustrial levels. According to the Greenhouse Gas Protocol, cities are responsible for an estimated 75% of global energy-related CO2 emissions.7 The European Commission estimates that there is a yearly investment shortfall of EUR 350 billion to overcome to meet the EU’s climate mitigation goals and an additional EUR 130 billion needed each year to attain its other environmental objectives (European Commission, 2021).
6 European Commission 2022, https://ec.europa.eu/info/business-economy-euro/banking-and-finance/sustainable-finance/eu-taxonomy-sustainableactivities_en
7 https://ghgprotocol.org/greenhouse-gas-protocol-accounting-reporting-standard-cities
Local Finances and the Green Transition 36 A DECADE OF LOCAL FINANCES: TWO CRISES AND THE INTERVENING PERIOD
2010 2015 2019 Housing, community amenities 85.0 90.2 88.2 Environmental protection 75.3 70.9 73.8 Economic affairs 50.9 48.8 50.0 Total subnational investments 54.1 52.9 54.3
TABLE 5 SUBNATIONAL GOVERNMENT CAPITAL FORMATION AS % OF GENERAL GOVERNMENT IN SELECTED SERVICES, EU COUNTRIES, 2019
These investment gaps cannot be bridged by national governments alone. It requires the mobilisation of private and public financial resources and this is where subnational governments also play an important role. They exercise partial control over the main sources of emission since housing, energy infrastructure, public transport, waste management, etc. are usually local government competences. As will be discussed later in this study, the main pillars of the European Union funding mechanism (Recovery and Resilience Facility) also entail a significant local dimension.
Most subnational capital investments are implemented in the infrastructure, communal and utility sectors. Local green investments are typically reported in three COFOG service areas: housing and community amenities, environmental protection and economic affairs (Table 5). In EU member countries, subnational governments were predominant in this respect in two areas: in housing and community services, almost all capital investments were local (88% of all government capital formation in 2019); in environmental protection, which includes reporting of waste management, an overwhelming majority of capital investments were local (74% in 2019).
Over the past decade, the local share of spending on housing and community investments has even increased despite the unfavourable economic conditions. This further highlights the importance of subnational governments in public services relating to climate change, green development and environmental protection. Transport-related investments, which fall under economic affairs, have been almost equally implemented by the national and local government tiers (see the case of Austria in Box 10).
Box 10 – Local investments in urban public transport in Austria
The federal government financial allocation for public transport under the fiscal equalisation scheme covers less than 5% of cities’ expenditure. The federal government provides funding, via the states (Länder), for the extension of city-regional railway systems, which amounted to EUR 125 million during the 2020-2024 period.
Cities benefitted from increased investment in public transport. According to a study of 12 participating cities, even though spending increased by 28 % from 2014 to 2019, revenue increased only by 12%.8 A new phase of subway construction in Vienna will cost EUR 6 billion, 50% of which will be covered by the federal government. Several public transport projects are still in the planning stage, for example, trolleybuses in the city of Linz (with costs split between the city (60%) and Land (40%)).
Local Finances and the Green Transition 37 A DECADE OF LOCAL FINANCES: TWO CRISES AND THE INTERVENING PERIOD
8 https://www.kdz.eu/de/wissen/studien/finanzierung-des-oepnv-oesterreichischen-staedten Germany 11 092 Austria 850 Norway 394 Finland 310 Slovenia 212 France 101 Lithuania 100 Estonia 79 United Kingdom 42 Netherlands 25 Ukraine 25 Poland 16 Czech Republic 14 Source: UN SDG database, indicator 13.1.3
TABLE 6 NUMBER OF LOCAL GOVERNMENTS THAT ADOPTED AND IMPLEMENTED LOCAL DISASTER RISK REDUCTION STRATEGIES, 2018
Local governments can do a lot more for a better environment beyond investing in municipal service improvements. Local strategies on environmental risk management have an impact not only on municipal services but affect other actors such as businesses and citizens as well. Goal 13 of the UN Sustainable Development Goals aims to combat climate change and promote adaptation actions. It is worth noting that the sub-indicator measuring progress in this field specifically refers to “proportion of local governments that adopt and implement local disaster risk reduction strategies in line with national disaster risk reduction strategies”.
Some CEMR countries have been major actors in this field since the early days of the agreement on the SDGs. The number of local governments that have adopted and implemented local disaster risk reduction strategies is listed in Table 6. Municipalities from countries listed at the top have been the most active (some cities have even come up with multiple strategies), while in other countries, only a few cities have experimented with risk reduction strategies thus far. Overall, subnational governments in the CEMR countries have been active in developing local climate-related programmes (see Box 11 on Tartu, Finland, Box 12 on Austria and Box 13 on the model of urban green areas in Turkey).
Box 11 – Car-Free Avenue project in Tartu, Estonia
The City of Tartu has focused on creating high-quality public spaces in order to bring people together from all walks of life and improve the quality of life in the city. In July 2020, the city closed off one of its main centre streets to car traffic and opened it up to pedestrians for one month as part of an experiment. This Car-Free Avenue project concept was first put together within a month after the COVID lockdown. It was a case of excellent collaboration between most of the departments of the Tartu City Government and more than 50 partners that came together to make the Car-Free Avenue project a reality. The budget of the project was around EUR 80 000 and was provided by the city.
The Car-Free Avenue was situated in between the classic old town and the river Emajõgi, giving new life to riverside areas and creating a connection between the two spots. The whole area was redesigned to create a public space made up of different microcosms, presenting versatile possibilities. It became a hot spot for different events, including dance courses, morning yoga, national radio broadcast pop-ups, concerts and more. More than 200 events, performances, conversations, meetings, mini-concerts and workshops took place on Car-Free Avenue over a one-month period. There were activities for both children and the elderly. It also launched a public discussion all over Estonia on climate.
The design of the area complied with COVID-19 restrictions and followed national social distancing rules. All of the design elements took the two-metre requirement into account; even the grass around the area was sectioned off into two-metre stripes.
The “Autovabaduse” (Car-Free Avenue) event attracted people from all over Estonia and even from abroad with around 150 000 total visitors. An impact assessment of Car-Free Avenue was conducted, receiving feedback from thousands of respondents. As many as 70% thought that the project had been a success. Another positive impact of Car-Free Avenue was its effect on domestic tourism, attracting nearly 7 000 more overnight stays in Tartu over July of the previous year.
The overall opinion of 25 businesses in the surrounding area was also positive: 85% of the enterprises noted that the project had boosted the area and 64% of the respondents confirmed that their business turnover for July was higher than expected. In addition, 33 programme partners were interviewed and 91% of them expressed interest in continuing the cooperation in the coming years. This novel and sustainable approach received a great deal of media attention and led to much discussion regarding the future of city centres and the inexorable rise of private car use in cities.
Many car owners were initially opposed to the closing of the street as they feared increased traffic jams. However, traffic did not in fact become an issue and people began to realise that the whole urban area could enjoy many benefits from the project. Traffic analysis of the period actually showed that the time spent in rush hour traffic jams during the Car-Free Avenue project only increased by one minute.
Local Finances and the Green Transition 38 A DECADE OF LOCAL FINANCES: TWO CRISES AND THE INTERVENING PERIOD
Box 12 – Local climate change mitigation and adaptation programmes in Austria
Nationwide funding programmes in Austria have focused on the following areas: energy renovation of housing and public buildings; energy efficiency within the context of the states’ (Länder) housing subsidy programmes; and infrastructure for flood control and avalanche barriers. Flood protection measures are often financed by several municipalities with co-financing from the Land and the federal government.
The major climate-related funding and support programmes are the Climate and Energy Model Regions (KEM) (https://www.klimaundenergiemodellregionen.at/); Climate Change Adaptation Model Regions, (KLAR) (https://klar-anpassungsregionen.at/); the e5-Local Energy Efficiency Programme (https://www. e5-gemeinden.at/); and Climate Alliance Communities (https://www.klimabuendnis.at/klimabuendnisgemeinden)
In the City of Vienna, several improved climate-related planning practices have been implemented: the Climate Roadmap (measures in the areas of buildings, transport and waste to reach climate neutrality by 2040); the Smart City Wien Framework Strategy (2019-2050) (https://smartcity.wien.gv.at/en/approach/ framework-strategy/); the Vienna Climate Council for citizen participation; and study on climate budget (WIFO).
Box 13 – Nation Garden Model in Turkey
In 2019, the Turkish Ministry of Environment, Urbanisation and Climate Change introduced the “Nation Garden Model”. It aims to respond to the increasing public demand for green areas in cities, as well as bringing people closer to nature, supporting active life and socialisation and converting them into use as disaster assembly areas, should the need arise.
The overall target of the Ministry of Environment, Urbanisation and Climate Change is to establish a total of 81 million m2 of Nation Garden areas in the country’s 81 provinces by the end of 2023. Currently, 14.5 million m2 have already been converted into green Nation Garden space, and another 13.0 million m2 are under construction. Throughout this implementation, care has been taken to develop stronger protocols to counteract any negative practices experienced during the construction period, which will then be revised and acted upon during the new period. https://milletbahceleri.gov.tr/#
Local Finances and the Green Transition 39 A DECADE OF LOCAL FINANCES: TWO CRISES AND THE INTERVENING PERIOD
4. Revenue assignment and taxation
Following the analysis of budget expenditure, this chapter will focus on the sources of financing for subnational governments. This key area of local finances is determined by the composition of the four types of local government revenues: own revenue, shared taxes and fees, intergovernmental transfers and loans. Aside from this financial data, the reports available on the countries under study only provide incomplete information about the actual form of fiscal decentralisation, i.e. the degree of revenue-raising autonomy and methods.
Revenue decentralisation and grant dependency
Subnational governments control a significant part of taxes in the more decentralised countries and in the federal countries (Figure 13). In the Scandinavian countries as well as in Germany and Spain, where states/ regions have extended responsibilities, subnational taxes represent more than 25% of all government taxes collected (local own-source and shared taxes are reported together). At the other end of the spectrum, there are the less decentralised countries or those that are more dependent on intergovernmental transfers (left-hand side of the chart).
Responses to the fiscal challenges of the economic crisis differed across the CEMR countries. In countries with higher local tax revenues, the importance of local taxes further increased. Within this group – with the exception of Israel, Latvia and Finland – the ratio of locally collected taxes was higher in 2020 than a decade ago. In the less decentralised countries, those with a lower local tax share were more reluctant to increase own source revenue-raising powers. Consequently, the lower local taxation translates into a further decrease in local taxes.
Local taxation underwent reforms in various ways at different stages of the economic recovery and crisis management (see the cases of Austria and France in Box 14).
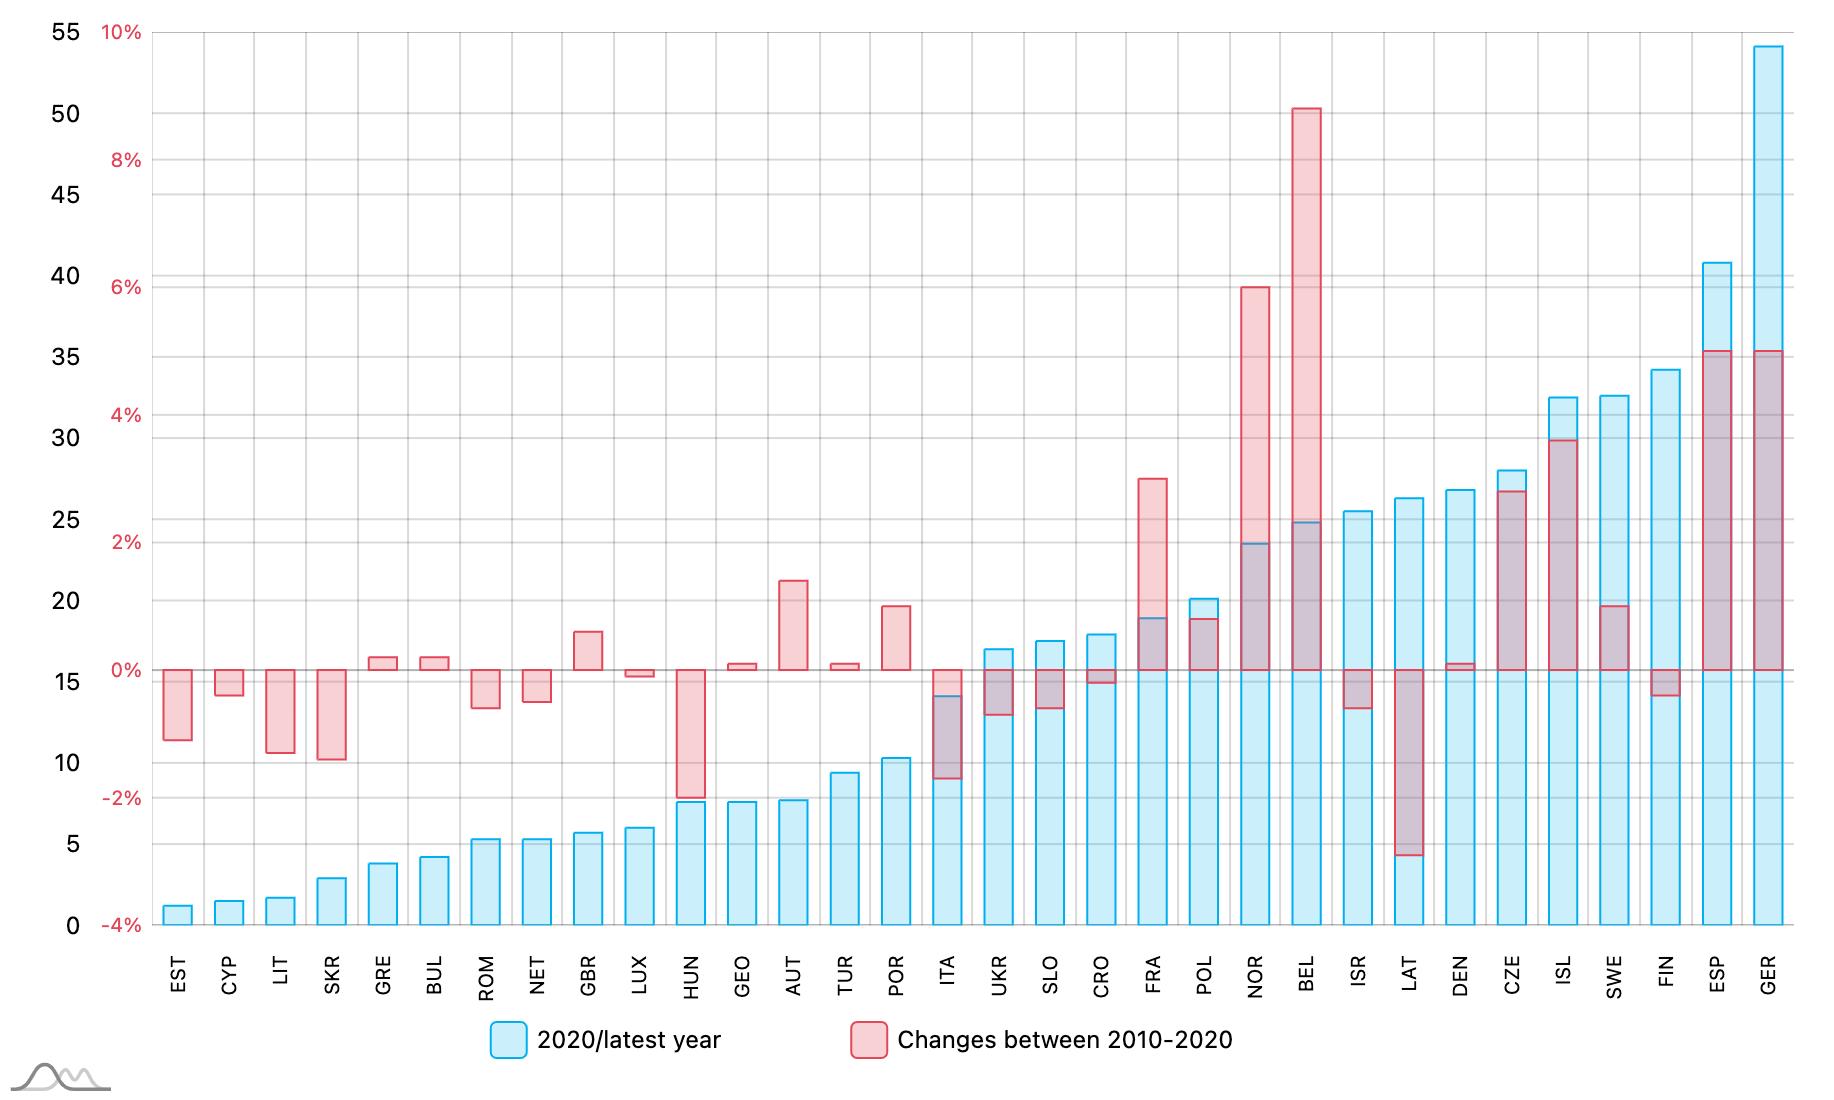
Local Finances and the Green Transition 40 A DECADE OF LOCAL FINANCES: TWO CRISES AND THE INTERVENING PERIOD
FIGURE 13 SUBNATIONAL TAX DECENTRALISATION, 2010-2020 SUBNATIONAL TAXES AS A % OF TOTAL TAX REVENUE
Box 14 – Local tax reforms in Austria and France
In Austria, three major tax reforms aimed at relieving the burden on companies or the population were introduced in the past decade. They reduced the local revenue from shared taxes, although this revenue shortfall was partly compensated through fiscal equalisation grants. The eco-social tax reform covering the 2020-2024 period is particularly significant as it will lead to municipal revenue losses of EUR 2.1 billion. Revenue from the newly introduced CO2 tax will accrue exclusively to the federal government. No new climate-related taxes have been introduced at the local level.
In France, a local business tax (EUR 30 billion) was abolished in 2010 for being too variable, penalising investment and employment. It was replaced by:
- contribution on companies’ added value (CVAE), which brought in EUR 19 billion in 2020 and was shared between municipalities and inter-municipal cooperation entities (26.5%), departments (23.5%) and regions (50%);
- property tax on businesses (CFE), which brought in EUR 8 billion in 2020 and was collected by municipalities and inter-municipal cooperation entities (see Box 4 above).
In addition, companies also pay property taxes on developed real estate (TFPB), which brought in local revenue of EUR 35 billion in 2020, around 33% of which was paid by companies and 66% by households.
In 2021, these taxes on production (turnover, added value, developed land) were further reduced in order to not penalise companies’ competitiveness. This was done by halving the CVAE for all companies through the elimination of the regions’ share and by dividing the industrial establishments’ real estate rental value by two (for CFE and TFPB).
These losses in local tax revenue were offset through State transfers (EUR 3 billion). The regions benefitted from a new VAT share (EUR 9 billion). Municipalities and inter-municipal cooperation entities were compensated through State allocations, which took the tax base into account but not the rates levied. For further information, see:
Le débat d’orientation budgétaire (D.O.B.) illustré
- Janvier 2021 - La Banque Postale
For one diverse group of countries, the ratio of intergovernmental transfers and grants in the subnational budgets is high, accounting for more than 60% of subnational budget revenue. Grant dependency, as a symmetrical indicator of local revenue autonomy, is typically high in the smaller transition countries, as well as in the Netherlands, Austria, UK and Italy (Figure 14). This indicates that local revenue autonomy is determined not only by the weight of intergovernmental transfers but that the grant allocation methods can prove critical as well. Inversely, in countries with significant shared revenue, local governments receive less financing through intergovernmental transfers. This is the case with the group comprising Turkey, three of the Western Balkan countries and the Scandinavian and federal countries.
Local Finances and the Green Transition 41 A DECADE OF LOCAL FINANCES: TWO CRISES AND THE INTERVENING PERIOD
During the past decade, the grant dependency ratio has changed for both groups of countries. However, no discernible pattern was identified in the countries with higher or lower shares of national budget transfers. The reasons behind the changes were different in each country; overall budget restrictions (e.g. Greece), radical centralisation of local functions (e.g. Hungary) or changes in tax policies (e.g. France) may all have contributed to the cuts in intergovernmental transfers.
National budget programmes often target local environmental investments and service management improvements (Box 15). These fiscal transfer programmes exist both in countries with a greater grant dependency ratio (e.g. Estonia, Austria) as well as in those with higher shared revenue (e.g. Turkey). Considering that the environmental impact of subsidised investments extends beyond the boundaries of a beneficiary municipality, these national or often supra-national (European Union) grants and support programmes are warranted.
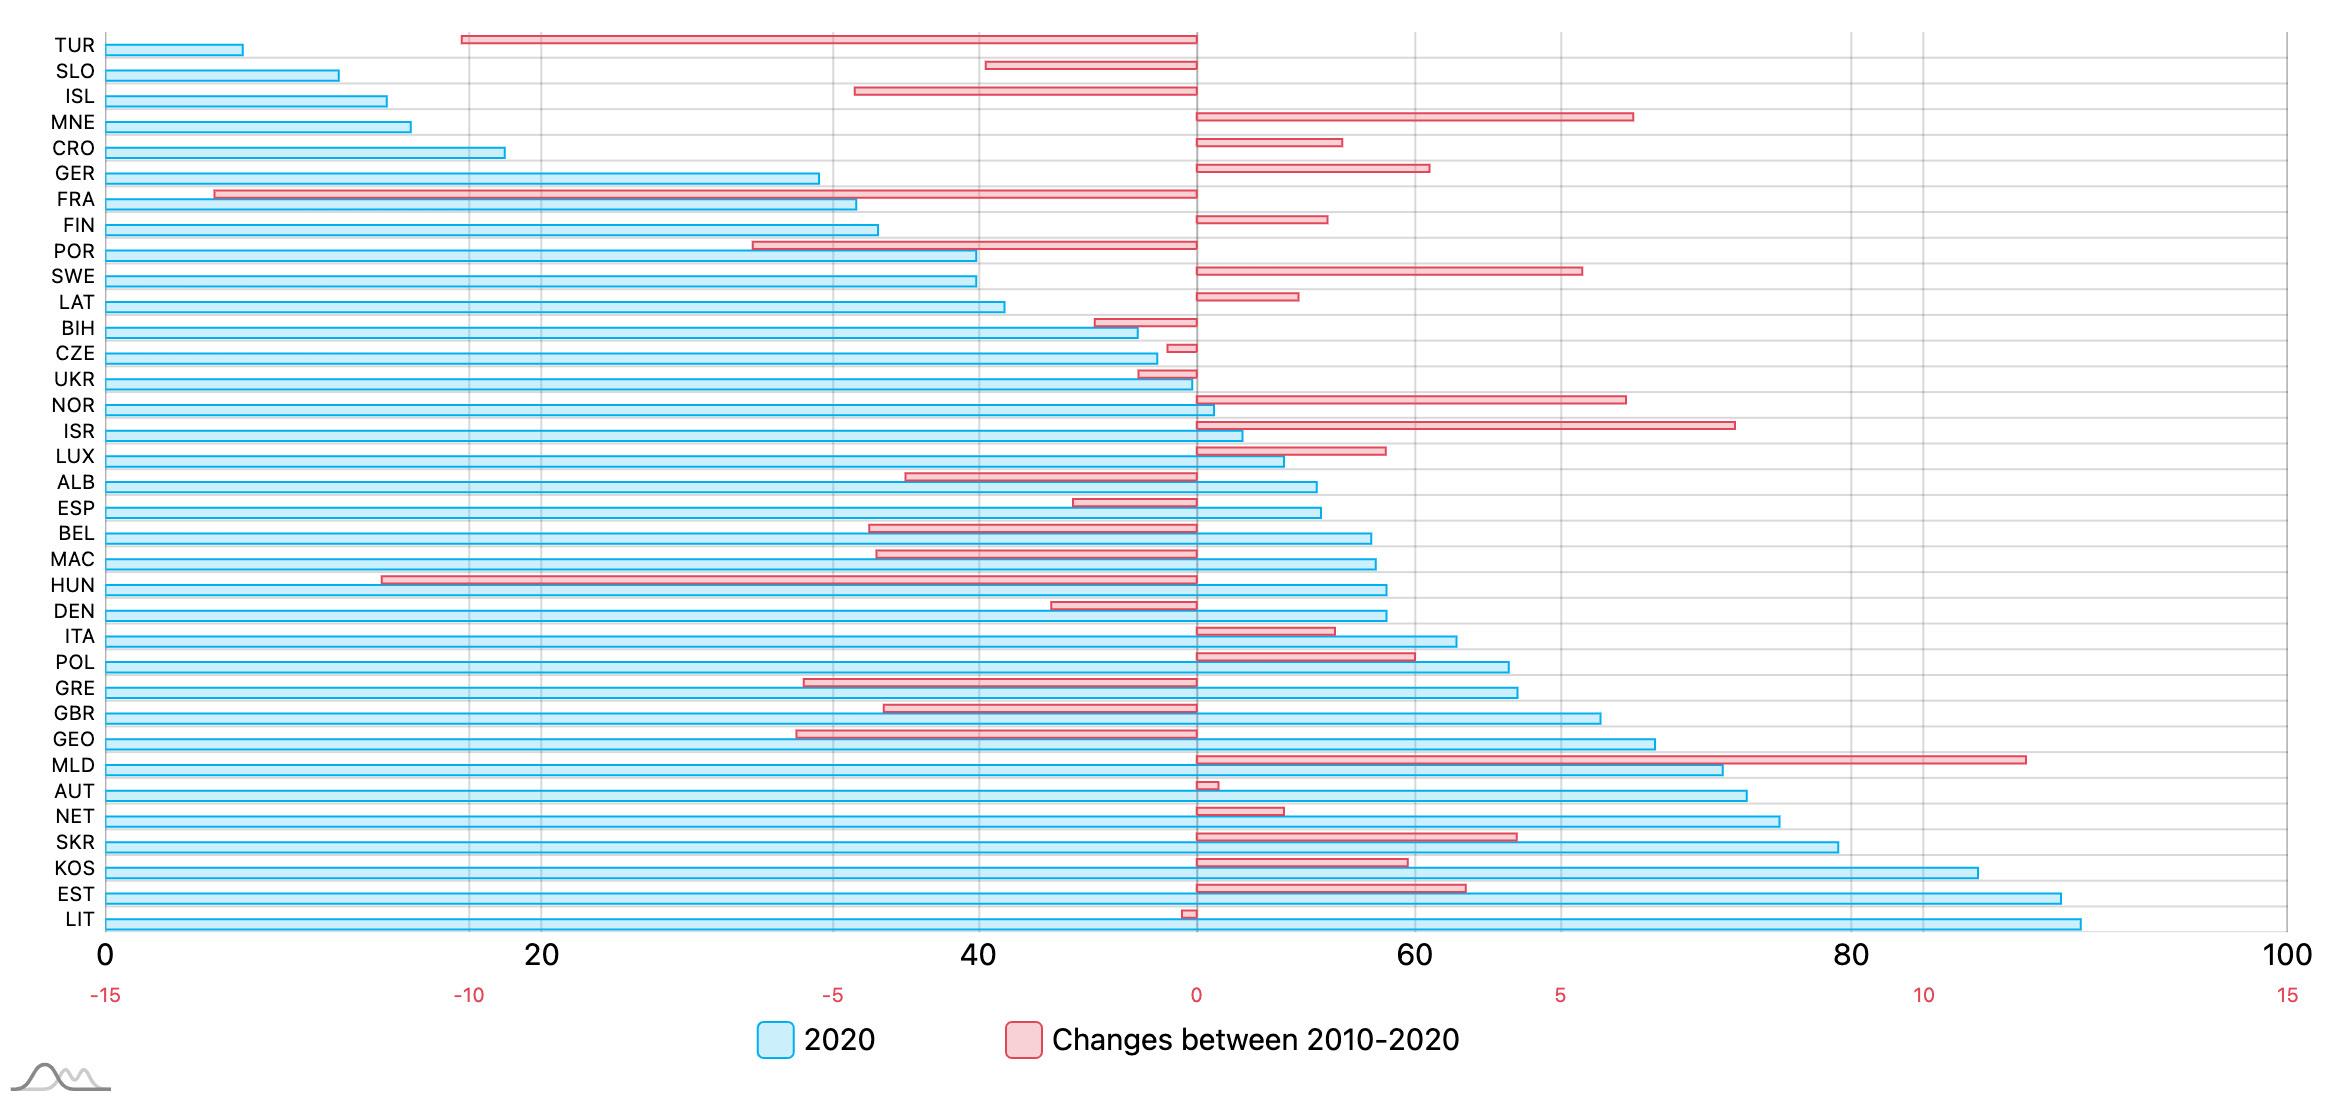
Local Finances and the Green Transition 42 A DECADE OF LOCAL FINANCES: TWO CRISES AND THE INTERVENING PERIOD
FIGURE 14 GRANT DEPENDENCY, 2020 AND CHANGES BETWEEN 2010-2020 GRANTS AS % OF TOTAL SUBNATIONAL REVENUE
Box 15 – Municipal financial support programmes and subsidies
In Austria, the municipal investment programme of the federal government is an investment package of EUR 1 billion, primarily covering 2020/2021, and a second municipal package of EUR 1.5 billion for 2021. It is a matching grant with 50% federal funding and the remaining 50% partly covered by the state (Land) or EU funds and partly by the municipalities. The amount of funding per municipality is capped according to demographic conditions. This second municipal package consists of EUR 500 million in additional aid for 2021 (a EUR 400 million increase in revenue shares and EUR 100 million in structural funds) and EUR 1 billion in advances on future revenue shares to resolve the urgent problem of securing liquidity. In light of the favourable economic environment, municipalities are not required to repay the advances. There is also the fiscal equalisation extension, which is partial compensation (EUR 310 million) for the shortfall in local revenue resulting from the eco-social tax reform.
The Disaster Fund of the Federal Government of Austria was established in 1966 to finance measures to avert future disasters and repair any damages that occur. The majority (75%) of the Disaster Fund’s resources (EUR 480 million in 2019) have been used for preventive measures, mainly to mitigate future flood and avalanche damage, e.g. passive flood protection and water quality surveys. The remaining funds have gone towards damage management and firefighting equipment.
Subsidies for preventive measures (EUR 352 million) have been used to a large extent by the federal government. In 2019, municipalities received EUR 20 million for damage control and EUR 43 million for fire department emergency equipment. In the event where there is damage to the assets of the provinces and municipalities, the Disaster Fund reimburses 50 percent of the loss.
In Estonia, centrally subsidised local energy efficiency programmes aimed at supporting local government energy saving investments in public buildings have been operating since the middle of the past decade. They are financed by CO2 sale revenues. This budget support is available to promote the construction of nearly-zero energy local government buildings (EUR 20 million) and the conversion of existing local government buildings (EUR 10 million). These energy-saving measures reduce the maintenance costs of public buildings. Other increasingly common local energy efficiency development measures involve the retrofitting of street lighting with LED technology, the increased use of new heating technologies by renovating boiler rooms and heating systems and transitioning consumers to local heating networks.
In Turkey, the National Zero Waste Project aims to manage waste in accordance with sustainable development principles, leaving a clean Turkey and a liveable world to future generations. The programme was launched in 2017 and is being implemented by the Ministry of Environment, Urbanisation and Climate Change and localised by the Union of Municipalities of Turkey (UMT). Municipalities have been encouraged to use zero-waste models in their public buildings. UMT has been providing technical assistance to municipalities to ensure their preparedness for the higher-level certification. The Zero Waste Blue Project has also been launched to protect the seas and coasts of Turkey. The Zero Waste Project hopes to reach a 35 percent recovery rate target (proportion of waste recycled from all recyclable materials) in 400 000 buildings by 2023. Potential economic savings have been calculated at TRY 17 billion, with direct employment for 100 000 people and annual savings of TRY 20 billion. The project is based on the “Zero Waste System”, a seven-step roadmap to be followed by the companies, institutions or organisations involved in the programme. The roadmap was developed by the Ministry of Environment, Urbanisation and Climate Change. UMT has been organising national contests for municipalities to promote certain topics, e.g., the Zero Waste Project and Idea Contest organised in 2020 that awarded grants of TRY 500 000 (EUR 31 000) to20 municipalities.
As of 2020, the Zero Waste Management System has been implemented in 76 000 public buildings, with an initial recovery rate of 13% that has continually increased, eventually reaching 19%. Between 2017 and 2020, the project helped save 397 million tons of raw material, 315 million kilowatt-hours of energy, 345 million cubic meters of water and 50 million barrels of oil. During the same period, 17 million tons of usable waste were collected, 2 billion tons of greenhouse gas emissions were prevented and 209 million trees were saved by the project.
Local Finances and the Green Transition 43 A DECADE OF LOCAL FINANCES: TWO CRISES AND THE INTERVENING PERIOD
Differences in local revenue policies
Local tax systems in the CEMR countries are predominantly structured around income (personal, profit) or land and building taxes (Figure 15). According to the OECD tax statistics, in the 16 countries that receive revenue from taxes on income, this source represents more than half of their total local tax revenue (left-hand side of the chart). Personal income taxes can be allocated to the place of origin, where they were raised, or they can be reallocated using a formula. The most progressive income tax-sharing mechanism is the surtax method, whereby subnational governments have the power to set their own rates (e.g. Scandinavia, Germany, Croatia).
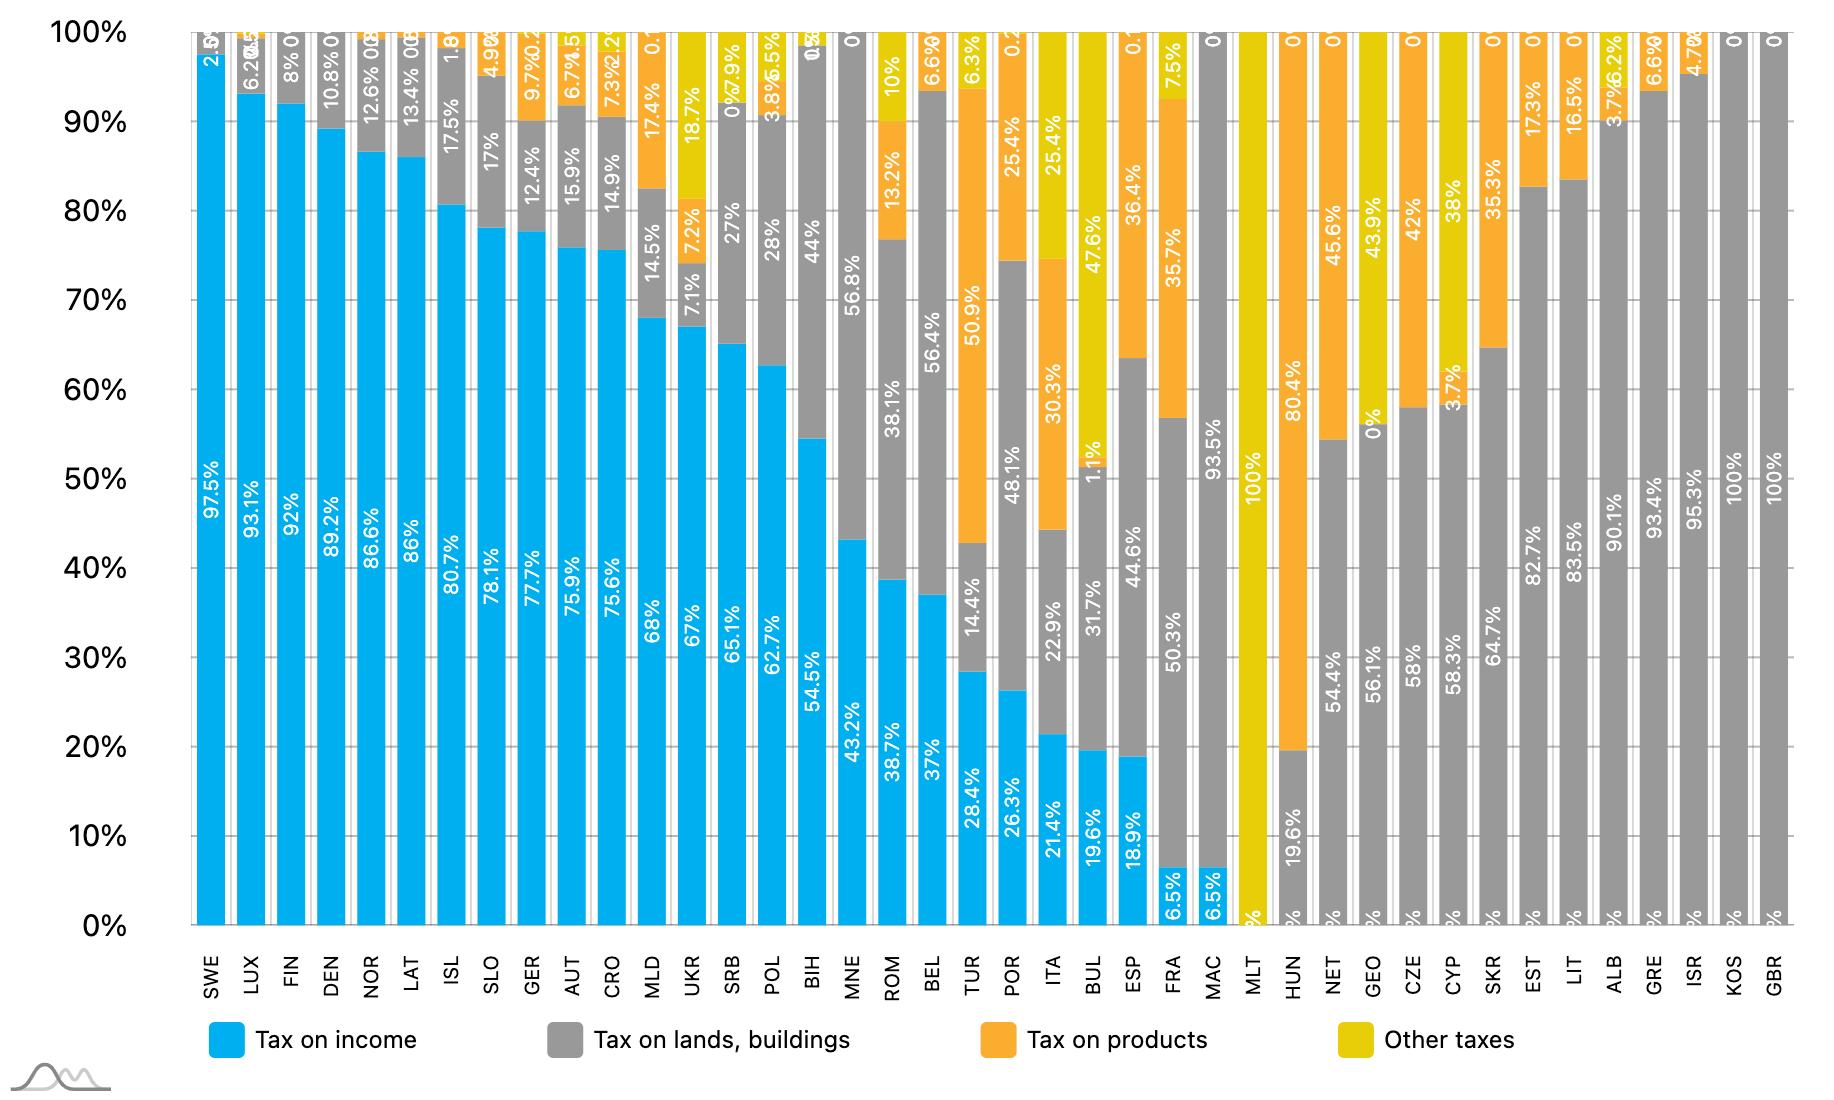
FIGURE 15 INCOME AND PROPERTY TAX- BASED LOCAL TAX SYSTEMS, 2020
The other group of countries (right side of the chart) relies on local property taxation. They are the less decentralised and smaller countries. However, the preponderance of this tax on land and buildings in these countries is due either to tradition, as the only existing main local tax revenue (e.g. UK), or to its introduction during the transition (Kosovo, Albania, Lithuania, Estonia).
Changes in local taxation
The local tax systems underwent minor reforms during the post-crisis period (Figure 16). Two trends can be identified in the CEMR countries. First, in line with the economic policy goals of the time, the local tax burden on businesses and production was reduced. The composition of local taxes shifted towards property taxation in these countries. A tax on buildings and land has a less direct distorting effect on business activities while also being a more stable source of local revenue. Various forms of taxing land value increases are also increasingly being developed (see Box 16).
Box 16 – Development charges in Austria
The development charge is a mandatory, one-time payment to the municipality. The levy becomes due once a plot of land has been designated as a building site or a building permit has been issued. The development charge is usually levied on the plot area or other indicators (e.g. building class, assessed value). The amount varies by state (Land). Its usage is not earmarked, but it finances, for example, roads, sidewalks, street lighting and drainage systems.
Local Finances and the Green Transition 44 A DECADE OF LOCAL FINANCES: TWO CRISES AND THE INTERVENING PERIOD
The second trend can be seen at the opposite end of this chart (Figure 16) with the countries that have moved away slightly from property taxation, experimenting either with income-based taxes (income, profits, capital gains) or taxes on products (sales, excise, motor vehicle, etc.). It should be noted that the tax on land and buildings includes not only recurrent taxes on immovable property, but the property transaction tax as well.
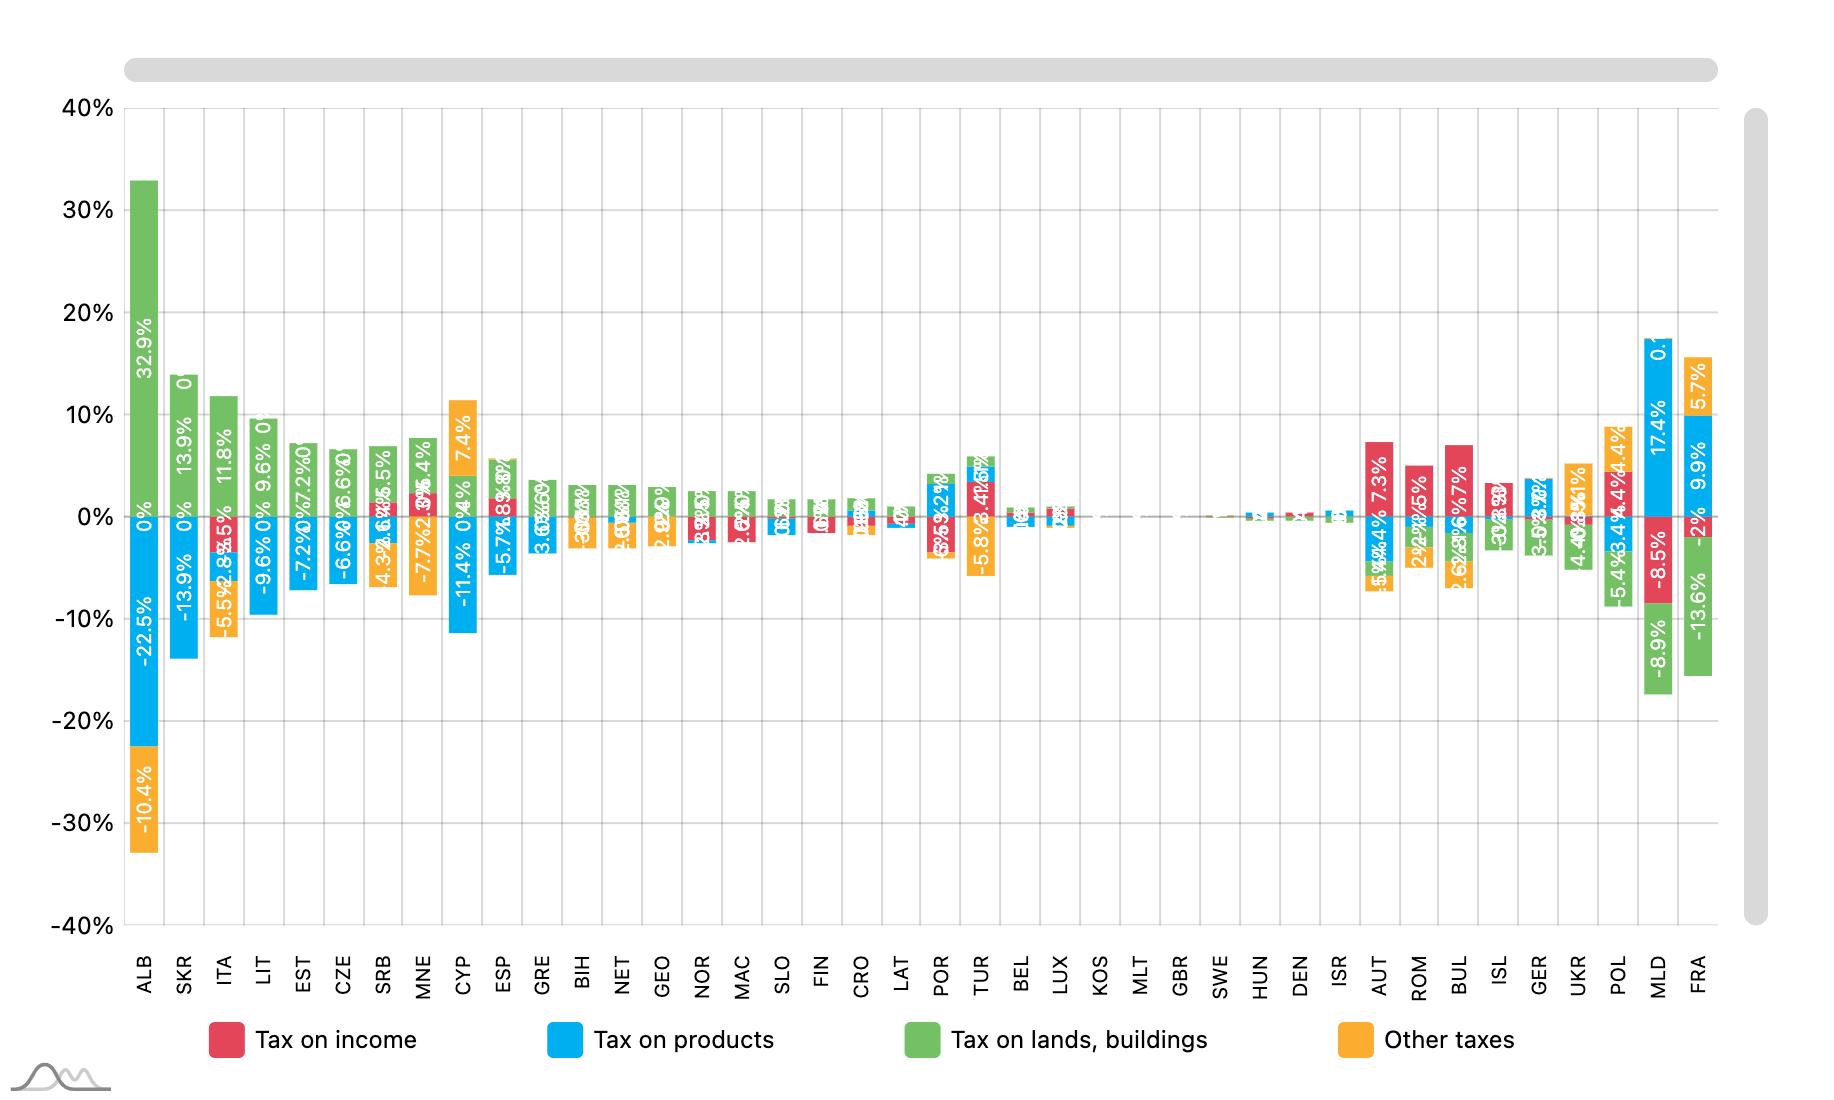
FIGURE 16 RESTRUCTURING LOCAL TAXATION 2010-2020: A ) FROM TAX ON PRODUCTS TOWARDS PROPERTY TAX B ) FROM PROPERTY TAX TO INCOME TAXATION
Box 17 – Local tax reforms in Serbia
The local property tax was previously assessed, collected and enforced by the national government, but its yield has been returned to local governments on the basis of origin. Since 2007, local self-governments have been responsible for administering the tax and setting the rates within limits. in 2012, the legal tax framework was amended by limiting the local business sign tax and eliminating the local motor vehicle fee. In 2014, the land use fee, the second most important source of own-revenue was eliminated so that it could be integrated into the property tax. In the meantime, the national government raised other central taxes including the VAT, capital income tax, excise and social contributions.
The personal income tax (PIT) is by far the most important local tax revenue source. In 2019, the PIT accounted for 63% of local self-government tax revenue and 33.5% of total revenue. PIT is levied by the central government on gross wages, as a payroll tax and on self-employed income. In June 2013, the government reduced the rate of the tax on wages from 12% to 10% while increasing the threshold for non-taxable income. These changes led to a direct loss in local revenue of around EUR 200 million. As of 2016, cities receive 77%, municipalities 74% and the City of Belgrade 66% of the revenue on gross wages.
Countries reliant on local income taxation pursue diverse policies (Figure 17). In countries where it already constitutes the major source of local tax revenue (Austria, Israel), the weight of taxes on income (wages) was increased further. The countries who had previously been less dependent on income taxes moved in the direction of an income-based local own source revenue system in the Balkans (Bulgaria, Romania, Montenegro) and in Turkey and Spain. Thus, within this group of countries, some convergence of their local tax systems can be detected.
Local Finances and the Green Transition 45 A DECADE OF LOCAL FINANCES: TWO CRISES AND THE INTERVENING PERIOD
Property taxation exists in almost all the CEMR member countries. The majority of countries with a high share of taxes on land and buildings in the local tax pool increased their property tax revenue (left side of Figure 18, with France as an outlier). Countries which were less reliant on local property taxes did not fit into any clear pattern in this respect.
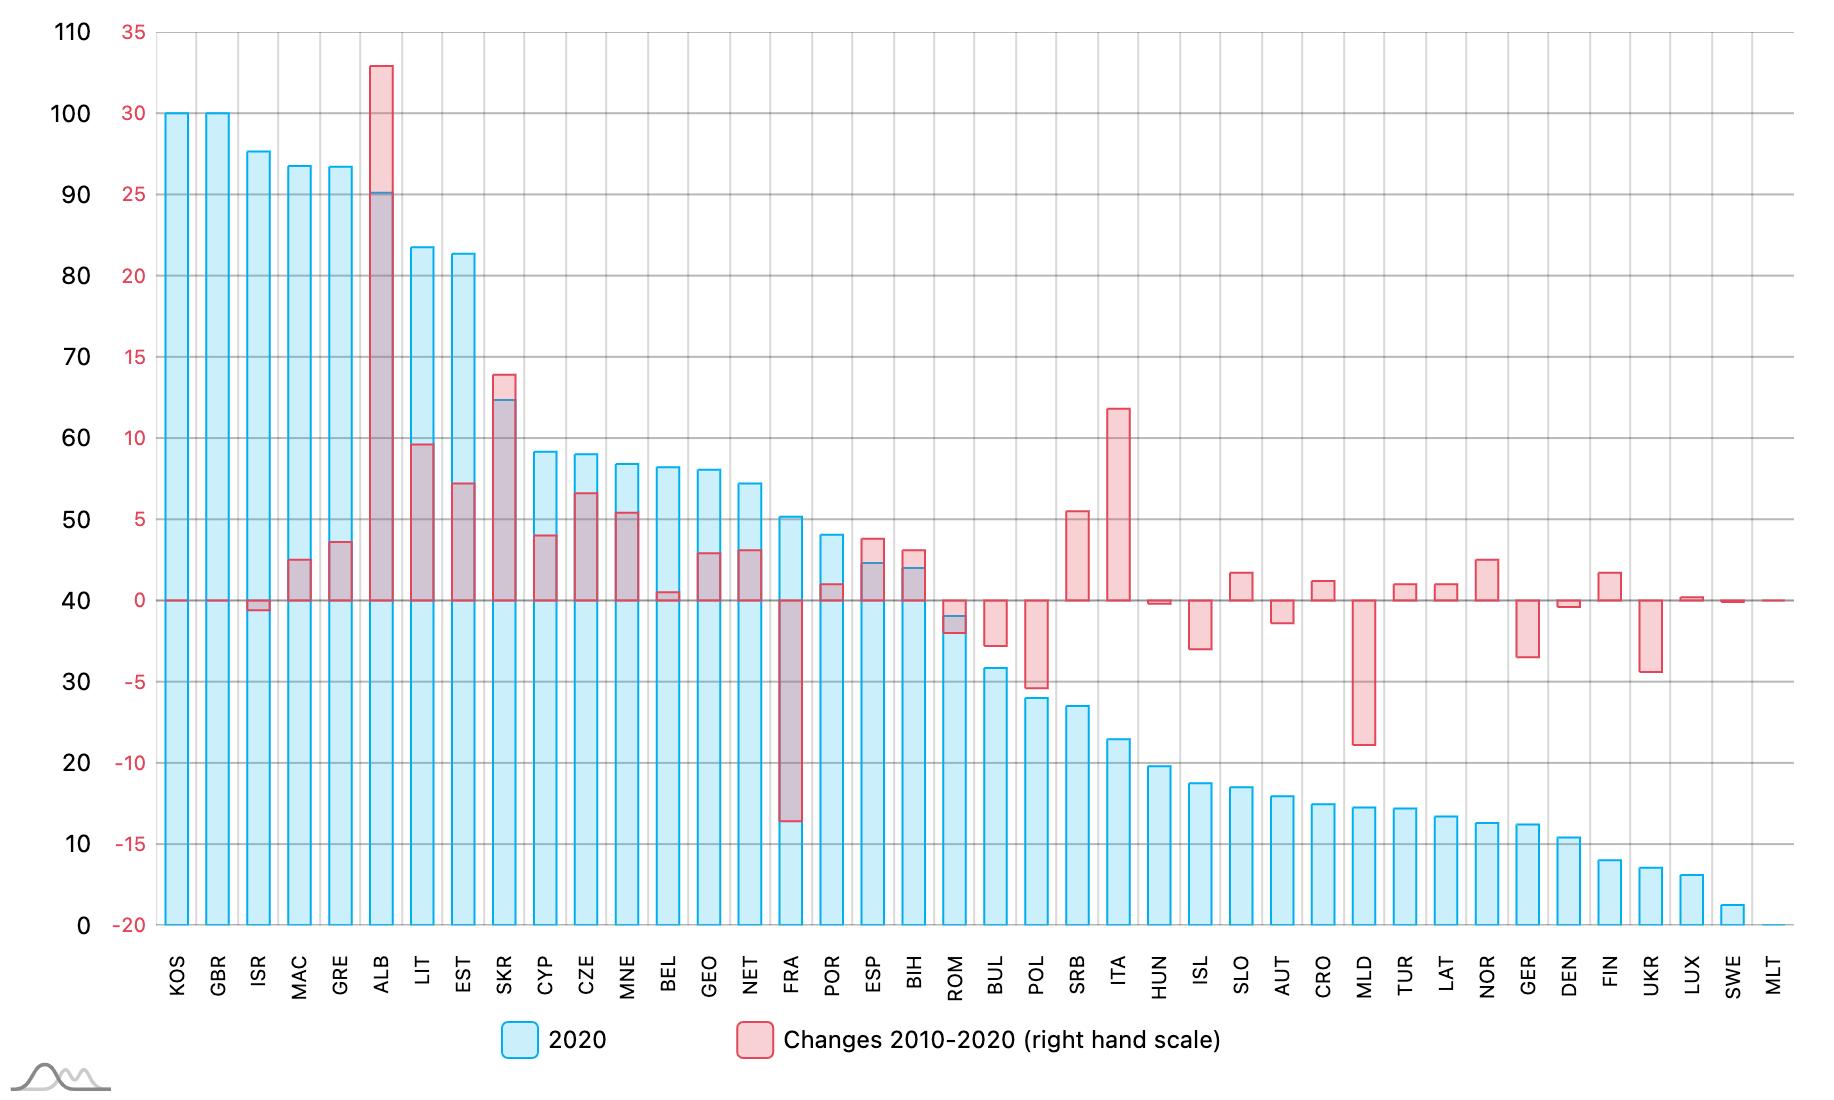
Local tax reforms have also targeted environmental objectives, such as the tax incentives for municipal waste reduction introduced in France (Box 18).
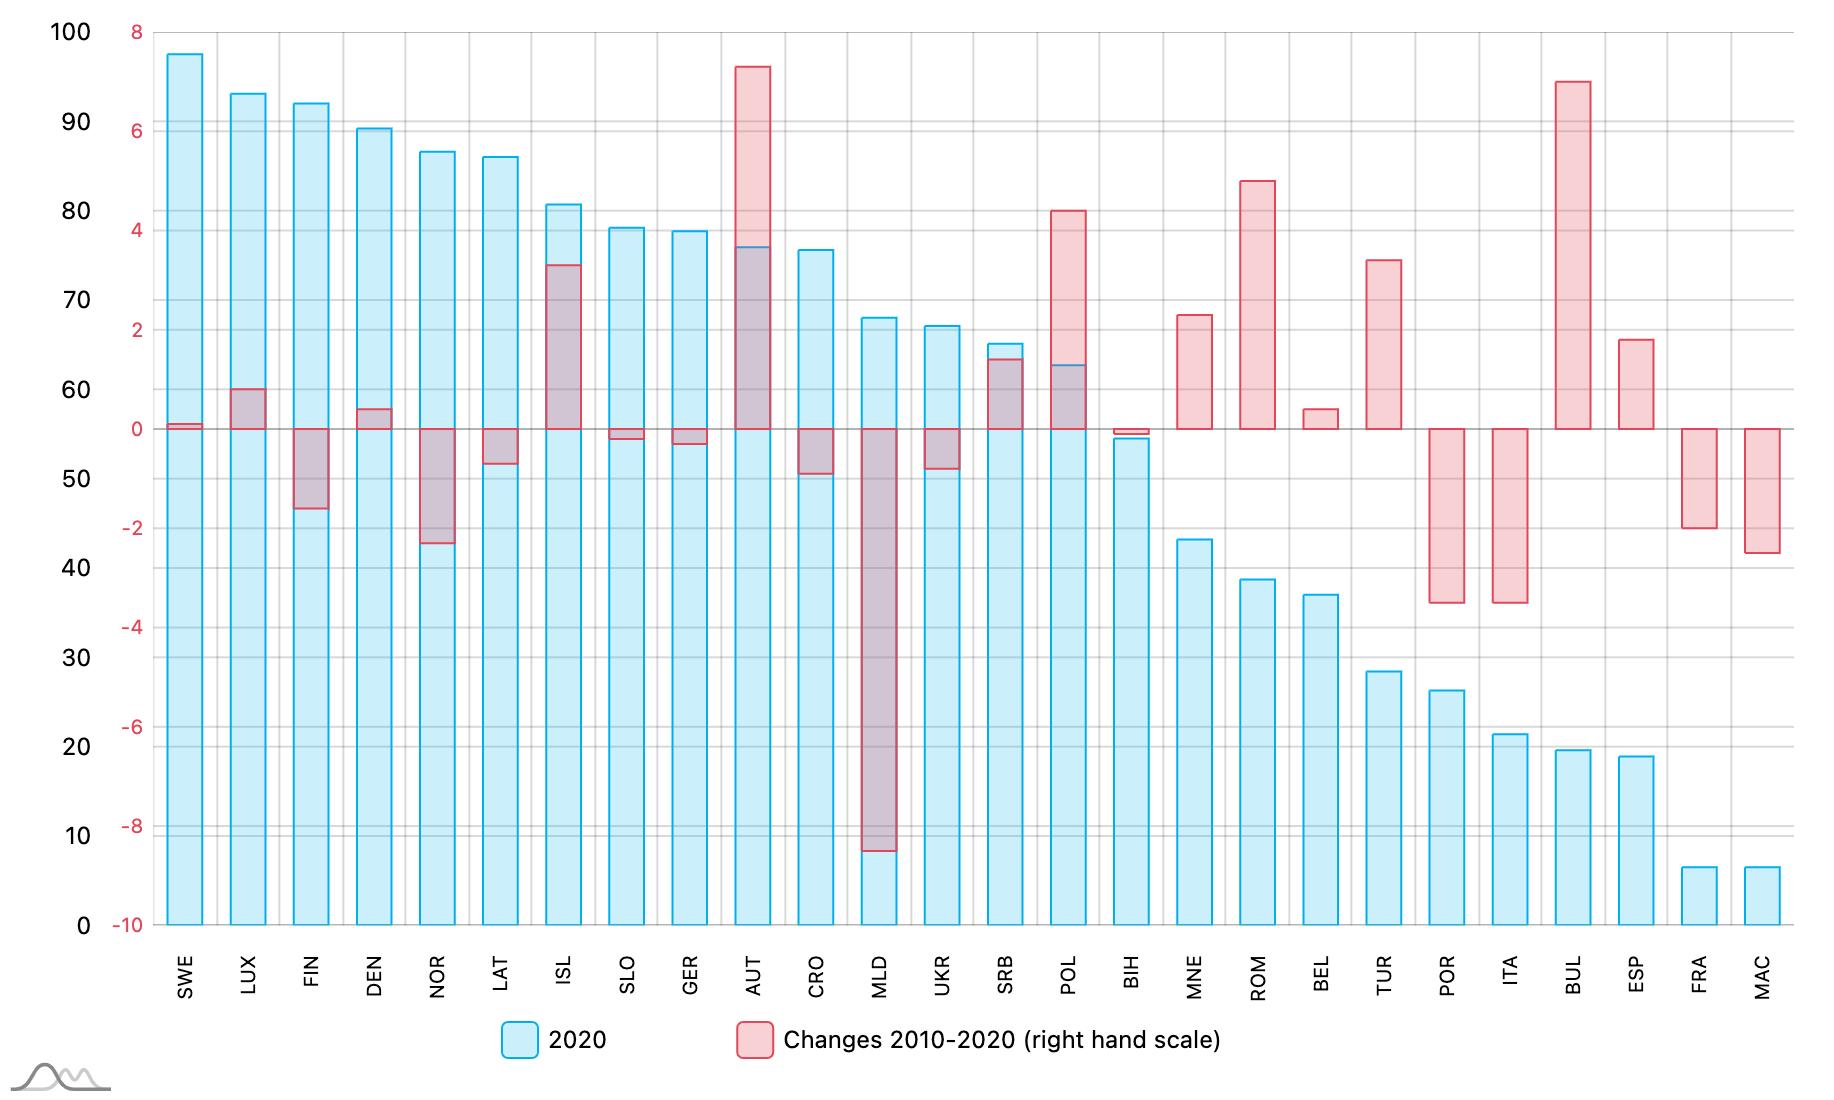
Local Finances and the Green Transition 46 A DECADE OF LOCAL FINANCES: TWO CRISES AND THE INTERVENING PERIOD
FIGURE 17 EXPERIMENTING WITH TAX ON INCOME
FIGURE 18 MOVE TOWARDS TAX ON LAND, BUILDINGS
Box 18 – Tax incentives for municipal waste reduction in France
Household waste is responsible for 4% of greenhouse gas emissions in France. The Energy Transition Law for Green Growth (TECV, 2015) set targets to reduce household waste by 10% (from 2010 levels and by 2020), increase the volume of recycling or organic recovery to 65% (by 2025). Two categories of tax incentives were introduced:
The household waste collection tax incentive for citizens (TEOMI). The household waste collection tax (TEOM) is a property tax paid by citizens (EUR 7.1 billion in 2020). Intermunicipal cooperation entities finance household waste management mainly through the TEOM. Since 2014, local governments have the option of adding an incentive tied to the quantity or type of waste collected. They can also opt to introduce a charge (i.e. fee to be paid for the service rendered) instead of the tax. This user service charge is less commonplace (EUR 550 million).
As of 2020, only 55 intermunicipal cooperation entities (out of a total of 1 254) have set up an incentive share for TEOM (EUR 33.5 million). The target for 2025 aims to have 25 million inhabitants taking part in this incentive pricing scheme; but as of 2020, only 5.9 million inhabitants were concerned by both schemes.
The main impediments to implementation are higher costs (communication with citizens, purchase of new equipment, training personnel), risk of counterproductive behaviour, such as illegal dumping or incineration, and lack of political will to carry out a service organisation review.
Gradual increase in State tax on polluting activities (TGAP). The TGAP is paid by local governments according to the volume of waste deposited or incinerated. In order to reduce waste tonnage over the 2021-2025 period, relevant tax rates were gradually increased. At the same time, the VAT rate on sorting activities has been lowered. The central government estimated that the rate increase would cost local governments EUR 104 million in 2021 and EUR 210 million in 2025. It is not possible to offset this increase through a reduced VAT rate or the volume of waste landfilled or incinerated.
For further information, see:
Terra Nova : la gestion du service des déchets ménagers par les collectivités locales en France - La Banque Postale
Tarification incitative parmi les modes de financement du service public déchets | Optigede - Ademe
Local tax autonomy
Subnational tax autonomy is measured not only by the ratio of tax revenue in the local budget, but by the local government’s power to levy and collect them The OECD has developed an indicator, which classifies all local tax revenue according to a six-unit-typology (OECD, 2020). Each tax is categorised using a scale ranging from high autonomy, such as being able to set tax rates, reliefs and tax sharing methods, to low tax autonomy, whereby the central government sets the tax rates and allowances. These 12 forms of local tax autonomy have been further distilled into four categories for the purposes of studying this matter in the CEMR countries that are covered by the OECD revenue statistics (Figure 19).
Most of the countries have high local tax autonomy. Local governments enjoy discretionary authority in setting tax rates and reliefs for almost all the local tax revenue. (Regional (state) governments’ taxing powers have been measured separately.) However, there is another distinct group of countries that typically employ tax sharing schemes. The method of revenue split will determine how stable and certain this source is, in light of whether the sharing arrangement can be changed by the central government only with the consent of local governments (high autonomy) or unilaterally through budget legislation (limited autonomy). The remaining countries fall somewhere in the middle, with local governments only responsible for tax collection while the tax base, rate and reliefs are set at the central level (e.g. Austria, Israel).
Local Finances and the Green Transition 47 A DECADE OF LOCAL FINANCES: TWO CRISES AND THE INTERVENING PERIOD
During the past decade, the level of tax autonomy has remained stable. There were only three countries in the OECD report where tax autonomy increased significantly by 2018. The share of taxes with local discretion on rates and reliefs was higher in Slovakia, Greece and Italy than at the beginning of the period. Reforms were responsible for major changes in these countries even though they started with a relatively low base at the beginning of the decade. In France, the locally significant municipal housing tax is gradually being replaced with revenue-sharing schemes (see Box 19).
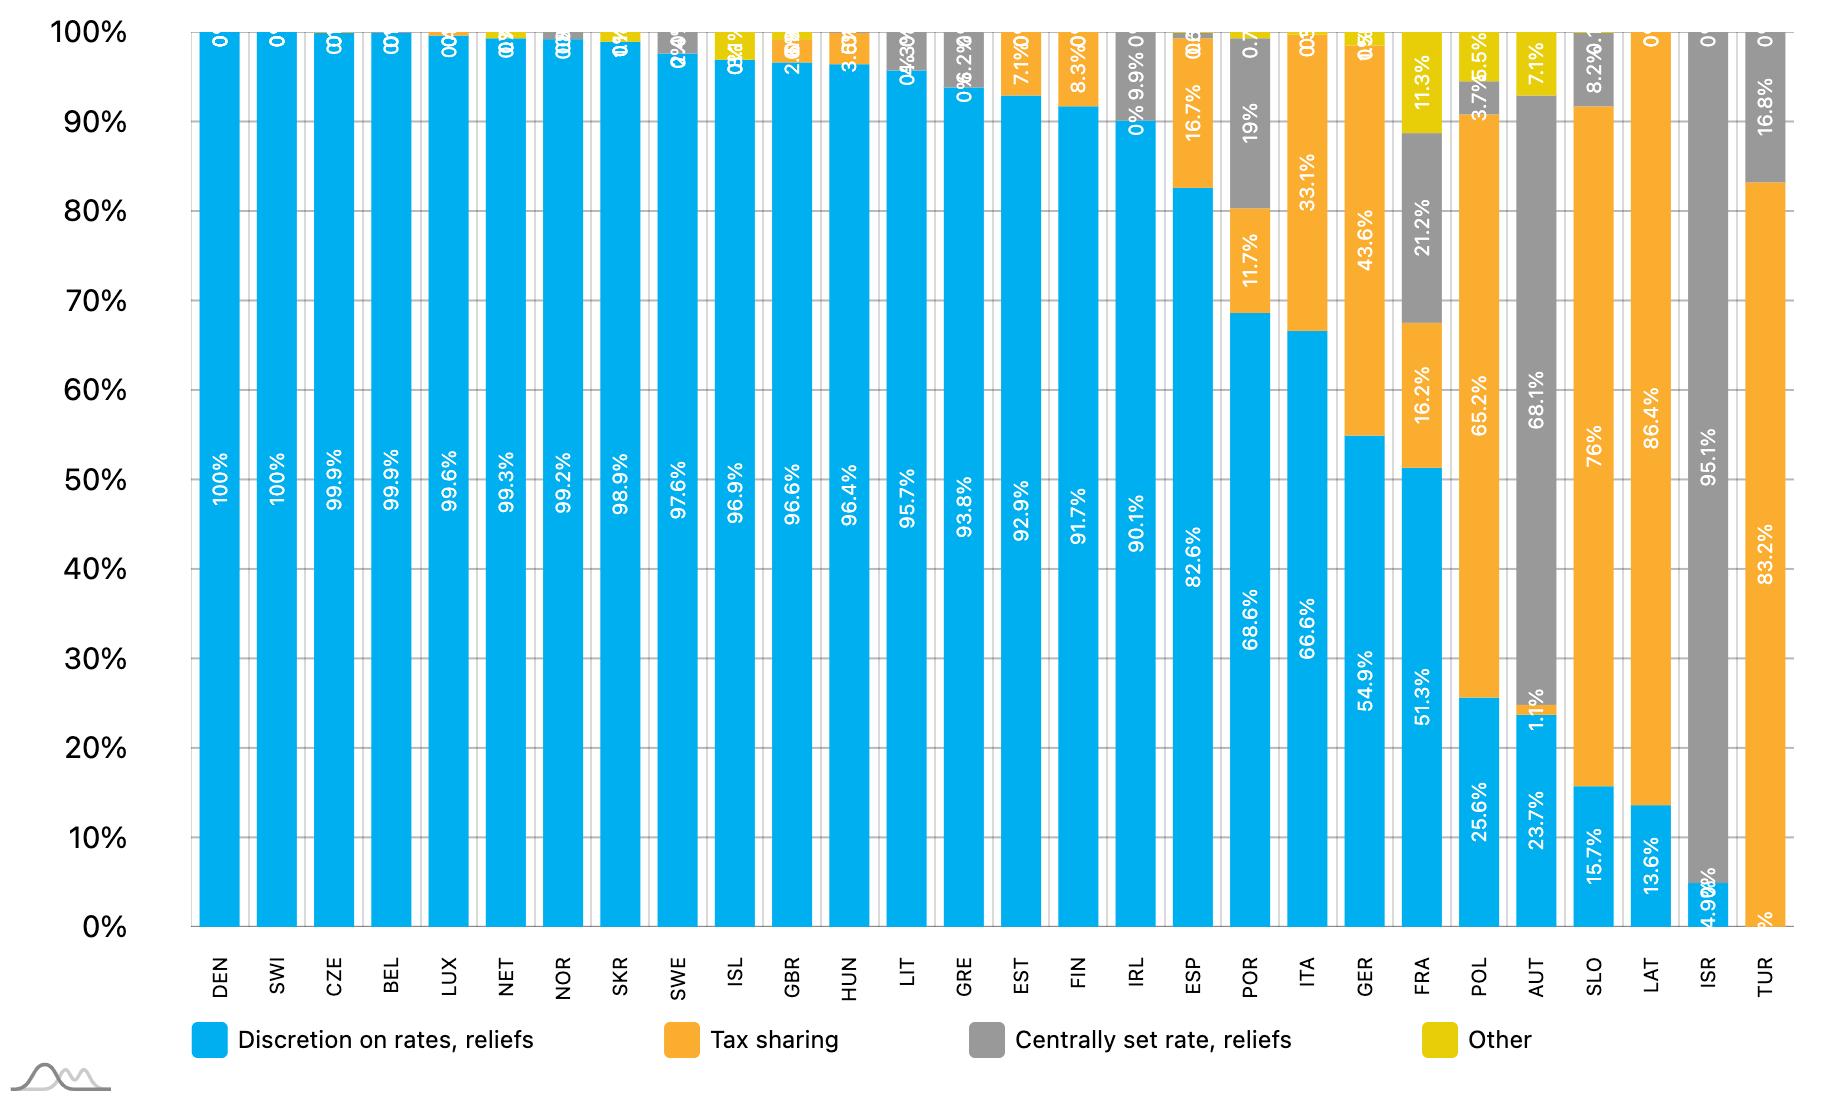
Local Finances and the Green Transition 48 A DECADE OF LOCAL FINANCES: TWO CRISES AND THE INTERVENING PERIOD
FIGURE 19 AUTONOMY IN SETTING THE MAJORITY OF LOCAL GOVERNMENT TAXES, 2018
Box 19 – Shift from a local tax towards revenue sharing in France
Up until 2020, a municipal housing tax (TH) was paid by owners or users of housing premises. It was based on the cadastral rental value of the dwellings, as assessed in 1980, revalued using an annual coefficient close to inflation. This tax brought in around EUR 24 billion or 15.5% in local tax revenue (in 2020). It was deemed to be unequal revenue, mainly on account of the timeworn tax base.
The gradual abolition of this housing tax is scheduled for the period of 2018-2023. Since 2021, local governments have been receiving compensation as part of local tax reforms; instead of the housing tax, municipalities collect the departmental share of the property tax on built properties, while the departments and intermunicipal groupings with tax powers (GFP) collect a share of the national VAT.
Some consequences of this new tax basket entail the following:
- on tax strategies: municipalities have the power to set the property tax (TFPB) rates. The owners of premises have to pay taxes to the municipality, making them taxpayers; but as there is no residency requirement, they are not necessarily local residents and therefore not voters. Thus, the link between the citizen and the municipality is weakened.
- on territorial inequalities: the housing tax remains in force for second homes, which have an uneven distribution across the country.
- on departments’ adaptability to budgetary shocks: the replacement of the TFPB with a share of VAT is not an adverse development in terms of revenue dynamics over time. However, the elimination of the power to set the TFPB rate further restricts any budgetary adaptation to the economic crisis.
For additional information, see:
Accès Territoires n°7 : la suppression de la taxe d’habitation (modalités et conséquences) - La Banque Postale
Réforme de la fiscalité locale - La Banque Postale
Local Finances and the Green Transition 49 A DECADE OF LOCAL FINANCES: TWO CRISES AND THE INTERVENING PERIOD
5. Budget balance and debt
As debt is widely used to finance capital investments, subnational governments’ level of borrowing is a good indicator of their fiscal autonomy. Notwithstanding this, as the overall public debt is always a central concern of national fiscal policy, subnational borrowing and debt usually remain strictly controlled, even in the most decentralised systems. This was all the more true after the 2008-2009 economic crisis when central budgets became highly indebted.
Local borrowing
At the start of the past decade, local governments had to borrow amidst a restrictive fiscal environment (Figure 20). National grants and other own-source revenue had declined. Yet, borrowing by governments at the subnational level was relatively low unless the regional level was also taken into account. As larger entities, regional (state) governments are generally viewed as more creditworthy and are in a better position to secure access to credit and use loan financing. However, as the decade progressed, stricter local borrowing regulations and a steadily improving overall budget balance led to lower annual borrowing overall; by 2013, local governments were posting surpluses and only regional governments in federal countries had recourse to debt financing.
The turning point in the decade-long trend in subnational government budget spending was 2016. With general government budgets in a more stable position, subnational governments started to actively borrow again in 2019. However, since more conservative policies were being followed by local governments, borrowing remained at a low level. Specific forms of debt were invested in the funding of ecological investments (see Annex 3 on EU green bond standards and green loans in France).
The first year of the pandemic placed the financial burden squarely on the national budget and on the regional governments. In Austria, fiscal rules specific to a federal country were developed for the subnational governments under the Austrian Stability Pact (see Box 2 above).
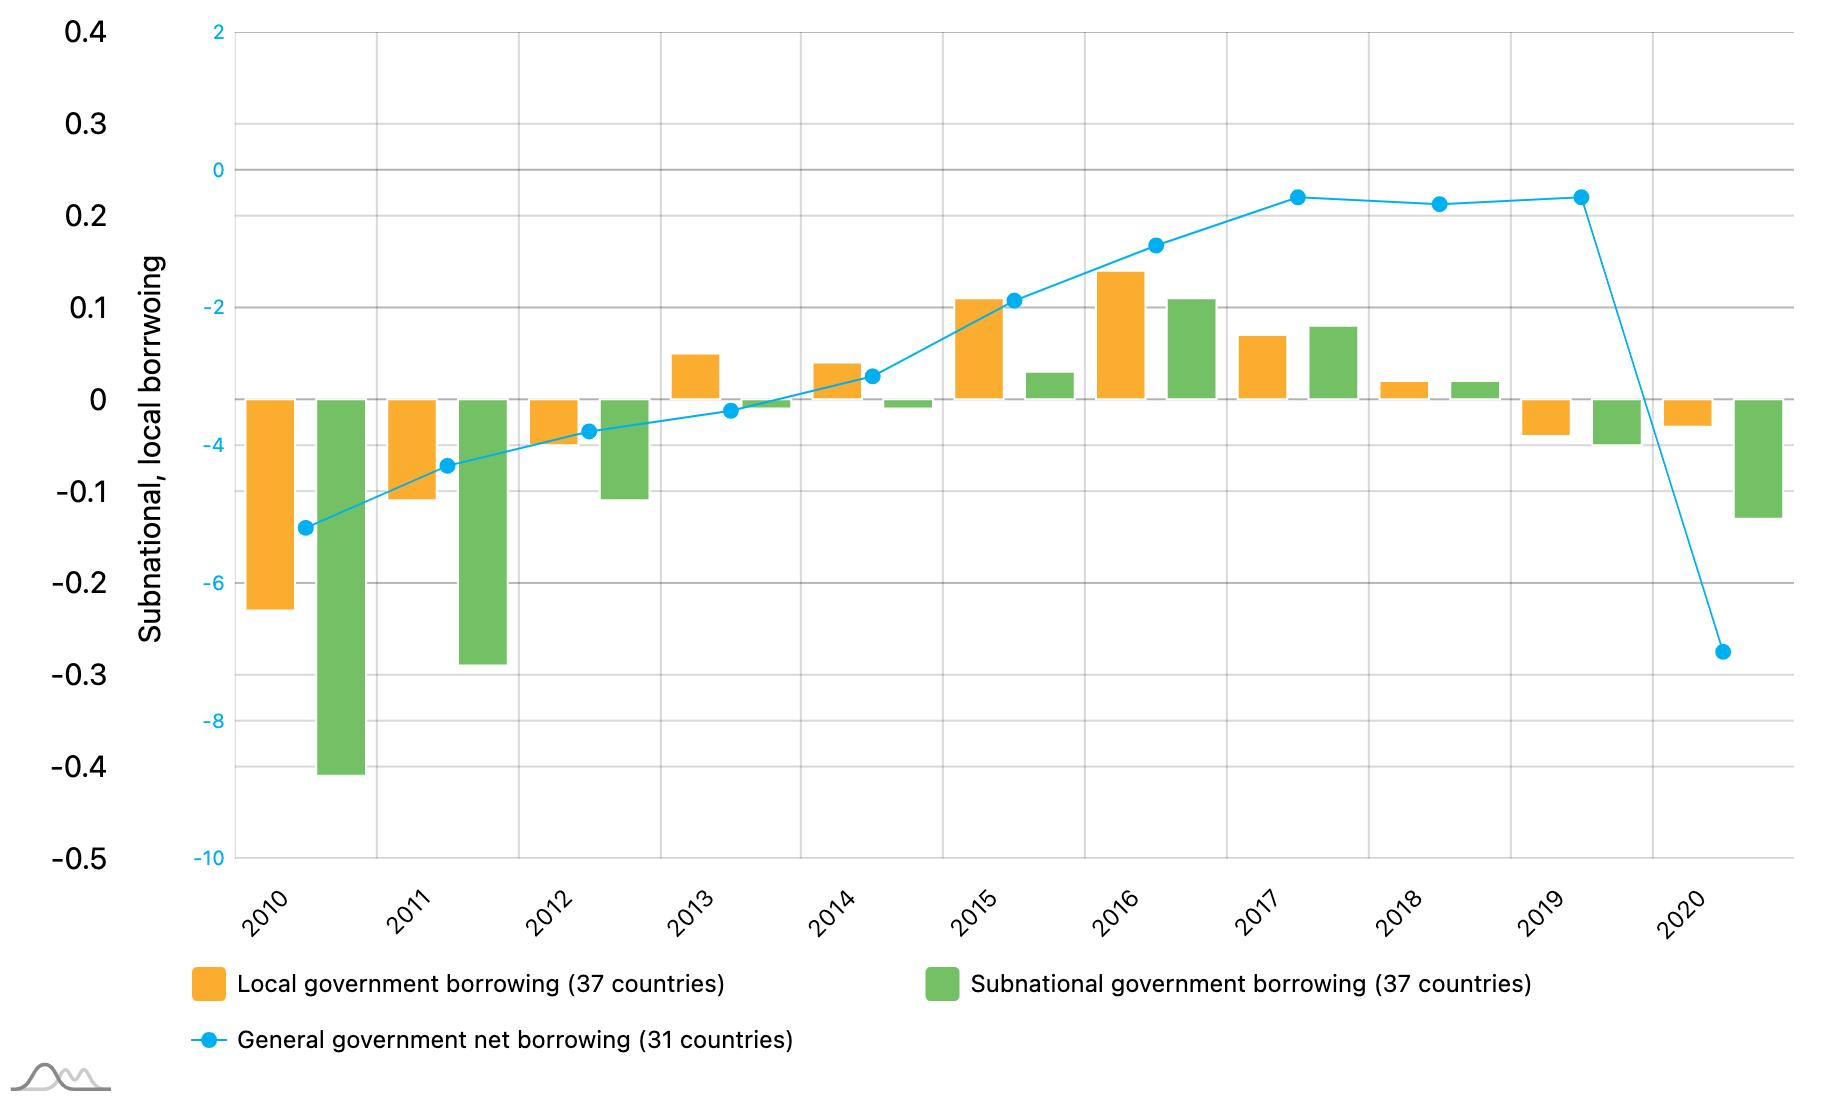
Local Finances and the Green Transition 50 A DECADE OF LOCAL FINANCES: TWO CRISES AND THE INTERVENING PERIOD
FIGURE 20 MANAGING GOVERNMENT DEFICIT, SELECTED CEMR COUNTRIES, 2010-2020 NET BORROWING (-)/NET LENDING (+) AS % OF GDP BY GOVERNMENT TIER
Local governments operate under a balanced budget requirement and borrowing is a minor source of budget revenue. Local debt policy options are partly influenced by municipal borrowing and debt regulations. Subnational governments in the CEMR countries followed a variety of borrowing policies. In most cases however, local borrowing potential was principally determined by the creditworthiness of the national budget. In 2010, the highest level of borrowing by subnational governments was in the federal countries, with Spain, Austria and Germany coming in at the top of the list (Figure 21). Larger economies, such as those of the Netherlands, Poland and Norway, actively used loan financing as well. Countries with underfunded local governments and/or those accumulating debt to cofinance EU funds (e.g. Poland, Portugal, Slovakia, Hungary) can also be found in this group. At the other end are the small countries with controlled local borrowing opportunities that use this financing option less actively (e.g. Western Balkan countries).
Local
Subnational government debt is at a manageable level in the 36 countries where comparative data was available (Table 7). As a result of strict fiscal rules and regulated borrowing procedures, accumulated debt was kept stable and below 4% of GDP at the lowest tier (see Box 20 on the progressive form of local debt regulations in Estonia). By way of comparison, general government debt had increased by the middle of the decade to 67% of GDP (and to 81% in 2020).
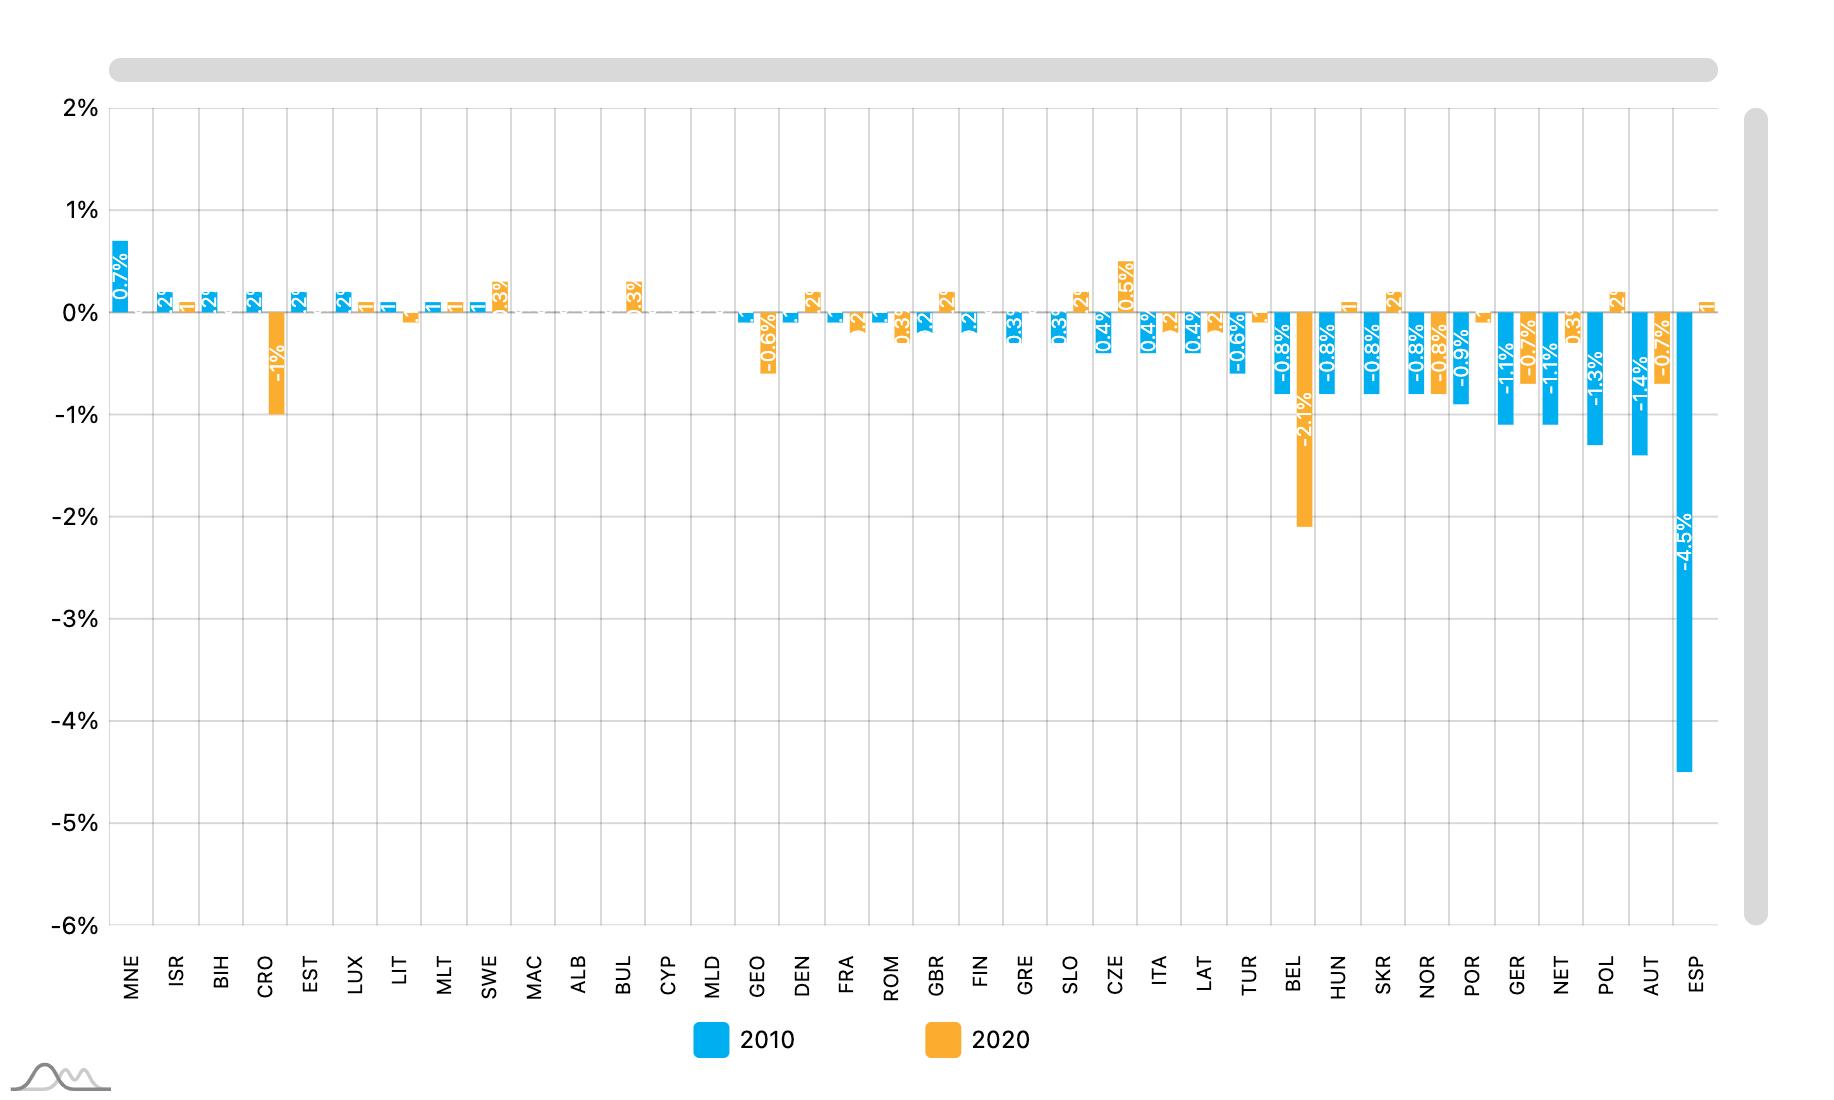
Local Finances and the Green Transition 51 A DECADE OF LOCAL FINANCES: TWO CRISES AND THE INTERVENING PERIOD
FIGURE 21 LOWER IMPACT OF PANDEMIC ON SUBNATIONAL GOVERNMENT BORROWING SUBNATIONAL BORROWING (-)/LENDING (+) AS % OF GDP, 2010, 2020
indebtedness
Local government States in federal countries as % of GDP 2017 3.9 15.7 2018 3.8 15.3 2019 3.8 15.0 2020 4.8 17.5
TABLE 7 CONSOLIDATED SUBNATIONAL GOVERNMENT GROSS DEBT
Box 20 – Local government debt regulation in Estonia
In 2011, the new Local Government Financial Management Act introduced, inter alia, a new budget structure, new balancing and debt rules, insolvency procedures and sanctions.
Local government borrowing and debt limits are regulated by balancing the operating budget. This dynamic approach calls for an operating result (amount of operating balance not lower than zero) and sets the upper limit of net government debt. At the end of the accounting year, net local government debt should be lower than the sixfold difference of the operating result, shall not exceed the total amount of the operating revenue and should be below 60% of operating revenue (if the sixfold operating result is less than the 60% of operational revenue).
Debt is broadly defined as including obligations, such as long-term debt to suppliers, leasing costs and requirements of concession agreements. Operational budgets use accrual-based accounting. Debt limits and positive operational results also apply to all local government institutions, including municipal companies. In 2010-2011, local governments faced restrictions in taking on new debt except in the case of co-financing for projects or the refinancing of existing loans.
https://www.riigiteataja.ee/en/eli/521122020004/consolide
Accumulated debt of the regional governments (the states in federal countries) reached 15% of GDP and rose even further in the first year of the pandemic (17.5%). Nevertheless, these federal regional governments, with their higher own-source revenue base and larger budgets, borrowed more actively.
Local Finances and the Green Transition 52 A DECADE OF LOCAL FINANCES: TWO CRISES AND THE INTERVENING PERIOD
6. Public financial management
Over the past decade, there have been various changes in local public service provision and public financial management (PFM). Some aspects of this systemic transformation should also be considered when local finances are being evaluated. Municipal service management and PFM are rather overly broad areas for a thorough analysis, especially in the CEMR countries where there are huge variations across public administrations and differing levels of economic development. Many domestic factors can influence direction and pace of change as well.
Therefore, besides supplementing the previous analysis on local expenditure and revenue, the following assessment will focus on selected aspects of PFM. The indicators discussed will also round out the data analysis on the overall quality of fiscal rules, budget openness and accountability.
Fiscal rules
FIGURE 22 FISCAL RULES INDEX, EU COUNTRIES, 2019
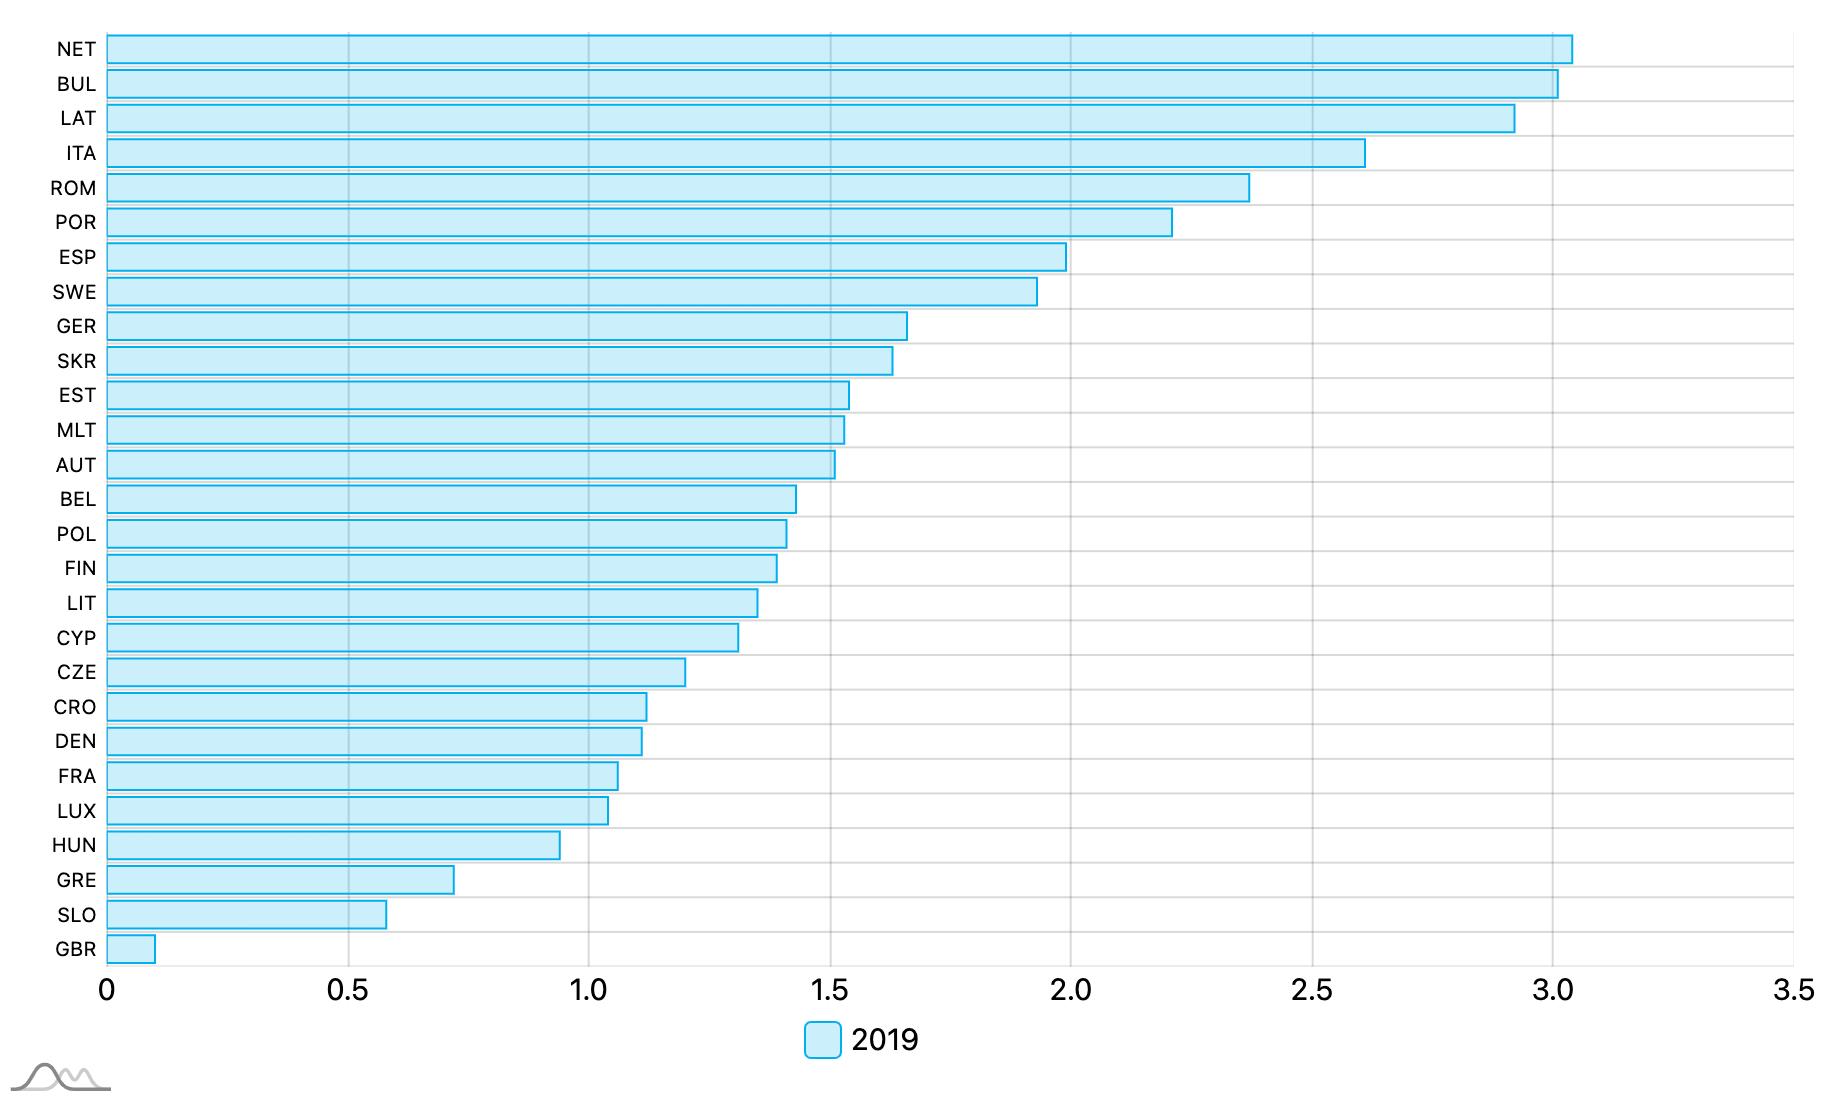
Following the 2008-2009 economic crisis, national fiscal policies were primarily concerned with the balancing of public budgets and maintaining control over local debt. During the past decade, the fiscal rules surrounding balanced budgets, borrowing limitations and procedures, control over local expenditure and taxes, monitoring and enforcement mechanisms have only grown in importance. They govern important areas of PFM and affect critical local finance conditions. The index on numerical fiscal rules in the EU countries measures this critical component of the local fiscal environment.
The Fiscal Rules Index9 takes into account several institutional aspects as well as fiscal weight of general government units. This composite index is a scaled measure of fiscal rules based on five dimensions: 1) legal base, 2) binding character, 3) bodies monitoring the compliance mechanism, 4) correction mechanisms, and 5) resilience to shocks. The Index characterises a very important element of fiscal policy making, which
9 https://ec.europa.eu/info/business-economy-euro/indicators-statistics/economic-databases/fiscal-governance-eu-member-states/numerical-fiscalrules-eu-member-countries_en
Local Finances and the Green Transition 53 A DECADE OF LOCAL FINANCES: TWO CRISES AND THE INTERVENING PERIOD
ultimately determines local budget design as well. As a unique measure of the strength of fiscal rules, it offers opportunities for benchmarking and the transfer of best practices on this critical area of PFM.
The Fiscal Rules Index shows significant differences among the EU countries (Figure 22). Countries with similar scores can diverge when it comes to the scope of decentralisation (the Netherlands vs. Bulgaria, Greece vs. Slovenia), population size or economic development. Consequently, the country ranking on the Fiscal Rules Index does not correlate to the level of decentralisation or economic development.
Budget openness
FIGURE 23 OPEN BUDGET INDEX, 2019
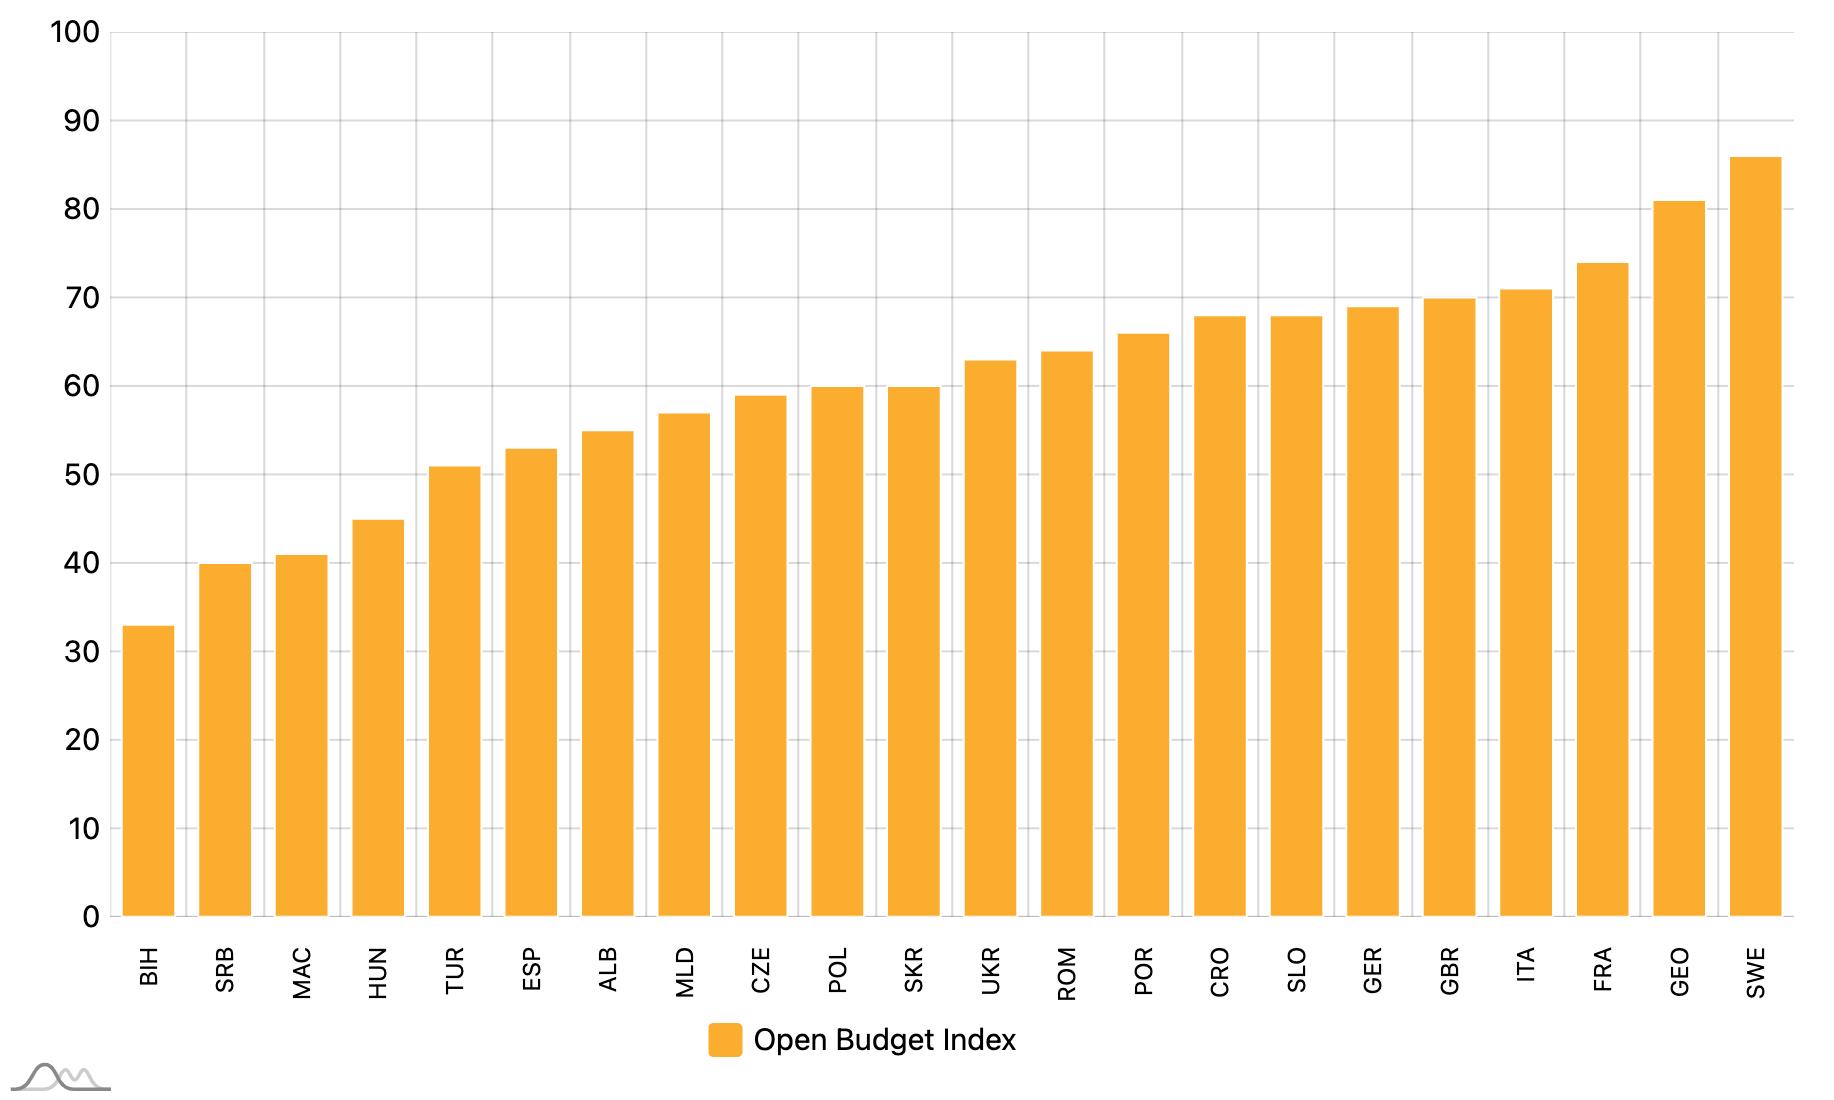
The efficiency of municipal service provision is greatly dependent on how governments respond to local needs. In order to ensure that local financial decisions dovetail with the public demand for services, not to mention the acceptable form and size of taxation, local governments should develop its budget in an open manner.
The Open Budget Index10 takes into account dozens of issues linked to budget preparation, design, approval and implementation and then presents an overall budgeting status. The budget openness index scores the major stages of the budgeting process and their outputs from a transparency standpoint. It primarily evaluates national budget procedures and documents. However, since these comprehensive government rules usually drive the local fiscal planning process, the country ranking also partly reflects the differences in the openness of subnational government budgeting practices (Figure 23).
Budget openness is primarily determined by national policies and general governance practices, although it is connected in part to the scope of decentralisation. Among the countries assessed by the Open Budget Survey, the more economically developed ones tend to score higher. These countries usually have more decentralised government systems: Sweden, France, Germany. However, seeing as some less decentralised countries also performed very well (e.g. Georgia, Slovenia), there are obviously exceptions. At the opposite end of the Open Budget Index’s ranking (lower scores), the countries are unquestionably more centralised (Spain, as a quasifederal country, being a special case).
10 The Index is only available for a limited number of countries, which are assessed by the International Budget Program: http://survey. internationalbudget.org/#home
Local Finances and the Green Transition 54 A DECADE OF LOCAL FINANCES: TWO CRISES AND THE INTERVENING PERIOD
Transparency and accountability
Openness in local finances and financial management also helps to curb corruption. The Corruption Perception Index (CPI)11 evaluates the overall status of a country. Given that local governments manage a major share of capital investments in the public sector, levels of corruption do affect local budgets. This reality is reflected in the CPI scores of the countries when they are ranked using a scope of decentralisation scale (Figure 24).
The more decentralised countries have higher CPI scores. The countries scoring the highest are more economically developed, as well as being less centralised, namely the decentralised Scandinavia countries and the federal countries. There are a few exceptions, such as Estonia and Israel, where corruption is successfully tackled under more unitary systems. The group with lower CPI scores is made up of countries that tend to be less economically developed and/or more centralised. Their ranking reflects higher levels of corruption and concerns many of the Balkan countries as well as Hungary and Turkey.
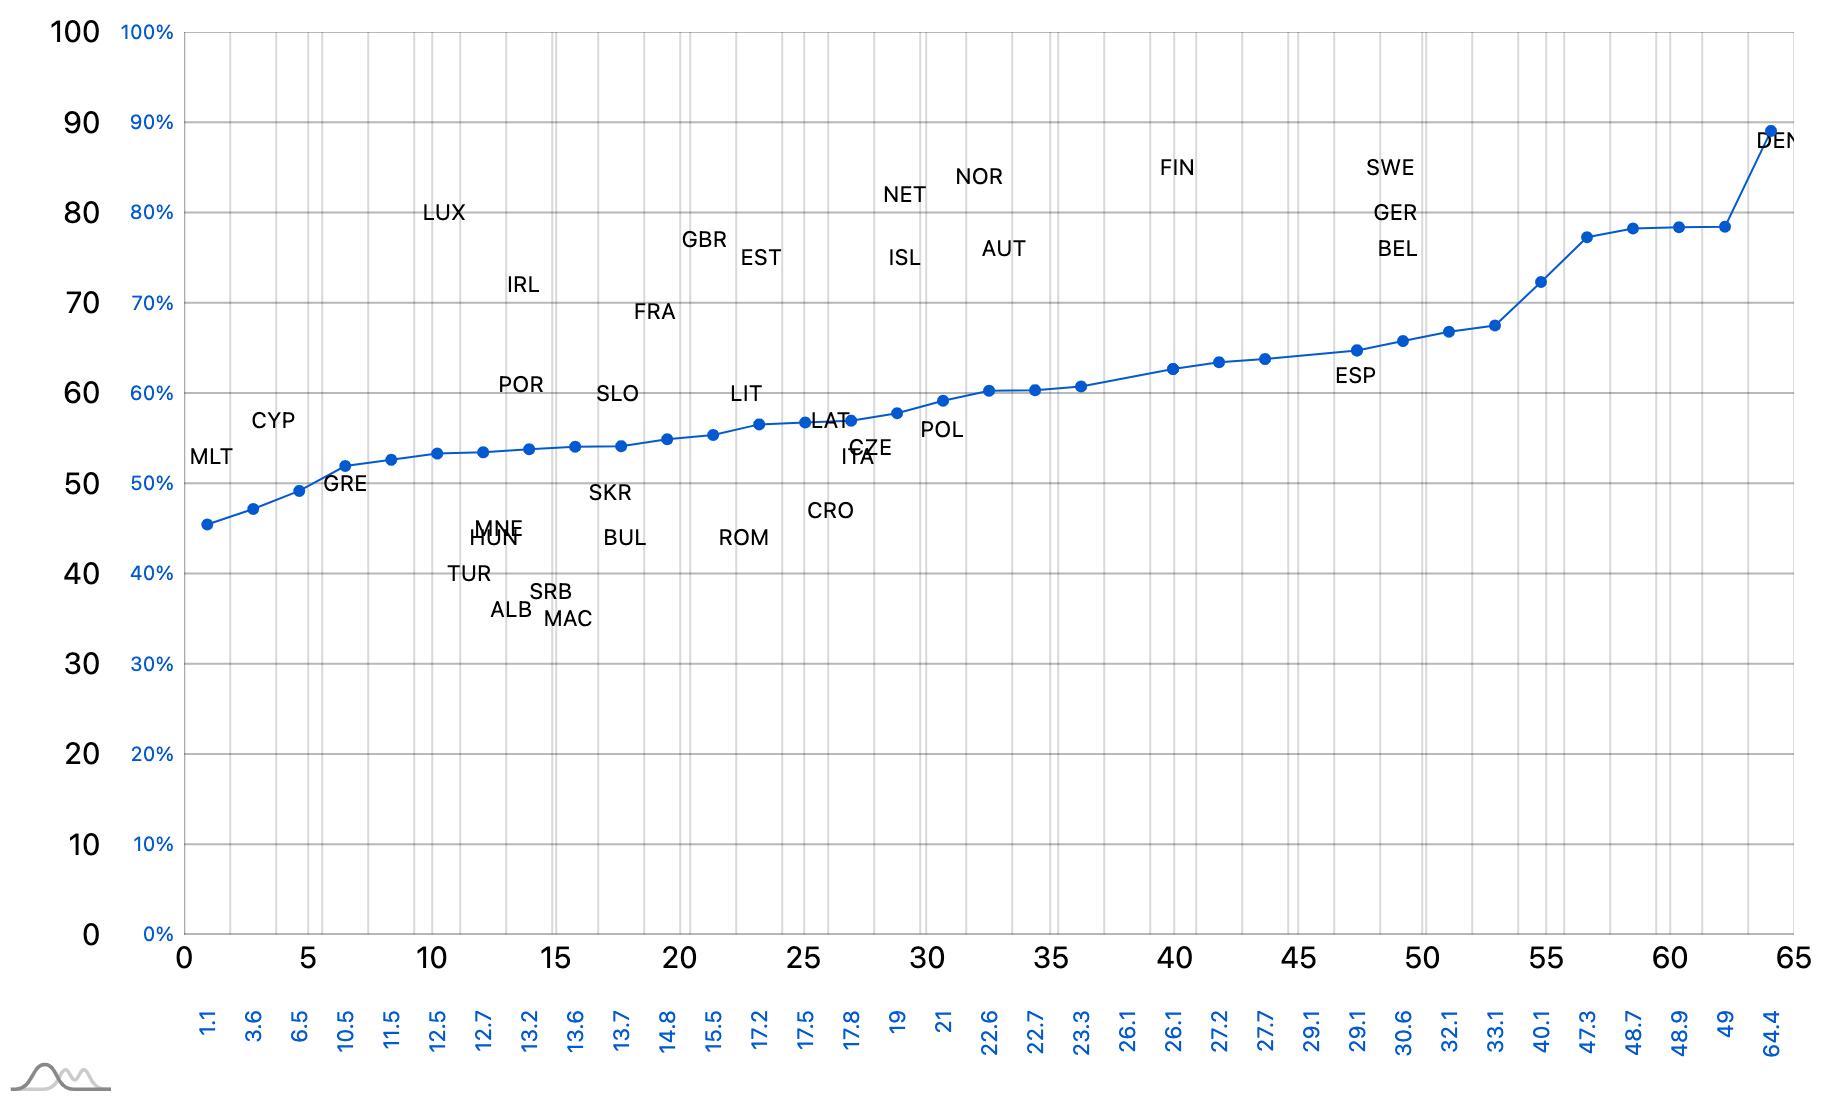
R² = 0.375
The type of information and statistical data available on government activities is an important measure of transparency and accountability. The comprehensive Statistical Performance Indicator (SPI)12 provides a general assessment on the state of maturity of these statistical practices. Reporting on the Sustainable Development Goals has been an additional challenge for national statistical systems. Since SDG implementation is measured by detailed performance indicators, the same data represents important products (topics) that are also assessed by the Statistical Performance Indicator.
CEMR member countries usually score high on the Statistical Performance Indicator (Figure 25). The more economically developed countries usually rank the highest on the list. The scope of decentralisation is another aspect that can be correlated to the quality of statistical systems. For example, Albania’s investing in the strengthening of its statistical systems seemed to follow local government reforms (with a high increase in scores since 2016). Some decentralised countries are constantly working to improve their internal information systems (Norway, Poland, Netherlands, Denmark).
11 https://www.transparency.org/en/cpi/2020/table/nzl
12 https://www.worldbank.org/en/programs/statistical-performance-indicators
Local Finances and the Green Transition 55 A DECADE OF LOCAL FINANCES: TWO CRISES AND THE INTERVENING PERIOD
FIGURE 24 LOWER CORRUPTION COINCIDES WITH HIGHER DECENTRALISATION ( SUBNATIONAL EXPENDITURE AS % OF GENERAL GOVERNMENT EXPENDITURE )
A DECADE OF LOCAL FINANCES: TWO CRISES AND THE INTERVENING PERIOD
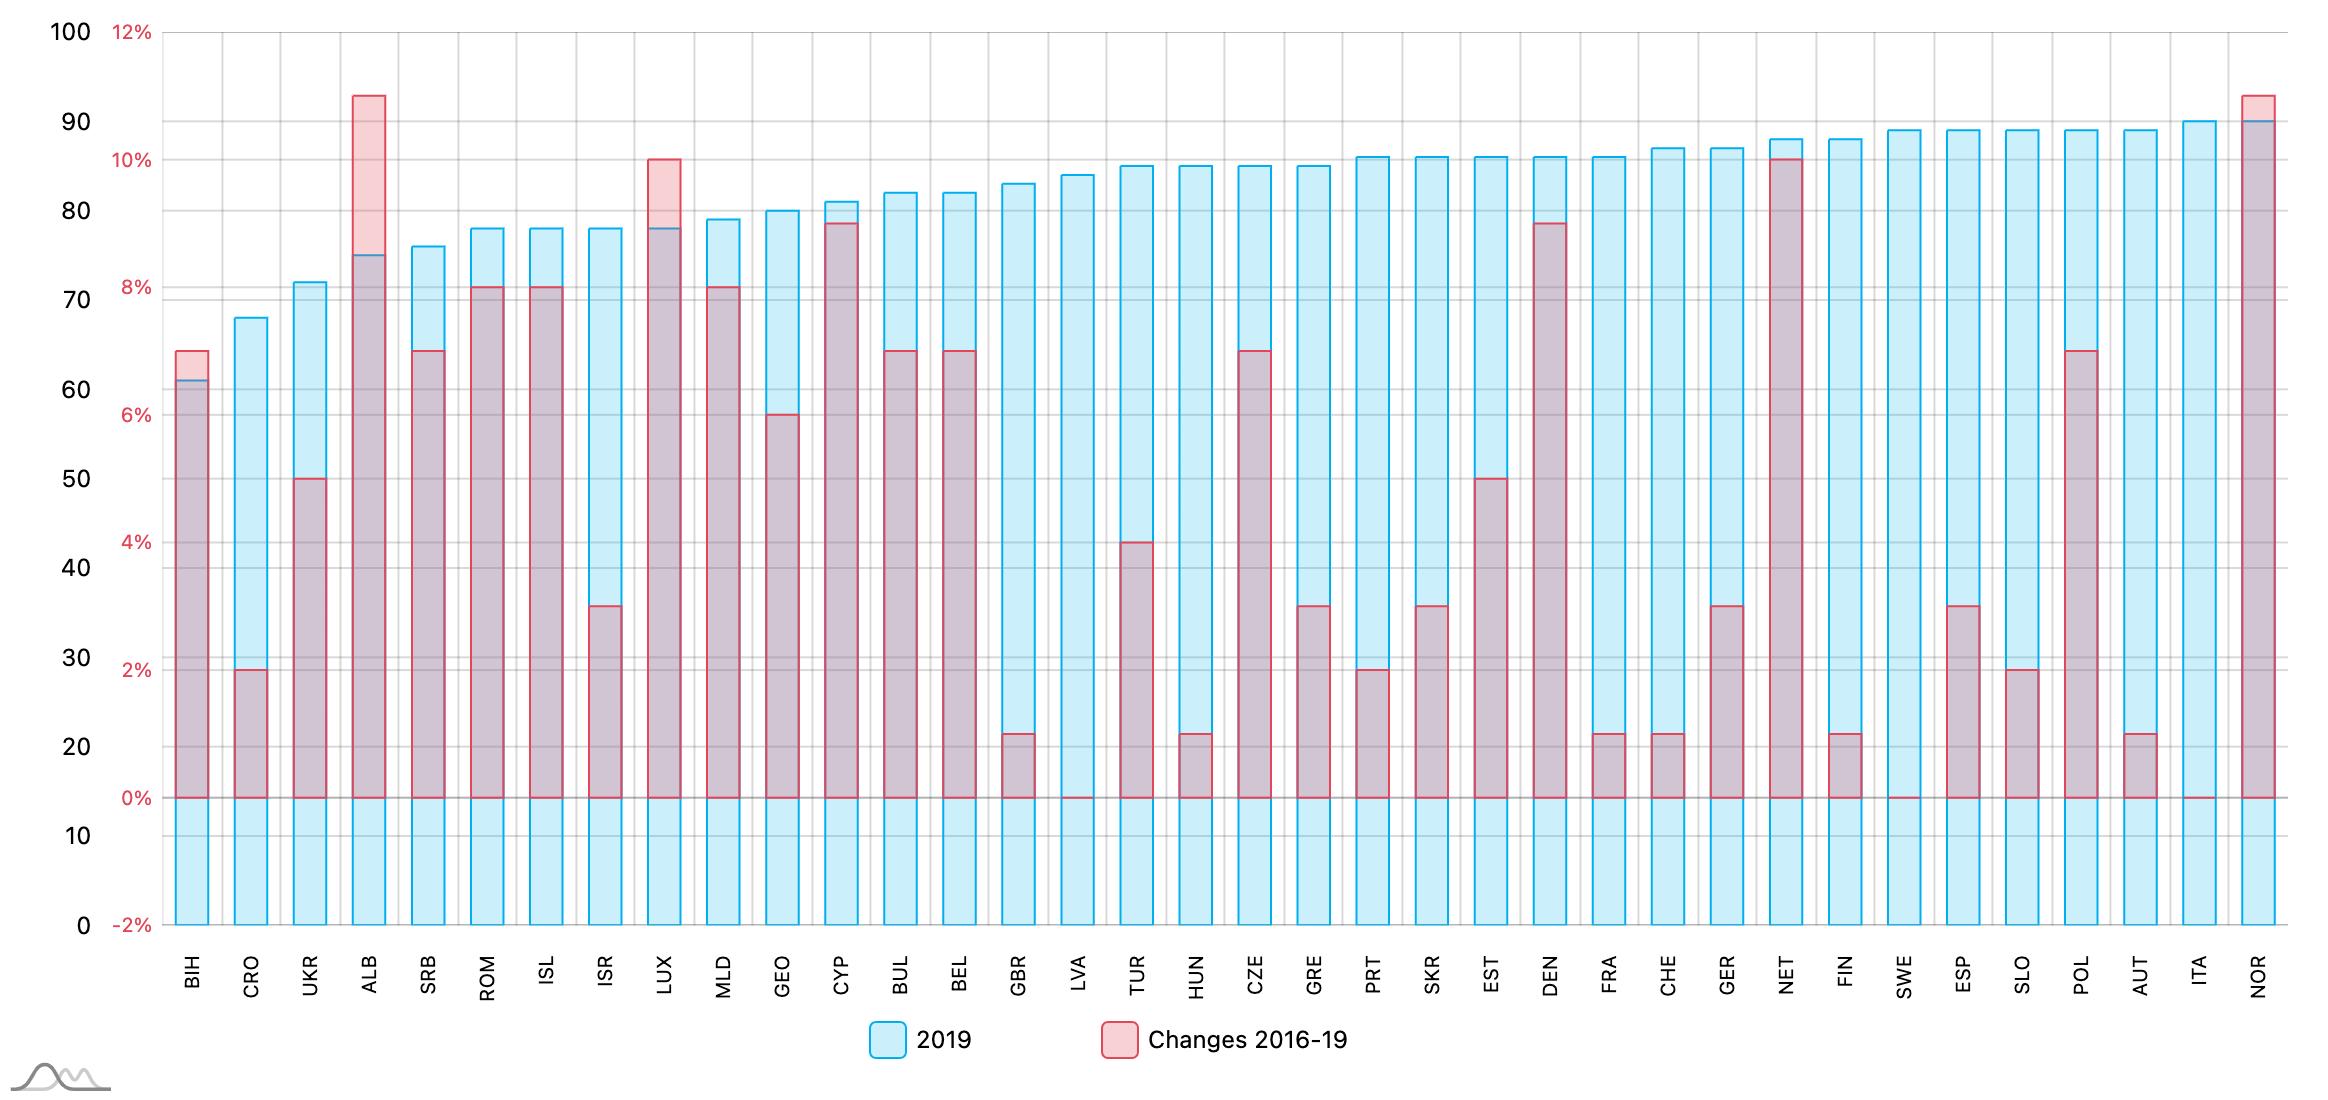
Local Finances and the Green Transition 56
FIGURE 25 STATISTICAL PERFORMANCE INDICATOR, 2019
7. The Recovery and Resilience Facility and subnational governments
In the coming years, climate change and the digital transition will remain integral to the European Union’s plans and funding policies. Subnational governments play an essential role in these two targeted areas of crisis recovery. They manage public services that are critical to climate mitigation, social resilience and territorial cohesion. As local and regional governments with regulatory powers in these areas, they can also contribute to sustainable growth.
The Recovery and Resilience Facility (RRF) is a major European Union financing mechanism that provides funds for the EU Member States to achieve their goals in these areas. This chapter includes a quick analysis of the national recovery and resilience plans and the grants provided through the RRF from subnational governments’ standpoint. Since the resilience and recovery plans submitted to the European Commission are the product of national programmes, the local and regional allocation of these investments are not presented in any great detail.
The following chapter briefly looks at the potential impact of the reforms and investments of the national recovery and resilience plans on local and regional governments. This study relies on the (rather limited) public information available.13 As it was written at the start of the RRF’s first year funding programmes, many national projects and grant schemes were still in development. Given the lack of specific financial data, the focus will mainly be on indirect connections between country-wide spending priorities and subnational governments’ functions. These proxies show how subnational governments can benefit from RRF funds. CEMR also plans to use this information as a baseline for future RRF assessments and as a tool to support its member associations in their local and regional monitoring activities.
RRF objectives and management
The Recovery and Resilience Facility was developed during an unprecedented period. This major European Union financing mechanism was launched in the first year of the multiannual financial framework for 20212027. This timely additional funding under the Next Generation EU instrument will be primarily used for regional development, cohesion, recovery and resilience during the second year of the pandemic. The targets for the investments funded by these programmes are defined in part by the European Green Deal. With the introduction of a temporary State aid framework and the adjustment of European Semester procedures to the RRF, beneficiary countries of RRF grants and loans can enjoy greater spending flexibility.
The total budget of the Recovery and Resilience Facility is EUR 672.5 billion, available as grants (EUR 312.5 billion) or as loans (EUR 360 billion) for the period of 2021-2026. The grant component of the RRF is allocated among the EU member countries based on objective criteria, taking into account population size, economic development (inverse of GDP per capita, changes in GDP) and unemployment rate.
As of 1st March 2022, 22 national recovery and resilience plans (RRP) have been finalised and approved (remaining countries are Bulgaria, Hungary, the Netherlands, Poland, Sweden). The total amount appropriated under the approved national plans provides EUR 291 billion in grant financing and EUR 154 billion in loans. Pre-financing payments for 13% of the allocated amount were already initiated the first year but have not yet been paid out in full. The actual management of the RRF is regulated under operational arrangements signed with the Member States. As of March 2022, eight countries have successfully reached this stage.14
13 The financial data was downloaded from the Recovery and Resilience Facility website in February 2022. 14 Report on the implementation of the Recovery and Resilience Facility. EC, Brussels, 1st March 2022 COM(2022) 75 final https://ec.europa.eu/info/sites/default/files/com_2022_75_1_en.pdf
Local Finances and the Green Transition 57 A DECADE OF LOCAL FINANCES: TWO CRISES AND THE INTERVENING PERIOD
RRF grants and decentralisation
Under the RRF allocation criteria, the grant per capita is higher in the newer less economically developed EU member countries (Figure 26).15 Italy and Spain represent the only exceptions among the developed states, but they can also be characterised as large countries from the South hit hard by the crisis and with huge internal regional differences. However, aside from these two countries, all the other major beneficiaries are smaller and less decentralised, with lower local government spending. In fact, the RRF grants per capita for these countries, which include Greece, Portugal, Romania, Croatia and Cyprus, are significantly higher than their per capita local government expenditure for one year.
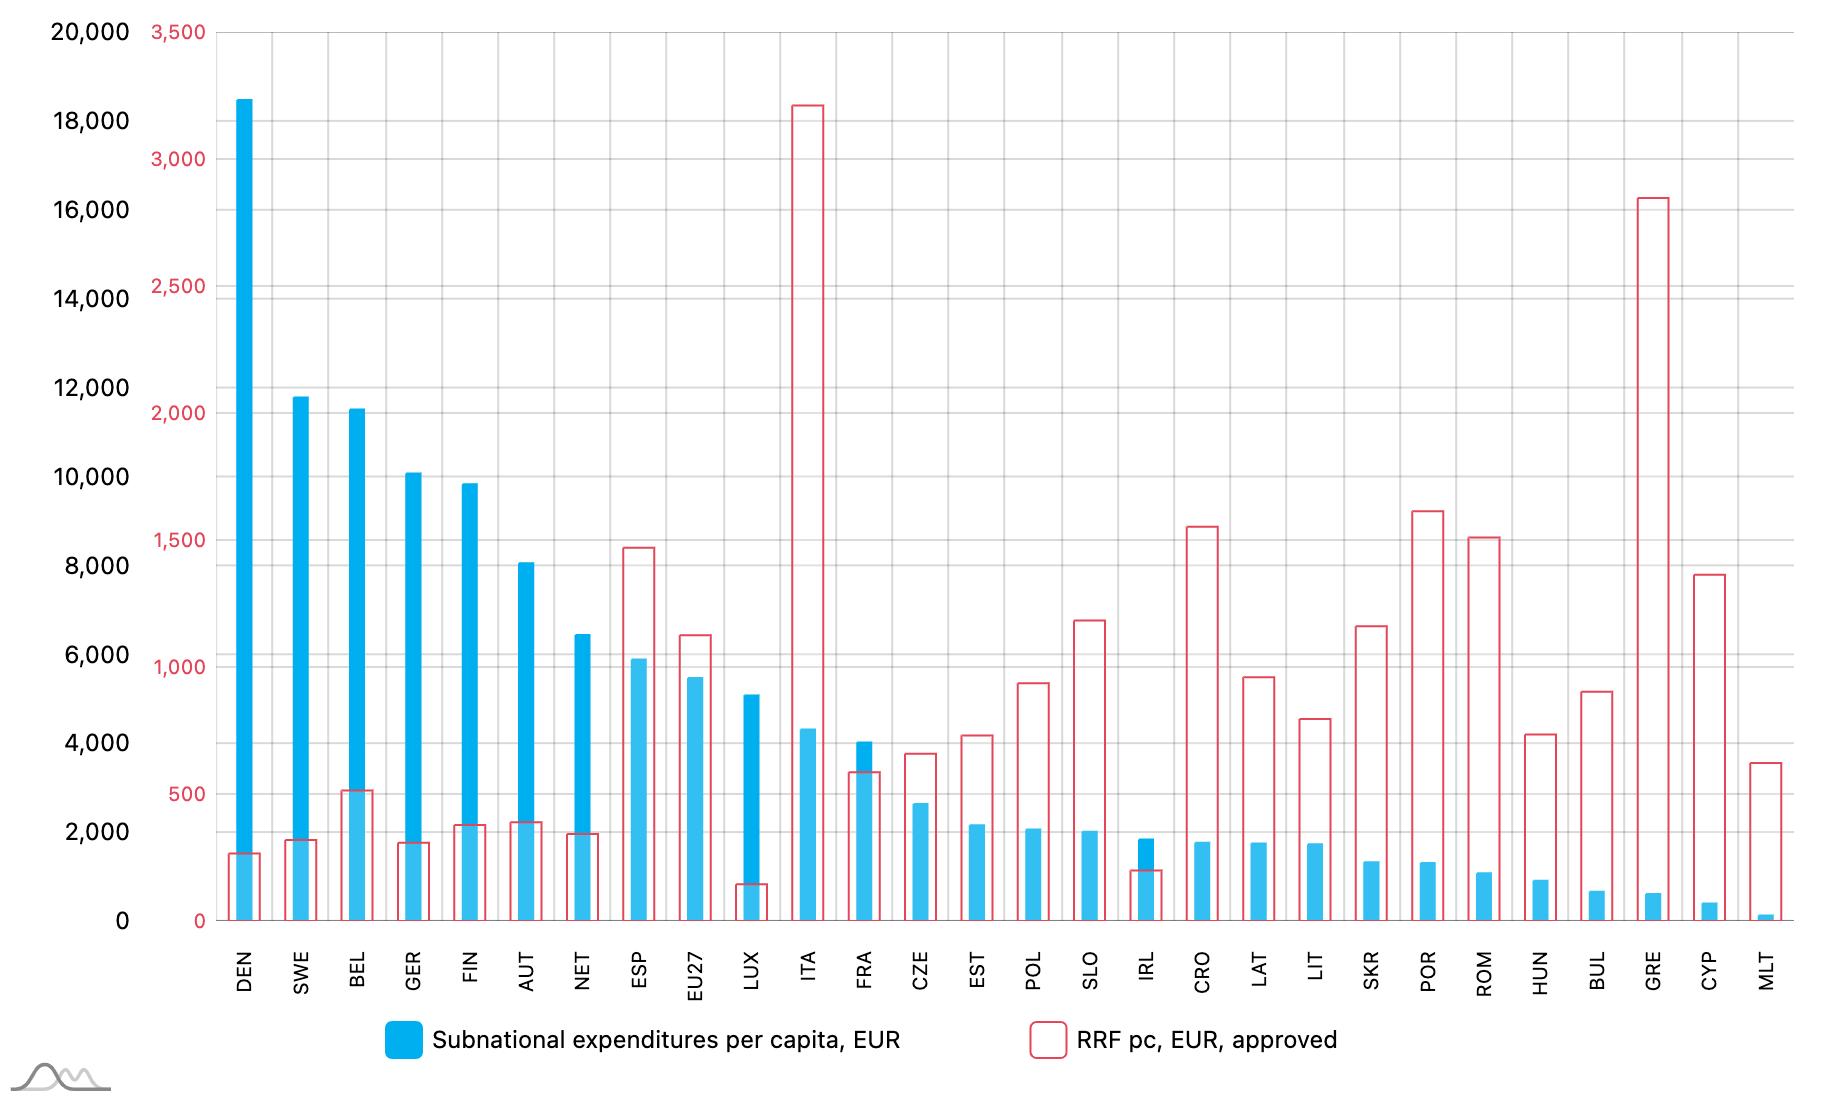
FIGURE 26 SUBNATIONAL EXPENDITURE AND RRF GRANTS PER CAPITA
RRF pillars
The six priorities of the RRF represent critical areas for crisis recovery but they have also been designed to work in tandem with responses to climate change, while also strengthening the EU foundation for future economic development through digitalisation, sustainable growth and increased resilience. The resulting RRF “pillars”16 are the following: green transition; digital transformation; smart, sustainable and inclusive growth; social and territorial cohesion; health, and economic, social and institutional resilience; policies for the next generation. All national recovery and resilience plans are required to allocate a minimum of 37% of their RRF funds to the green transition (climate change) and 20% to the digital transition. Local governments may benefit from these grants in cases where their functions and competences are in line with the RRF pillars.
As a reform action or an investment might be beneficial to several programmes, the RRF guidance sets out specific rules on climate tracking and digital tagging. For example, “energy efficiency renovation of existing housing stock” is assigned a coefficient of 40% in support for climate change, while an intervention relating to “Smart Energy Systems” is accounted as 40% for digital transition. These RRF regulations on planning ratios are made more complicated when an action works in favour of more than one targeted pillar. For example, modernisation of public transport can be said to support both green transition and territorial cohesion. This explains why some independent reviews of the RRF grant and loan classification system resorted to
15 All the RRF-related data in this report were downloaded from the RRF website from 22 to 26 February 2022. The other data is from Eurostat 16 https://ec.europa.eu/economy_finance/recovery-and-resilience-scoreboard/pillar_overview.html?lang=en
Local Finances and the Green Transition 58 A DECADE OF LOCAL FINANCES: TWO CRISES AND THE INTERVENING PERIOD
a combination of pillars (also classifying some actions as “uncategorised”, see the Bruegel dataset17). This categorisation problem has been addressed here by using the data available on RRF grants by pillar and breaking it down by spending allocation/target and presenting it as “Primary” or “Secondary” for analytical purposes (see Figure 27).
The data average of 22 countries shows that, as the “Primary” allocation, green transition spending accounts for the highest share of RRF grants (42%), with digital transformation representing the next largest item (25%). For both items, the required minimum allocation limits of 37% and 20%, respectively, have been met and exceeded. Of the remaining one-third of RRF funding, the grants for economic growth constitutes the highest share (11%), and the rest of the support is distributed rather evenly (6%-8%) amongst the last three RRF pillars. However, as a “Secondary” target, the remaining grant allocation mainly goes towards supporting social and territorial cohesion (38%) and economic growth (29%).
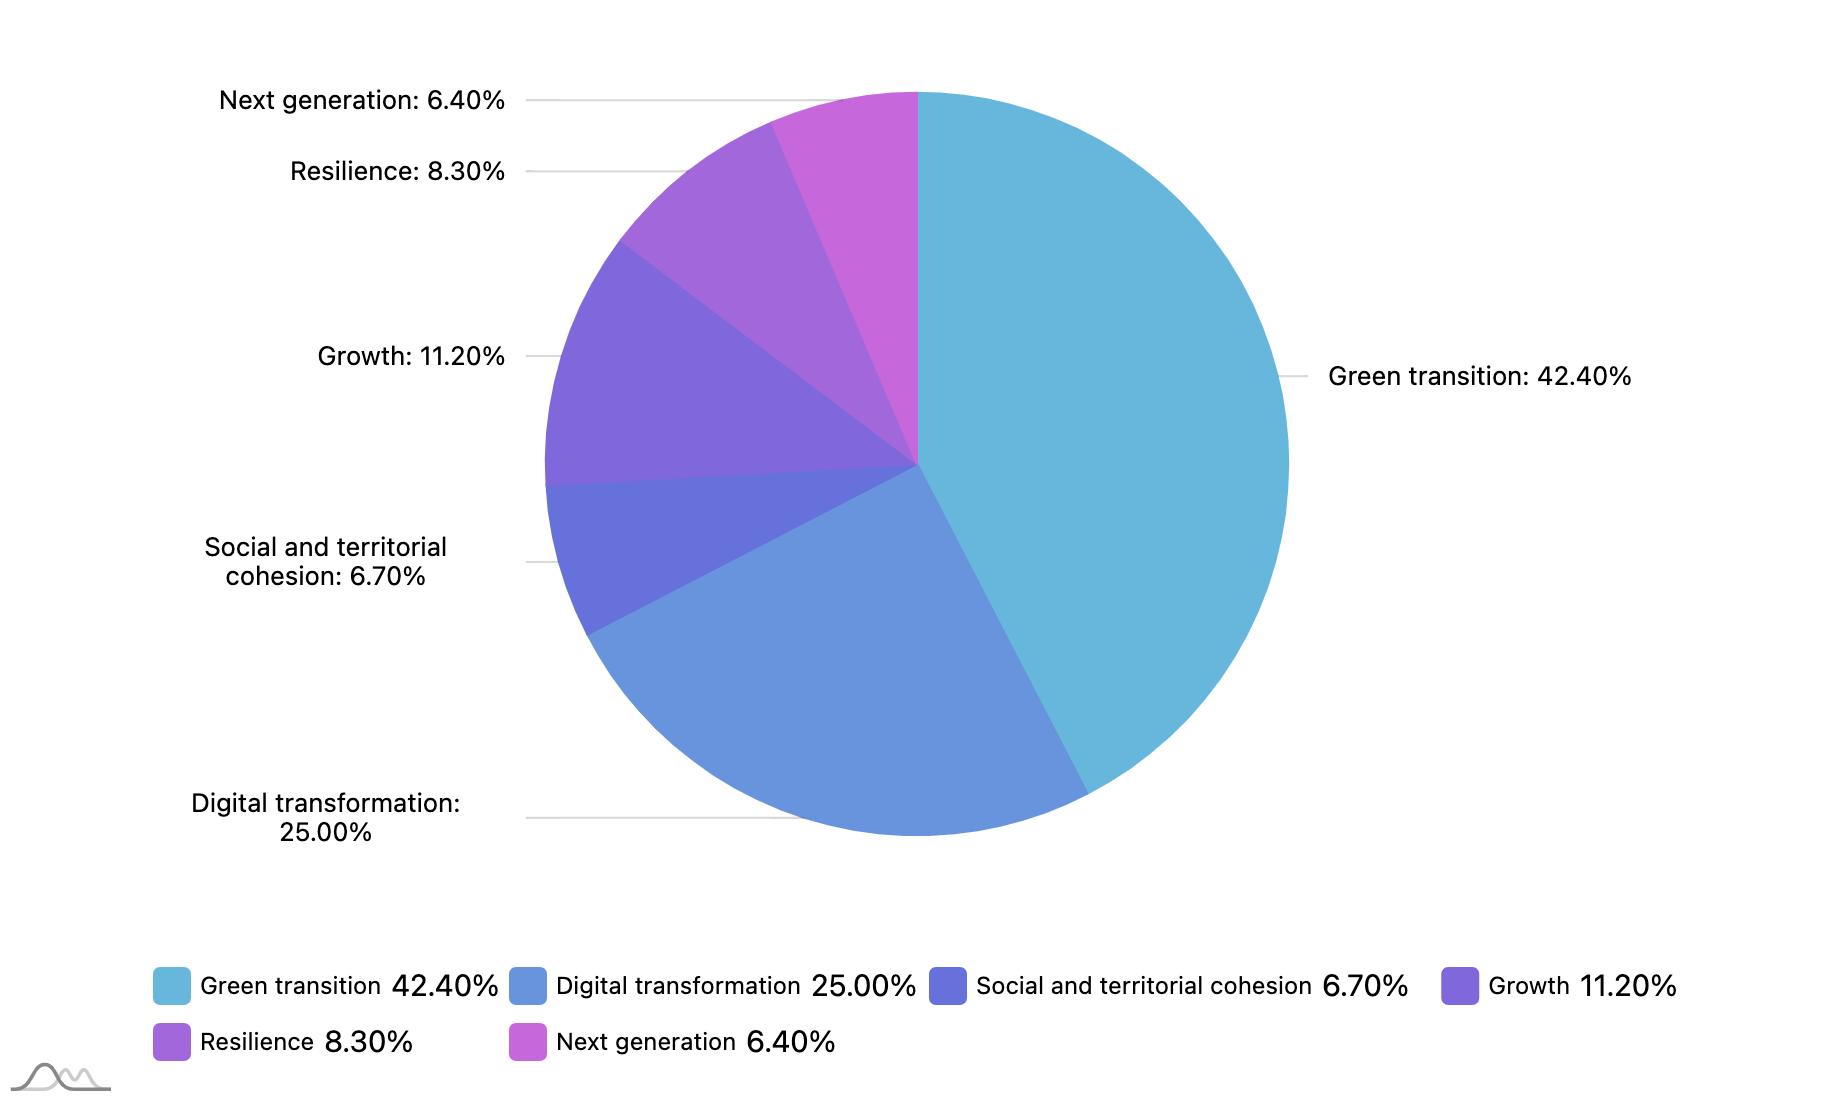
Unweighted averages of 22 countries with approved national plans
17 https://www.bruegel.org/publications/datasets/european-union-countries-recovery-and-resilience-plans/
Local Finances and the Green Transition 59 A DECADE OF LOCAL FINANCES: TWO CRISES AND THE INTERVENING PERIOD
FIGURE 27 RRF GRANT SPENDING BY PILLAR ( PRIMARY AND SECONDARY )
The European Commission has identified seven “flagship areas” for reforms and investments. They represent priorities to be taken into consideration for planning purposes and are all connected to green transition and digitalisation: Power up (clean technologies and renewables), Renovate (energy efficiency of buildings), Recharge and refuel (sustainable transport), Connect (broadband services), Modernise (digitalisation of public administration), Scale-up (data clouds), Reskill and upskill (education in digital skills). The national recovery and resilience plans are also guided by these high priority flagship areas.
Two sets of guidance providing detailed instructions on the planning principles, content and format of the Member States’ recovery and resilience plans have also been issued.18 Specific examples are included to assist governments in drafting their RRF plans and developing the national programmes.
RRF pillars of high local significance
The first RRF pillar on green transition accounts for the largest share in the planned national recovery and resilience expenditure. For the 22 countries with approved plans, it represents more than 30% of RRF-related expenditure (Figure 28). The share of green transition spending is higher in the more decentralised countries, with the exception of a few smaller countries, e.g. Luxembourg or Malta.
The four countries with strong regional structures (Austria, Belgium, Germany, Spain) all appropriated more than 40% of their RRF budgets to climate-related interventions and policy areas. Among the less decentralised countries, Portugal, Greece and Cyprus have allocated less to the green transition pillar (although it is a high priority in Ireland). The national aggregate data on this first pillar indicates a clear trend, namely that the more decentralised countries intend to spend more on green transition-related investments and reforms.
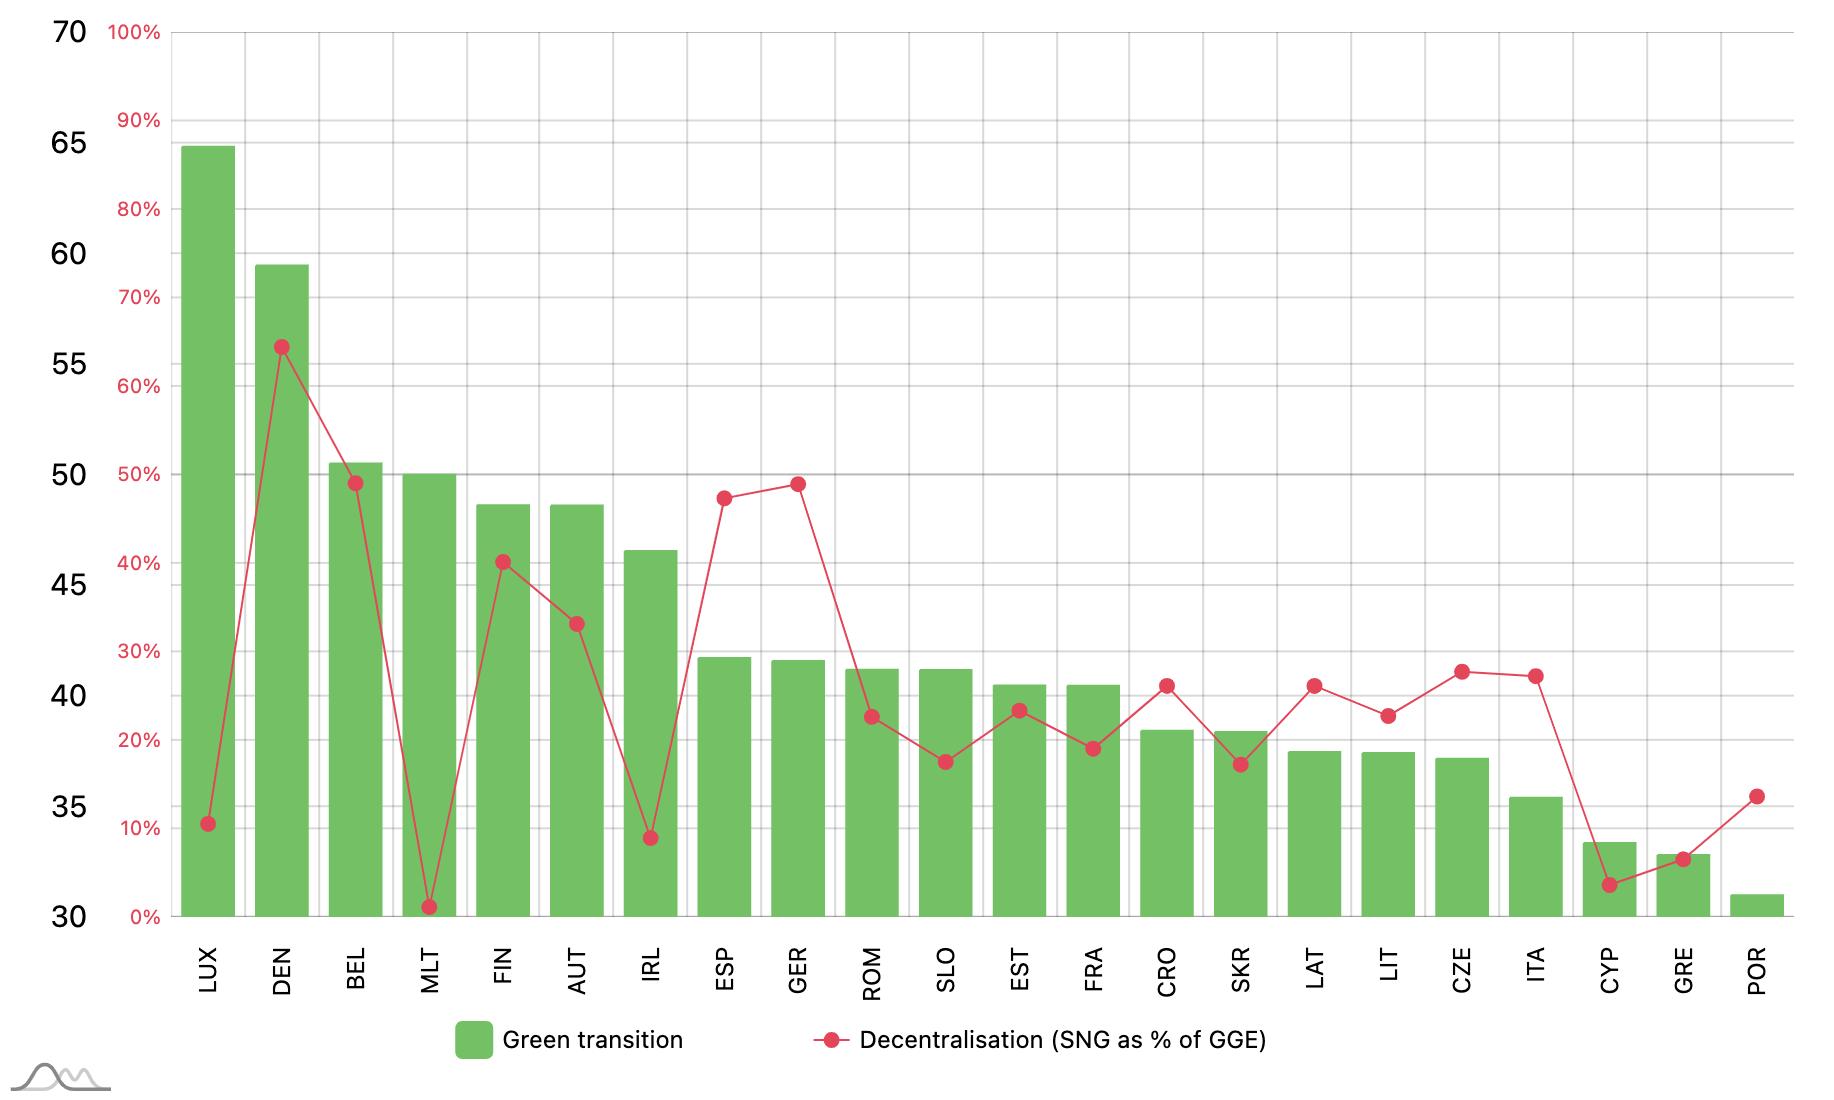
Local Finances and the Green Transition 60 A DECADE OF LOCAL FINANCES: TWO CRISES AND THE INTERVENING PERIOD
18 See Staff Working Documents, European Commission 22.1.2021 SWD(2021) 12 final, Parts 1 and 2.
FIGURE 28 SHARE OF GREEN TRANSITION EXPENDITURE AND DECENTRALISATION
In addition to the far-reaching core pillars of green transition and digital transformation, three other pillars are especially significant for subnational governments and represent primary priorities: (i) social and territorial cohesion, with its focus on reducing inequalities; (ii) resilience, which covers locally managed health care programmes; and the (iii) next generation pillar, on account of the many education interventions that will typically take place at the subnational level. The countries in Figure 29 have been ranked according to their share of funds dedicated to social and territorial cohesion in total contributions.
Countries with above average shares of funds for cohesion are rather heterogeneous: they include medium-sized ones (Portugal, Czech Republic, Ireland), two countries with federal structures (Belgium, Spain), as well as Italy, with huge regional differentiation.
The less decentralised countries intend to spend more on programmes under the “resilience” pillar where health care and public administration expenditures have been budgeted. Slovakia and Estonia are the highest spenders in this group even though expenditure on health care is relatively low in these two countries (3% and 15%).
Under the next generation pillar, education constitutes the largest expenditure item. The RRF grants can help support local governments in countries such as the Czech Republic and Lithuania, where education represents almost one-third of local spending, or France, where public education is a shared function (15% of local expenditure). In countries where education is not a local mandate (Cyprus, Malta), it is the national governments that will benefit from this pillar and RRF support.
Looking at the pillars that represent secondary priorities (in terms of grant allocation but also their impact on subnational governments), social and territorial cohesion has been allocated the largest grant share; there only seems to be a random connection to scope of decentralisation (Figure 30). Moreover, the potential impact of RRF grants on subnational governments cannot be determined by the overall allocation of grants by pillar.
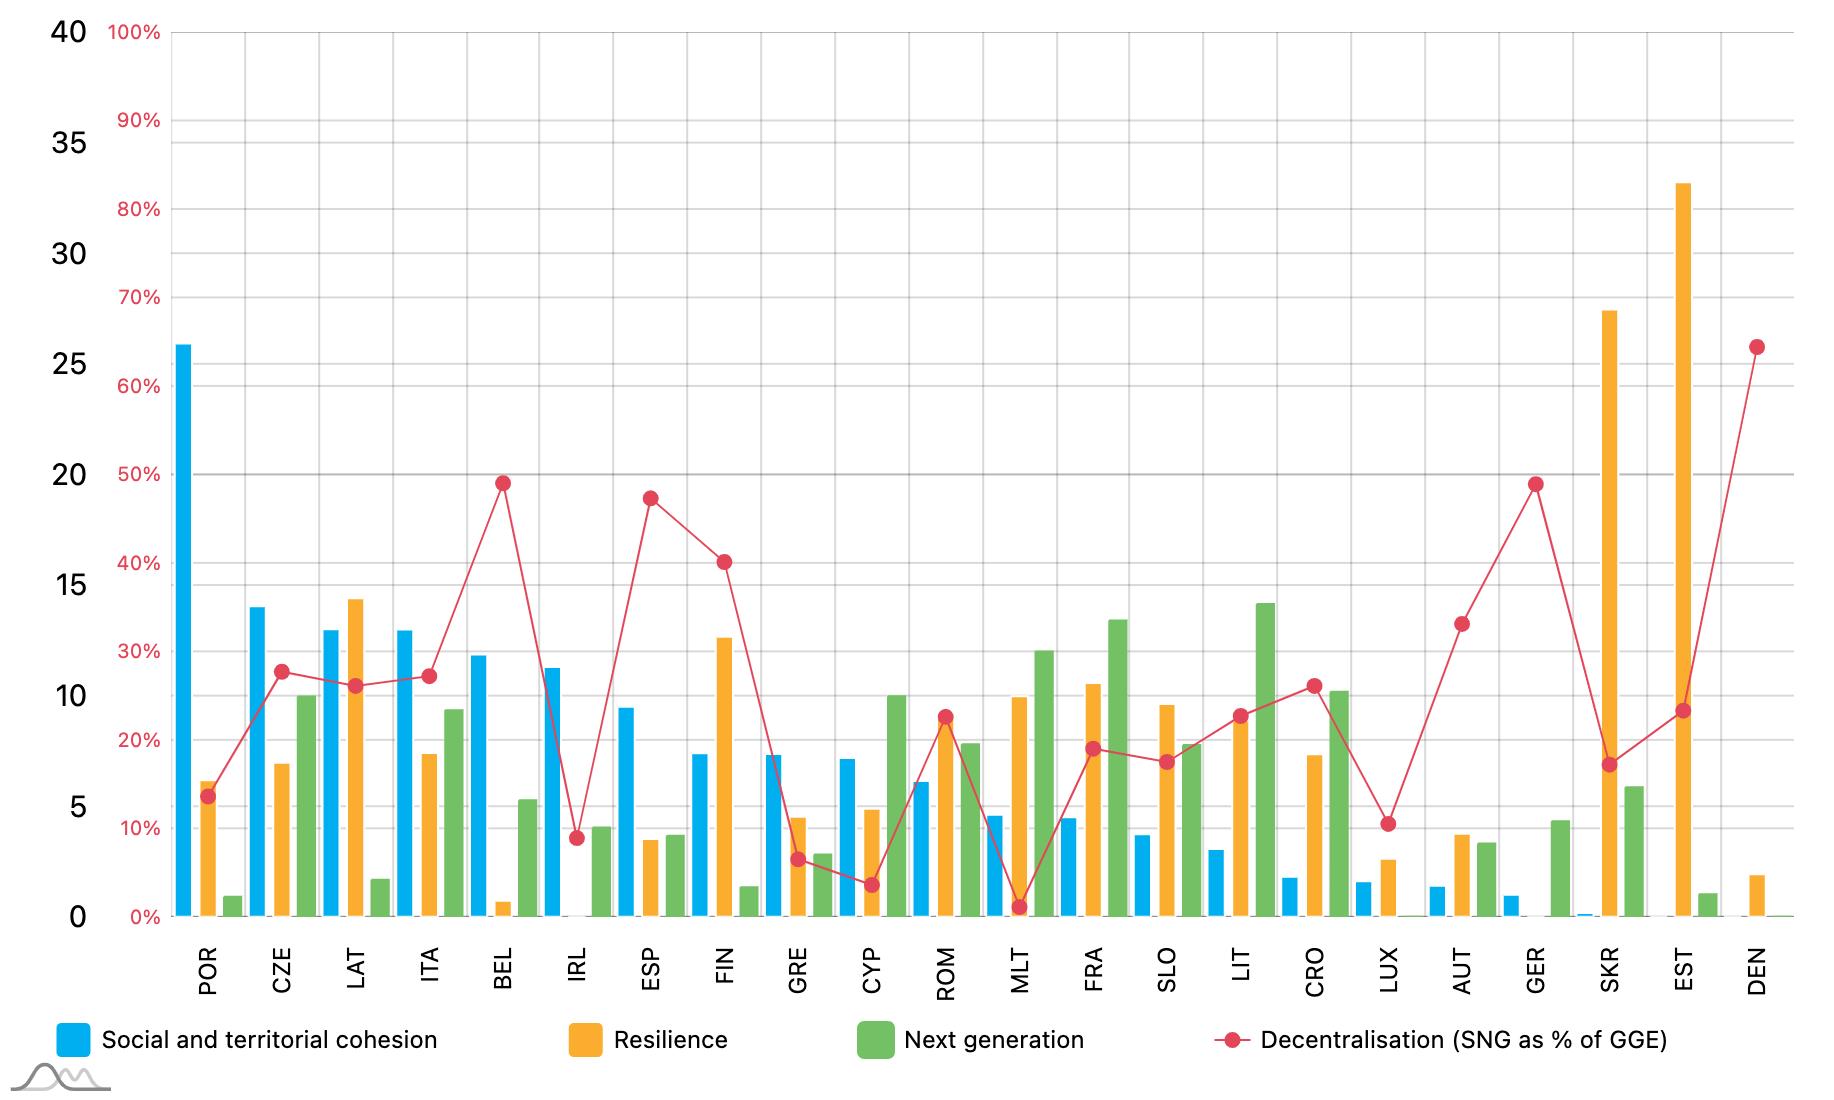
Local Finances and the Green Transition 61 A DECADE OF LOCAL FINANCES: TWO CRISES AND THE INTERVENING PERIOD
FIGURE 29 SHARE OF RRF GRANTS BY COUNTRY AND DECENTRALISATION ( SELECTED PRIMARY PILLARS )
Preferred policy areas by pillar priority
As previously mentioned, four RRF pillars are especially important for local and regional governments, particularly given their high level of competences and service provision responsibilities in green transition, health and resilience, next generation, and the fact that they are impacted by the social and territorial cohesion programmes. The importance of these selected pillars will be evaluated from an SNG viewpoint by looking at the composition of RRF grants by policy area.
Green transition
Under the first RRF pillar, sustainable mobility is the preferred policy area with 32% of planned ‘green’ expenditure (Figure 31). Interventions include costly investments for railway networks and locally important green public transport programmes.
Energy efficiency is a similarly high priority, representing 29% of total expenditure planned on green transition. These grants are to be used for investments with local significance, such as making residential buildings more energy efficient, refitting public buildings, managing energy poverty, etc.
Typical local government functions, such as solid waste management using circular economy solutions (e.g. waste sorting, bio-waste treatment), sustainable water services and other environmental pollution prevention programmes, represent only 2-4% of total expenditure under Pillar 1.
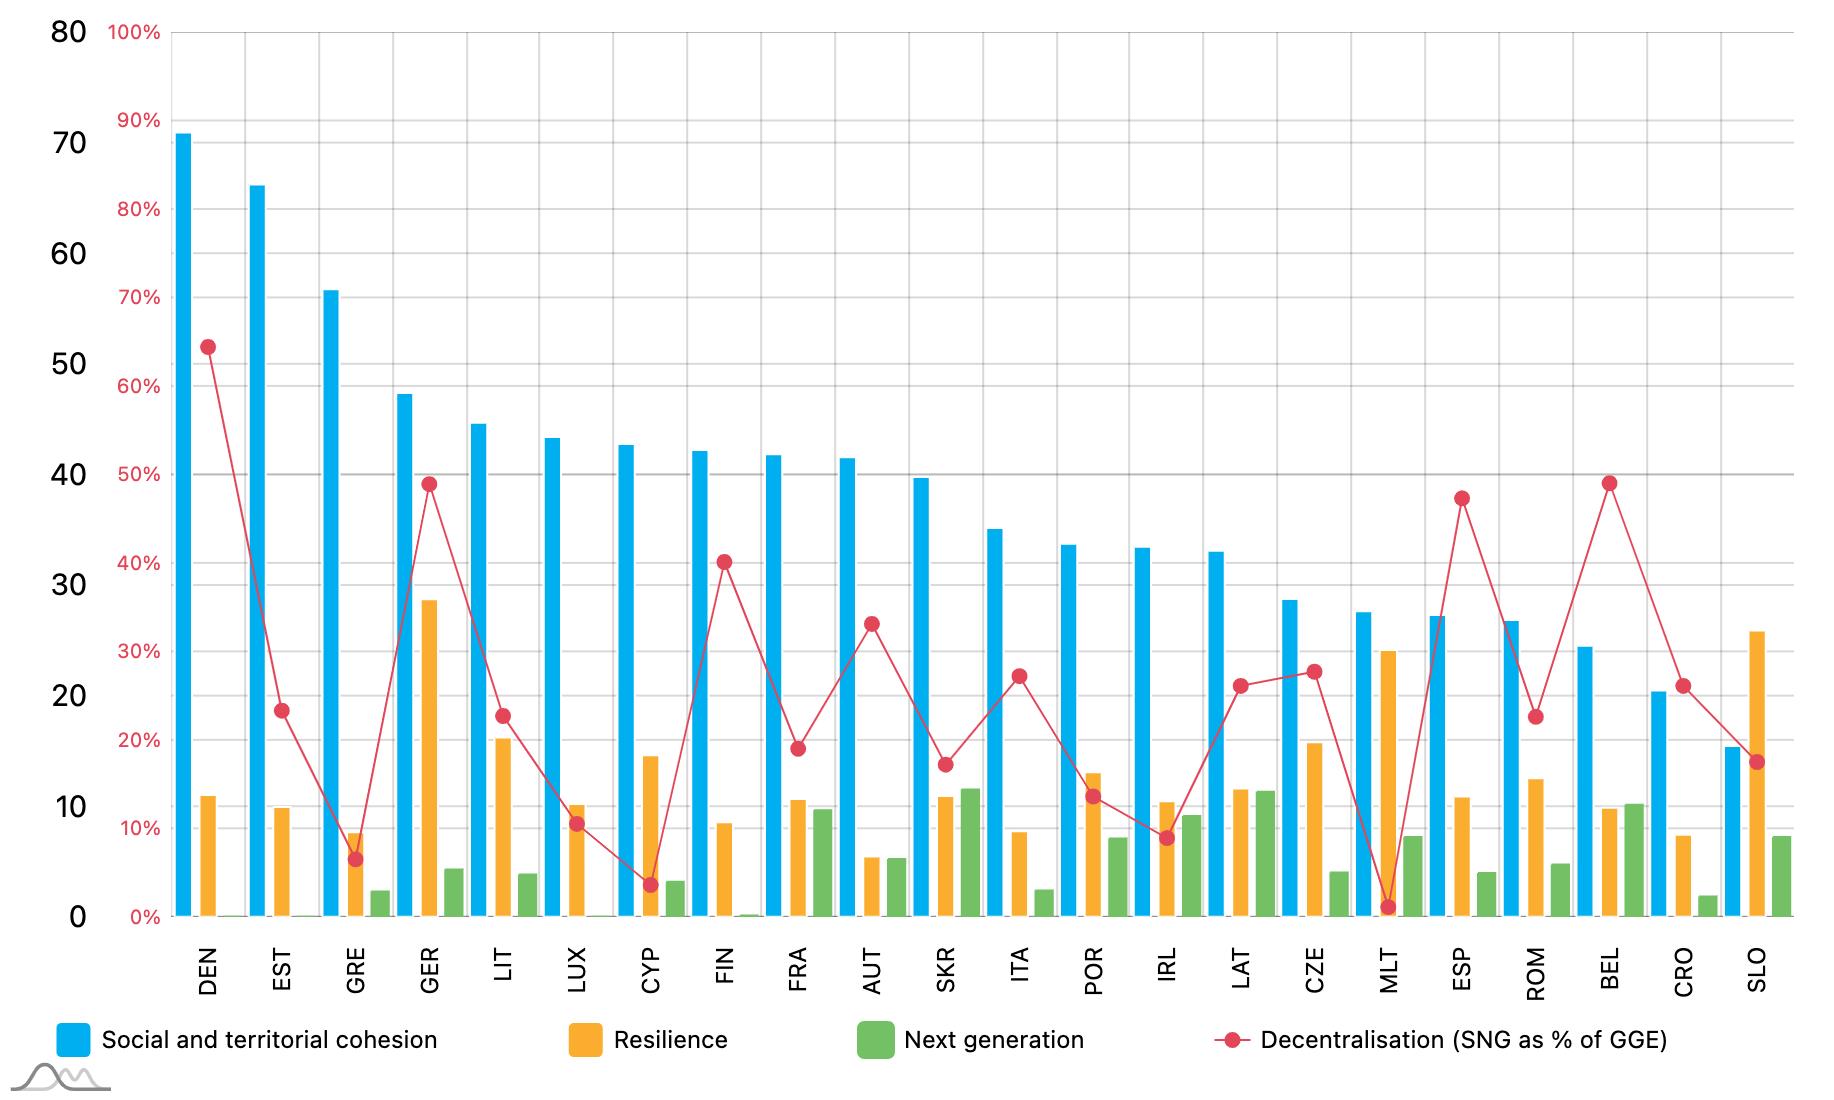
Local Finances and the Green Transition 62 A DECADE OF LOCAL FINANCES:
AND THE INTERVENING PERIOD
TWO CRISES
FIGURE 30 SHARE OF RRF GRANTS BY COUNTRY AND DECENTRALISATION ( SELECTED SECONDARY PILLAR )
Spain provides a good example of a comprehensive national programme, the Spanish Urban Agenda, targeting various elements aligned with green transition (see Box 21).
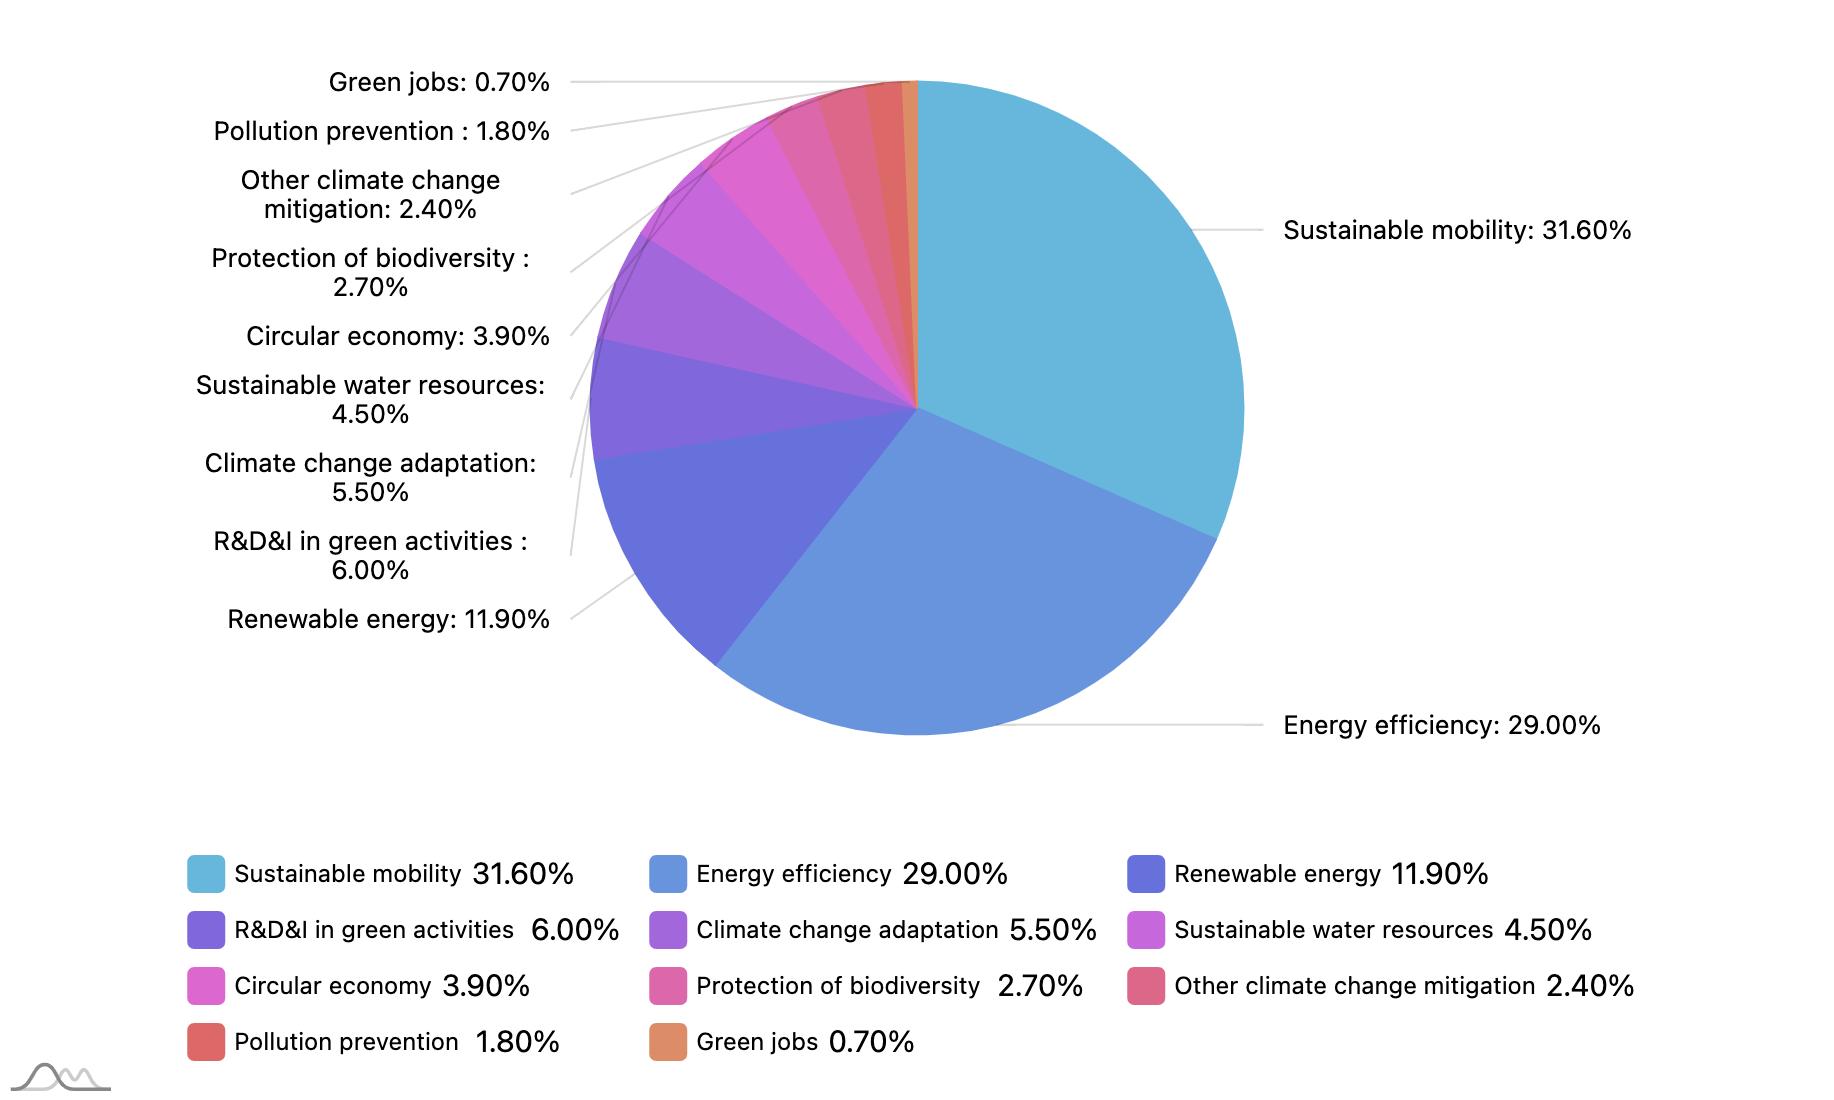
Box 21 – Spain: Implementing the Spanish Urban Agenda – rehabilitation and regeneration plan
This component of Spain’s RRF national plan involves the entry into effect of the Spanish Urban Agenda, a long-term renovation strategy for energy rehabilitation in the building sector. It will be implemented through various legislative actions touching on housing, property law and the establishment of renovation one-stop-shops. Planned investment targets include a large number of residential housing renovations, reduction in non-renewable primary energy consumption, construction of energy efficient social housing, renovations in small municipalities (population under 5 000), clean energy projects renovating public buildings partially in small municipalities.
Source: Annex to the Proposal for a Council Implementing Decision on the approval of the assessment of the recovery and resilience plan for Spain {SWD(2021) 147 final}
Social and territorial cohesion
Territorial infrastructure and services are the predominant policy areas of spending under the social and territorial cohesion pillar (66% of total) (Figure 32). This category encompasses different activities under local governments’ control, ranging from public utilities to administrative services. The remaining one-third of cohesion spending is divided up amongst various services, many of which are also important at the subnational level: vocational education (8%), social housing and social services (both 7%), rural development (6%) and employment (3%).
Local Finances and the Green Transition 63 A DECADE OF LOCAL FINANCES: TWO CRISES AND THE INTERVENING PERIOD
FIGURE 31 EXPENDITURE SUPPORTING GREEN TRANSITION BY POLICY AREA
The typical LRG-related policy areas under this pillar are territorial infrastructure and rural development. Their RRF grant shares range from 15% (Luxembourg) to 86% (Romania) in the case of territorial infrastructure and services. Rural development accounted for the highest share in Denmark (58%). Romania has developed an RRF-specific component, entitled “Local Fund”, that targets various aspects of local infrastructure development (Box 22).
Box 22 – Romania: Component 10 – Local Fund
A key element of reforms and investments is sustainable urban mobility. This goal can be achieved through strategies and guidance on urban mobility planning, changes in zoning regulations to limit the use of cars, enforced service standards on public transport. Supporting investments include urban air quality monitoring systems, zero emission transport fleets and intelligent transport systems for administrative territorial units.
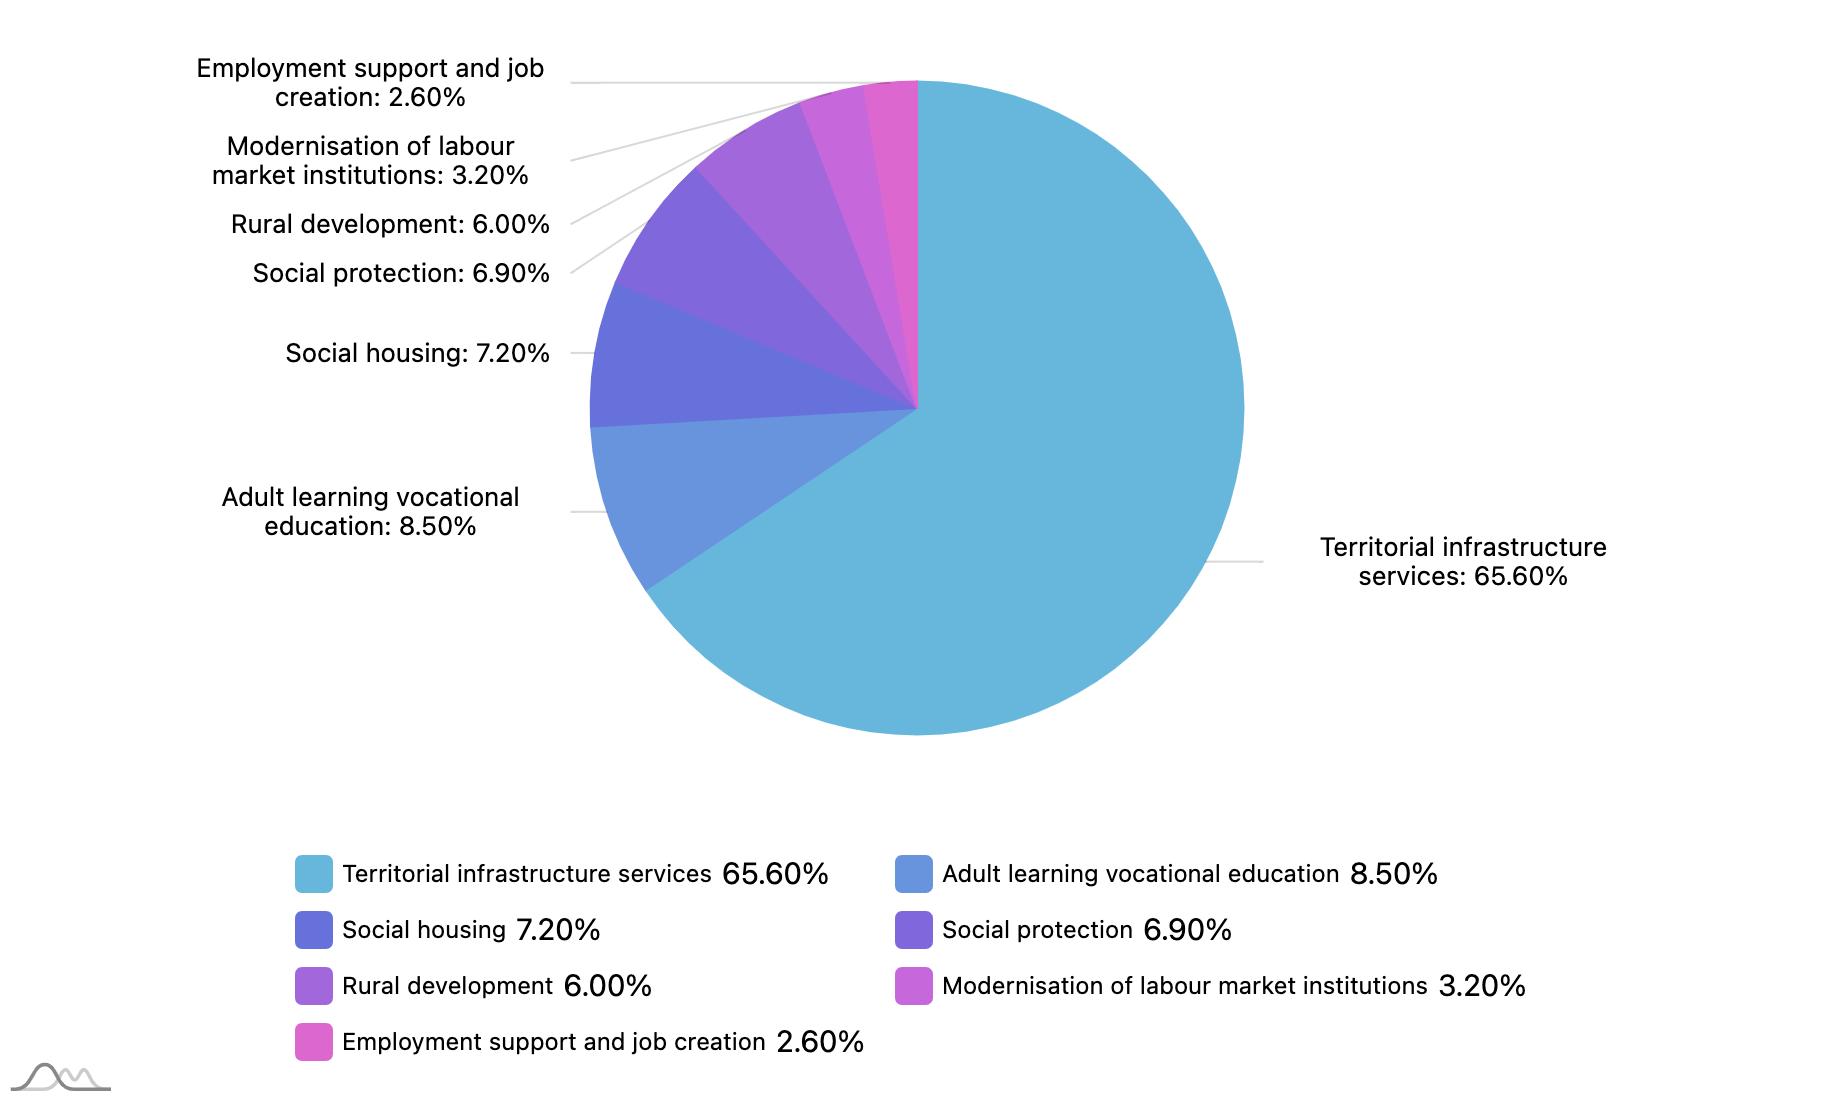
Source: ANNEX to the Proposal for a Council Implementing Decision on the approval of the assessment of the recovery and resilience plan for Romania {SWD(2021) 276 final}
Examining the expenditure on territorial infrastructure and rural development together, these policy areas are most prevalent among the four countries with federal structures (Austria, Belgium, Germany and Spain). Diverse projects have been planned, such as the expansion of broadband coverage in Austria as part of rural development policy. In the less decentralised countries – where subnational government expenditure is less than the 20% threshold in general government expenditure – expenditure on territorial infrastructure and rural development was high in Malta, Slovakia, Cyprus, Greece and Ireland. In these countries, the RRF funding will presumably be of greater benefit to the national government programmes.
Local Finances and the Green Transition 64 A DECADE OF LOCAL FINANCES: TWO CRISES AND THE INTERVENING PERIOD
FIGURE 32 SOCIAL AND TERRITORIAL COHESION PILLAR: EXPENDITURE BY POLICY AREA
FIGURE 33 TERRITORIAL INFRASTRUCTURE, RURAL DEVELOPMENT AND DECENTRALISATION
In Latvia, the RRF grants will finance its territorial administrative reform, which was initiated in 2021 (Box 23).
Box 23 – Latvia: Reducing inequalities through administrative territorial reform
As part of administrative territorial reforms, a new municipality law introducing additional functions and improved governance is scheduled to enter into effect by the end of 2023. Under this new institutional framework, the planned investments will go towards improving the network of regional and local roads and strengthening municipal operational capacities. Programmes will be launched aimed at establishing industrial parks in the regions, providing affordable housing, promoting high quality education by investing in general secondary education and related local infrastructure, purchasing zero emission public transport vehicles at local level and supporting access to public services and employment for people with disabilities.
Source: ANNEX to the Proposal for a Council Implementing Decision on the approval of the assessment of the recovery and resilience plan for Latvia {SWD(2021) 162 final}
TABLE 8 RRPS ON TERRITORIAL COHESION
The plan effectively contributes to enhancing territorial cohesion
To a large extent 8.3%
To a limited extent
Not at all
Do not know/ No opinion 20.8%
A survey of local government associations in 19 countries indicated that local and regional governments are not satisfied with the national plans on territorial cohesion (Table 8). An overwhelming majority of the respondents stated that the National Recovery and Resilience Plans do not contribute at all or only to a limited

Local Finances and the Green Transition 65 A DECADE OF LOCAL FINANCES: TWO CRISES AND THE INTERVENING PERIOD
54.2%
16.7%
Total 100.0%
extent to the enhancement of territorial cohesion. It is also striking that one-fifth of the associations did not know or had no opinion regarding this critical territorial aspect of recovery.
Health and resilience
Health care services (48%) and effective public administration (30%) represent the main expenditure areas of the pillar on health, and economic, social and institutional resilience (Figure 34). The remaining eleven policy areas account for only 22% of spending under this pillar. The policy areas targeted are quite broad and range from crisis preparedness and crisis reaction capacity to financial sector reforms and fraud prevention.
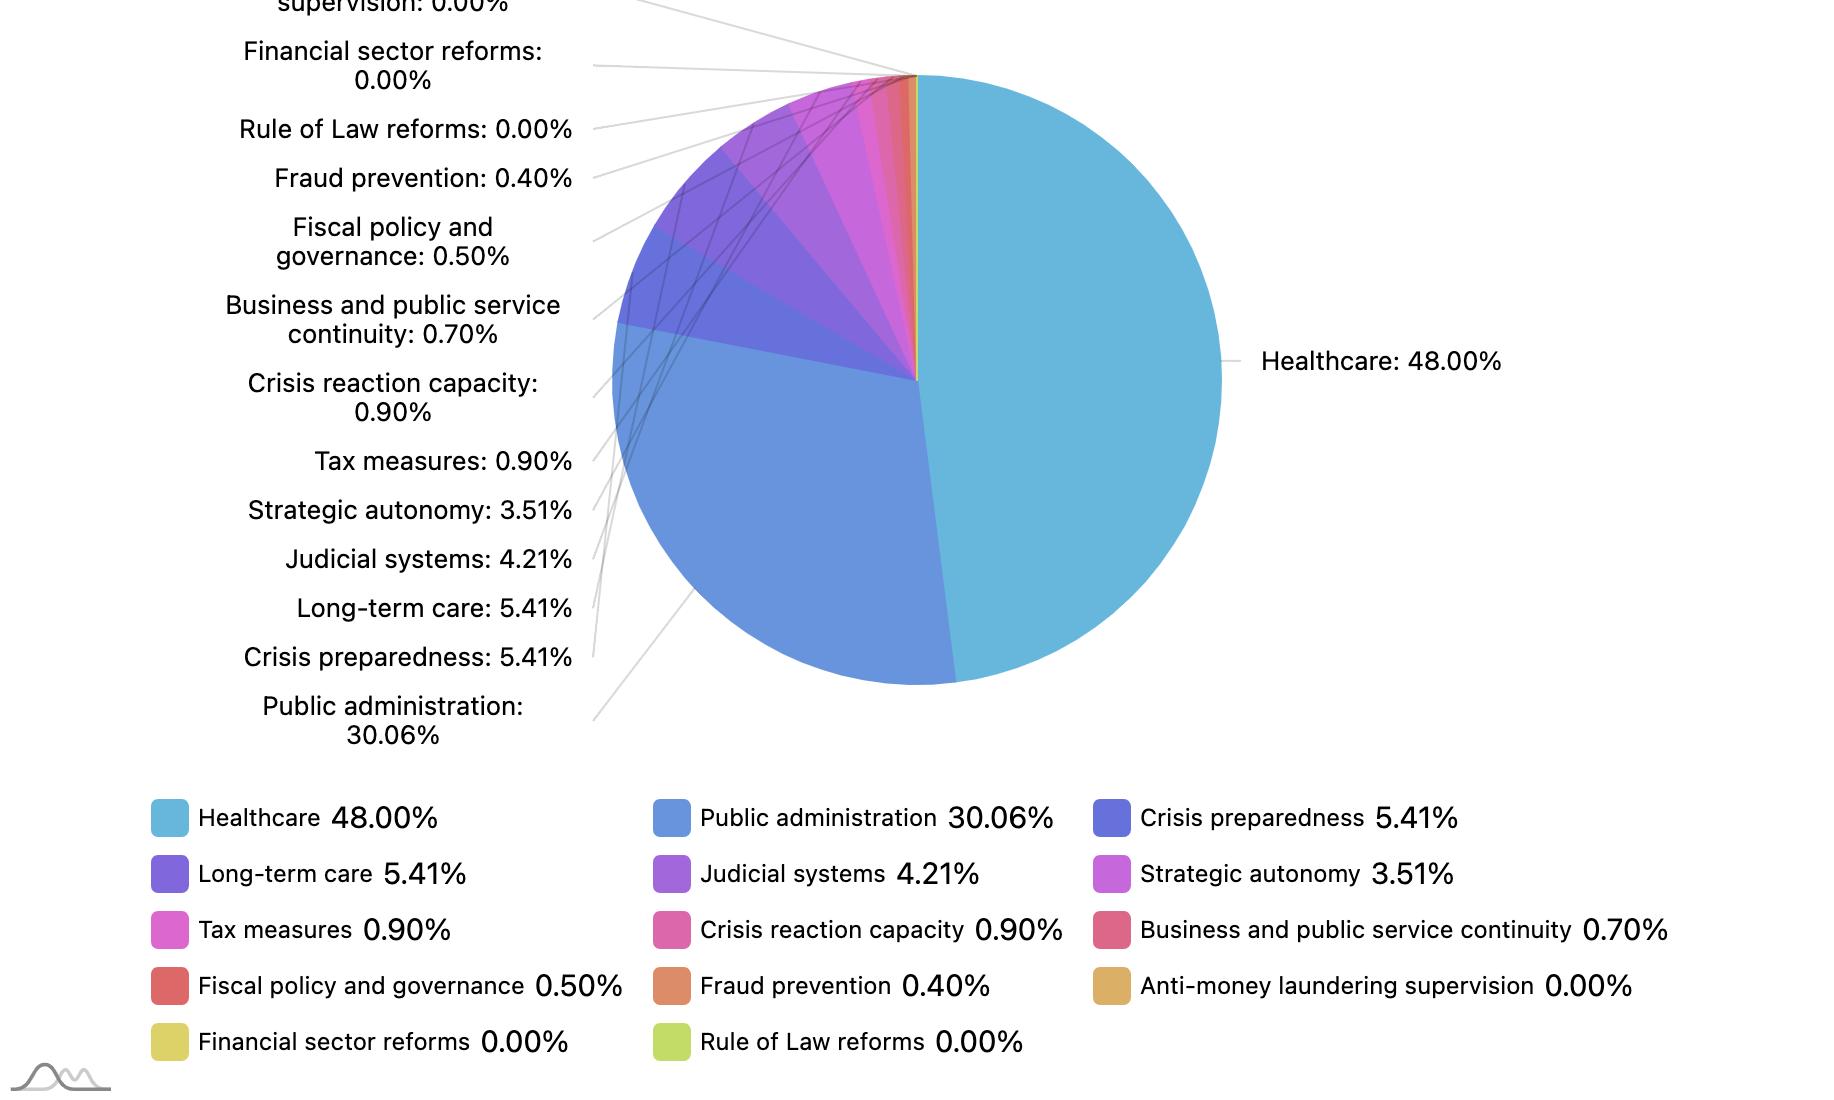
RRF funding for health care, which accounts for almost half the spending under this pillar, represents a large share, with significant local implications in countries where it is a local government function (e.g. Estonia, Latvia, Finland, Romania). In others, however, even though they have similarly extended subnational health functions, the impact of the RRF grants will be felt to a greater degree at the intermediary tier local governments (Italy, Denmark, Austria).19
Austria has developed diverse programmes to strengthen subnational (regional and municipal) resilience (Box 24).
19 See the CEMR TERRI Report on local and regional government health care spending: https://terri.cemr.eu/en/the-analysis/local-public-healthcareresponsibilities/local-and-regional-healthcare-spending.html
Local Finances and the Green Transition 66 A DECADE OF LOCAL FINANCES: TWO
AND THE INTERVENING PERIOD
CRISES
FIGURE 34 HEALTH AND RESILIENCE PILLAR: EXPENDITURE BY POLICY AREA
Box 24 – Austria: Interventions for increased subnational government resilience
Several specific reforms and investments have been proposed under Austria’s national recovery and resilience plan that will involve both regional (Länder) and municipal governments. The reforms target a broad range of issues and include: devising a roadmap for Austria’s soil protection strategy, which sets a specific target to reduce land use, improving long-term care provision and developing a target-based fiscal framework at all government tiers legislated by the intergovernmental fiscal relations act (“eco-social tax reform”). Examples of investments are thermal refurbishment projects, connections to high-efficiency district heating, recycled brownfield land projects for climate-friendly town centres and community nursing pilot projects.
Source: ANNEX to the Council Implementing Decision on the approval of the assessment of the recovery and resilience plan for Austria, 2021/0162 (NLE)
Policies for the next generation
Three levels of education (74% of total grants), early childhood education and care (14%) and youth employment (12%) make up the majority of grants under the next generation pillar, ensuring its local significance. Among the countries with decentralised public education, namely Lithuania, Czech Republic and Croatia (see Box 25), Slovenia and France that will benefit more from the next generation grants (Figure 35). Countries with a low next generation pillar grant ratio but a high local education budget share are Slovakia, Estonia, Latvia, Finland and two of the federal countries (Austria, Germany). As the next generation grants in these countries will mainly target the tertiary (higher) education level, their local governments will benefit less from these RRF grants.
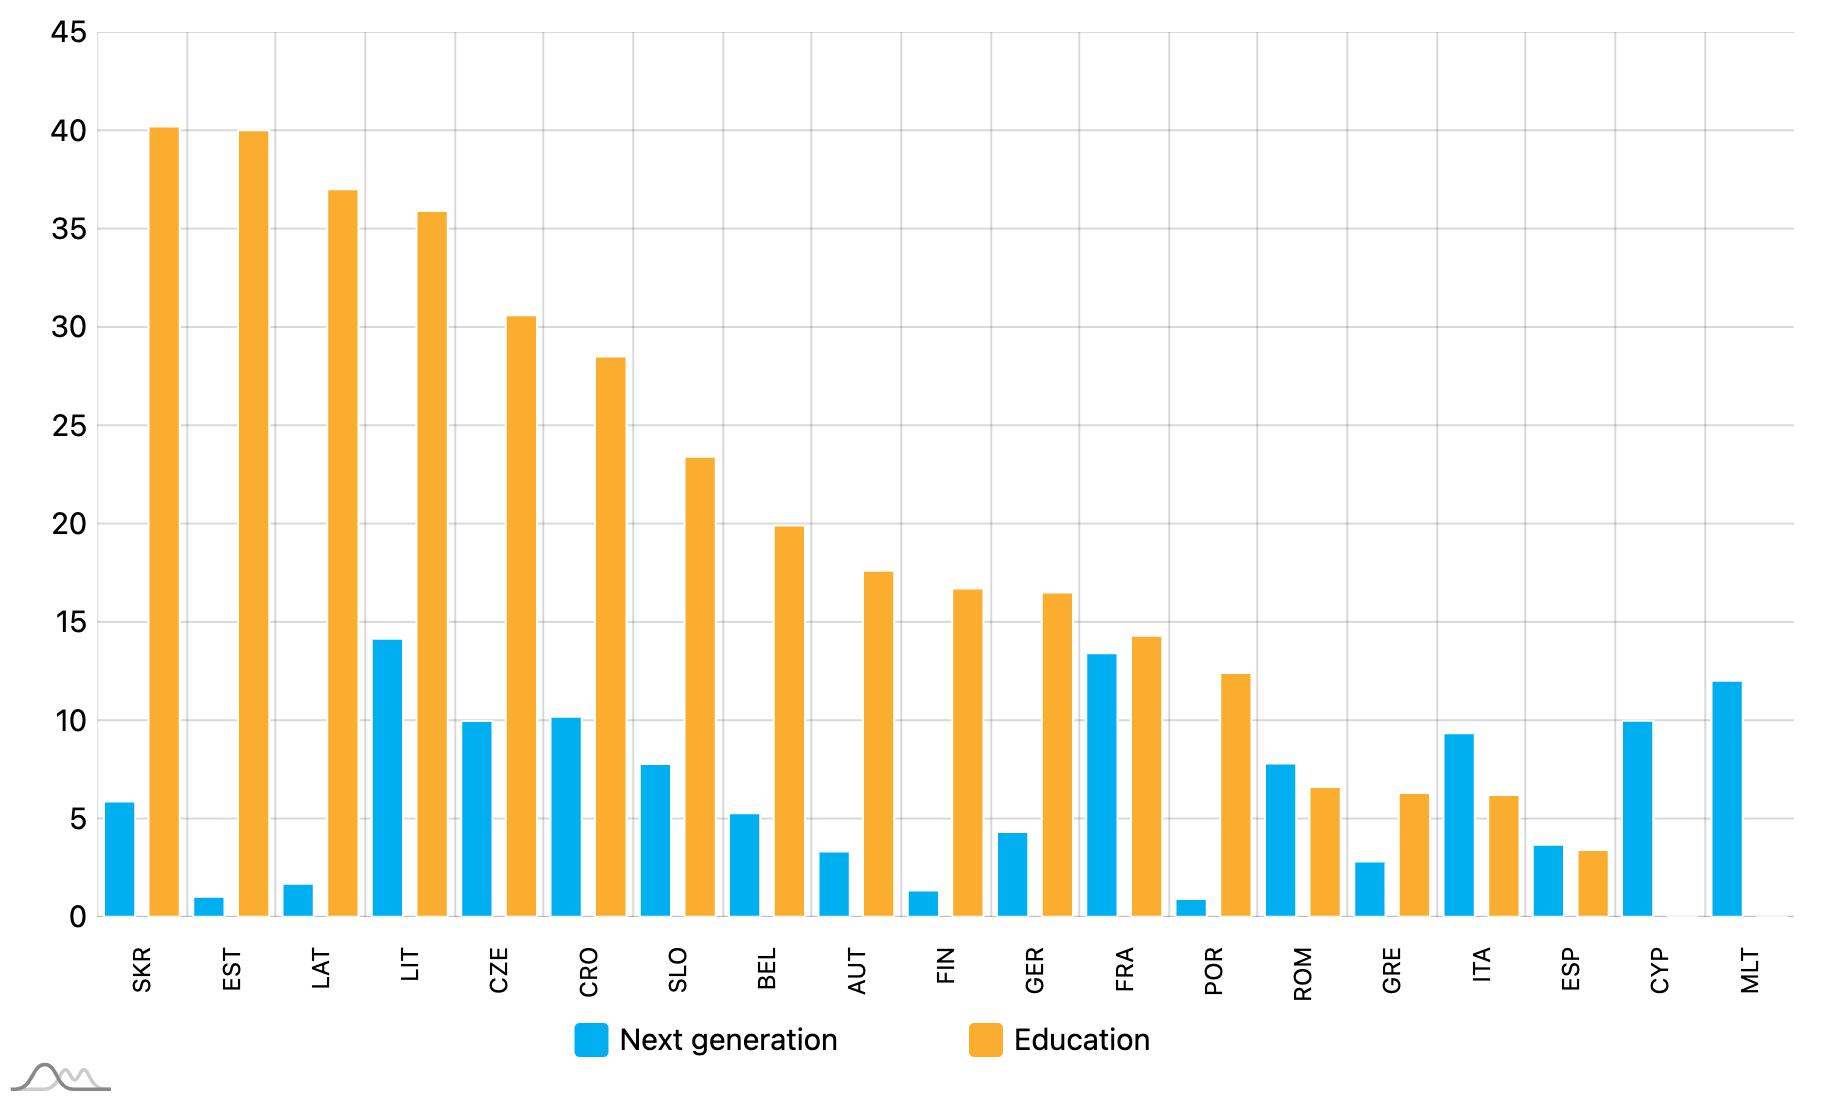
Local Finances and the Green Transition 67 A DECADE OF LOCAL FINANCES: TWO CRISES AND THE INTERVENING PERIOD
FIGURE 35 RATIO OF NEXT GENERATION GRANTS AND SHARE OF EDUCATION EXPENDITURE IN LOCAL BUDGETS
Box 25 – Croatia: Reform of the educational system
Planned reforms of local significance target the model for financing of Early Childhood Education and Care (ECEC), the introduction of full-day teaching and a secondary education needs assessment. Investments will go towards increasing ECEC places, the number of primary one-shift primary schools and the attendance in general secondary schools.
Source: ANNEX to the Proposal for a Council Implementing Decision on the approval of the assessment of the recovery and resilience plan for Croatia {SWD(2021) 197 final}
Grants by thematic area
RRF grants already allocated include a total of EUR 26.7 billion for clean energy and EUR 41.8 billion for digital public administration.20 Many clean energy programmes target the decarbonisation of energy systems in light of the fact that energy consumption produces 75% of greenhouse gas emissions. The use of renewable energies, combined with alternative sources (e.g. hydrogen) will impact many services provided by local governments, including transport, heating and buildings. The RRF will also concentrate on infrastructure network development and supporting reforms in this area.
The digital public administration programmes cover all aspects of e-governance (health care, justice) and, from a climate perspective, the digitalisation of transport and energy systems. Reforms in these areas aim to integrate service platforms, data management, analysis and decision making. Investments target the technologies supporting these programmes.
No specific pattern has been detected regarding the relationship between decentralisation and RRF expenditure on clean power (Figure 36). Greece, Italy, Cyprus and Croatia are the highest spenders (per capita) on clean power, but the role played by local governments in the public sector in these countries varies greatly, which influences grant distribution and significance. It can be assumed that local governments will benefit more from clean power programmes in the more decentralised countries such as Italy, Croatia, Lithuania and Spain. However, in other decentralised countries (Germany, France and Austria), where spending on clean power programmes is relatively low, the higher government tiers are likely to be the main beneficiaries of the RRF grants. 20 Source: https://ec.europa.eu/economy_finance/recovery-and-resilience-scoreboard/thematic_analysis.html?lang=en
Local Finances and the Green Transition 68 A DECADE OF LOCAL FINANCES: TWO CRISES AND THE INTERVENING PERIOD
National plans from LRGs’ perspective
The active planning of the Recovery and Resilient Facility programmes at the national level has a significant impact on services and finances at the local and municipal levels. The inclusion of local and regional governments during this development phase is therefore vital. Two European organisations, the Committee of the Regions (CoR) and CEMR, therefore conducted a survey of subnational governments on their involvement and appraisal of the approved national plans.21 The responses from 19 EU countries (25 local and/or regional government associations) highlighted the need for more consultation of local governments, although national government practices did differ widely across the continent.
TABLE 9 RRP RESPONSIVENESS
The plan effectively responds to the key challenges faced by local and regional authorities
To a large extent
To a limited extent
An overwhelming majority stated that the national RRF plans effectively respond to the key challenges faced by local and regional authorities “to a limited extent” (75% of respondents). Only 8% of the respondents believed that their objectives were incorporated into the reform and investment plans (Table 9).
According to the local governments surveyed, the main goals of the Recovery and Resilience Facility were reflected in the national plans (Table 10). In line with the spending priorities, the digital and green/ sustainability transition did receive the most support. Local governments could benefit a lot from successful programmes in these fields. However, the locally important territorial cohesion dimension of the RRF was assessed as being the least effective one.
21 CoR-CEMR Consultation on the Implementation of the Recovery and Resilience Facility at Regional and Local Level: https://ec.europa.eu/eusurvey/ runner/CoR-CEMR_RRF_Consultation2022
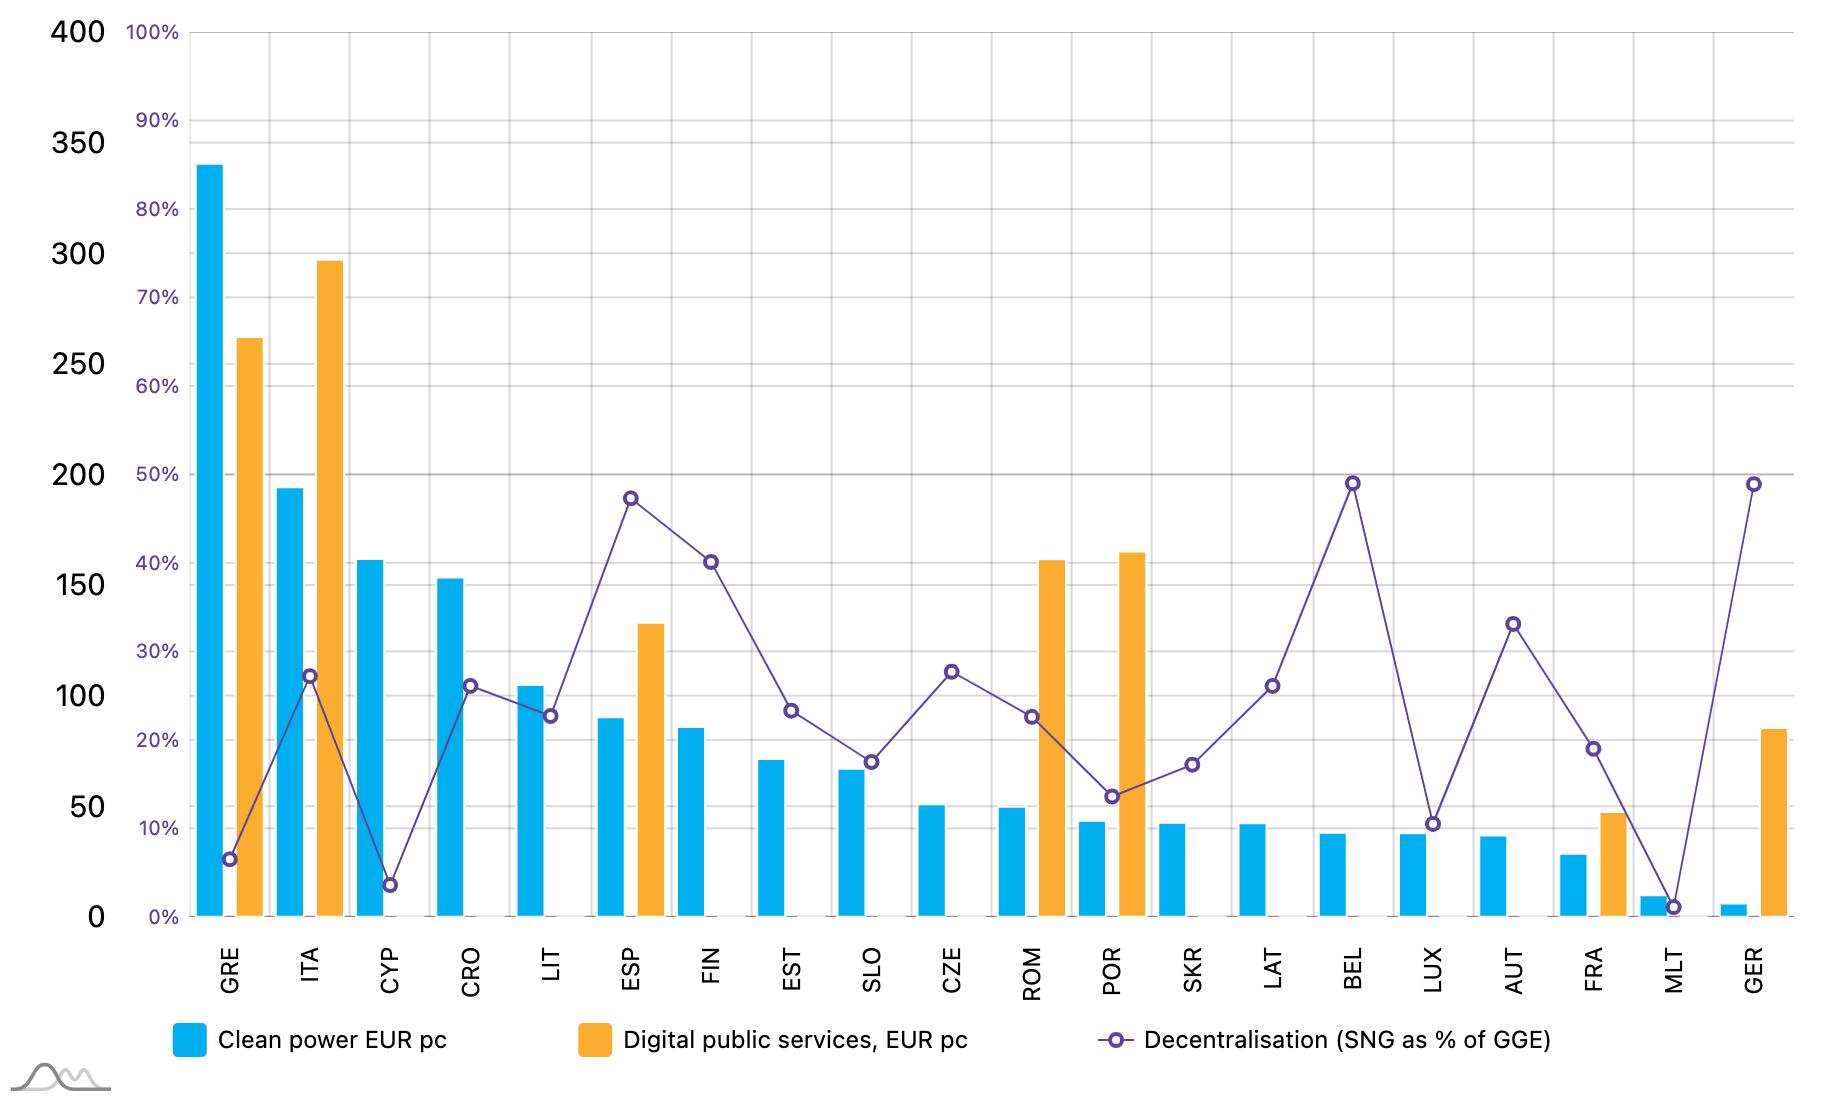
Local Finances and the Green Transition 69 A DECADE OF LOCAL FINANCES: TWO CRISES AND THE INTERVENING PERIOD
FIGURE 36 CLEAN POWER, DIGITAL PUBLIC SERVICES AND DECENTRALISATION
8.3%
75.0%
4.2%
Not at all
100.0%
Do not know/ No opinion 12.5% Total
TABLE 10 ASSESSMENT OF THE RECOVERY AND RESILIENCE PLANS
Question: To what extent do you agree with the statements [above] regarding your country’s National Recovery and Resilience Plan? To a large extent: 3; To a limited extent: 2; Not at all: 1
Evaluation and monitoring
During the preparatory stage, the national recovery and resilience plans were assessed by the Commission in accordance with general evaluation criteria. The standards used were those set by the RRF regulations: relevance (comprehensive and balanced measures), effectiveness (lasting impact, effective monitoring), efficiency (reasonable justification of cost efficiency) and coherence of actions. A specific rating was used to categorise to what extent the national plans aligned with these criteria (large (A), moderate (B), small (C)).
In addition to the general evaluation criteria, the RRF regulations also specified other elements adding new aspects of assessment: the lasting impact of measures, milestones and targets that allow for the monitoring of progress, respect for the “do no significant harm” principle. The national plans also need to provide adequate control and audit mechanisms.
The progress of resilience and recovery plans’ implementation is reported on a public RRF scoreboard. It not only provides updates regarding the financial contributions and disbursements but indicates the extent of fulfilment of the reforms (milestones) and investments (targets). A set of 14 common indicators is also measured. Social expenditure is also assessed by labelling expenditure according to nine dimensions linked to broad social categories in employment, education, health care and social policies.
The role of local and regional governments
According to the guidance issued to Member States regarding the national RRPs, local authorities should be consulted and involved in the RRF process, during the development of plans and in the monitoring of its implementation. The RRF regulations also call for coordination and complementarity of programmes and instruments between various tiers of governments, with an emphasis on the regional levels, where appropriate. Otherwise, local governments are rarely mentioned in the RRF regulations or guidance methods.
The LRG associations reported on the extent to which local governments were involved in the various stages of planning and preparing the national RRP (Table 11). The majority of respondents stated that they had only been informed about the overall process (40%), while approximately one-third were consulted (mostly with limited impact on the outcome). They were informed about the overall priorities of the national plans (44% of the respondents) but not consulted on these objectives (which only occurred with 16%).
Specific aspects of the national programmes were developed without input from the local governments. A majority of them responded that they had not been involved at all (or did not know/did not respond) in the identification of reforms (56%) or investments (52%). The critical elements of the planning process, such as coordination, validation and timelines, were also decided without local governments (56%); they were only informed about the governance aspects (28%).
Local Finances and the Green Transition 70 A DECADE OF LOCAL FINANCES: TWO CRISES AND THE INTERVENING PERIOD
The plan effectively… Average score ... supports the digital transition 2.29 ... supports the green/sustainability transition 2.27 ... responds to the key challenges faced by local and regional authorities 2.05 ... coordinates recovery funding with other sources of funding, notably EU funds 2.00 ... supports cross-border initiatives with European added value 1.91 ... contributes to enhancing territorial cohesion 1.89
TABLE 11 LOCAL GOVERNMENT INVOLVEMENT IN PREPARING THE NATIONAL RRPS
Question: To what extent were you or your members involved in your national government’s preparation of the National Recovery and Resilience Plan (NRRP)?
Consulted with impact on outcome, Consulted with no / limited impact: 3; Informed only: 2; Not at all, Do not know / No answer:1
Future of local monitoring
As important actors affected by the national plans’ reforms who are also beneficiaries of RRF-funded investments, local and regional governments should have a say in the RRF’s implementation. According to the survey, local governments and their associations play a rather limited role in RRP implementation. Using a three-point-scale, they were overlooked when it came to appropriate roles, being a full partner of the national government and taking on considerable local ownership of the plans or projects (average score: 1.50, see Table 12).
Results can be considered slightly more favourable with respect to making use of local governments’ specific powers (1.65) and exercising local influence on any potential changes to RRPs (1.67). Dialogue and information exchange with the national government on implementation mechanisms and procedures scored the highest (1.82). Nonetheless, all these aspects of implementation are far from the ideal for local government participation; the average level of involvement is low, not even reaching the level of “limited extent” (the median score).
TABLE 12 IMPLEMENTATION OF THE RECOVERY AND RESILIENCE PLAN
You/your members
...undertake dialogues and receive timely and exhaustive information from the national government regarding procedures and implementation mechanisms
… have the possibility to suggest changes to implementation of plans to adapt to unforeseen changes 1.67
...are sufficiently taken into consideration in implementing the plan, on the basis of your specific competences/responsibilities 1.65
...have considerable ownership of the plan and any projects it contains 1.50
...are a full partner of the national government in the implementation phase 1.50
...have an appropriate role in monitoring the results of reforms and investments and the achievement of targets and milestones under the national plan
1.50
Question: Turning to the implementation phase, to what extent do you agree with the following statements? To a large extent: 3; To a limited extent: 2; Not at all: 1
Implementation of the European Commission’s planning and monitoring principles can only be properly assessed through the collation of country-specific information and comprehensive surveys after two to four years. The joint CEMR-Committee of the Regions survey helps in analysing the way in which the different national RRF plans responded to key local challenges, the extent to which they enhanced territorial cohesion,
Local Finances and the Green Transition 71 A DECADE OF LOCAL FINANCES: TWO CRISES AND THE INTERVENING PERIOD
Consulted Informed only Not at all, do not know 3 2 1 Overall process 32.0% 40.0% 28.0% Definition of the overall priorities and objectives of the NRRP 16.0% 44.0% 40.0% Identification of specific investments 32.0% 16.0% 52.0% Identification of specific reforms 28.0% 16.0% 56.0% Governance of the process 16.0% 28.0% 56.0%
Average score
1.82
worked in coordination with other EU funds and supported the RRF priorities from the point of view of LRGs. Areas that receive unfavourable assessments should be the focus of future evaluations and amendments.
As the above analysis of RRF grants has shown, the local dimension of recovery and resilience plans should be evaluated primarily by countries. The policy areas or the main pillars of the national plans need to be aligned with local and regional governments’ functions. LRGs are best suited to quantify the local relevance of investments and reforms implemented under the various RRF pillars.
Domestic data on RRF implementation will be limited, as noted in a survey of national RRPs: “…68% of countries committed to proactive publication of information about RRF implementation … only two countries (Cyprus and Romania) actually mentioned providing accessible, open data on their spending… and only two countries promised to publish full information on final recipients (Bulgaria, Romania)”.22
Regardless, any comprehensive evaluation of the six pillars will always prove complicated as the expenditures very often serve multiple purposes. Horizontally, actions can overlap across pillars and/or policy areas.
In the future, it will be possible to measure the actual implementation of the recovery and resilience plans more effectively by using the national disbursement reports. The financial statistics in these country reports will shed light on whether the expenditure targets mainly serve local or regional governments and how the original objectives were achieved. To supplement RRF evaluations with comprehensive reports including the local and regional dimensions, the core data used by the Commission, and not only aggregate ratios, should be made publicly accessible.
Local Finances and the Green Transition 72 A DECADE OF LOCAL FINANCES: TWO CRISES AND THE INTERVENING PERIOD
22 Open Spending EU Coalition: https://www.open-spending.eu/
8. Conclusions and recommendations
The objectives of this CEMR report were to evaluate (i) local finances over the past decade, framed as they were by two major crises, and (ii) how local and regional government investments can contribute to this century’s main challenge: climate change.
After the economic downturn of 2008-2009, general government finances and various public sector mechanisms operated under unusual pressure. They had to be overhauled in a restrictive fiscal climate, despite the fact that such systemic changes can only be implemented at a slow gradual pace.
A comprehensive evaluation of local activities and the role played by subnational governments during the 2010-2020 period is difficult for two reasons:
• CEMR countries are quite heterogeneous, with very different levels of economic development and varying degrees in their scope of decentralisation.
• Another constraint is that local government systems could only be assessed using the limited comparable fiscal data available at the national macro level. The very essence of decentralised actions could not be adequately studied owing to a lack of territorial data and information focused on the work of local and regional governments.
Despite these impediments, some lessons can be extrapolated on the key areas of local finances and their connection to climate change. These conclusions from our data analysis and the recommendations are intended for both policymakers within the national governments and the many stakeholders shaping subnational, European or international programmes.
Responding to the two crises: from cooperation and partnership to coordinated actions
At the beginning of the past decade, major financial and institutional reforms were hindered by the slow economic recovery and stagnation that followed the 2008-2009 global crisis. Pressure to respond to the issue of climate change also increased, both at national and local government levels. The resulting actions for climate change adaptation and mitigation were gradually incorporated into national programmes and local government actions.
One key lesson from the first economic downturn is that effective responses to the crisis require new forms of cooperation among various government actors and also between the public sector and private entities.
By the end of the 2010s, more favourable economic conditions supported balanced development. Local government reforms, the modernisation of public decision making through greater transparency and improved local accountability and fiscal decentralisation efforts all started to produce results in service efficiency.
These positive trends in development and democratisation were abruptly put on hold by the pandemic in 2020. This new crisis not only led to human losses and drastic economic changes but transformed the demand for public services and increased the role of local and national governments as well. These economic and fiscal policy responses were different from the reactions to the previous economic crisis a decade earlier. This time, more coordination was needed with intensified national government actions (OECD, 2020). At this stage, it is still too early to fully take stock of the long-term consequences of these interventions and looser fiscal policies. Local and regional governments were faced with a dual challenge throughout the period under study. They had to cope with the long aftermath of the 2008-2009 economic and financial crisis, followed by the sudden shock of the pandemic with its scissors effect (demand for increased expenditure amidst a decrease in revenue from taxes and transfers). All the while, local governments continued to gradually develop their climate change adaptation capacities and mitigation measures.
Local Finances and the Green Transition 73 A DECADE OF LOCAL FINANCES: TWO CRISES AND THE INTERVENING PERIOD
The two tasks of crisis management and environmental risk mitigation are interconnected. They both strongly need new forms of coordination between government tiers, improved service management methods, additional and restructured investments, adjustment of local revenue to changing requirements, better administration capacities, modified planning and improved budgeting practices.
Local impact of economic regulations
After the 2008-2009 economic downturn, subnational governments were subjected to their national austerity policies. These governmental actions targeted the entire public sector, primarily the budget sphere. Overall, the CEMR countries provide a wide range of welfare and administrative services: general government expenditure averages 42-45% of GDP. Setting aside this average, the share in total government expenditure can vary significantly, from 35 to 50% depending on a country’s level of development and its public sector traditions. Local governments are responsible for a substantial part of their country’s government functions (25% on average in the CEMR countries).
As evidenced by the macroeconomic data analysis, public spending was limited by strict budget constraints in the first few years after the economic crisis. This resulted in serious limitations on local spending and municipal borrowing. Any changes to economic and fiscal policies affect the local scope of manoeuvre.
Austerity measures should be proportional to the fiscal weight of subnational governments, legislated for all government entities in general and introduced in a straightforward and transparent way.
Towards the middle of the decade, budget conditions gradually normalised, although there were striking differences between CEMR member countries. A high level of diversification in government functioning overall can have a bearing on decentralisation prospects. Countries with a larger than average public sector are better placed to devolve more services to subnational governments and expand decentralisation programmes. This objective condition should be taken into account in decentralisation policy design.
In 2020, the first year of the pandemic, all economies contracted. In contrast to the earlier economic crisis, several active fiscal instruments (wage subsidies, special spending programmes, tax reductions) created a more favourable financial environment for the government sector.
Active fiscal policies financed through increased borrowing and higher general government debt affect the future of subnational government budgets and the local capacity to invest in the green and digital transition. These overall fiscal conditions should not augment the risk of fiscal re-centralisation.
Managing administrative-territorial reforms
There is a wide array of subnational government configurations in the CEMR countries. They can differ in the following: (i) constitutional form (whether they are federal or unitary countries); (ii) number of elected government tiers (two or three) and (iii) population size of subnational government units (fragmented or amalgamated models).
During the past decade, several CEMR countries have implemented administrative-territorial reforms and decreased their number of first tier governments. The stated aim was to improve municipal service efficiency by establishing larger territorial units. Citing economies-of-scale, this rationale was used to promote municipal mergers and comprehensive local territorial changes. It will only be possible to evaluate their actual impact on service efficiency and local finances after some time has passed. Larger administrative units mean more influential local governments with improved service efficiencies. Mergers of first tier local governments were also sought out in response to an increase in regional differences
Local Finances and the Green Transition 74 A DECADE OF LOCAL FINANCES: TWO CRISES AND THE INTERVENING PERIOD
over the past decade. Measuring the differentiation using a ratio of the highest and lowest GDP per capita of the basic regions (NUTS2) showed an increase from 2.37 (2010) to 2.46 (2020) on average in the 36 countries studied.
These administrative-territorial reforms have been implemented over a longer period than the one under study. Similarly to all other decentralisation efforts, they are highly political actions (Boex et al., 2022). The decadelong preparatory processes were precipitated by the crisis and economic fallout.
Highly political territorial-administrative changes are generally initiated under favourable economic conditions, but implementation of structural reforms usually only follow once any financial shocks subside.
Balanced central-local relations support more collaboration in a multi-tier government system (Smoke-Cook, 2022). Large and autonomous local governments tend to be more experimental with their climate change actions, which can then be transposed into national (or even European) policies. A proper intergovernmental system provides options for assessing governmental climate actions. Implementation of climate-related policies can be made more effective by ensuring that all the critical local-regional conditions (regulatory powers, planning practices, capacities, collaboration mechanisms) are taken into account.
Administrative-territorial reforms also increase the effectiveness of climate change mitigation actions.
Diverse expenditure assignment influences economic recovery
There are strong arguments for establishing local governments with extended public functions and the corresponding administrative fiscal powers (Martinez-Vazquez, 2021). First, decentralisation improves the public service performance of responsive and accountable service providers. Larger local governments with broader powers benefit from economies-of-scale in service management and are able to incorporate externalities to deal with free riders. However, traditional national government tasks, such as economic stabilisation and fiscal policies for debt management, may be hampered by wide-ranging decentralisation.
Over the past decade, subnational governments have slightly increased their financial weight in general government expenditure (from 25% in 2010 to 26% by the end of the decade). However, the CEMR countries have generally used very different roadmaps in following a path towards or even away from decentralisation. One group of countries supported subnational governments, which led to their higher share in overall government spending, while others followed radical centralisation policies. The more decentralised countries experienced an increase (or lower cuts) in subnational spending in contrast to the more centralised ones, where subnational governments lost some of their spending powers. The devolution of public services and administrative-territorial structures influences in turn any decentralisation policy objectives and methods.
Countries with more devolved government structures continued to decentralise further, while others with lower subnational spending often remained anchored to centralisation policies. Any transfer of decentralisation methods and exchange of best practices in service management should therefore also bear in mind this possible path dependency in countries with different local functions and municipality sizes.
The more decentralised CEMR countries bear greater responsibilities in providing human and social services such as education and health care. Local governments with extended functions are capable of more successfully exercising their planning and coordination functions, regulatory powers and human capacities. They can also manage spillovers more effectively through cooperation (e.g. in water services). Even though these often strictly local public services cannot supplant national government environmental protection actions for the restructuring of energy production and decarbonisation, they can effectively work as useful adjuncts.
Local Finances and the Green Transition 75 A DECADE OF LOCAL FINANCES: TWO CRISES AND THE INTERVENING PERIOD
Under more centralised structures, local governments only manage the core administrative functions as well as the key public utilities and municipal services. In these cases, the basic public services where local governments can have an impact on climate change are the following: municipal transport services, solid waste management, housing, public lighting, etc. Accordingly, their impact on climate change will inevitably be more limited.
The scope and form of decentralisation, as basic determinants, have shaped the responses to the two crises and will be influential in managing climate change successfully.
Local capital investments matter
On average, a significant part (40%) of total capital expenditure is managed locally, even though this capital expenditure represents only a minor share in subnational budgets (15-18%) in the CEMR countries. The ratio of local and regional government capital expenditures in general government expenditure increases according to the scope of decentralisation. However, there are also cases of less decentralised CEMR countries that were able to enhance the local share in total government capital expenditure during the past decade, whereas in other similar countries, the subnational governments lost capital investments.
Subnational governments have the powers to manage capital expenditure in several areas that are typically devolved functions and which also fall under the climate and environmental objectives of the EU Taxonomy regulation. As a result, local government green capital investments are especially prevalent in three COFOG service areas: housing and community amenities (88%), environmental protection (74%) and economic affairs (50%).
The specific cases presented in this study demonstrate the diversity of local government planning and regulatory responsibilities. Local governments well suited to developing local environmental risk management strategies as well.
Subnational government capital expenditure is mainly driven by national investment programmes and grant schemes. Nonetheless, there is a great deal more that local governments can do to better the environment beyond investments in municipal services.
Local revenue autonomy for crisis management and pollution control
Subnational governments control a significant share of taxes in the more decentralised Scandinavian and federal countries. Interestingly, countries with higher local tax revenues increased the weight of local taxes further. In comparison, other countries with lower local tax shares seemed disinclined to extend their ownsource revenue raising powers.
Two typical local tax models characterise the CEMR countries. They are either dominated by income (personal, profit) taxes or by taxes on property (land, buildings). The more decentralised countries rely on personal income-based taxes. This revenue is primarily shared, allocated using various methods (origin-based, surcharges or formulas) between the national and the local (or regional) government budgets.
Over the past decade, the grant dependency ratio has changed but no general pattern has been discernible. Increases or declines in the share of national budget transfers can be explained by various country-specific factors: overall budget restrictions, radical centralisation or changes in national tax policies. These national grants and budget programmes often target local environmental investments and the improvement of service management.
Local Finances and the Green Transition 76 A DECADE OF LOCAL FINANCES: TWO CRISES AND THE INTERVENING PERIOD
In the CEMR countries, responses to the fiscal challenges of the economic crisis tend to follow the pattern of revenue decentralisation in place in a given country.
During the post-2009 crisis period, local tax systems unsurprisingly did not undergo any significant transformations. The most decentralised CEMR countries relied predominantly on income-based local taxation. In the countries where the local tax burden on businesses and production decreased, local taxes shifted towards property taxation. Countries that moved away somewhat from property taxation experimented either with income-based taxes or taxes on products.
A broad revenue base and convergence of local tax systems make local budgets more stable and financially resilient to withstand economic fluctuations.
Subnational tax autonomy is determined by a local government’s power to levy and collect taxes. Tax autonomy can be increased by allocating powers over setting tax rates and reliefs to local and regional governments. In countries with tax sharing schemes, the method of resource split needs to be stable and predictable to increase revenue autonomy.
Local revenue-raising autonomy is essential to regulating polluting activities. Local taxes, charges, levies and other revenue-raising options all have an indirect impact on the climate. They affect water management, forms of transport, land use and urban planning to minimise disaster risks and reduce pollution.
Borrowing is generally a minor source of local budget revenue in the CEMR countries. Subnational debt issue is determined by the borrowing capacity and creditworthiness of the general government. Due to regulated borrowing procedures at the EU and national levels, accumulated local debt in the CEMR countries is kept below 4% of GDP. In the federal countries, regional governments have a higher own-source revenue base and could thus borrow more actively (their debt ratio reached over 15% of GDP). During the past decade, local governments have often used loans to co-fund EU grants and finance capital investments in environmental services. They also experimented with green bond investments targeting environmental and climate change actions.
Subnational government loans are essential to finance capital investments. Local debt issue should be regulated by a general control mechanism that reflects the dynamic status of local creditworthiness and leaves limited discretion to the higher government tier.
Public Financial Management
To supplement the present data analysis, select PFM issues on the overall quality of fiscal rules, budget openness and accountability have also been addressed. The level of decentralisation or economic development has been shown to be connected to various aspects of budget openness (Open Budget Index, Statistical Performance Indicator) and corruption control (Corruption Perception Index), but is not correlated with the country ranking measured by the Fiscal Rules Index.
The Recovery and Resilience Facility: an opportunity for local governments
Under the RRF allocation criteria, the per capita grant is higher in the newer less economically developed EU member countries. The four countries with strong regional structures appropriated more than 40% of their RRF budgets to climate-related interventions and policy areas.
Local Finances and the Green Transition 77 A DECADE OF LOCAL FINANCES: TWO CRISES AND THE INTERVENING PERIOD
The share of green transition among the main RRF spending areas is higher in the decentralised countries. Stronger local and regional governments can support more recovery and resilience programmes and actions.
Subnational governments in these countries may benefit from the RRF grants in cases where their local functions and competences align with the core RRF pillars. Actions involving typical local functions, such as solid waste management, sustainable water services and other environmental pollution prevention measures represent only 2-4% of total expenditure under Pillar 1 on green transition. The bulk of spending under the social and territorial cohesion pillar is taken up by territorial infrastructure and services, which further bolsters support for increased decentralisation.
Local and regional governments will be directly affected by the planned reforms and they are also often the beneficiaries of RRF-funded investments. Yet, a joint CEMR/CoR survey of local government associations revealed that the majority of respondents had only been informed about the overall planning process but not consulted. This limited of course their impact on planning outcomes and investment selection. To increase local and regional governments’ monitoring capacity over RRF implementation, the core data and not only the aggregate ratios also need to be made publicly accessible.
According to the member associations, the national RRF plans must respond to key local and regional challenges more effectively. Local and regional governments also need to have a say in the monitoring of RRF implementation.
Local Finances and the Green Transition 78 A DECADE OF LOCAL FINANCES: TWO CRISES AND THE INTERVENING PERIOD
References
Boex, J.- Williamson, T.- Yilmaz, S. (2022). Decentralization, Multi-Level Governance and Intergovernmental Relations: A Primer. Washington, DC: Local Public Sector Alliance / The World Bank.
CEMR (2022). Territorial Governance, Powers and Reforms in Europe: Focus on Local Health Care Systems.
CEMR (2021). Uncertainty amidst recovery. 2021 estimates of COVID’s impact on local and regional finances.
CoE (2012). Local government in critical times: policies for crisis, recovery and a sustainable future. Strasbourg: Council of Europe. https://rm.coe.int/16807472af
CoR (2021). Local and regional finances in the aftermath of COVID-19. European Committee of the Regions. Commission for Economic Policy.
Dexia-CEMR (2012). Subnational public finance in the European Union.
European Commission (2012). Report on public finances in the EMU. European Economy 4/2012. Brussels: DG Economic and Financial Affairs. https://ec.europa.eu/economy_finance/publications/european_economy/2012/ public-finances-in-emu-2012_en.htm
European Commission (2019). The European Green Deal, COM(2019) 640 final, Brussels.
European Commission (2021). Strategy for Financing the Transition to a Sustainable Economy. https://eur-lex. europa.eu/legal-content/EN/TXT/?uri=CELEX:52021DC0390
Martinez-Vazquez, J. (2021). Adapting Fiscal Decentralization Design to Combat Climate Change. Climate Governance Papers Series. Washington, DC: World Bank.
OECD (2020). Tax Autonomy Survey: Methodological Guide. OECD Fiscal Federalism Network.
OECD (2020a). The territorial impact of COVID-19: Managing the crisis across levels of government. https://www. oecd.org/coronavirus/policy-responses/the-territorial-impact-of-covid-19-managing-the-crisis-across-levels-ofgovernment-d3e314e1/
OECD (2021), Fiscal Federalism 2022. Making Decentralisation Work. Paris: OECD Publishing. https://doi. org/10.1787/201c75b6-en
Smoke, P., and Mitchell Cook (2022). Administrative Decentralization and Climate Change: Concepts, Experience, and Action. Climate Governance Papers Series. Washington, DC: World Bank
Swianiewicz, P., Gendźwiłł, A., Houlberg, K. and Klausen, J. E. (2022). Municipal Territorial Reforms of the 21st Century in Europe. Oxon-New York: Routledge, Taylor & Francis.
West, K. (2007). Inter-Municipal Cooperation in France: Incentives, Instrumentality and Empty Shells in: Hulst, R.Monfort, van A. (Editors). Inter-municipal cooperation in Europe. The Netherlands: Springer.
Local Finances and the Green Transition 79
Annex 1. Data sources and statistical terms
Eurostat
The current 27 EU member countries (the UK has already been removed from the archives) and some non-EU member countries (Norway, Iceland and certain Western Balkan countries) are covered by Eurostat.
NALAS Fiscal Decentralisation Indicators Report
The Balkan countries and Turkey are included in the routinely published NALAS report on fiscal decentralisation indicators. The national data files were kindly provided by the NALAS Observatory
IMF – Government Finance Statistics
The financial data on Georgia, Israel, Ukraine and the United Kingdom was taken primarily from the IMF’s Government Finance Statistics.
Other international databases used:
(i) World Observatory on Subnational Government Finance and Investment (UCLG-OECD WOFI)
(ii) OECD Government at a Glance database (OECD Statistics)
(iii) OECD Fiscal Decentralisation Database (OECD FDD)
(iv) World Bank Environment Social and Governance Data (World Bank Databank)
The indicators for selected elements sourced from Public Financial Management and Sustainable Development Goals are available on their websites (referenced in the report).
In this report, standard public finance terms and categories are used, listed in detail in the European System of Accounts (ESA2010) and Government Finance Statistics (GFS) manuals.
In budgetary terms, general government encompasses all (subnational and central government) budgets and funds (e.g. social security fund).
Subnational governments have been broken down into two categories: local governments (municipalities, intermediary tier of government including counties, districts, etc.) and regional governments (which is used interchangeably with states, as well as Land/Länder, in reference to Germany and Austria, both federal countries).
The number of subnational governments are from the country sheets of the CEMR publication on Territorial Governance, Powers and Reforms in Europe (CEMR TERRI).
Local Finances and the Green Transition 80
Annex
Annex 2. Troika intervention in Portugal
The global economic and financial crisis in 2008 eventually led to the sovereign debt crisis in Portugal in April 2011. The Portuguese Government requested the support of the troika institutions (the European Commission (EC), the European Central Bank (ECB) and the International Monetary Fund (IMF)) and subsequently agreed to be subject to the terms of an adjustment programme, which led to financial disbursements totalling EUR 78 billion from 2011 to 2014. Municipalities were not direct beneficiaries of these bailout funds, nor were they involved in the negotiations over the package of measures that were adopted, known as the Memorandum.
At central State level, the programme’s main objectives were to reduce public debt and deficit, promote public sector rationalisation and increase competitiveness through structural reforms.
Local governments had to deal with drastic cuts in their revenue, both from the State Budget and from the collection of local taxes. Many municipalities ended up “voluntarily” assuming many responsibilities of the central administration as well.
There were substantial reductions in the funds transferred to local governments from the State budget, along with unusual measures involving the forced consignment of revenue (earmarking), in clear breach of Portugal’s Local Finance Law. The Memorandum imposed reductions in the number of employees, municipal administrative managers, a ban on the hiring of personnel as well as a decrease in the number of organisational units. It also led to considerable restrictions affecting the autonomy of municipal management as well as the creation and operations of local companies. It also imposed an obligation to reduce the number of parishes.
Despite the huge difficulties and challenges for municipalities, this intervention did produce a significant improvement in their fiscal and financial performance indicators:
• Revenue collected by municipalities fell from EUR 8.026 billion to EUR 7.745 billion and spending dropped from EUR 7.872 billion to EUR 7.219 billion;23
• The overall balance (discounting financial assets and liabilities) increased from EUR 243 million to EUR 826 million;
• The weight of local government debt in total general government debt decreased from 3.5% (EUR 6.078 billion) to 2.3% (EUR 5.139 billion);24
• Municipal budget execution on the revenue side rose from 60.5% to 78.7% and from 59.7% to 73.5% on the expenditure side;
• The number of municipalities with an average payment term of more than 90 days (legal limit) decreased from 185 to 68;
• Investment expenses fell from EUR 3.444 billion to EUR 1.6 billion (in 2014, they represented only 19.5% of total expenses incurred, compared to 21% in 2010);
• Services at the municipal level were “reconcentrated” as the number of entities belonging to the local business sector dropped from 333 (29 municipal services, 281 local companies and 23 intermunicipal companies) to 240 (24, 190 and 26 respectively);
• The number of workers in local public administrations dropped from 135 527 to 116 275;25
• The number of parishes was reduced by around 27%, from 4 259 to the current 3 091.
Local Finances and the Green Transition 81
23
Anuário Financeiro dos Municípios Portugueses de 2010 e 2014 24 Instituto Nacional de Estatística 25 PORDATA
Some of the adjustment measures improved the financial and budgetary situation of some municipalities, namely those that introduced rules to strengthen their budget management and control over late payments and debt as well as those that worked to achieve more efficient and sustainable management.
However, others did not perceive any positive results. The consignment of revenue to certain expenses erased any potential benefit of increases in revenue. For example, the increase in revenue from State Transfers (after 2015) and in the Municipal Property Tax, arising from a general revaluation of urban buildings (after 2013), was mandatorily reserved for the following purposes: capitalisation of the Municipal Support Fund, payment of debts to suppliers and reduction of medium and long-term indebtedness. Many municipalities also had to face a reduction in the number of their directors and organisational units.
Since 2016, there has been a tendency to reverse some of these imposed measures and restrictions, restoring municipalities’ financial and administrative autonomy. In 2018, a new Local Finance Law was approved, which introduced increases in financial transfers to municipalities.
Local Finances and the Green Transition 82
Annex 3. Financing the ecological transition
EU Green Bond Standard
A bond qualifies as “green” when the proceeds from the issued debt are allocated only to finance green projects. The project itself should contribute to one of the environmental objectives specified in the EU Taxonomy, namely climate change mitigation or adaptation, protection of water and marine resources, transition to a circular economy (waste prevention, recycling), pollution prevention and control and protection of healthy ecosystems. Green projects can be physical and financial assets (tangible or intangible) and can include a share of working capital (but not purchasing and leasing costs). Public investments and subsidies for sub-sovereign issuers also qualify.
The bond issuer shall produce a green bond framework, which provides details on the proposed use of proceeds, the green bond strategy and processes. An allocation report shall include a statement of alignment with the EU standards, a breakdown of allocated amounts at sector level and the geographical distribution of projects. The impact report includes an evaluation of the green projects based on the nature of what is being financed, the share of financing and possible metrics on the projects’ environmental impacts. All of these reports must be validated by an independent verifier.
For additional information, see:
https://ec.europa.eu/info/business-economy-euro/banking-and-finance/sustainable-finance/european-greenbond-standard_en
Green loans in France
Green loans (Prêts verts) are part of a global green finance approach involving the raising of funds through a green bond, which will be allocated as green loans that finance environmentally friendly investments.
French local governments are key actors in the energy and ecological transition and play a crucial role in the recovery plan. They represent 90% of the public investments dedicated to environmental protection in France. To support French local governments in their green movement, La Banque Postale (the bank of the French postal service) and its partner, SFIL (a French public development bank), have worked to democratise green financing, which had previously been limited to green bonds, only accessible to a small number of large communities.
Green loans, offered since June 2019, is a tool for financing projects that contribute to the ecological transition of territories, in accordance with the European taxonomy (a classification system that entered into effect in July 2020). Projects are only eligible if their action is covered under a list of specific activities and meets specific performance thresholds.
Eligible projects must have a strong environmental impact and align with one of the following areas:
1. renewable energy: production of electricity or heat via power plants or production parks (photovoltaic, wind, geothermal, hydraulic or biomass);
2. sustainable management of water and sanitation: production of drinking water and sanitation (networks, wastewater treatment equipment), rainwater management, management of aquatic environments and flood control and prevention;
3. waste management and recovery: waste collection and sorting (equipment, collection, treatment or recycling centres) and waste recovery;
4. soft mobility and clean transport: establishment of clean public transport infrastructure and alternative mobility solutions linked to soft mobility;
5. energy efficiency in construction and urban planning: ecological construction (energy-efficient public facilities) or thermal renovation of public buildings improving energy performance by 30% or more, modernisation of public lighting.
Local Finances and the Green Transition 83
Green loans can start at EUR 300 000, compared to EUR 250 million on average for green bonds. Similarly to conventional loans, it is possible to have mobilisation phases for the gradual release of funds and repayment periods that are adapted to the nature of the investment, with fixed and variable interest rates. It is a classic medium- or long-term loan that is defined by the specificity of its purpose and its method of refinancing. Investors mindful of environmental, social and governance criteria may wish to look to green bonds instead.
More than 500 green loans with a total value of EUR 2 billion have been financed since mid-2019. The financed projects have been mainly carried out by municipalities and subnational units. A majority of these projects target drinking water supply or wastewater treatment
The impact and environmental contribution are assessed for each green loan. To avoid adding to the administrative burden of local governments (need for feasibility studies or substantial reporting), two types of simple indicators with standardised data should be submitted to the bank:
- quantitative: aggregate CO2 emissions avoided per year (in tonnes) for projects on “Renewable energies”, “Soft mobility and clean transport” and “Energy efficiency of construction and urban development”. This can be calculated using comparative modelling and data from funded projects.
- qualitative: indicators on the weight of activity of the financed entities and their assessed contribution capacities for projects on “Sustainable management of water and sanitation” and “Waste management and recovery”.
For additional information, see: Prêts verts ou prêts responsables : comment les analyser ? - La Banque Postale
Local Finances and the Green Transition 84
Local Finances and the Green Transition 85
Local Finances and the Green Transition 86
Layout : inextremis.be - Photo cover: © stock.adobe.com
Local Finances and the Green Transition

Council of European Municipalities and Regions (CEMR)
1 Square de Meeûs
B - 1000 Brussels studies@ccre-cemr.org
cemr.eu
Follow us With the support of the European Union