REAL


Q3 2022 ELMHURST LOCAL
ESTATE GUIDE
OPENING NOTE


As the leaves change and weather cools the real estate market
typically moderates some post-Labor Day. This seasonal shift is exaggerated this year by the overheated market during the second quarter. Currently, Elmhurst real estate is in an interesting spot with lower transaction activity, limited home inventory and interest rates that have increased quickly (see pg. 19). Absent a life event creating a move, neither buyer nor seller seems too motivated to transact during the rest of 2022.
With that said, we will be reporting another great year (more to come!) and are very excited about the weeks ahead. Following Family Fall Fest, we are sponsoring the hospitality tent at the Dan Gibbons Turkey Trot, the Holiday Market at Wilder Mansion and the Tree Lighting at Wilder Park amongst other events. We hope to see you around town this holiday season!
Elmhurst History Museum sent us the cover image. We were a Platinum Sponsor for Craft Beer Fest which raised a record of more than $55,000 for the Elmhurst Heritage Foundation.
2
The
All my best, 630.750.9551 kelly.stetler@compass.com www.kellystetlerrealestate.com Learn More Scan Here
Contracted Homes10 Comparing Suburbs34 Comparing Home Types31 New Construction18 Pre-Winter Home Checks Important HVAC Maintenance Items (Eric Weech, Alan Energy Services) 25 WHAT’S INSIDE FEATURES Real Estate Lawyers Role in the Transaction Process (Themis Katris, The Katris Law Group) 9 Spatial Planning Considerations for Main Living Spaces (Betty Brandolino, Fresh Twist Studio) 8 Buying in the Fall Why Fall is the Season to Buy (John Noldan, Guaranteed Rate) 24 Mortgage Rates and Inflation Increasing Rates to Tame Inflation (Kelly Stetler, Compass Real Estate) 19 New Listings6 Closed Homes12 Home Inventory20 Contract Time22 Price Discounts26 Price Per Sq. Ft.28 Closed Sale Prices30 EVERY ISSUE 3
METHODOLOGY
Overview of Terms and Elmhurst Submarkets
CLOSED:closed transaction reflecting the final sales price (does not include any seller credits)
CONTRACTED:contingent or pending transaction reflecting the latest asking price
CONTRACT TIME:number of days between the first list date and the contracted date (does not include time from contract to close)
HOME INVENTORY:number of homes currently available for sale
MEDIAN:middle value of a given dataset (all report values are medians, which are less impacted by outliers than averages)
PRICE DISCOUNTS:percentage difference between the initial list and recorded sale price
PRICE PER SQ. FT:ratio of the price to the square footage of a closed transaction as a relative price measure (factors in home size)
NORTHWEST
(North Ave. to Lake St. and Rte. 83 to Hwy. 290)
CENTRAL WEST
(Prairie Path to North Ave. and Rte. 83 to York St.)
SOUTHWEST
(Prairie Path to Butterfield Rd. and Rte. 83 to York St.)
NORTHEAST
(Lake St. to Grand Ave. and Hwy. 290 to Rte. 83)
CENTRAL EAST
(Prairie Path to North Ave. and Hwy. 290 to York St.)
SOUTHEAST
(Prairie Path to Butterfield Rd. and Hwy. 290 to York St.)
Note: All figures represent detached single-family homes unless otherwise specified. Price range data based on the city of Elmhurst. Submarket figures based on the approximate areas identified on map above.

4
MARKET SUMMARY



“Seller’s
Narrow
Higher Relative
Market” Remains Going into 2022 Year End 5 Lower Overall Activity New Home Listings (Q3) Contracted Homes (Q3) 38% Demo permits continuing to declinewith new builds roughly flat(despite August spike) Mixed Construction Trends New Home Permits (YTD) 1% Home Inventory (Sept) 21% “Seller’s market” with 15+ year low of available homesthis time of year Short Market Times List to Contract Days (Q3) Mostly 2 weeks or lessacross submarkets and price points, but times extending
Price Discounts Sale Price Discounts (Q3) Limited discounts, but homes no longer consistently selling at or above full price Generally higher relative pricesacross submarkets and price points
Sale Prices Sale Price / Price Per Sq. Ft. (Q3) 38% Fewer Available Homes Closed Homes (Q3) 33%
Rolling Last 12 Months (YoY%)

184 401 154 196 0 100 200 300 400 500 600 '08 '09 '10 '11 '12 '13 '14 '15 '16 '17 '18 '19 '20 '21 '22 <$400K $400K –$699K $700K –$999K $1M+ (-25%) (-50%) (-17%) (+9%) NEW LISTINGS
New listings were down, but $1M+ was flat in Q3 and higher over the last 12 months Each month of Q3 showed new listings down by 35%+ YoY Dramatic declines in <$400K listings while $1M+ has been stable / growing Continued lower listing activity as market enters typical seasonal slowing Jul. –Sept. (YoY%) 6 By Price Range Price Range'22'21% <$400K 52116-55% $400K - $699K 114176-35% $700K - $999K 2543-42% $1M+ 43430%
Jul. –Sept. (YoY%) Q3 and last 12 months showed lower listing activity across all submarkets Northeast and to a lesser extent the Northwest have experienced the largest new listing declines Southeast Elmhurst listing activity has returned to historical levels after a period of large increases 7 By Submarket Rolling Last 12 Months (YoY%) 154 41 149 176 231 105 0 100 200 300 400 '08 '09 '10 '11 '12 '13 '14 '15 '16 '17 '18 '19 '20 '21 '22 Northwest Northeast Central West Central East Southwest Southeast (-65%) (-27%) (-19%) (-22%) (-22%) (-14%) Submarket'22'21% Northwest 3357-42% Northeast 1536-58% Central West 3249-35% Central East 5272-28% Southwest 5787-34% Southeast 2839-28%
SPATIAL PLANNING
Key Considerations for Main Living Spaces

How
Do
Will this room be
you
What design style and color

Contributed By: Furniture Spatial Planning is One of the Most Important Stages of Designing a Home Interior
do you want to use the space? How many people would you like to seat comfortably?
you have a preference for TV placement?
a multifunctional space? Do
need additional lighting?
palette do you prefer? 8
REAL ESTATE LAWYERS

Role in the Transaction Process Contract
Drafting / Review
On your behalf attorneys have 3 –5 business days to approve, disapprove or make contract modifications. A copy of the signed contract should be sent to the attorney upon acceptance. Modifications made are based upon the specified terms of the contract and vary. Attorneys may insert provisions indicating the property appraise at the purchase price, the buyer has the right to conduct tests for radon, asbestos or mold and any other changes necessary. These modifications are typically agreed upon between the parties within the first 10 business days of the contract
Inspection Provision
The contract is contingent upon a home inspection by a licensed inspector within the attorney review timeframe. The buyer should be present for the inspection. Upon completion, the inspector will issue a written report and a copy should be sent to the buyer attorney with input as to what items the buyer wishes to be corrected. Inspection issues are often categorized as structural, safety and other defects
Mortgage Contingency
Closing
The contract provides a contingency for the buyer to obtain a mortgage. The language indicates the buyer must obtain a mortgage of a specified amount with an interest rate not to exceed a specified rate on or before a certain date. If a written mortgage commitment is not obtained by this date, it is important to request a contingency extension (otherwise buyer’s earnest money may be at risk). The buyer should apply for a mortgage immediately after contract acceptance
Illinois is a “table funding state” meaning the buyer will receive a deed and other documents at closing and will deliver funds / mortgage proceeds to pay the seller who will receive a check. At closing the buyer will sign loan and title conveyance documents. An attorney will explain the loan papers and review the financial aspects of closing to ensure the buyer is paying what the contract provides for and receiving clear title
Contributed By:
9

CONTRACTED HOMES Contracted homes were down nearly 40% for the quarter across all price ranges Contracts were down 50% in September as YoY declines increased; activity over the last 12 months at <$400K is at 15+ year lows Declining contracted homes are trending similarly with lower listing activity Jul. –Sept. (YoY%) 133 224 98 117 0 75 150 225 300 375 '08 '09 '10 '11 '12 '13 '14 '15 '16 '17 '18 '19 '20 '21 '22 <$400K $400K –$699K $700K –$999K $1M+ (-20%) (-46%) (-23%) (+18%) 10 By Price Range Rolling Last 12 Months (YoY%) Price Range'22'21% <$400K 2357-60% $400K - $699K 4357-25% $700K - $999K 1526-42% $1M+ 2124-13%
Rolling Last
Months
91 29 89 106 141 65 0 50 100 150 200 250 '08 '09 '10 '11 '12 '13 '14 '15 '16 '17 '18 '19 '20 '21 '22 Northwest Northeast Central West Central East Southwest Southeast Contracted activity was lower across all submarkets in Q3 Northern submarkets saw tremendous declines for the quarter Contracted homes generally returning to pre-pandemic levels over the last 12 months 11 By Submarket
12
(YoY%) Jul. –Sept. (YoY%) (-59%) (-29%) (-24%) (-16%) (-18%) (-7%) Submarket'22'21% Northwest 926-65% Northeast 518-72% Central West 1622-27% Central East 2238-42% Southwest 2830-7% Southeast 1315-13%

CLOSED HOME SALES Closed homes were down 30%+ for the quarter; however, activity continued to grow for homes priced over $1M More declines expected at <$400K given very low contract activity at this price range Closed homes likely to continue declines with lower listings and fewer contracts Jul. –Sept. (YoY%) 169 221 103 124 0 75 150 225 300 375 '08 '09 '10 '11 '12 '13 '14 '15 '16 '17 '18 '19 '20 '21 '22 <$400K $400K –$699K $700K –$999K $1M+ (-20%) (-33%) (-27%) (+44%) 12 By Price Range Rolling Last 12 Months (YoY%) Price Range'22'21% <$400K 2962-53% $400K - $699K 5179-35% $700K - $999K 2544-43% $1M+ 372832%
Rolling Last 12 Months (YoY%)
–Sept.
99 38 92 118 150 68 0 50 100 150 200 250 '08 '09 '10 '11 '12 '13 '14 '15 '16 '17 '18 '19 '20 '21 '22 Northwest Northeast Central West Central East Southwest Southeast Closed home sales activity was lower across submarkets in Q3 Central Elmhurst submarkets meaningfully reversed after increasing last quarter Southwest Elmhurst had the highest closed home sales for the quarter (nearly flat YoY) and last 12 months 13 By Submarket
Jul.
(YoY%) (-42%) (-26%) (-8%) (-14%) (-16%) (-12%)Submarket'22'21% Northwest 1933-42% Northeast 617-65% Central West 2130-30% Central East 2644-41% Southwest 4142-2% Southeast 1625-36%


HIGHLIGHTED SALE Beautiful luxury new construction home on deep lot; great location close to East End pool and park, downtown Elmhurst and (soon to be new) Field Elementary $1,675,000 SALE PRICE 100% SALE / LIST PRICE 5 / 4.5 BEDS / BATHS ~4,070 SQ. FT. 14 Closed in Q3 2022 –Central East Elmhurst $412 PRICE PER SQ. FT. Sold By:


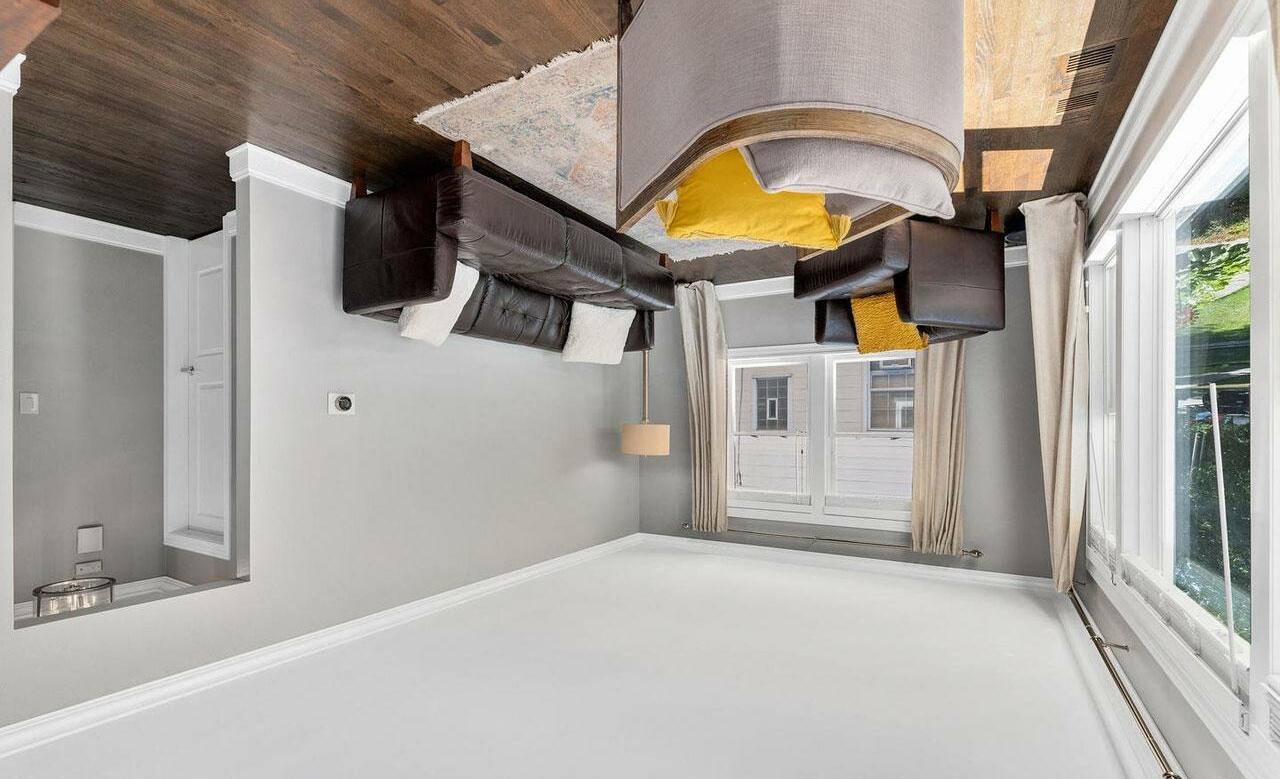


HIGHLIGHTED SALE Bright and completely updated cape cod on a family friendly block. Fantastic location with the Prairie Path and new Lincoln Elementary school nearby $590,000 SALE PRICE 98% SALE / LIST PRICE 3 / 2 BEDS / BATHS ~1,475 SQ. FT. 15 Closed in Q3 2022 –Southwest Elmhurst ~$400 PRICE PER SQ. FT. Sold By:


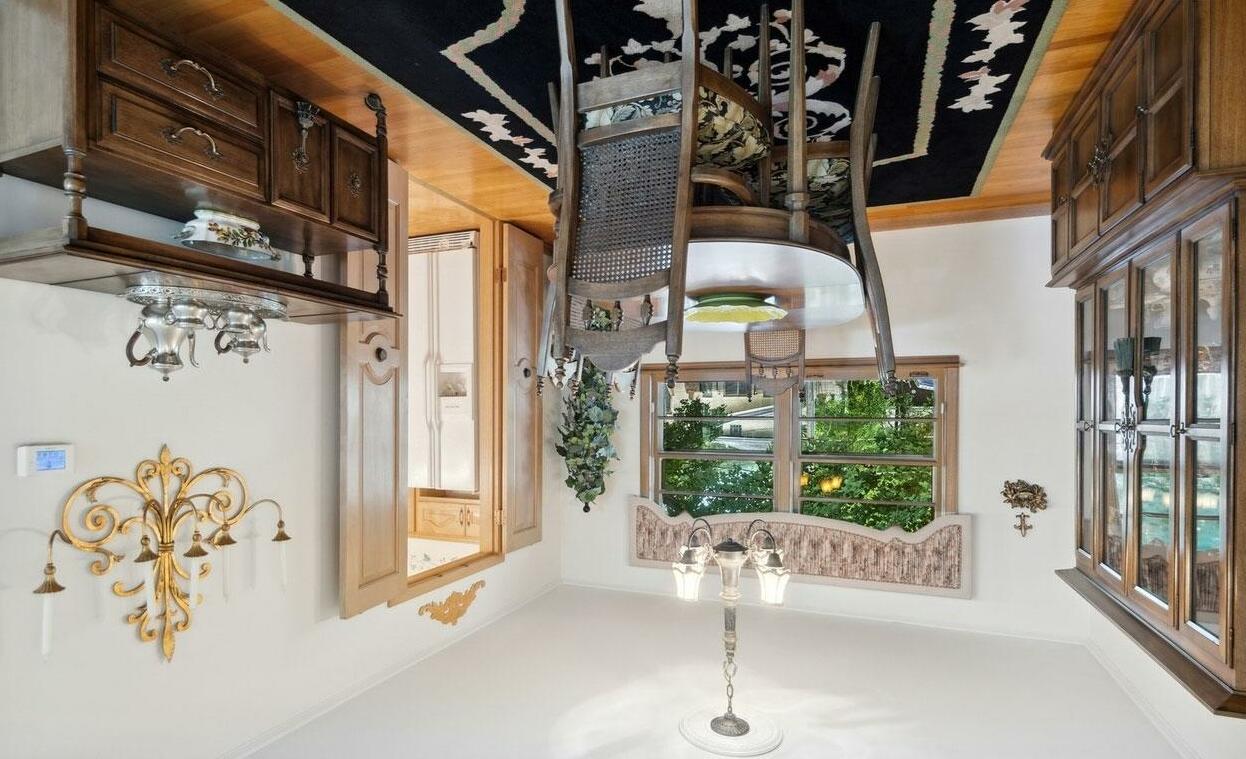
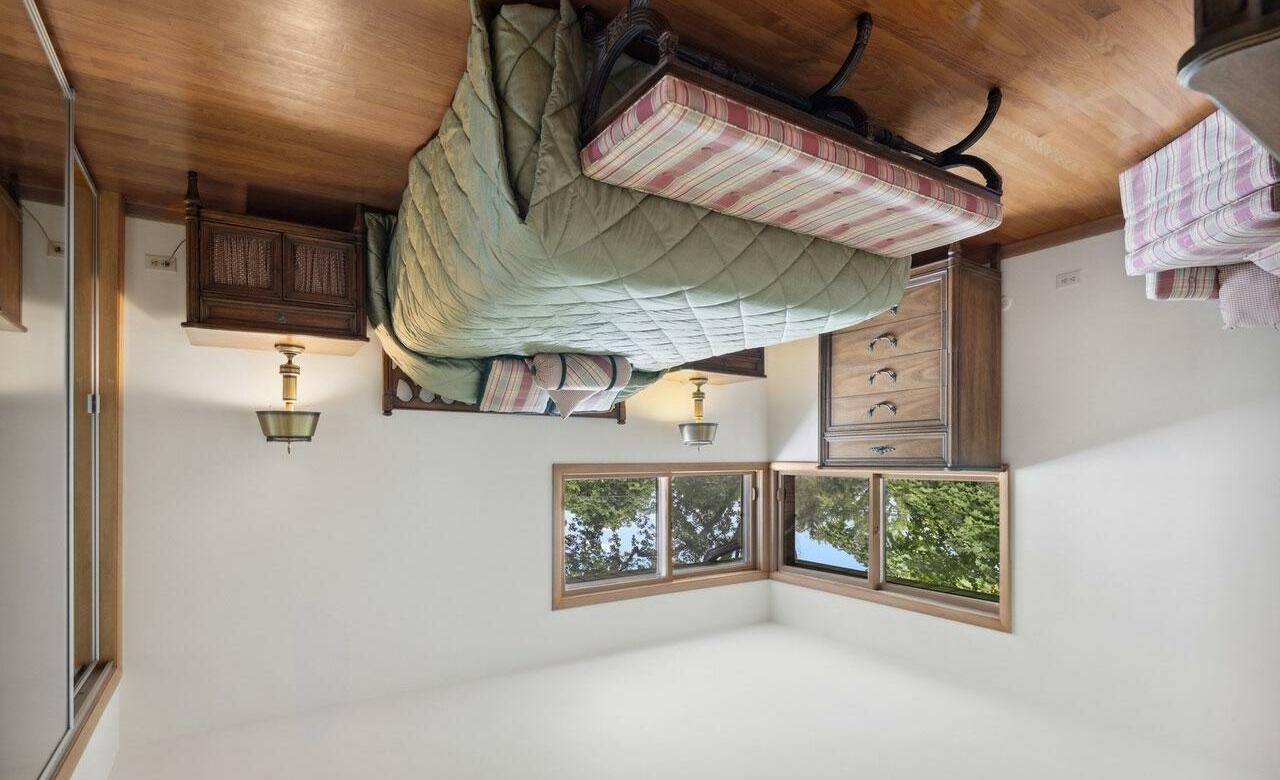

HIGHLIGHTED BUY Large MacDougall build with nice-sized bedrooms, two full baths and two half baths plus hardwood floors throughout; easy walk to Visitation school $567,500 SALE PRICE 100%+ SALE / LIST PRICE 4 / 3 BEDS / BATHS ~2,200 SQ. FT. 16 Closed in Q3 2022 –Southwest Elmhurst $258 PRICE PER SQ. FT. Bought By:


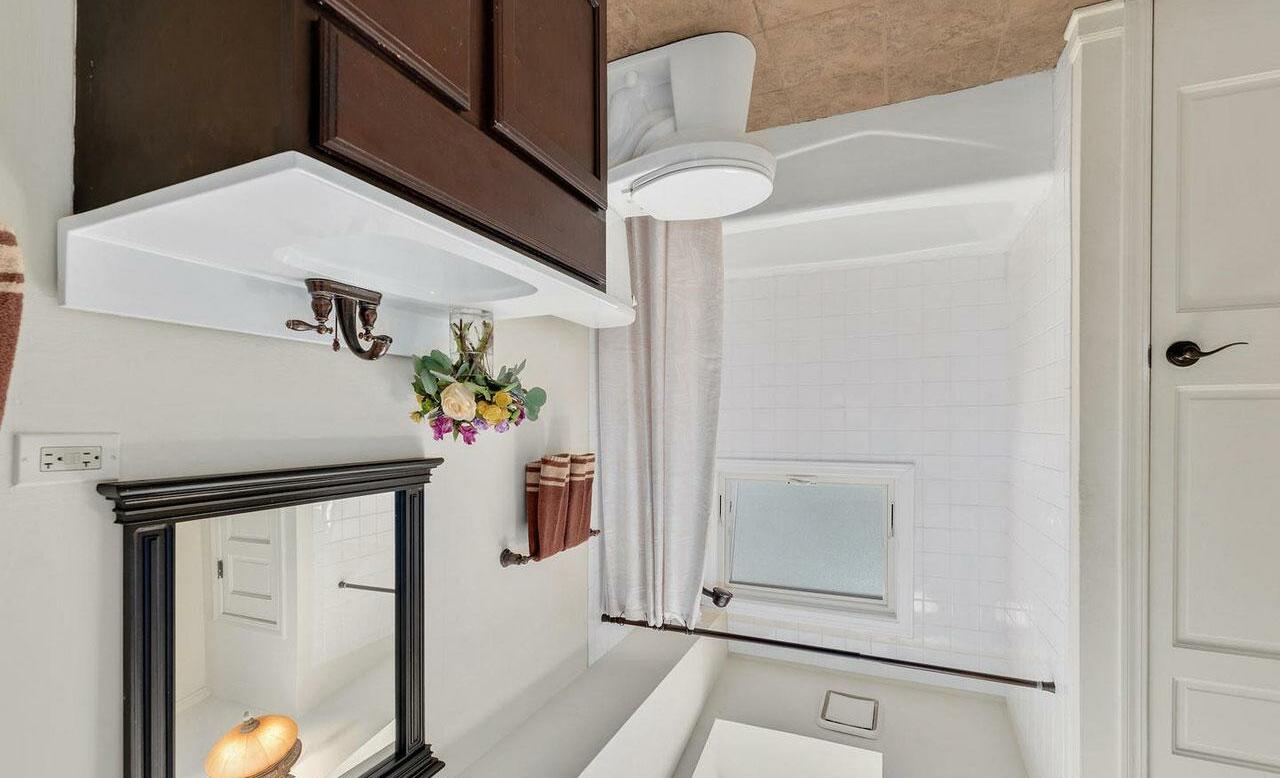
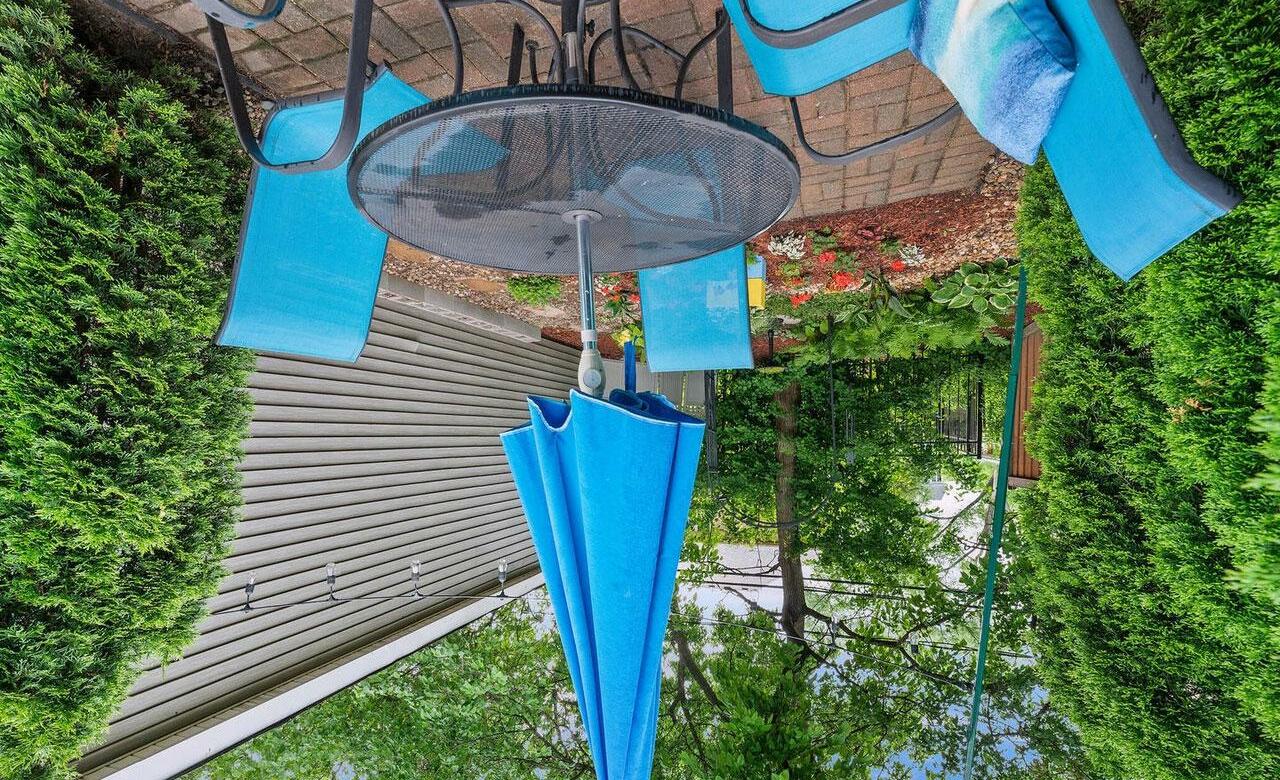
HIGHLIGHTED SALE Charming and beautifully maintained bungalow in desirable south Elmhurst. Convenient location close to schools, parks, shopping and highway access $410,000 SALE PRICE 99% SALE / LIST PRICE 3 / 2 BEDS / BATHS 1,700+ SQ. FT. 17 Closed in Q3 2022 –Southeast Elmhurst $239 PRICE PER SQ. FT. Sold By:

NEW CONSTRUCTION Permit Activity 93 92 0 40 80 120 160 '09 '10 '11 '12 '13 '14 '15 '16 '17 '18 '19 '20 '21 '22 New Home Permits Issued Demo Permits Issued Over 1,200 new home permits since 2010 August new home permits (18 issued) was the biggest single month since March 2014 New home and demo permits have converged after an extended period of higher demos Demo permits likely to continue declining with lot scarcity and economy / market concerns 64 41 71 7067 44 76 65 0 20 40 60 80 '19'20'21'22 New Home Permits Issued Demo Permits Issued Jan. –Sept. (YTD) (-2%) Rolling Last 12 Months (YoY%) (-15%) 18

-3.0% -2.0% -1.0% 0.0% 1.0% 2.0% 3.0% 4.0% 5.0% 6.0% 7.0% 8.0% 9.0% 10.0% (Percentage %) 30-Year Fixed Mortgage Rate U.S. Inflation RATES AND INFLATION Interest Rates Increasing to Tame Inflation Over Time Contributed By: 19 Kelly Stetler Note: Inflation measured by the Consumer Price Index from the Bureau of Labor Statistics as of August 2022. Mortgage rates based on average 30-year fixed rate monthly average data from the Federal Reserve Economic Research Division as of September 2022. Q4 2022 mortgage rate forecasts as of October10, 2022. National Association of Realtors: 6.0% Mortgage Rate Forecasts (Q4 2022) Wells Fargo: 5.7% Fannie Mae: 5.7% Mortgage Bankers Association: 5.5% Freddie Mac: 5.4% U.S. Recessions

HOME INVENTORY 25% 27% 28% 25% 18% 33% 33% 34% 42% 42% 25% 22% 18% 10% 10% 16% 18% 21% 23% 30% 0% 25% 50% 75% 100% '18'19'20'21'22 <$400K $400K –$699K $700K –$999K $1M+ Sept. Trends (Relative%) Available homes declined 21% overall and remain at 15+ year lows for this time of year Inventory is particularly limited for homes priced <$400K and $700K –$1M Homes at $1M+ represent ~30% of inventory Continued inventory declines finally slowing some with lower transaction activity 20 By Price Range Sept. Quarter End (YoY%) 23 53 12 37 0 50 100 150 200 '08 '09 '10 '11 '12 '13 '14 '15 '16 '17 '18 '19 '20 '21 '22 <$400K $400K –$699K $700K –$999K $1M+ (-21%) (-43%) (-25%) (+3%)
Northeast Central West
20% 16% 15% 18% 22% 8% 5% 11% 10% 8% 18% 18% 18% 15% 16% 20% 22% 24% 15% 21% 20% 23% 20% 27% 25% 14% 17% 12% 14% 8% 0% 25% 50% 75% 100% '18'19'20'21'22 Northwest Northeast Central West Central East Southwest Southeast 25 9 18 24 28 9 0 25 50 75 100 '08 '09 '10 '11 '12 '13 '14 '15 '16 '17 '18 '19 '20 '21 '22 Northwest
Central East Southwest Southeast (-40%) (-4%) (-18%) (-28%) Home inventory is low, particularly in the Northeast and Southeast Only Central East Elmhurst showed YoY inventory increases Western Elmhurst currently holds 60%+ of all home inventory (+9%) By Submarket Sept. Quarter End (YoY%) Sept. Trends (Relative%) 21 (-55%)

CONTRACT TIME Contract time extended for Elmhurst homes priced <$700K in Q3 Homes went under contract in less than two weeks in most cases during the quarter Expect contract times to lengthen despite limited available inventory Jul. –Sept. (YoY%) 12 9 5 11 0 75 150 225 '08 '09 '10 '11 '12 '13 '14 '15 '16 '17 '18 '19 '20 '21 '22 <$400K $400K –$699K $700K –$999K $1M+ (+13%) (-8%) (-44%) (-27%) 22 By Price Range Rolling Last 12 Months (YoY%) Price Range'22'21% <$400K 12933% $400K - $699K 10911% $700K - $999K 59-44% $1M+ 15150%
Rolling
6 14 12 7 10 15 0 25 50 75 100 125 '08 '09 '10 '11 '12 '13 '14 '15 '16 '17 '18 '19 '20 '21 '22 Northwest Northeast Central West Central East Southwest Southeast (-7%) (-45%) (+33%) (-9%) (-36%) Contract time in Q3 was still relatively quick, but extending in most areas Submarkets experienced large percentage changes (with only a few days of difference) given low days last year Homes on the market for two weeks or longer are likely overpriced or have other factors impacting time / interest By Submarket
Last 12 Months (YoY%) Jul. –Sept. (YoY%) 23 (+25%) Submarket'22'21% Northwest 511-55% Northeast 257257% Central West 151136% Central East 14956% Southwest 10911% Southeast 511-55%
By:
BUYING IN THE FALL
Why Fall is the Season to Buy John Noldan
It’s been commonly accepted that the springtime was the best time to buy or sell a home, but that’s not necessarily true. As temperatures drop, so does the competition. Here are some reasons why fall can be the best time for homebuyers:
Less Competition / Better Prices*
Spring is when most people begin their home search. By fall, most of these buyers are out of the market, leaving more inventory and prices tend to drop.
You Aren’t so Rushed
When the market is competitive in the spring and summer, you don’t have time to consider your options. Not so in the fall
Flexible Move-in / Closing Dates

Because the seller could be more motivated, they’ll likely be more flexible on timing. It never hurts to ask
Get an Accurate View of the Home
When the sun’s shining and flowers are in bloom, any home looks great. In fall, you’ll see how the home looks on most days of the year
More Workers Available
Thinking of upgrades to a new home? Tradesmen, contractors, handymen (even movers) tend to be less busy during the fall and winter.
Put Furniture on the Holiday Wish List
Your new home has spaces to decorate and spots for new furniture –great items for a holiday wish list
*https://www.nar.realtor/blogs/economists-outlook/seasonality-in-the-housing-market Applicant subject to credit and underwritingapproval. Not all applicants will be approved for financing. Receipt of application does not represent an approval for financing or interest rate guarantee. Restrictions may apply, contact Guaranteed Rate for current rates and for more information. (20210921-458945)
Contributed
24
PRE-WINTER CHECKS
Important HVAC Maintenance Items to Get Ready for Cold Weather
1 Check Indoor Furnace –Before the weather gets cold, test your furnace to make sure it is running properly. Check the pilot light to make sure it is lit. Turn the thermostat up to at least 75 degrees and wait for the heat to kick on. Feel your registers to confirm warm air is coming out
2 Change HVAC Air Filter(s) –Every home HVAC system utilizes an air filter to remove dirt, dust, and contaminants from a home’s interior air. Filters should be changed at least every three months to keep air clean and increase heater efficiency
3 Vacuum and Clean Air Vents –Filters can’t stop tiny bits of dirt and dust from settling in HVAC ductwork and vents. Vacuuming and wiping down air vents can also prevent burning smells from filling your home when you turn your heater on
4 Check Thermostat Batteries –Many home thermostats use batteries keep them powered. These batteries can last several years, but they can also stop working without warning. Ensure that your home’s heating remains consistent by checking or proactively replacing
5 Check Carbon Monoxide Detector Batteries –Any home with a heater should have carbon monoxide detectors. This gas can be fatal, which is why it’s important to install and maintain detectors; they could save your life
Schedule a Professional Service –Regular service appointments are critical to the lifespan, efficiency, and condition of an HVAC system. Technicians can also help avoid expensive repairs

Contributed By:
6 25
Price Range

98% 98% 100% 100% 85% 90% 95% 100% '08 '09 '10 '11 '12 '13 '14 '15 '16 '17 '18 '19 '20 '21 '22 <$400K $400K –$699K $700K –$999K $1M+ (0%) (+1%) (+1%) (+3%) PRICE DISCOUNTS Sales closed at 97% –100% of original list price for Q3 as homes continued to sell for near ask Multiple offers becoming more situationspecific than the expectation Price discount negotiability is returning in many cases, but remains relatively tight Jul. –Sept. (YoY%) 26 By
Rolling Last 12 Months (YoY%) Price Range'22'21% <$400K 97%97%0% $400K - $699K 98%98%0% $700K - $999K 100%98%2% $1M+ 100%99%1%
Rolling Last 12 Months (YoY%)
Northeast Central West
East Southwest Southeast (0%)
98% 98% 99% 98% 98%
(+2%) (+1%) (+1%)
–Sept.
Central
Central East
100%
85% 90% 95% 100% '08 '09 '10 '11 '12 '13 '14 '15 '16 '17 '18 '19 '20 '21 '22 Northwest
Central
(+2%) Price discounts have been mostly consistent across submarkets Northeast saw discounts widen consistent with a meaningful increase in contract time Buyers and sellers mostly met at or a slight discount to original asking price during the quarter 27 By Submarket
Jul.
(YoY%) (+1%) Submarket'22'21% Northwest 100%98%2% Northeast 96%99%-3%
West 98%97%1%
100%98%2% Southwest 98%98%0% Southeast 99%98%1%
Price Range

PRICE PER SQ. FT. Price per sq. ft. trend was meaningfully higher across all price ranges in Q3 All price ranges set new records as of September over the last 12 months Pricing continues to be strong based on low home inventory even as demand moderates $254 $267 $279 $330 $150 $200 $250 $300 $350 '08 '09 '10 '11 '12 '13 '14 '15 '16 '17 '18 '19 '20 '21 '22 <$400K $400K –$699K $700K –$999K $1M+ (+6%) (+10%) (+13%) (+6%) 28 By
Rolling Last 12 Months (YoY%) Jul. –Sept. (YoY%) Price Range'22'21% <$400K $255$2435% $400K - $699K $262$2467% $700K - $999K $300$25418% $1M+ $358$3279%
Rolling Last 12 Months
Northeast Central West
$259 $233 $291 $301 $289 $283 $100 $125 $150 $175 $200 $225 $250 $275 $300 $325 '08 '09 '10 '11 '12 '13 '14 '15 '16 '17 '18 '19 '20 '21 '22 Northwest
Central East Southwest Southeast (+12%) (+14%) (+10%) (+9%) (+14%) Submarkets saw higher prices for Q3 with all areas increasing, except Northeast Central Elmhurst experienced a significant increase and is now the only submarket ever above $300 over the last 12 months North Elmhurst submarkets are on the lower end of relative price per sq. ft. 29 By Submarket
(YoY%) Jul. –Sept. (YoY%) (+10%) Submarket'22'21% Northwest $278$23717% Northeast $212$226-6% Central West $304$27411% Central East $331$26525% Southwest $297$26711% Southeast $293$26013%

$470 $356 $738 $653 $525 $630 $100 $200 $300 $400 $500 $600 $700 $800 '08 '09 '10 '11 '12 '13 '14 '15 '16 '17 '18 '19 '20 '21 '22 Northwest Northeast Central West Central East Southwest Southeast K (0%) K (-4%) K (+13%) K (+12%) CLOSED SALE PRICES K (+6%) Sale prices were up across submarkets, except Northwest (these values are influenced by the size of the homes sold) Northeast closed sale price increase in Q3 is an outlier due to the home mix, especially with price per sq. ft. declining Price growth is moderating, but conditions continue to favor sellers K K K K K K K 30 By Submarket Rolling Last 12 Months (YoY%) Jul. –Sept. (YoY%) K (+1%) K Submarket'22'21% Northwest $415K$480K-14% Northeast $532K$355K50% Central West $700K$663K6% Central East $715K$630K13% Southwest $615K$585K5% Southeast $822K$620K33%


COMPARING HOME TYPES Analyzing Elmhurst Home Types for Q3 2022 New Listings234724 Contracted Homes102418 Home Inventory12579 Contract Time11 days4 days11 days Price Discounts98.8%99.3%97.0% Price per Sq. Ft. $294$248$252 Closed Sale Price$615K$548K$285K Home TypeSingle FamilyTown HousesCondos 31 Closed Homes1421122
SEEN AROUND ELMHURST


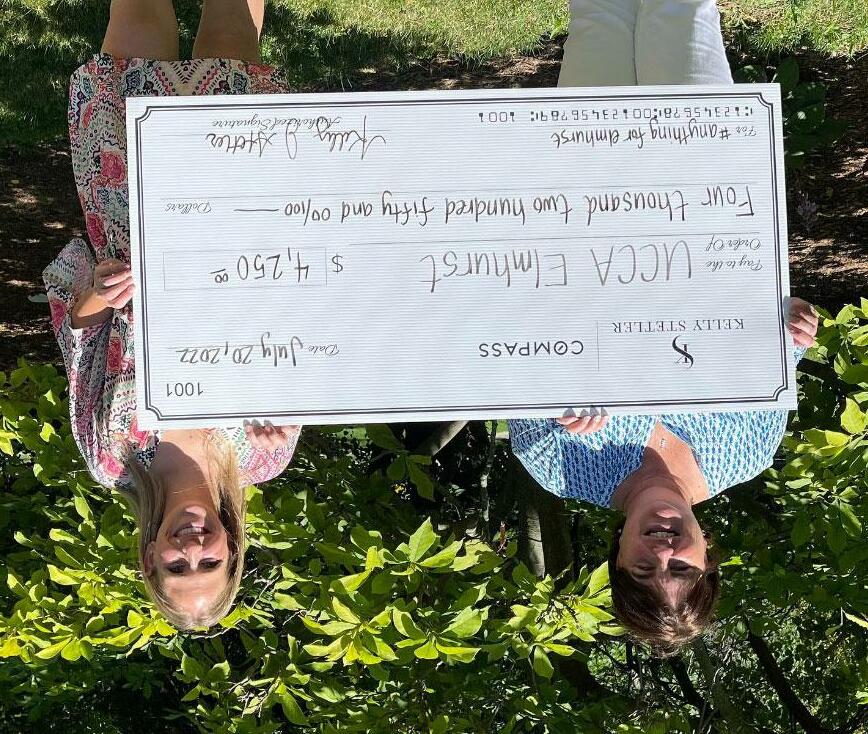

Our Recent Community Involvement 32
JOIN US FOR SOME FUN
Elmhurst Supported Events in Q4 2022
Saturday, Oct. 8 (9am –noon)
Event Sponsor
Fall Family Photos –Wilder Conservatory (Sunday, Oct. 30 and Saturday, Nov. 6)

Holiday Family Photos –Wilder Mansion (Saturday, Nov. 19 and Sunday, Nov. 20) Event Sponsor

Thursday, Nov. 24 (9am)
Premier Sponsor / Hospitality Tent
Wilder Park Tree Lighting
Thursday, Dec. 1 (5:30pm)
Event Sponsor
Friday, Nov. 4 (4pm –9pm)
Saturday, Nov. 5 (10am –4pm)

Presenting Sponsor
Saturday, Dec. 3 –Santa (9am) and
Santa’s Workshop (1pm –4pm)


Event Sponsor

Note: Fall Family photo sessions, Holiday Family photo sessions and Santa visit at Wilder Mansion require advance registration. These events are currently full. Please visit the Elmhurst Park District website to be added to the waitlist. Santa’s Workshop is free to attend.

33
COMPARING SUBURBS 34 Analyzing Western Suburb Markets SuburbMedian PriceQ3 YoY%Price / Sq. Ft.Q3 YoY%Contract TimeQ3 YoY% Clarendon Hills$646K-7%$254-4%129% Downers Grove$458K6%$24011%6-33% Elmhurst$615K14%$29414%1110% Glen Ellyn$475K-7%$25610%7-22% Hinsdale$1,149K12%$32217%10-41% La Grange$625K0%$2914%6-14% Lombard$350K4%$2155%70% Oak Brook$825K-1%$221-3%2124% Western Springs$668K-2%$3119%6-54% Wheaton$470K9%$2339%8-11%
Special


Betty
Themis Katris


OUR CONTRIBUTORS
Thanks to Our Contributors Eric Weech –Vice President of Operations Alan Energy Services 630.833.1100 eric.weech@energyserv.com John Noldan –EVP, Mortgage Lending Guaranteed Rate 630.290.6251 jnoldan@rate.com @johnnoldan_guaranteedrate NMLS License #2611; NMLS #193680
Brandolino –Founder / Creative Director Fresh Twist Studio 630.651.0499 betty@freshtwiststudio.com @freshtwiststudio 35
–Managing Partner The Katris Law Group 708.351.1199 tk@katrislaw.com @themi_the_closer


630.750.9551 kelly.stetler@compass.com www.kellystetlerrealestate.com Compass is a licensed real estate broker and abides by federa l, state and local equal housing opportunity laws. All materialpr esented herein is intended for informational purposes only, is compiled from sources deemed reliable but is subject to errors, omissions, and changes with out notice. Sources include Midwest Real Estate Data LLC and th e Elmhurst Community Development department. This is not intended to solicit propert yalready listed. Elmhurst Office 103 Haven Road Elmhurst, IL 60126 www.compass.com


