


Q4 2022
ELMHURST
LOCAL REAL ESTATE GUIDE
OPENING NOTE


Scan Here

Briefly reflecting on 2022, the year was a tale of two halves. The first half was incredible and clearly unsustainable. The second half, particularly the fourth quarter, experienced a meaningful slowdown in transaction activity as interest rates spiked. The market is picking up again with seasonal trends, but Elmhurst and other western suburbs remain in the same quandary –there are very few houses available, which is holding prices.
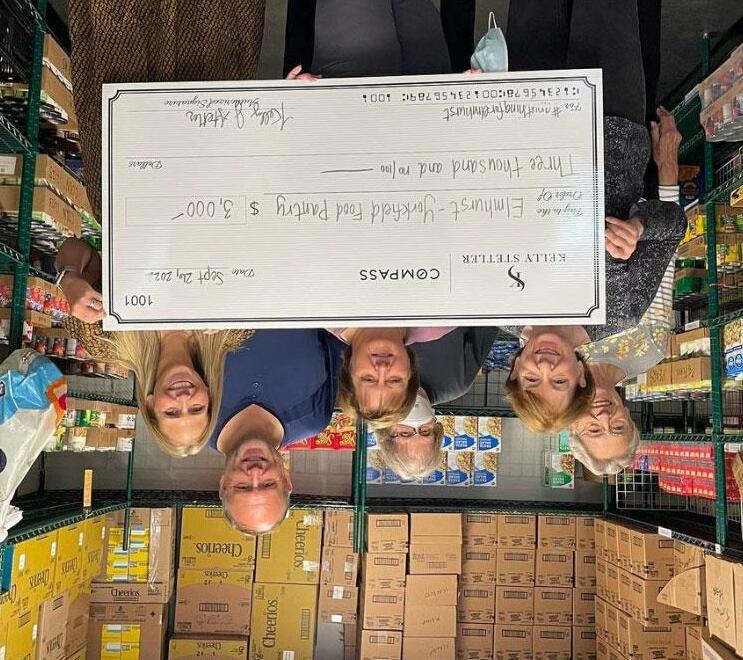
This past year we supported ~45 local organizations and events while growing our Elmhurst closed sales volume by over 40% along the way (note overall Elmhurst sales volume was down nearly 15%). We also began donating for every transaction and have given over $10,000 to Elmhurst not-for-profits in the last 9 months. We love our town and can’t wait to raise the bar in 2023. #anythingforelmhurst
For the cover we chose an Elmhurst fire truck. We are so grateful to have some of the best police officers, firefighters and paramedics providing us a safe community!
All my best, 630.750.9551 kelly.stetler@compass.com www.kellystetlerrealestate.com
2
Learn More
Contracted Homes 10 Comparing Suburbs 29 Comparing Home Types 28 New Construction 14 Kitchen Organization It’s Time to Get Organized (Kaitlyn Dane, Neat Method) 21 WHAT’S INSIDE FEATURES Land Trusts Protecting Your Biggest Asset (Themis Katris, The Katris Law Group) 9 Favorite Paint Colors Create a Mood and Transform a Space (Betty Brandolino, Fresh Twist Studio) 8 Conforming Loans New Higher Loan Limits Help Buyers (John Noldan, Guaranteed Rate) 20 Preparing to Sell Getting Ready to List Your House (Kelly Stetler, Compass Real Estate) 15 New Listings 6 Closed Homes 12 Home Inventory 16 Contract Time 18 Price Discounts 22 Price Per Sq. Ft. 24 Closed Sale Prices 26 EVERY ISSUE 3
METHODOLOGY
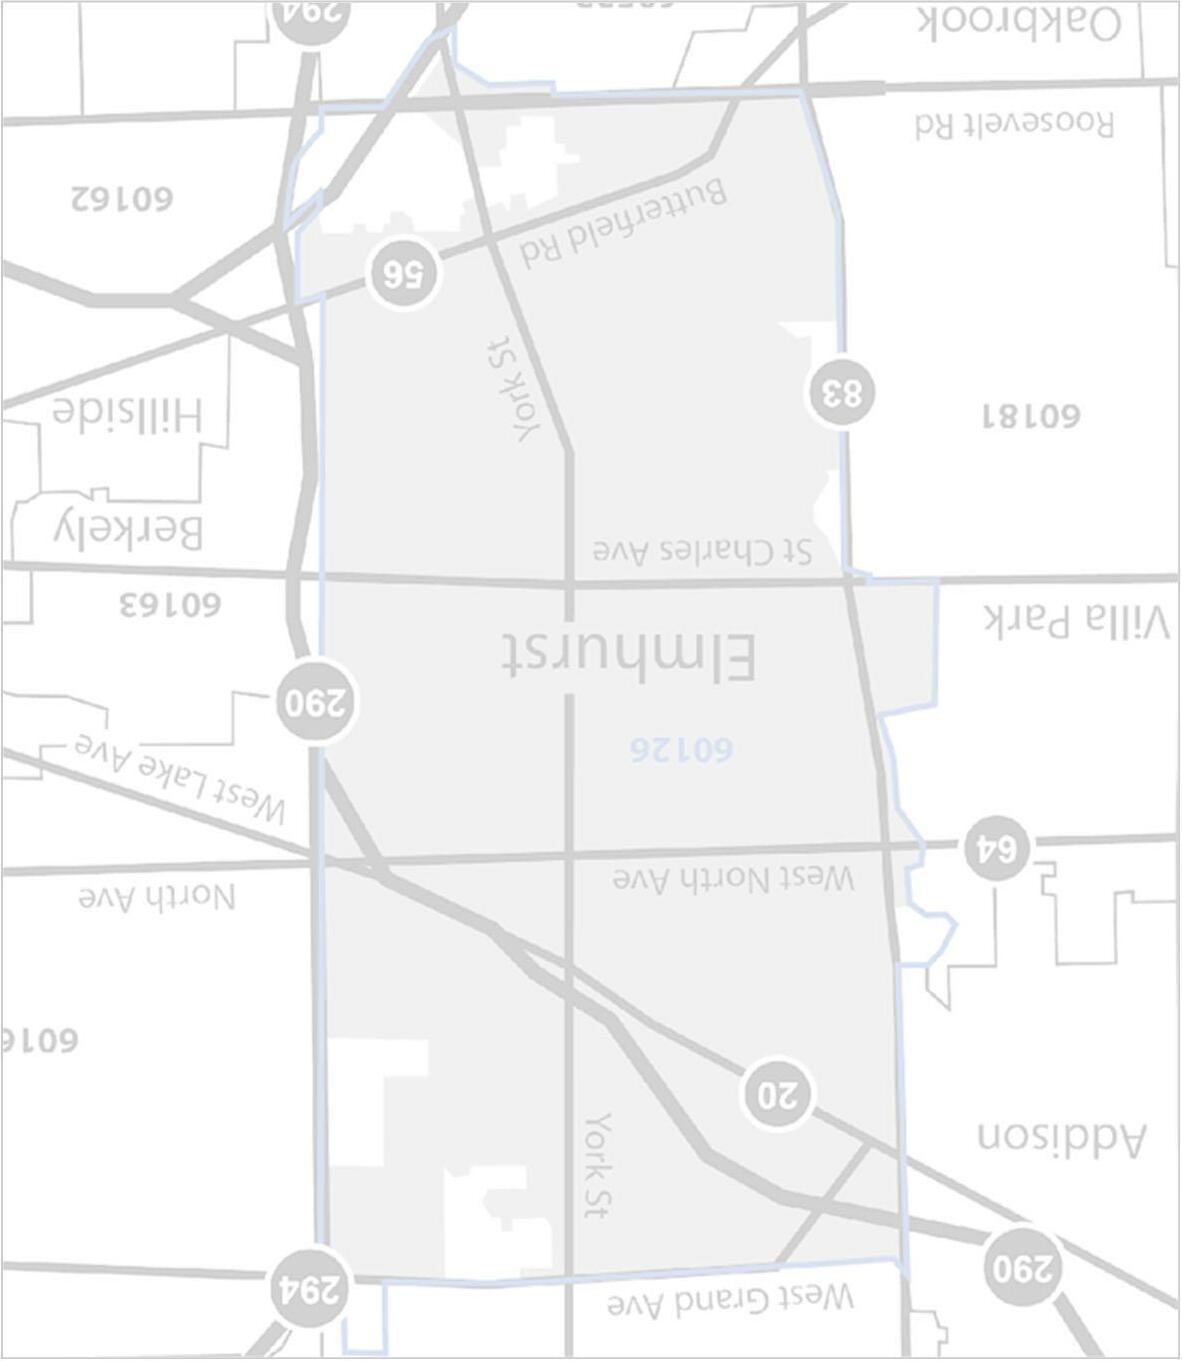
Overview of Terms and Elmhurst Submarkets
CLOSED:closed transaction reflecting the final sales price (does not include any seller credits)
CONTRACTED:contingent or pending transaction reflecting the latest asking price
CONTRACT TIME:number of days between the first list date and the contracted date (does not include time from contract to close)
HOME INVENTORY:number of homes currently available for sale
MEDIAN:middle value of a given dataset (all report values are medians, which are less impacted by outliers than averages)
PRICE DISCOUNTS:percentage difference between the initial list and recorded sale price
PRICE PER SQ. FT:ratio of the price to the square footage of a closed transaction as a relative price measure (factors in home size)
NORTHWEST
(North Ave. to Lake St. and Rte. 83 to Hwy. 294)
CENTRAL WEST
(Prairie Path to North Ave. and Rte. 83 to York St.)
NORTHEAST
(Lake St. to Grand Ave. and Hwy. 294 to Rte. 83)
CENTRAL EAST
(Prairie Path to North Ave. and Hwy. 290 to York St.)
SOUTHEAST
(Prairie Path to Butterfield Rd. and Hwy. 290 to York St.)
SOUTHWEST
(Prairie Path to Butterfield Rd. and Rte. 83 to York St.)
Note: All figures represent detached single-family homes unless otherwise specified. Price range data based on the city of Elmhurst. Submarket figures based on the approximate areas identified on map above.
4


MARKET SUMMARY “Seller’s Market” Remains Going into 2023 Seasonal Uptick 5 Lower Overall Activity New Home Listings (Q4) Contracted Homes (Q4) 50% Demo and new construction permits declining; lowest Q4 in our database (back to 2008) Declining New Construction Trends New Home Permits (2022) 17% Home Inventory (Dec) 9% “Seller’s market” with 15+ year low of available homesthis time of year Short Market Times List to Contract Days (Q4) Mostly 2 weeks or lessacross submarkets and price points, but timing more mixed Narrow Price Discounts Sale Price Discounts (Q4) Homes no longer consistently selling at or above full price; smaller discounts common Generally higher relative pricesacross submarkets and price points; <$400K softening Higher Relative Sale Prices Sale Price / Price Per Sq. Ft. (Q4) 28% Fewer Available Homes Closed Homes (Q4) 47%

141
0 100 200 300
'08 '09 '10 '11 '12 '13 '14 '15 '16 '17 '18 '19 '20 '21 '22
NEW LISTINGS
6
162 404
184
400 500 600
<$400K $400K –$699K $700K –$999K $1M+ (-22%) (-51%) (-24%) (-1%)
Rolling Last 12 Months (YoY%) New listings were down meaningfully, but $400K –$700K was roughly flat in Q4 November and December each showed new listings down by 30%+ YoY Dramatic declines in <$400K and $700K –$1M listings for the quarter and last 12 months Continued lower listing activity as market enters typical seasonal upswing Oct. –Dec. (YoY%)
By Price Range Price Range'22'21% <$400K 2951-43% $400K - $699K 60592% $700K - $999K 1326-50% $1M+ 1830-40%
By Submarket Rolling Last 12
Q4 and last 12 months showed lower listing activity across all submarkets (except Northeast for the quarter) Many Elmhurst areas experiencing 5+ year lows for listing activity over the last 12 months (well below pre-pandemic) December showed the lowest number of new listings in a single month in 15+ years
7
Months
136 46 143 170 227 101 0 100 200 300
'08 '09 '10 '11 '12 '13 '14 '15 '16 '17 '18 '19 '20 '21 '22
(-55%) (-33%) (-18%) (-24%)
Submarket'22'21% Northwest 1735-51% Northeast 83167% Central
Central
Southwest
Oct. –Dec. (YoY%) Southeast
(YoY%)
400
Northwest Northeast Central West Central East Southwest Southeast
(-20%) (-15%)
West 1623-30%
East 2330-23%
3438-11%
1216-25%
PAINT COLORS
Paint colors create a mood and can transform a space


Favorite Whites:
o BM Chantilly Lace –warm white
o BM White Dove –creamy white
o BM Simply White –clean white, no undertones

o BM Swiss Coffee –warm white with latte undertone
o BM Pale Oak –slight beige undertone
Favorite Blues:
o BM Flint –dark blue / charcoal gray with moody depth
o BM Gibraltar Cliffs –green / blue that looks great in traditional or modern spaces
o F & B Hague Blue –blue with a teal undertone
Favorite Greens
o BM Dark Olive –warm green with brown undertone
o BM Jojoba –soft muted olive tone
o F & B Pigeon –green with gray undertones
Favorite Dark Blacks
o SW Iron Ore –soft black
o SW Urban Bronze –dark warm undertones

o SW Tricon Black –true black with no undertones
o SW Green Black –black with slight green undertone
Note: BM = Benjamin Moore, F & B = Farrow & Ball, SW = Sherwin-Williams
8
Contributed By:
LAND TRUSTS
Protecting Your Biggest Asset
What is a Land Trust?
A land trust is the simplest and most inexpensive form of estate planning. It is an arrangement by which the recorded title to the real estate is held by a trustee, but all the rights and conveniences are controlled by you and exercised by the beneficiary you choose. You are the beneficiary during your lifetime. And the best part –beneficiary information is never disclosed!
What are the Benefits?

Privacy Avoid Probate Protection Against Liens
Your purchase price, name and mortgage information are just a click away from being viewed by anyone. A land trust is the first step to ensure your privacy of ownership. Unless required by law, the identity of the real owner(s) is not disclosed to the public
The party creating the trust retains control over the property during his / her lifetime. The successors you assign in the trust agreement become effective upon death. Upon death, your beneficiaries take control of the property while avoiding the expense, time, and stress involved in probate court
When the property is held in a land trust, a judgment against one of the beneficiaries does not automatically constitute a lien upon the real estate. If the property is held in a land trust, the beneficiary is provided with an extra measure of protection against liens and lawsuits
By:
Contributed
9

CONTRACTED HOMES Contracted homes were down 50% for the quarter across all price ranges Contracts were down nearly the same YoY in each month of Q4 (i.e., all months were equally weak) Contracted homes dropped faster than new listings with limited available inventory Oct. –Dec. (YoY%) 101 212 87 110 0 75 150 225 300 375 '08 '09 '10 '11 '12 '13 '14 '15 '16 '17 '18 '19 '20 '21 '22 <$400K $400K –$699K $700K –$999K $1M+ (-24%) (-57%) (-31%) (+15%) 10 By Price Range Rolling Last 12 Months (YoY%) Price Range'22'21% <$400K 1851-65% $400K - $699K 3143-28% $700K - $999K 719-63% $1M+ 1120-45%
Contracted activity was meaningfully lower across all submarkets in Q4
Homes under contract now at or below prepandemic levels across Elmhurst areas over the last 12 months
Central West has held up the best over the last 12 months, but also did not experience the same dramatic increases as other areas
Northwest Northeast Central West Central East Southwest Southeast
79 26
50 0 50 100
'08 '09 '10 '11 '12 '13 '14 '15 '16 '17 '18 '19 '20 '21 '22
11
(-59%)
Submarket'22'21% Northwest
Northeast
81 98 134
150 200 250
By Submarket Rolling Last 12 Months (YoY%) Oct. –Dec. (YoY%)
(-35%) (-28%) (-41%) (-15%) (-15%)
1224-50%
47-43% Central West 615-60% Central East 1424-42% Southwest 1523-35% Southeast 722-68%
Closed homes were down nearly 50% for the quarter; however, homes priced over $1M remain 30% higher over the last 12 months Declines at <$400K have been tremendous over the last 12 months (and nearly 70% lower in Q4); currently at 15+ year lows Closed homes likely to continue declines with lower listings and fewer contracts Oct. –Dec. (YoY%)

HOME SALES
124 204 99 118 0 75 150 225 300 375 '08 '09 '10 '11 '12 '13 '14 '15 '16 '17 '18 '19 '20 '21 '22 <$400K $400K –$699K $700K
$1M+ (-23%) (-50%) (-24%) (+30%) 12
Rolling Last 12 Months (YoY%) Price Range'22'21% <$400K 2269-68% $400K
3148-35% $700K
1317-24% $1M+
CLOSED
–$999K
By Price Range
- $699K
- $999K
1925-24%
86 25 83 107 140 55 0 50 100 150 200 250 '08 '09 '10 '11 '12 '13 '14 '15 '16 '17 '18 '19 '20 '21 '22
13
Submarket Rolling Last 12 Months (YoY%) Oct. –Dec. (YoY%) (-64%) (-28%) (-20%) (-33%) (-13%) (-14%) Submarket'22'21% Northwest 1225-52% Northeast
Central
Central East
Northwest Northeast Central West Central East Southwest Southeast Closed home sales activity was lower across submarkets in Q4 Northeast Elmhurst was 80%+ lower during the quarter and is now nearly twice as far down as other areas for the last 12 months Central East and Southwest remain the most active areas for home closings
By
316-81%
West 1019-47%
2032-38% Southwest 1930-37% Southeast 922-59%

NEW CONSTRUCTION Permit Activity 78 72 0 40 80 120 160 '09 '10 '11 '12 '13 '14 '15 '16 '17 '18 '19 '20 '21 '22 New Home Permits Issued Demo Permits Issued Over 1,225 new home permits since 2010 Permit activity trailed off significantly in Q4 Demo permits converged with new permits and now fallen below after an extended period of higher demos Activity to likely to continue declining with lot scarcity and economy / market concerns 65 78 76 72 0 20 40 60 80 '19'20'21'22 New Home Permits Issued Demo Permits Issued Jan. –Dec. (Full Year) (-17%) Rolling Last 12 Months (YoY%) (-30%) 14
SALE PREPARATION
Recommendations Before Listing Your House for Sale
 Kelly Stetler
Clean toilets, showers and bathtubs, wipe surfaces, mop floors, clean rugs, etc. Consider bringing in a cleaning service to ensure that your house looks great
Declutter and organize your space. When a house is clutter-free, buyers can focus on the home instead of overflowing closets and accumulating knick knacks. This also goes for the yard
Depersonalize by putting away most photos and personal items. Leave a few nice, framed photos to strike a balance between depersonalization and creating an inviting home
Paint over any bright walls with neutral colors such as whites, light grays or light beiges. These shades will make the house feel bigger and more welcoming. Touch-up other areas as needed
Fix items such as leaky faucets, wall cracks, squeaky doors, etc. and complete any overdue servicing (e.g.HVAC). Otherwise, buyers may think your house hasn’t been well maintained





Stage your home, depending on the situation. Multiple studies show that staging a home helps sell faster and for more money. Interior staging is also relatively easy and affordable

15
Contributed By:

HOME INVENTORY 30% 24% 34% 15% 26% 28% 28% 34% 41% 38% 25% 25% 15% 7% 8% 17% 23% 17% 37% 28% 0% 25% 50% 75% 100% '18'19'20'21'22 <$400K $400K –$699K $700K –$999K $1M+ Dec. Trends (Relative%) Available homes declined nearly 10% and remain at 15+ year lows for this time of year Inventory is particularly limited for homes priced $700K –$1M (1/3 of what it was on a relative basis versus 2018 / 2019) Continued inventory declines slowing; not possible to move much lower 16 By Price Range Dec. Quarter End (YoY%) 19 28 6 21 0 50 100 150 200 '08 '09 '10 '11 '12 '13 '14 '15 '16 '17 '18 '19 '20 '21 '22 <$400K $400K –$699K $700K –$999K $1M+ (-15%) (+58%) (0%) (-30%)
16% 17% 20% 17% 18% 9% 5% 10% 4% 6% 23% 19% 15% 18% 22% 18% 22% 21% 19% 22% 22% 22% 23% 34% 25% 13% 15% 10% 8% 7% 0% 25% 50% 75% 100% '18'19'20'21'22 Northwest Northeast Central West Central East Southwest Southeast 12 4 15 15 17 5 0 25 50 75 100 '08 '09 '10 '11 '12 '13 '14 '15 '16 '17 '18 '19 '20 '21 '22
(+33%) (-8%) (+7%) (-35%) Home inventory
low,
increases
Southeast
availability
price
(0%) By Submarket Dec. Quarter End (YoY%) Dec. Trends (Relative%) 17 (-17%)
Northwest Northeast Central West Central East Southwest Southeast
is
but Central West and Northeast showed YoY
(Central East was flat)
home
remains particularly low relative to history
Only Southwest has more than 15 homes available across
points

CONTRACT TIME Contract time declined for homes under $1M in Q4; $1M+ homes had the most inventory and are more likely to be new construction Homes went under contract around two weeks or less in most cases during the quarter Expect contract times to remain short with limited available inventory Oct. –Dec. (YoY%) 11 9 5 13 0 75 150 225 '08 '09 '10 '11 '12 '13 '14 '15 '16 '17 '18 '19 '20 '21 '22 <$400K $400K –$699K $700K –$999K $1M+ (0%) (-15%) (-55%) (+18%) 18 By Price Range Rolling Last 12 Months (YoY%) Price Range'22'21% <$400K 1516-6% $400K - $699K 1215-20% $700K - $999K 918-50% $1M+ 208150%
Contract time in Q4 was still relatively quick, but mixed (Northeast and Southeast being outliers on low sales volume) Submarkets experienced large percentage changes due to low day counts (i.e., a day or two change is a large relative move) Homes on the market for two weeks or longer are likely overpriced or have other factors impacting time / interest
Northwest Northeast Central West Central East Southwest Southeast
(+33%) (0%) (-45%)
6 9 12 6 11 10 0 25 50 75
'08 '09 '10 '11 '12 '13 '14 '15 '16 '17 '18 '19 '20 '21 '22
100 125
(-40%) (-40%)
Months
Oct. –Dec. (YoY%) 19 (-33%) Submarket'22'21% Northwest 990% Northeast 8125224% Central West 1316-19% Central East 181429% Southwest 14138% Southeast 525-80%
By Submarket Rolling Last 12
(YoY%)
(20221129-874377)
Contributed By:

LOANS New Higher Loan Limits Help Buyers
CONFORMING
The maximum conforming loan limits for Fannie Mae and Freddie Mac have increased in 2023. In response to rising property values across the U.S., the Federal Housing Finance Agency (FHFA) is increasing the standard baseline for single-unit home loans to $726,200. An increase in conforming loan limits gives homebuyers a more flexible and manageable loan option. Some of the benefits of conventional loans are: Lower down payment options More flexible credit score requirements Options for fixed-rate or adjustable-rate mortgages Avoid mortgage insurance by providing a 20% down payment New Conforming Loan Limits for Properties NOT in Alaska, Hawaii, Guam and U.S. Virgin Islands Units20232022 https://www.fhfa.gov/Media/PublicAffairs/Pages/FHFA-Announces-Conforming-Loan-Limits-for-2023.aspx Applicant subject to credit and underwriting approval. Not all applicants will be approved for financing. Receipt of applicationdoes not represent an approval for financing or interest rate guarantee. Restrictions may apply, contact Guaranteed Rate for current rates and for more information. Guaranteed Rate, Inc is a private corporation organized under the laws of the State of Delaware. It has no affiliation with the US Department of Housing and Urban Development, the US Department of Veterans Affairs, the Nevada Department of Veterans Services, the US Department of Agricultureor any other government agency. No compensation can be received for advising or assisting another person with a matter relating to veterans’ benefits except as authorized under Title 38 of the United States Code.
John Noldan 1$726,200$647,200 2$929,850$828,700 3$1,123,900$1,001,650 4$1,396,800$1,244,850 20

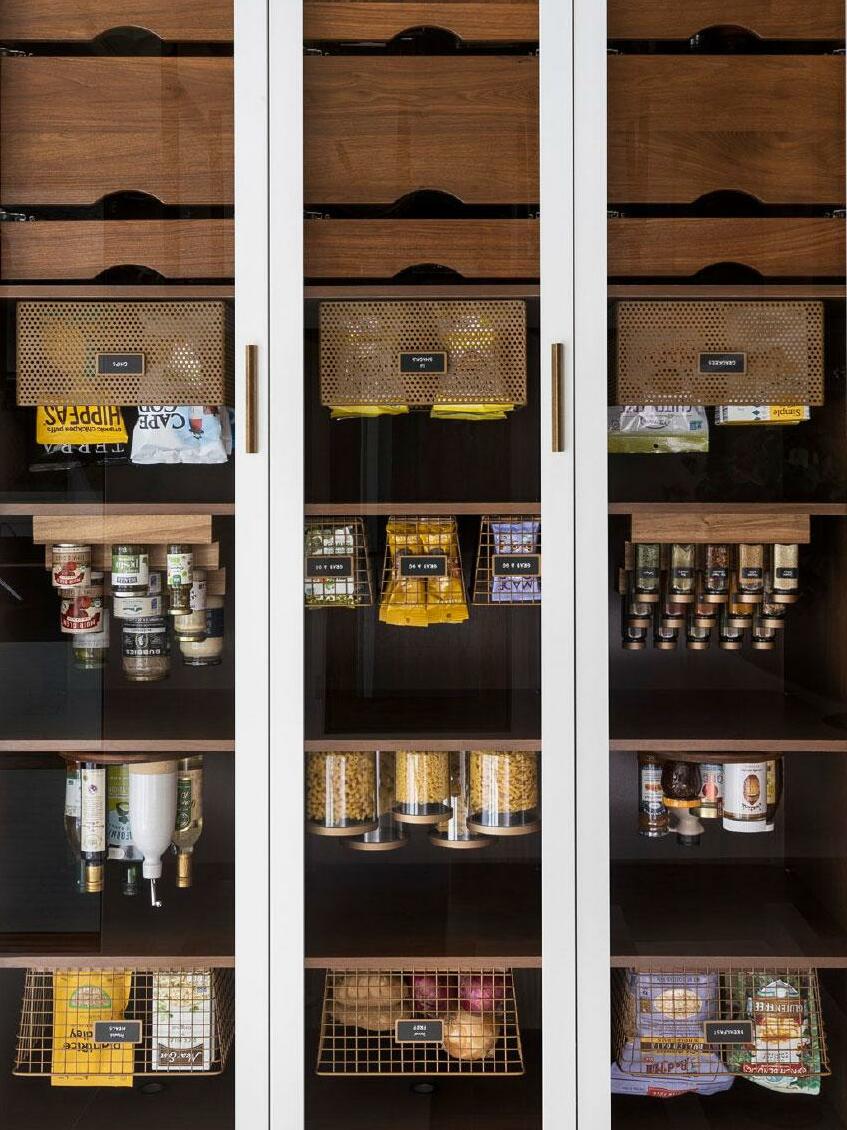
ORGANIZATION It’s Time to Get Organized in the Kitchen
21
Contributed By:
In order to discover how much you really have, remove everything from the space Take it All Out Sort, Categorize, Edit + Plan Create categories and edit what you no longer use; make sure you have plenty of room to spread out! Implement Products Use organizational products that are beautiful, functional and sustainable Label, Label, Label
it is clear where everything goes, it is more likely to stay neat!
Kaitlyn Dane
If
–Dec. (YoY%)
90% 95% 100%
100% 100%

85%
'08 '09 '10 '11 '12 '13 '14 '15 '16 '17 '18 '19 '20 '21 '22
DISCOUNTS
22
Rolling Last 12 Months
Price
93%96%-3% $400K
97%98%-1% $700K
97% 98% 98%97%1% $1M+
<$400K $400K –$699K $700K –$999K $1M+ (0%) (+1%) (+2%) (+3%) PRICE
Sales closed at 97% – 99% of original list price for Q4 as some discounts worked into the market; homes priced less than $400K had the most negotiability Multiple offers are more situation-specific than the expectation Price discount has returned in many cases, but remains relatively tight Oct.
By Price Range
(YoY%)
Range'22'21% <$400K
- $699K
- $999K
99%97%1%
Price discounts have been mostly consistent across submarkets, but some variability developing Northeast saw discounts widen consistent with a meaningful increase in contract time (again on a low volume of sales) Buyers and sellers mostly met at a small discount to original asking price during the quarter
Oct. –Dec. (YoY%)
Submarket'22'21% Northwest 98%98%0% Northeast 91%97%-6% Central West 95%98%-3% Central
96%97%-2%
90% 95% 100%
100% 99% 99%
(+3%) 23
85%
100% 98% 98% '08 '09 '10 '11 '12 '13 '14 '15 '16 '17 '18 '19 '20 '21 '22
Northwest Northeast Central West Central East Southwest Southeast (0%)
(+2%) (0%) (+1%)
98%96%2% Southwest
Southeast
By Submarket Rolling Last 12 Months (YoY%)
(+2%)
East
99%96%3%

PRICE PER SQ. FT. Price per sq. ft. trend was meaningfully higher across price ranges
Q4, except <$400K All price ranges remain at record levels over the last 12 months other than <$400K
based
quarter) Pricing continues to be strong based on low home inventory even as demand moderates $254 $270 $281 $336 $150 $200 $250 $300 $350 '08 '09 '10 '11 '12 '13 '14 '15 '16 '17 '18 '19 '20 '21 '22 <$400K $400K –$699K $700K –$999K $1M+ (+8%) (+6%) (+12%) (+9%) 24 By Price Range Rolling Last 12 Months (YoY%) Oct. –Dec. (YoY%) Price Range'22'21% <$400K $227$250-9% $400K - $699K $265$2506% $700K - $999K $283$2753% $1M+ $325$3047%
in
(which is slightly below
on the
By
Northwest Northeast Central West Central East Southwest Southeast (+24%) (+10%) (+6%) (+13%) (+14%) Submarkets saw mixed prices for Q4 with half of the areas advancing and the other half declining Central East remains above $300 per sq. ft. over the last 12 months with Southwest also climbing closer to that level North Elmhurst submarkets are on the lower end of relative price per sq. ft.
$200 $225 $250 $275 $300 $325
$307 $298 $283 (+8%) Submarket'22'21% Northwest $251$2472% Northeast $294$17964% Central West $258$284-9% Central East $273$282-3% Southwest $304$27112% Southeast $265$279-5%
$100 $125 $150 $175
'08 '09 '10 '11 '12 '13 '14 '15 '16 '17 '18 '19 '20 '21 '22
$259 $255 25
$291 Submarket Rolling Last 12 Months (YoY%) Oct. –Dec. (YoY%)

$500 $377 $781
$100 $200 $300 $400 $500 $600 $700 $800 '08 '09 '10 '11 '12 '13 '14 '15 '16 '17 '18 '19 '20 '21 '22 Northwest Northeast Central West Central East Southwest Southeast K (+7%) K (-2%) K (+20%) K (+24%) CLOSED SALE PRICES K (+3%) Sale prices were up across submarkets, except Northeast (these values are influenced
the size
the homes sold) Northeast
sale price decline
Q4
Price growth is moderating, but conditions continue to favor sellers K K K K K K K 26 By Submarket Rolling Last 12 Months (YoY%) Oct. –Dec. (YoY%) K (+10%) K Submarket'22'21% Northwest $473K$410K15% Northeast $262K$335K-22% Central West $788K$535K47% Central East $693K$648K7% Southwest $790K$421K88% Southeast $556K$466K19%
$655 $558 $710
by
of
closed
in
is an outlier due to the home mix, especially with price per sq. ft. increasing significantly

$54 $12 $74 $82
$44 $0 $25 $50 $75 $100 $125 '08 '09 '10 '11 '12 '13 '14 '15 '16 '17 '18 '19 '20 '21 '22
K (-58%) M
M
M
CLOSED SALE VOLUME M
M M M M M 27
Submarket Rolling Last 12 Months (YoY%) Oct. –Dec. (YoY%) M (-2%) M Submarket'22'21% Northwest $8M$13M-40% Northeast $1M$6M-86% Central West $8M$12M-29% Central East $16M$25M-39% Southwest $15M$18M-16% Southeast $6M$16M-64%
$99
Northwest Northeast Central West Central East Southwest Southeast
(-19%)
(+13%)
(-25%)
(-19%) Overall closed sale volume for the Elmhurst market was down 40%+ for the quarter and 15%+ over the last 12 months Northeast (smallest market area) and Southeast experienced particularly low sale volume in Q4 from last year Southwest and Central areas remain the largest sale volume areas in Elmhurst
By



COMPARING HOME TYPES Analyzing Elmhurst Home Types for Q4 2022 New Listings120513 Contracted Homes67211 Home Inventory7457 Contract Time13 days3 days26 days Price Discounts96.7%100.0%95.0% Price per Sq. Ft. $265$255$211 Closed Sale Price$560K$985K$169K Home TypeSingle FamilyTown HousesCondos 28 Closed Homes85311
COMPARING SUBURBS 29 Analyzing Western Suburb Markets SuburbMedian PriceQ4 YoY%Price / Sq. Ft.Q4 YoY%Contract TimeQ4 YoY% Clarendon Hills$755K37%$2586%1880% Downers Grove$430K-1%$2190%129% Elmhurst$560K25%$2650%13-13% Glen Ellyn$433K-5%$27214%8-33% Hinsdale$1,030K6%$3075%20-33% La Grange$621K30%$28513%196% Lombard$340K6%$2109%130% Oak Brook$845K-11%$198-16%39-28% Western Springs$699K13%$2892%9-44% Wheaton$445K7%$2251%1850%
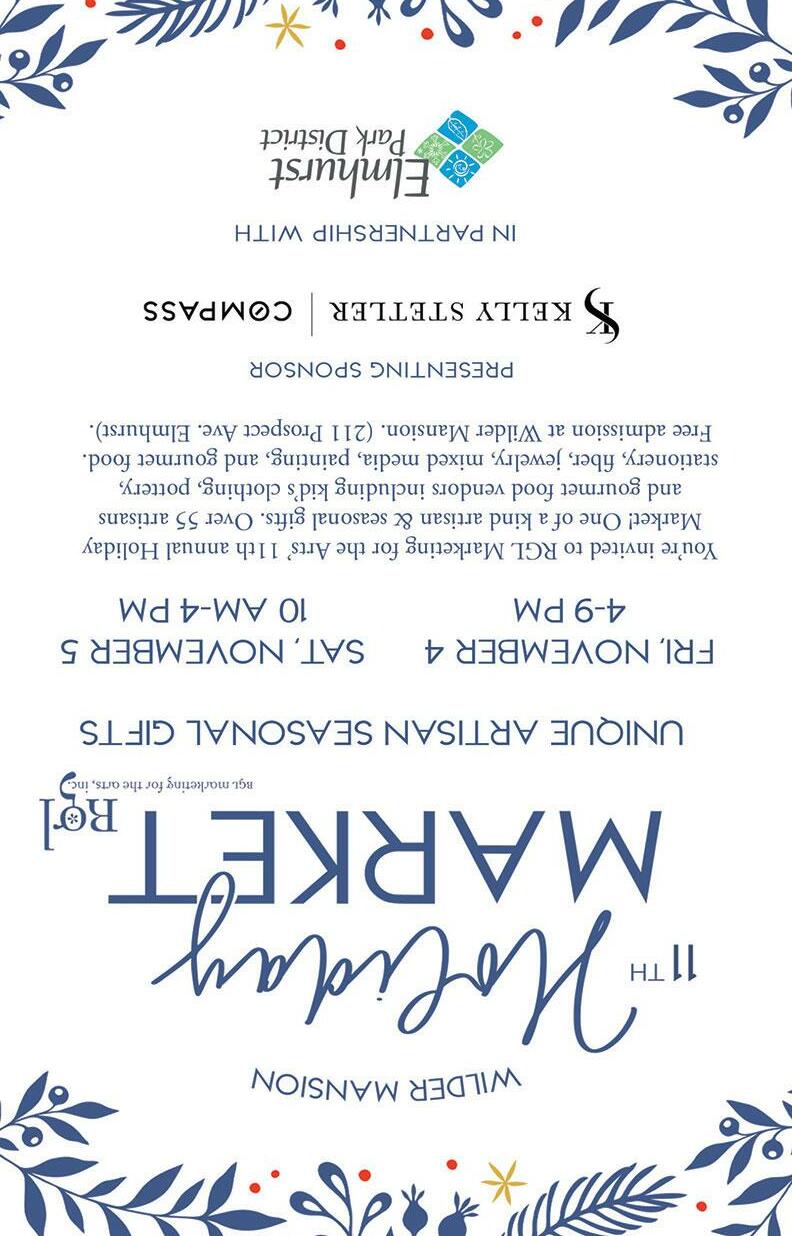
SEEN AROUND ELMHURST
Our Recent Community Involvement








30





OUR CONTRIBUTORS Special Thanks to Our Contributors Betty Brandolino –Founder / Creative Director Fresh Twist Studio 630.651.0499 betty@freshtwiststudio.com @freshtwiststudio Themis Katris –Managing Partner The Katris Law Group 708.351.1199 tk@katrislaw.com @themi_the_closer NMLS License #2611; NMLS #193680 John Noldan –EVP, Mortgage Lending Guaranteed Rate 630.290.6251 jnoldan@rate.com @johnnoldan_guaranteedrate 31 Kaitlyn Dane –Owner, Chicago –Western Suburbs Neat Method 630.605.3028 kaitlyn.dane@neatmethod.com @chicagowestneat e2Photography generously provided the cover photo. Image is copyrighted. www.e2photo.net


630.750.9551 kelly.stetler@compass.com www.kellystetlerrealestate.com Compass is a licensed real estate broker and abides by federa l, state and local equal housing opportunity laws. All materialpr esented herein is intended for informational purposes only, is compiled from sources deemed reliable but is subject to errors, omissions, and changes with out notice. Sources include Midwest Real Estate Data LLC and th e Elmhurst Community Development department. This is not intended to solicit propert yalready listed. Elmhurst Office 103 Haven Road Elmhurst, IL 60126 www.compass.com


 Kelly Stetler


