Q2 2024 GLEN ELLYN
LOCAL REAL ESTATE GUIDE


Q2 2024 GLEN ELLYN
LOCAL REAL ESTATE GUIDE


CLOSED:closed transaction reflecting the final sales price (does not include any seller credits)
CONTRACTED:contingent or pending transaction reflecting the latest asking price
CONTRACT TIME:number of days between the first list date and the contracted date (does not include time from contract to close)
HOME INVENTORY:number of homes currently available for sale
MEDIAN:middle value of a given dataset (all report values are medians, which are less impacted by outliers than averages)
PRICE DISCOUNTS:percentage difference between the initial list and recorded sale price
PRICE PER SQ. FT:ratio of the median price to the median sq. footage of a closed transaction as a relative price measure
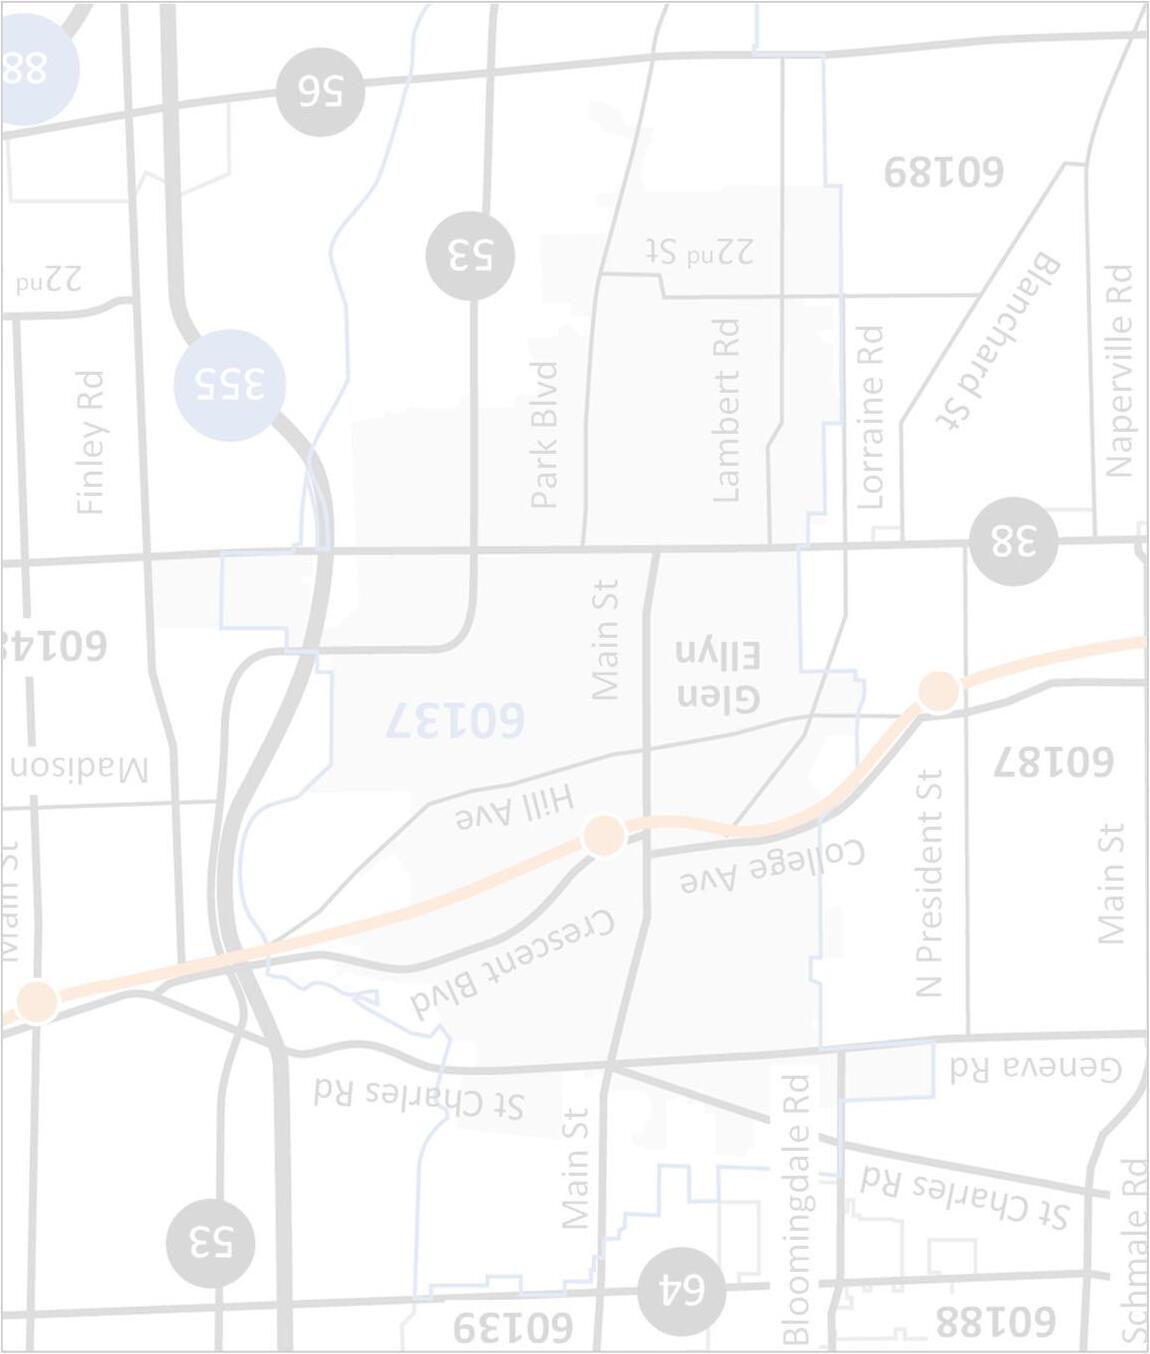
(West of Main St. / North of Pennsylvania Ave. to St. Charles Rd.)
CENTRAL WEST
(West of Park Blvd. / South of Pennsylvania Ave. to Roosevelt Rd.)
(East of Main St. / North of Crescent Blvd. to St. Charles Rd. )
(East of Park Blvd. / South of Crescent Blvd. to Roosevelt Rd.
(South of Roosevelt Rd.)

“Seller’s Market” Remains Despite Early Increase in Listings


By
Price Range
New listings increased nearly 10% in Q2; only homes below $400K were lower for the quarter while homes under $700K are down over the last 12 months
April listings jumped 30% and May was up slightly before June declined over 5%

Listing activity picked up with seasonal trends but late summer expected to be soft Apr. –Jun. (YoY%)
Range'24'23%
Q2 experienced higher listing activity across most areas; Northeast (down 1 listing) and Central West (down 2 listings) were lower
Northwest and South are down meaningfully over the last 12 months; Eastern submarkets are up 15% or more during this timeframe
Central East had a strong quarter and has the most new listings over the last 12 months
Northwest Northeast Central West Central East South
By
Contracted homes declined over 10% for the quarter; all the decrease occurred below $400K and $700K –$1M was flat

Although contracts were down every month of Q2, June was particularly weak with contracts declining over 30% Contract declines likely to slow with more listings and inventory also flattening
Apr. –Jun. (YoY%)
Range'24'23%
Glen Ellyn submarkets mostly declined for Q2; only increases were Central East (up significantly) and South (slightly higher)
Consistent with more new listings, Eastern areas are higher over the last 12 months
Continued Northwest contract declines caused this area to approach historical lows over the last 12 months
Northwest Northeast Central West
Central East South
By
Closed homes decreased nearly 10% in Q2 driven entirely by homes priced below $400K; homes priced $1M+ increased substantially

Homes priced under $400K continue to set new lows for closings due to overall increases in Glen Ellyn sale price levels Closing activity will continue to be limited until more home inventory is available
Apr. –Jun. (YoY%)
Range'24'23%
Glen Ellyn submarkets were mixed but mostly higher for the quarter; Western areas showed declines
Eastern submarket closings have moved higher over last 12 months consistent with more contract activity
South remains near historic lows over the last 12 months with a small increase in Q2
Available homes declined nearly 10% in Q2 from levels that were already historically low
Homes priced $400K –$700K represent more than 45% of inventory; homes priced over $1M are over 40% of inventory

Scarce inventory expected to continue driving “seller’s market” conditions
Home inventory is down meaningfully across Glen Ellyn submarkets; South area increased by only 2 homes from last year
Very limited home availability in all areas (5 or fewer homes, except Central West)
Central submarkets represent ~50% of all available homes
Northwest Northeast Central West Central East South
Northwest Northeast Central West
Central East South
Days between listing date and contract signing have been low (mostly less than two weeks) for a couple years
Contract time was mostly flat overall, varying by only a day or two (if at all) from last year across price ranges

Expect contract times to remain short with very limited home availability
Range'24'23%
Contract times were relatively quick in most areas during Q2; Northeast extended over two weeks on low activity
Northern areas are the only submarkets higher over the last 12 months
Homes on the market for more than two weeks could be overpriced or have other factors impacting time / interest
Northwest Northeast Central West Central East South
Price discounts were very limited in Q2 with most homes selling at or above full asking price across price ranges
Homes priced below $400K are still showing a small discount over the last 12 months

Price discounts expected to remain narrow given limited home inventory
Apr. –Jun. (YoY%)
Price Range'24'23%
Glen Ellyn submarket price discounts were limited during the quarter; Northeast was the only area below asking price
South saw homes selling above asking price in Q2 and over the last 12 months (also lowest available inventory)
Northeast was the only submarket below asking price over the last 12 months
Northwest Northeast Central West Central East South
Price per sq. ft. increased nearly 10% in Q2; only homes priced $400K –$700K showed relative prices flattening
Relative prices for the quarter set new highs (three-month period) as June also tied March for the single-month record

Pricing environment remains strong with most price ranges showing increases
Range'24'23%
Most submarkets were up for the quarter; South area flattened
Northwest and Central East increased despite lower overall closed sale prices (driven by home size mix)
Northwest and Central areas are setting records over the last 12 months; Northeast submarket is the only declining area
Overall sale prices showed more variability than relative prices (impacted by mix and number of closings in each submarket)
Central East was the only area lower over the last 12 months (Northeast, Central West and South all up more than 10%)

Home sales mix pushed overall prices up more than relative prices
Overall closed sale volume for single-family homes increased nearly 10% for the quarter, but declined slightly over the last 12 months
Northeast submarket is up 35%+ over the last 12 months whereas the South is down 45%+ (even with the improved Q2)

Central submarkets remain the largest sale volume areas in Glen Ellyn
–Jun. (YoY%)
Northwest Northeast Central West
Central East South
Analyzing Glen Ellyn Home Types for Q2 2024


