Q2 2022
LOCAL REAL ESTATE GUIDE Q3 2024
HINSDALE
HINSDALE LOCAL REAL ESTATE GUIDE


Q2 2022
LOCAL REAL ESTATE GUIDE Q3 2024
HINSDALE
HINSDALE LOCAL REAL ESTATE GUIDE


CLOSED:closed transaction reflecting the final sales price (does not include any seller credits)
CONTRACTED:contingent or pending transaction reflecting the latest asking price
CONTRACT TIME:number of days between the first list date and the contracted date (does not include time from contract to close)
HOME INVENTORY:number of homes currently available for sale
MEDIAN:middle value of a given dataset (all report values are medians, which are less impacted by outliers than averages)
PRICE DISCOUNTS:percentage difference between the initial list and recorded sale price
PRICE PER SQ. FT:ratio of the median price to the median sq. footage of a closed transaction as a relative price measure
(Rte. 83 to N. York Rd. / N. Garfield St. and Ogden Ave. to W. Chicago Ave.)
(Rte. 83 to S. Garfield St. and W. Chicago Ave. to W. 55th St.)
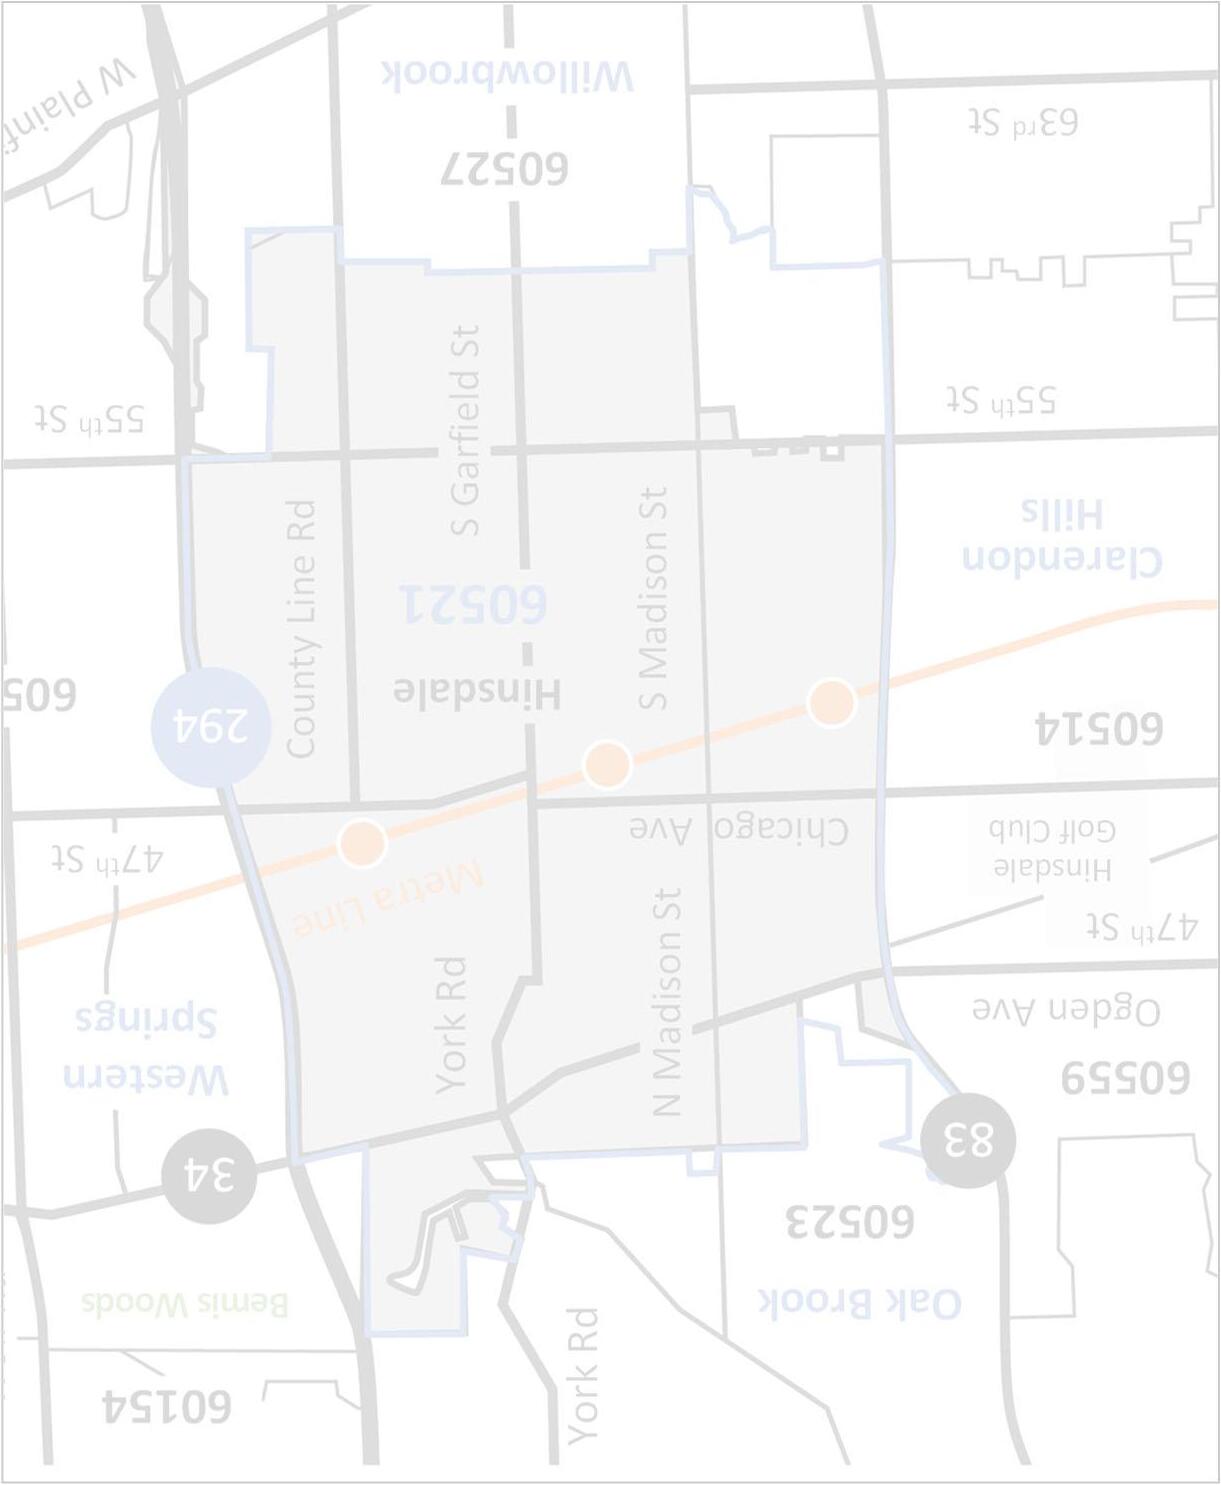
(Hwy. 294 to N. York Rd. / N. Garfield St. and Ogden Ave. to E. Chicago Ave.)
Hwy. 294 to S. Garfield St. and E. Chicago Ave. to E. 55th St.
(South of 55th St.)
“Seller’s Market” Continues into the Fall with Very Low Home Inventory


By Price Range
Listings decreased nearly 30% in Q3; only homes under $500K increased (1 more listing)
July and September listings were down 15% or more with August very soft (down ~50%) compared to prior year

Listing activity expected to be limited with seasonal trends going into year end
Price Range'24'23%
<$500K 3250%
$500K - $999K 1423-39%
$1M - $1.49M 1725-32%
$1.5M - $1.99M 2332-28%
$2M - $2.99M 79-22%
$3M+ 770%
Hinsdale submarkets were also mostly lower during the quarter (South was up from a small amount last year)
Only Central East area remains higher over the last 12 months
South listings are less than half of other submarkets during the last 12 months
Northwest Northeast Central West Central East South
By Price Range
Contracts were 25%+ higher during the quarter supported by most price ranges ($3M+ flat)
Lower end of the Hinsdale market (below $1M) continues to show contract declines over the last 12 months

Contracts expected to soften due to low listing activity and a shortage of inventory
Price Range'24'23% <$500K 30N/A
Contract activity was mixed across submarkets in Q3 (3 up / 2 down)
Central East had a strong quarter (more than doubling) and is now 50%+ higher over the last 12 months
Central West chart-topping increases began in 2019 and continued to mid-2021 before large declines (now flattening)
Northwest Northeast Central West Central East South
Closed homes increased nearly 45% in Q3 with more activity across all price ranges
Consistent with contracts, lower end of the market continues to show closing declines over the last 12 months

Closing activity anticipated to slow without more inventory
–Sept. (YoY%)
Price Range'24'23% <$500K 52150% $500K - $999K 191712% $1M - $1.49M 171242%
Closed activity was higher across all submarkets during the quarter
Northwest and Central East had a very strong quarter; these areas are also up 30%+ over the last 12 months
South area is lower than other submarkets, but closed in Q3 nearly half of the homes comprising the last 12 months
Northwest Northeast Central West Central East South
By Price Range
Available homes declined nearly 50% on already very low inventory
Overall home inventory across price ranges is down almost 90% from September 2019

Limited inventory expected to continue driving “seller’s market” conditions
Sept. Quarter End (YoY%)
Home inventory is down materially across submarkets; only South is higher (1 house)
All submarkets currently have only a handful or so homes available
coming
Days between listing date and contract signing varied by price range, but overall time was faster

Homes priced $500K –$1M and $3M+ took a little longer in Q3, but all prices ranges are down over the last 12 months Overall contract times shortened more in an already fast-moving market
Jul. –Sept. (YoY%)
Price Range'24'23%
<$500K 1369-81%
$500K - $999K 7540%
$1M - $1.49M 59-44% $1.5M - $1.99M 10100% $2M - $2.99M 1122-50%
$3M+ 262313%
Contract times were more mixed in Q3 across Hinsdale submarkets (2 shorter / 2 longer / 1 flat)
West areas and South were all under 10 days to contract during the quarter
Most areas have shorter contract times over the last 12 months (Northwest flat)
Northwest Northeast Central West Central East South
By
Closed price discounts widened slightly overall in Q3 (despite some variability)
Homes priced $500K –$2M showed more negotiability during the quarter; only homes priced $1M –$1.5M sold at full price over the last 12 months

Price discounts expected to remain narrow due to limited home availability
Price Range'24'23%
<$500K 92%84%8%
$500K - $999K 97%100%-3%
$1M - $1.49M 98%100%-2%
$1.5M - $1.99M 95%101%-5%
$2M - $2.99M 98%95%3%
$3M+ 93%92%2%
Price discounts widened during the quarter in most areas (Northwest flat)
Northeast and Central areas had the most discount in Q3; South was full price in the quarter and narrowest in the last 12 months
Transactions mostly closing with a small discount (but some cases full asking price)
Relative prices increased slightly overall during the quarter with meaningful variability
Price ranges with the most closings in Q3 ($500K –$1M and $1.5M –$2M) were the only areas that declined

Relative pricing has been supported by limited home inventory and buyer demand
Jul. –Sept. (YoY%)
Price Range'24'23%
<$500K $281$23122%
$500K - $999K $312$314-1%
$1M - $1.49M $343$3149%
$1.5M - $1.99M $311$338-8%
$2M - $2.99M $427$36019%
$3M+ $549$5294%
Hinsdale submarkets experienced mixed relative price trends in Q3 (2 higher / 2 lower / 1 flat)
Northwest was down during the quarter and is the only area that declined over the last 12 months
South area normalizing some over the last 12 months with more closings
Northwest Northeast Central West Central East South
By
Overall sale prices were up over 5% across Hinsdale submarkets; Northwest growth more than offset other declines
Central areas showed sale price decreases (due to mix) despite relative price per sq. ft. increases in the quarter

Closed sale prices should be reviewed with price per sq. ft. to gauge overall trends
Jul. –Sept. (YoY%)
Northwest Northeast Central West Central East South
Overall closed sale volume for single-family homes increased 50%+ in Q3 and is now up more than 25% over the last 12 months
Central East was up tremendously for the quarter and last 12 months; Northwest also jumped in both timeframes

Central East has surpassed Central West as the largest closed sale volume area
Jul. –Sept. (YoY%)
Northwest Northeast Central West Central East South
Analyzing Hinsdale Home Types for Q3 2024
